Abstract
The architectural heritage of traditional villages, as an important bearing entity of regional culture, contains strong regional color attributes. However, under the wave of contemporary rapid economic development, the color of traditional village architectural heritage is facing serious challenges. The K-means clustering algorithm has outstanding advantages in image color clustering and is suitable for the large-scale data collection of sample picture primary colors to reduce subjective bias and can be combined with the HSV color space to optimize the results. In this study, the architectural heritage of four traditional villages of the Ming and Qing dynasties in the southeastern region of Hubei Province is taken as the research object, the K-means clustering algorithm is used to quantify the color data of the architectural heritage, and the HSV color space is used to analyze the distribution characteristics of the color data and to excavate the uniqueness of its colors and the regional characteristics. The results of this study show that the color characteristics of the architectural heritage of the four villages are as follows: the main colors, red-yellow and red, and the overall color percentage should be between 80% and 100%. The auxiliary colors, cyan blue and blue, should range from 0 to 20% and show low saturation and medium-high value characteristics. Based on the above results, the recommended range of values for the architectural heritage colors in the southeastern part of Hubei Province is clarified: the hue values are between the ranges of 0–40 and 200–230, the saturation is between 0 and 30%, and the values are in the range of 30–70%. At the same time, based on this range of values, a set of recommended chromatograms was generated to provide a visual reference for the adjustment of architectural heritage colors, which is helpful for the conservation and development of architectural heritage colors and landscapes.
1. Introduction
Traditional villages are important carriers of cultural heritage, presenting architectural landscapes with regional characteristics and, at the same time, containing rich folk customs and historical and cultural connotations. However, with the development of urbanization, many traditional villages have inevitably gone into a gradual decline, and some traditional architecture have been forcibly abandoned or demolished, resulting in the fragmentation of the regional landscape [1]. This has led to the fact that cultural elements and stylistic features are often not properly preserved, and it is for this reason that the study of traditional villages is particularly important [2]. Color is an important visual element that contains the characteristics of the local natural environment and historical and cultural connotations. The color characteristics of traditional villages architectural are also an important part of the cultural heritage of traditional villages, containing historical, cultural and technological values, and are therefore of great research significance [3]. Traditional villages with color and unique texture as the main visual feature, which conveys intuitive regional color symbols to people, are the key to sustainable development in the current construction of rural environments. In order to achieve this goal, it is necessary to carry out a detailed survey and record the color of the dwellings in order to better study their original color features [4].
Traditional color studies of architectural heritage use color card comparison and field sampling methods, which are often qualitative, inefficient, unable to collect large quantities of color samples and affected by subjectivity, and lack quantitative methods. With the breakthrough development of computer technology, the paradigm of architectural heritage color research has changed from qualitative analysis to quantitative research [5]. The K-means color clustering algorithm as the core technology path, by virtue of its efficient automation characteristics and high-volume processing advantages, combined with the HSV (hue-saturation-luminance) color space of human visual perception characteristics of the high degree of fit, significantly reduces the traditional color classification rate of misjudgment and constructs a new technological framework for quantitative research on the color of architectural heritage [6].
This study investigates the use of the K-means color clustering algorithm for the quantitative analysis of architectural heritage color, providing a new methodology to design an HSV color space. The space analyzes architectural heritage colors at both the holistic and local levels: (1) A method is proposed for color value conversion, decomposition and visualization to provide a comprehensive study of architectural heritage colors. (2) A color distribution space is designed to represent the dominant colors, color distribution and proportional relationships of various types of architectural heritage. Based on the results of this study, targeted proposals are made to protect and restore the colors of the area according to relevant norms and the literature to ensure their original appearance [7].
2. Research Background
2.1. Color Quantization of Traditional Villages Architectural Heritage
The study of color quantization in architectural heritage requires a solution to the problem of color extraction and quantization. Traditional color extraction methods such as color card matching rely on the human eye’s ability to recognize color, have poor accuracy and can only obtain the intrinsic colors in close proximity, rather than being able to deal with a large, dynamic range of colors [8]. In addition, instrumental metrological analysis methods, which are non-contact measurements, are difficult to apply to large, hard-to-reach samples [9]. Therefore, there is an urgent need for a color effective method to extract quantitative architectural heritage colors. In recent years, a number of researchers have tried to establish the possibility of triangulation between digital media technology and the acquisition and visualization of architectural color data of traditional villages in various ways. The software analysis method is based on digital images and quantifies the colors through computer software such as Matlab and Python. Lei Zhang et al. [10] quantified the color data of five representative buildings on the main facade of the cathedral using HSB, RGB, CMYK, CIELab and other color spaces. Zhanzhu Wang et al. [11] used the Chinese architectural color card developed by Munsell color System to compare the architectural color coding of the site and conducted a questionnaire survey to study the differences in the visual comfort of various historical buildings. Deyi Kong et al. [12] combined instrumental measurement techniques with lab color space to collect traditional architectural heritage color data and explore the internal logic of regional colors.
However, most of the existing software research focuses on the study of a particular field, and cross-disciplinary links are still missing. At the same time, the relevant research is not yet perfect. For example, when a large number of samples are collected and pre-processed, attention is often focused on the number of samples while ignoring the quality of samples; street view data are difficult to restore the original color in the actual scene, which will directly affect the accuracy of the experimental results, which in turn restricts the construction of subsequent color application strategies. Therefore, systematize all aspects as much as possible to make the visual effect more accurate and objective.
By studying and combing through the literature, we found that the K-means clustering algorithm has outstanding advantages in image color clustering, is suitable for the large-scale data collection of sample picture primary colors, reduces subjective bias, supports the study of dynamic color sequences, and can be used to optimize the results by combining it with multiple color spaces, such as RGB, lab, HSV, and so on [13]. Jing Yang et al. [14] used the K-means clustering algorithm to extract 2352 pictures of spatial seasonal changes in different landscape types and to determine the differences in people’s perception of the color of the landscape of two parks in different seasons. Yadav et al. [15] compared and analyzed K-means clustering and other clustering algorithms and proved that the K-means clustering algorithm can deal better with a large number of samples. This provides technical support for the mass color acquisition of architectural heritage color images. Molada-Tebar et al. [16] proposed a new K-means based Pattern Adaptive Screening Algorithm (P-ASK), which is suitable for the automatic selection of patches for camera feature descriptions. This proves that the K-means color clustering method can be improved for different data types and problems. Due to the advantages of the K-means algorithm and its wide acceptance and successful cases in practice with better results, this paper adopts the K-means algorithm for clustering analysis and expects to obtain more accurate and objective research results by using the K-means clustering method.
2.2. HSV Color Space
When clustering central colors, the same colors are represented differently in both RGB and HSV dimensions due to differences in color space. In the RGB space, the red, green and blue channels are used to represent colors, while the HSV space divides the characteristics of colors into hue, saturation and value. In the RGB color space, colors are presented as linear, while the HSV color space is closer to the subjective perception of the human eye, which can portray the characteristics of colors in terms of the three dimensions of hue, saturation, and luminance [17]. The chroma channel in the HSV color space can better portray the differences between different colors, while the luminance channel can effectively separate the light information, effectively overcoming the effects of lighting, shadows, and other factors that improve the robustness of color extraction [18]. On this basis, combined with a new K-mean-based color extraction algorithm, the accurate identification and analysis of various colors can be achieved [19,20].
The HSV space consists of three elements: hue, saturation, and lightness. Hue (H) varies on a circular scale and goes from 0 to 360 (0 for red, 60 for yellow, 120 for green, 240 for blue, and 300 for fuchsia) [21]. Saturation (S) varies horizontally from 0 to 100%, and value (V) varies vertically from 0 to 100% (Figure 1). The color data obtained were analyzed using Origin software 10.1.0.178.
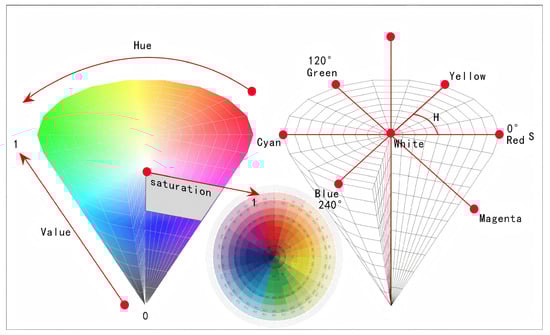
Figure 1.
HSV color space (Ref [22] Miao, M. et al., 2024).
Normally images are stored in RGB color space and need to be converted to the HSV color space. The formula for conversion is as follows:
This study takes four traditional village architectural heritages in southeastern Hubei Province, China, as the research object, extracts the dominant color by the K-mean clustering algorithm as the color data collection method, uses the HSV color space to construct the color data features, analyzes the color reference intervals of the comparative research areas, and analyzes the color distribution characteristics of the architectural heritages. Through the understanding of the mechanism of geographical change and geographical characteristics of the architectural heritage of traditional villages, the scope of color control and optimization strategies are proposed, with a view to provide practical references for the color management of architectural heritage.
3. Research Objects and Methods
Our research process consists of four parts: (1) photographing to obtain sample pictures of the research object; (2) using Adobe Lightroom software 14.1.1 for color correction (DeepLabV3 was used to segment the sample pictures) and extracting the dominant color of the sample pictures through K-means clustering; (3) analyzing the characteristics of the color data in conjunction with the HSV color space; and (4) exploring and architectural heritage color stability and diversity and proposing recommendations for color conservation (Figure 2).
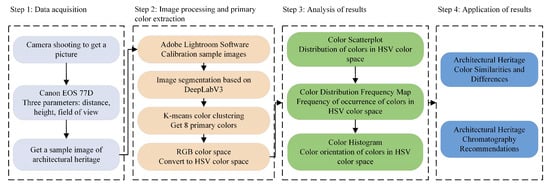
Figure 2.
Research flowchart (Source: drawn by the author).
3.1. Research Area and Sample
The southeastern region of Hubei Province is a collection of areas along the Yangtze River east of Hubei and to the south, including Yangxin County and Daye City in Huangshi City (Figure 3a), Xianan District in Xianning City, Chibi City, Jiayu County, Chongyang County, Tongcheng County and Tongshan County (Figure 3b). This region has a complex topography, with hilly, mountainous terrain, small basins crisscrossing the area, and numerous river valleys. In the north is Dabie Mountain, and in the south is Mufu Mountain, which is the intersection of Mufu and Jianghan Plain, and the junction of Hubei, Hunan and Jiangxi provinces in the mountainous and hilly area (Figure 3c), with a typical hot summer and cold winter terrestrial climate region. The traditional architectural heritage in this area has been largely influenced by the Huizhou architecture in terms of the style of construction of residential buildings, both for residential buildings and public buildings such as ancestral halls, pagodas, corridors, and bridges, with a wide variety of types. It is due to the combined effect of various factors that the unique regional settlement in southeastern Hubei Province was formed.
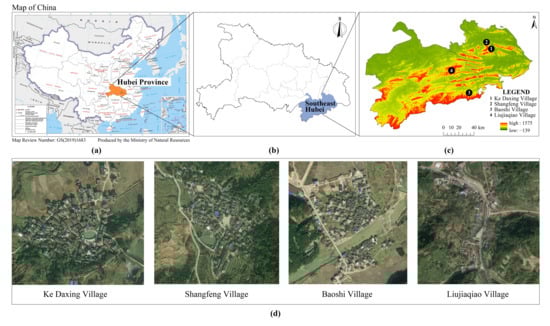
Figure 3.
(a) Geographical location of Hubei Province in China; (b) geographic location of southeastern Hubei; (c) geographic location of sample villages; and (d) satellite view of four villages (Source: drawn by the author).
In this study, among the 44 traditional villages in southeastern Hubei Province in the list of Chinese traditional villages, four objects with the same geomorphological type (Figure 3d), the same settlement type and the village layout of relative completeness and representativeness were selected as typical villages for the collection of traditional architectural color information data (Table 1). Based on this, further quantitative and qualitative analyses were carried out.

Table 1.
Basic information about the village where the built heritage is located (Source: drawn and photographed by the author).
3.2. Selection Criteria for Typical Building Architectural Heritage Samples
- Priority was given to selecting well-preserved architectural heritage in villages that are listed as protected units, in order to reflect the architectural characteristics and architectural colors of the villages to the greatest extent possible. The selection of such nationally protected architectural heritage with historical significance, artistic value and scientific research value can reduce the error between the research samples and the real situation [23].
- Priority was given to well-preserved ancient buildings with a certain historical value, which, even if they are not rated as cultural relic conservation units, can also reflect the architectural characteristics and architectural colors of the village.
- When selecting a variety of different types of buildings with different functions, the proportion of different functional types of buildings selected should be considered, and residential buildings and public buildings should be considered.
3.3. Research Methodology
3.3.1. Sample Collection
On-site photographs were taken to obtain sample photographs of the study subjects. To ensure the accuracy of data collection, this should be performed under a standard light source with a clear sky brightness of d65, and, to avoid direct illumination in a backlit or shadowed situation, in a place repeated several times. In order to obtain accurate color images, we took photographs between 9:00 and 1:00 pm and between 2:00 pm and 5:00 pm. We used a Canon EOS 77D camera with a zoom lens model Canon EF-S 18–55 mm f/4–5.6 IS STM. During the acquisition of the images, we set up a tripod to stabilize the camera. The camera lens height was set at 1.58 m with a focal length of 50 mm and an image aspect ratio of 3:2 to simulate the field of view of the human eye [24].
3.3.2. Color Correction of Sample Pictures
In order to avoid noise in the pictures, the ISO value of the camera must be set very low, the recommended international standard being 100. For the optimal dynamic range, precise adjustment of the white balance, and accurate color contouring, we recommend the use of RAW image files instead of JPG files [25].
The colors captured in the camera during shooting were affected by sunlight, illumination and reflectivity, so eliminating or reducing the bias caused by ambient light before extracting the primary colors is a must. The Automatic White Balance (AWB) method is an algorithm that automatically estimates the image illumination and corrects the image color and has a promising future for applications [26]. In this study, we used the method of automatic calibration of white patches in white balance (AWB) by detecting the brightest and the closest white-colored area in the image as a white spot and adjusting the color balance of the whole image by using the color information of this white spot as a reference [27]. Figure 4 shows our sample pictures after AWB calibration and the treatment of overexposure and underexposure using Adobe Lightroom software.
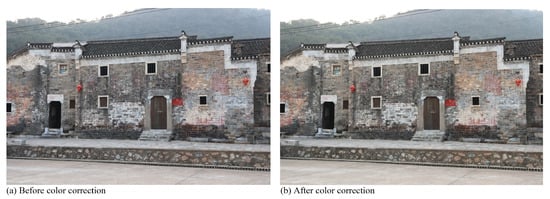
Figure 4.
Adobe Lightroom software color correction before and after comparison (Source: drawn by the author).
3.3.3. Image Segmentation of Sample Pictures
With the help of semantic segmentation technology, we accurately extracted the architectural heritage subjects from the sample pictures, which in turn improves the accuracy of color acquisition. Nowadays, semantic segmentation models such as FCN, U-Net, DeepLab, SegNet, etc., can be adapted to various types of datasets and can efficiently identify and extract multiple types of elements [28]. To achieve the goal of automatically extracting architectural elements from various sample images, we relied on the DeepLab family of methods, which are at the forefront of semantic image segmentation. The methods rely on Convolutional Neural Networks (CNNs) in the TensorFlow framework, which are capable of performing pixel-level image classification tasks at a fine-grained level [29]. The DeepLabV3 model was used in this study, along with the Ade20k dataset to handle different types of scenes and different types of objects [30]. Figure 5 illustrates the process of segmenting the sample image architectural heritage by DeepLabV3.
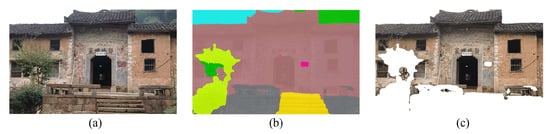
Figure 5.
Example image of semantic segmentation diagram: (a) sample images; (b) semantic segmentation results; and (c) results of building extraction (Source: drawn by the author).
3.3.4. Data Quantization Methods
K-means clustering is a common unsupervised learning algorithm for dividing a dataset into K non-overlapping subsets (clusters), each of which has sample points that are similar in some sense [31]. It consists of four steps:
- (1)
- Initialization: Randomly select k-clustering centers;
- (2)
- Assignment: Assign each pixel to the closest cluster center;
- (3)
- Update: Calculate the average color of all pixels in each cluster as the new center;
- (4)
- Convergence: Repeat the steps of (2) assignment and (3) update until the clustering results are stable [32].
The K-means algorithm first determines the cluster to which a data point belongs by looking at the distance from the data point to the center of mass. The Euclidean distance is commonly used to measure the distance. For two dvectors and , the Euclidean distance between them is defined as follows:
The aim of this algorithm is to minimize the sum of squares of the distances from the sample points within a cluster to the cluster center [33]. Its mathematical expression is
where is the number of clusters, and is the square of the distance between the data point and the center of mass of the cluster to which it belongs . The K-means algorithm is an iterative process in which the clusters and the center of mass are updated until the objective function converges or the maximum number of iterations are performed.
It has been demonstrated that the human eye’s color abstraction of space is closest to the human eye’s perception of primary colors when the number of clustered clusters is 4–10 [34]. Therefore, in this paper, we used Image Color Summarizer, a color analysis tool with a K-means clustering algorithm, to set the number of clusters to 8 and perform a cluster analysis of the colors to obtain the proportions of the top 8 colors (except white) and their HSV values. The sample size of the resulting color library is still relatively large, and, for further research, a secondary K-means clustering analysis was performed on this color library to obtain the generalized colors [35].
3.3.5. Data Analysis Method
On the basis of the principle of the HSV color space, a visualization method was proposed to observe the clustering phenomenon and distribution characteristics in color data in a more intuitive way. The color gradations were classified according to a certain range (Table 2) and analyzed by Origin software; that is, the histogram of hue was generated; the hue (H), saturation (S), and value (V) are expressed in two planes, respectively, to obtain the scatter plot of hue (H)—saturation (S), the scatter plot of hue (H)—value (V) scatterplot, saturation (S)—value (V) scatterplot, which were used to characterize the distribution properties of each color [36]. The frequency and distribution of different colors were analyzed to obtain histograms representing the distribution of hue (H), saturation (S), and value (V). The method extracts color information by collecting and analyzing large amounts of image data. By quantifying these values, the color space can be divided into multiple intervals, thus simplifying the analysis process and improving computational efficiency [37].
Table 2.
Range of hue classification (Source: drawn by the author).
4. Research Results and Analyses
4.1. Color Cluster Analysis of Architectural Heritage
A color cluster analysis of photographs of the architectural heritage of the four villages has been carried out using the above methodology and the results of the color analysis have been produced (Figure 6).
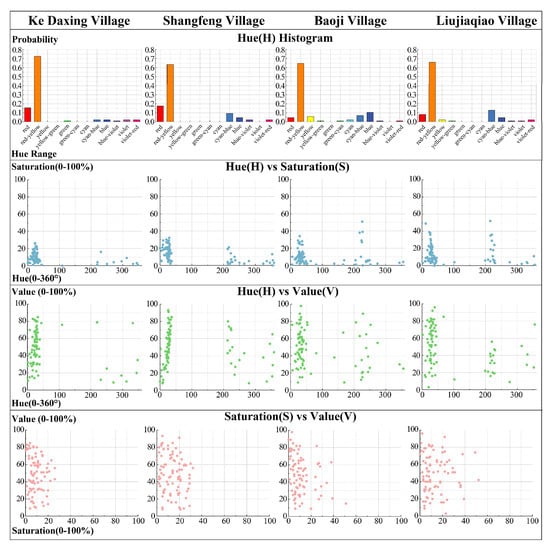
Figure 6.
Color cluster analysis of four traditional villages’ architectural heritage (Source: drawn by the author).
4.1.1. Ke Daxing Village
Ke Daxing Village is an ancient building of ‘green bricks and black tiles’, each with a 3-meter-long and 2-meter-wide bluestone patio, blocks connected to each other. From north-west to south-east, a green stone alley of more than 80 meters highlights the mood. In terms of materials and colors, black tiles, cyan bricks, white eaves and stone frames dominate. The outer walls of the buildings are all made of cyan bricks, and the roofs are made of small cyan tiles, which have been well preserved for hundreds of years. The histogram of color phases shows that the main color phases of the architectural heritage of Ke Daxing Village include red-yellow, red, a small amount of fuchsia and blue hues. From the hue (H)—saturation (S) scatter plot, it can be seen that the hue red-yellow, red, densely concentrated in the 0–25% low-saturation interval, fuchsia and blue hues are concentrated in the middle 0–10% low-saturation interval and are relatively dispersed. The hue (H)—value (V) scatter plot shows that the hue red-yellow, red is distributed in the 10–85% value and concentrated in the middle and high value. And the saturation (S)—value (V) scatter plot distribution is very dispersed between 0 and 30%.
4.1.2. Shangfeng Village
Shangfeng Village consists of more than 40 ancient buildings, which have borrowed the architectural styles of Huizhou and Jiangxi and integrated with the local culture, thus developing the unique architectural features of southeastern Hubei: most of the outer walls are rectangular planes, constructed with bricks and wood, with whitewashed walls and black tiles, with carvings on the top and lapis lazuli boards underneath, and with intact stone carvings and high craftsmanship, which have a pure and simple atmosphere. Tall walls are surrounded by a circle, the wall line is staggered, half-hidden, half-exposed double-draped roofs are hidden behind the heavy horse-head wall, able to withstand fire and wind. The hue histogram shows that the architectural heritage of the village of Shangfeng is predominantly reddish-yellow and red, supplemented by small amounts of cyan blue and blue. In terms of saturation, the hue (H)—saturation (S) scatter plot shows that red-yellow and red tones are mainly low-saturated and densely distributed between 0 and 35%, supplemented by cooler tones such as green-blue with medium to low saturation between 0 and 60%, and a small amount of blue as low-saturated in the 0–20% range. Reading the hue (H)—value (V) scatter plot, it can be seen that red-yellow and red tones are distributed between 5 and 95%, cyan blue tones are in the 20% and 80% of the medium-high value. And the value of saturation (S)—value (V) scatter plot is distributed between 0 and 30%. Shangfeng Village has a concentration of hues that are low-saturated and medium-high value.
4.1.3. Baoshi Village
There are more than 130 ancient buildings, of various shapes and sizes from the Ming, Qing and Republican periods in Baoshi Village, which is known as ‘the first ancient buildings in Chutian’. Baoshi Village is named after a small river in the village called ‘Baoshi River’, which has many pebbles in its water, hence its name. The pebbles are not only used in the village’s architecture but also add a unique color to the village, making the whole village full of a rustic and elegant style. The white, ink, ochre, blue and bright yellow colors of Baoshi Village are not only shown on the walls but are also prevalent in the eaves and detailed decorations, such as the eave paintings combined with gray ridges. From the hue histogram, it can be seen that the main hues of the architectural heritage of Baoshi Village are red-yellow, a small amount of cyan blue, blue and yellow, with fuchsia accents; as can be seen from the hue (H)—saturation (S) scatter plot, the reddish yellow is more concentrated in the medium-low saturation range, ranging from 0 to 30%, while the cyan blue and blue are dispersed in the low-saturation range of 0–20%, which is relatively more dispersed. From the hue (H)—value (V) scatter plot, it can be seen that the hue red-yellow is concentrated in the range of 15–85%, and cyan blue and blue are in the range of 10–85%. The saturation (S)—value (V) scatter plot shows that the saturation is concentrated in the 0–20% range and dispersed in the 20–50% range.
4.1.4. Liujiaqiao Village
Liujiaqiao Village is a famous ancient building area in China during the Ming and Qing dynasties, consisting of 740 houses, 38 corridors and 54 patio courtyards, with a total area of 35,000 square meters. Most of them are Hui-style buildings from the Ming and Qing dynasties. Most of the houses in Liujiaqiao are of a two-story brick and wood structure, with hard hill type roofs and tile roofs. The buildings have high gate towers and flying eaves and corners, which are very characteristic of Huizhou-style architecture. The colors and decorations are exquisite, most of the exterior walls of the residential buildings are made of bricks, and the roofs are made of green tiles. In addition, the furnishings inside the buildings are also elaborate, such as carved dragons and painted phoenixes on the corridors. From the hue histogram, it is concluded that the architectural heritage of Liujiaqiao Village has red and yellow as the main hues, with a small amount of greenish blue, blue tones dotted. From the hue (H)—saturation (S) scatter plot, it can be seen that the Liujiaqiao Village building color saturation of a variety of hues are between 0 and 40%, for the middle and low saturation, while the red and yellow saturation is more concentrated. From the hue (H)—value (V) scatter plot, it can be seen that the main color red-yellow value is concentrated in the distribution of 0–90%, medium-high and low values are included, and the rest of the green-blue, blue hue value in the 20–60% is relatively more dispersed. The saturation (S)—value (V) scatter plot shows that the saturation is between 0 and 40%, and the data are more dispersed.
4.2. HSV Distribution Analysis of Architectural Heritage Colors
The biggest advantage of the HSV color space is the mutual independence of the color attributes in the color space and the consistency of spatial spacing with the human eye’s vision. The hue of the HSV color space is usually 60°. Usually, saturation and brightness are divided into low interval (0~0.33), medium interval (0.33~0.66), and high interval (0.66~1). On the basis of the image colors collected using K-mean clustering, the distribution characteristics of each color were plotted using hue, saturation and value as the horizontal coordinates and the frequency of the number of pixels as the vertical axis (Figure 7). At the same time, we aim to find out the proportion of the distribution of the HSV data of the colors of the ancient buildings in each village in each region (Table 3).
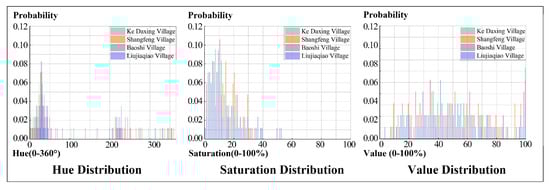
Figure 7.
HSV distribution of built heritage colors in four traditional villages (Source: drawn by the author).
Table 3.
Percentage of number of clustered pixels of architectural heritage (Source: drawn by the author).
The color values of the architectural heritage of the four villages have distinctive features in the color HSV distribution. There are three peaks in the hue (H) values. The first peak is located at around 30, dominated by red and yellow, accounting for about 80%, which is due to the fact that the architectural heritage of the four villages is built with adobe bricks and pebbles as building materials. The second peak is located at around 220 and is dominated by blue color, accounting for about 20% of the total, because a small number of the architectural heritage of the four villages is also based on green bricks as a building material. The saturation (S) values are concentrated in the 0–30% low-color range, with the values decreasing from 0 to 30%, and the peak value is about 10%. The color saturation values of the architectural heritage of Ke Daxing Village have the smallest extreme difference and the most stable variation, while Liujiaqiao Village has the largest extreme difference, which indicates that Liujiaqiao Village has a strong contrast in color saturation. The data of value (V) are uniformly distributed in the interval of 10–100%, and the color expression increases and then decreases in the low, medium and high intervals, with the obvious peaks at 40% and 100%. Between 40% and 60% showed a small degree of stability.
As shown in Table 3, the number of pixels in the low interval of 0–60° of the color phase of the architectural heritage of Ke Daxing Village is 6.6 times higher than that of the high interval of 60–360°, while the low intervals of the other three villages are 3, 2.7 and 2.7 times higher than that of the high intervals, respectively. In terms of saturation, the number of pixels in the low interval is much higher than in the high interval in the four villages, 84, 85, 81, and 78 times, respectively. The proportion of the number of value pixel counts is more balanced compared to hue and saturation, and the proportion of the number of architectural heritage pixels in the low, medium, and high zones of the four villages reaches a situation close to 1:2:1.
4.3. Color Relationships After Secondary Clustering
Quadratic K-mean clustering was performed on the collected architectural heritage colors of four villages in the southeastern region of Hubei Province, eight representative colors were extracted as the dominant colors of the color images, some colors with fewer samples and less distinctive features were filtered out, and their respective proportions in the architectural heritage of each traditional village were also extracted (Figure 8). The hue, saturation and value of the representative colors were compared based on the HSV color space information. The proportions of the dominant colors in the architectural heritage of the four traditional villages clearly increased in a trapezoidal manner. Among them, the proportion of buildings with one color in Ke Daxing Village and Liujiaqiao Village is super close to 20%, indicating that the colors of these two villages are mainly dominated by this type of color. On the other hand, the proportion of colors in Shangfeng Village and Baoshi is relatively balanced. Specifically, cool gray tones (e.g., light gray, dark gray and white) dominate the color trends of the architectural heritage of the four villages, with warm gray tones (e.g., light brown and dark brown) and high value (V) in the secondary colors of Shangfeng Village and Liujiaqiao Village, while the secondary tones of the buildings of Ke Daxing Village and Baoshi Village are also cool gray tones. Both the main and secondary colors of the buildings in Ke Daxing Village have high value. The proportion of auxiliary colors in Shangfeng Village is balanced between 12% and 13%. There is not much difference between the saturation and value of the auxiliary colors of the main body colors of Baoshi Village. Liujiaqiao Village has a higher percentage of warm tones in comparison to Shangfeng Village’s auxiliary colors.
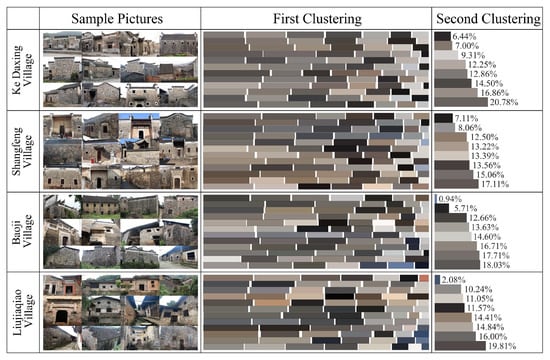
Figure 8.
Secondary clustering color and color share analysis of architectural heritage in four villages (Source: drawn by the author).
5. Discussion
5.1. Software to Extract and Quantify Architectural Heritage Colors
Previously, manual color card comparison for color extraction and instrumental color extraction, the method of Li et al. [24] and Shao et al. [5] who used optical instruments to obtain color data and subjectively screen the color data, required a large number of manual measurements for subsequent quantization, with low extensibility. In contrast, our proposed method corrects the captured images first and then applies the K-means color clustering algorithm to process the corrected images for data acquisition. This method has a significant advantage in that it greatly improves the accuracy of color acquisition while taking into account the efficiency of color acquisition. No complex optical equipment is required, and the operation can be completed with common shooting equipment and computer software, which is more cost-effective. Once the data are acquired, it can be brought into the HSV color space for quantitative analysis of the distribution characteristics of the color data, rather than just a simple qualitative description. Similar studies have confirmed this finding [38,39,40].
5.2. Factors Affecting the Color of the Region’s Architectural Heritage
Although the use of scientific and technological means to objectively evaluate and analyze architectural heritage color data has been the trend of many color studies, we still cannot ignore the intrinsic mechanisms and factors that affect the color of architectural heritage. For example, historically and culturally, the traditional Chinese five-color theory distinguishes between the colors used in imperial and civil buildings, which leads to regional color differences [41]. There are significant differences between the architecture of Iran and Australia in terms of the influence of socio-cultural factors on color perception, preference and use [42]. The hierarchical concepts and norms of etiquette embedded in Confucianism have left a deep imprint on the architectural heritage structures of southeastern Hubei Province. In terms of color choices, these buildings are also heavily influenced by Confucian concepts and rituals. In contrast to the red and yellow colors that symbolize the majesty of the royal family, the buildings here are mostly in simple and elegant shades of green, gray and white. This not only fits the local cultural characteristics of the region but also reflects the color concepts of the ancient Chinese doctrine of the five colors [43]. This has been confirmed in previous studies. In addition, geographic location and popular preference are also key factors in shaping the color of architectural heritage. The villages of Shangfeng and Liujiaqiao have a primary color hue in the 0–40 range and a secondary color hue in the 200–230 range. These color differences are mainly determined by the building materials. As we know, the southeast of Hubei Province is surrounded by mountains, and transportation is inconvenient, so the building materials of the traditional architectural heritage are locally sourced, and materials such as green bricks and rammed earth, which are very common in the region, have become an important material basis for shaping the unique colors of the villages. In the course of development, the walls have undergone red brick restoration and white plaster restoration, resulting in gray concrete remaining on the façade, which, to a certain extent, affects the range of color variations. This variation is largely attributable to the local economy, which has allowed the wider use of modern building materials. However, the absence of large-scale changes in the colors of the architectural heritage is due to the implementation of effective government control measures to ensure the relative stability of the architectural colors [44].
5.3. Recommendations for Architectural Heritage Color Conservation and Development
This study rationalizes the conservation and development of the architectural heritage of four villages in southeastern Hubei Province and proposes a recommended color spectrum (Figure 9a). For the main color red-yellow and red, its hue value should be controlled in the range of 0–40, and the overall color area should be between 80 and 100%. For auxiliary hues cyan blue and the blue system, the hue control in the 200–230 interval band, accounting for 0–20%, with an appropriate amount of warm tones, can increase the richness of the color and the sense of hierarchy. For the main use of low-saturation colors, the saturation value should be in the range 0–30%, and the interval of the colors accounted for the overall saturation should be in the interval of 90–100%. Highly saturated colors should be used as embellishment and avoid excessive use, so as not to affect the stability and coordination of the overall color; the choice of value is relatively broad, with a ratio control of 1:2:1 for the low, medium and high ranges, respectively, mainly in the 30–70% range. The building walls are mainly used in the high value(V) of the colors, while the top of the roof space was for choosing the chromaticity of the smaller tiles, in order to maintain the stability of the overall color. Based on the current status of architectural colors and using the architectural heritage color genes, the classification of chromatographic main, auxiliary and accent tones is proposed, and modern architectural colors are adjusted in accordance with the color ratio of 60–70% for main tones, 20–30% for auxiliary tones, and less than 10% for accent tones (Figure 9b). Based on this, the primary work of architectural heritage protection is to inherit the original materials, such as green bricks, rammed earth and green tiles, and to inherit the production techniques, such as rammed earth walls, and, secondly, according to the actual needs, to adjust the color of the building facades by means of brushing the walls, paving bricks, etc., and to make efforts to improve the status quo of jumping colors and heterogeneous colors, so as to perpetuate the color and style characteristics of the architectural heritage.
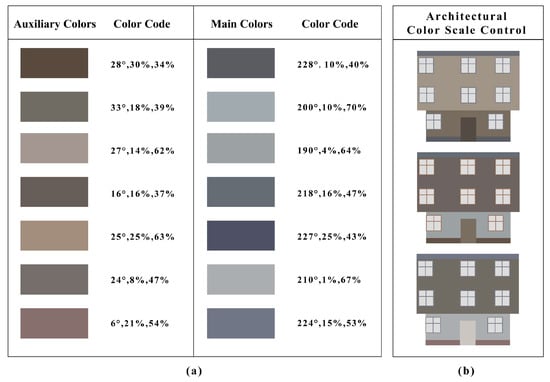
Figure 9.
Recommended color spectrum: (a) recommended primary and secondary colors; and (b) architectural color scale control (Source: drawn by the author).
5.4. Limitations of This Study
This study has some limitations in terms of sample picture outliers processing. Although the pictures have been processed for off-color and exposure, the quality of the pictures is affected by many factors such as light in the shooting session [45]. Secondly, semantic segmentation removes the shadows of the building outright, which can lead to a loss of building area. In addition, the convergence result of the K-means algorithm is highly dependent on the selection of the initial clustering center, which may lead to convergence failure, empty clusters (i.e., some colors are not clustered), or locally optimal solutions. The HSV color space improves the light stability, but the complex background may still lead to noise interference [46,47]. However, we believe that the results of this study still have operational significance at the practical application level, and, at the same time, this study also builds a reference framework for subsequent studies, and we expect that more scholars will be able to put forward brand new methods and strategies to effectively circumvent the above problems in future studies.
6. Conclusions
In this study, we use color data analysis to construct an objective ecological perspective, which provides a valuable reference for the comparative analysis of color characteristics of architectural heritage. Previous studies have used algorithms to calculate color characteristics, but they are limited by the quality of the images and often do not take into account the elasticity of color changes in real environments. In contrast, our approach, which combines post-processing software color correction with K-Means color clustering and HSV color space quantization, not only improves the efficiency of color extraction but also makes the color data more accurate, thus establishing a more effective method for analyzing the color characteristics of architectural heritage.
By using the color data extracted from the K-Means color clustering and quantitative analysis using the HVS color space, the similarities and differences between the architectural heritage colors of different villages in the same region were investigated, and the stability and diversity of the architectural heritage colors that have existed up to now were recognized, so as to objectively and comprehensively reveal the characteristics of the evolution of the architectural heritage colors in the region and the mechanisms behind them. The results of this study will provide a meaningful reference for the continuation and development of architectural heritage color.
Author Contributions
Conceptualization, L.D.; methodology, L.D. and M.K.; software, M.K.; formal analysis, L.D. and M.K.; investigation, M.K.; resources, L.D.; data curation, M.K.; writing—original draft preparation, M.K.; writing—review and editing, L.D.; visualization, M.K.; supervision, L.D.; project administration, L.D.; funding acquisition, L.D. All authors have read and agreed to the published version of the manuscript.
Funding
This research received no external funding.
Data Availability Statement
The data for this study are available from the authors upon request.
Conflicts of Interest
The authors declare no conflicts of interest.
References
- Codosero Rodas, J.M.; Naranjo Gómez, J.M.; Castanho, R.A.; Cabezas, J. Land Valuation Sustainable Model of Urban Planning Development: A Case Study in Badajoz, Spain. Sustainability 2018, 10, 1450. [Google Scholar] [CrossRef]
- Mu, Q.; Aimar, F. How Are Historical Villages Changed? A Systematic Literature Review on European and Chinese Cultural Heritage Preservation Practices in Rural Areas. Land 2022, 11, 982. [Google Scholar] [CrossRef]
- Cheshmehzangi, A. Urban Regeneration and Building Colours: Mapping Visual and Perceptual Dimensions of Dali’s Old Towns. In Mapping Urban Regeneration: City Life Experiences in Yunnan, China; Springer Nature: Singapore, 2023; pp. 105–137. [Google Scholar]
- Santopuoli, N.; Pecoraro, I. Historic Centers Restoration and Ancient Buildings Energetic Efficiency Improvement. J. Build. Constr. Plan. Res. 2014, 2, 209–215. [Google Scholar] [CrossRef][Green Version]
- Shao, J.; Li, L.; Jiang, Y.; Liu, X.; Yang, H. Quantitative analysis methods for evaluating colour on architectural heritage: Survey of colour restoration and perception of the Wen Yuan Ge in the Forbidden City. Herit. Sci. 2024, 12, 124. [Google Scholar] [CrossRef]
- Yushu, C.; Feng, G. Quantitative Analysis of Traditional Chinese Color. BioResources 2023, 18, 4954–4963. [Google Scholar] [CrossRef]
- Hong, L.; Pang, S.; Geng, M.; Wang, S. The GIS study on the spatial structure and visual perception of historical districts in winter cities. Arab. J. Geosci. 2021, 14, 1142. [Google Scholar] [CrossRef]
- Marqués-Mateu, A.; Moreno-Ramón, H.; Balasch, S.; Ibáñez-Asensio, S. Quantifying the uncertainty of soil colour measurements with Munsell charts using a modified attribute agreement analysis. Catena 2018, 171, 44–53. [Google Scholar] [CrossRef]
- Nguyen, L.; Embrechts, J.J.; Teller, J. Colour in the city: A chromatic typology for the quantitative analysis of spatial coherence. Landsc. Res. 2019, 45, 44–62. [Google Scholar] [CrossRef]
- Zhang, L.; Cheng, Y.; Ma, L. A Quantitative Study on the Colour of City Landmark Landscape Architectures. J. Phys. Conf. Ser. 2019, 1288, 012011. [Google Scholar] [CrossRef]
- Wang, Z.; Sun, H.; Li, J. Research on Architectural Color and Visual Comfort in Historic Landscape Areas. Buildings 2023, 13, 1004. [Google Scholar] [CrossRef]
- Kong, D.; Lin, X.; Lu, Z.; Fei, X.; Xie, Y.; Chen, Z. Quantitative study on the color of traditional dwellings in Jianxi River Basin, Fujian Province, based on the lab color space model. J. Asian Archit. Build. Eng. 2024, 1–27. [Google Scholar] [CrossRef]
- Pérez-Delgado, M.-L.; Celebi, M.E. A comparative study of color quantization methods using various image quality assessment indices. Multimed. Syst. 2024, 30, 40. [Google Scholar] [CrossRef]
- Feng, J.; Zhang, K.; Xu, Z.; Du, C.; Tang, X.; Zhang, L. Quantitative study on color characteristics of urban park landscapes based on K-means clustering and SD. method. Earth Sci. Inform. 2024, 17, 999–1012. [Google Scholar] [CrossRef]
- Yadav, N.K.; Saraswat, M. A novel fuzzy clustering based method for image segmentation in RGB-D images. Eng. Appl. Artif. Intell. 2022, 111, 104709. [Google Scholar] [CrossRef]
- Molada-Tebar, A.; Marqués-Mateu, Á.; Lerma, J.L.; Westland, S. Dominant Color Extraction with K-Means for Camera Characterization in Cultural Heritage Documentation. Remote Sens. 2020, 12, 520. [Google Scholar] [CrossRef]
- He, X.F.; Lv, X.G. From the color composition to the color psychology: Soft drink packaging in warm colors, and spirits packaging in dark colors. Color Res. Appl. 2022, 47, 758–770. [Google Scholar] [CrossRef]
- Bora, D.J.; Bania, R.K.; Ngoc, C. A Local Type-2 Fuzzy Set Based Technique For He Stain Image Enhancement. Ing. Solidar. 2019, 15, 1–22. [Google Scholar] [CrossRef]
- Hema, D.; Kannan, S. Interactive Color Image Segmentation using HSV Color Space. Sci. Technol. J. 2019, 7, 37–41. [Google Scholar] [CrossRef]
- Yuan, F.; Li, S.; Yang, B.; Liu, J. Research on Graphic Visual Communication Design for User Perception Experience. Appl. Math. Nonlinear Sci. 2024, 9, 1–18. [Google Scholar] [CrossRef]
- Rong, A.; Hansopaheluwakan-Edward, N.; Li, D. Analyzing the color availability of AI-generated posters based on K-means clustering: 74% orange, 38% cyan, 32% yellow, and 28% blue-cyan. Color. Res. Appl. 2024, 49, 234–257. [Google Scholar] [CrossRef]
- Miao, M.; Feng, L.; Wu, Y.; Zhu, R.; Xu, D. Color Authenticity for the Sustainable Development of Historical Areas: A Case Study of Shiquan. Sustainability 2024, 16, 2417. [Google Scholar] [CrossRef]
- Qi, Y.; Ren, Y.; Zhou, D.; Wang, Y.; Liu, Y.; Zhang, B. Quantitative Analysis and Cause Exploration of Architectural Feature Changes in a Traditional Chinese Village: Lingquan Village, Heyang County, Shaanxi Province. Land 2023, 12, 886. [Google Scholar] [CrossRef]
- Yan, L.; Li, Q.; Zhang, Y.; Zhu, C. Computer vision quantization research on the architectural color of Avenida de Almeida Ribeiro in Macau based on the human eye perspective. Front. Comput. Neurosci. 2022, 16, 951718. [Google Scholar] [CrossRef] [PubMed]
- Cabezos-Bernal, P.M.; Rodriguez-Navarro, P.; Gil-Piqueras, T. Documenting Paintings with Gigapixel Photography. J. Imaging 2021, 7, 156. [Google Scholar] [CrossRef]
- Minaee, S.; Boykov, Y.; Porikli, F.; Plaza, A.; Kehtarnavaz, N.; Terzopoulos, D. Image Segmentation Using Deep Learning: A Survey. IEEE Trans. Pattern Anal. Mach. Intell. 2022, 44, 3523–3542. [Google Scholar] [CrossRef]
- Shen, L.-S. Color Cast Detection and Color Correction Methods Based on Image Analysis. Meas. Control. Technol. 2008, 27, 10–12. [Google Scholar]
- Atik, S.; Atik, M.E.; Ipbuker, C. Comparative research on different backbone architectures of DeepLabV3+ for building segmentation. J. Appl. Remote Sens. 2022, 16, 024510. [Google Scholar] [CrossRef]
- Chen, L.C.; Papandreou, G.; Kokkinos, I.; Murphy, K.; Yuille, A.L. DeepLab: Semantic Image Segmentation with Deep Convolutional Nets, Atrous Convolution, and Fully Connected CRFs. IEEE Trans. Pattern Anal. Mach. Intell. 2018, 40, 834–848. [Google Scholar] [CrossRef]
- Zhou, B.; Zhao, H.; Puig, X.; Xiao, T.; Fidler, S.; Barriuso, A.; Torralba, A. Semantic Understanding of Scenes Through the ADE20K Dataset. Int. J. Comput. Vis. 2019, 127, 302–321. [Google Scholar] [CrossRef]
- Jardim, S.; António, J.; Mora, C. Graphical Image Region Extraction with K-Means Clustering and Watershed. J. Imaging 2022, 8, 163. [Google Scholar] [CrossRef]
- Patrascu, V. A Novel Penta-Valued Descriptor for Color Clustering; Springer Nature: Berlin, Germany, 2014; pp. 173–182. [Google Scholar]
- Wang, Q. Digital Application of Folk Culture Elements in City Branding Visual Identity Shaping. Appl. Math. Nonlinear Sci. 2024, 9, 1–14. [Google Scholar] [CrossRef]
- Han, X.; Yu, Y.; Liu, L.; Li, M.; Wang, L.; Zhang, T.; Tang, F.; Shen, Y.; Li, M.; Yu, S.; et al. Exploration of street space architectural color measurement based on street view big data and deep learning—A case study of Jiefang North Road Street in Tianjin. PLoS ONE 2023, 18, e0289305. [Google Scholar] [CrossRef] [PubMed]
- Allam, A.; Youssif, A.; Ghalwash, A. Segmentation of Exudates via Color-Based K-Means Clustering and Statistical-based Thresholding. J. Comput. Sci. 2017, 13, 524–536. [Google Scholar] [CrossRef][Green Version]
- Raj, R.; Sudhamani, D.M.V. Retrieval of Images using Combination of Features as Color, Color Moments and Hu Moments. Adv. Image Video Process. 2019, 7, 9–21. [Google Scholar] [CrossRef]
- Wang, X.; Li, W. A Fast K -medoids Clustering Algorithm for Image Segmentation based Object Recognition. J. Robot. Autom. 2020, 4, 202–211. [Google Scholar] [CrossRef]
- Liu, B.; Huang, W.; Yu, X.; Ma, Z.; Guo, Z.; Wang, S.; Jiang, W. Architectural Color Image Scale Computing of Beijing Forbidden City. In Proceedings of the 2024 International Conference on Culture-Oriented Science & Technology (CoST), Beijing, China, 25–28 August 2024; pp. 440–445. [Google Scholar]
- Schnabel, M.A.; Nakapan, W.; Kim, M.J.; Roudavski, S. Cultural Difference in Colour Usages for Building Façades Focusing on Theme Park Buildings. In Proceedings of the 21st International Conference of the Association for Computer-Aided Architectural Design Research in Asia (CAADRIA 2016), Melbourne, Australia, 30 March–2 April 2016. [Google Scholar]
- Xu, J. Unveiling Patterns and Colors in Architectural Paintings: An Analysis by K-Means++ Clustering and Color Ratio Analysis. Teh. Vjesn. Tech. Gaz. 2023, 30, 1870–1879. [Google Scholar] [CrossRef]
- Ma, Y.; Misni, A. The Application and Concept of the Theory of Five Colour in Ancient Chinese Urban Architecture. Int. J. Art Des. 2024, 8 (Suppl. S2), 61–80. [Google Scholar] [CrossRef]
- Motamed, B.; Tucker, R. Rose tinted spectacles: Culturally informed differences between Iran and Australia in architect’s colour cognition, preference and use. City Cult. Soc. 2019, 18, 100288. [Google Scholar] [CrossRef]
- Li, Y.; Wu, K.; Yuan, X. Belief Space Creation of Wurs Ancestal Hall; Springer Nature: Berlin, Germany, 2018. [Google Scholar]
- Tan, G.; Chen, Z.; Xue, M.; Jia, Y. Unveiling the mechanism of diachronic changes and regional characteristics differences in the built environment of traditional villages from the perspective of color data: Evidence from Macheng City, China. Herit. Sci. 2024, 12, 115. [Google Scholar] [CrossRef]
- Zhong, T.; Ye, C.; Wang, Z.; Tang, G.; Zhang, W.; Ye, Y. City-Scale Mapping of Urban Façade Color Using Street-View Imagery. Remote Sens. 2021, 13, 1591. [Google Scholar] [CrossRef]
- Weller, H.I.; Westneat, M.W. Quantitative color profiling of digital images with earth mover’s distance using the R package colordistance. PeerJ 2018, 7, e6398. [Google Scholar] [CrossRef] [PubMed]
- Li, X. Exploring the Integration and Value of Chinese Traditional Elements and Modern Clothing Design under Big Data Technology. Appl. Math. Nonlinear Sci. 2024, 9, 1–19. [Google Scholar] [CrossRef]


Disclaimer/Publisher’s Note: The statements, opinions and data contained in all publications are solely those of the individual author(s) and contributor(s) and not of MDPI and/or the editor(s). MDPI and/or the editor(s) disclaim responsibility for any injury to people or property resulting from any ideas, methods, instructions or products referred to in the content. |
© 2025 by the authors. Licensee MDPI, Basel, Switzerland. This article is an open access article distributed under the terms and conditions of the Creative Commons Attribution (CC BY) license (https://creativecommons.org/licenses/by/4.0/).