Article

Experimental Study on Cyclic Loading and Unloading of Remodeled Loess Using True Triaxial Testing

1
Institute of Geotechnical Engineering, Xi’an University of Technology, Xi’an 710048, China
2
School of Civil & Architecture Engineering, Xi’an Technological University, Xi’an 710021, China
3
Department of Architecture and Urban Planning, Xi’an University of Technology, Xi’an 710048, China
4
Shaanxi Provincial Key Laboratory of Loess Mechanics and Engineering, Xi’an 710048, China
*
Author to whom correspondence should be addressed.
Buildings 2025, 15(4), 602; https://doi.org/10.3390/buildings15040602
Submission received: 17 December 2024 / Revised: 22 January 2025 / Accepted: 11 February 2025 / Published: 14 February 2025
(This article belongs to the Section Building Materials, and Repair & Renovation)

Abstract

True triaxial tests of cyclic loading and unloading were carried out on remodeled loess, and the effects of the anisotropic consolidation ratio ( K = σ 1 c / σ 3 c ), intermediate principal stress coefficient ( b = σ 2 σ 3 / σ 1 σ 3 ), and cyclic loading on the deformation characteristics of the loess were analyzed. The results show that principal strain develops in two stages: a rapid initial increase followed by a slower increase until stabilization. Plastic volumetric strain is found to increase with increases in cyclic loading, anisotropic consolidation ratio, and intermediate principal stress coefficient. After normalization, the consolidation mode has a large effect on the plastic volumetric strain ratio, while the intermediate principal stress coefficient has a smaller effect. All types of plastic shear strain exhibit shear shrinkage, increasing with increases in cyclic loading and the intermediate principal stress coefficient, with no obvious relationship with the anisotropic consolidation ratio. After normalization, the consolidation mode and the intermediate principal stress coefficient have significant effects on the plastic shear strain ratio.

1. Introduction

Loess, which covers about one-tenth of the world’s land area, has distinctive characteristics such as large pores, weak cementation, and insufficient compaction [1]. These typical properties of loess make it susceptible to damage due to natural disasters such as earthquakes or loess landslides [2,3] induced by seismic activity. The formation of such landslides is closely related to the mechanical properties and residual deformation characteristics of loess when seismically loaded. Therefore, scholars have used cyclic loads to simulate seismic loads, in order to study their effects on soils. The weak cementation of loess is also the main reason for the cumulative deformation and even instability of loess dams experiencing reciprocating changes in water levels. Earthquakes and engineering problems such as increases and decreases in dam water levels are closely related to the mechanical properties of loess under cyclic loading and unloading. Therefore, it is very important to study the mechanical properties of loess under cyclic loading and unloading to mitigate natural disasters and ensure trouble-free engineering construction.
The study of soil mechanical properties under cyclic loading and unloading includes theoretical research, experimental research, and numerical simulation. This study mainly focuses on tests of different stress paths using a new true triaxial apparatus. To date, most experimental studies on the mechanical properties of soils under cyclic loading have been carried out using dynamic triaxial and hollow cylinder torsional shear apparatus [4,5,6,7]. The stress conditions of the dynamic triaxial apparatus are as follows: During the consolidation stage, axial and confining pressures are applied along the axial and radial directions. After consolidation is complete, different forms of cyclic loading are applied only in the axial direction. As a result, the loading is unidirectional and one-dimensional. For these reasons, a dynamic triaxial apparatus may be used to study the stress–strain relationship, pattern of change in strength, and development of accumulative plastic strain in soils under cyclic loading [8,9,10], or the effects of moisture content, consolidation ratio, and cycle times on axial dynamic strain, the dynamic shear modulus, and the dynamic damping ratio under axial-direction cyclic loading [11,12,13,14,15]. Liu [16,17] carried out a series of undrained cyclic triaxial tests on undisturbed and remodeled loess samples under different initial static shear stresses. It was found that the existence of initial static shear stress has a significant impact on the failure modes of loess. Three failure modes were observed in the loess samples: flow failure, cyclic mobility, and plastic strain accumulation.
Other scholars have used a hollow cylinder torsional shear apparatus to study the dynamic properties of soils [18]. The stress conditions of a hollow cylinder torsional shear apparatus are as follows: In the consolidation stage, an axial force, inner confining pressure, and outer pressure are applied to the hollow cylindrical specimen along the axial direction and the inner and outer radial directions. After consolidation is completed, different cyclic loads can be applied in the axial and torsional directions, which can induce dual-directional coupled loading. Wang [19] analyzed the development of pore water pressure, accumulative strain, the axial stress–strain relationship, and the resilient modulus in soft clay. Gabriele [20] studied the limiting value of shear strain through a series of undrained cyclic torsional shear tests on saturated loess. The limiting strain value was determined to be in the range of 23–28%, independent of the cyclic stress amplitude and the initial static shear applied. Wang [21] investigated the undrained deformation behavior and degradation of natural soft marine clay and found that the undrained response of saturated marine clay was strongly influenced by the cyclic stress ratio (CSR) and the effective confining pressure under continuous principal stress rotation, in terms of the axial strain, axial and torsional stress–strain hysteretic loops, stiffness degradation, and resilient moduli. Yang [22] studied the effects of the vertical cyclic dynamic stress ratio, torsion shear stress ratio, initial static shear stress, and intermediate principal stress coefficient on the axial plastic deformation and rebound deformation of compacted loess in Lanzhou.
Traditionally, both dynamic triaxial apparatus and hollow cylindrical torsional shear systems have mainly been used to impart unidirectional loading in the axial direction or bi-directional loading in the axial [23] and torsional directions [24,25,26]. However, in real engineering applications, soil is often in a three-dimensional stress state and the magnitude of the three-way stress is unequal. Thus, the study of cyclic loading under a simple stress path is insufficient; it is necessary to study the mechanical characteristics of loess under a complex stress path of cyclic loading and unloading.
In this study, a series of cyclic loading and unloading tests were carried out on remodeled loess under different stress paths. The tests used a rigid–flexible boundary triaxial apparatus independently developed by Xi’an University of Technology, which enables the independent loading of soil samples in three directions. This study also explored the influence of the anisotropic consolidation ratio, the intermediate principal stress parameter, and the amplitude of cyclic loading on the deformation characteristics of the remodeled loess. The complex stress state of loess under cyclic loading was realistically simulated, revealing the deformation law of the soil, thus providing a reference for analyzing engineering problems in loess areas.

2. Test Materials, Apparatus and Methods
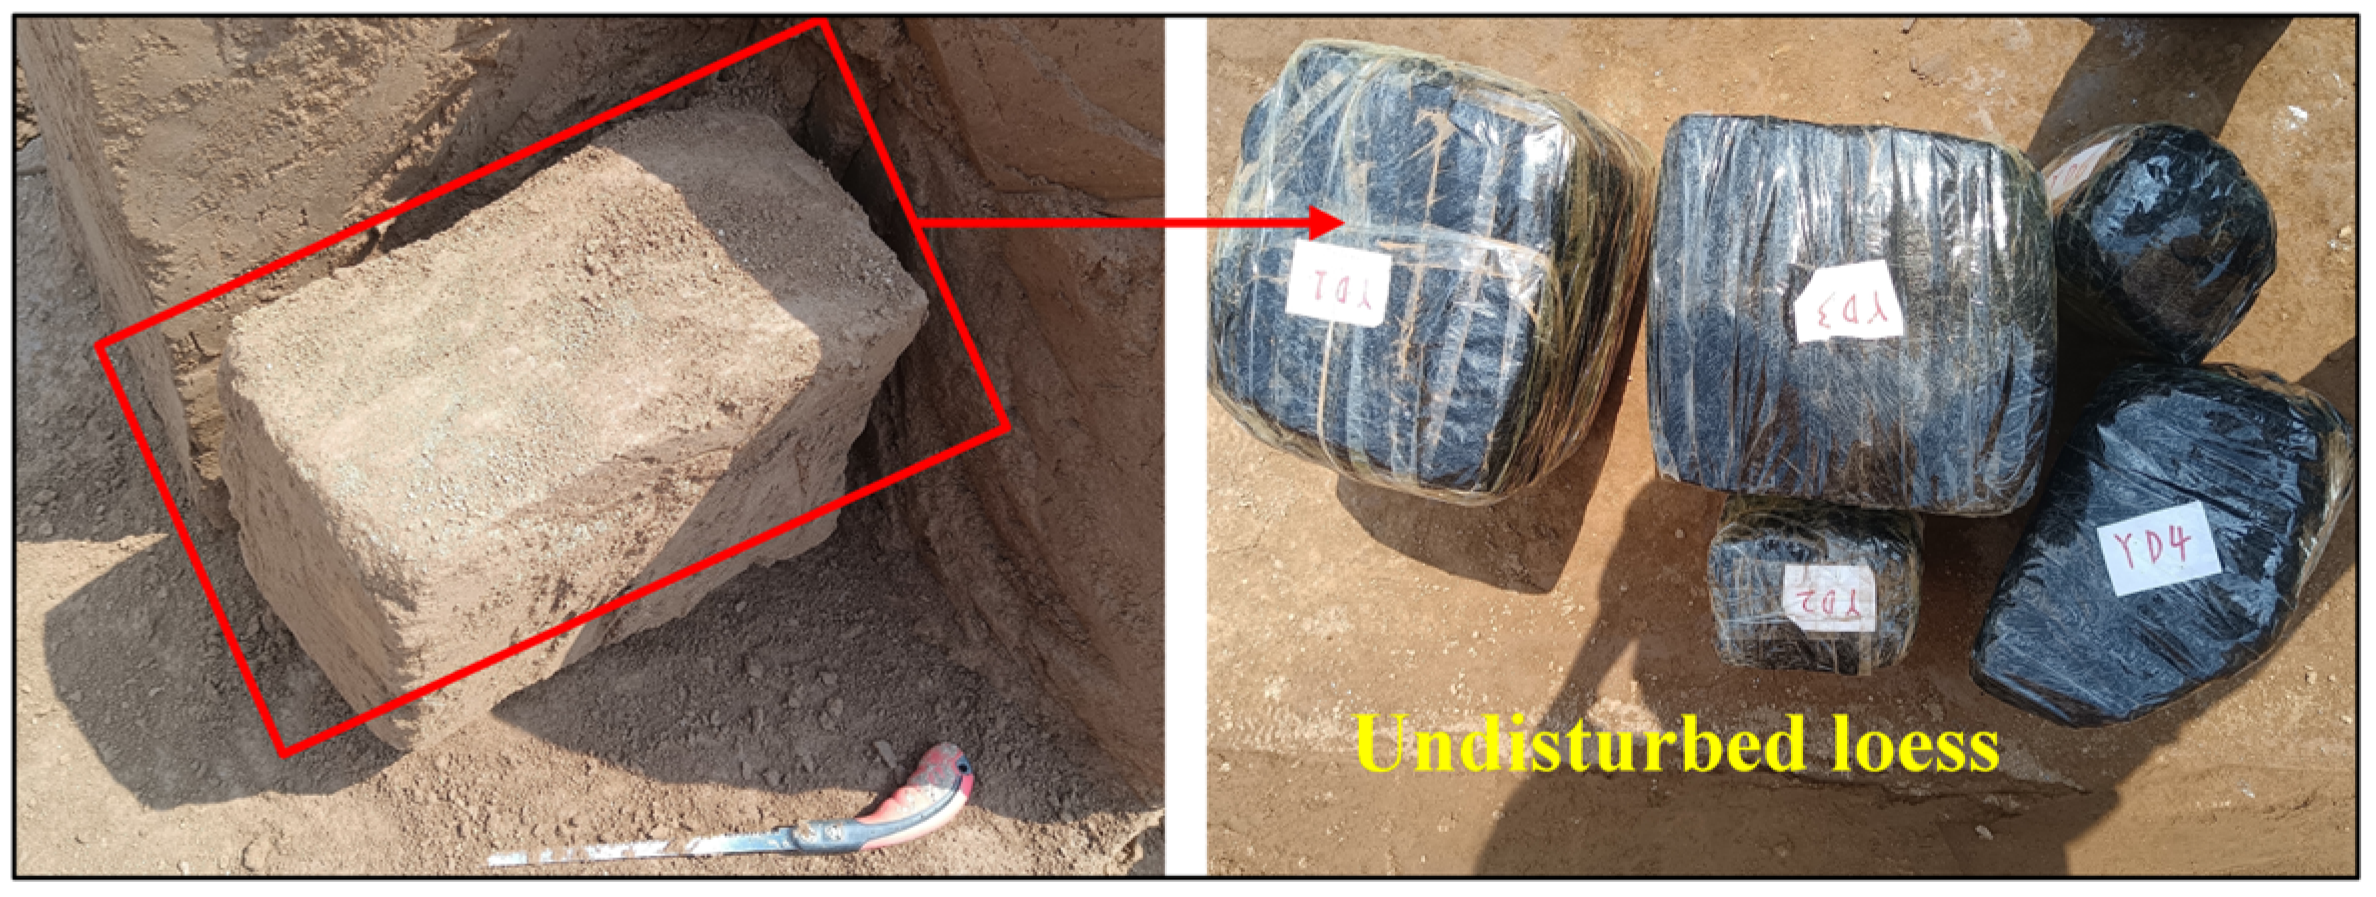
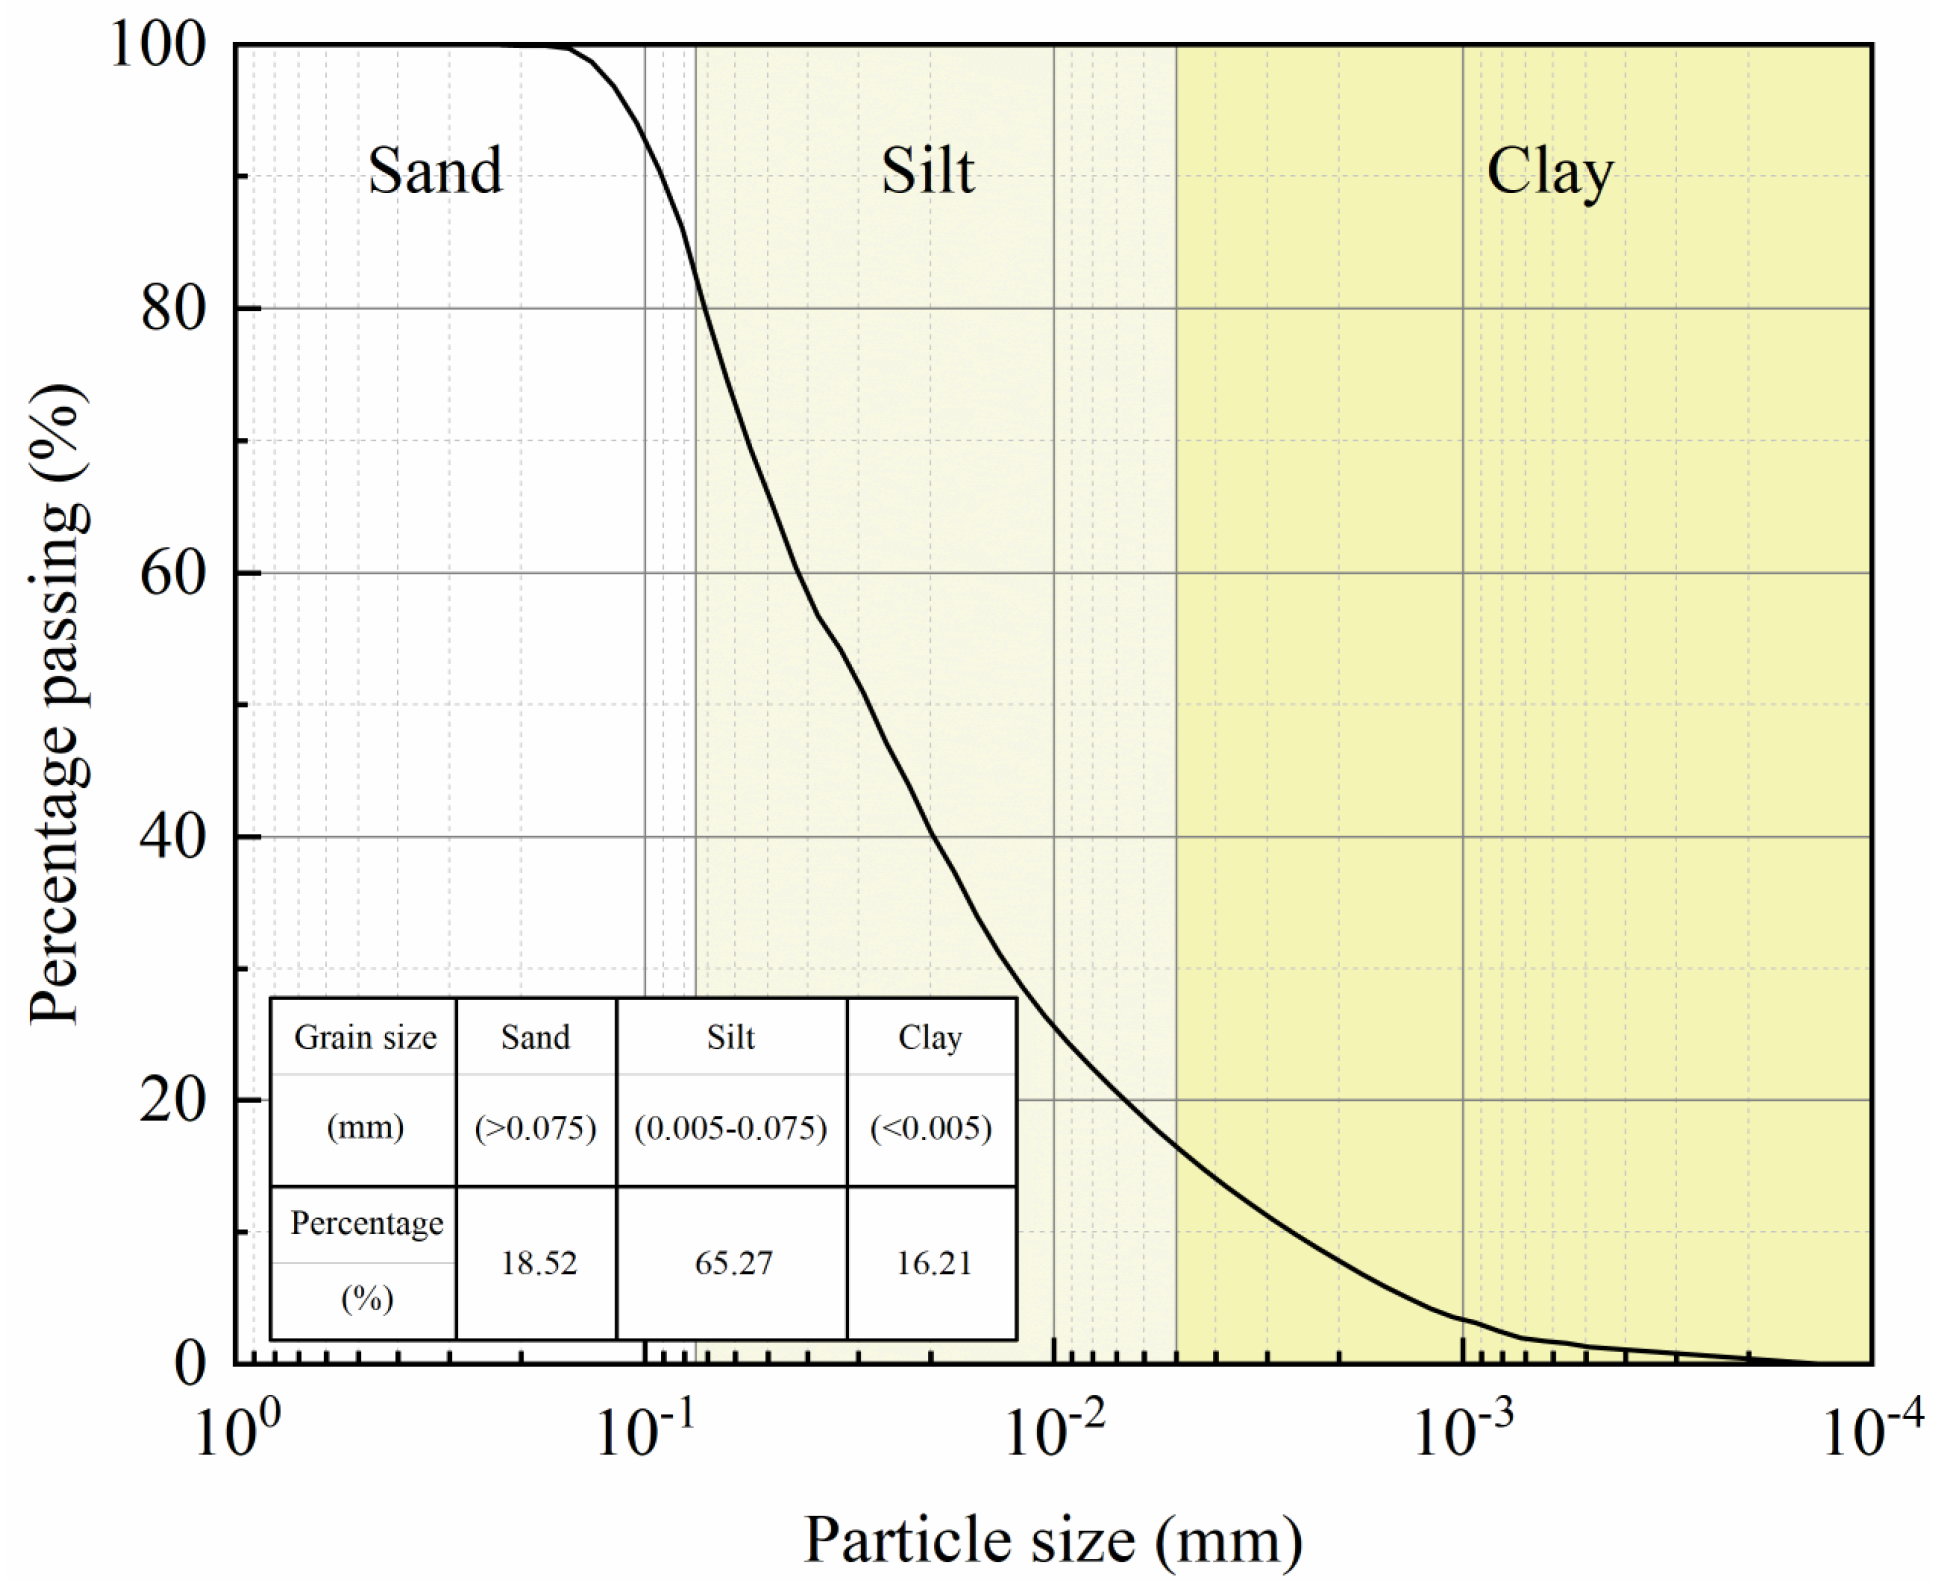
2.1. Soil Samples

Soil samples were obtained from a construction site on East Third Ring Road, Xi’an, China. Block samples were collected at a depth of 3–5 m and wrapped in black plastic bags (Figure 1). The physical and mechanical properties of the loess were determined according to the Chinese Standard for Geotechnical Testing Method [27]. The results are provided in Table 1. The particle size distribution of the soil samples, shown in Figure 2, is 18.52% sand, 65.27% silt, and 16.21% clay. The mean diameter of the soil particles, D50, is 0.028 mm. The nonuniformity coefficient Cu and curvature coefficient CC are 16.27 and 1.559, respectively, and the loess is well-graded.
The specimen preparation process was as follows: The samples of undisturbed loess were collected, dried, crushed and passed through a 2 mm standard geotechnical sieve. The target moisture content of all samples was 21%; added water was calculated according to the moisture content of the target sample and sprayed on the sample, which was then placed into a sealed bag. It was then stirred evenly and left to stand for 48 h. The target dry density of the remodeled loess specimens was controlled to be 1.23 g·cm−3. The samples measured 70 mm × 70 mm × 140 mm and were prepared using seven layers of compression: the target total mass was divided into seven parts, and the first part of the soil slurry was then poured into a custom stainless steel mold and compressed using a jack. The upper surface was scraped after completion, and a second layer of soil was poured into the mold. This process was repeated until seven layers of soil compression were completed. The sample was then labeled and placed in a moisturizing tank to rest for 48 h.

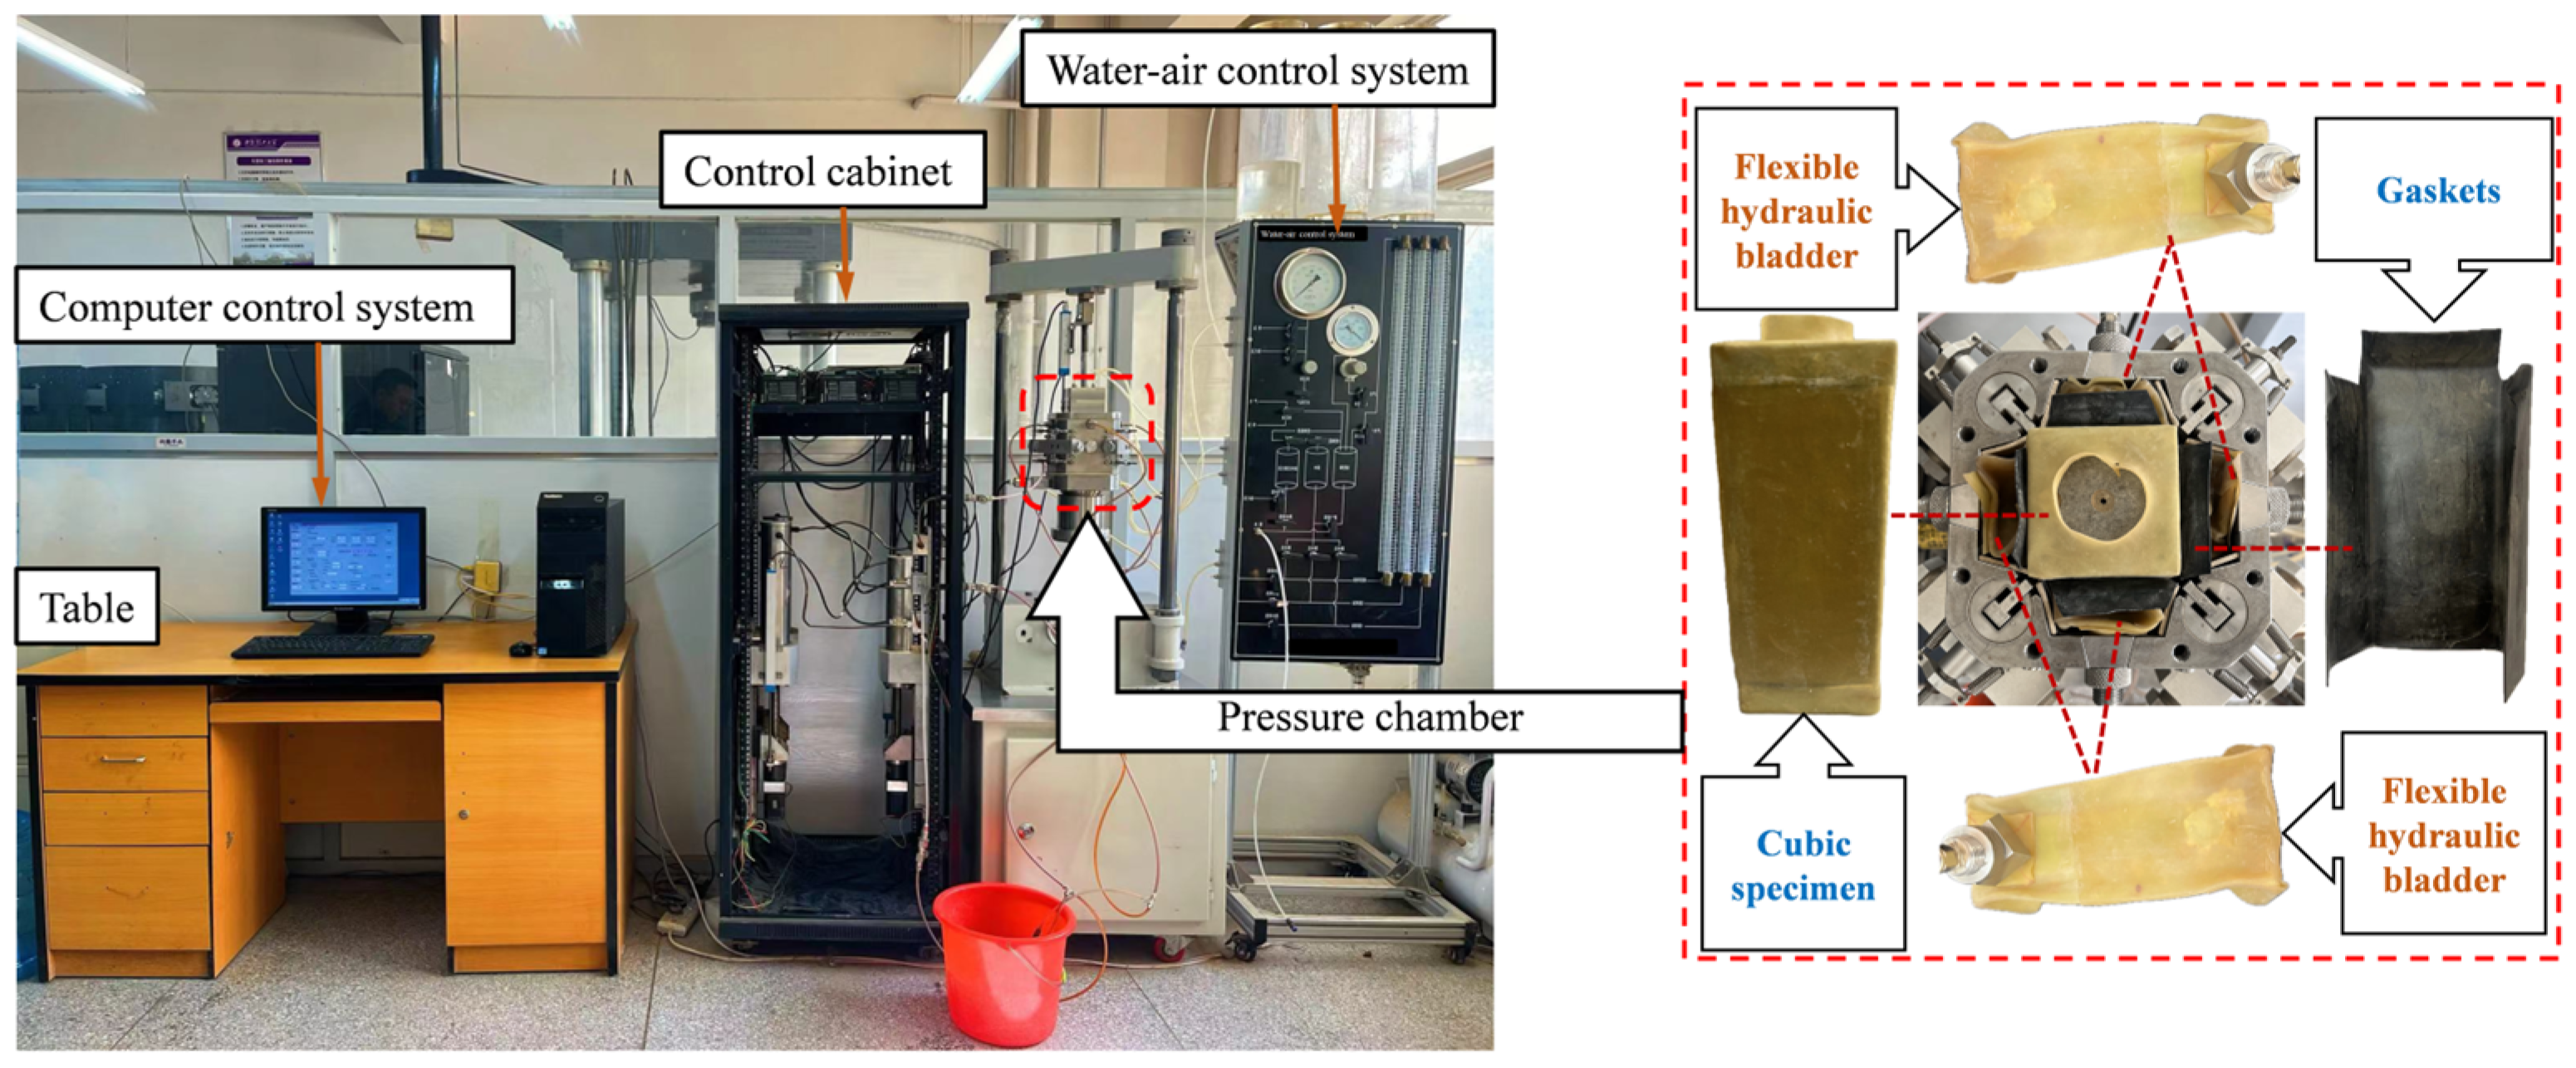
2.2. True Triaxial Apparatus
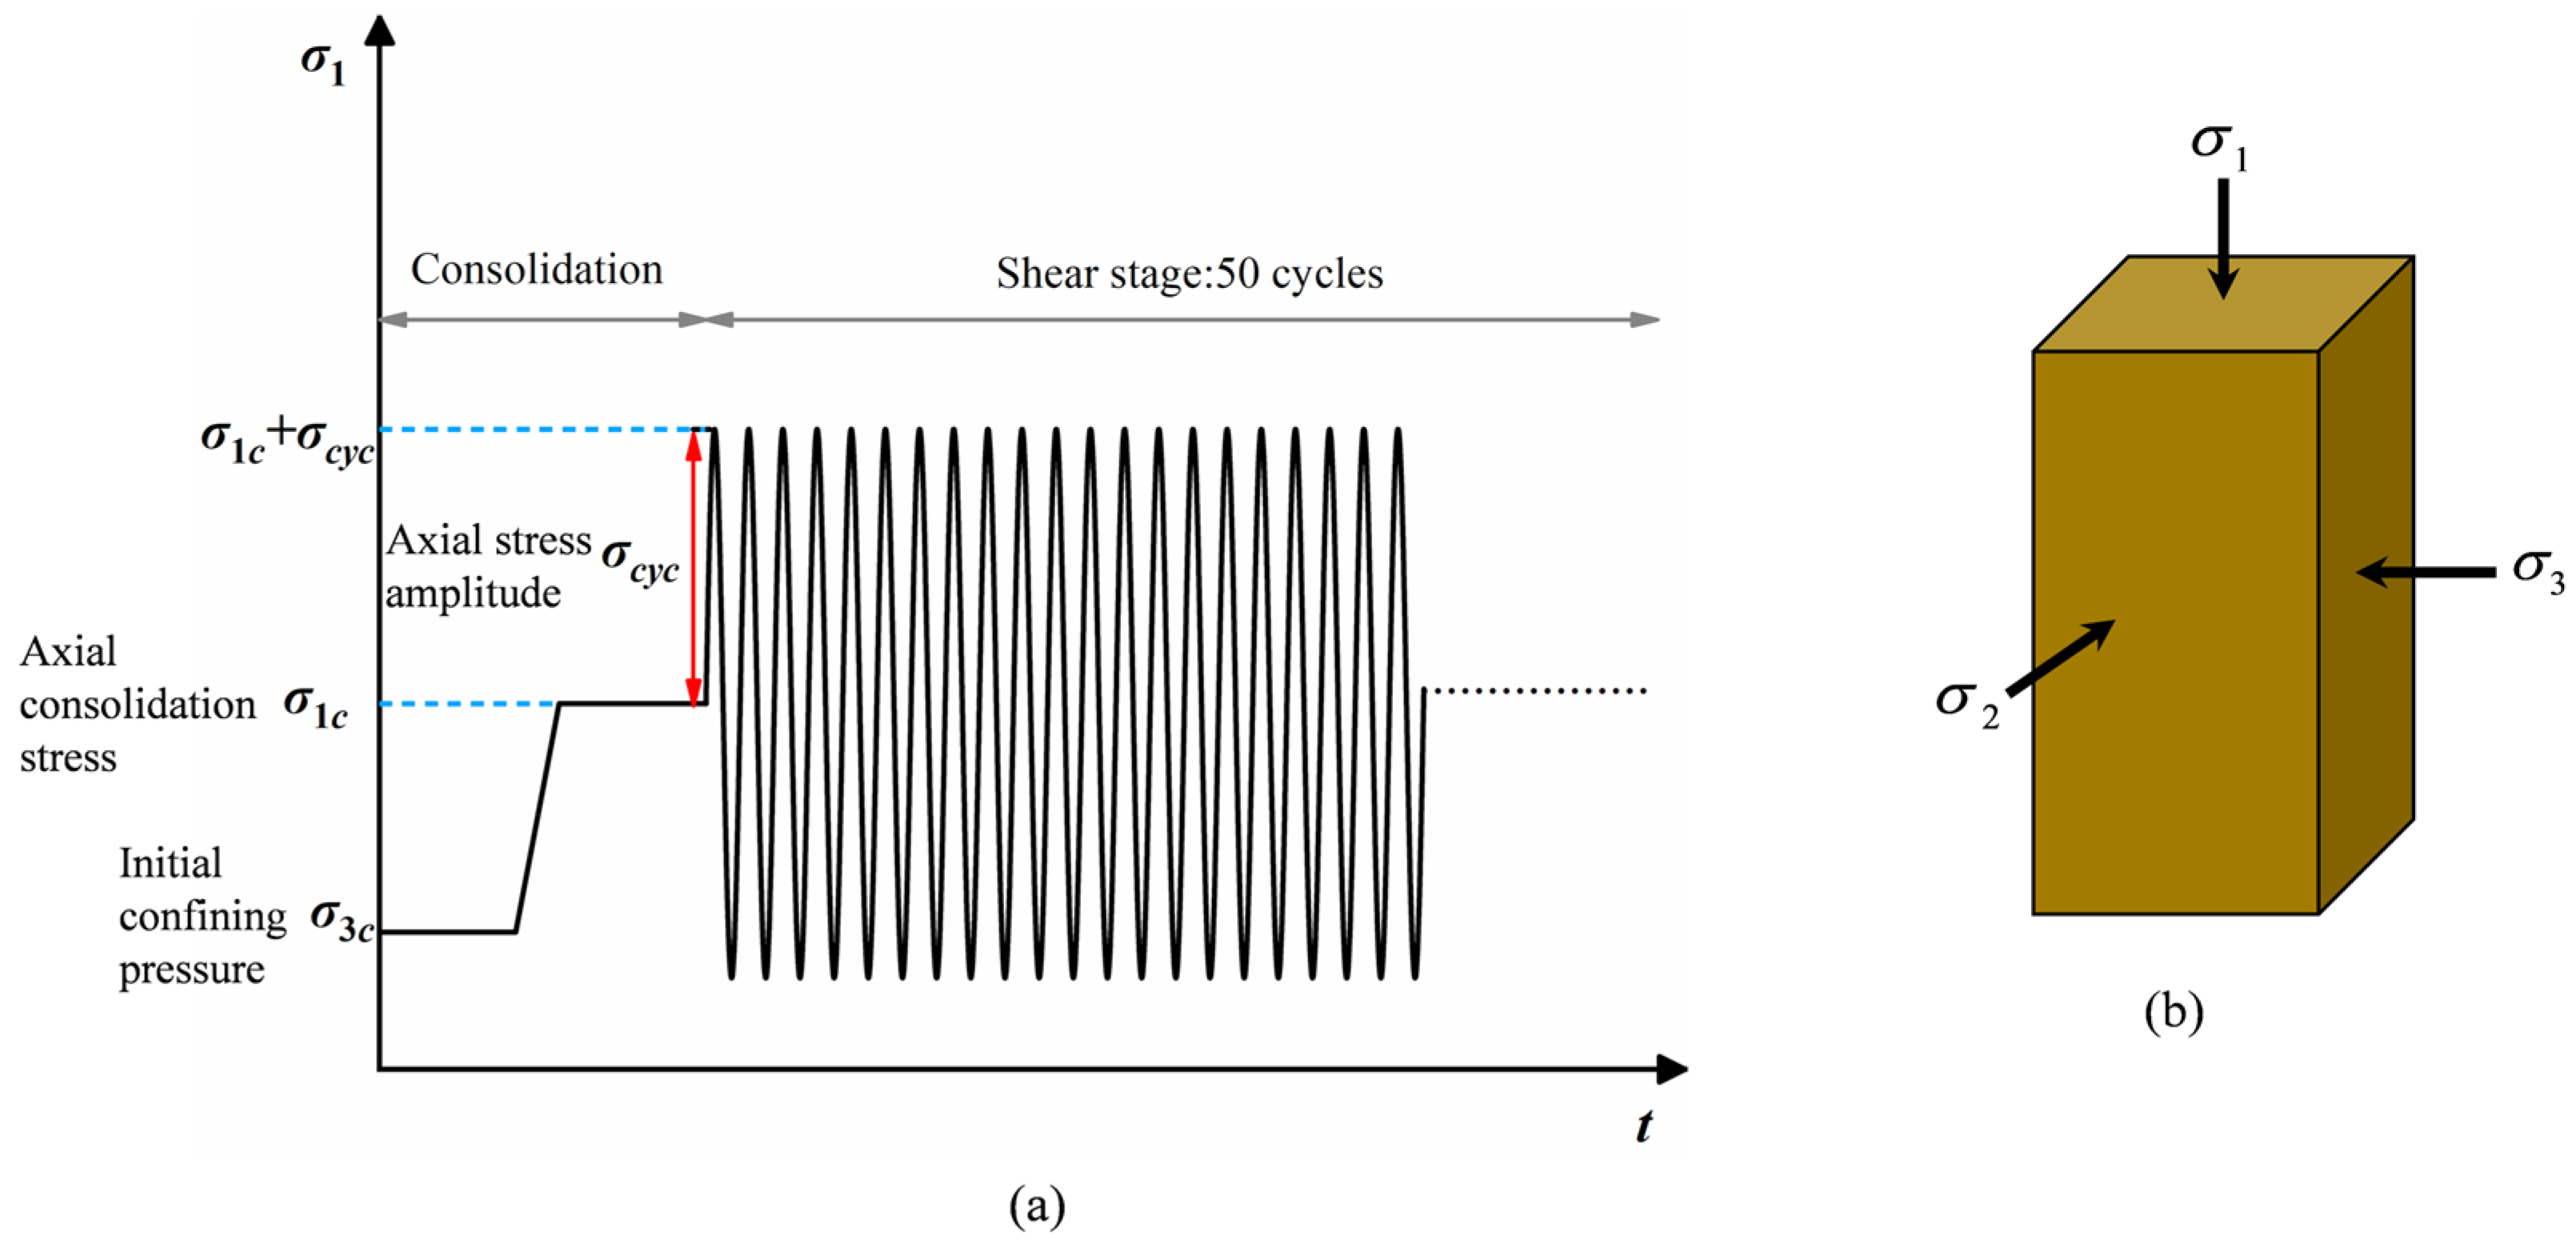
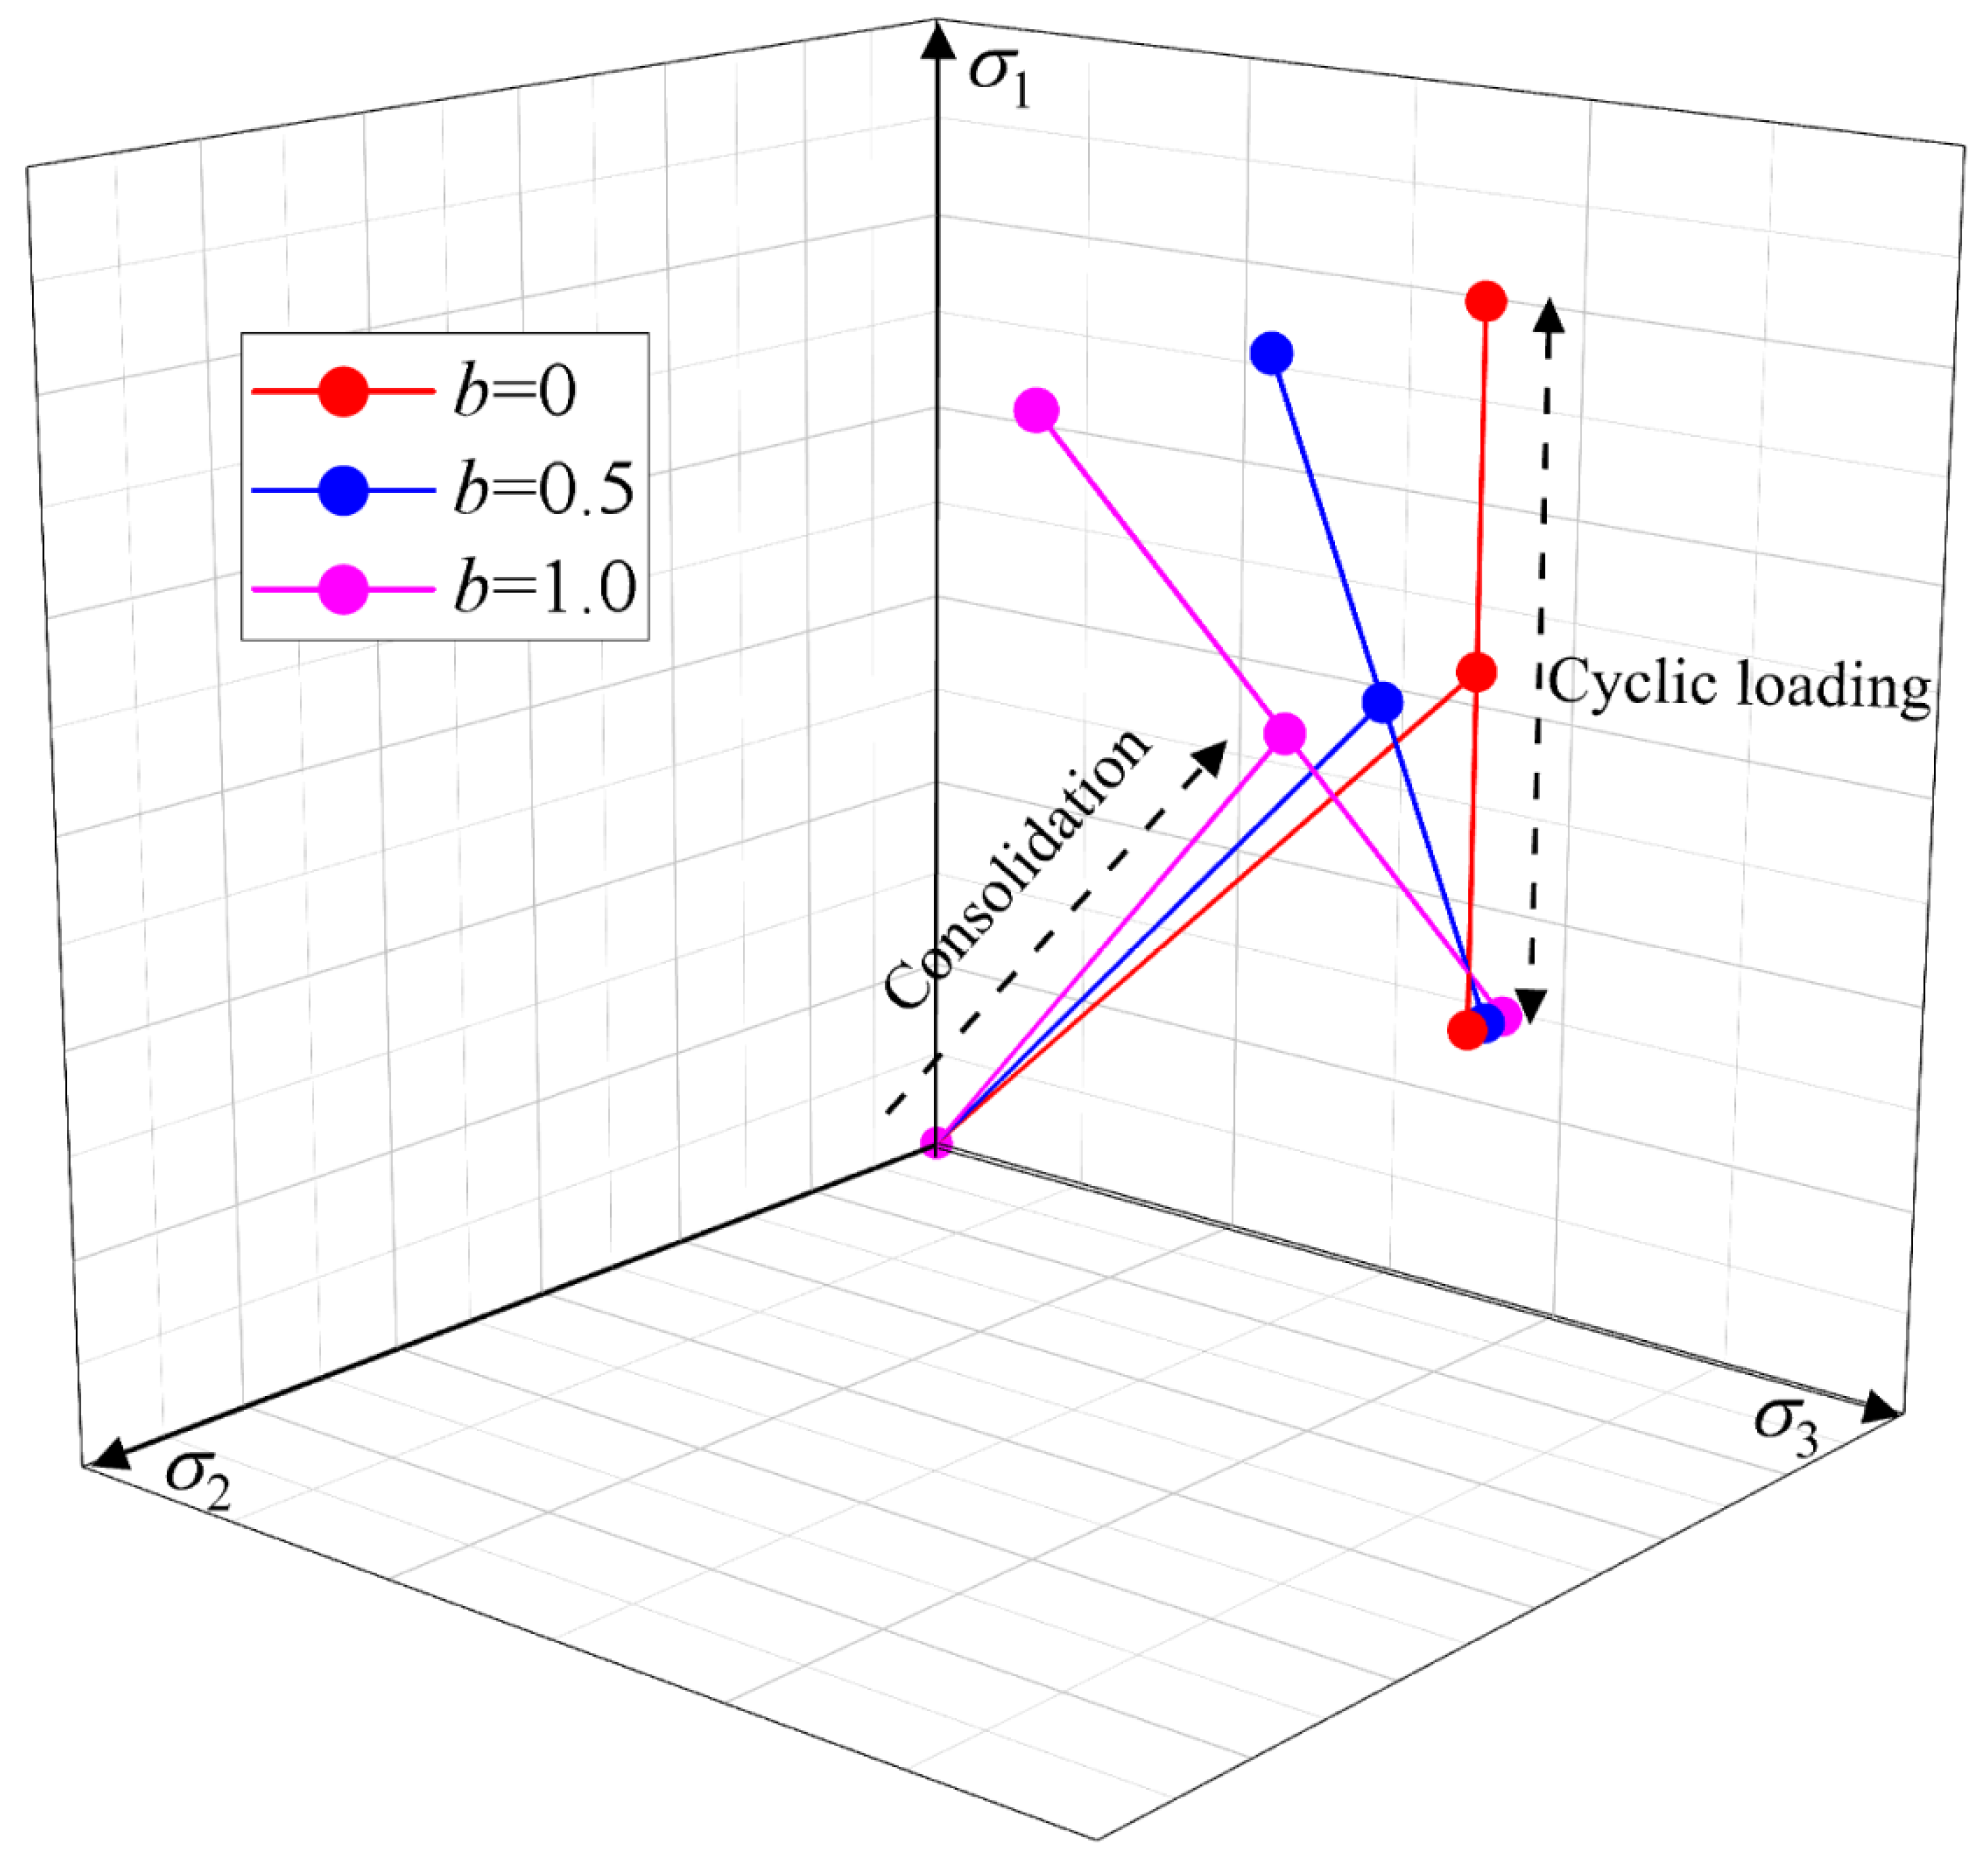
The equipment used in this test is a new type of rigid–flexible boundary true triaxial apparatus independently developed by the Xi’an University of Technology [28], which is composed of a computer control system, a control cabinet, a pressure chamber, and so on, as shown in Figure 3. This apparatus applies axial rigid and lateral flexible loading; axial loading is realized using a pair of rigid plates for major principal stresses, and lateral loading is realized using two pairs of hydraulic bladders for intermediate and minor principal stresses. For flexible loading, two pairs of hydraulic bladders are sealed in the four pressure cells of the pressure chamber, and distilled water is injected into the four hydraulic bladders. The hydraulic bladders are isolated from each other by a rigid plate to avoid mutual interference and ensure independent loading in three directions. The soil samples were wrapped in a specific hydraulic bladder and placed in the middle of the pressure chamber. Forces were imposed in three directions via independent servo-driven systems. The hydraulic drive system is actuated by step-servo motors. The servo-motor, hydraulic screw and measurement sensor are arranged in a large control cabinet. The apparatus has a cyclic stress loading and unloading control system, which outputs sinusoidal signals through the program and transmits them to the hydraulic volume-variable servo stepping-motor drive control device, which drives the piston of the hydraulic cylinder to control the vertical and lateral loads and thus realizes sinusoidal change in the axial stress and intermediate principal stress. The technical specifications of this true triaxial instrument are as follows: a power supply of 220 V ± 5 V; a pressure range of 4 MPa for major principal stress, 2 MPa for intermediate principal stress, and 2 MPa for minor principal stress; a volume range of 200 cm3; a measurement accuracy of ±0.5% (the measurement accuracy of the sensor); and a control accuracy of ±0.5% (a closed loop can regulate pressure up to ±0.5%; the closed loop can adjust the accuracy of the deformation control to ±0.5%).
A traditional triaxial instrument can only apply equal peripheral compressive stress to the specimen, and the test stress path is relatively independent. The true triaxial apparatus can carry out shear tests on soil samples subjected to independent three-way principal stresses, and it can carry out related tests on complex stress paths for rock and soil materials under unequal three-way stresses in special working conditions to reveal deformation and strength characteristics of rock and soil masses that better reflect real working conditions.

2.3. Test Plan

The tests were conducted under drained conditions and divided into two phases: consolidation and cyclic shear. First, confining pressure was applied for isobaric consolidation, and after stabilization, 200 kPa of static deviation stress was applied to the axial direction for deviation consolidation. The anisotropic consolidation ratio was defined as shown in Equation (4), and an axial deformation of no more than 0.01 mm/h was used for consolidation completion standard. Equal b cycle shear was initiated using 50 cycles of stress-controlled sinusoidal cyclic loading. Each cycle lasted 10 min (frequency f = 0.0017 Hz). The test loading process is shown in Figure 4. The stress path in the principal stress space is shown in Figure 5. The intermediate principal stress coefficient b reflects the relative size relationship between the intermediate principal stress, the major principal stress, and the minor principal stress, and the test principle of equal b shear is shown in Equations (1)–(5) [29]. In real-world conditions, the consolidation stresses σ 1 c and σ 3 c of the soil unit are not necessarily equal, so the anisotropic consolidation ratio was used to react to the initial consolidation stress state of the soil, which is defined in Equation (4).
σ 1 = σ 1 c + σ c y c sin 2 π T t
σ 3 = σ 3 c
b = σ 2 σ 3 σ 1 σ 3
K = σ 1 c / σ 3 c
σ 2 = K 1 b + 1 σ 3 c + b σ c y c sin 2 π T t
where σ 1 is the axial cyclic stress, σ 1 c is the axial consolidation stress, σ c y c is the axial stress amplitude, σ 3 is the minor principal stress, σ 3 c is the initial confining pressure, K is the anisotropic consolidation ratio, σ 2 is the intermediate principal stress, T is the cyclic time, t is the loading time, and b is the intermediate principal stress coefficient.
In this test, the loess specimens were subjected to true triaxial cyclic shear tests with three anisotropic consolidation ratios (1.0, 1.5, and 2.0), four stress amplitudes (40 kPa, 80 kPa, 120 kPa, and 160 kPa), and three intermediate principal stress coefficients (0, 0.5, and 1). The prepared specimens had a moisture content of 21% and a dry density of 1.23 g/cm3. The test program is shown in Table 2.

3. Results and Discussion

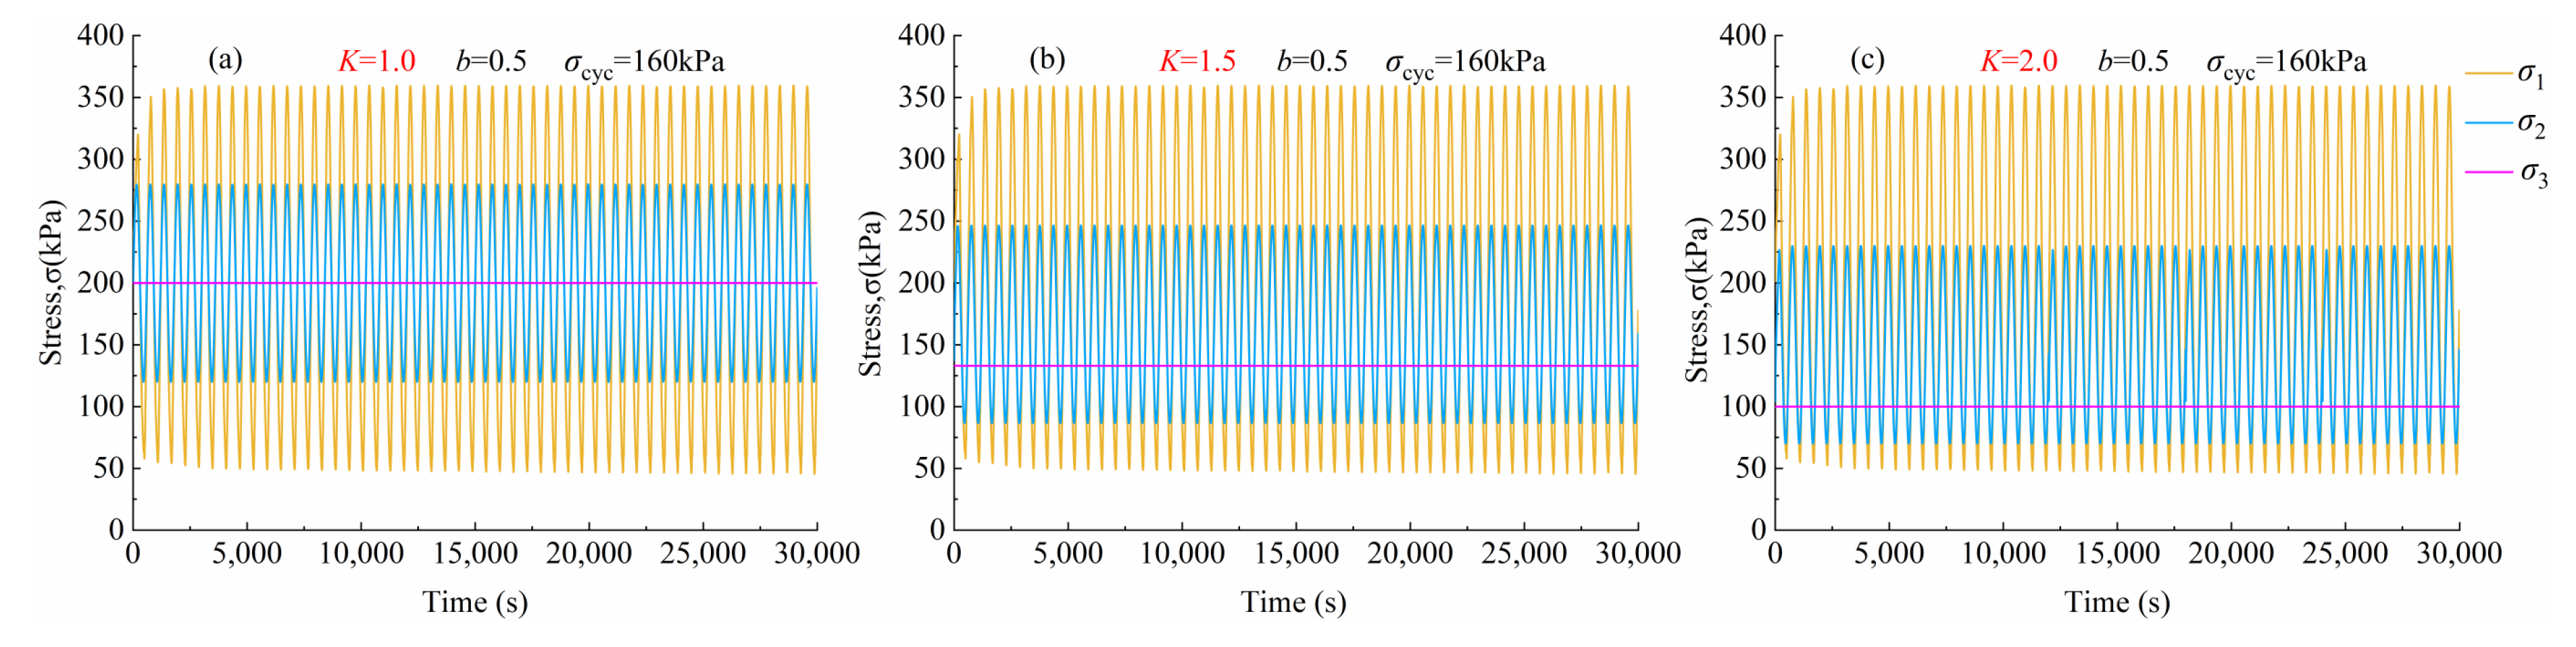
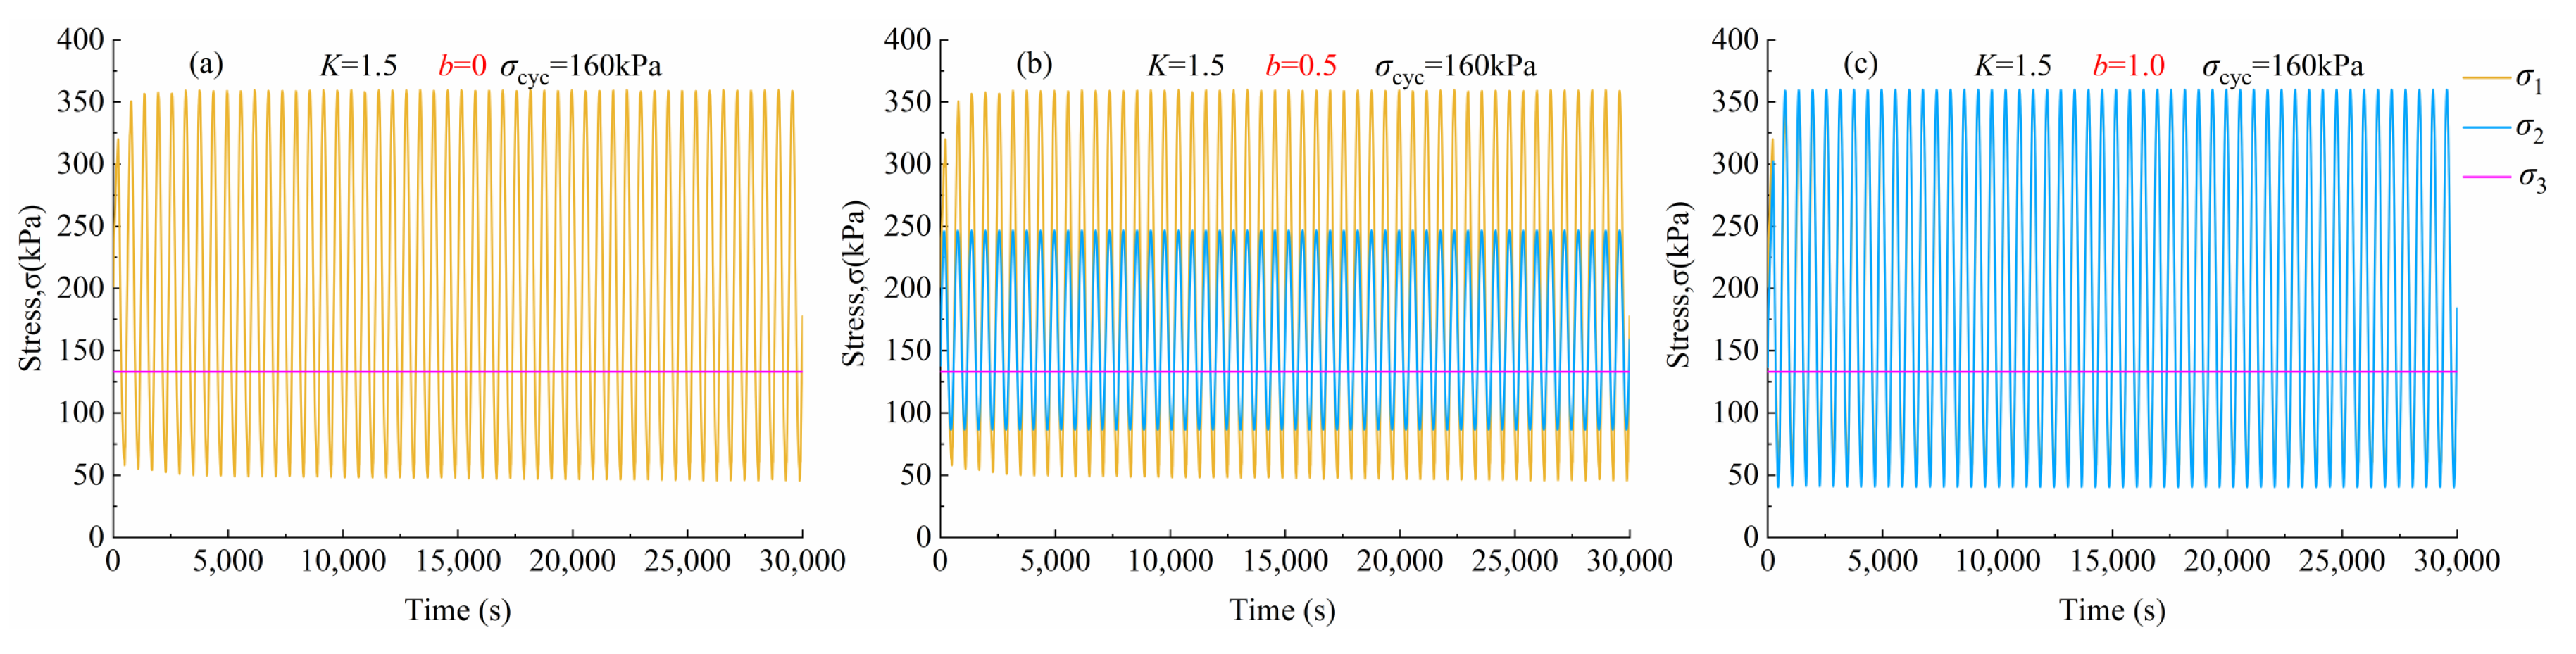
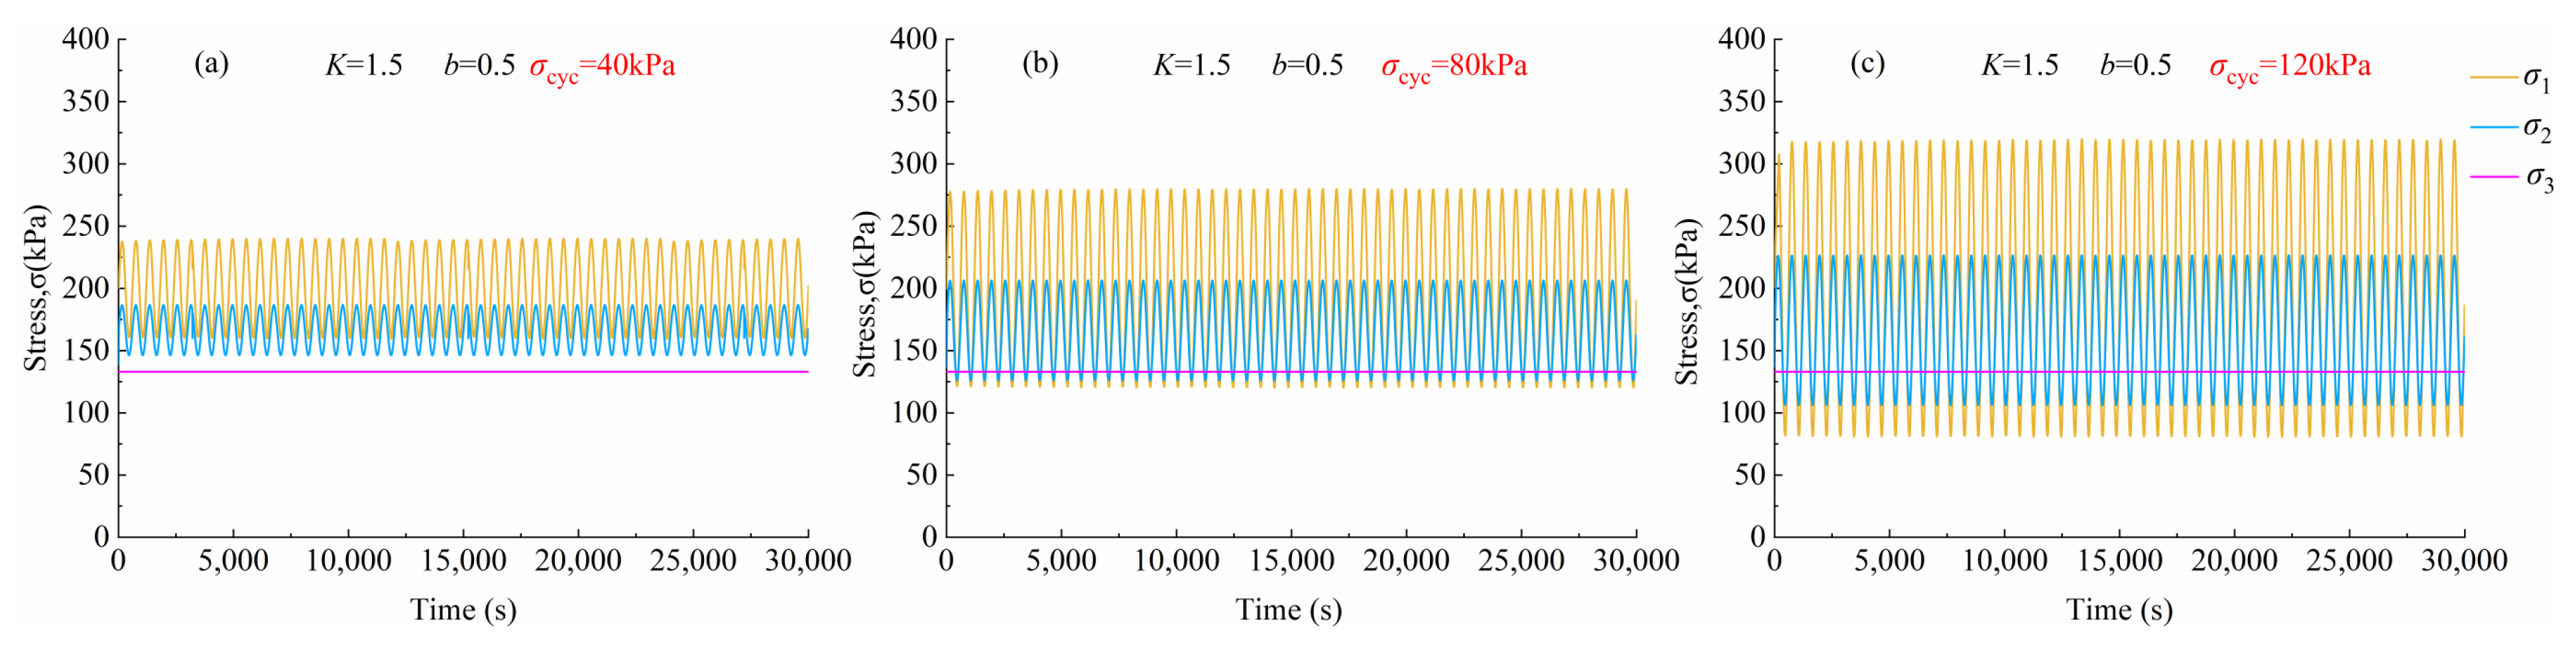
3.1. Stress Time History Curve

Figure 6, Figure 7 and Figure 8 show the stress time history curve for the shear phase of the remodeled loess, in which the stresses were loaded cyclically in sinusoidal form 50 times. σ 1 is a sinusoidal cyclic load, with 200 kPa as the starting point and σ cyc as the amplitude, as shown in Figure 6. When σ cyc = 160 kPa, σ 1 is always loaded in the sinusoidal form of 200 kPa–360 kPa–200 kPa–40 kPa–200 kPa. In Figure 8, σ 1 increases with an increase in σ cyc . σ 2 is a sinusoidal load with magnitude b σ c y c ; its starting point is affected by K and decreases with an increase of K . Its magnitude is proportional to b . It shifts downward as a whole with an increase in K for the same amplitude and b (Figure 6), whereas its amplitude increases with an increase in b . When b = 0 , its amplitude is 0, and when b = 1 , its amplitude is σ cyc (Figure 7). σ 3 is the confining pressure during homogeneous pressure consolidation, which is related to K . It corresponds to 200 kPa at K = 1 . 0 , 133 kPa at K = 1 . 5 , and 100 kPa at K = 2 . 0 .

3.2. Principal Strain

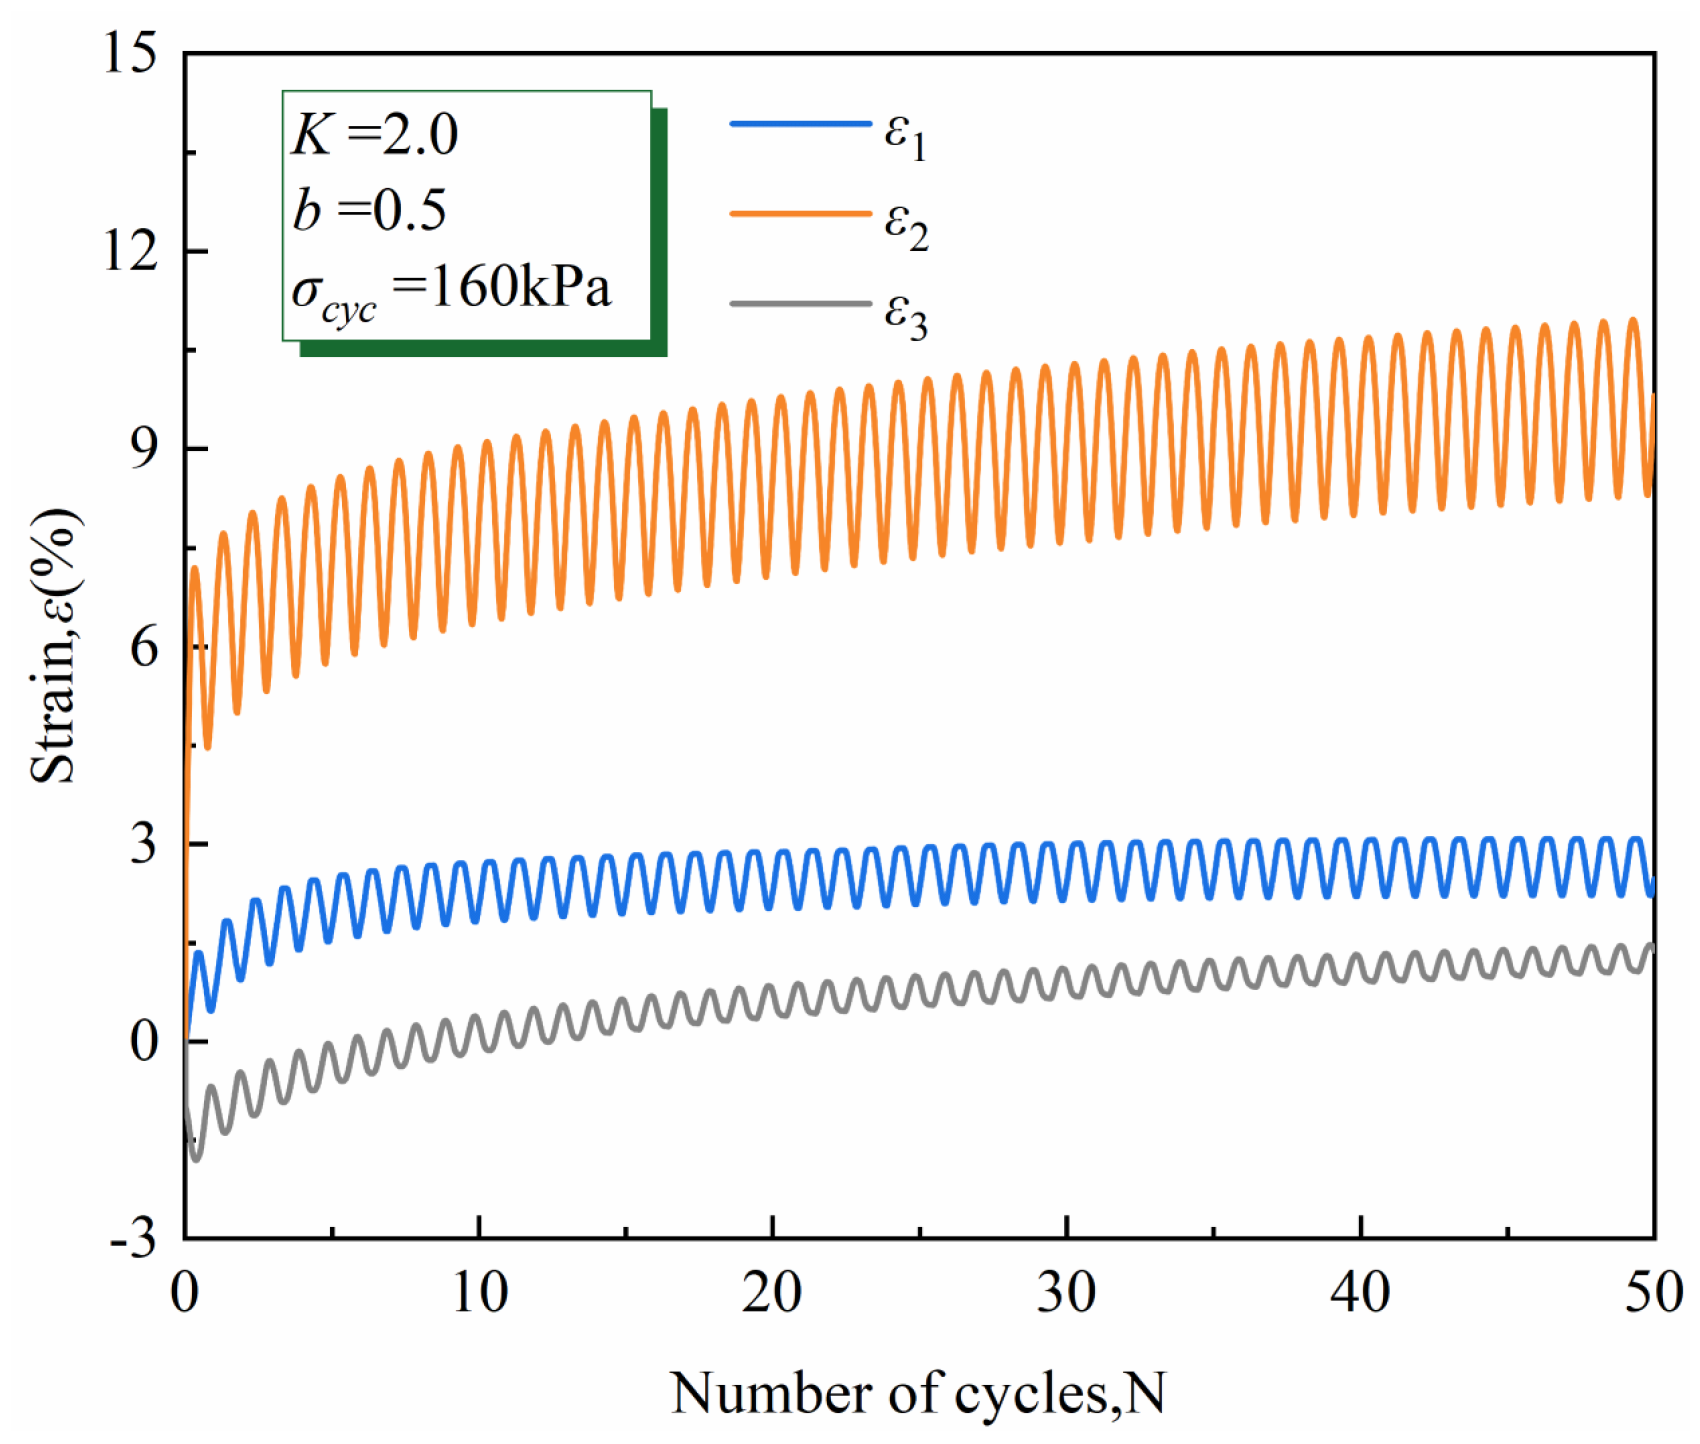
3.2.1. Typical Principal Strain Components

The principal strain development law of the loess specimens was analyzed by considering test C01, which involved 160 kPa of cyclic loading. Its principal strain cycle number curve is shown in Figure 9. Principal strain develops in two stages: a rapid initial increase followed by a slower increase until stabilization. For example, the maximum value of ε 2 is 7.19 in the first cycle, and the final value of ε 2 is 10.96. ε 2 increases by 65.60% in the first cycle and only increases by 34.40% over the next 49 cycles. At the beginning of loading, the adhesion between the internal particles of the loess was destroyed, so the principal strain developed rapidly. With an increase in the number of cycles, contact between the particles increased, and the compressive stiffness of the soil became more pronounced, resulting in greater strength and increased resistance to deformation. The three principal strains continued to accumulate, and the growth rate of the slow curve tended to flatten. With the increase in the number of cycles, the principal strain showed a monotonic growth trend. ε 1 and ε 2 were always positive, that is, the axial and intermediate principal stress directions indicated compressive deformation, and ε 3 increased from negative to positive, that is, the minor principal stress direction initially exhibited expansion deformation and then slowly underwent compressive deformation.

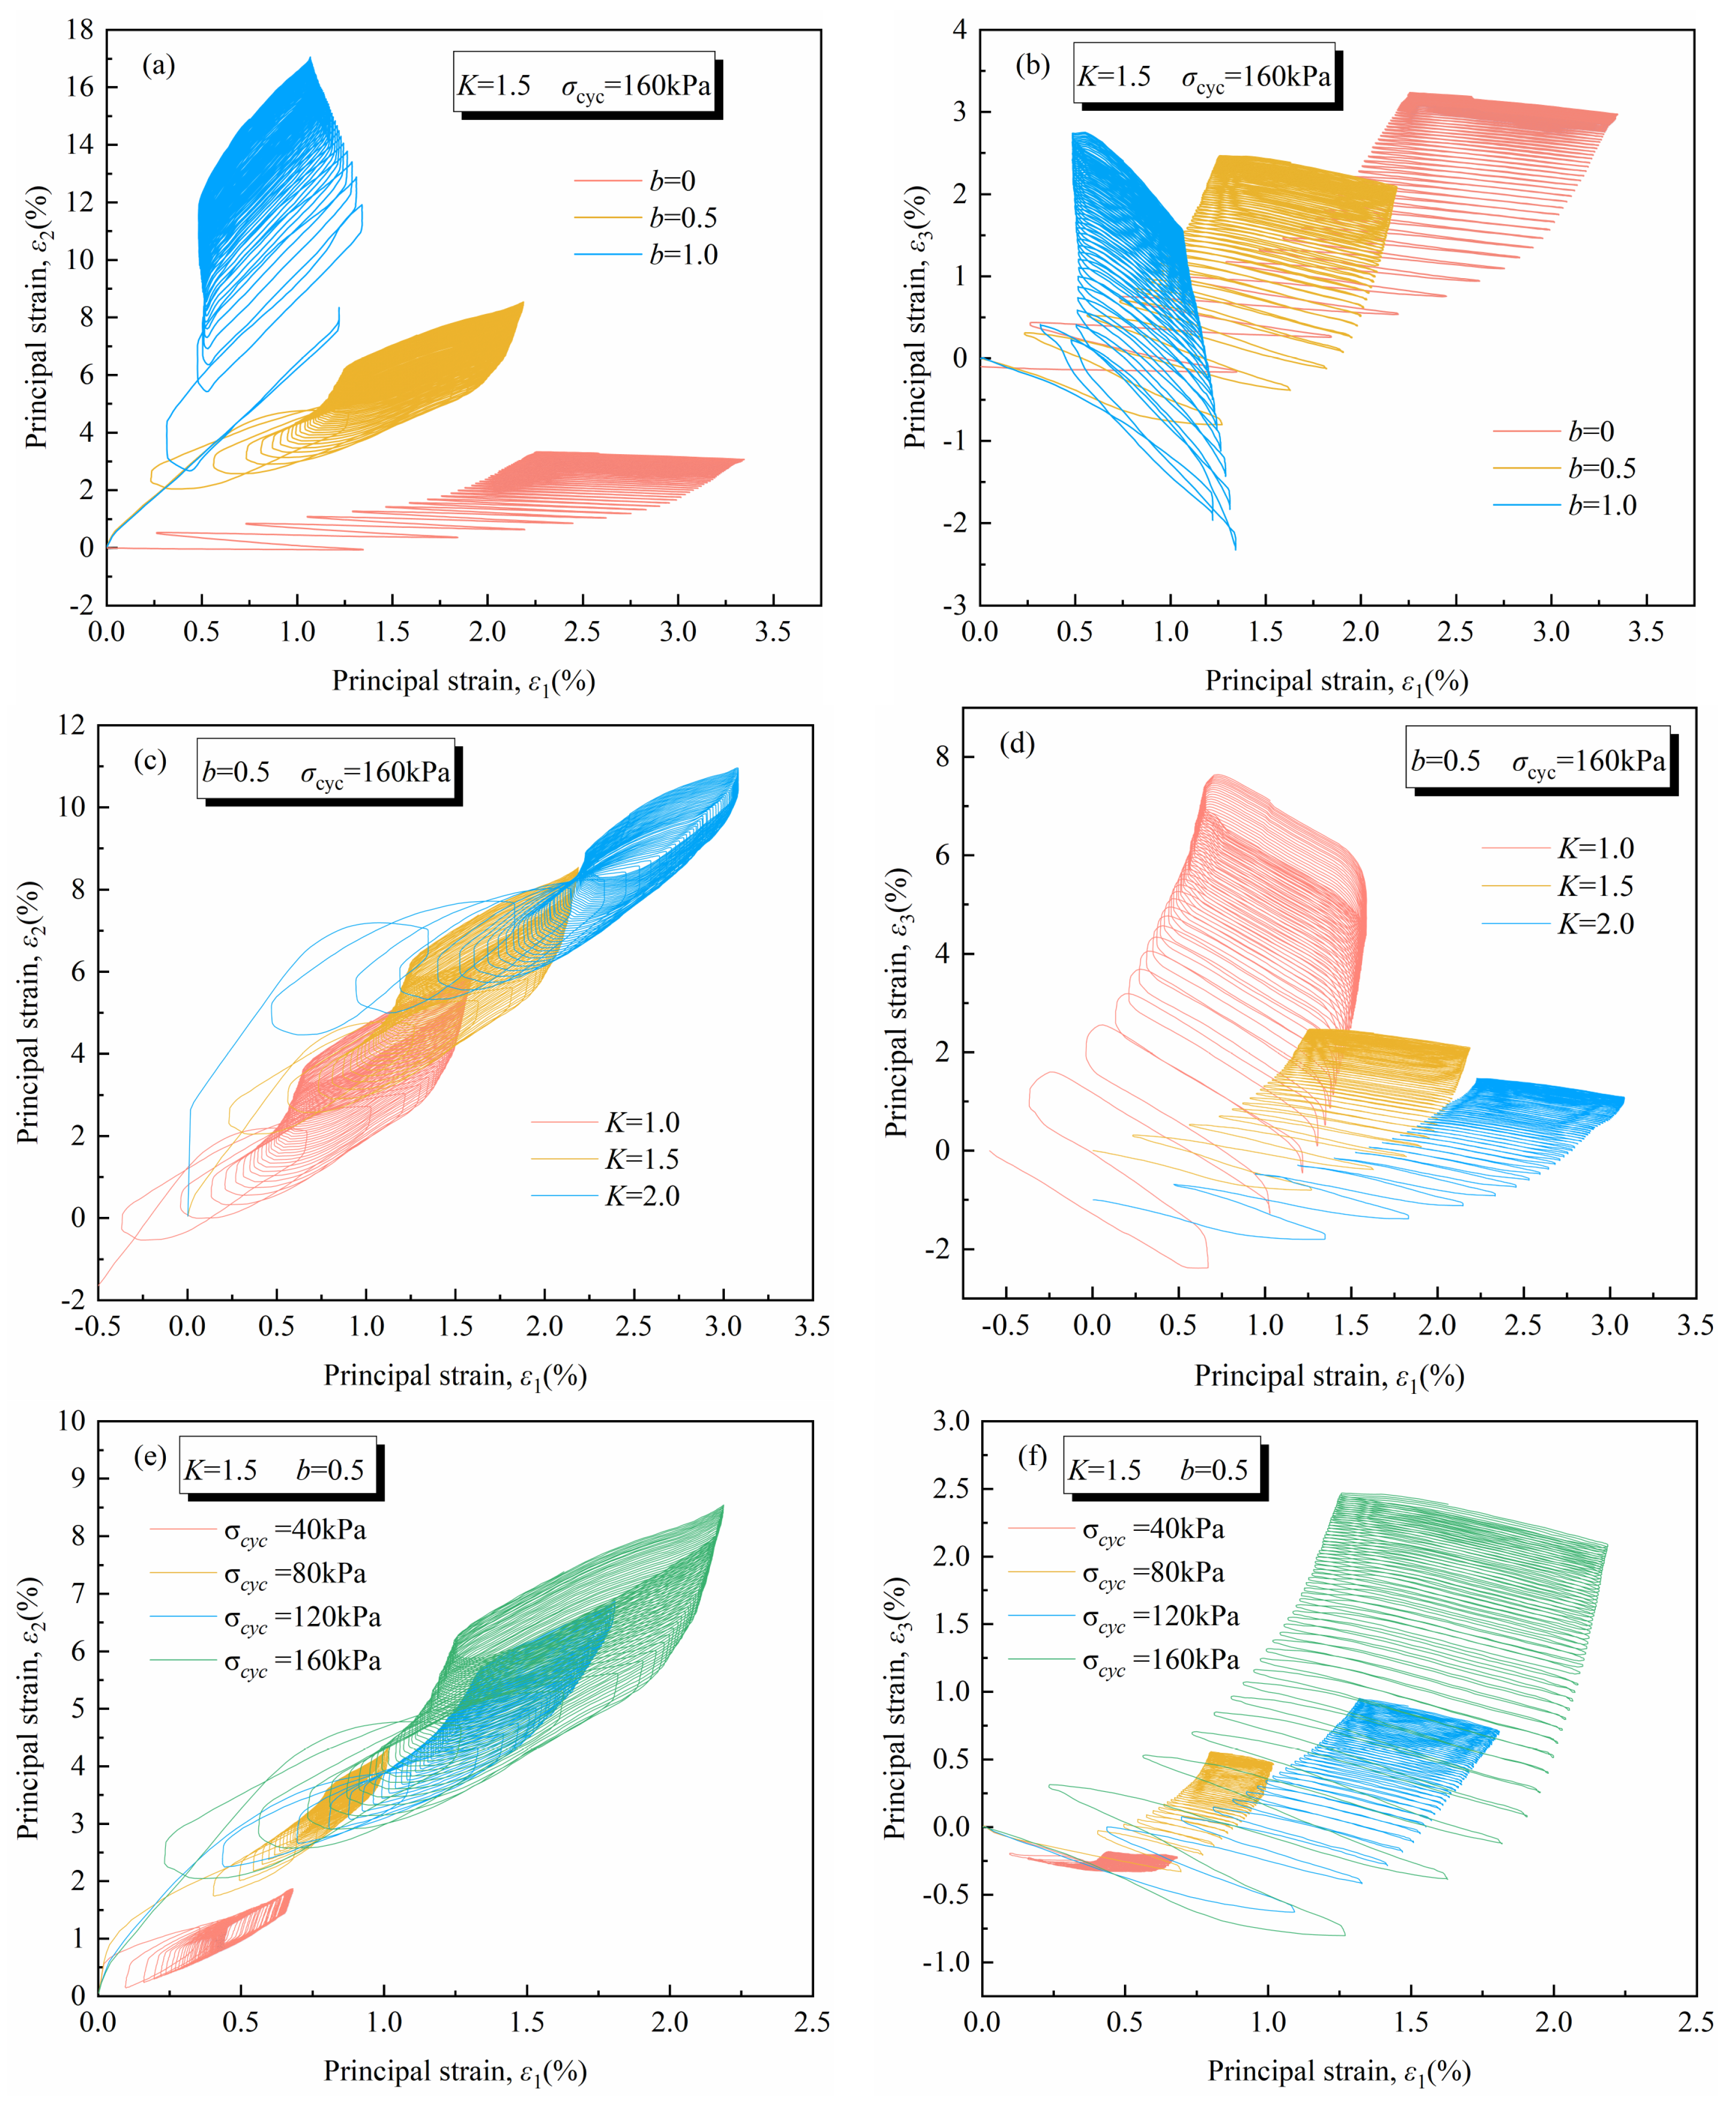
3.2.2. Relationship Between Lateral Strain and Axial Strain

The lateral strain curves versus axial strain curves of loess under different conditions are shown in Figure 10. The following conclusions can be obtained by comparing these curves: (1) ε 1 indicates compressive deformation. When samples are in a the isotropic consolidation ( K = 1 . 0 ) phase, ε 2 begins with expansion deformation and slowly transitions to compressive deformation with cyclic shear, while anisotropic consolidation ( K = 1 . 5 and K = 2 . 0 ) are always compressive deformation. ε 3 is initially an expansion deformation and then slowly changes to a compressive deformation. (2) The effect of b : ε 1 decreases with an increase in b ; ε 2 deformation increases significantly with an increase in b ; and ε 3 does not change much because the value of the increase in the 2 direction is much greater than the value of the decrease in the 1 direction, so the total volumetric strain increases with an increase in b (Figure 10a,b). The larger b is, the greater the load in the direction of the intermediate principal stress is, and deformation in the ε 2 direction can be developed so that the contact between the particles is tighter and the hardness of the soil is more obvious, which leads to greater strength for the axial soil and an enhanced ability to resist deformation. (3) The effect of K : ε 1 and ε 2 increase with K ; that is, deformation is larger under anisotropic consolidation conditions than under isotropic consolidation conditions because of the presence of initial shear stresses in anisotropic consolidation. Additionally, the larger the anisotropic consolidation ratio, the larger the initial shear stresses. ε 3 decreases with K , and the total volumetric strain increases with K . (4) The effects of σ cyc : ε 1 , ε 2 and ε 3 all increase with an increase in the loading amplitude, and the larger the amplitude, the larger the deformation interval of the strain.

3.3. Volumetric Strain and Shear Strain

In the loading and unloading of remodeled loess, spherical stress generates volumetric strain ε v , and deviatoric stress generates shear strain ε d .The calculation of ε v is shown in Equation (6), and in this study, ε d was used to represent the generalized shear strain and calculated as shown in Equation (7). Figure 11 shows the relationship between the volumetric strain ε v , the shear strain ε d of the test C01 with 160 kPa cyclic loading and the number of cycles N . As the number of cycles increases, the volumetric strain accumulates and grows slowly. The blue dashed line indicates the relationship between the minimum value of the accumulated volumetric strain in each shear cycle as a function of the number of cyclic shears, which indicates an irreversible, accumulative plastic volumetric strain component that increases monotonically with an increase in the cycle number; this component is denoted ε v p . Subtracting ε v p from the total volumetric strain yields a new elastic strain component ε v e , and the variation of ε v e with the cyclic shear number is plotted in Figure 11a, which shows sinusoidal fluctuations throughout the cyclic shear process. The magnitude of the elastic volumetric strain ε v e remains essentially constant throughout the cycle and is expressed as the amplitude a v e at N = 20. The same shear strain can also be viewed as comprising a reboundable elastic shear strain component ε d e and an accumulative plastic shear strain component ε d p . The shear strain is smaller than the volumetric strain, and the time it takes to develop to the stable stage is shorter. The elastic shear strain is also sinusoidal, fluctuating throughout the cycle, and its magnitude is not affected by the number of shear stresses. ε d e remains basically unchanged during the shear process and is represented by the amplitude a d e at N = 20. Thus, future focus is on the influence of different factors on the plastic volumetric strain and plastic shear strain. The deformation decomposition formula of loess can be simplified, as shown in Equation (8).
ε v = ε 1 + ε 2 + ε 3
ε d = 2 ε 1 ε 2 2 + ε 2 ε 3 2 + ε 3 ε 1 2 / 3
ε v ε d = ε v e ε d e + ε v p ε d p

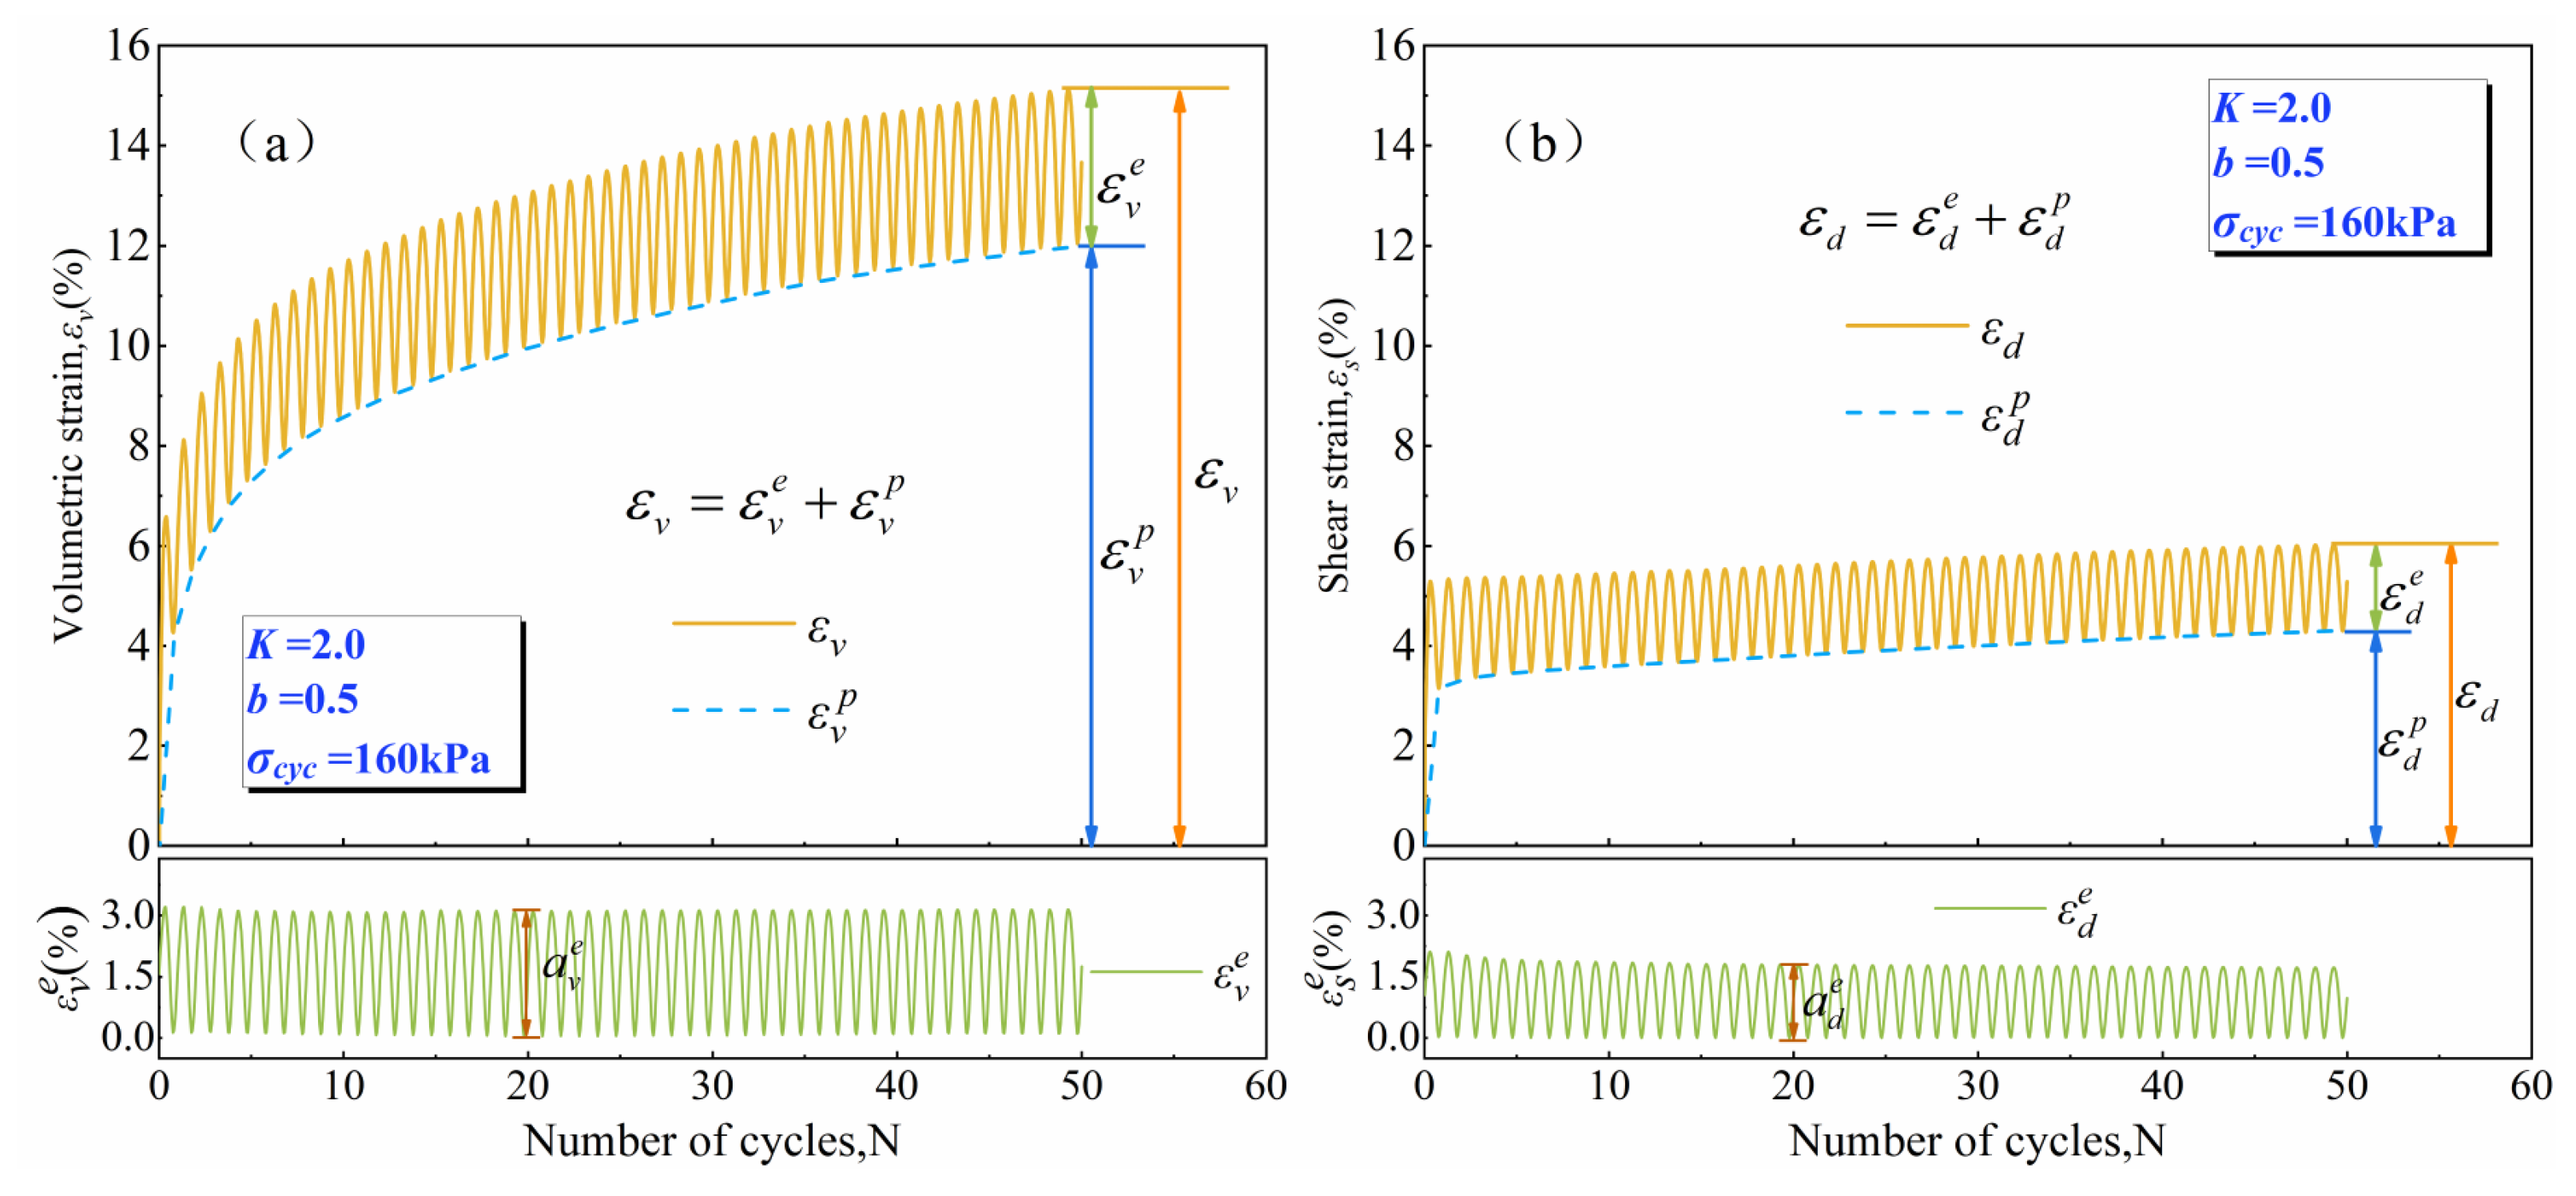
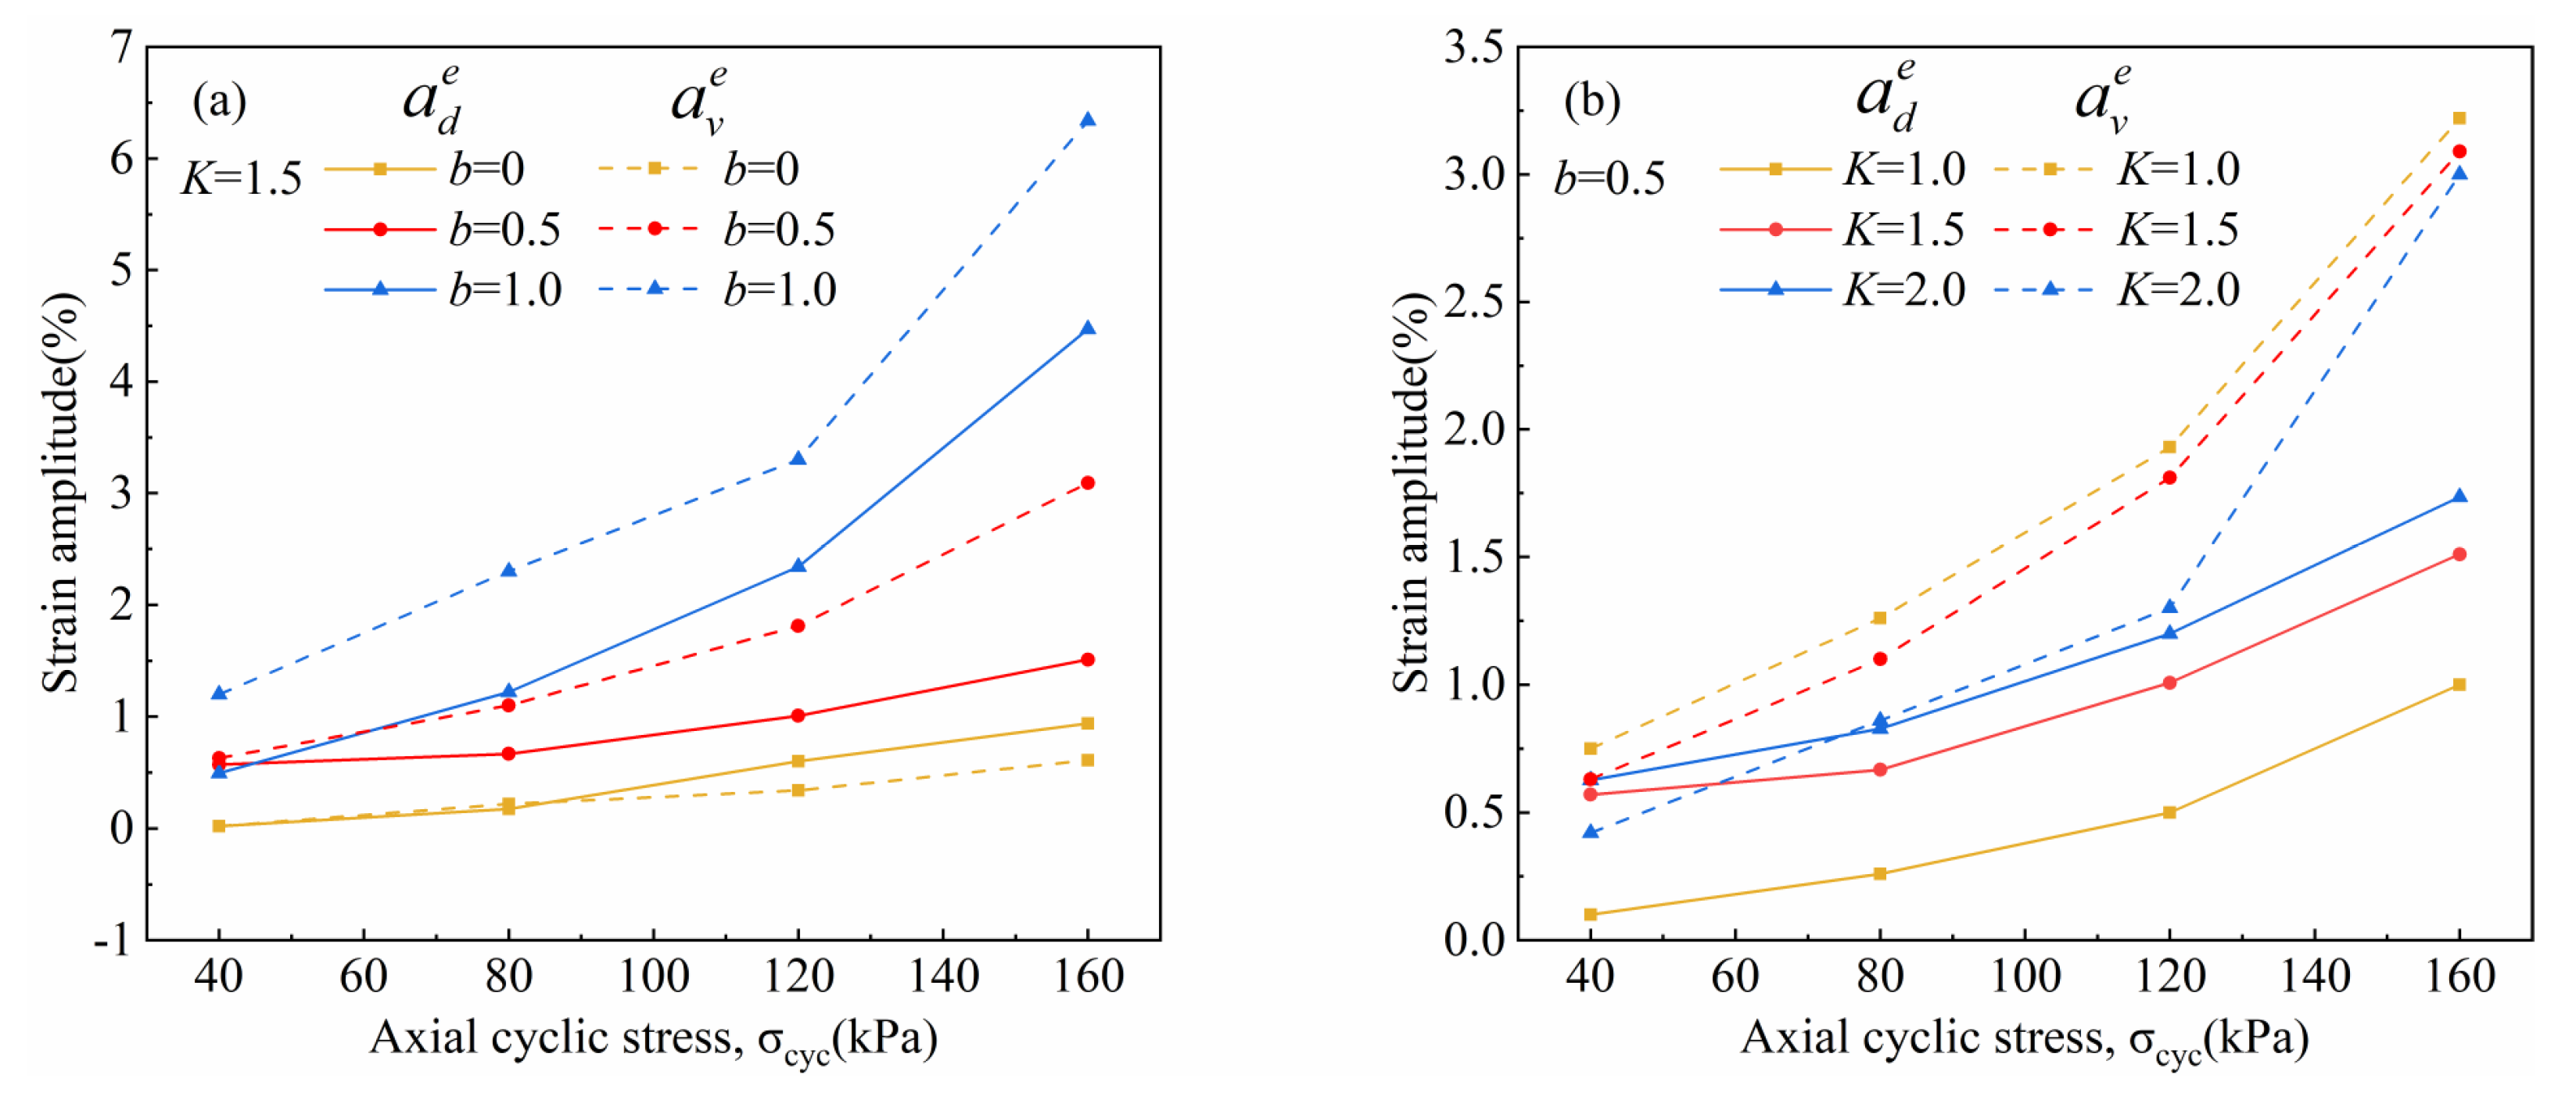
3.3.1. Elastic Volumetric Strain and Elastic Shear Strain

In this case, elastic strain is caused by sliding friction between soil particles and occlusion between adjacent particles, and the magnitude of the elastic strain depends on the magnitude of spherical stress or shear stress, which are basically unaffected by an object’s action history [30]. Figure 12 shows the curves of the elastic volumetric strain amplitude a v e and elastic shear strain amplitude a d e with the intermediate principal stress coefficient b and the deviation consolidation ratio K . Both a v e and a d e increase with increasing b . a v e decreases with increasing K , whereas a d e increases with increasing K . This is also due to the presence of the initial shear stresses in the various anisotropic consolidations increases the magnitude of shear strain.

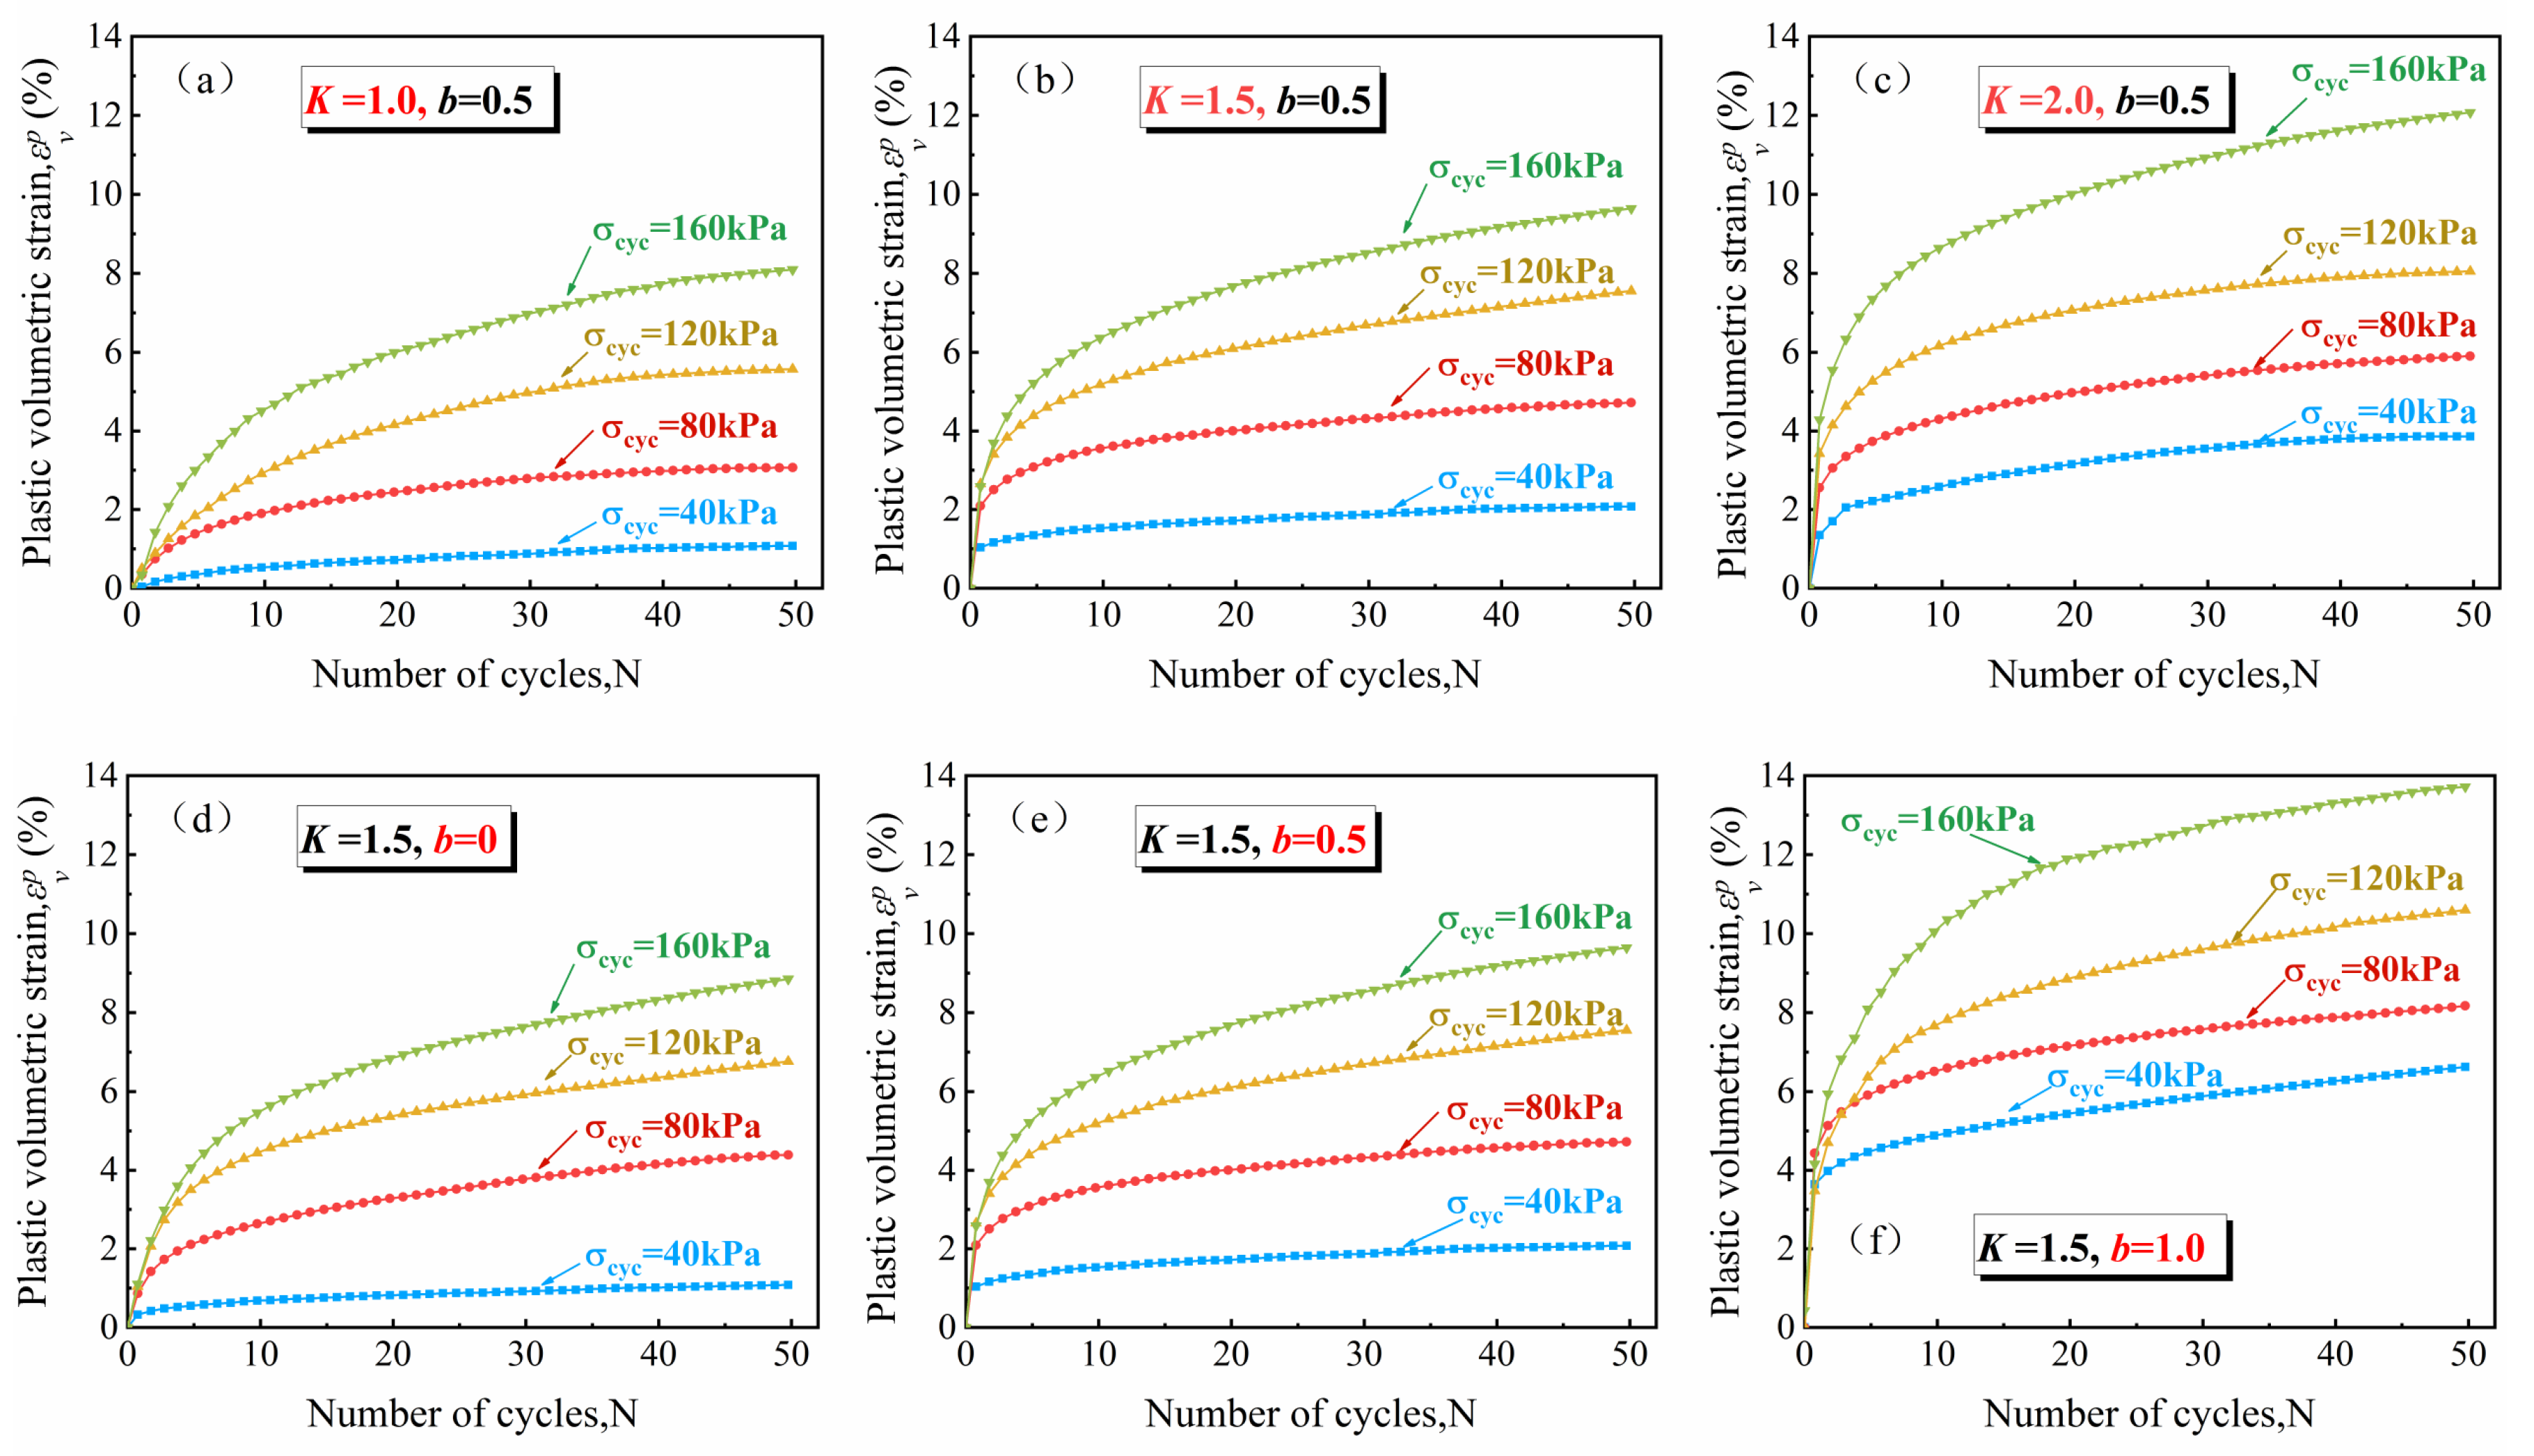
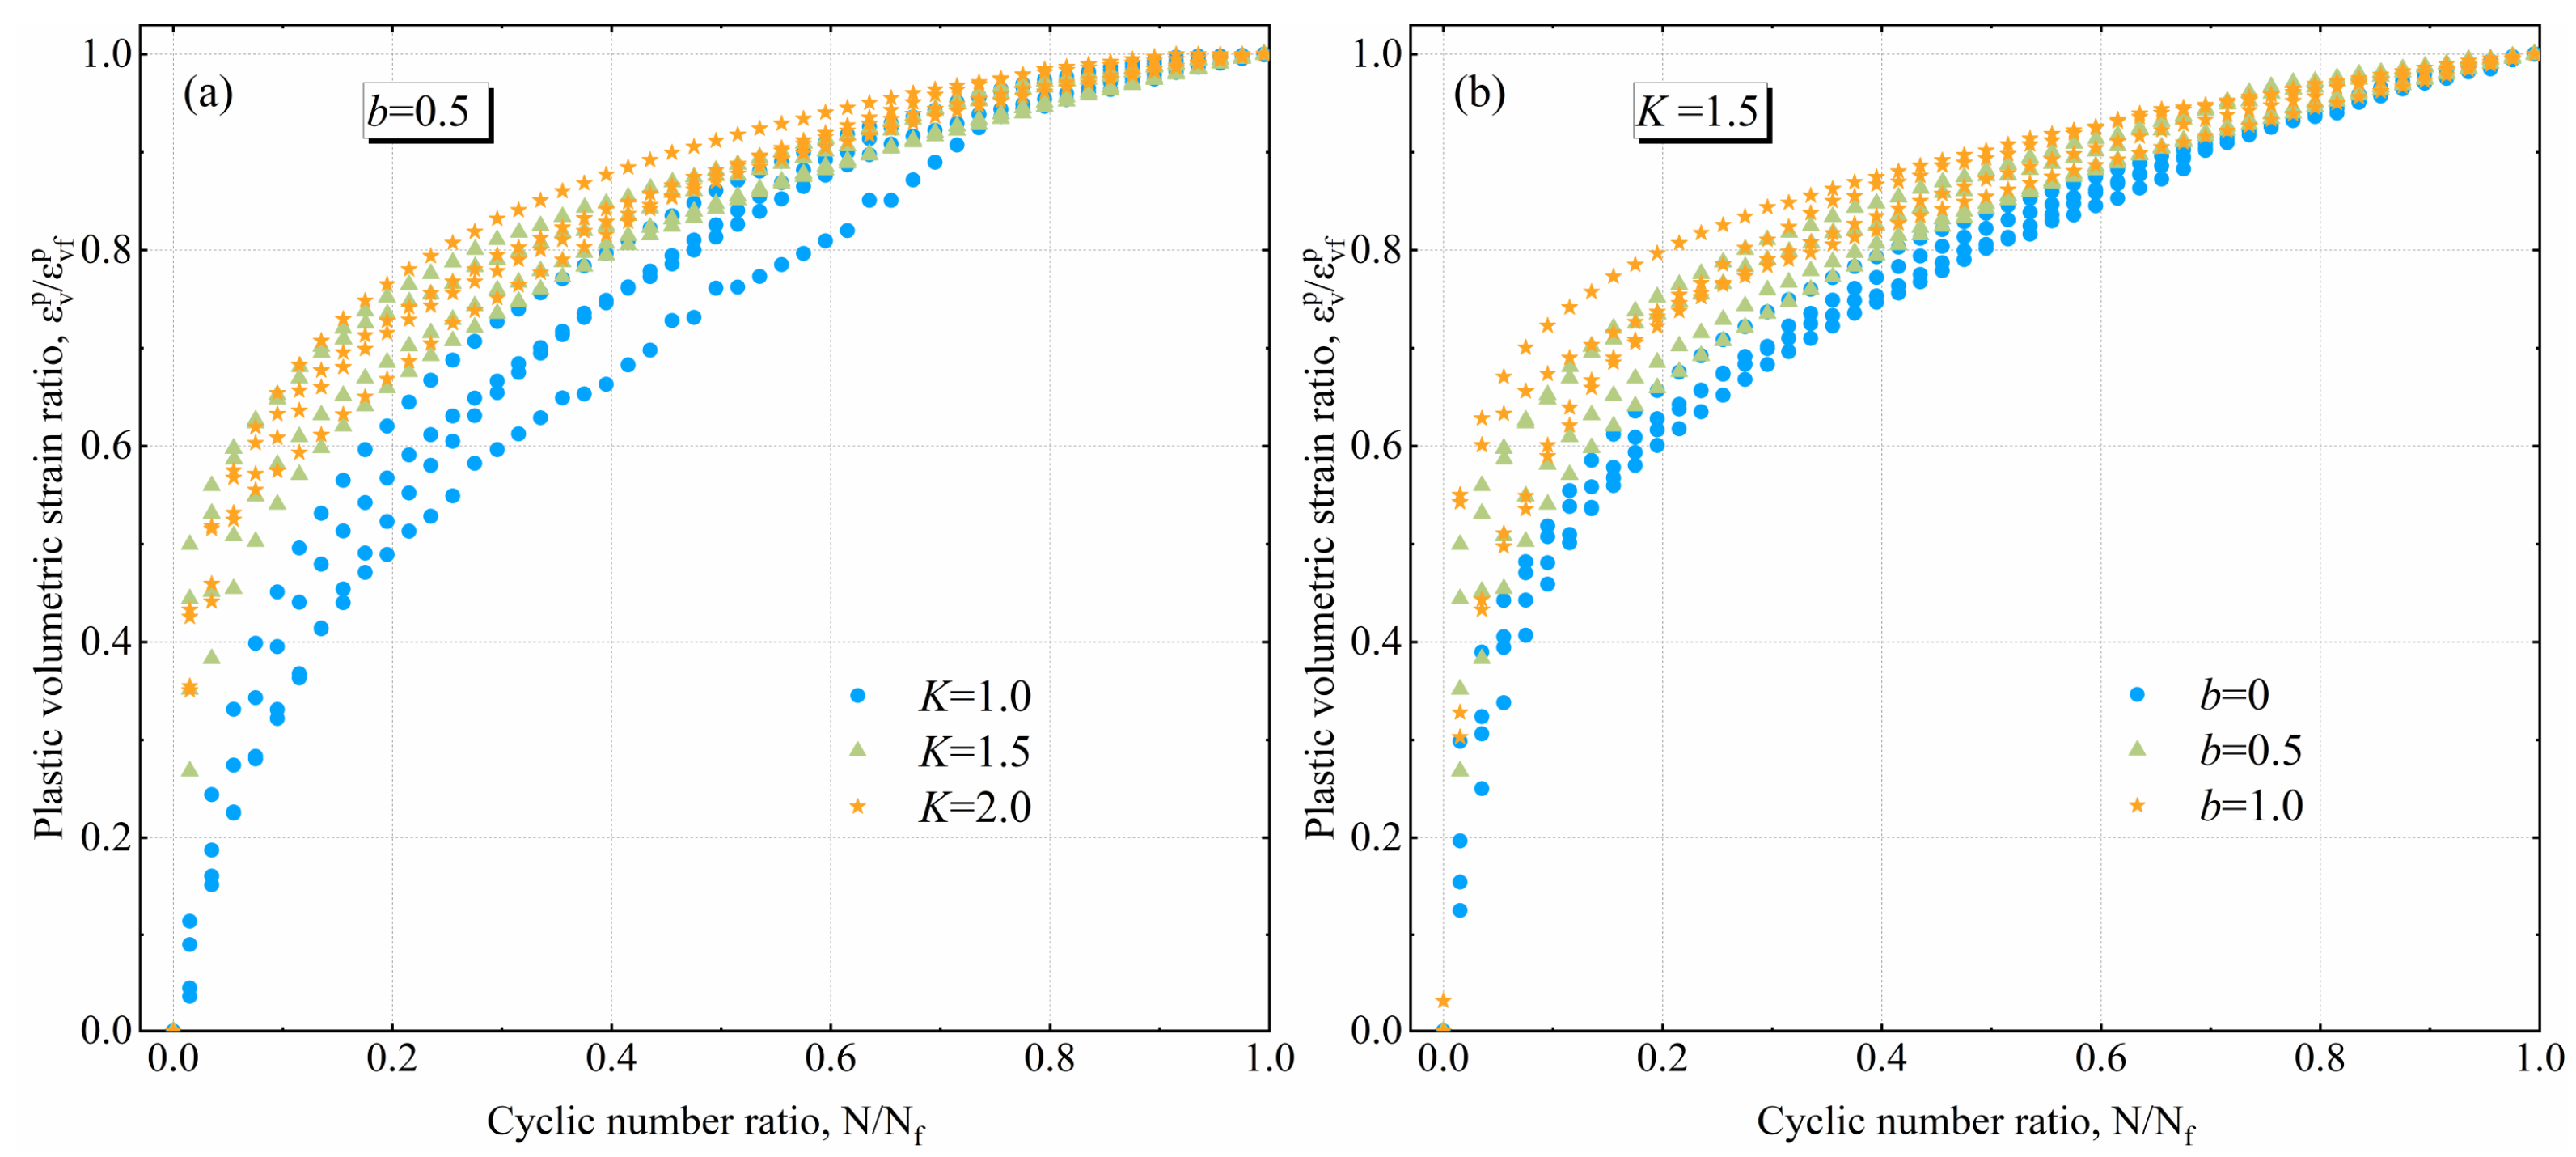
3.3.2. Plastic Accumulated Volumetric Strain

Figure 13 illustrates the plastic accumulated volumetric strain ε v p of the loess. It is irreversible, and its magnitude is not only related to the magnitude of the spherical stress at that time but also depends on the history of the shear [30]. The spherical stress further discharges the pore water in the loess, and the matrix suction increases, causing the soil to produce obvious volumetric strain. Contact between the loess particles becomes tighter with the increase in spherical stress, and the hardness of the soil is more obvious, resulting in irreversible plastic strain. Plastic volumetric strains all manifest as volume shrinkage and gradually accumulate with an increase in the number of cycles. In the initial stage of loading, the strain increases rapidly, after which the growth rate gradually slows, and the development of plastic strain tends to stabilize. It is also found that the greater the applied cyclic loading, the faster the rate of growth of the plastic strain and the greater the final strain accumulation [13]. Comparing Figure 13a–c, ε v p increases with an increase in the anisotropic consolidation ratio. Comparing Figure 13d–f, there is an increase in ε v p from b = 0 to b = 0 . 5 , although the increment is not large. From b = 0 . 5 to b = 1 . 0 , the plastic body strain increases substantially.
To further investigate the influence of the anisotropic consolidation ratio and the intermediate principal stress coefficient on the plastic strain, scatter plots of the plastic volumetric strain ratio as a function of the number of cycles were obtained [26] (Figure 14). The plastic volumetric strain ratio is the ratio of the plastic volumetric strain to the maximum of the plastic volumetric strain under the same conditions, and the cycle number ratio is the ratio of the cycle number to the maximum number of cycles. When b = 0 . 5 , the point distribution range of the plastic volumetric strain ratio to the number of cycles under different anisotropic consolidation ratios is wider, which indicates that the degree of normalization of the plastic volumetric strain growth curve under different consolidation ratios differs. The points of anisotropic consolidation ( K = 1 . 5 and K = 2 . 0 ) are more closely distributed, all of which experienced high axial consolidation stresses at an early stage and are more highly normalized. The points of isotropic consolidation ( K = 1 . 0 ) are dispersed underneath them, with a lesser degree of normalization. Therefore, the consolidation ratio has a certain effect on the plastic volumetric strain ratio of loess samples. When K = 1 . 5 , the plastic volumetric strain ratio increases rapidly in the early stage of cyclic loading, and when the cycle ratio exceeds 0.1, the plastic volumetric strain ratio begins to increase slowly, and volumetric strain gradually accumulates. The narrow range of point distributions for the ratio of the plastic volumetric strain ratio to the number of cycles for different values of b suggests that the intermediate stress coefficients have less influence on the plastic volumetric strain ratio and that the measurement points are more normalized.

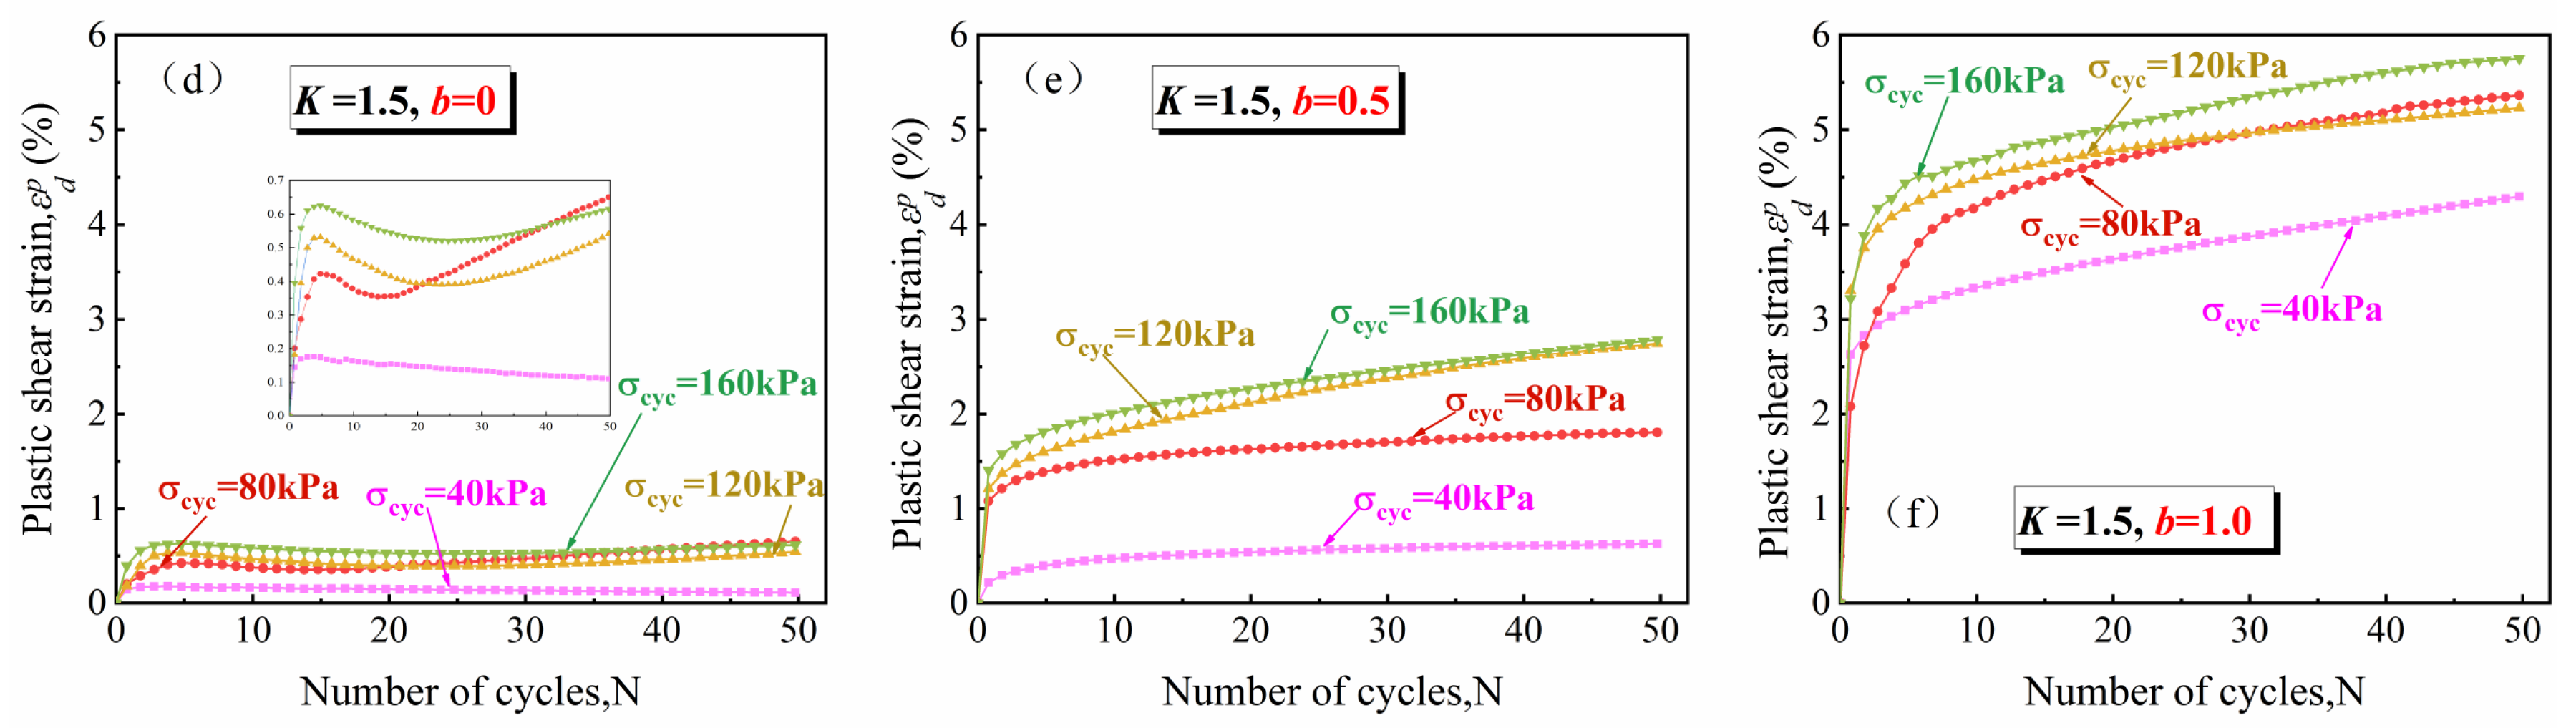
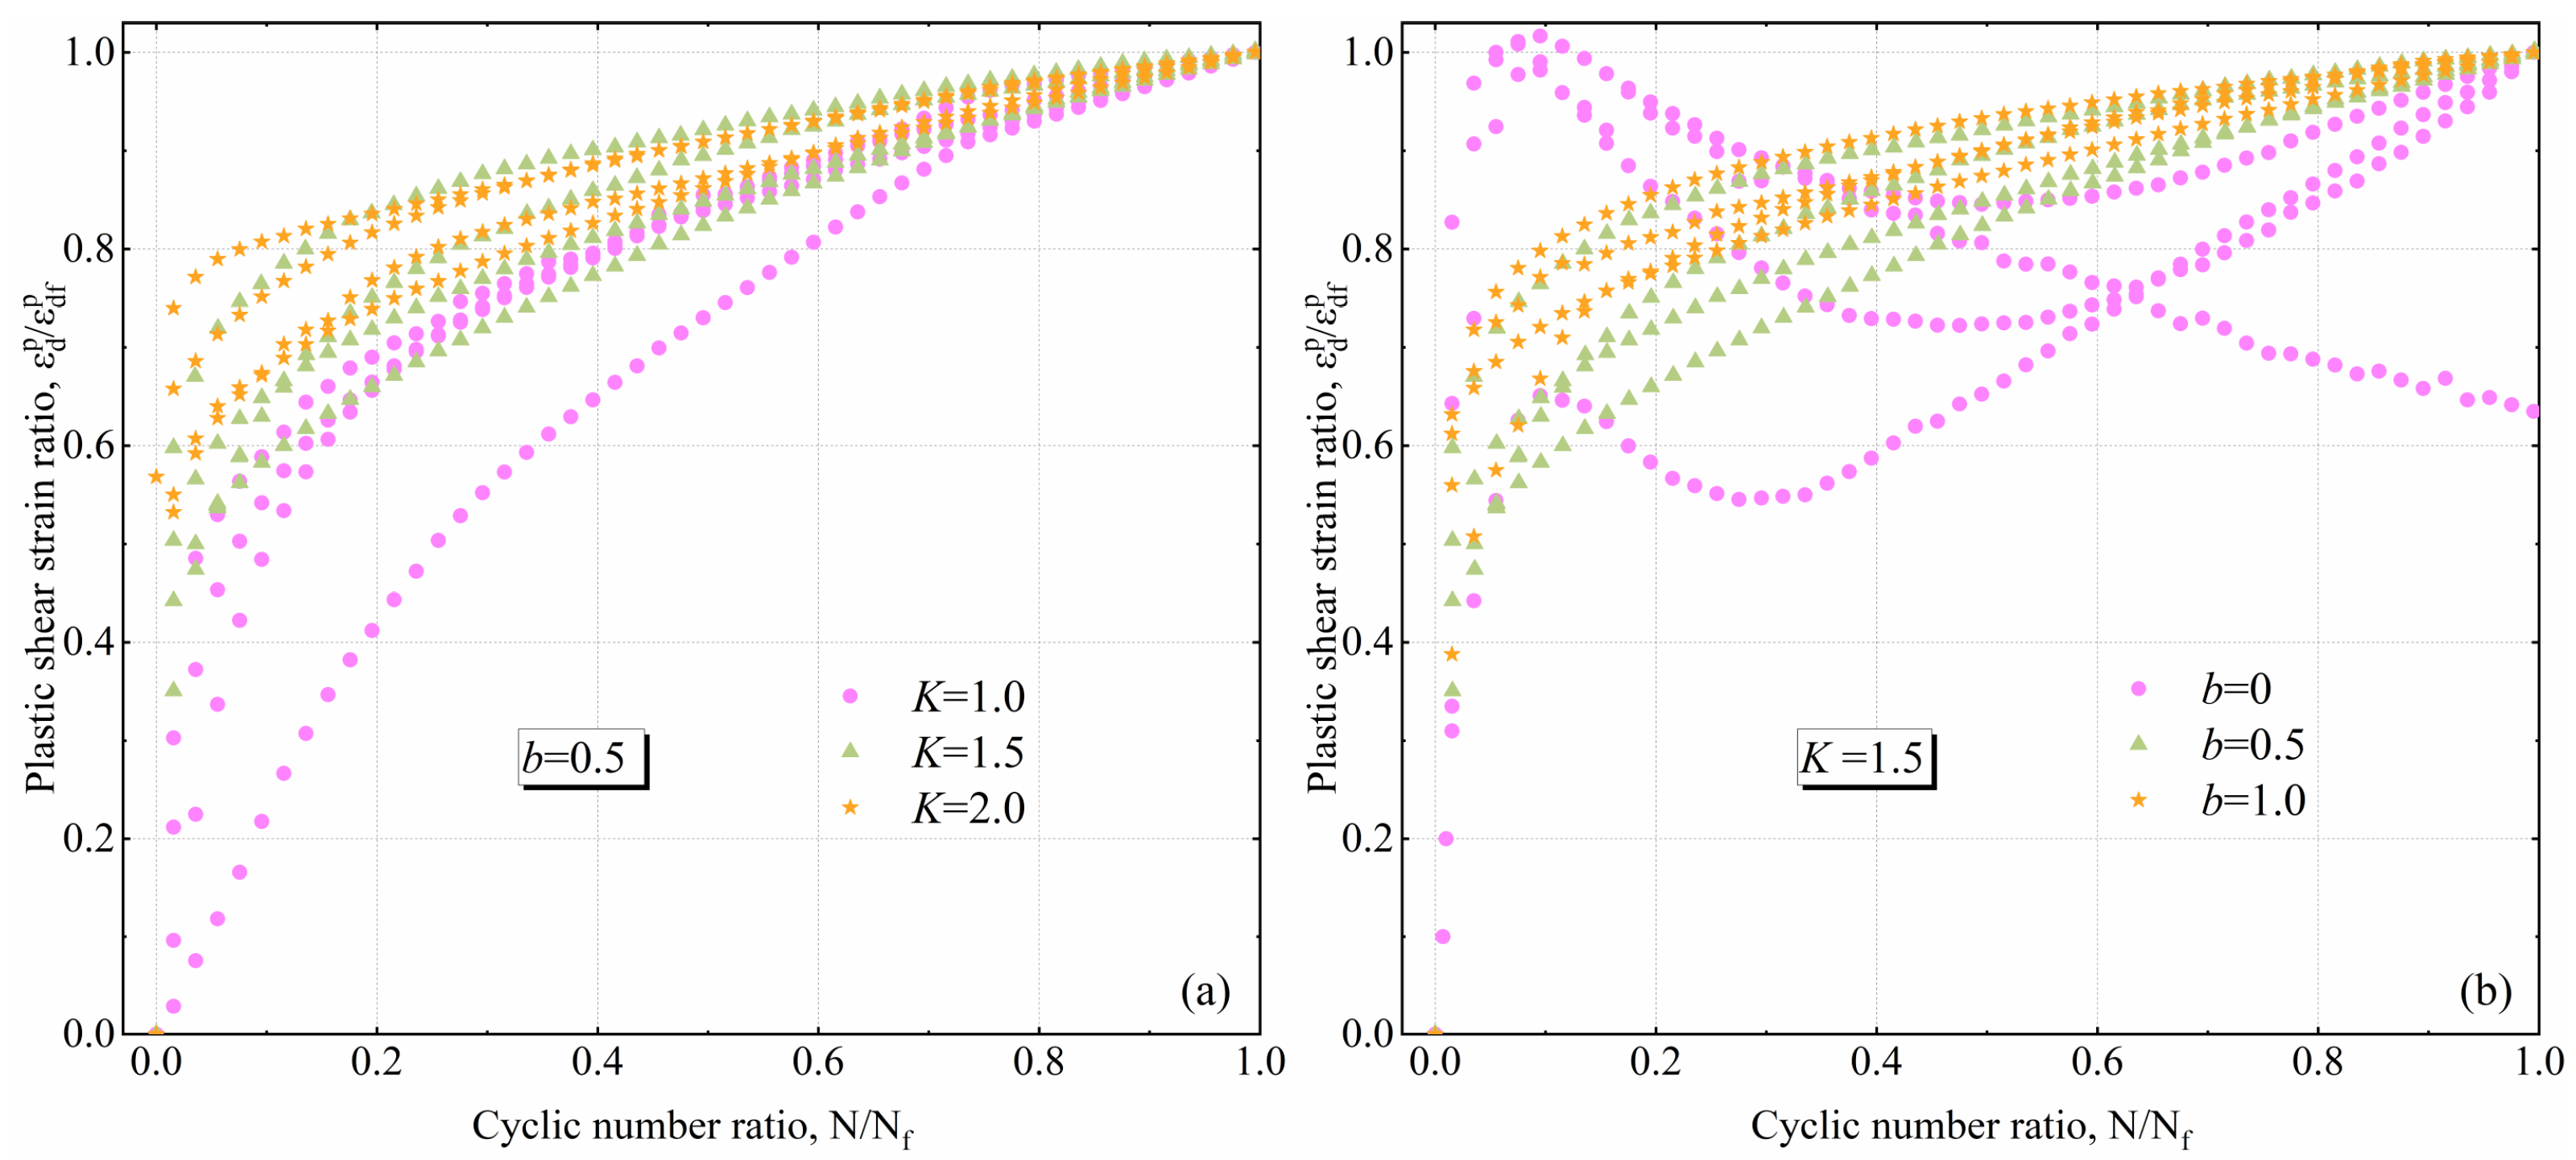
3.3.3. Plastic Accumulated Shear Strain

Figure 15 shows the plastic accumulated shear strain ε d p of the loess. The plastic shear strain of the remodeled loess under cyclic shear is also irrecoverable, and its magnitude not only relates to the shear stress ratio q / p at that time but also depends on the history of the shear [30]. The contact between soil particles is point-and-surface or point-and-point contact, the adhesion force between soil particles decreases under loess shear, the particles are broken and the average porosity decreases, causing irreversible changes in the contact angles between the soil particles, which generates plastic shear strain and causes it to accumulate. ε d p exhibits shear shrinkage and increases with cyclic loading. Compared with Figure 15a–c, the plastic shear strain accumulates gradually with an increasing number of cycles, and there is no obvious relationship between the magnitude of the plastic shear strain and the anisotropic consolidation ratio. The plastic shear strain accumulates more rapidly, and the slope of the curves is large in the case of deviation consolidation ( K = 1 . 5 and K = 2 . 0 ). Compared with Figure 15d–f), ε d p increases significantly with an increase in b , and it accumulates gradually with an increasing number of cycles for b = 0 . 5 and b = 1 . 0 . To the contrary, the plastic shear strain demonstrates a significant decrease after the peak value is reached for b = 0 and then increases slowly.
Figure 16 illustrates the relationship between the plastic shear strain ratio and the cycle number ratio [26]. The plastic shear strain ratio is defined as the ratio of plastic shear strain to the maximum plastic shear strain. The distribution of plastic shear strain ratio test points is very discrete. In Figure 16a, the distribution of the plastic shear strain and plastic volumetric strain ratios under different anisotropic consolidation ratios are similar, and the test points of anisotropic consolidation are normalized well and fall above the test points of isotropic consolidation. Figure 16b shows that the intermediate principal stress coefficient has a significant effect on the plastic shear strain ratio; the point at b = 0 is completely different from the other two cases.

4. Conclusions

To study the deformation evolution law of loess, true triaxial tests on the cyclic loading and unloading of remodeled loess under anisotropic consolidation ratio conditions were carried out on samples of remodeled loess obtained from the Xi’an area. In this study, various complex stress paths were simulated realistically to approximate real-world engineering conditions and provide more accurate design parameters for the seismic design of projects, thus guiding engineering practice. The main conclusions are as follows:
(1)
Principal strain develops in two stages: a rapid initial increase followed by a slower increase until stabilization. ε 1 is the compressive deformation. ε 2 isotropic consolidation ( K = 1 . 0 ) begins with expansion deformation and slowly transitions to compressive deformation with cyclic shear, while anisotropic consolidation ( K = 1 . 5 and K = 2 . 0 ) is always compressive deformation. ε 3 is initially expansion deformation and then slowly transitions to compressive deformation.
(2)
The magnitudes of the elastic volumetric strain and elastic shear strain depend on the magnitude of the spherical or shear stress and are largely unaffected by their loading history.
(3)
All forms of plastic volume strain show volume shrinkage, which increases with increases in K and b . After normalization, the consolidation mode has a greater effect on the plastic volume strain ratio. The distribution range of the points of each anisotropic consolidation is smaller, and the points of isotropic consolidation and its dispersion are larger. The intermediate principal stress coefficient has a lesser effect on the plastic volume strain ratio, and the degree of normalization of the measurement points is higher.
(4)
All types of plastic shear strain exhibit shear shrinkage. They increase significantly with an increase in the intermediate principal stress coefficient, and there is no obvious relationship between the magnitude of the plastic shear strain and the anisotropic consolidation ratio. After normalization, the fall points of the plastic shear strain ratios for different anisotropic consolidation ratios and intermediate principal stress coefficients are scattered, and both K and b have a significant effect on the plastic shear strain ratios.
At present, a constitutive model of loess is being derived. The authors hope to clarify the stress–strain development law in loess in their next work.

Author Contributions

Conceptualization, D.G. and S.S. (Shengjun Shao); methodology, S.S. (Shengjun Shao); software, D.G. and S.S. (Shuai Shao); validation, D.G. and S.S. (Shuai Shao); formal analysis, D.G.; investigation, D.G.; resources, S.S. (Shuai Shao); data curation, D.G.; writing—original draft preparation, D.G.; writing—review and editing, D.G.; visualization, D.G.; supervision, S.S. (Shuai Shao); project administration, S.S. (Shengjun Shao); funding acquisition, S.S. (Shuai Shao). All authors have read and agreed to the published version of the manuscript.

Funding

This research was funded by the Natural Science Foundation of China (52108342), Doctoral initial funding from the Xi’an University of Technology (107-451122001), the Key Research and Development Project of Shaanxi Province (2024SF-YBXM-618) and the Natural Science Foundation of Shaanxi Province (No. 2024JC-YBQN-0605 and 2024JC-YBMS-427).

Data Availability Statement

The original contributions presented in this study are included in the article. Further inquiries can be directed to the corresponding author.

Conflicts of Interest

The authors declare that they have no known competing financial interests or personal relationships that could have appeared to influence the work reported in this paper.

Abbreviations

K anisotropic consolidation ratio
b intermediate principal stress coefficient
G s specific gravity
w natural moisture content
ρ d natural dry density
w l limits liquid limit
w p plastic limit
I p plasticity limit
σ 1 axial stress
σ 2 intermediate principal stress
σ 3 minor principal stress
σ 1 c axial consolidation stress
σ 3 c initial confining pressure
σ c y c axial stress amplitude
T cyclic time
t loading time
ε 1 axial strain
ε 2 intermediate principal strain
ε 3 minor principal strain
ε v volumetric strain
ε d shear strain
ε v p plastic volumetric strain
ε v f p maximum of the volumetric shear strain
ε v e elastic volumetric strain
a v e amplitude of elastic volumetric strain
ε d p plastic shear strain
ε d e elastic shear strain
ε d f p maximum of the plastic shear strain
a d e amplitude of elastic shear strain
p spherical stress
q deviatoric stress

References

  1. Wu, H.; Shao, S.; Shao, S.; Wang, Z.; Yan, G. Cyclic loading deformation response and microstructure evolution of undisturbed loess subjected to pre-humidification process. Eng. Geol. 2024, 337, 107573. [Google Scholar] [CrossRef]
  2. Yan, Z.; Zhang, S.; Zhang, X.; Jiang, P. Dynamic Response Law of Loess Slope with Different Shapes. Adv. Mater. Sci. Eng. 2019, 2019, 4853102. [Google Scholar] [CrossRef]
  3. Cheng, Y.; Huo, A.; Zhao, Z.; Peng, J. Analysis of loess fracture on slope stability based on centrifugal model tests. Bull. Eng. Geol. Environ. 2021, 80, 3647–3657. [Google Scholar] [CrossRef]
  4. Umar, M.; Chiaro, G.; Kiyota, T.; Ullah, N. Deformation and cyclic resistance of sand in large-strain undrained torsional shear tests with initial static shear stress. Soils Found. 2021, 61, 765–781. [Google Scholar] [CrossRef]
  5. Thevakumar, K.; Indraratna, B.; Ferreira, F.B.; Carter, J.; Rujikiatkamjorn, C. The influence of cyclic loading on the response of soft subgrade soil in relation to heavy haul railways. Transp. Geotech. 2021, 29, 100571. [Google Scholar] [CrossRef]
  6. Zhu, W.; Ye, G.; Gu, L.; Zhang, F. Modeling of monotonic and cyclic behaviors of sand under small and normal confining stresses. Soil Dyn. Earthq. Eng. 2022, 156, 107209. [Google Scholar] [CrossRef]
  7. Dörner, J.; Horn, R.; Uteau, D.; Rostek, J.; Zúñiga, F.; Peth, S.; Dec, D.; Fleige, H. Studying the soil pore physical resistance and resilience of a shallow volcanic ash soil subjected to pure cyclic loading. Soil Tillage Res. 2020, 204, 104709. [Google Scholar] [CrossRef]
  8. Zhang, Z.; Wang, T.; Wu, S.; Tang, H.; Xin, P.; Liang, C. Dynamics stress–strain behavior of Tianshui soils. Landslides 2016, 14, 323–335. [Google Scholar] [CrossRef]
  9. Vargas, R.R.; Ueda, K.; Uemura, K. Influence of the relative density and K0 effects in the cyclic response of Ottawa F-65 sand—Cyclic Torsional Hollow-Cylinder shear tests for LEAP-ASIA-2019. Soil Dyn. Earthq. Eng. 2020, 133, 106111. [Google Scholar] [CrossRef]
  10. Yang, J.; Cui, Z.-D.; Xi, B.; Song, W. Experimental study on cyclic triaxial behaviors of saturated soft soil considering time intermittent and variable confining pressure. Soil Dyn. Earthq. Eng. 2024, 179, 108508. [Google Scholar] [CrossRef]
  11. Truong, M.H.; Indraratna, B.; Nguyen, T.T.; Carter, J.; Rujikiatkamjorn, C. Analysis of undrained cyclic response of saturated soils. Comput. Geotech. 2021, 134, 104095. [Google Scholar] [CrossRef]
  12. Ueno, K.; Kuroda, S.; Hori, T.; Tatsuoka, F. Elastic shear modulus variations during undrained cyclic loading and subsequent reconsolidation of saturated sandy soil. Soil Dyn. Earthq. Eng. 2018, 116, 476–489. [Google Scholar] [CrossRef]
  13. Kumar, A.; Azizi, A.; Toll, D.G. Application of Suction Monitoring for Cyclic Triaxial Testing of Compacted Soils. J. Geotech. Geoenviron. Eng. 2022, 148, 04022009. [Google Scholar] [CrossRef]
  14. Lei, H.; Li, B.; Lu, H.; Ren, Q. Dynamic Deformation Behavior and Cyclic Degradation of Ultrasoft Soil under Cyclic Loading. J. Mater. Civ. Eng. 2016, 28, 04016135. [Google Scholar] [CrossRef]
  15. Chen, C.; Zhou, Z.; Kong, L.; Zhang, X.; Yin, S. Undrained dynamic behaviour of peaty organic soil under long-term cyclic loading, Part I: Experimental investigation. Soil Dyn. Earthq. Eng. 2018, 107, 279–291. [Google Scholar] [CrossRef]
  16. Liu, X.; Qin, Z.; Yang, J. Undrained cyclic behaviour of loess with initial shear stress: A focus on failure mode. Soil Dyn. Earthq. Eng. 2023, 171, 107971. [Google Scholar] [CrossRef]
  17. Liu, X.; Huang, G.; Qin, Z.; Miao, X. Shear behaviour of loess under varied drainage conditions subjected to monotonic and cyclic loads. Soil Dyn. Earthq. Eng. 2024, 177, 108397. [Google Scholar] [CrossRef]
  18. Shafiee, A.; Fathipour, H.; Payan, M.; Jalili, J.; Chenari, R.J. Modulus reduction and damping characteristics of geotextile-reinforced sands. Soil Dyn. Earthq. Eng. 2024, 181, 108641. [Google Scholar] [CrossRef]
  19. Wang, J.; Zhou, Z.; Hu, X.; Guo, L.; Cai, Y. Effects of principal stress rotation and cyclic confining pressure on behavior of soft clay with different frequencies. Soil Dyn. Earthq. Eng. 2018, 118, 75–85. [Google Scholar] [CrossRef]
  20. Chiaro, G.; Kiyota, T.; Koseki, J. Strain localization characteristics of loose saturated Toyoura sand in undrained cyclic torsional shear tests with initial static shear. Soils Found. 2013, 53, 23–34. [Google Scholar] [CrossRef]
  21. Wang, Y.; Wan, Y.; Liu, M.; Guo, C.; Zeng, C.; Wu, D. Undrained multi-dimensional deformation behavior and degradation of natural soft marine clay from HCA experiments. Soils Found. 2020, 60, 103–114. [Google Scholar] [CrossRef]
  22. Yang, L.; Shao, S.; Wang, F.; Wang, L. Experimental Study on the Axial Deformation Characteristics of Compacted Lanzhou Loess under Traffic Loads. Sustainability 2023, 15, 10939. [Google Scholar] [CrossRef]
  23. Zheng, D.; Tang, L.; Wang, Y.; Sun, Y. Dynamic stress accumulation effects on soil strength under cyclic loading. Soils Found. 2022, 62, 101164. [Google Scholar] [CrossRef]
  24. Cui, K.; Zhang, D.; Li, P.; Li, Q.; Zhang, H.; Qing, Y. Influence of the initial static stress state on the accumulation behaviour of a coarse-grained soil under long-term cyclic loading. Soil Dyn. Earthq. Eng. 2023, 172, 108042. [Google Scholar] [CrossRef]
  25. Pan, K.; Yuan, Z.; Zhao, C.; Tong, J.; Yang, Z. Undrained shear and stiffness degradation of intact marine clay under monotonic and cyclic loading. Eng. Geol. 2022, 297, 106502. [Google Scholar] [CrossRef]
  26. Wang, H.; Sun, P.; Liu, E.; Li, R. Dynamic properties of Tianshui saturated remolded loess: A laboratory study. Eng. Geol. 2020, 272, 105570. [Google Scholar] [CrossRef]
  27. GB/T 50123-2019; Standard for Geotechnical Testing Method. Chinese Standard: Beijing, China, 2019.
  28. Zheng, F.; Shao, S.; Wang, Y.; Shao, S. A New Suction-Controlled True Triaxial Apparatus for Unsaturated Soil Testing. Geotech. Test. J. 2021, 44, 833–850. [Google Scholar] [CrossRef]
  29. Li, G. Advanced Soil Mechanics, 2nd ed.; Tsinghua University Press: Beijing, China, 2016. [Google Scholar]
  30. Zhang, J.M. Reversible and irreversible dilatancy of sand. Chin. J. Geotech. Eng. 2020, 22, 15–20. (In Chinese) [Google Scholar]
Figure 1. Photographs of field sampling of loess soil material.
Buildings 15 00602 g001
Figure 2. The particle size distribution curve.
Buildings 15 00602 g002
Figure 3. Diagram of apparatus.
Buildings 15 00602 g003
Figure 4. Schematic diagram of test loading: (a) Axial stress loading process; (b) diagram of stress loading.
Buildings 15 00602 g004
Figure 5. The stress path in the principal stress space.
Buildings 15 00602 g005
Figure 6. Stress time history curve of different consolidation ratios. Three consolidation ratios are highlighted in red: (a) K = 1 . 0 ; (b) K = 1 . 5 ; (c) K = 2 . 0 .
Buildings 15 00602 g006
Figure 7. Stress time history curve of different intermediate principal stress coefficients. Three intermediate principal stress coefficients are highlighted in red: (a) b = 0 ; (b) b = 0 . 5 ; (c) b = 1 . 0 .
Buildings 15 00602 g007
Figure 8. Stress time history curve of different stress amplitudes. Three stress amplitudes are highlighted in red: (a) σ cyc = 40 kPa; (b) σ cyc = 80 kPa; (c) σ cyc = 120 kPa.
Buildings 15 00602 g008
Figure 9. Principal strain components of loess.
Buildings 15 00602 g009
Figure 10. Relationship between lateral strain and axial strain: (a,c,e) relationship between intermediate principal strain and major l strain; (b,d,f) relationship between minor principal strain and major l strain.
Buildings 15 00602 g010
Figure 11. Volumetric strain and shear strain of remodeled loess: (a) volumetric strain components; (b) shear strain components.
Buildings 15 00602 g011
Figure 12. Strain amplitude: (a) a v e and a d e with different b ; (b) a v e and a d e with different K .
Buildings 15 00602 g012
Figure 13. Plastic accumulated volumetric strain. (ac) Three consolidation ratios are highlighted in red: (a) K = 1 . 0 ; (b) K = 1 . 5 ; (c) K = 2 . 0 . (df) Three intermediate principal stress coefficient are highlighted in red: (d) b = 0 ; (e) b = 0 . 5 ; (f) b = 1 . 0 .
Buildings 15 00602 g013
Figure 14. Curves of plastic volumetric strain ratio and cyclic number ratio: (a) b = 0 . 5 under different K ; (b) K = 1 . 5 under different b .
Buildings 15 00602 g014
Figure 15. Plastic accumulated shear strain. (ac) Three consolidation ratios are highlighted in red: (a) K = 1 . 0 ; (b) K = 1 . 5 ; (c) K = 2 . 0 . (df) Three intermediate principal stress coefficient are highlighted in red: (d) b = 0 ; (e) b = 0 . 5 ; (f) b = 1 . 0 .
Buildings 15 00602 g015aBuildings 15 00602 g015b
Figure 16. Curves between plastic shear strain ratio and cyclic number ratio: (a) b = 0 . 5 under different K values; (b) K = 1 . 5 under different b values.
Buildings 15 00602 g016
Table 1. The physical and mechanical properties of the loess.
PropertyValue
Specific gravity, Gs2.70
Natural moisture content, w/%21
Natural dry density, ρd/g·cm−31.23
Liquid limit, wl/%35.49
Plastic limit, wp/%23.08
Plasticity limit, Ip12.41
Main minerals
Quartz (%)36.2
Mica (%)21.6
Feldspar (%)14.3
Calcite (%)18.2
Dolomite (%)1.9
Illite (%)7.8
Table 2. Test plan.
Table 2. Test plan.
Test Series σ 1 c /kPa σ 3 c /kPa K b σ c y c /kPa
A012002001.00.540, 80, 120, 160
B012001331.5040, 80, 120, 160
B022001331.50.540, 80, 120, 160
B032001331.5140, 80, 120, 160
C012001002.00.540, 80, 120, 160
Disclaimer/Publisher’s Note: The statements, opinions and data contained in all publications are solely those of the individual author(s) and contributor(s) and not of MDPI and/or the editor(s). MDPI and/or the editor(s) disclaim responsibility for any injury to people or property resulting from any ideas, methods, instructions or products referred to in the content.

