Article

Impact of Internal and External Landscape Patterns on Urban Greenspace Cooling Effects: Analysis from Maximum and Accumulative Perspectives

1
School of Urban Design, Wuhan University, Wuhan 430072, China
2
Research Center for Digital City, Wuhan University, Wuhan 430072, China
*
Author to whom correspondence should be addressed.
Buildings 2025, 15(4), 573; https://doi.org/10.3390/buildings15040573
Submission received: 23 January 2025 / Revised: 9 February 2025 / Accepted: 12 February 2025 / Published: 13 February 2025
(This article belongs to the Special Issue Advanced Studies in Urban and Regional Planning—2nd Edition)

Abstract

:
Urban greenspace is an effective strategy to mitigate the urban heat island (UHI) effect. While its cooling effects are well-established, uncertainties remain regarding the combined impact of internal and external landscape patterns, particularly the role of morphological spatial patterns. Taking 40 urban greenspaces in Wuhan as the sample, this study quantified cooling effects from maximum and accumulative perspectives and investigated the impacts of internal and external landscape patterns. First, using land surface temperature (LST) data, four cooling indexes—greenspace cooling area (GCA), cooling efficiency (GCE), cooling intensity (GCI), and cooling gradient (GCG)—were quantified. Then, the relationships between these indexes and landscape patterns, including scale and landscape composition, morphological spatial pattern, and surrounding environmental characteristics, were investigated by correlation analysis and multiple stepwise regression. The results showed that the cooling effects of greenspace varied across different perspectives. Both greenspace area and perimeter exerted non-linear impacts on cooling effects, and morphological spatial pattern significantly influenced cooling effects. Core proportion was positively correlated with cooling effects, with an optimal threshold of 55%, whereas bridge and branch proportions had negative impacts. External landscape patterns, particularly the proportion of impervious surfaces and building coverage, also affected cooling effects. Additionally, cluster analysis using Ward’s system clustering method revealed five cooling bundles, indicating that urban greenspaces with diverse cooling needs exhibited different cooling effects. This study offers valuable insights for optimizing urban greenspace design to enhance cooling effects and mitigate UHI.

1. Introduction

Rapid urbanization and population growth have led to a range of ecological and environmental issues, notably the intense urban heat island (UHI) effect. UHI, characterized by elevated temperatures in urban areas compared to their non-urban counterparts, poses significant threats to ecosystems and human health [1,2,3,4,5]. It exacerbates environmental issues such as heightened energy consumption and increased air pollution while also inflicting profound adverse impacts on the health and well-being of urban dwellers [6,7,8,9,10]. As urbanization accelerates alongside global warming, the ecological and environmental impacts of the UHI effect are expected to expand [11]. Hence, urgent action is needed to implement effective measures for mitigating and adapting to the escalating UHI effect.
Urban greenspace, integral to the building environment and ecosystem of cities, plays a crucial role in the ecological development of urban areas and the enhancement of human settlement quality [5,12,13]. Importantly, as a nature-based solution, urban greenspace is regarded as a cost-effective and environmentally friendly approach to improving the urban thermal environment and mitigating the UHI effect [14,15,16,17,18]. Urban greenspace primarily regulates latent and sensible heat through shading and transpiration while also influencing local thermal conditions by modulating local ventilation and humidity, thus significantly reducing temperature [19,20,21,22,23]. Given the growing focus on urban greenspace for UHI mitigation, it is crucial to improve our understanding of its cooling effects. The accurate and comprehensive measurement of these cooling effects is the first step in fully understanding their potential. Since the cooling effects of urban greenspaces are spatially continuous and non-linear, it is crucial to conduct a thorough assessment from both maximum and cumulative perspectives to fully capture the extent of these effects [24,25,26].
Optimizing the cooling potential of urban greenspace is particularly challenging in densely urbanized areas, where available space for greening is limited. Consequently, maximizing the cooling effect of greenspaces within these constrained environments has become a critical issue for urban planning [27,28]. Effective strategies require a comprehensive understanding of the factors influencing greenspace cooling, including both internal landscape features (such as patch size and composition) and external environmental characteristics (such as surrounding impervious surfaces) [29]. At the same time, it is essential to identify the key factors that drive cooling performance. In addition, while existing research has identified various factors influencing the cooling effects of urban greenspace, limited attention has been given to the role of its morphological spatial patterns. Notably, morphological spatial pattern analysis (MSPA) provides a powerful tool for analyzing the landscape configuration in a spatially explicit manner [30,31]. Therefore, further investigation is crucial to gain new insights into optimizing and regulating urban greenspace to enhance cooling effects.
This study aims to quantify the cooling effects of urban greenspace and explore the impacts of internal and external landscape patterns on these effects, with a focus on optimizing greenspace design for enhanced cooling performance. Using 40 representative urban greenspaces in Wuhan, the specific research objectives are: (1) to quantify the cooling effects of greenspace from both maximum and accumulative perspectives; (2) to examine the relationship between internal and external factors—including the scale and landscape composition, morphological spatial patterns, and surrounding environmental characteristics—and cooling effects of urban greenspace; (3) to identify the dominant factors influencing different cooling effects; and (4) to propose key optimization strategies for enhancing cooling effects based on urban planning demands.

2. Literature Review

The cooling effect of urban greenspace has been a central focus of urban planning research, with numerous studies aiming to quantify this benefit. Early studies primarily employed temperature differentials between greenspace and its surroundings to verify its cooling effect [32,33,34]. As research advanced, spatial distance-based cooling indexes, such as maximum cooling ranges and maximum cooling distances, were introduced to quantify cooling effects from a maximum perspective [35,36,37,38,39,40]. However, this approach primarily focuses on peak cooling values and fails to capture variations in the cooling rate and how it changes across space [24,25,26]. Specifically, prior studies have highlighted the spatial non-linearity of cooling effects in greenspace [40]. Even when the maximum cooling distance or area remains constant, variations in the cooling curve (i.e., the LST-distance relationship) can lead to changes in the cooling outcomes, which are not captured by maximum-perspective indexes [24,26]. To overcome these limitations, an emerging quantitative method that adopts an accumulative perspective to measure the continuous cooling effect of greenspace has been developed in a limited number of studies [24,26,28,41]. Therefore, to provide comprehensive insights for urban planners aiming to enhance the cooling capabilities of urban greenspace, it is imperative to quantify cooling effects from both maximum and accumulative perspectives.
Meanwhile, an expanding body of research has focused on identifying factors that contribute to the cooling effects of urban greenspace and optimizing these factors to enhance cooling benefits and land use efficiency [35,42,43]. One of the most commonly studied factors is the size or number of urban greenspace, which are often regarded as the simplest and most quantifiable elements impacting cooling potential [32,33,44]. These studies have shown that larger greenspaces tend to have greater cooling effects; there is also a growing recognition of the need to determine threshold sizes of greenspace that maximize cooling efficiency for urban planners [18,40,45,46,47,48]. In addition to size, researchers have increasingly explored the role of landscape pattern metrics, such as patch density (PD), largest patch index (LPI), and aggregation index (AI), to understand how the configuration of greenspace influences their cooling potential [11,18,29,42,49]. Additionally, few studies have extended the scope of investigation by examining the influence of external landscape patterns—such as the surrounding impervious surface area and the built environment—on the cooling effects of urban greenspace [29,50,51]. Findings suggest that the cooling range of greenspace is significantly influenced by the impervious surface area of its surroundings, which could be increased by reducing the proportion of impervious surfaces nearby [35,52]. However, previous research has typically examined either internal or external landscape factors separately, and few have comprehensively integrated multiple influencing factors to explore their impacts on cooling performance.
Moreover, while many studies have explored the relationship between landscape patterns and cooling effects, the commonly used landscape metrics—primarily calculated using Fragstats software—are limited in their ability to spatially and explicitly characterize the urban greenspace spatial pattern [30,31,53]. These traditional metrics, while useful for broad assessments, fail to distinguish between distinct morphological structures with varying ecological implications, leading to challenges in developing effective spatial strategies for optimizing urban greenspace and enhancing its cooling effect [31]. In contrast, MSPA can identify various morphologies of the space (e.g., hubs, corridors, and sites) at the pixel level, visually representing the internal spatial pattern and distributional characteristics of urban greenspace and providing clear interpretations for each specific MSPA metric’s physical environment [30,54,55,56,57]. This makes MSPA a promising tool for investigating how different morphological configurations of greenspaces contribute to their cooling potential. While MSPA has been successfully applied in various ecological and planning contexts, including ecological safety networks, habitat assessments, and, more recently, in analyzing green infrastructure in urban contexts [58,59,60,61,62], there remains a gap in the literature regarding its systematic application to urban greenspace cooling. Specifically, it remains unclear how the morphological spatial patterns of greenspace influence the cooling effects, particularly from both maximum and accumulative perspectives. Addressing this gap is essential for refining urban greenspace design to maximize its cooling potential and mitigate UHI.
In summary, while urban greenspace is well-recognized for its cooling benefits, there is still a need for comprehensive quantification of its cooling effects from both maximum and accumulative perspectives, as well as further investigation into the influence of both internal and external landscape patterns, particularly morphological spatial patterns. This study aims to fill this gap by exploring how landscape patterns of urban greenspace contribute to diverse cooling effects and by providing valuable insights for urban greening strategies aimed at mitigating the UHI effect.

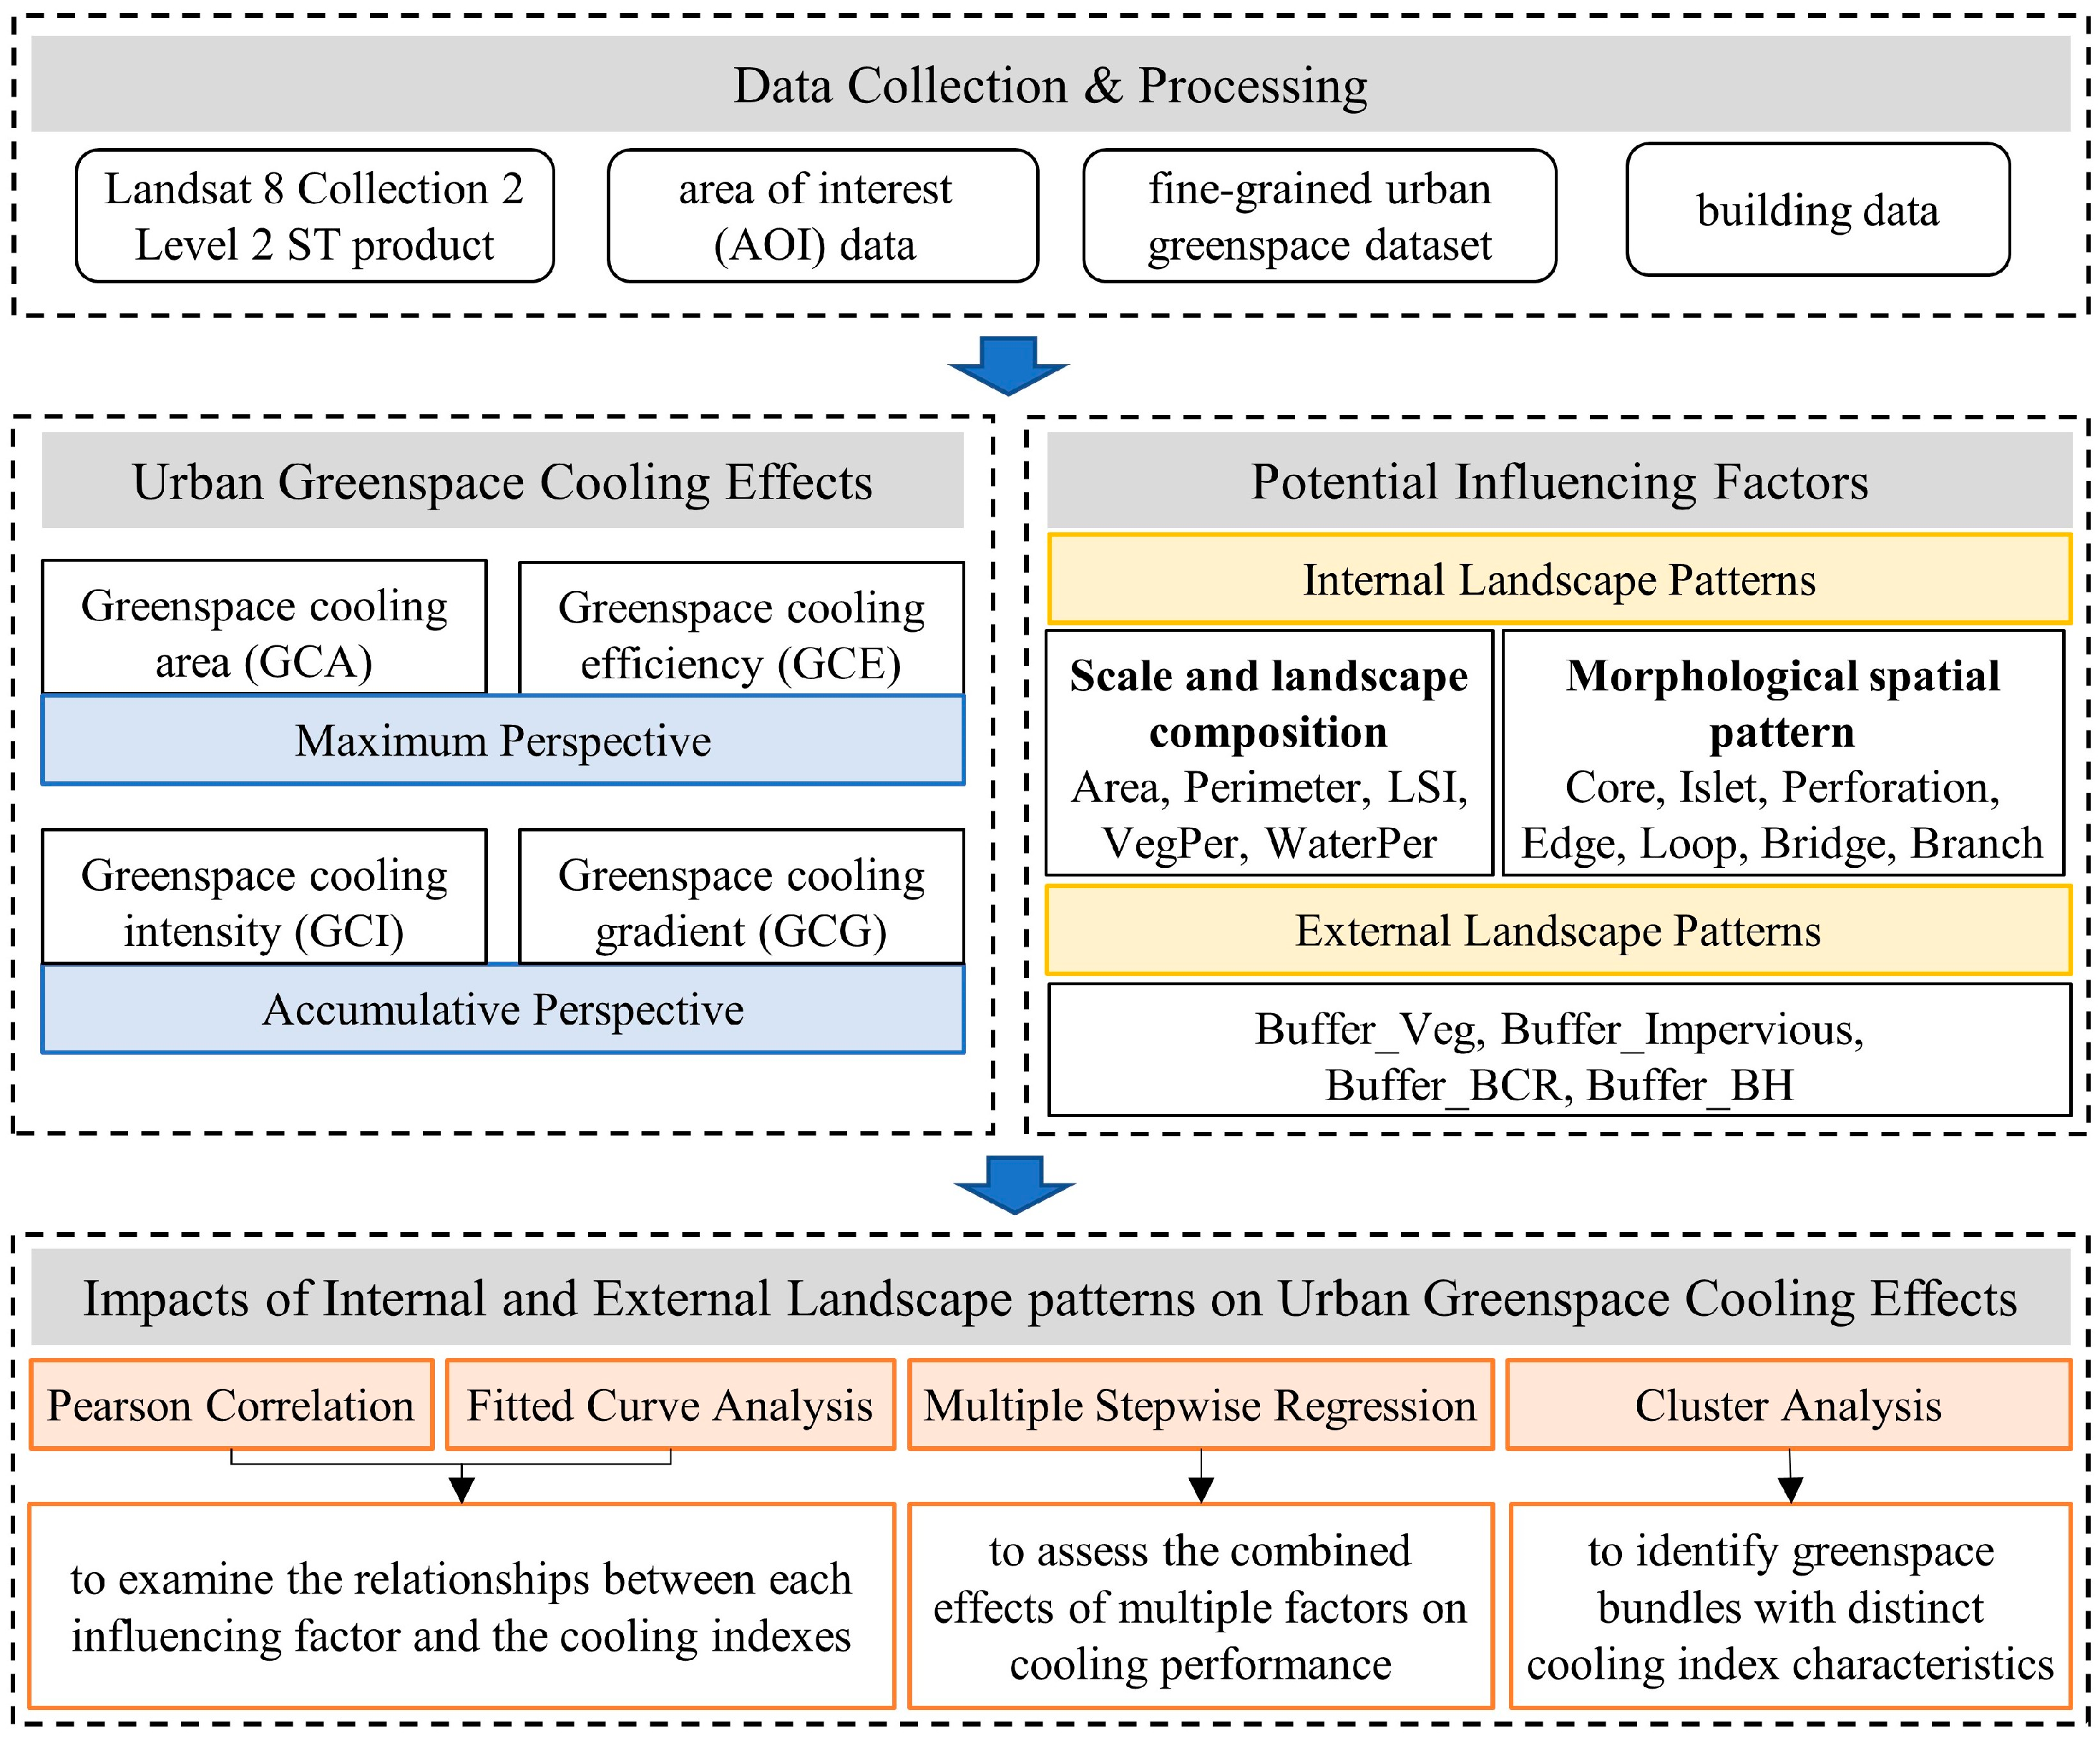
3. Materials and Methods
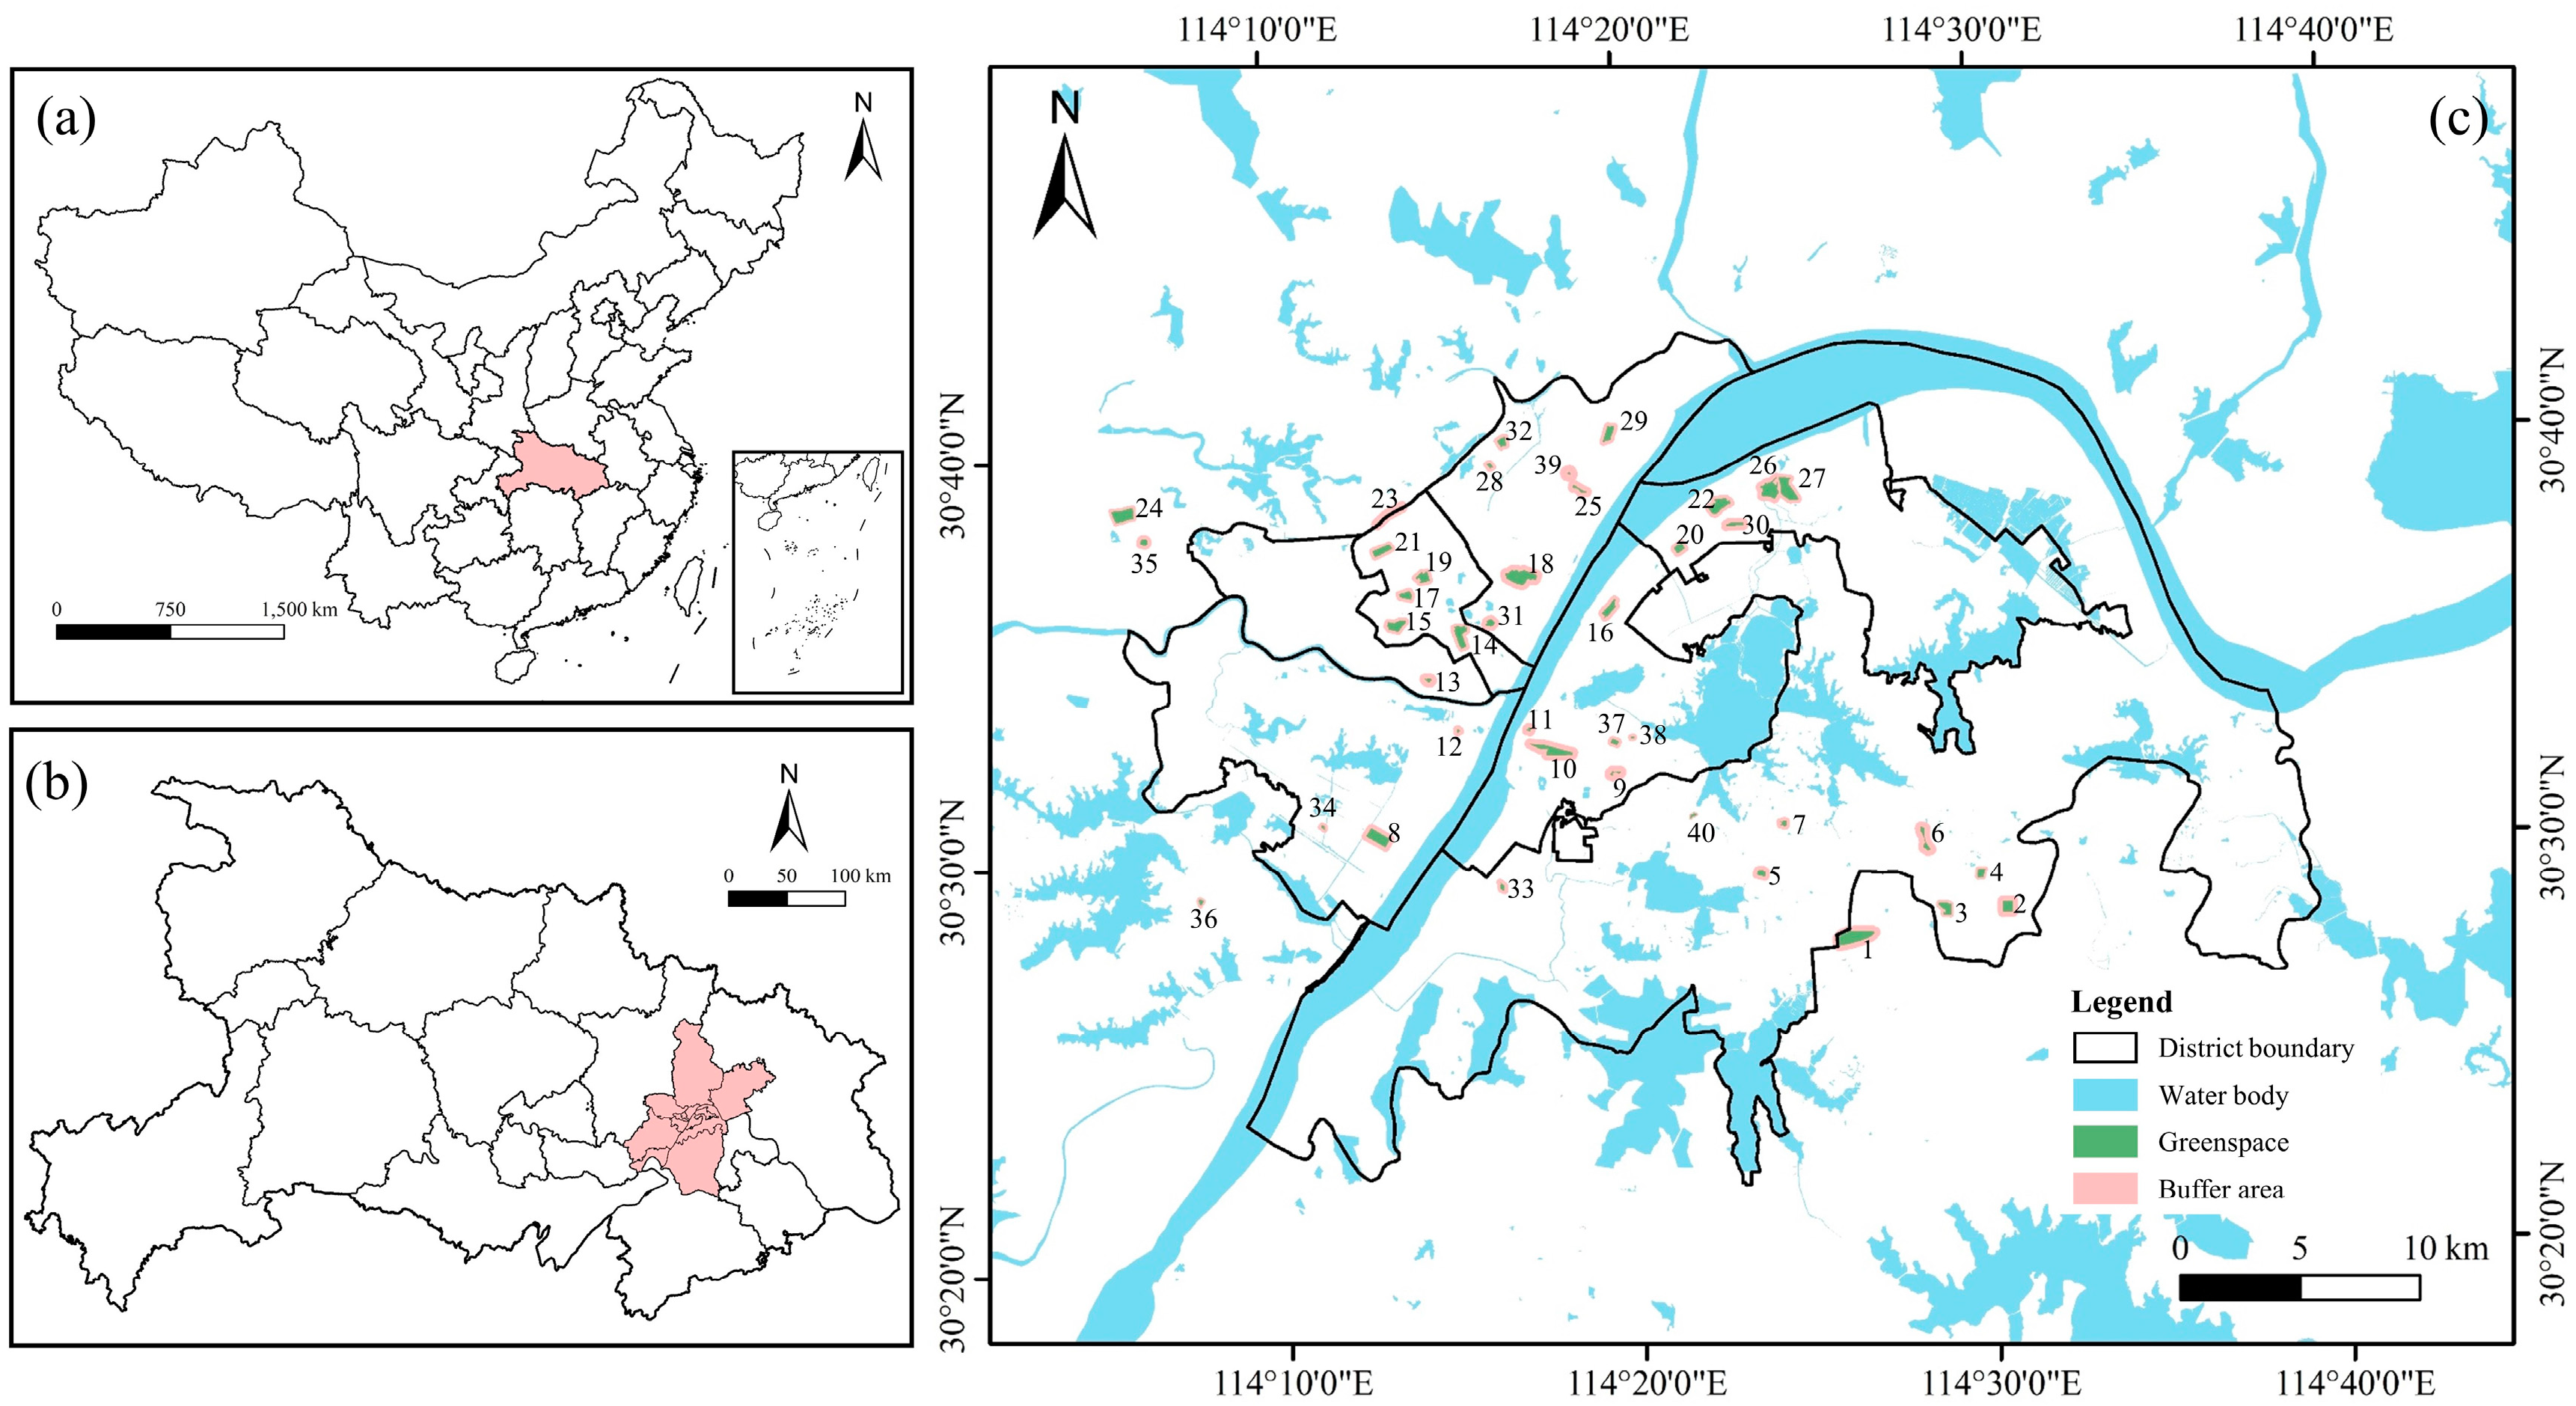
Figure 1 displays the research framework of this study, which was developed to quantify the cooling effects and investigate the impacts of internal and external landscape patterns on different cooling outcomes. First, several categories of data were collected and processed to be further applied in the analysis (Section 3.2). Second, based on the land LST data, the cooling effects of urban greenspace were quantified using four different cooling indexes from both maximum and accumulative perspectives (Section 3.3). Third, various potential influencing factors representing internal and external landscape patterns were selected and calculated based on greenspace classification and building data (Section 3.4 and Section 3.5). Finally, Pearson correlation analysis and curve fitting analysis were applied to examine the relationships between each influencing factor and the cooling indexes. Multiple stepwise regression was conducted to assess the combined effects of multiple factors on cooling performance and to identify the dominant factors. Additionally, cluster analysis was performed to categorize greenspace bundles with distinct cooling index characteristics (Section 3.6). More detailed descriptions of the methodology are provided in the following sections.

3.1. Study Area

Wuhan, the capital of Hubei Province in central China, is located at the confluence of the Yangtze and Hanjiang rivers (113°41′ E~115°05′ E, 29°58′ N~31°22′ N). Covering 8569.15 km2, it had a population of 13.74 million in 2022 [63]. Characterized by a typically subtropical humid monsoon climate, Wuhan suffers from extremely hot summers and cold winters. Average annual temperatures range from 15.8 °C to 17.5 °C, with a rising trend over recent years (http://data.cma.cn/, accessed on 21 March 2023). Often referred to as one of China’s “furnace cities”, Wuhan faces significant urbanization and the intensifying UHI effect, highlighting the need for urgent thermal environment management. Additionally, in line with the creation of an ecological civilization and the vision of fostering a garden city, Wuhan’s government plans to implement a series of measures aimed at increasing greenspace coverage and enhancing the ecological layout of urban greenspace. This includes the construction or renovation of 110 urban greenspaces or parks by 2024, aiming to maximize ecological restoration and mitigate the UHI effect.
Our study focuses on the densely urbanized core areas of Wuhan, where high population density, extensive construction, and intense UHI effects intersect. The limited natural ecological spaces, escalating recreational demands, and a sweltering thermal summer environment exacerbate these challenges. To minimize the influence of nearby water bodies and extensive greenspace, we selected 40 urban greenspace samples primarily within Wuhan’s central area for further investigation in this study (Figure 2). These greenspace samples were deliberately situated away from rivers, major lakes, or expansive green belts, all maintaining a distance of at least 300 m [39,53]. Additionally, the selected greenspace contains minimal or no water bodies.

3.2. Data Source and Processing

In this study, the LST data was derived from the USGS Landsat 8 Collection 2 Level 2 Surface Temperature (Landsat 8 C2 L2 ST) Product for 3 August 2020 (https://glovis.usgs.gov/, accessed on 21 May 2023). This date corresponds to a typical high-temperature summer’s day in Wuhan. The original image had a cloud cover of 1.96%, with no cloud cover over the study area. On the day of image capture, the mean air temperature was 31.5°C, with no precipitation and an average humidity level of 75.8%. The LST product is generated using the Landsat surface temperature algorithm (Version 1.3.0), developed in cooperation with the Rochester Institute of Technology and NASA Jet Propulsion Laboratory (https://www.usgs.gov/landsat-missions/landsat-collection-2-level-2-science-products, accessed on 21 May 2023). Using the scaling factors provided, the LST data (in °C) can be calculated by Equation (1):
L S T = N × 0.00341802 + 149.0 273.15
where N represents the original value from the Landsat 8 C2 L2 ST Product and 0.00341802, 149.0, and 273.15 are the scaling factors.
The geographic location and boundary information of selected urban greenspaces were obtained using area of interest (AOI) data from the Baidu Map API (https://lbsyun.baidu.com/, accessed on 21 May 2023). The fine-grained urban greenspace dataset (1 m resolution) shared by Shi et al. [64] was used to extract land cover of vegetation (https://www.scidb.cn/en/detail?dataSetId=36af2aed281e4c82aa8a3cd3f1211a37, accessed on 23 July 2023), with an overall accuracy of 86.05% for Wuhan. Meanwhile, high-resolution imagery sourced from Google Earth, acquired in October 2020, was employed for manual correction of greenspace boundaries and further vectorization of the selected urban greenspace. Additionally, building data, including building outlines and height information, was also acquired from the Baidu Map API to characterize the surrounding characteristics of urban greenspace. ArcGIS 10.7 software was used to process and analyze spatial data, including urban greenspace boundary extraction, landscape metric calculation, and spatial visualization.

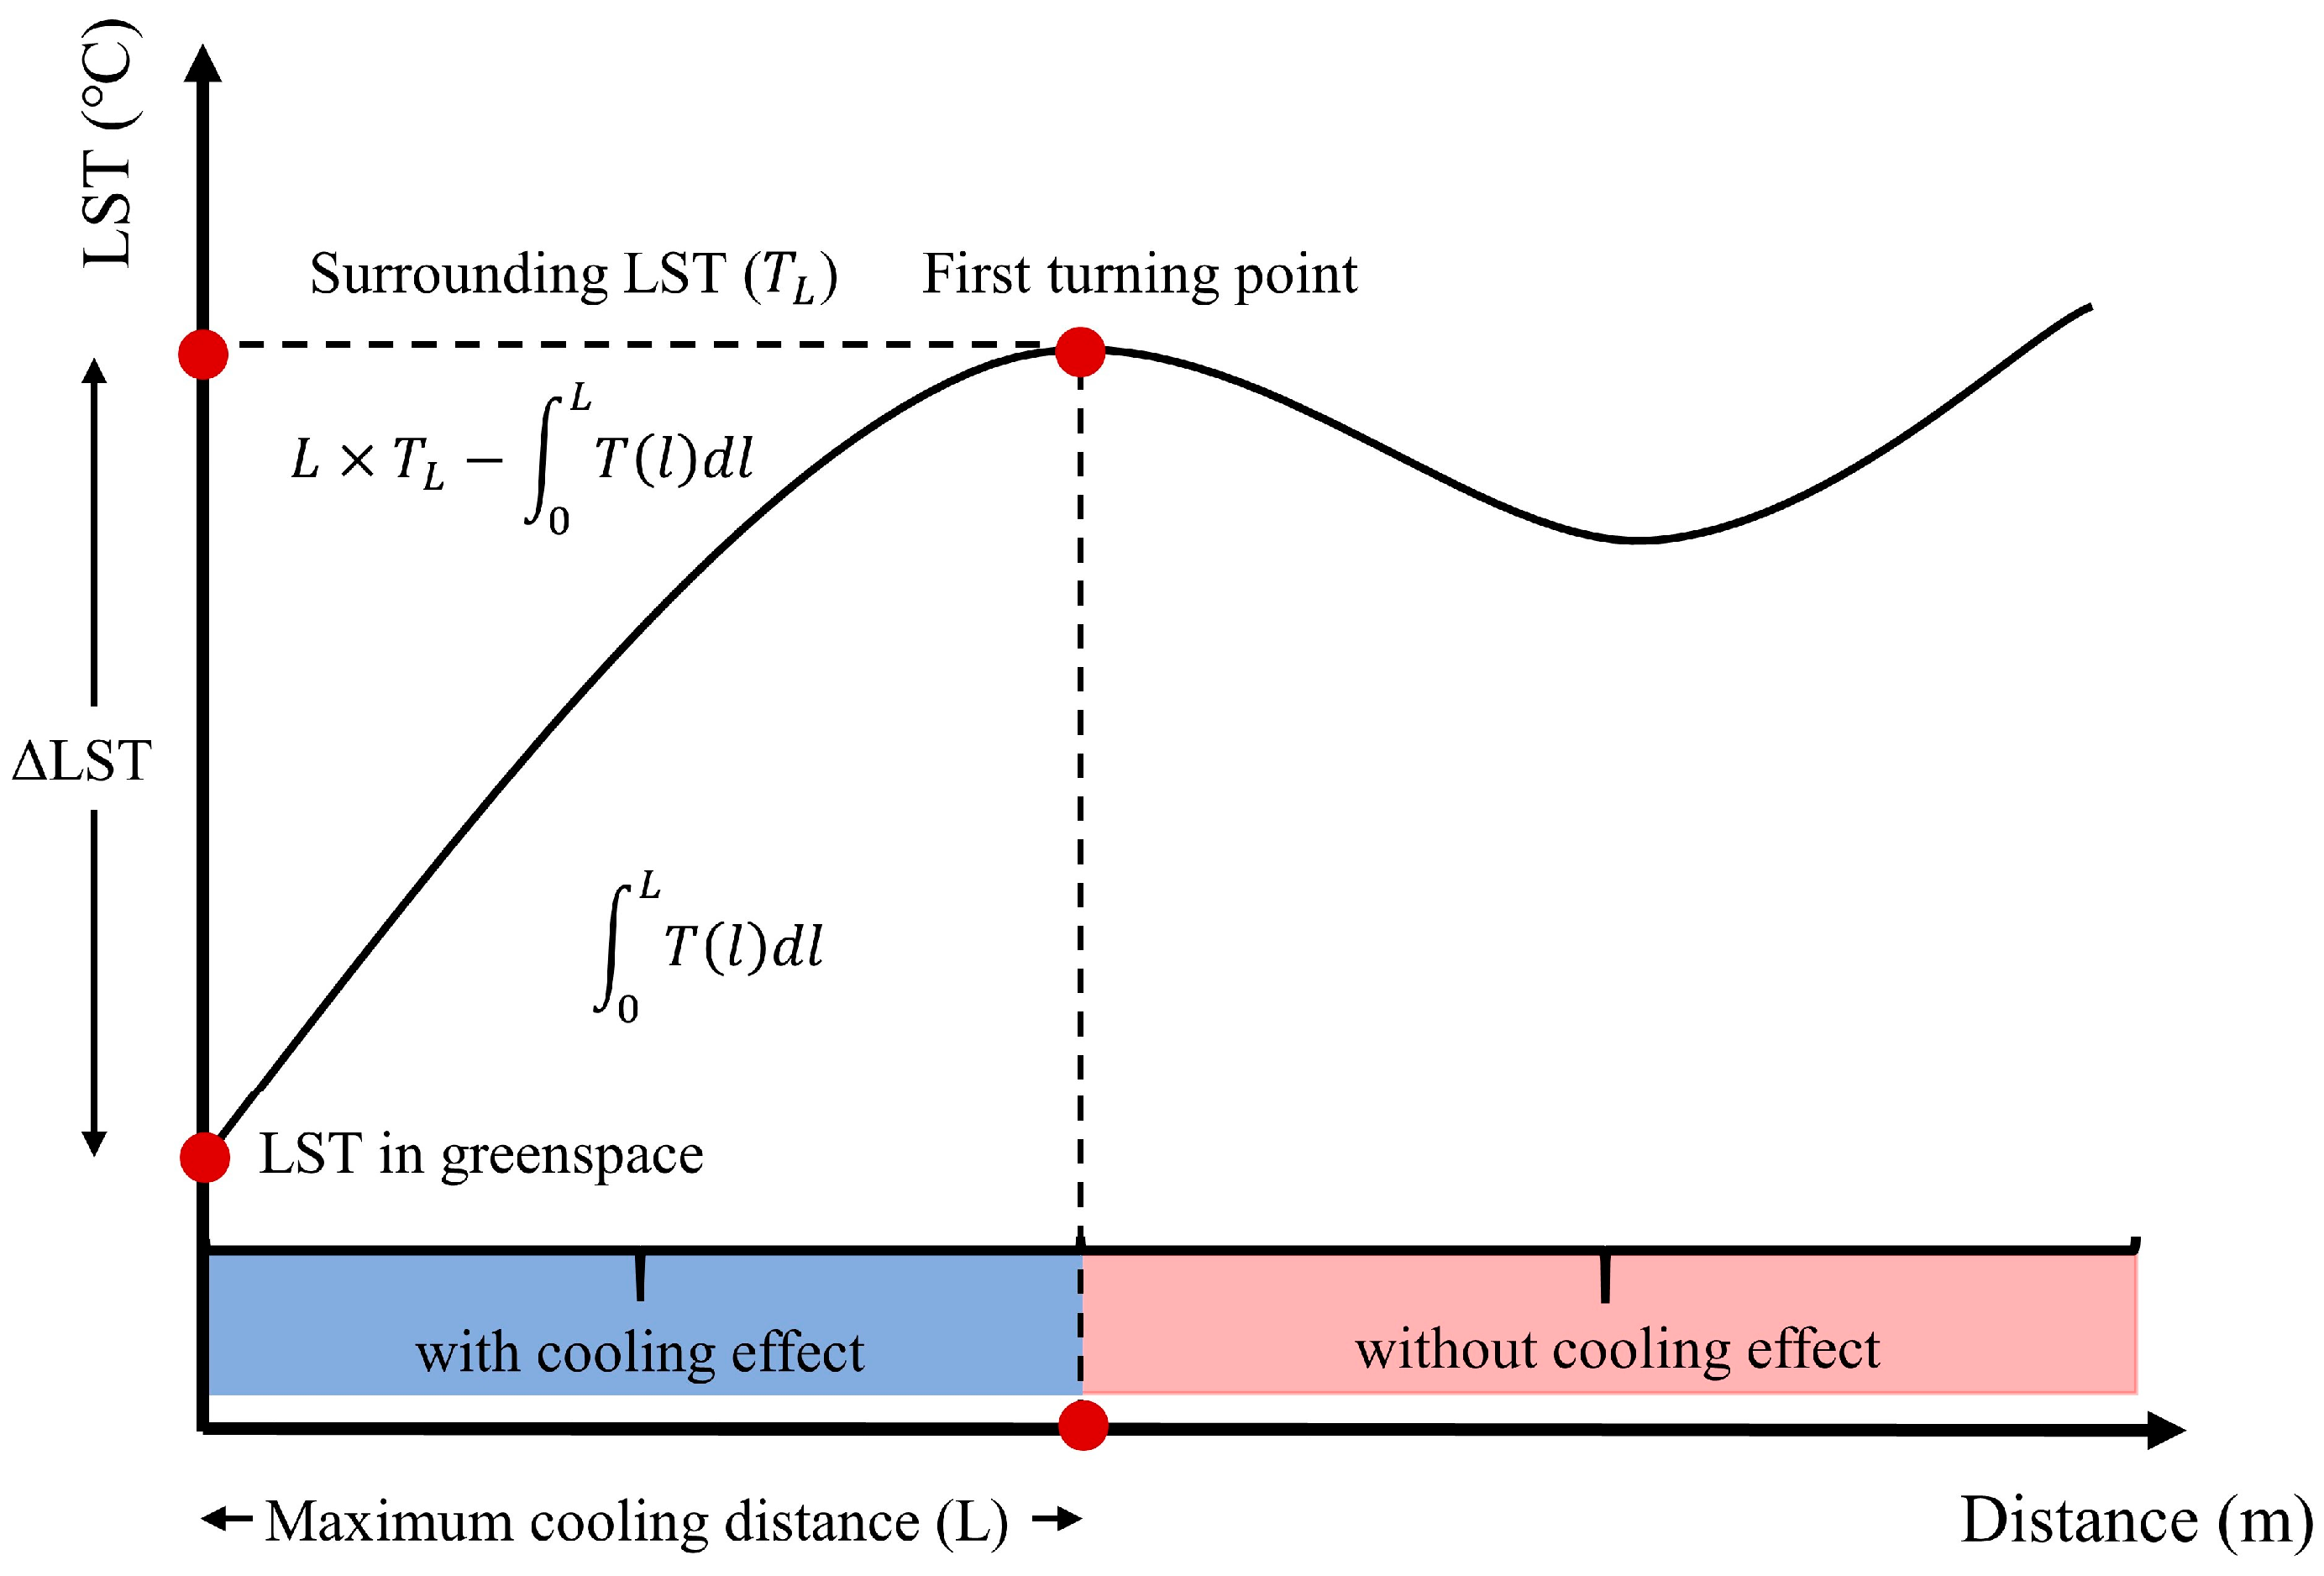
3.3. Urban Greenspace Cooling Effects Measurement

The study combined maximum and accumulative perspectives to measure the cooling effects of greenspace, defining four indexes in total: greenspace cooling area (GCA), greenspace cooling efficiency (GCE), greenspace cooling intensity (GCI), and greenspace cooling gradient (GCG).
Specifically, considering the 30 m resolution of the Landsat 8 images, buffer rings with a width of 30 m were created outward from the outer boundary of each urban greenspace. Previous studies have demonstrated that a buffer zone distance of 300 m provides an optimal measurement for the cooling effect of greenspace [24,41]. Hence, a total of 10 buffer rings were generated for this study. Following that, the mean LST was calculated sequentially within each urban greenspace and within each buffer ring. The relationship between the distance and LST of the buffer ring was established using a cubic polynomial function, as follows [65]:
T l = a l 3 + b l 2 + c l + d
where l represents the distance between the buffer ring and the urban greenspace boundary, T l denotes the mean LST of the buffer ring, a, b, and c are the coefficients of each cubic polynomial obtained through fitting, and d is the constant term.
As depicted in Figure 3, the LST of the buffer ring gradually increases as the distance from the greenspace boundary increases, yet the rate of LST increase progressively diminishes until it reaches 0, indicating the disappearance of the cooling effect of the greenspace on the surroundings. Following prior studies [24,26,47], a point corresponding to a value of 0 for the first-order derivative T′(l) function of T(l) indicates that the LST around the greenspace reaches a maximum; this point is considered as the first turning point. If the curve has no such point, it is replaced by the point with the smallest positive value of the first-order derivative T′(l). In summary, the point represents the maximum cooling distance of the greenspace (i.e., L), beyond which the greenspace will no longer exhibit a significant cooling effect, and the LST at the maximum cooling distance is defined as T L .
Further, GCA was defined as the area of the region covered by the maximum cooling distance, i.e., the area of the buffer zone most affected by the cooling effect of the greenspace. GCE was defined as the ratio of the greenspace cooling area to the area of the greenspace itself (Sgreenspace), characterizing the cooling area per unit area of the greenspace, which can be calculated by Equation (3):
G C E = G C A / S g r e e n s p a c e
GCI is defined as the ratio of LST reduced over the maximum cooling distance to the total LST if the urban greenspace is not built [24,28]. It represents the accumulative cooling intensity of the greenspace and also reflects the coolness felt by residents. GCG is defined as the ratio between the accumulative reduced LST over the maximum cooling distance and the maximum cooling distance, representing the accumulative LST reduction per unit of greenspace cooling distance. A larger GCG is evidence of more intensive heat absorption during the cooling process. Thus, this could be estimated as follows:
G C I = L × T L 0 L T l d l L × T L
G C G = L × T L 0 L T l d l L
where L is the maximum cooling distance, which is also the first turning point in the distance-LST curve, and T L is the LST at the maximum cooling distance.

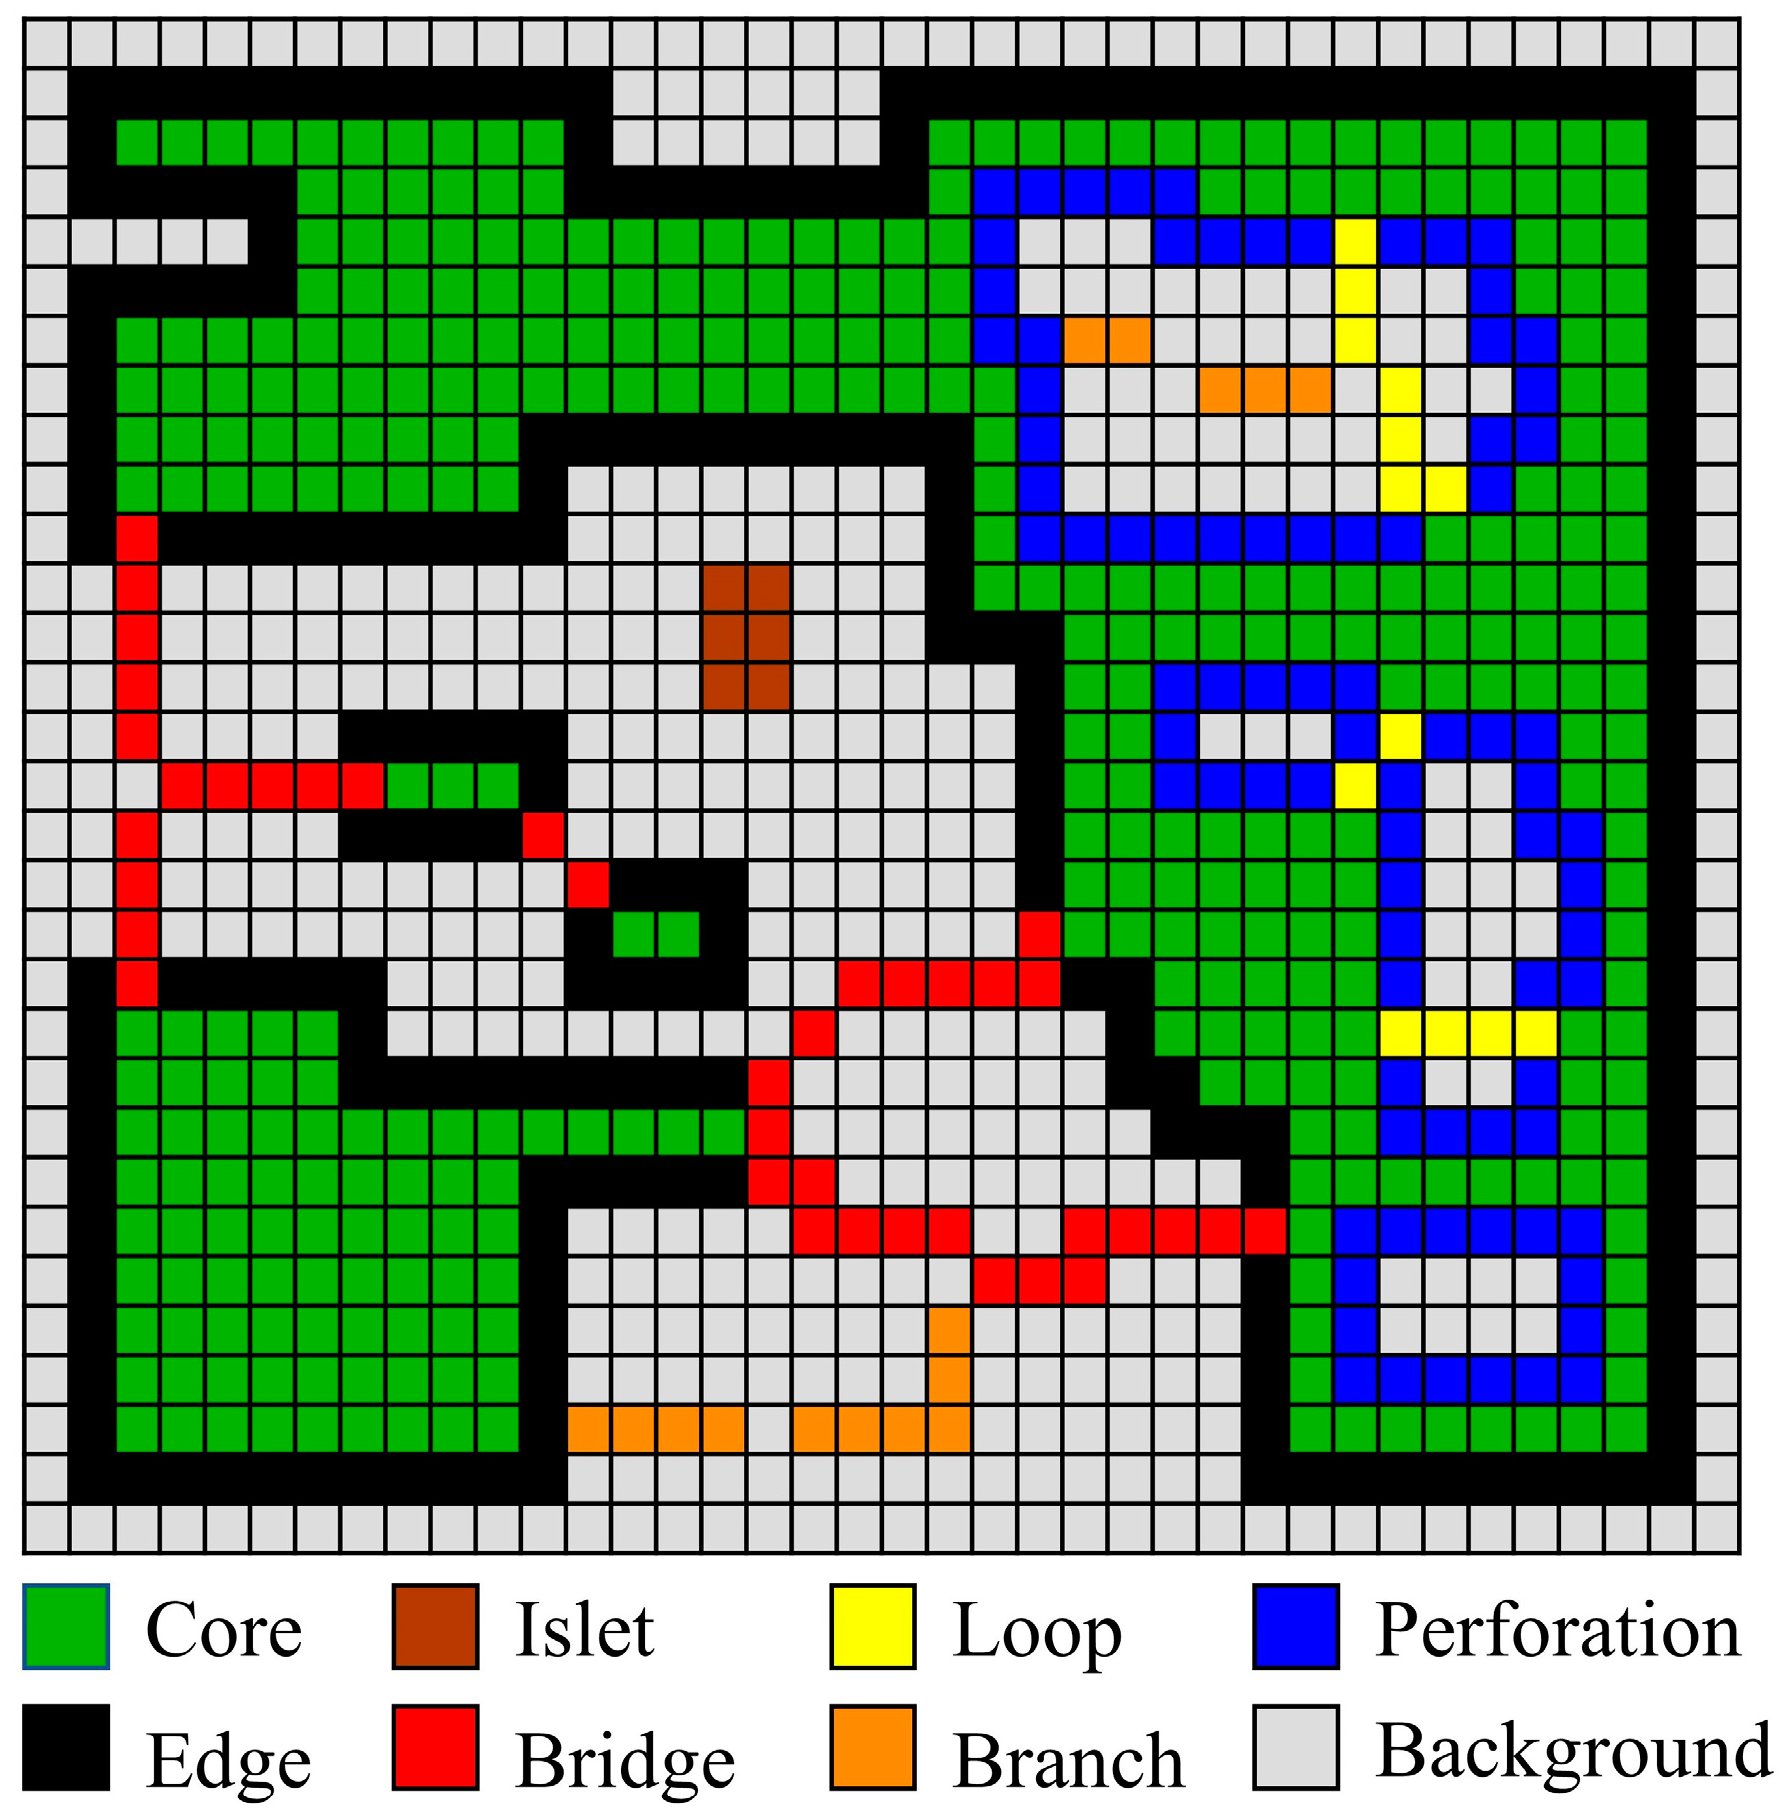
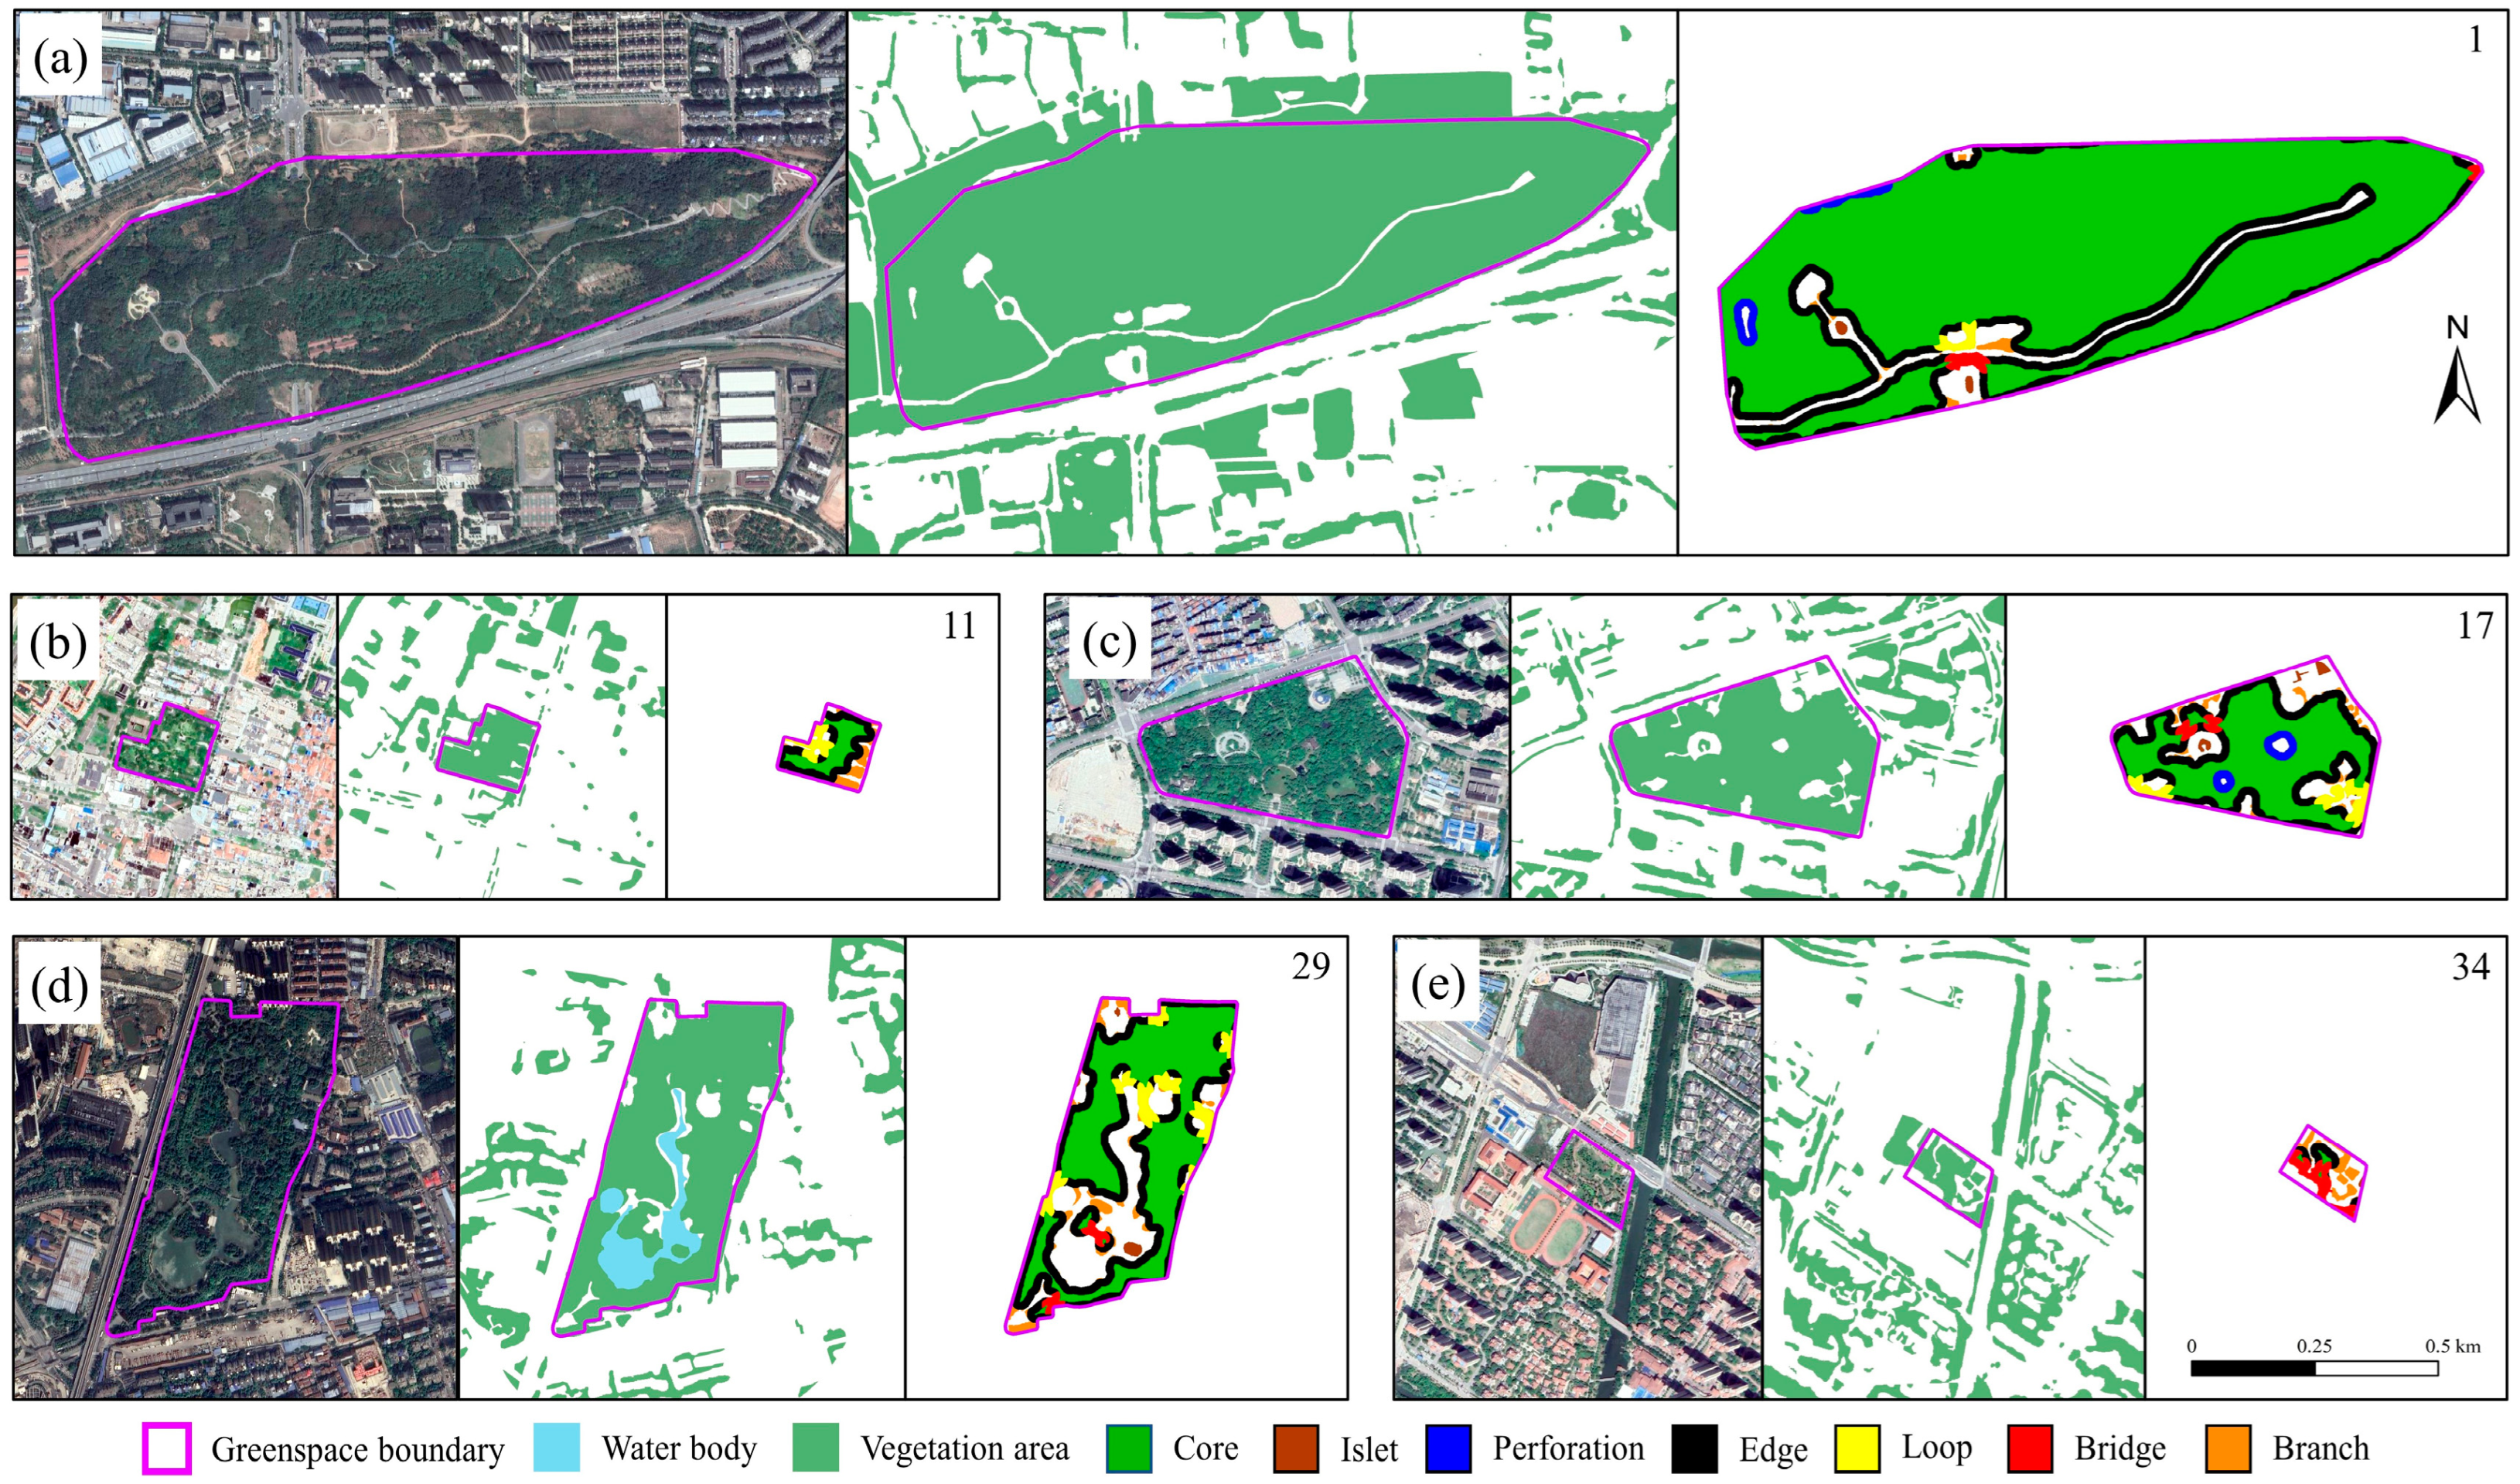
3.4. Morphological Spatial Pattern Analysis (MSPA)

In this study, MSPA was used to analyze the spatial configuration of urban greenspace. Specifically, MSPA categorizes the greenspace pixels (foreground) into seven non-overlapping spatial pattern types, including core, island, pore, edge, loop, bridge, and branch, as illustrated in Figure 4 [54,55,56]. The specific definitions and ecological significance of these categories are summarized in Table 1.
The MSPA analysis was conducted using Guidos 2.8 Toolbox software, with greenspace pixels defined as the foreground and other land cover as the background [56]. An edge width of 16 pixels was used to define spatial boundaries to compute and extract the seven morphological categories of the selected greenspace. Figure 5 presents examples of MSPA results for selected urban greenspace. Moreover, these categories based on MSPA further served as independent factors in subsequent statistical analyses for quantitatively measuring the morphological spatial pattern of urban greenspace. Each factor was represented by the proportion of its area relative to the total greenspace area.

3.5. Potential Influencing Factors Selection

The potential factors that influenced the cooling effect of urban greenspace were divided into two broad categories, namely internal factors and external factors, as shown in Table 2. Specifically, one aspect of the internal factors was the scale and landscape composition of the greenspace, including metrics such as area, perimeter, LSI, and the percentage of vegetation and water body area. These factors were commonly examined in previous studies and were mostly found to be significant in affecting the cooling effect [24,28,40,66,67]. The other aspect referred to the morphological spatial pattern of the urban greenspace, i.e., the area proportion of each MSPA metric. It is worth noting that using the proportion of area for the seven categories of MSPA as a measure of morphological spatial pattern aims to mitigate the influence of variations in the total greenspace area size.
In addition to the internal landscape patterns of greenspace, the external environment, i.e., factors within GCA, may likewise influence the cooling effect of greenspace [29]. Four factors were employed to quantify the surrounding two-dimensional (2D) landscape composition and three-dimensional (3D) urban form. The percentage of vegetation and impervious surface in the surrounding area of the greenspace represented the 2D landscapes, while the building coverage ratio and average building height in the surrounding area represented the 3D landscapes, characterizing the anthropogenic heat flux [50].

3.6. Statistical Analysis

3.6.1. Investigating the Relationship Between Potential Factors and Cooling Effects

In this study, we initially conducted Pearson correlation analysis to investigate the relationship between the selected potential influencing factors and cooling indexes. Correlation coefficient and p-values were utilized to assess the type (positive, negative, or none), strength, and statistical significance of the correlation. Subsequently, to further examine the impact of each potential influencing factor on each cooling index, various functions (e.g., linear, polynomial, logarithmic, power, exponential functions, etc.) were fitted to curves, which allowed for the visualization and quantification of the relationship. Finally, to explore the combined effects of various influencing factors and identify the major factors of cooling effects, multiple stepwise regression analysis was conducted to reduce redundancy. The LST of greenspace and four cooling indexes were used as the dependent variables, respectively.

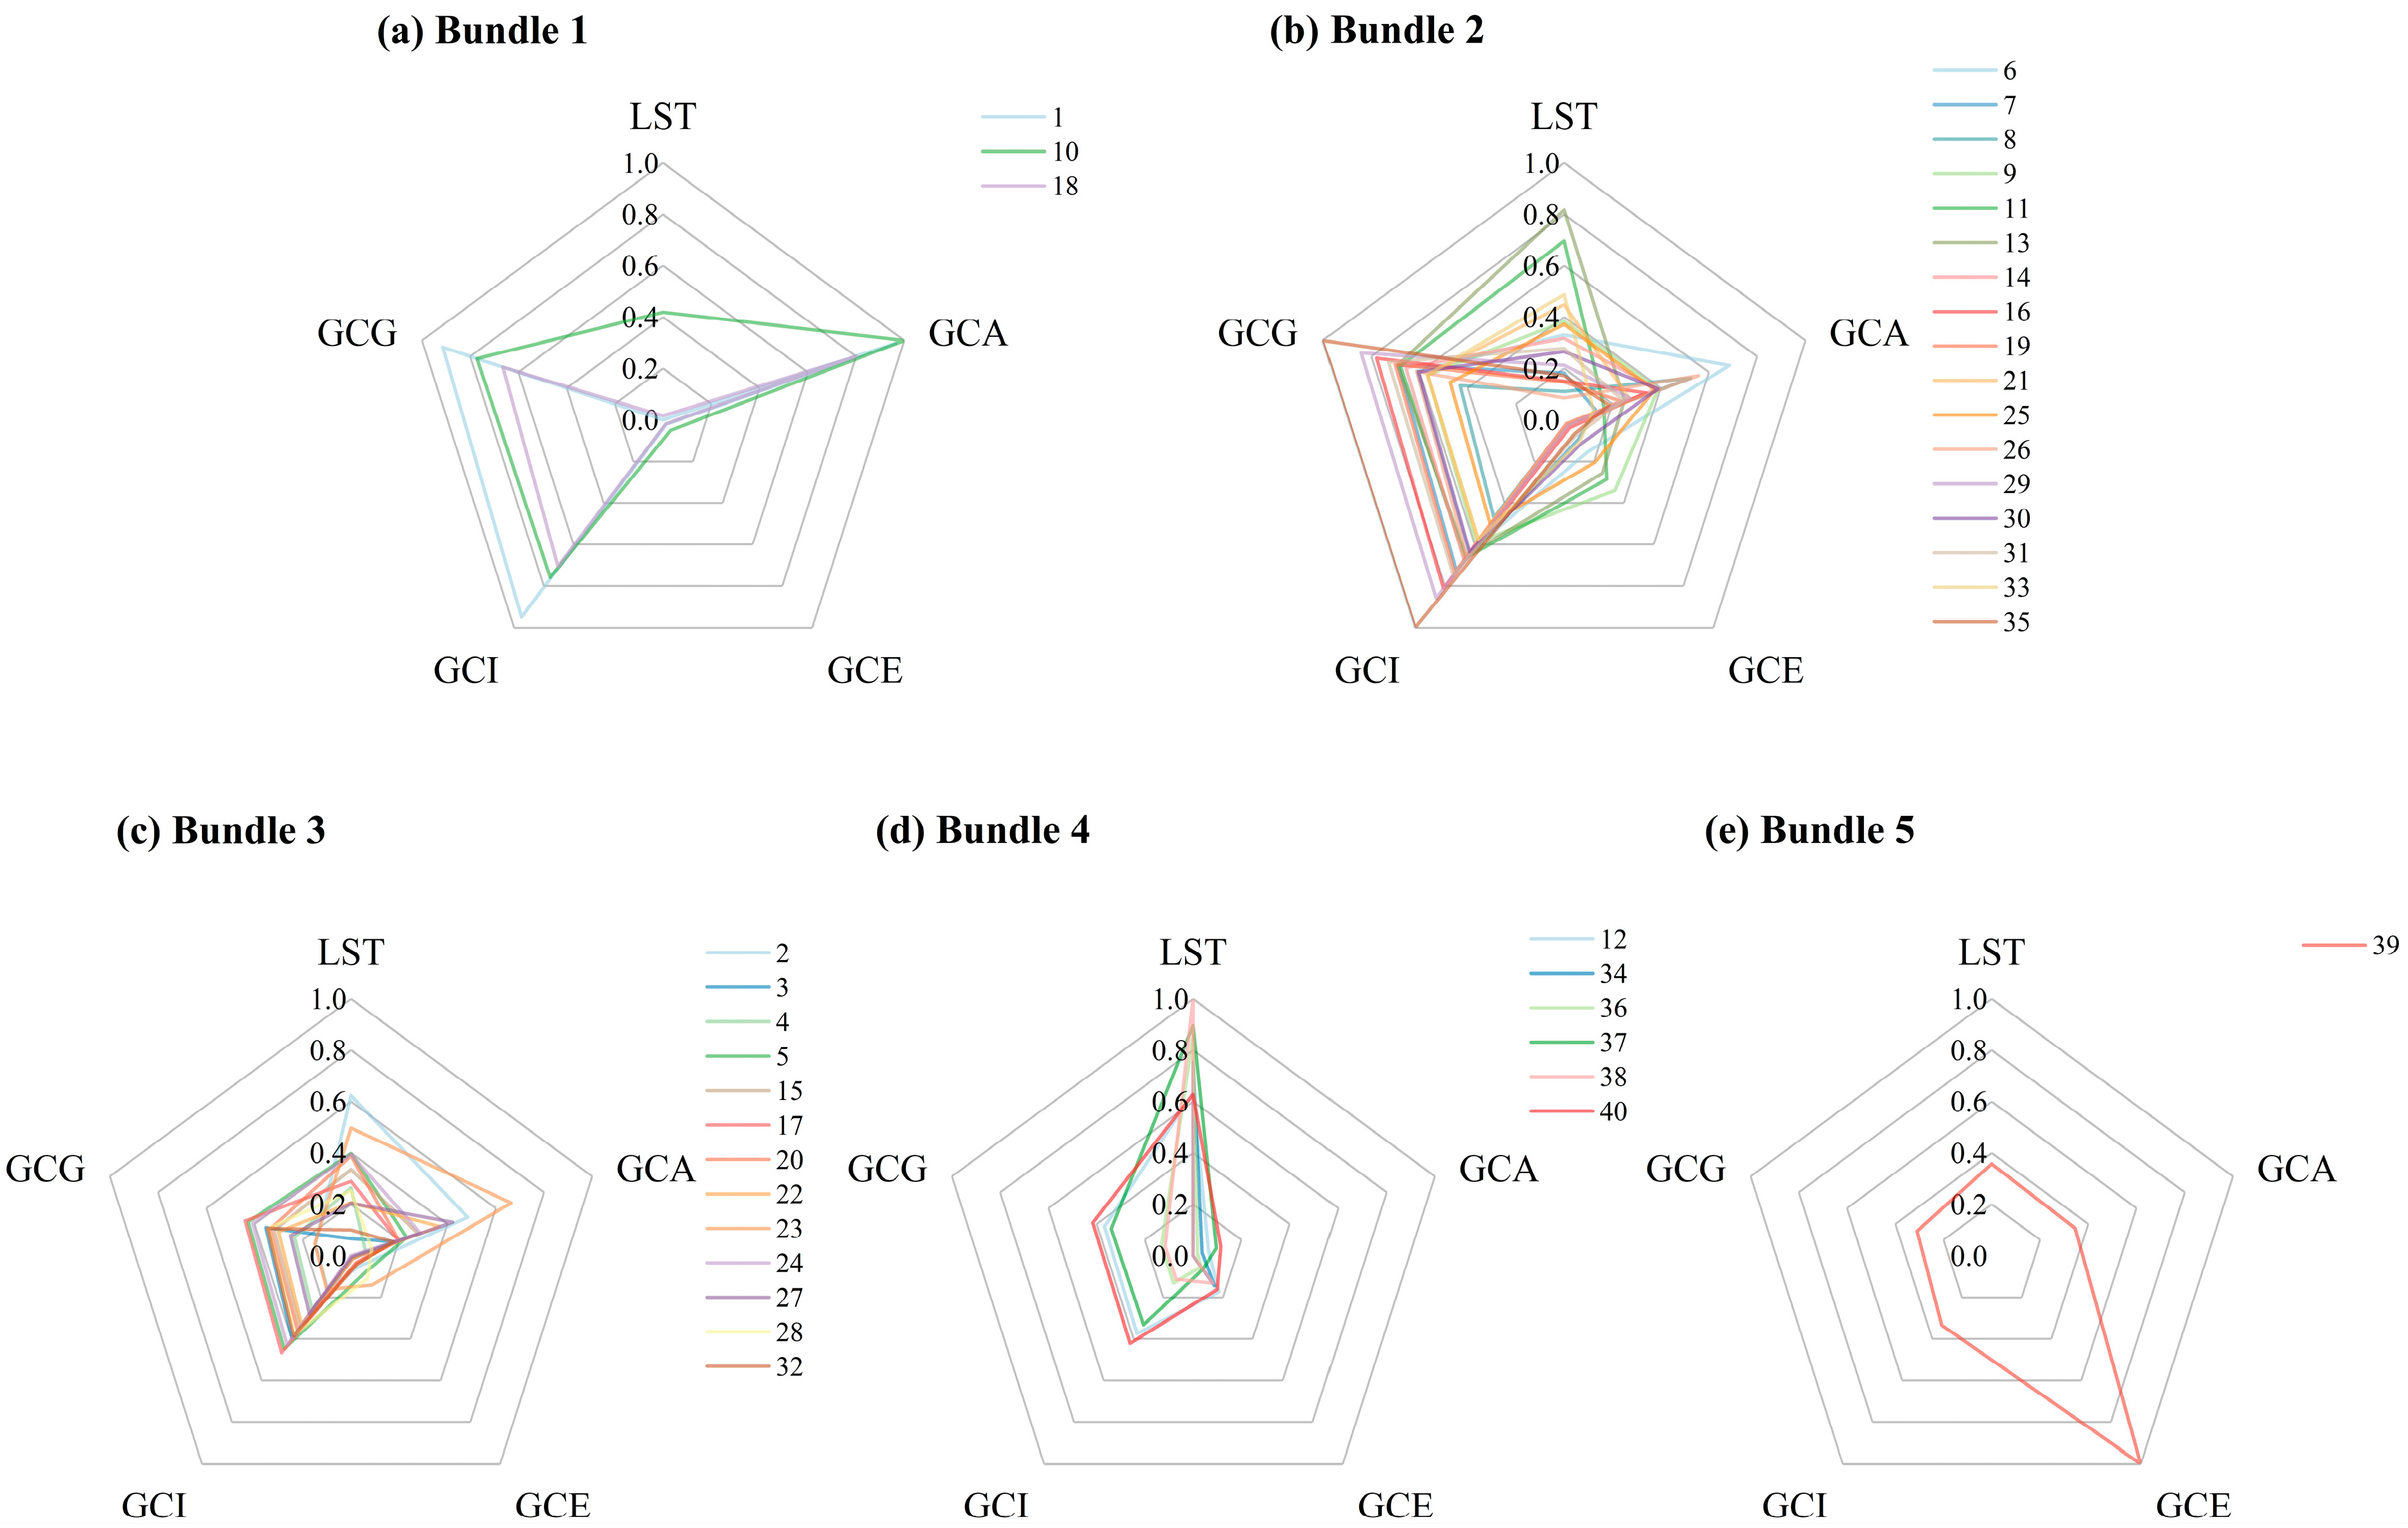
3.6.2. Cooling Bundles of Greenspace Identification

To further investigate the spatial characteristics of greenspace exhibiting different cooling effects and extract dominant and common features, we first selected the average LST of the greenspace and the four defined cooling indexes as feature values for normalization. Subsequently, we applied a combination of Ward’s system clustering method and variance test to identify different cooling bundles of greenspace. According to [24], a bundle refers to a similar cluster of urban greenspace with a similar combination of the above five normalized indexes at high or low values. For different cooling bundles, by comparing the differences in each influencing factor, we could identify the dominant cooling factor that affects the cooling effect. In this study, Ward’s system clustering method was initially used to classify urban greenspace into 2–10 clusters, and then the final number of chosen clusters was determined by the minimum number of clusters that passed the variance test [24,26].

4. Results and Analysis

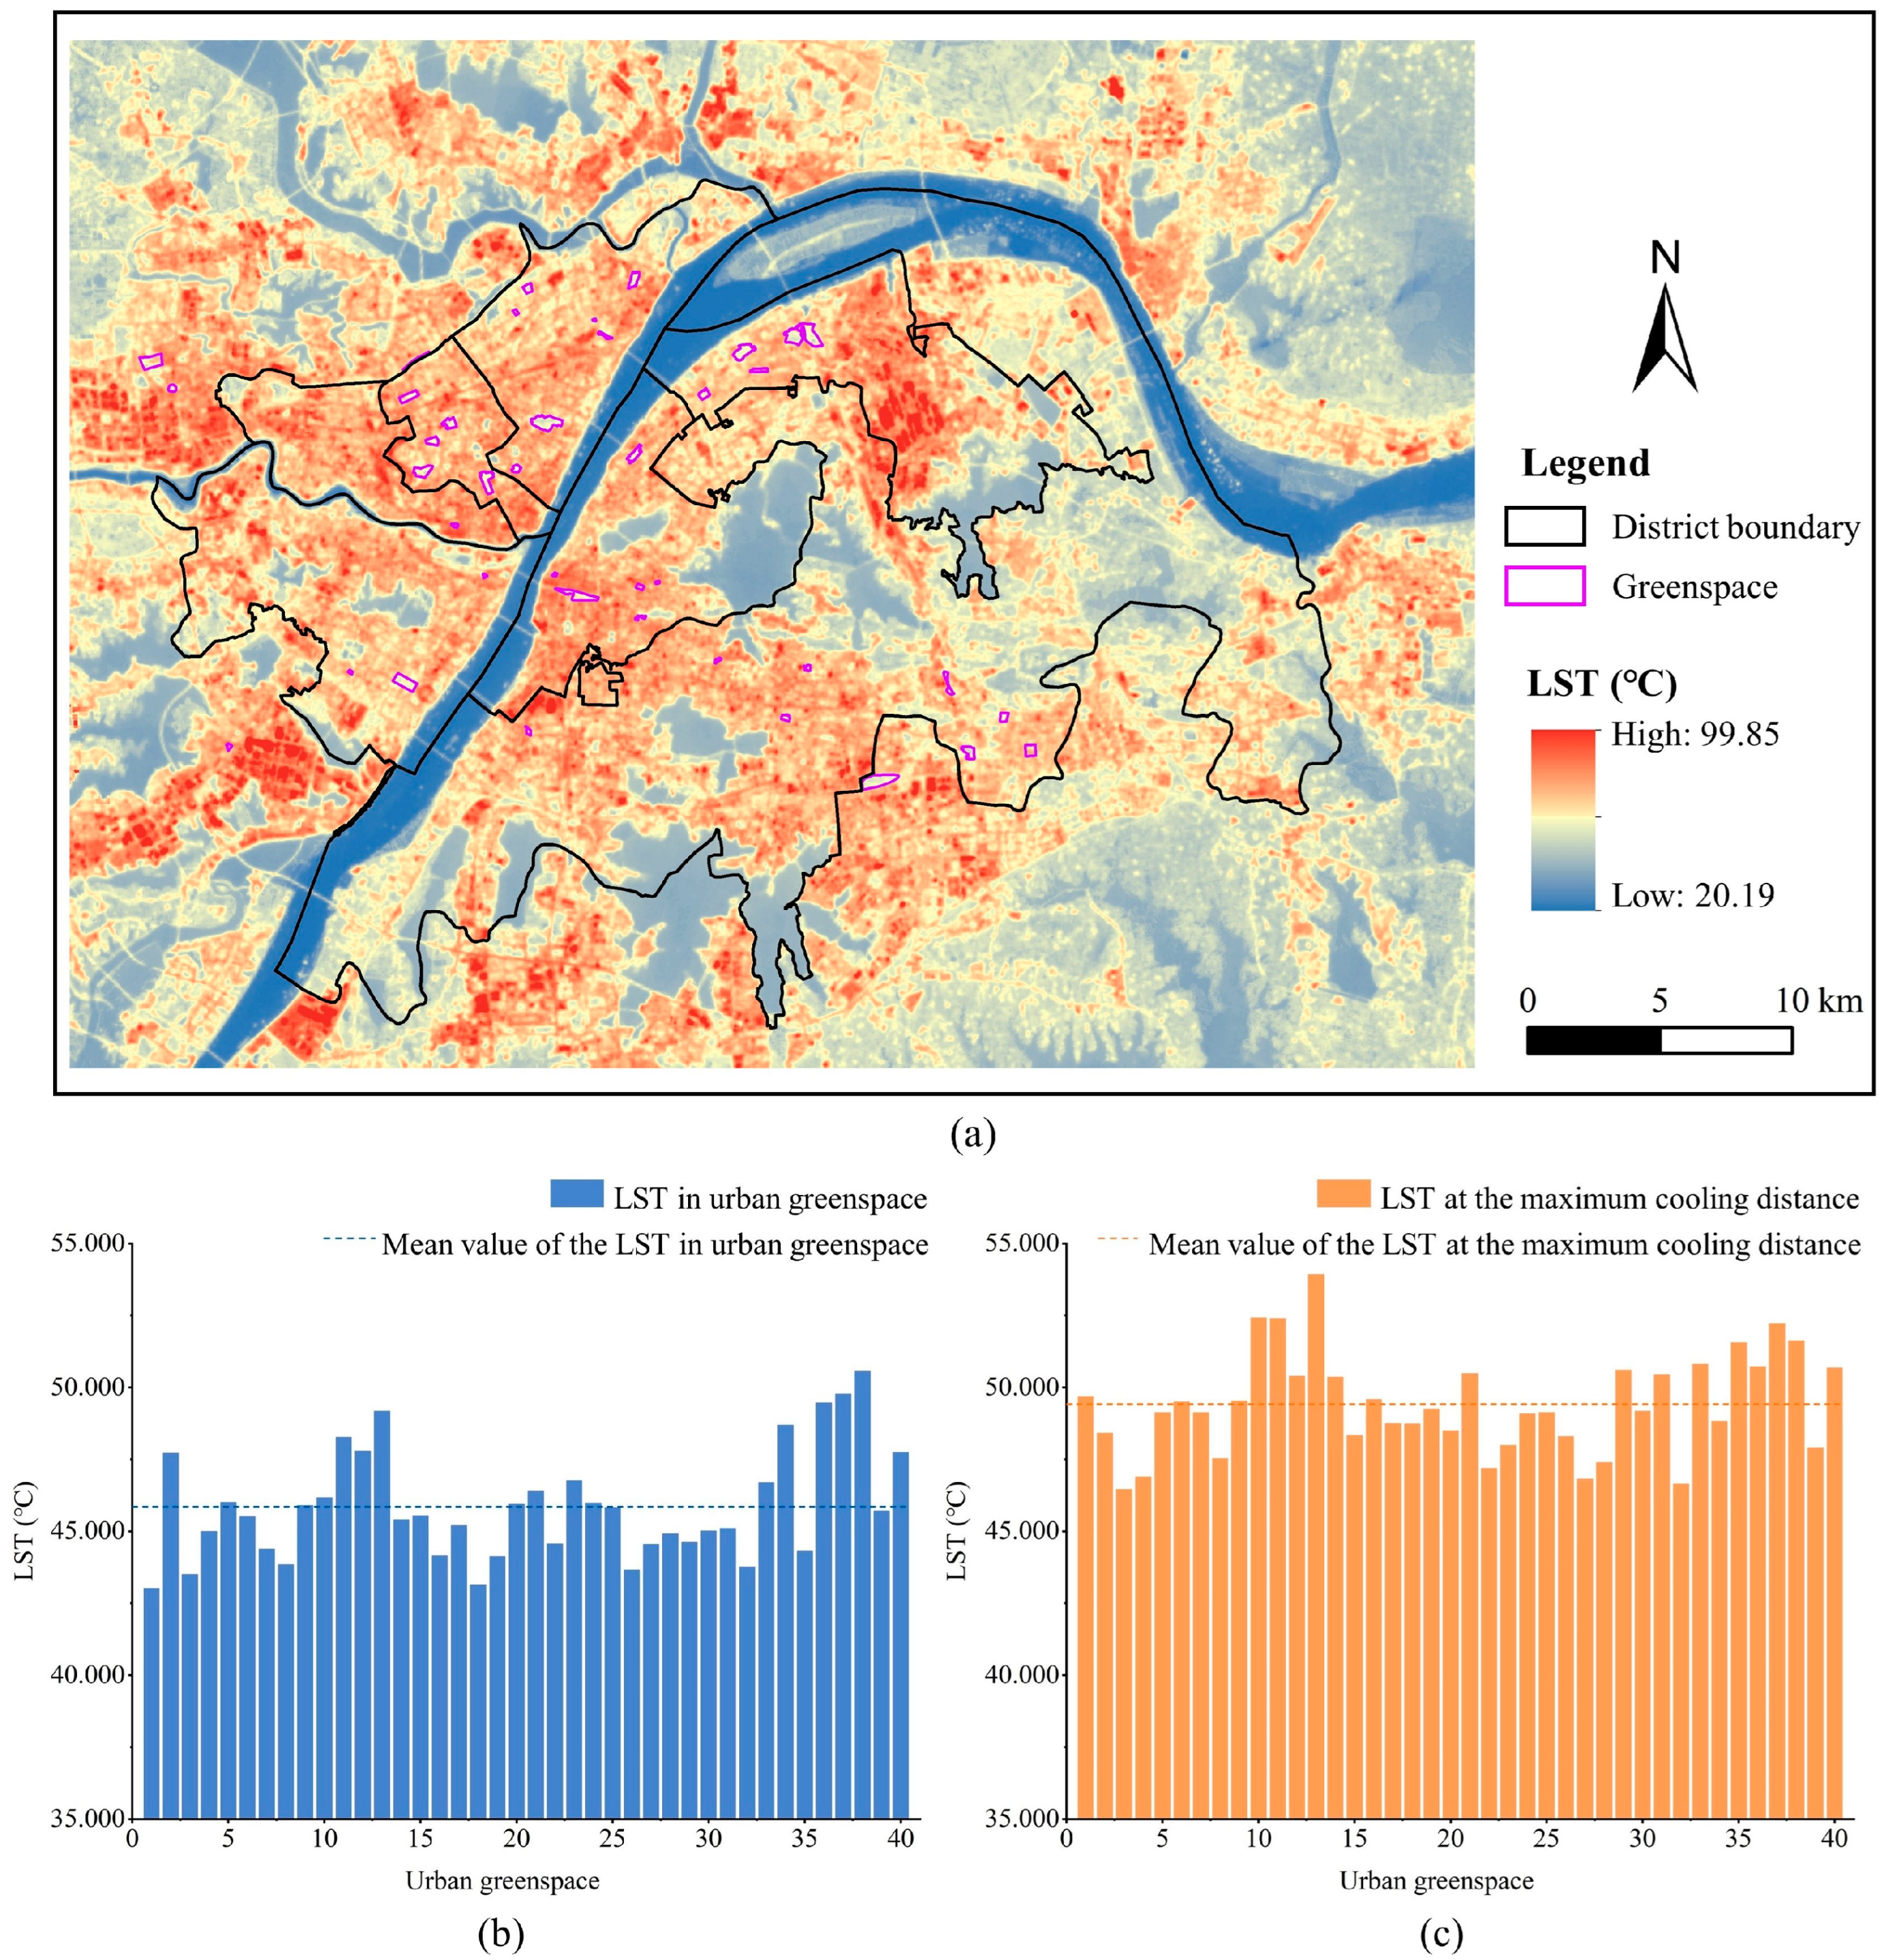
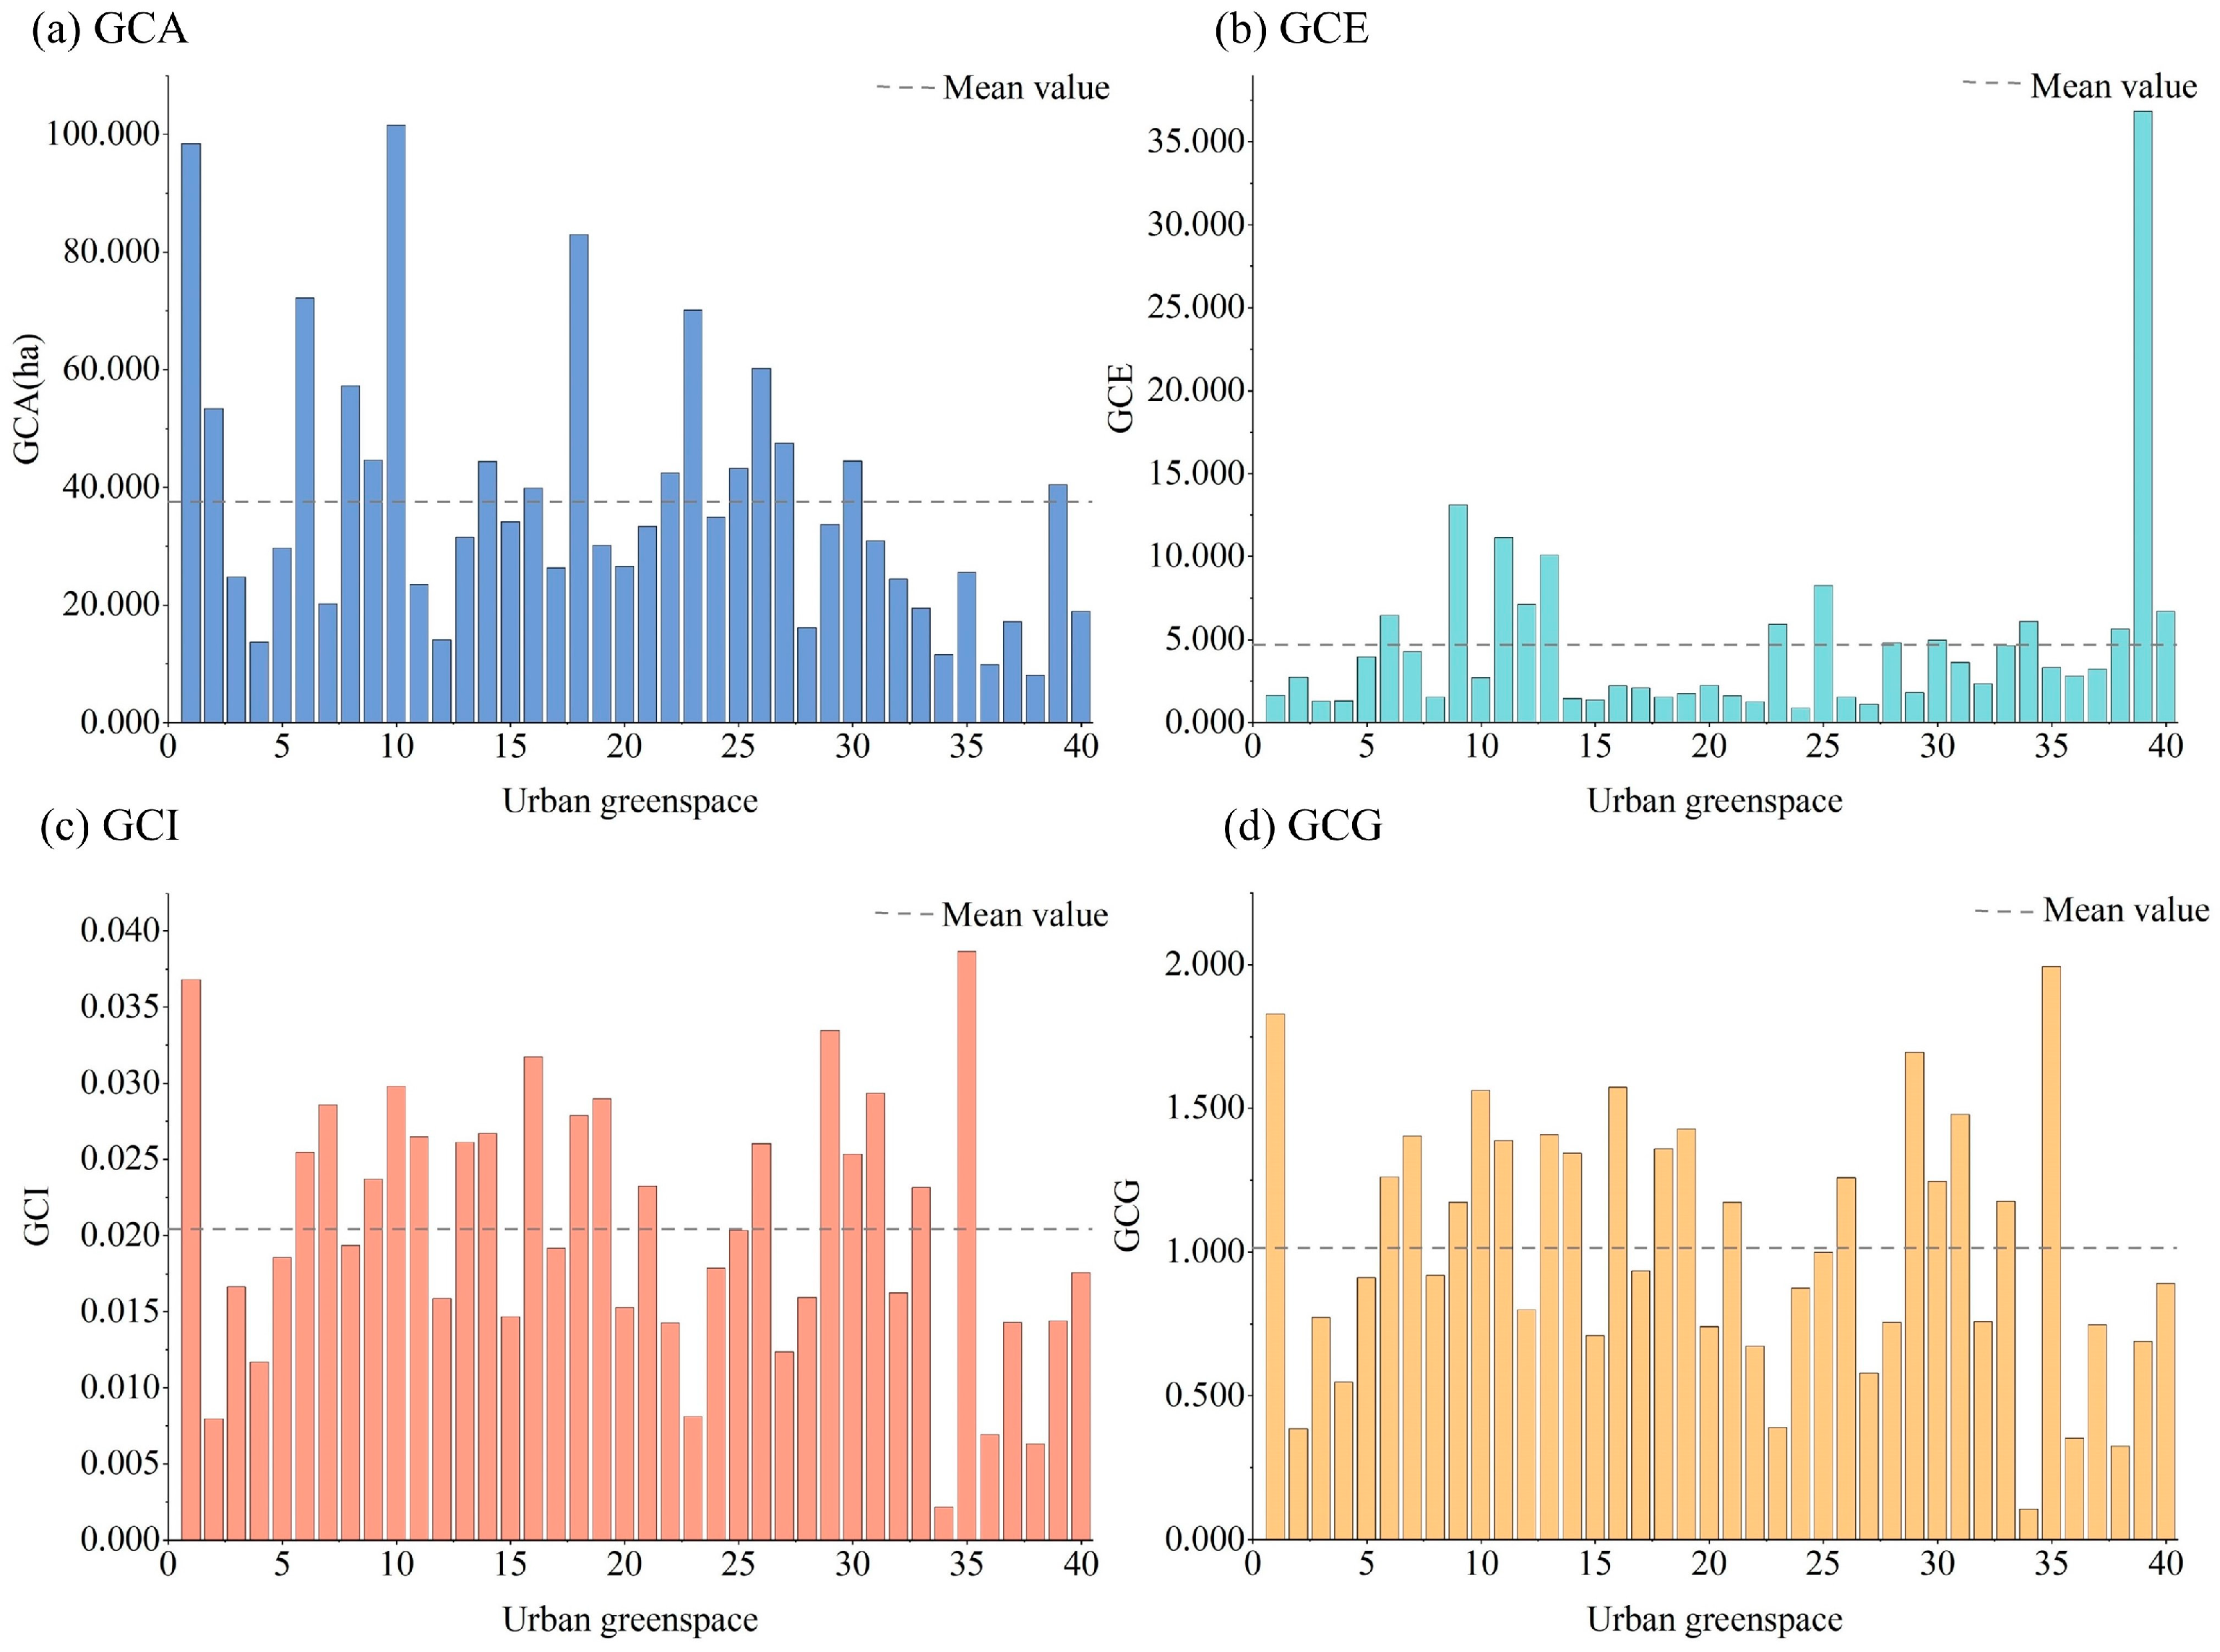
4.1. Cooling Effects of Urban Greenspace

As shown in Figure 6a, the 40 selected urban greenspaces were cooler than their surrounding areas, indicating that all the greenspaces exhibit significant cooling effects. The LST within the greenspaces in this study ranged from 43.008 to 50.556 °C, with an average of 45.844 °C (Figure 6b). The average R-squared (R2) value of the cubic polynomial function used to establish the distance-LST relationship was 0.963. The LST at the first turning point, which represents the maximum cooling distance, ranged from 46.458 to 53.917 °C, as determined from each fitted curve. Additionally, both the initial LST values and the extent of LST reduction in surrounding areas varied across the different greenspaces.
The results of the four indexes characterizing the cooling effects of urban greenspace are shown in Figure 7. It can be found that these indexes differed among urban greenspaces. The average values of GCA, GCE, GCI, and GCG were 37.544 ha, 4.682, 0.020, and 1.015, respectively. These values ranged from 8.113 to 101.607 ha for GCA, 0.861 to 36.858 for GCE, 0.002 to 0.039 for GCI, and 0.106 to 1.993 for GCG. In general, the cooling indexes from the maximum perspective, i.e., GCA and GCE, exhibited opposite characteristics. Specifically, urban greenspaces with a larger GCA tended to have a smaller GCE. In contrast, the cooling indexes from the accumulative perspective, i.e., GCI and GCG, presented more consistent characteristics. In our study, the urban greenspace with the largest of both these two cooling indexes was Wujiashan Park (no. 35).

4.2. Factors Influencing Cooling Effects of Urban Greenspace

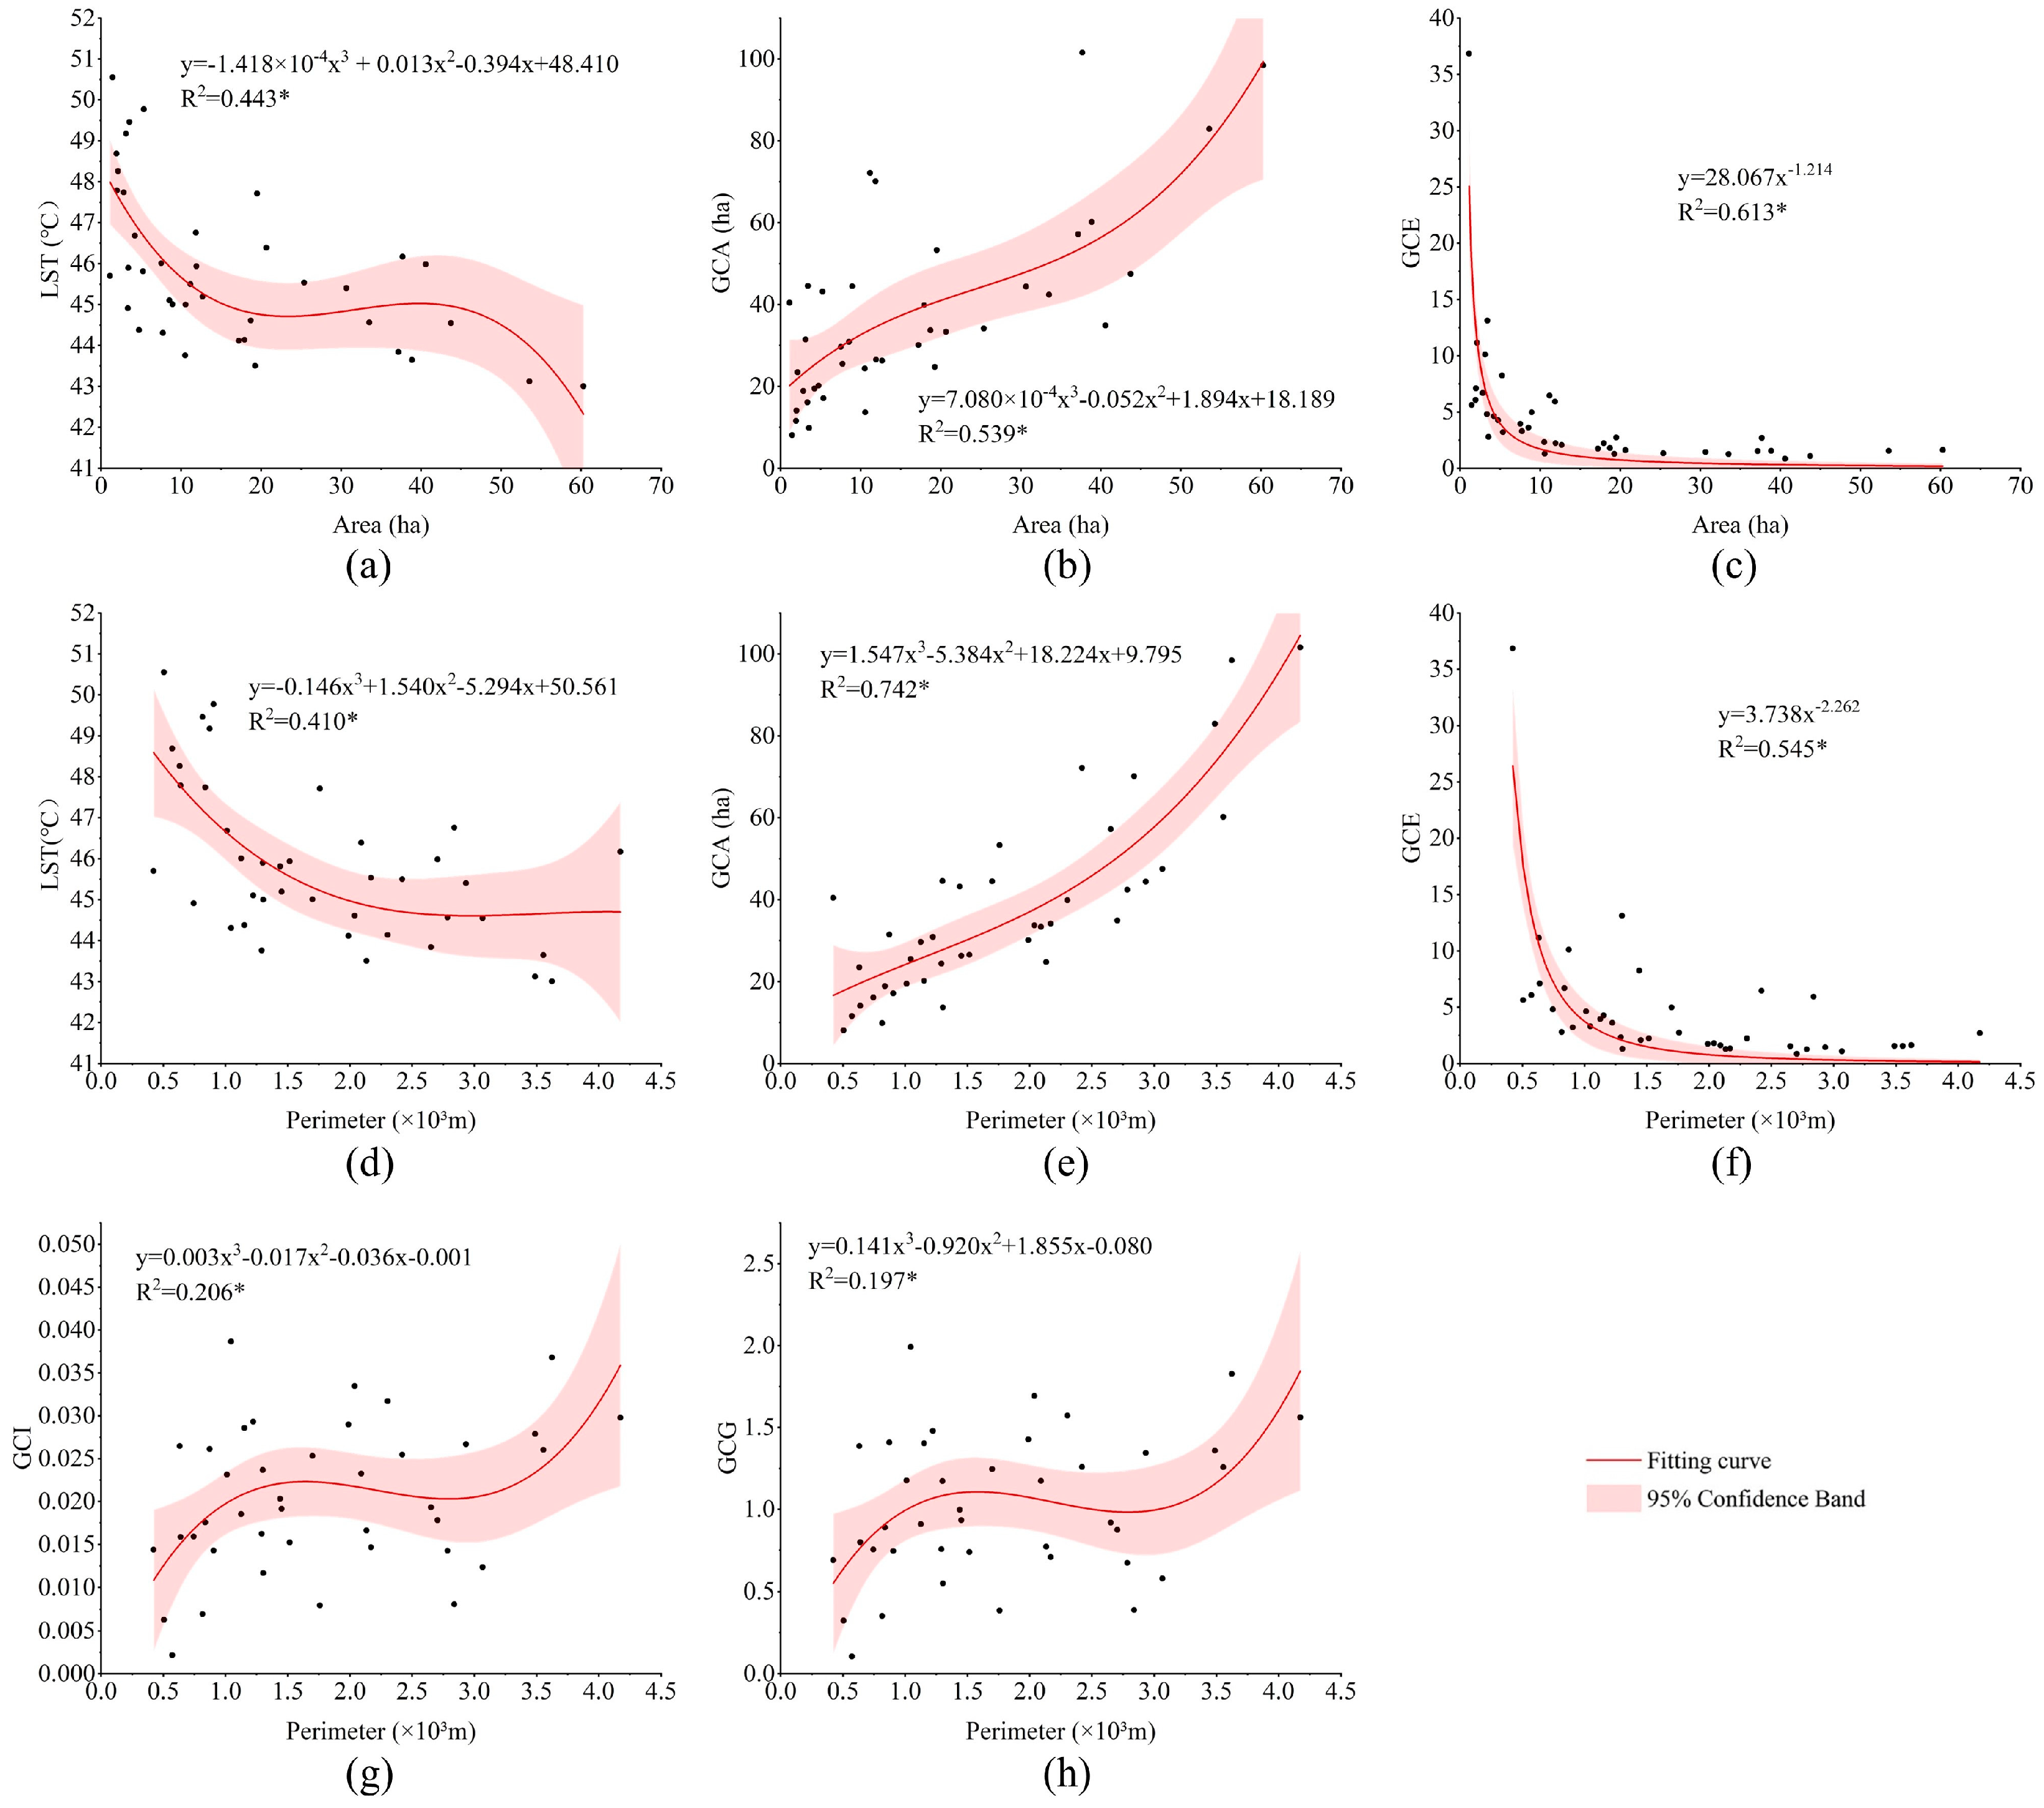
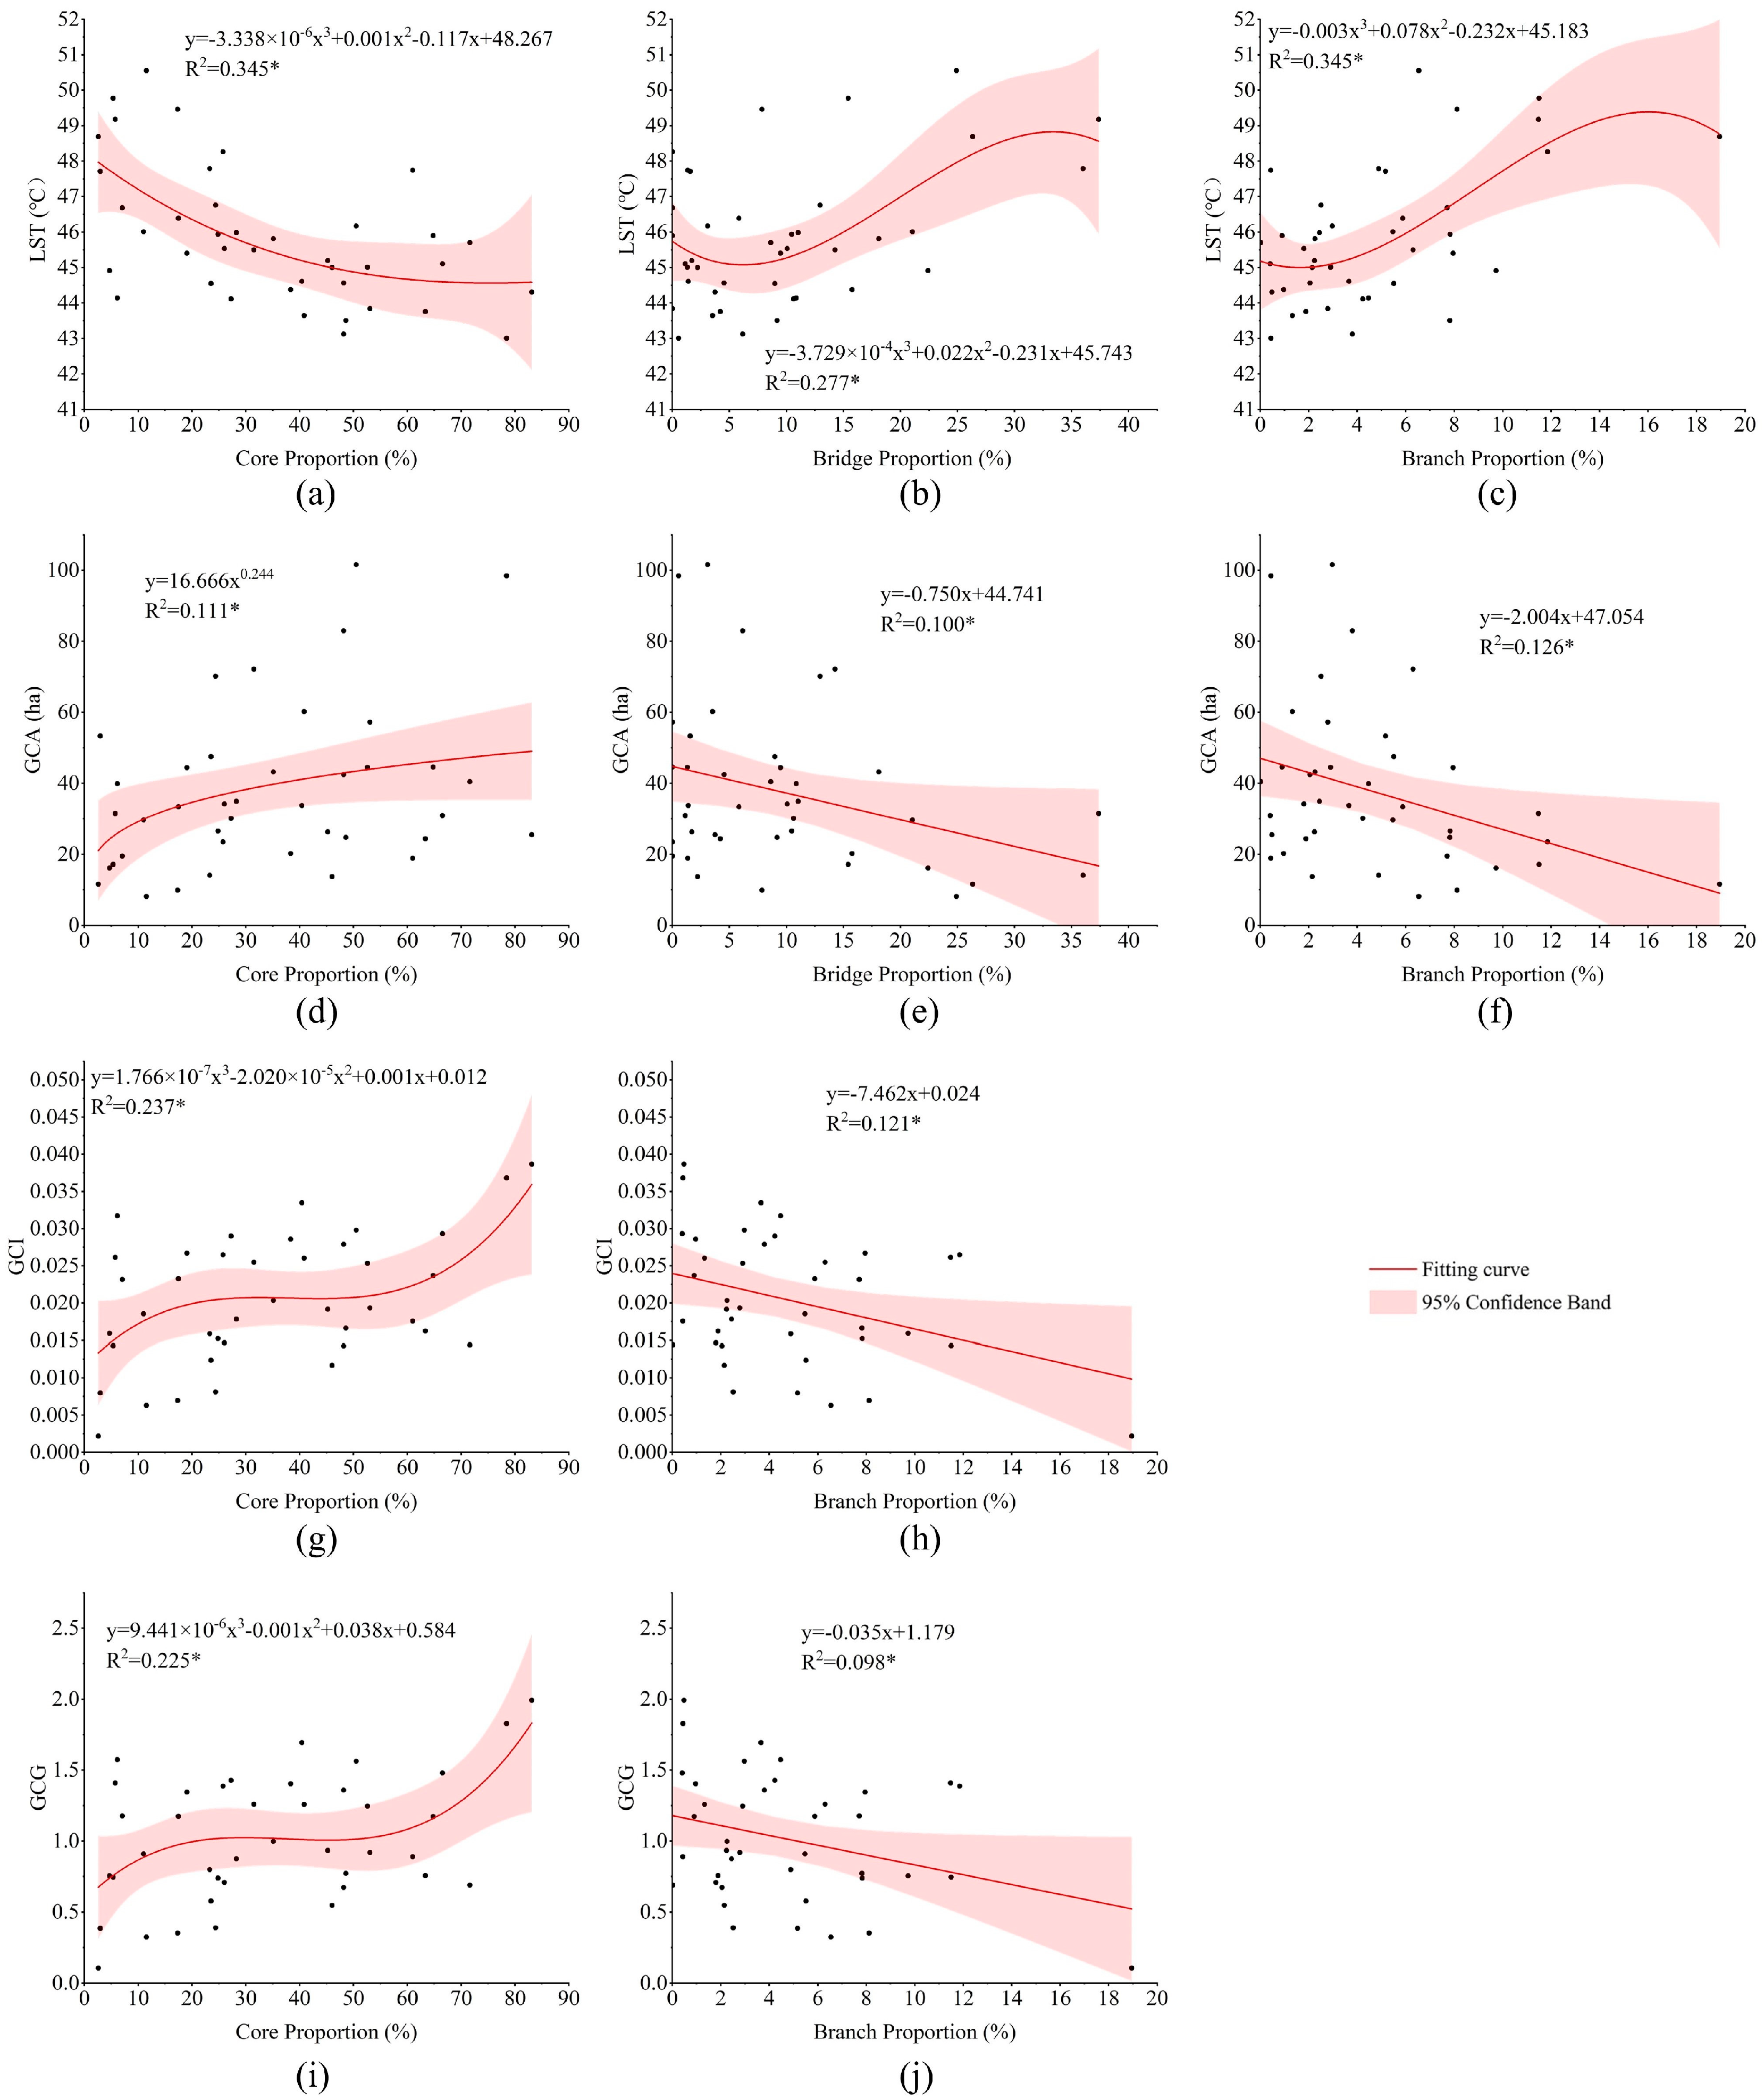
4.2.1. Relationship Between Potential Factors and Cooling Effects

Figure 8 shows the Pearson correlation analysis results between selected potential factors and the LST of greenspace, along with four cooling indexes. Among the factors commonly used as the scale and landscape composition, significant negative correlations were observed between the LST and Area, Perimeter, VegPer, and WaterPer. The curve fitting results demonstrated diminishing returns as Area and Perimeter increased (Figure 9a,d). GCA positively correlated with Area, Perimeter, and LSI, indicating that larger or more complex-shaped greenspace tended to have larger cooling ranges and areas. Conversely, GCE negatively correlated with Area and Perimeter (Figure 8). The fitted curves revealed a power function relationship, where GCE decreased rapidly with increasing Area and Perimeter but plateaued at certain thresholds (Figure 9c,f). In addition, both GCI and GCG increased dramatically with a perimeter below 1500 m, slightly decreased above this threshold, and then increased again when the perimeter exceeded 3000m (Figure 9g,h).
For the morphological spatial pattern factors, a significant negative correlation was observed between the LST of urban greenspace and core proportion, and the fitted curve revealed a gradual moderation in LST decrease with increasing core proportion (Figure 10a). Conversely, the LST of urban greenspace exhibited a positive correlation with bridge proportion and branch proportion, suggesting that the higher the proportion of the bridge and branch area, the higher the LST. The fitted curves showed an initial increase followed by a decrease in LST with increasing bridge proportion and branch proportion (Figure 10b,c). GCA demonstrated a positive correlation with core proportion and a negative correlation with bridge proportion and branch proportion. As shown in Figure 10d,f, with an increase in core proportion and decreases in bridge proportion and branch proportion, GCA exhibited a relatively steady upward trend. Notably, GCE exhibited no significant correlation with any morphological spatial pattern factors. Additionally, both GCI and GCG, defined from an accumulative perspective, showed a positive correlation with core proportion and a negative correlation with branch proportion. Interestingly, GCG and GCI showed varying trends based on core proportion: they increased when core proportion was less than 20%, plateaued around 20–55%, and then significantly increased beyond 55% (Figure 10g,i). Conversely, GCI and GCG tended to decrease at a relatively stable rate with increasing branch proportion, implying that greater dispersion in greenspace morphology with additional branches reduces the cooling effect (Figure 10h,j).
The results also showed that surrounding environmental characteristics, apart from Buffer_BH, influenced the cooling effects of urban greenspace. LST of greenspace exhibited a significant negative correlation with Buffer_Veg, decreasing gradually as Buffer_Veg increased, though at a slower rate (Figure 11a). Buffer_Impervious was significantly positively correlated with the LST of greenspace, with a notable surge observed when Buffer_Impervious exceeded 70% (Figure 11b). Furthermore, GCA was negatively correlated with the Buffer_Impervious, indicating a steady decrease in GCA with increasing Buffer_Impervious, despite being fitted as a power function (Figure 11c). Conversely, GCE showed no correlation with these factors. Both GCI and GCG positively correlated with Buffer_BCR, with two cooling indexes steadily increasing as Buffer_BCR increased (Figure 11d,e). Hence, we could infer that higher Buffer_BCR values correspond to a greater ratio of the reduced LST to the surrounding LST, leading to a more intense cooling process (i.e., the greater GCI and GCG).

4.2.2. Effects of Potential Factors on Cooling Effects

Table 3 presents the results of the multiple stepwise regression analysis, through which we identified the major factors influencing urban greenspace’s LST and four cooling indexes. The results revealed that different influencing factors were selected into these regression models, collectively explaining 65.3% (LST), 75.9% (GCA), 26.5% (GCE), 44.4% (GCI), and 43.0% (GCG) of the variation, respectively. Specifically, the LST of urban greenspace was determined by core proportion, WaterPer, Perimeter, and Buffer_Impervious, with core proportion exerting the most significant influence on decreasing LST. GCA variation was primarily explained by Land Surface Index (LSI) and urban greenspace area, with the largest coefficient of determination (R2) observed in this regression model; conversely, the variation in GCE was the least explained, as indicated by the lowest coefficient of determination (R2) in the regression model. This cooling index was primarily explained by perimeter and VegPer. Regarding GCI and GCG, both indexes were influenced by core proportion, Buffer_BCR, and WaterPer, with core proportion making the largest relative contribution to GCI and GCG. This suggested that an increase in core proportion most significantly affected the increase in GCI and GCG.

4.3. Various Cooling Bundles of Urban Greenspace

The cluster analysis classified the 40 urban greenspace samples into five distinct cooling bundles based on their own LST and four cooling indexes (Figure 12). Further examination and comparison of the potential influencing factors within different cooling bundles identified dominant factors influencing varied cooling effects (Figure 13).
Bundle 1: Exhibited the most significant cooling effects with the lowest LST, dominated by GCA, GCI, and GCG, while GCE showed poor performance. Notably, Bundle 1 featured the largest area, perimeter, and LSI, alongside a high core proportion (59.028%) and minimal bridge and branch proportions (3.265% and 2.403%, respectively). This bundle typically consisted of large ecological parks.
Bundle 2: Characterized by dominance in GCI and GCG, with a balanced distribution of other indexes. Both GCI and GCG indicated a strong cooling effect on the surroundings, enhancing thermal comfort for residents. Greenspace in this bundle was smaller in scale but had a larger LSI, relatively higher vegetation coverage, the highest percentage of water bodies (8.061%), and a higher building coverage ratio in the surrounding environment. Bundle 2 was the most numerous and widely distributed, primarily comprising medium-scale ecological greenspace situated around high-density built-up areas, which could provide a more profound cooling sensation for neighboring residents.
Bundle 3: Featured low cooling indexes but effective internal LST reduction. Across all five bundles, this bundle of urban greenspace exhibited a larger scale (second to Bundle 1) but had the lowest average percentage of vegetation coverage (68.659%). These greenspaces were predominantly large-scale parks with specific themes to meet the needs of urban residents for popular science, cultural education, or recreation, such as Matoutan Cultural Heritage Park (no. 24).
Bundle 4: Characterized by high LST and relatively low cooling indexes, indicating ineffective cooling effects. This bundle primarily consisted of small-scale greenspace with the lowest percentage of vegetation coverage, absence of water bodies, and the lowest core proportion (20.189%), while exhibiting the highest bridge and branch proportion (18.642% and 8.405%, respectively) (Figure 13). The surroundings had the lowest proportion of vegetation and the highest proportion of impervious surface, implying that such greenspace may be predominantly located in dense urban areas. Most of these greenspaces were small-scale theme parks or squares within the city, such as Hongshan Square (no. 37) and Fuhu Mountain Martyrs’ Cemetery (no. 40).
Bundle 5: Dominated by GCE, with only one greenspace (Baibuting Fertility Culture Garden) in our study. Its GCE was exceptionally high, while all other cooling indexes were extremely low, indicating the highest cooling efficiency with a cooling area significantly larger than its own area. As shown in Figure 13, this greenspace had the smallest area and perimeter, the highest percentage of vegetation coverage, the highest core proportion (71.629%), and the highest proportion of vegetation coverage in the surroundings (32.824%).

5. Discussion

5.1. The Diverse Cooling Effects and Driving Factors

Quantifying cooling effects of urban greenspace is the basis for greenspace planning and design to mitigate the UHI effect [23,43]. Previous research has suggested that it is inadequate to quantify the cooling effect from a single perspective due to uncertainties introduced by the complex interactions between internal and external characteristics affecting cooling effects [26]. We applied two maximum-perspective cooling indexes (GCA and GCE) and two accumulative-perspective cooling indexes (GCI and GCG), observing significant variations. This result confirms that urban greenspace exhibits a cooling island effect, with cooling effects varying across different types of greenspace [24,26,35]. Although our study found a relatively lower GCA (37.544 ha) and higher GCG (1.015) compared to studies in Shenzhen [24], Fuzhou [26], and Xi’an [28], these differences could potentially be attributed to variations in local climatic conditions and sample selection [68].
Our study further explored the impacts of both internal and external landscape patterns on the cooling effects of urban greenspace. While many studies have investigated the effects of landscape patterns on cooling, few have focused on the multi-dimensional factors of urban greenspace, particularly the detailed morphological spatial pattern of greenspace and the 3D characteristics of surrounding landscapes [28,29,31,50]. Consistent with prior research [24,26,35,40,66], our results revealed significant non-linear correlations between the area and perimeter of urban greenspace and cooling indexes. Specifically, as greenspace size increases beyond certain thresholds, the reduction in LST slows down and GCE diminishes, while GCI and GCG increase at a slower rate. To optimize cooling efficacy in an economically viable way, thresholds of approximately 1500 m for the perimeter are recommended. Additionally, this study highlighted the significant cooling impact of external environmental characteristics, which aligns with findings from previous studies [29,50,67]. We observed a positive correlation between the proportion of impervious surfaces and LST of greenspace and a negative correlation with GCA (Table 3). Higher LST in surrounding areas is attributed to the lower heat capacity and faster heat absorption of impervious surfaces, which enhance energy exchange with greenspace, thus increasing LST and reducing effective cooling areas [67]. Moreover, our study found a positive correlation between the building coverage ratio in the surroundings and both GCI and GCG, suggesting that areas with more buildings may experience stronger accumulative cooling effects from greenspace. This is similar to previous research indicating that neighborhood parks located near high-density urban areas exhibit the strongest accumulative cooling effects [28]. This may be because baseline LST tends to be higher in such areas due to the urban heat island effect, which in turn makes greenspace introduced in these areas produce more significant accumulative cooling effects. Additionally, shading from surrounding buildings may reduce solar radiation on greenspace, thereby enhancing its cooling capacity by lowering temperature [50,69,70]. Moreover, buildings alter the local energy balance, promoting heat exchange and absorption by greenspace, which intensifies its cooling effect.
More importantly, our study introduced morphology as a quantitative element to characterize urban greenspace spatial patterns and highlighted the significant role of core, bridge, and branch proportions in enhancing cooling capacity. Higher core proportions were associated with decreased LST and increased GCA, GCI, and GCG (Figure 10). Moreover, our results indicated that the core proportion was a more significant factor influencing cooling effects compared to the total vegetation area proportion, aligning with the findings of Lin et al. [31]. Core areas, with compact patches and taller canopies, enhance spatial exchanges and evapotranspiration more effectively than other morphological components, such as islet areas. This is primarily due to their higher vegetation density and larger canopy coverage, which includes plants with wide canopies that block solar radiation and reduce heat absorption by neighboring surfaces. At the same time, these areas promote evapotranspiration, further enhancing cooling effects. Additionally, core areas modify local microclimates by altering wind patterns, boosting their cooling capacity [31,53]. Conversely, bridge and branch areas within urban greenspace increased LST and reduced GCA, GCI, and GCG. While these areas enhance the connectivity of greenspace patches, their narrow corridors exposed to impervious surfaces likely diminish cooling capacity [53]. Additionally, an increase in bridge and branch areas reduces the core area, further lowering the overall cooling effects. Other MSPA categories showed no significant cooling impact, unlike previous studies that found islet, perforation, and loop densities significantly reduce LST at the grid scale [31]. This discrepancy may be attributed to the relatively low proportions of these areas in our study. Moreover, islets within greenspace are typically small and fragmented, which likely limits their cooling potential. Perforation and loop areas, located in the interior of greenspace and acting as internal boundaries and corridors (Figure 4), may have minimal influence on surrounding LST due to their limited interaction with the external environment, which is in line with the explanations proposed in previous studies [53].

5.2. Implications for Urban Greenspace Planning and Optimization

Urban greening is a multi-stage, multi-dimensional, and multi-level process that requires comprehensive consideration and coordination from the initial design phase rather than being an afterthought [28]. It is critical to understand and differentiate among urban greenspace the diverse cooling effects of greenspace with varying landscape characteristics, which could provide comprehensive insights for urban planners to implement appropriate design regulations and cooling interventions to mitigate the UHI effect [28,29]. Our study showed that the cooling effect of greenspace varies depending on different perspectives, with individual cooling indexes responding differently to potential factors. Hence, solely focusing on enhancing the cooling effect from a single perspective or optimizing specific aspects based on individual influencing factors may not fully maximize their cooling effectiveness [71]. Planners should leverage the strengths and landscape characteristics of urban greenspace based on actual cooling needs, aiming to achieve optimal cooling effects within the limited land resources while maintaining a balance between multiple cooling indexes [35,41,72].
Moreover, with limited space in densely populated urban centers, it is crucial to optimize the design of urban greenspace to achieve cost-effective cooling outcomes [45,46,73,74]. While existing studies have primarily focused on vegetation coverage or landscape configuration, our findings highlighted the critical impact of the core area proportion on enhancing cooling effectiveness, even surpassing that of vegetation coverage. For urban greenspace design at patch scale, especially when spatial location and boundaries are predefined, merely increasing greenspace coverage may not yield optimal cooling outcomes. Instead, optimizing greenspace morphology, particularly by increasing core patches within greenspace, can significantly boost cooling ability. Our results revealed that the proportion of core area within urban greenspace plays a pivotal role in cooling effects, with a threshold of approximately 55% core proportion identified as crucial for maximizing cooling efficiency. Beyond this threshold, the cooling effect appears to improve significantly, suggesting that increasing the core proportion of greenspaces is key to optimizing their cooling benefits. This threshold serves not only as a critical factor in understanding cooling potentials but also provides actionable insights for urban planning, particularly in areas where land is scarce.
In densely developed urban cores with limited available land, such as high-end business districts or old districts, small-scale greenspace with abundant vegetation and a high core proportion provide the best cooling efficiency with minimal investment [24,35]. Achieving a core proportion above 55% may be challenging in such areas due to competing land uses, but even modest increases in core proportion can significantly enhance cooling effects. Strategic planning and design can enable these areas to reach near-optimal core proportions, fostering localized cooling benefits while accommodating urban development. Conversely, in areas with more available space and high cooling demands, such as urban fringe areas or new development zones, larger-scale greenspace or eco-parks may be better suited to achieve and exceed the 55% core proportion threshold. In these settings, planners can prioritize maximizing the core area within greenspace to achieve more effective mitigation of the UHI effect. In high-density zones, medium-scale ecological greenspace can provide significant localized cooling benefits, potentially enhanced by integrating water bodies to optimize cooling synergy [67]. However, achieving a high core proportion in these areas may require innovative design strategies, as maintaining large contiguous green areas might conflict with urban development pressures. Thus, while the 55% threshold serves as a valuable guideline, its application should be tailored to local contexts, considering factors like land availability, urban function, and ecological goals, with the optimal core proportion balancing cooling benefits and urban development needs. Also, the 55% core area threshold identified in this study is based on Wuhan’s specific greenspace characteristics. This threshold serves as a guideline for Wuhan’s urban planning, so it may vary in other cities depending on local conditions such as land availability, climate, and greenspace types.

5.3. Limitations and Future Research

There are several limitations in this study. First, this study quantified the cooling effects of greenspace based on a single remote sensing image during the daytime in summer. However, LST may vary across different periods and conditions, potentially introducing uncertainties in the outcomes. Furthermore, given the significant seasonal variations reported by previous studies [73], future research could incorporate multiple images across seasons to better capture temporal dynamics and provide a more comprehensive understanding of greenspace cooling. Second, the study did not delve into the effects of vegetation types and species composition on cooling performance. Investigating these factors in future studies could offer valuable insights for optimizing greenspace design. Third, while this study used a fine-grained dataset with a resolution of 1 m, uncertainties related to data accuracy, land cover classification, and manual corrections (e.g., using Google Earth images) may introduce potential subjectivity or errors. These factors should be considered when interpreting the results. Lastly, previous studies consistently indicate that the cooling effect achieved by coupling with water bodies surpasses that of greenspace alone [40,75,76]. However, as our study focused solely on greenspace cooling effects, the potential combined cooling effects of blue-green spaces were not explored. Future research could investigate key variables, such as the proximity of water bodies to greenspace and water type, to better understand the synergistic cooling effects of blue-green spaces and enhance mitigation strategies for the UHI effect.

6. Conclusions

A comprehensive understanding of the cooling effects of urban greenspace and factors affecting its effectiveness is crucial for optimizing greenspace design to maximize its cooling capacity, particularly in urban areas where land resources are scarce. This study provides insights into the cooling effects of urban greenspace and the impact of various potential factors, offering a framework for optimizing greenspace design in urban environments. The main findings of this study are: (1) urban greenspaces exhibited varied cooling effects, with significant relationships between spatial characteristics and cooling outcomes; (2) the area and perimeter of greenspaces influenced cooling effects in a non-linear manner; (3) the morphological spatial pattern of greenspace, particularly the core proportion, were key determinants of its cooling effects, with proportions above 55% being most beneficial; and (4) surrounding environmental factors such as impervious surfaces and building coverage also significantly affected cooling capacities.
The methodology employed in this research, especially MSPA-based methodology, can be extended to other cities, offering a flexible framework for assessing greenspace cooling effects and exploring the impact of both internal and external landscape patterns under varying urban conditions. However, the specific results may vary across regions due to differences in vegetation types, climatic conditions, and urban morphology. Therefore, the application of these findings may require localized adjustments to account for regional variations in environmental and urban factors.
In conclusion, this study advances our understanding of how urban greenspace can be optimized to enhance cooling effects and can also guide urban planning strategies aimed at mitigating the UHI effect and provide actionable insights for policymakers to optimize urban greenspaces for greater cooling benefits.

Author Contributions

Conceptualization, L.T.; Data curation, L.T.; Formal analysis, L.T.; Funding acquisition, Q.Z.; Investigation, L.T.; Methodology, L.T.; Project administration, Q.Z.; Resources, Q.Z.; Software, L.T.; Supervision, Q.Z., H.L. and Y.F.; Validation, L.T.; Visualization, L.T.; Writing—original draft, L.T.; Writing—review and editing, L.T., H.L. and Y.F. All authors have read and agreed to the published version of the manuscript.

Funding

This research was funded by the National Natural Science Foundation of China (Grant numbers 52078389 and 52308079).

Data Availability Statement

Data are available with the corresponding author and can be shared upon reasonable request.

Conflicts of Interest

The authors declare no conflicts of interest.

Abbreviations

The following abbreviations are used in this manuscript:
UHIUrban Heat Island
MSPAMorphological Spatial Pattern Analysis
LSTLand Surface Temperature
GCAGreenspace Cooling Area
GCEGreenspace Cooling Efficiency
GCIGreenspace Cooling Intensity
GCGGreenspace Cooling Gradient

References

  1. Estoque, R.C.; Ooba, M.; Seposo, X.T.; Togawa, T.; Hijioka, Y.; Takahashi, K.; Nakamura, S. Heat health risk assessment in Philippine cities using remotely sensed data and social-ecological indicators. Nat. Commun. 2020, 11, 1581. [Google Scholar] [CrossRef] [PubMed]
  2. Lin, P.; Lau, S.S.Y.; Qin, H.; Gou, Z. Effects of urban planning indicators on urban heat island: A case study of pocket parks in high-rise high-density environment. Landsc. Urban Plan. 2017, 168, 48–60. [Google Scholar] [CrossRef]
  3. Intergovernmental Panel on Climate Change (IPCC). AR6 Synthesis Report: Climate Change 2023. Available online: https://www.ipcc.ch/report//ar6/syr/ (accessed on 11 February 2025).
  4. Liu, H.; He, B.; Gao, S.; Zhan, Q.; Yang, C. Influence of non-urban reference delineation on trend estimate of surface urban heat island intensity: A comparison of seven methods. Remote Sens. Environ. 2023, 296, 113735. [Google Scholar] [CrossRef]
  5. Oke, T.R.; Mills, G.; Christen, A.; Voogt, J.A. (Eds.) Urban Climates; Cambridge University Press: Cambridge, UK, 2017. [Google Scholar]
  6. Egide, K.; Sulaiman, F.; Mabano, A.; Lamek, N.; Gabriel, H. Temperature and air pollution relationship during heatwaves in Birmingham, UK. Sustain. Cities Soc. 2018, 43, S488546019. [Google Scholar]
  7. Grimm, N.B.; Faeth, S.H.; Golubiewski, N.E.; Redman, C.L.; Wu, J.; Bai, X.; Briggs, J.M. Global Change and the Ecology of Cities. Science 2008, 319, 756–760. [Google Scholar] [CrossRef] [PubMed]
  8. Hondula, D.M.; Georgescu, M.; Balling, R.C. Challenges associated with projecting urbanization-induced heat-related mortality. Sci. Total Environ. 2014, 490, 538–544. [Google Scholar] [CrossRef] [PubMed]
  9. Liu, H.; Huang, B.; Zhan, Q.; Gao, S.; Li, R.; Fan, Z. The influence of urban form on surface urban heat island and its planning implications: Evidence from 1288 urban clusters in China. Sustain. Cities Soc. 2021, 71, 102987. [Google Scholar] [CrossRef]
  10. Sippel, S.; Meinshausen, N.; Fischer, E.M.; Székely, E.; Knutti, R. Climate change now detectable from any single day of weather at global scale. Nat. Clim. Chang. 2020, 10, 35–41. [Google Scholar] [CrossRef]
  11. Li, X.; Zhou, W. Optimizing urban greenspace spatial pattern to mitigate urban heat island effects: Extending understanding from local to the city scale. Urban For. Urban Green. 2019, 41, 255–263. [Google Scholar] [CrossRef]
  12. Tang, L.; Zhan, Q.; Fan, Y.; Liu, H.; Fan, Z. Exploring the impacts of greenspace spatial patterns on land surface temperature across different urban functional zones: A case study in Wuhan metropolitan area, China. Ecol. Indic. 2023, 146, 109787. [Google Scholar] [CrossRef]
  13. Guo, G.; Wu, Z.; Chen, Y. Complex mechanisms linking land surface temperature to greenspace spatial patterns: Evidence from four southeastern Chinese cities. Sci. Total Environ. 2019, 674, 77–87. [Google Scholar] [CrossRef]
  14. Martins, T.A.L.; Adolphe, L.; Bonhomme, M.; Bonneaud, F.; Faraut, S.; Ginestet, S.; Michel, C.; Guyard, W. Impact of Urban Cool Island measures on outdoor climate and pedestrian comfort: Simulations for a new district of Toulouse, France. Sustain. Cities Soc. 2016, 26, 9–26. [Google Scholar] [CrossRef]
  15. Santamouris, M.; Ban-Weiss, G.; Osmond, P.; Paolini, R.; Synnefa, A.; Cartalis, C.; Muscio, A.; Zinzi, M.; Morakinyo, T.E.; Ng, E.; et al. Progress in urban greenery mitigation science—Assessment methodologies advanced technologies and impact on cities. J. Civ. Eng. Manag. 2018, 24, 638–671. [Google Scholar] [CrossRef]
  16. Shi, Y.; Zhao, S. Discover the desirable landscape structure for mitigating urban heat: The urban-rural gradient approach for an ancient Chinese city. Cities 2022, 127, 103737. [Google Scholar] [CrossRef]
  17. Xu, C.; Chen, G.; Huang, Q.; Su, M.; Rong, Q.; Yue, W.; Haase, D. Can improving the spatial equity of urban green space mitigate the effect of urban heat islands? An empirical study. Sci. Total Environ. 2022, 841, 156687. [Google Scholar] [CrossRef] [PubMed]
  18. Yu, Z.; Yang, G.; Zuo, S.; Jørgensen, G.; Koga, M.; Vejre, H. Critical review on the cooling effect of urban blue-green space: A threshold-size perspective. Urban For. Urban Green. 2020, 49, 126630. [Google Scholar] [CrossRef]
  19. Hoyano, A. Climatological uses of plants for solar control and the effects on the thermal environment of a building. Energy Build. 1988, 11, 181–199. [Google Scholar] [CrossRef]
  20. Shashua-Bar, L.; Pearlmutter, D.; Erell, E. The influence of trees and grass on outdoor thermal comfort in a hot-arid environment. Int. J. Climatol. 2011, 31, 1498–1506. [Google Scholar] [CrossRef]
  21. Takebayashi, H.; Moriyama, M. Surface heat budget on green roof and high reflection roof for mitigation of urban heat island. Build. Environ. 2007, 42, 2971–2979. [Google Scholar] [CrossRef]
  22. Oke, T.R. The energetic basis of the urban heat island. Q. J. R. Meteorol. Soc. 1982, 108, 1–24. [Google Scholar] [CrossRef]
  23. Wong, N.H.; Tan, C.L.; Kolokotsa, D.D.; Takebayashi, H. Greenery as a mitigation and adaptation strategy to urban heat. Nat. Rev. Earth Environ. 2021, 2, 166–181. [Google Scholar] [CrossRef]
  24. Peng, J.; Dan, Y.; Qiao, R.; Liu, Y.; Dong, J.; Wu, J. How to quantify the cooling effect of urban parks? Linking maximum and accumulation perspectives. Remote Sens. Environ. 2021, 252, 112135. [Google Scholar] [CrossRef]
  25. Vidrih, B.; Medved, S. Multiparametric model of urban park cooling island. Urban For. Urban Green. 2013, 12, 220–229. [Google Scholar] [CrossRef]
  26. Yao, X.; Yu, K.; Zeng, X.; Lin, Y.; Ye, B.; Shen, X.; Liu, J. How can urban parks be planned to mitigate urban heat island effect in “Furnace cities” ? An accumulation perspective. J. Clean. Prod. 2022, 330, 129852. [Google Scholar] [CrossRef]
  27. Yan, L.; Jia, W.; Zhao, S. The Cooling Effect of Urban Green Spaces in Metacities: A Case Study of Beijing, China’s Capital. Remote Sens. 2021, 13, 4601. [Google Scholar] [CrossRef]
  28. Du, C.; Jia, W.; Chen, M.; Yan, L.; Wang, K. How can urban parks be planned to maximize cooling effect in hot extremes? Linking maximum and accumulative perspectives. J. Environ. Manag. 2022, 317, 115346. [Google Scholar] [CrossRef] [PubMed]
  29. Qiu, K.; Jia, B. The roles of landscape both inside the park and the surroundings in park cooling effect. Sustain. Cities Soc. 2020, 52, 101864. [Google Scholar] [CrossRef]
  30. Chen, M.; Dai, F.; Yang, B.; Zhu, S. Effects of urban green space morphological pattern on variation of PM2.5 concentration in the neighborhoods of five Chinese megacities. Build. Environ. 2019, 158, 1–15. [Google Scholar] [CrossRef]
  31. Lin, J.; Qiu, S.; Tan, X.; Zhuang, Y. Measuring the relationship between morphological spatial pattern of green space and urban heat island using machine learning methods. Build. Environ. 2023, 228, 109910. [Google Scholar] [CrossRef]
  32. Cao, X.; Onishi, A.; Chen, J.; Imura, H. Quantifying the cool island intensity of urban parks using ASTER and IKONOS data. Landsc. Urban Plan. 2010, 96, 224–231. [Google Scholar] [CrossRef]
  33. Chang, C.; Li, M.; Chang, S. A preliminary study on the local cool-island intensity of Taipei city parks. Landsc. Urban Plan. 2007, 80, 386–395. [Google Scholar] [CrossRef]
  34. Oliveira, S.; Andrade, H.; Vaz, T. The cooling effect of green spaces as a contribution to the mitigation of urban heat: A case study in Lisbon. Build. Environ. 2011, 46, 2186–2194. [Google Scholar] [CrossRef]
  35. Chen, M.; Jia, W.; Yan, L.; Du, C.; Wang, K. Quantification and mapping cooling effect and its accessibility of urban parks in an extreme heat event in a megacity. J. Clean. Prod. 2022, 334, 130252. [Google Scholar] [CrossRef]
  36. Chen, X.; Su, Y.; Li, D.; Huang, G.; Chen, W.; Chen, S. Study on the cooling effects of urban parks on surrounding environments using Landsat TM data: A case study in Guangzhou, southern China. Int. J. Remote Sens. 2012, 33, 5889–5914. [Google Scholar] [CrossRef]
  37. Cheng, X.; Wei, B.; Chen, G.; Li, J.; Song, C. Influence of Park Size and Its Surrounding Urban Landscape Patterns on the Park Cooling Effect. J. Urban Plan. Dev. 2015, 141. [Google Scholar] [CrossRef]
  38. Feyisa, G.L.; Dons, K.; Meilby, H. Efficiency of parks in mitigating urban heat island effect: An example from Addis Ababa. Landsc. Urban Plan. 2014, 123, 87–95. [Google Scholar] [CrossRef]
  39. Sun, X.; Tan, X.; Chen, K.; Song, S.; Zhu, X.; Hou, D. Quantifying landscape-metrics impacts on urban green-spaces and water-bodies cooling effect: The study of Nanjing, China. Urban For. Urban Green. 2020, 55, 126838. [Google Scholar] [CrossRef]
  40. Yu, Z.; Guo, X.; Jørgensen, G.; Vejre, H. How can urban green spaces be planned for climate adaptation in subtropical cities? Ecol. Indic. 2017, 82, 152–162. [Google Scholar] [CrossRef]
  41. Zhou, Y.; Zhao, H.; Mao, S.; Zhang, G.; Jin, Y.; Luo, Y.; Huo, W.; Pan, Z.; An, P.; Lun, F. Studies on urban park cooling effects and their driving factors in China: Considering 276 cities under different climate zones. Build. Environ. 2022, 222, 109441. [Google Scholar] [CrossRef]
  42. Li, X.; Zhou, W.; Ouyang, Z. Relationship between land surface temperature and spatial pattern of greenspace: What are the effects of spatial resolution? Landsc. Urban Plan. 2013, 114, 1–8. [Google Scholar] [CrossRef]
  43. Zhou, W.; Yu, W.; Wu, T. An alternative method of developing landscape strategies for urban cooling: A threshold-based perspective. Landsc. Urban Plan. 2022, 225, 104449. [Google Scholar] [CrossRef]
  44. Li, X.; Zhou, W.; Ouyang, Z.; Xu, W.; Zheng, H. Spatial pattern of greenspace affects land surface temperature: Evidence from the heavily urbanized Beijing metropolitan area, China. Landsc. Ecol. 2012, 27, 887–898. [Google Scholar] [CrossRef]
  45. Fan, H.; Yu, Z.; Yang, G.; Liu, T.Y.; Liu, T.Y.; Hung, C.H.; Vejre, H. How to cool hot-humid (Asian) cities with urban trees? An optimal landscape size perspective. Agric. For. Meteorol. 2019, 265, 338–348. [Google Scholar] [CrossRef]
  46. Peng, J.; Xie, P.; Liu, Y.; Ma, J. Urban thermal environment dynamics and associated landscape pattern factors: A case study in the Beijing metropolitan region. Remote Sens. Environ. 2016, 173, 145–155. [Google Scholar] [CrossRef]
  47. Yu, Z.; Guo, X.; Zeng, Y.; Koga, M.; Vejre, H. Variations in land surface temperature and cooling efficiency of green space in rapid urbanization: The case of Fuzhou city, China. Urban For. Urban Green. 2018, 29, 113–121. [Google Scholar] [CrossRef]
  48. Zhou, W.; Wang, J.; Cadenasso, M.L. Effects of the spatial configuration of trees on urban heat mitigation: A comparative study. Remote Sens. Environ. 2017, 195, 1–12. [Google Scholar] [CrossRef]
  49. Masoudi, M.; Tan, P.Y. Multi-year comparison of the effects of spatial pattern of urban green spaces on urban land surface temperature. Landsc. Urban Plan. 2019, 184, 44–58. [Google Scholar] [CrossRef]
  50. Han, D.; Xu, X.; Qiao, Z.; Wang, F.; Cai, H.; An, H.; Jia, K.; Liu, Y.; Sun, Z.; Wang, S.; et al. The roles of surrounding 2D/3D landscapes in park cooling effect: Analysis from extreme hot and normal weather perspectives. Build. Environ. 2023, 231, 110053. [Google Scholar] [CrossRef]
  51. Ruiz, M.A.; Colli, M.F.; Martinez, C.F.; Correa-Cantaloube, E.N. Park cool island and built environment. A ten-year evaluation in Parque Central, Mendoza-Argentina. Sustain. Cities Soc. 2022, 79, 103681. [Google Scholar] [CrossRef]
  52. Naeem, S.; Cao, C.; Qazi, W.; Zamani, M.; Wei, C.; Acharya, B.; Rehman, A. Studying the Association between Green Space Characteristics and Land Surface Temperature for Sustainable Urban Environments: An Analysis of Beijing and Islamabad. ISPRS Int. J. Geo-Inf. 2018, 7, 38. [Google Scholar] [CrossRef]
  53. Chen, M.; Dai, F. The influence of urban green spaces on thermal environment based on morphological spatial pattern analysis. Ecol. Environ. Sci. 2021, 30, 125–134. [Google Scholar] [CrossRef]
  54. Soille, P.; Vogt, P. Morphological segmentation of binary patterns. Pattern Recognit. Lett. 2009, 30, 456–459. [Google Scholar] [CrossRef]
  55. Vogt, P.; Ferrari, J.R.; Lookingbill, T.R.; Gardner, R.H.; Riitters, K.H.; Ostapowicz, K. Mapping functional connectivity. Ecol. Indic. 2009, 9, 64–71. [Google Scholar] [CrossRef]
  56. Vogt, P.; Riitters, K. GuidosToolbox: Universal digital image object analysis. Eur. J. Remote Sens. 2017, 50, 352–361. [Google Scholar] [CrossRef]
  57. Zhang, X.; Wang, Y. Spatial and temporal heterogeneity analysis of urban expansion and ecological landscape in rapid urbanization area in central China: A case study of Wuhan city. Resour. Environ. Yangtze Basin 2023, 32, 1583–1593. [Google Scholar]
  58. Dai, L.; Liu, Y.; Luo, X. Integrating the MCR and DOI models to construct an ecological security network for the urban agglomeration around Poyang Lake, China. Sci. Total Environ. 2021, 754, 141868. [Google Scholar] [CrossRef] [PubMed]
  59. Saura, S.; Vogt, P.; Velázquez, J.; Hernando, A.; Tejera, R. Key structural forest connectors can be identified by combining landscape spatial pattern and network analyses. For. Ecol. Manag. 2011, 262, 150–160. [Google Scholar] [CrossRef]
  60. Wei, Q.; Halike, A.; Yao, K.; Chen, L.; Balati, M. Construction and optimization of ecological security pattern in Ebinur Lake Basin based on MSPA-MCR models. Ecol. Indic. 2022, 138, 108857. [Google Scholar] [CrossRef]
  61. Wickham, J.; Riitters, K.; Vogt, P.; Costanza, J.; Neale, A. An inventory of continental U.S. terrestrial candidate eco-logical restoration areas based on landscape context. Restor. Ecol. 2017, 25, 894–902. [Google Scholar] [CrossRef]
  62. Chang, Q.; Liu, X.; Wu, J.; He, P. MSPA-Based Urban Green Infrastructure Planning and Management Approach for Urban Sustainability: Case Study of Longgang in China. J. Urban Plan. Dev. 2015, 141. [Google Scholar] [CrossRef]
  63. Wuhan Municipal Bureau of Statistics. Wuhan Statistical Yearbook 2023. 2023. Available online: https://tjj.wuhan.gov.cn/tjfw/tjnj/202312/t20231204_2312633.shtml (accessed on 20 December 2024).
  64. Shi, Q.; Liu, M.; Marinoni, A.; Liu, X. UGS-1m: Fine-grained urban green space mapping of 31 major cities in China based on the deep learning framework. Earth Syst. Sci. Data 2023, 15, 555–577. [Google Scholar] [CrossRef]
  65. Park, C.Y.; Lee, D.K.; Asawa, T.; Murakami, A.; Kim, H.G.; Lee, M.K.; Lee, H.S. Influence of urban form on the cooling effect of a small urban river. Landsc. Urban Plan. 2019, 183, 26–35. [Google Scholar] [CrossRef]
  66. Feng, X.; Yu, J.; Xin, C.; Ye, T.; Wang, T.A.; Chen, H.; Zhang, X.; Zhang, L. Quantifying and Comparing the Cooling Effects of Three Different Morphologies of Urban Parks in Chengdu. Land 2023, 12, 451. [Google Scholar] [CrossRef]
  67. Zhao, H.; Hu, M.; Zhu, J.; Huang, T.; Zhang, Y.; Li, Y.; Yan, M. Blue-green space cooling effect and its influencing factors in metropolitan area: A case study on the area within the Fifth Ring Road in Beijing. Acta Ecol. Sin. 2023, 43, 4904–4919. [Google Scholar] [CrossRef]
  68. Yu, Z.; Xu, S.; Zhang, Y.; Jørgensen, G.; Vejre, H. Strong contributions of local background climate to the cooling effect of urban green vegetation. Sci. Rep. 2018, 8, 6798. [Google Scholar] [CrossRef]
  69. Li, H.; Li, Y.; Wang, T.; Wang, Z.; Gao, M.; Shen, H. Quantifying 3D building form effects on urban land surface temperature and modeling seasonal correlation patterns. Build. Environ. 2021, 204, 108132. [Google Scholar] [CrossRef]
  70. Han, D.; Yang, X.; Cai, H.; Xu, X. Impacts of Neighboring Buildings on the Cold Island Effect of Central Parks: A Case Study of Beijing, China. Sustainability 2020, 12, 9499. [Google Scholar] [CrossRef]
  71. Lin, B.S.; Lin, C.T. Preliminary study of the influence of the spatial arrangement of urban parks on local temperature reduction. Urban For. Urban Green. 2016, 20, 348–357. [Google Scholar] [CrossRef]
  72. Kothencz, G.; Blaschke, T. Urban parks: Visitors’ perceptions versus spatial indicators. Land Use Policy 2017, 64, 233–244. [Google Scholar] [CrossRef]
  73. Bartesaghi Koc, C.; Osmond, P.; Peters, A. Towards a comprehensive green infrastructure typology: A systematic review of approaches, methods and typologies. Urban Ecosyst. 2017, 20, 15–35. [Google Scholar] [CrossRef]
  74. Bi, S.; Chen, M.; Dai, F. The impact of urban green space morphology on PM2.5 pollution in Wuhan, China: A novel multiscale spatiotemporal analytical framework. Build. Environ. 2022, 221, 109340. [Google Scholar] [CrossRef]
  75. Yang, G.; Yu, Z.; Jørgensen, G.; Vejre, H. How can urban blue-green space be planned for climate adaption in high-latitude cities? A seasonal perspective. Sustain. Cities Soc. 2020, 53, 101932. [Google Scholar] [CrossRef]
  76. Zhou, W.; Cao, W.; Wu, T.; Zhang, T. The win-win interaction between integrated blue and green space on urban cooling. Sci. Total Environ. 2023, 863, 160712. [Google Scholar] [CrossRef]
Figure 1. The framework of this research.
Buildings 15 00573 g001
Figure 2. Map of Wuhan and urban greenspace in the study. (a) Location of Hubei Province in China; (b) Location of Wuhan city in Hubei Province; (c) Location and spatial distribution of 40 urban greenspace samples in Wuhan. Note: Numbers 1–40 represent the 40 selected samples of urban greenspace in this study.
Buildings 15 00573 g002
Figure 3. Schematic of LST change curve of urban greenspace cooling process.
Buildings 15 00573 g003
Figure 4. Illustration of MSPA.
Buildings 15 00573 g004
Figure 5. Examples of MSPA results for urban greenspace samples no. 1, 13, 17, 29, and 34 (location is shown in Figure 2). The purple rectangles are (a) Guanggu Huanglongshan Park (no. 1), (b) Wuhan Integrity Cultural Park (no. 11), (c) Wangjiadun Park (no. 17), (d) Dijiao Park (no. 29), and (e) Yingcai Park (no. 34). From left to right are high-resolution remote sensing images, urban greenspace extraction results, and MSPA results.
Buildings 15 00573 g005
Figure 6. (a) Spatial distribution of LST; (b) LST in urban greenspace; (c) LST at the maximum cooling distance. Note: Numbers 1–40 represent the 40 selected urban greenspace samples in this study.
Buildings 15 00573 g006
Figure 7. Cooling indexes of urban greenspace. (a) GCA of urban greenspace, (b) GCE of urban greenspace, (c) GCI of urban greenspace, and (d) GCG of urban greenspace. Note: Numbers 1–40 represent the 40 selected urban greenspace samples in this study.
Buildings 15 00573 g007
Figure 8. Pearson correlation between potential influencing factors and LST of greenspace and cooling effect indexes (Notes: * p < 0.05, ** p <0.01).
Buildings 15 00573 g008
Figure 9. Fitted curve of the scale and landscape composition factors: (a) Area-LST; (b) Area-GCA; (c) Area-GCE; (d) Perimeter-LST; (e) Perimeter-GCA; (f) Perimeter-GCE; (g) Perimeter-GCI; (h) Perimeter-GCG. Notes: The fitted curves were selected among linear, quadratic, cubic, logarithmic, power, and exponential functions with the largest R2 value. * following R2 values represent the significance level (p < 0.05).
Buildings 15 00573 g009
Figure 10. Fitted curve of the morphological spatial pattern factors: (a) Core Proportion-LST; (b) Bridge Proportion-LST; (c) Branch Proportion-LST; (d) Core Proportion-GCA; (e) Bridge Proportion-GCA; (f) Branch Proportion-GCA; (g) Core Proportion-GCI; (h) Branch Proportion-GCI; (i) Core Proportion-GCG; (j) Branch Proportion-GCG. Notes: The fitted curves were selected among linear, quadratic, cubic, logarithmic, power, and exponential functions with the largest R2 value. * following R2 values represent the significance level (p < 0.05).
Buildings 15 00573 g010
Figure 11. Fitted curve of the surrounding environmental characteristic factors: (a) Buffer_Veg-LST; (b) Buffer_Impervious-LST; (c) Buffer_Impervious-GCA; (d) Buffer_BCR-GCI; (e) Buffer_BCR-GCG. Notes: The fitted curves were selected among linear, quadratic, cubic, logarithmic, power, and exponential functions with the largest R2 value. * following R2 values represent the significance level (p < 0.05).
Buildings 15 00573 g011
Figure 12. Radar diagrams of cooling indexes for 5 cooling bundles: (a) Bundle 1; (b) Bundle 2; (c) Bundle 3; (d) Bundle 4; (e) Bundle 5.
Buildings 15 00573 g012
Figure 13. Comparison of the average values of the major influencing factors for 5 cooling bundles.
Buildings 15 00573 g013
Table 1. Definitions of the seven morphological categories in MSPA.
Morphological CategoryEcological Definition
CoreLarge green patches and the primary components of greenspace serve as important ecological sources
IsletSmall, isolated, fragmented green patches that are not connected to each other
PerforationInternal boundary of core green patches, transition areas between core areas and non-green landscape patches, with edge effect
EdgeExternal boundary of core green patches, transition areas between core areas, and major non-green landscape areas, with edge effect
LoopCorridors linking the same core patches, which are important pathways for energy flow
BridgeCorridors linking different core patches, which are important for landscape connectivity
BranchCorridors with only one end connected to perforation, edge, bridge, or loop
Table 2. Potential influencing factors on the cooling effect of greenspace.
CategoryInfluencing FactorDefinition
Internal factorsScale and landscape compositionAreaThe area of the urban greenspace (ha)
PerimeterThe perimeter of the urban greenspace (m)
LSIThe shape index of the urban greenspace. The value of LSI is greater than 1, and the more irregular the shape, the larger the value
VegPerThe percentage of area covered by vegetation to the overall area of the greenspace (%)
WaterPerThe percentage of water body area within the urban greenspace (%)
Morphological spatial patternCore ProportionThe proportion of core spatial pattern area within the urban greenspace (%)
Islet ProportionThe proportion of islet spatial pattern area within the urban greenspace (%)
Perforation ProportionThe proportion of perforation spatial pattern area within the urban greenspace (%)
Edge ProportionThe proportion of edge spatial pattern area within the urban greenspace (%)
Loop ProportionThe proportion of loop spatial pattern area within the urban greenspace (%)
Bridge ProportionThe proportion of bridge spatial pattern area within the urban greenspace (%)
Branch ProportionThe proportion of branch spatial pattern area within the urban greenspace (%)
External factorsSurrounding environmental characteristicBuffer_VegThe proportion of the vegetation coverage in the surrounding area of the urban greenspace (%)
Buffer_ImperviousThe proportion of the impervious surface in the surrounding area of the urban greenspace (%)
Buffer_BCRThe building coverage ratio in the surrounding area of the urban greenspace (%)
Buffer_BHThe average building height in the surrounding area of the urban greenspace (m)
Table 3. Multiple stepwise regression results between potential influencing factors and LST of urban greenspace and cooling indexes (i.e., GCA, GCE, GCI, GCG).
FactorsBβt-ValuesigVIFR2Adjusted
R2
F
LSTPerimeter−0.001−0.278−2.6250.0131.2570.6880.65319.319
Core Proportion−0.038−0.445−4.0020.0001.388
WaterPer−0.081−0.378−3.6410.0011.213
Buffer_Impervious0.0630.2832.5780.0141.349
(Constant)43.784/21.0340.000/
GCALSI40.3100.5096.4540.0001.0030.7710.75962.267
Area0.9950.6878.7130.0001.003
(Constant)−34.221/−3.8680.000/
GCEPerimeter−0.003−0.429−3.1230.0031.0010.3020.2658.021
VegPer0.1280.3292.3910.0221.001
(Constant)−0.191/−0.0440.965/
GCICore Proportion0.0000.5714.6110.0001.0740.4870.44411.378
Buffer_BCR0.0000.4283.5420.0011.024
WaterPer0.0000.3933.2090.0031.054
(Constant)0.004/1.4650.152/
GCGCore Proportion0.0110.5454.3470.0001.0740.4730.43010.792
Buffer_BCR0.0190.4593.7490.0011.024
WaterPer0.0180.3662.9450.0061.054
(Constant)0.190/1.2130.233/
Note: B is the unstandardized coefficient; β is the standardized coefficient, and it embodies the relative contribution of each factor. The boldfaced numbers indicate the maximum values of β among the various factors. The determination coefficient (R2) represents the proportion of variation in each dependent variable.
Disclaimer/Publisher’s Note: The statements, opinions and data contained in all publications are solely those of the individual author(s) and contributor(s) and not of MDPI and/or the editor(s). MDPI and/or the editor(s) disclaim responsibility for any injury to people or property resulting from any ideas, methods, instructions or products referred to in the content.

