Abstract
An assembled elliptical joint was designed for a lattice wind turbine tower, and four samples were analyzed under static loads. Additionally, finite element analysis software was employed to create 40 models, with the wall thickness of the ball seat and the web being the variable parameters. This enabled the identification of the variation pattern in the ultimate bearing capacity. It was found that the failure parts of the four test pieces were located in the connection area between the tensioned web member and the ball table. Increasing the wall thickness of the ball table and the web member significantly increased the joint’s load-bearing capacity. However, increasing the table wall thickness somewhat reduced the joint’s deformation capacity. Increasing the web member thickness significantly improved the deformation capacity and the energy absorption capacity of the joint. Increasing the table wall and the member web thickness reduced the peak equivalent stress in the ball table area and the press plate, as well as the overall stress level. Finite element simulations showed that the joint’s load-bearing ability was adversely impacted when the table wall thickness exceeded 10 mm. When the web member wall thickness exceeded 5 mm, the joint bearing capacity was less sensitive to the increase in the wall thickness.
1. Introduction
Currently, several countries have focused on improving the global environment, efficiently using clean energy and actively participating in global climate change alleviation efforts. Wind energy, as an inexhaustible source of clean energy, is currently promoted by many countries. However, with the rapid development of the global wind power industry and the evolution of wind turbines toward higher power, the requirements for the height and load-bearing capacity of the supporting towers below have become more stringent. Traditional conical tower structures use large amounts of steel, leading to some difficulties in transportation and installation that necessitate the use of professional manufacturing equipment and technology. By contrast, lattice towers have high material utilization rates and low transportation and installation costs and are suitable for various terrains and wind speed conditions in different regions [1,2,3,4,5]. However, lattice towers also have significant disadvantages. A large amount of high-altitude welding work is required at the joints, making their construction difficult, and it is also difficult to ensure the quality of the welding. Residual stress is generated at the welded parts, which adversely affects the structure [6,7,8,9].
Previous research on lattice towers has focused on intersecting joints (including K, T, X and other shapes), and has been relatively fruitful [10,11,12,13,14,15,16,17,18]. However, several problems must still be addressed to promote the use of lattice towers. Multiple welds are required at the joints, which have high requirements for welding accuracy. Welding at high altitudes is difficult, and the weld is prone to residual stress. Therefore, this research group proposed a prefabricated joint and successively studied the spherical plate joint, the bolt ball universal joint, universally wrapped assembled joints, and the flange spherical joint [19,20,21,22]. Because the first few joints have many parts, they require many bolts to be installed, and the axes of the tension web member and compression web member do not intersect the tower column, resulting in unreasonable force transmission. To reduce construction difficulty, improve construction efficiency, and optimize the force transmission of the joints, ellipsoidal joints are proposed. In this paper, the stress distribution characteristics and damage mechanisms of four ellipsoidal joints were derived from static loading tests.
2. Overview of the Test
2.1. Sample Parameters
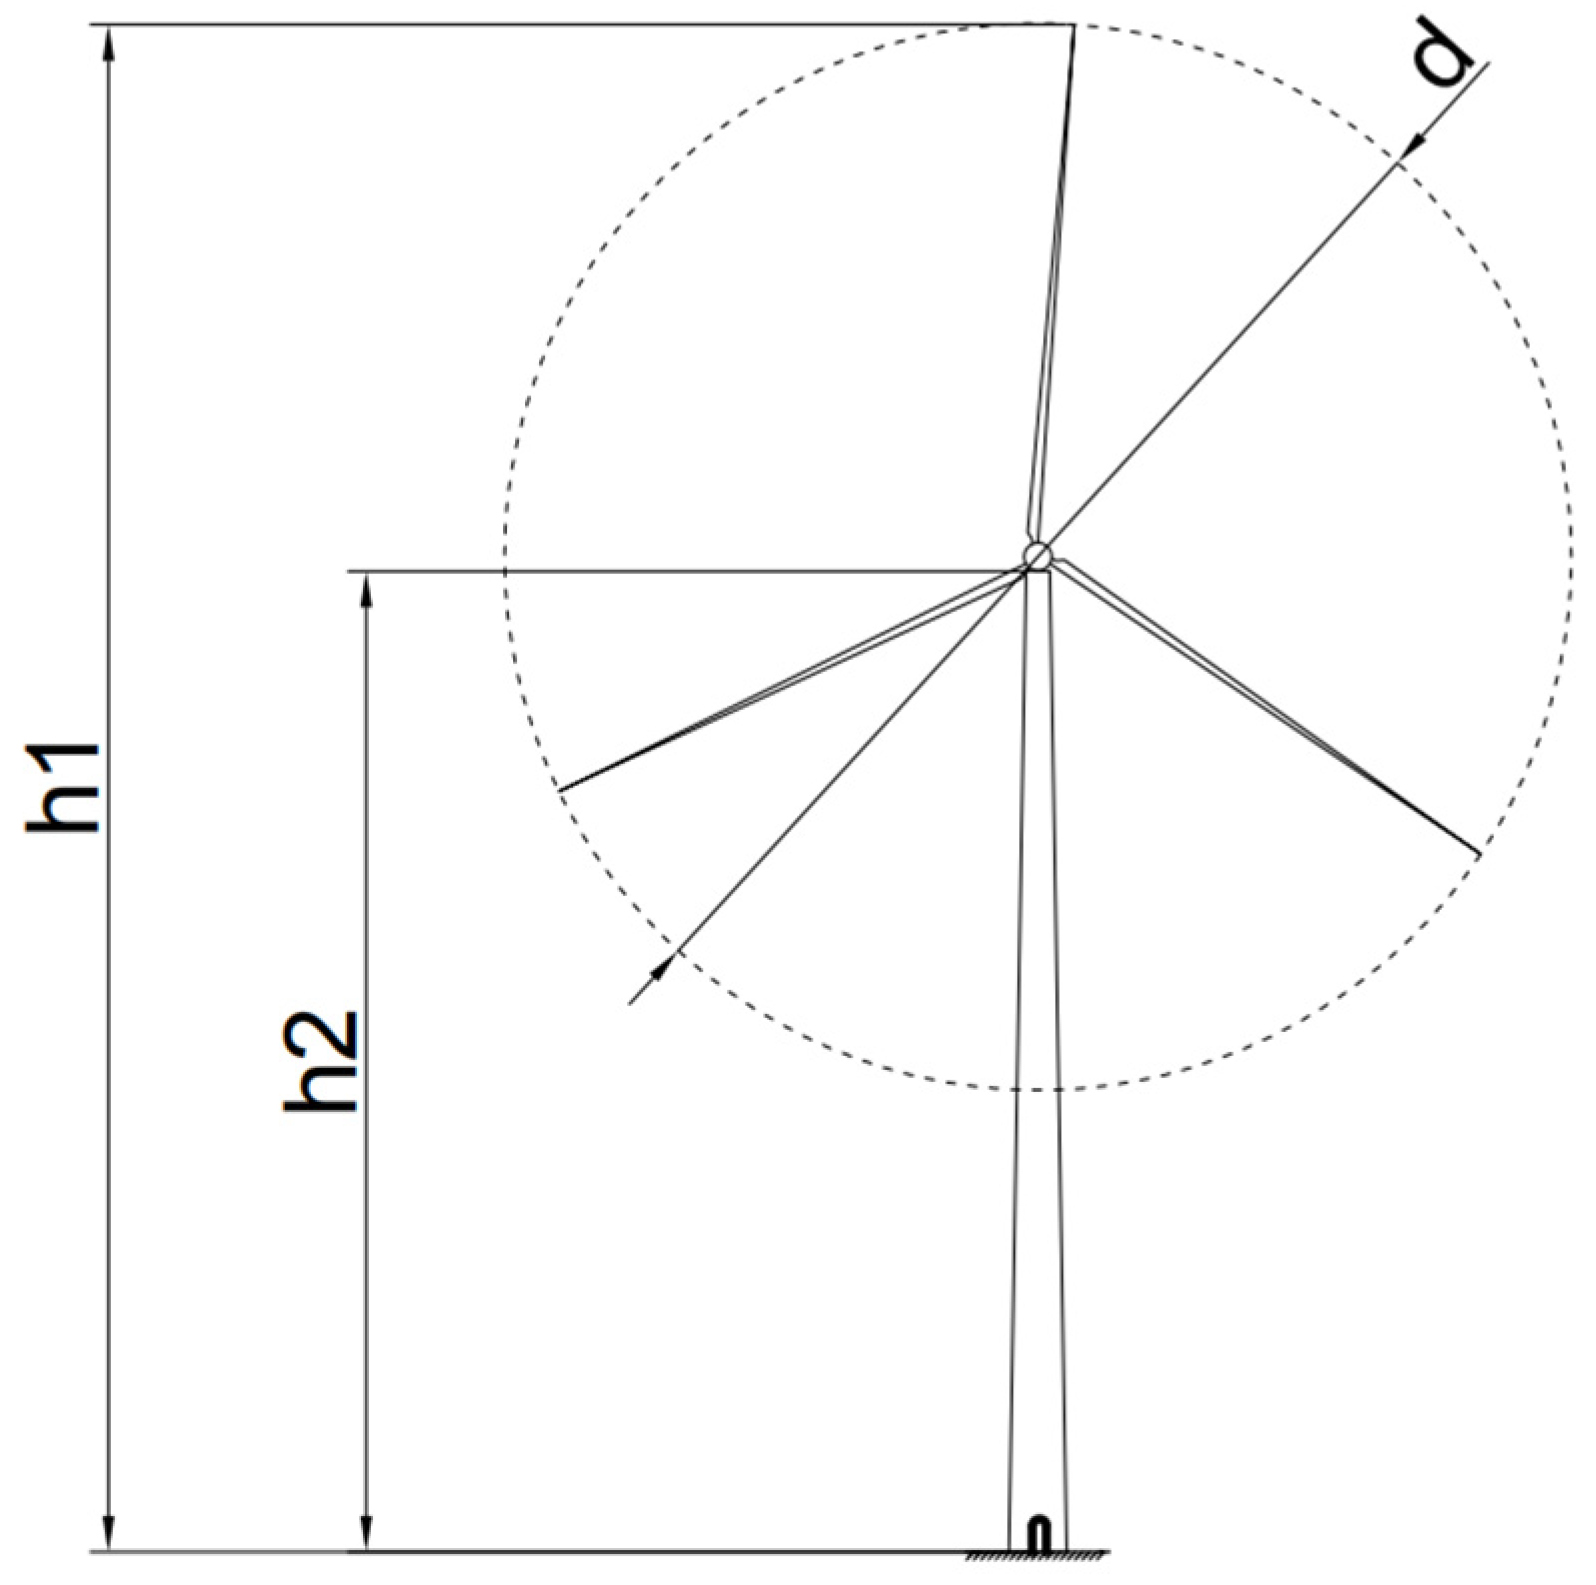
A 1.5 MW cone tower in Baotou City was used as a prototype to design a four-legged lattice tower in SAP2000. The prototype of the cone tower column is shown in Figure 1, and the main parameters are shown in Table 1. The most unfavorable position at the joint was selected according to the internal force distribution. Four elliptical joints were designed at a scale of 1:1.6 according to the Standard for Design of Steel Structures (GB50017-2017) [23], the Standard for Design of High-Rising Structures (GB50936-2014) [24], the Technical Code for Concrete-filled Steel Tubular Structures (GB50135-2019) [25], and the actual loading conditions. The structural diagram is shown in Figure 2.
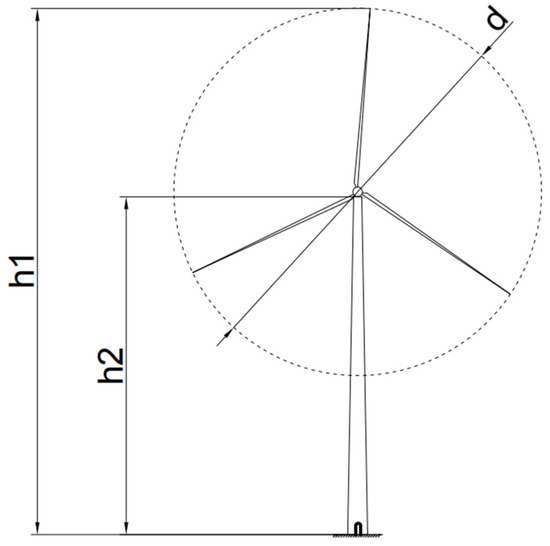
Figure 1.
Schematic diagram of a prototype cone tower.

Table 1.
The main parameters of the cone tower.

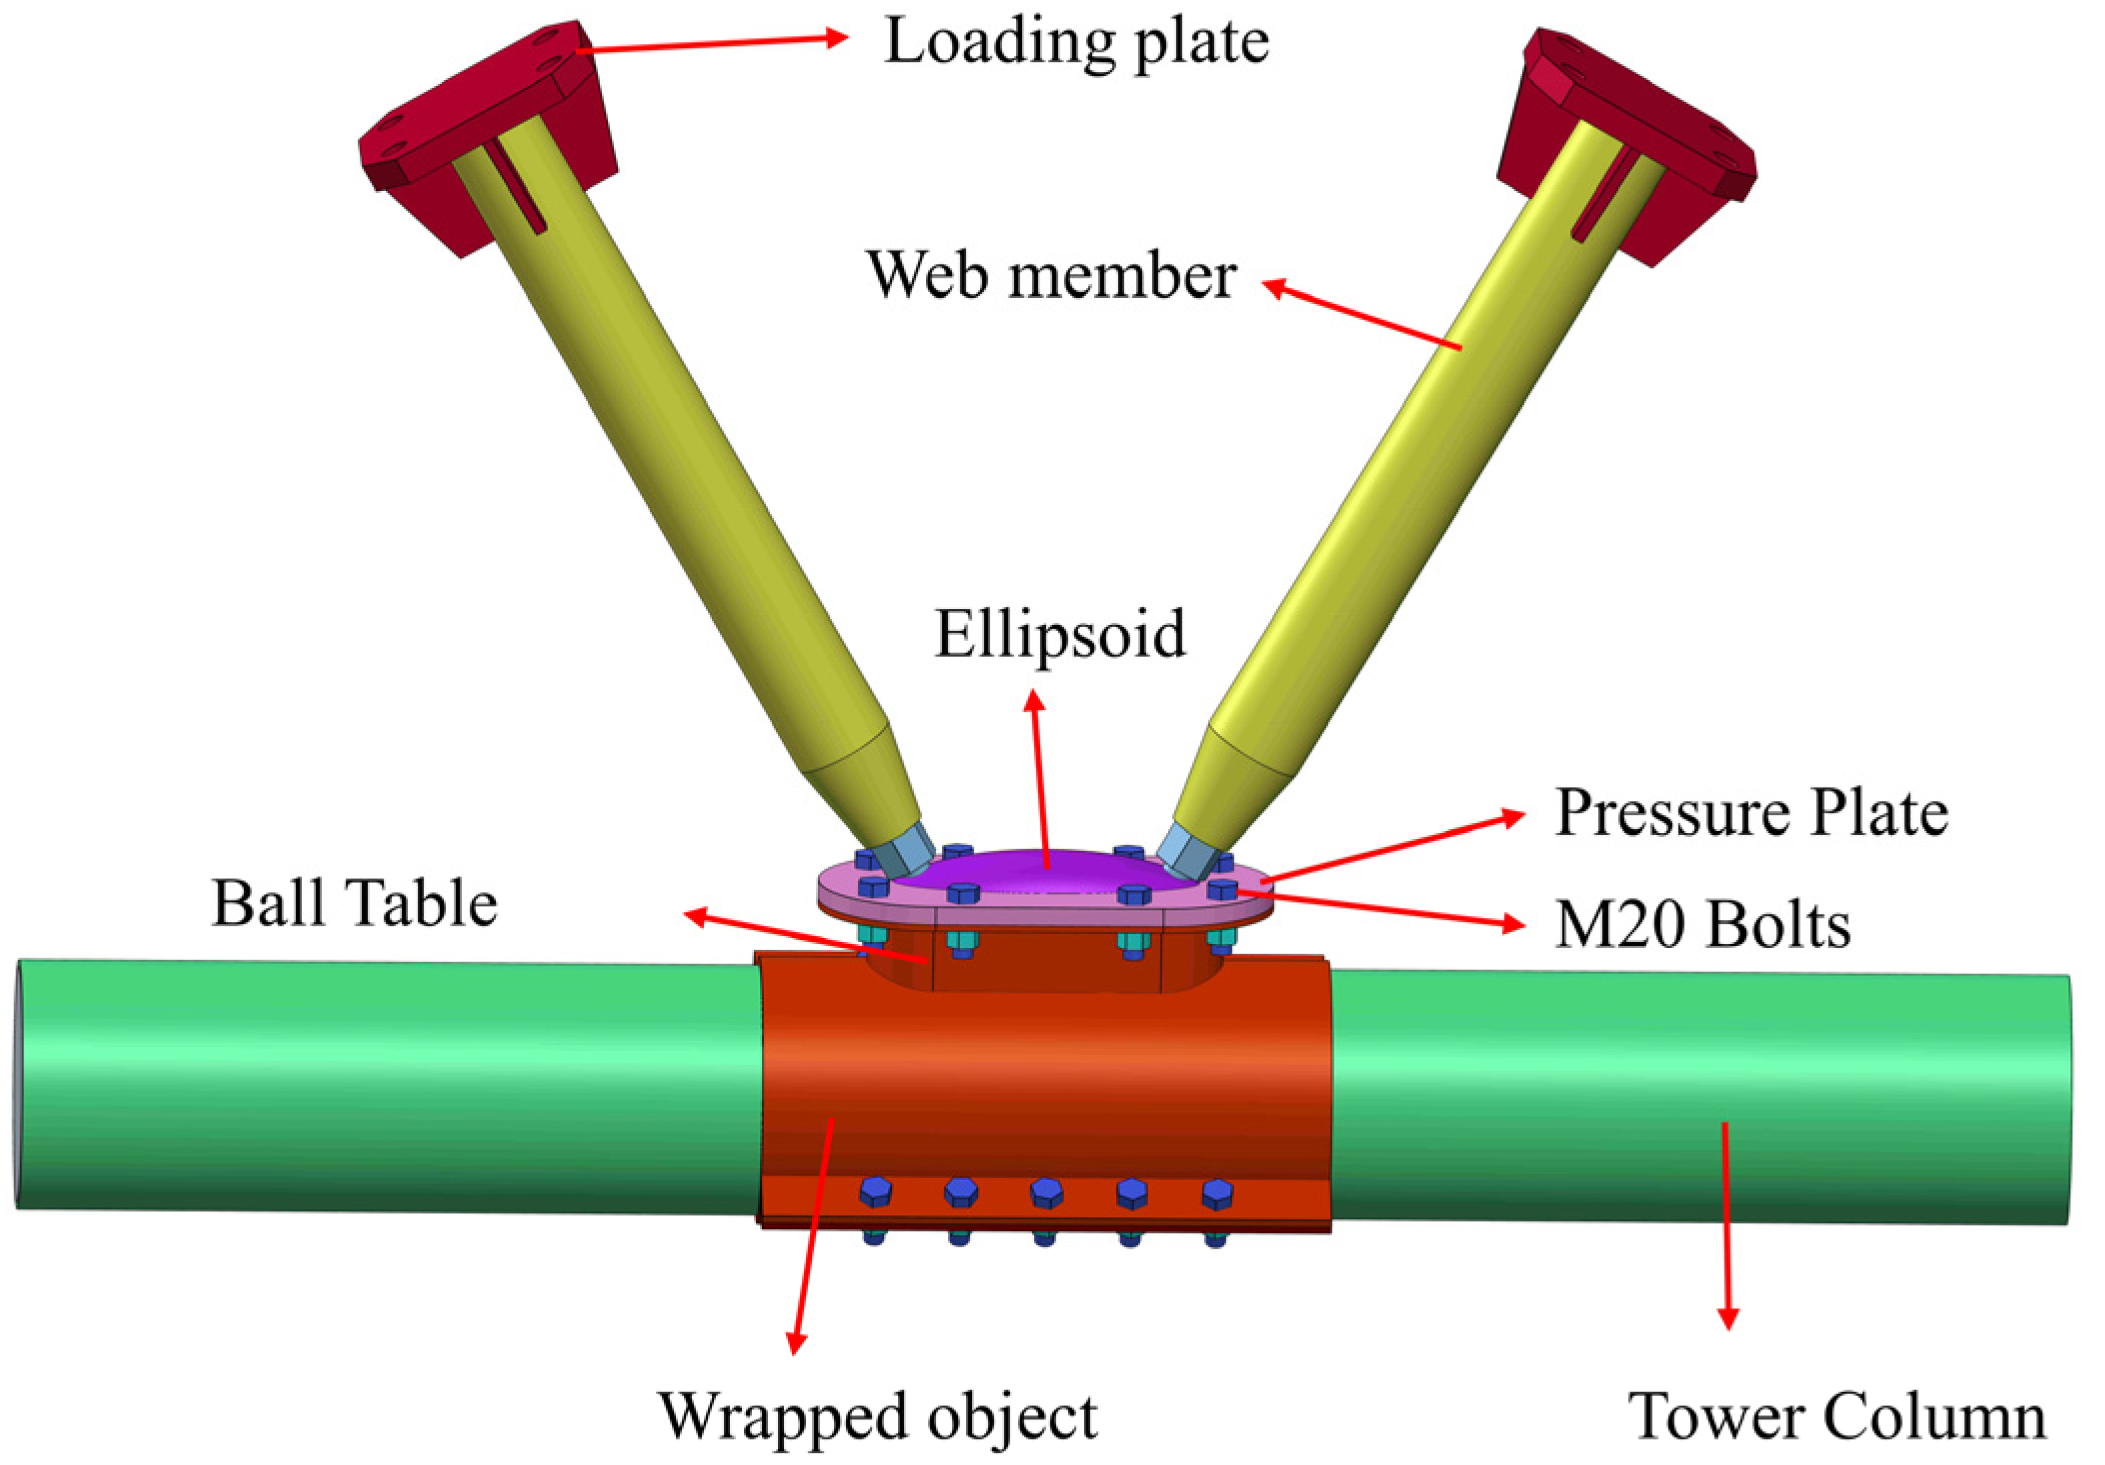
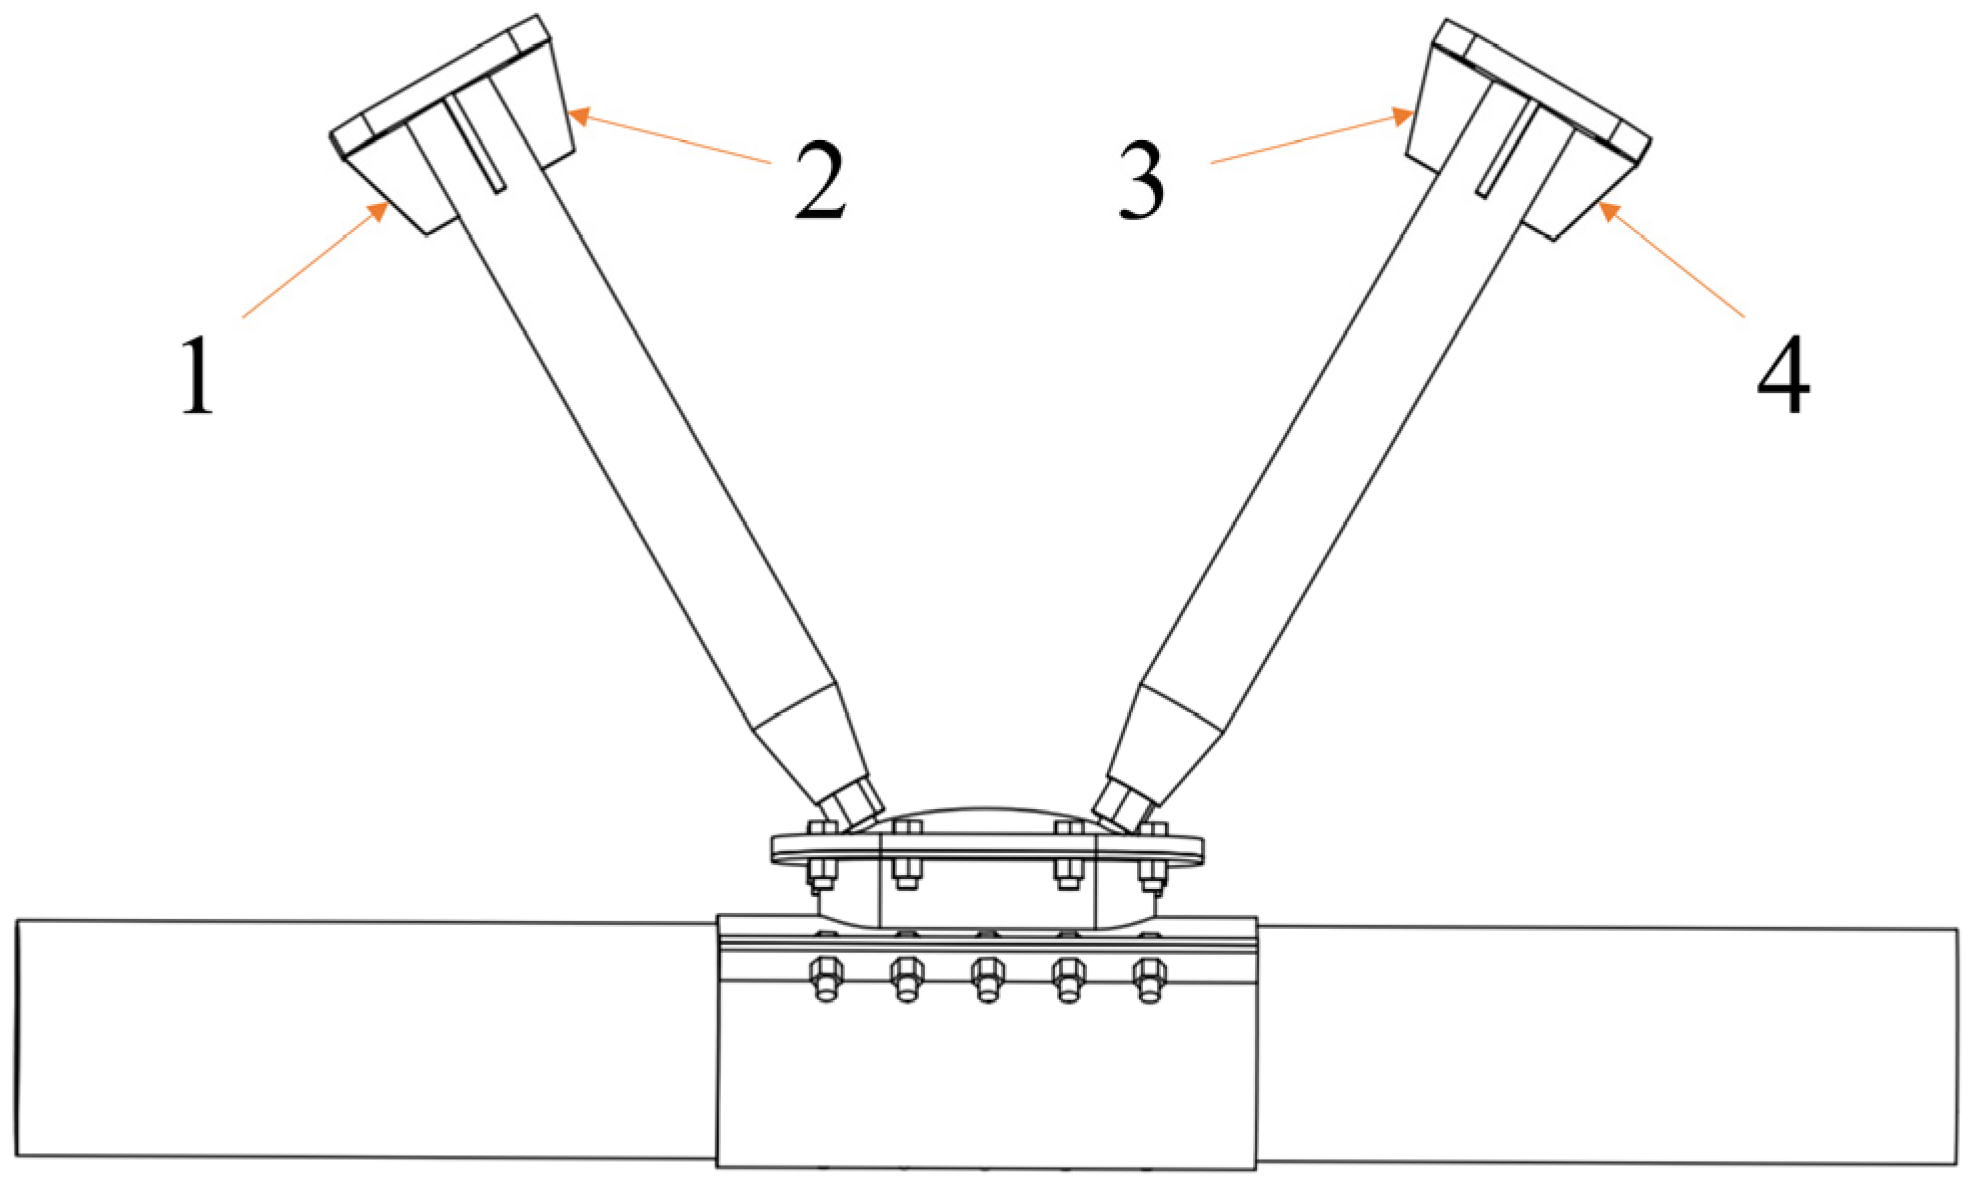
Figure 2.
Node construction diagram.
In this work, the wall thicknesses of the ball table and the web member served as variation parameters. A total of four scaled test pieces with ellipsoidal joints were designed and manufactured. Figure 1 shows the joint structure diagram, and the dimensional parameters of each component are shown in Table 2, while the material strength tests are shown in Table 3. The machining of all parts of the sample was performed by a machine shop. A simple schematic of the sample is shown in Figure 3, and an assembly diagram of the sample is shown in Figure 4. The tower column was constructed from a 20 Mn seamless steel pipe. After being transported back to the laboratory, it was filled with concrete of strength class C40. The ellipsoidal bolt ball was made of 45# steel, and the remaining parts were made of Q235 ordinary carbon steel.
Table 2.
Sample parameter.
Table 3.
Mechanical property indexes of steel.

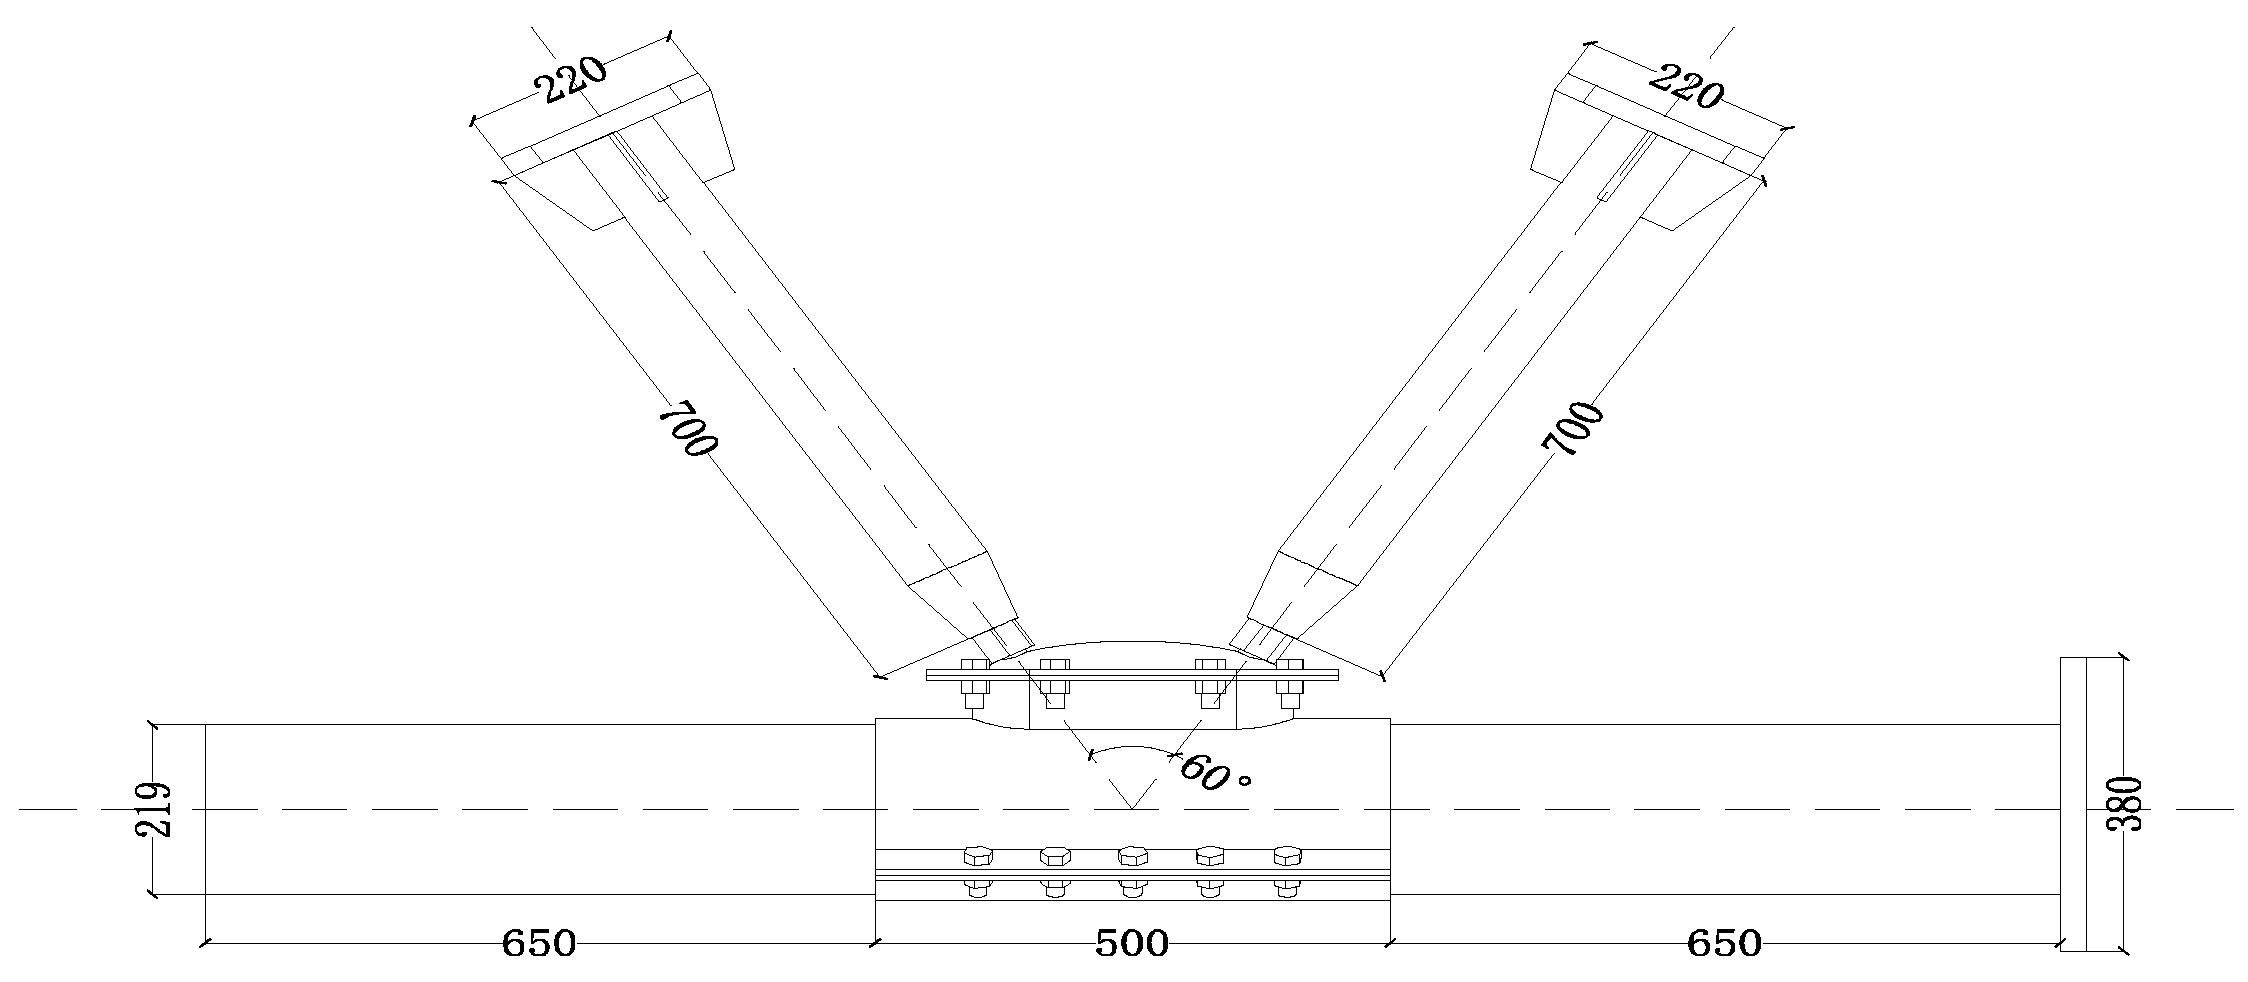
Figure 3.
Schematic diagram of sample.
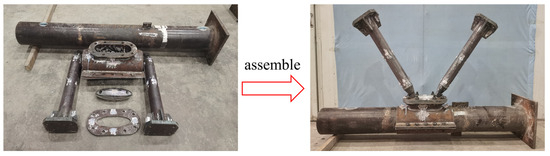
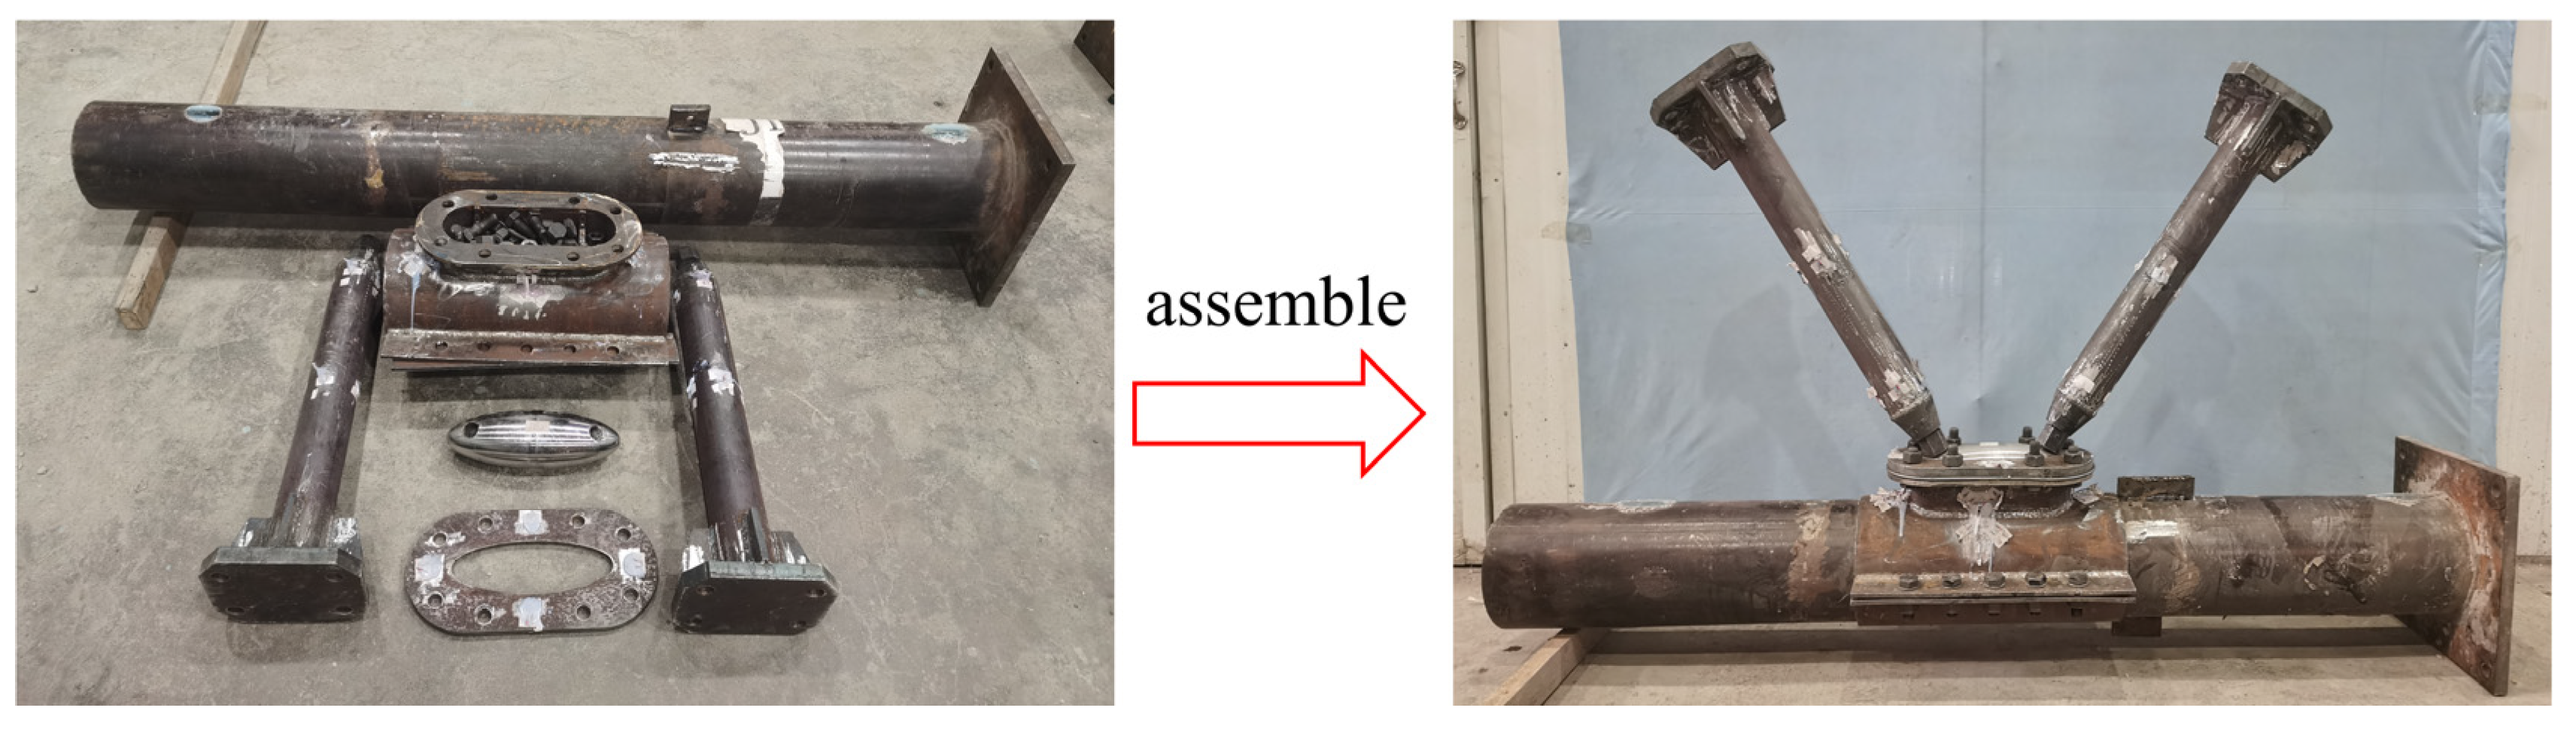
Figure 4.
Sample assembly diagram.
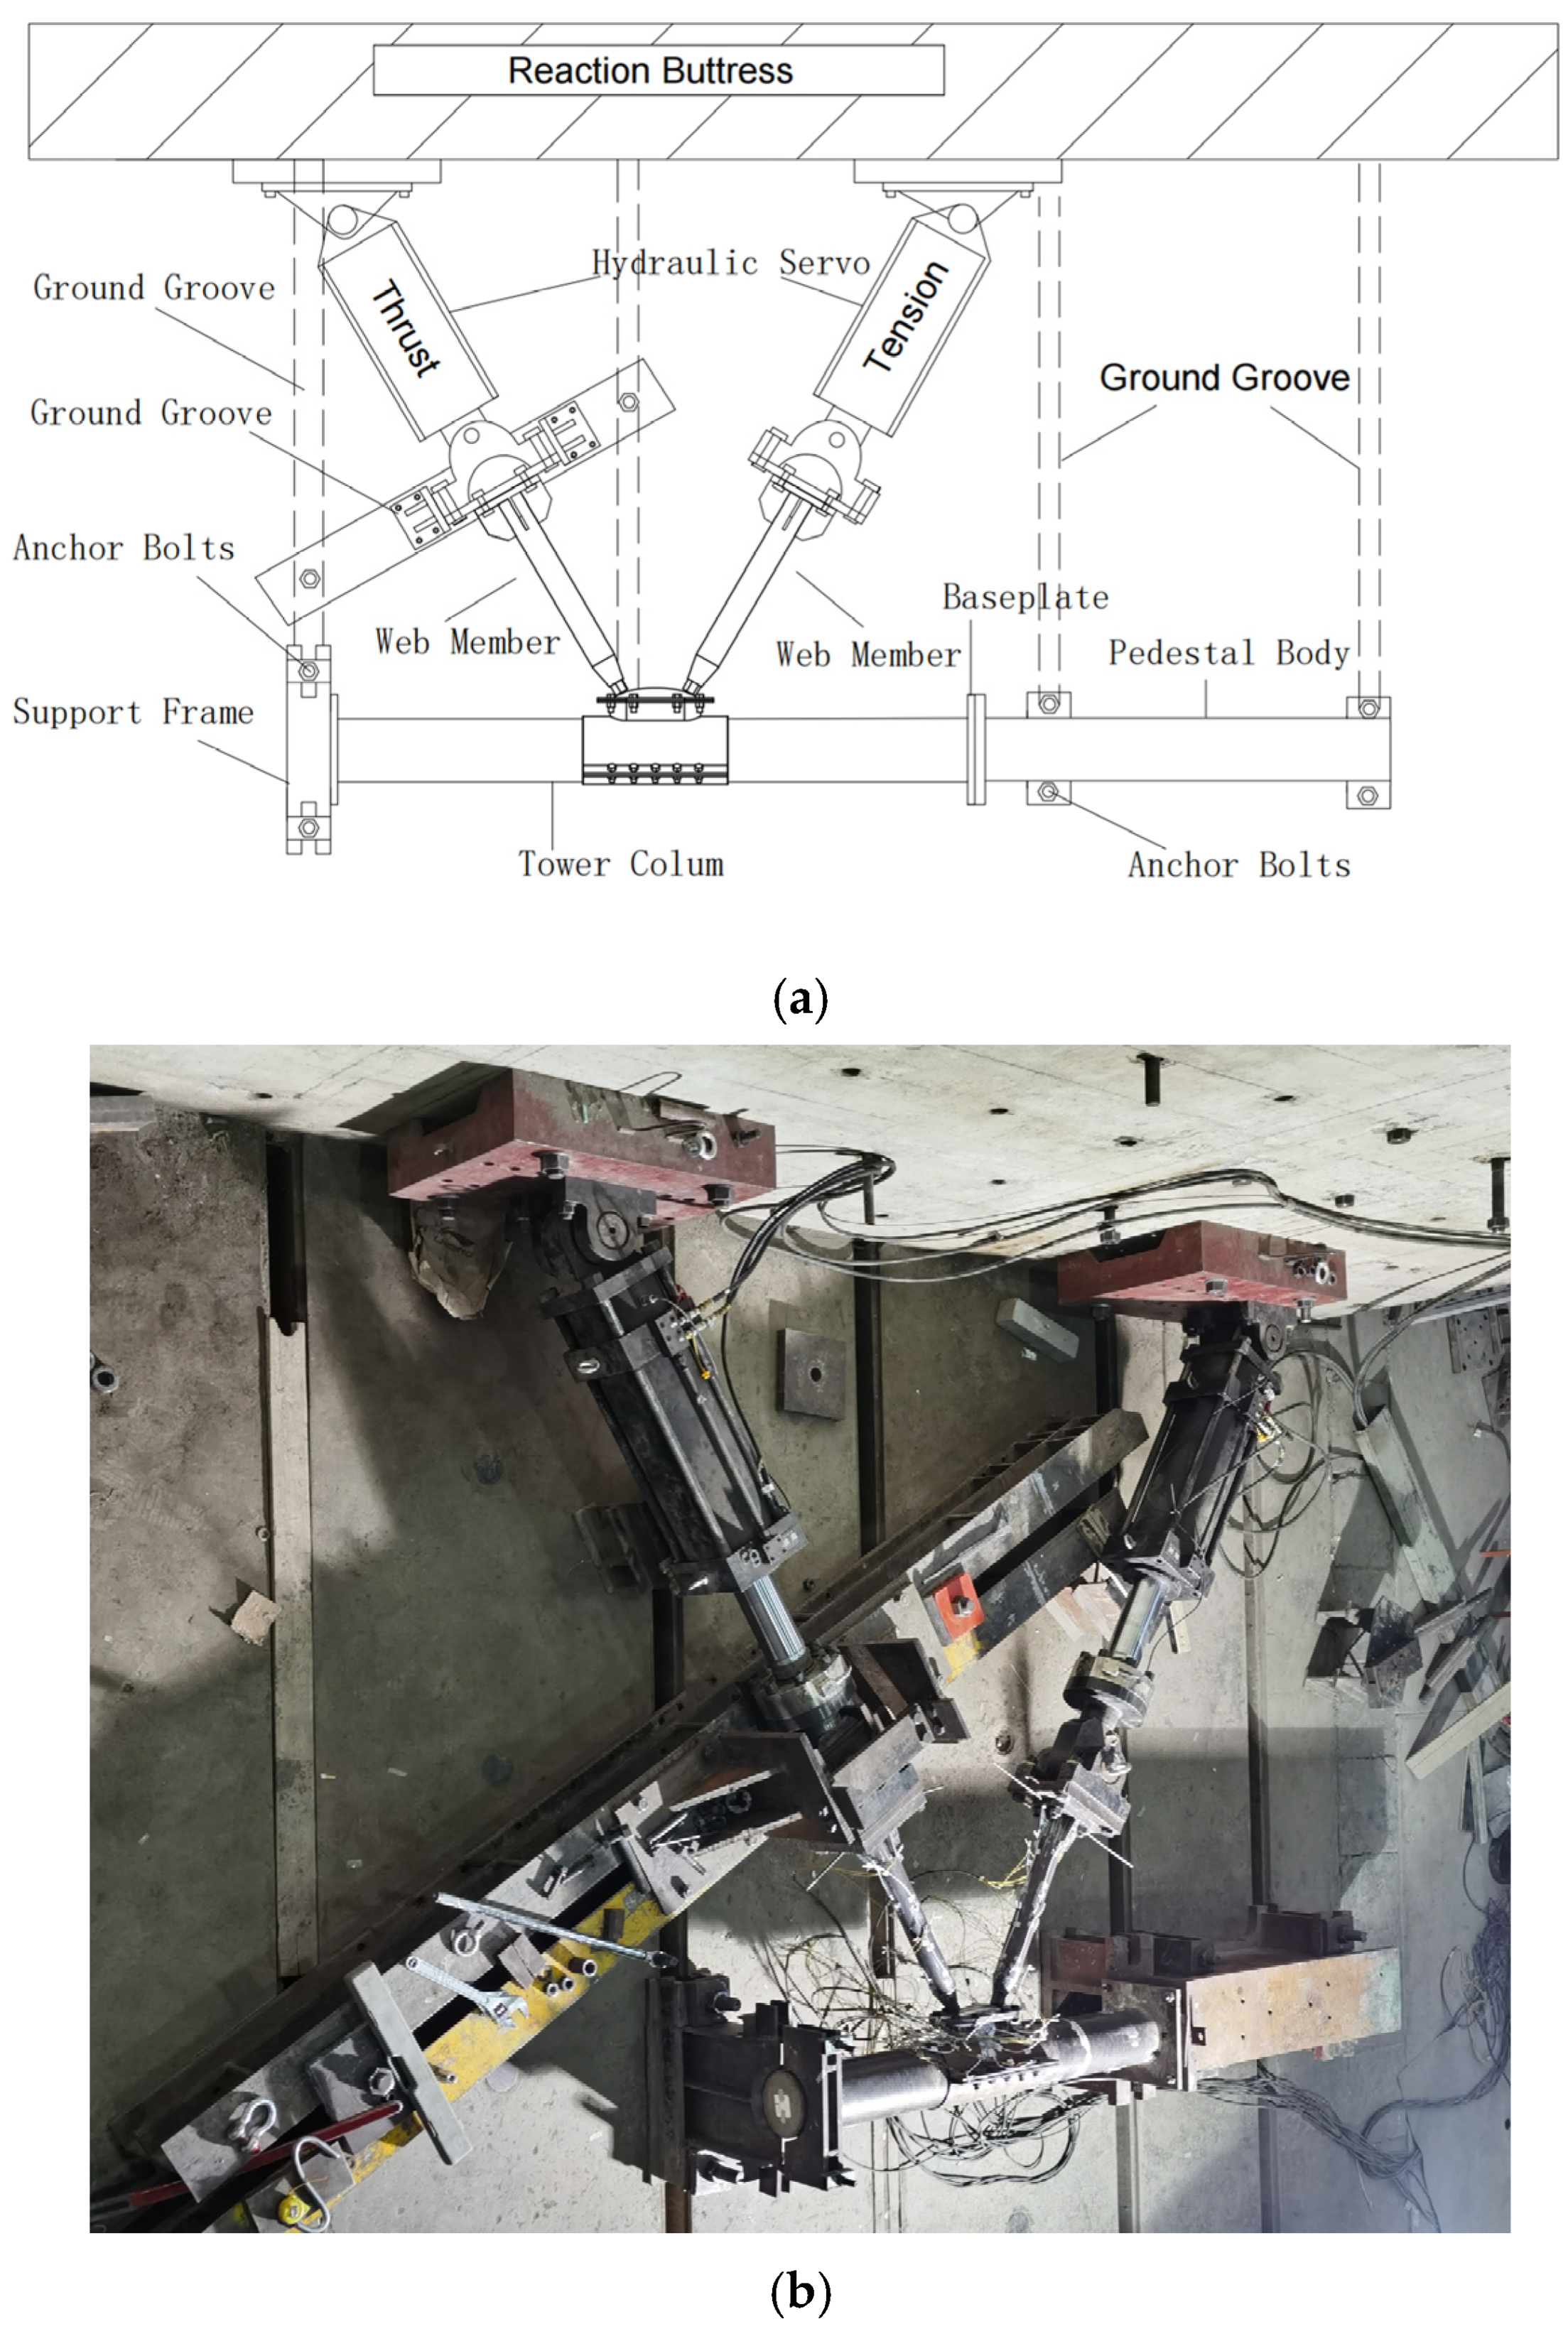
2.2. Loading System
This test uses a horizontal loading position, as shown in Figure 5. To avoid additional bending moments caused by the deflection of the thrusted web member during the loading process, which would affect the accuracy of the test, a lateral displacement prevention device is installed at the thrusted web member. The thrust and tension web members are loaded at a ratio of 1.1:1. The loading is controlled by both the load and displacement, and the maximum load-bearing capacity and maximum displacement of the test piece are analyzed theoretically using the Abaqus software. Loading was carried out in the load control mode until local buckling occurred at intervals of 10% of the theoretical ultimate load. After the load reached 80% of the theoretical load or the sample exhibited significant local buckling deformation, loading was switched to displacement control, with each load step equal to 1 mm, and loading was carried out until failure.
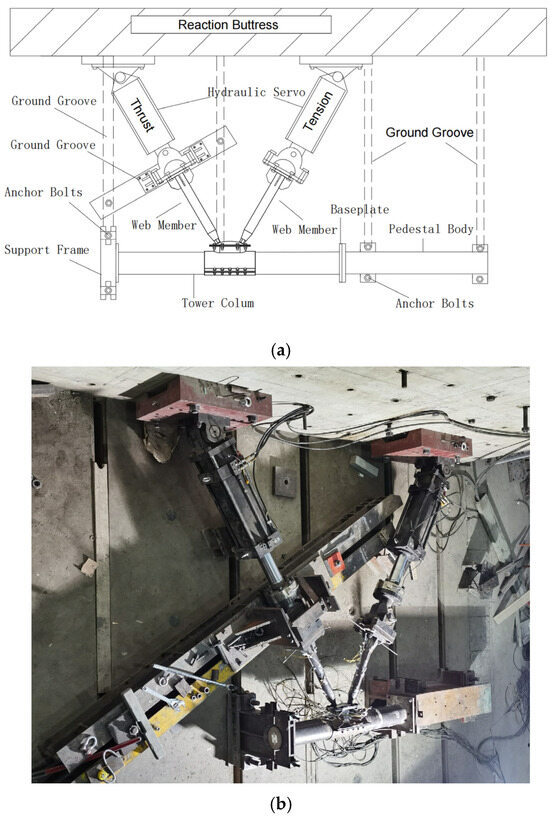
Figure 5.
Loading device. (a) Schematic diagram of loading device (b) loading site.
2.3. Displacement–Deformation Measurement Program for Sample
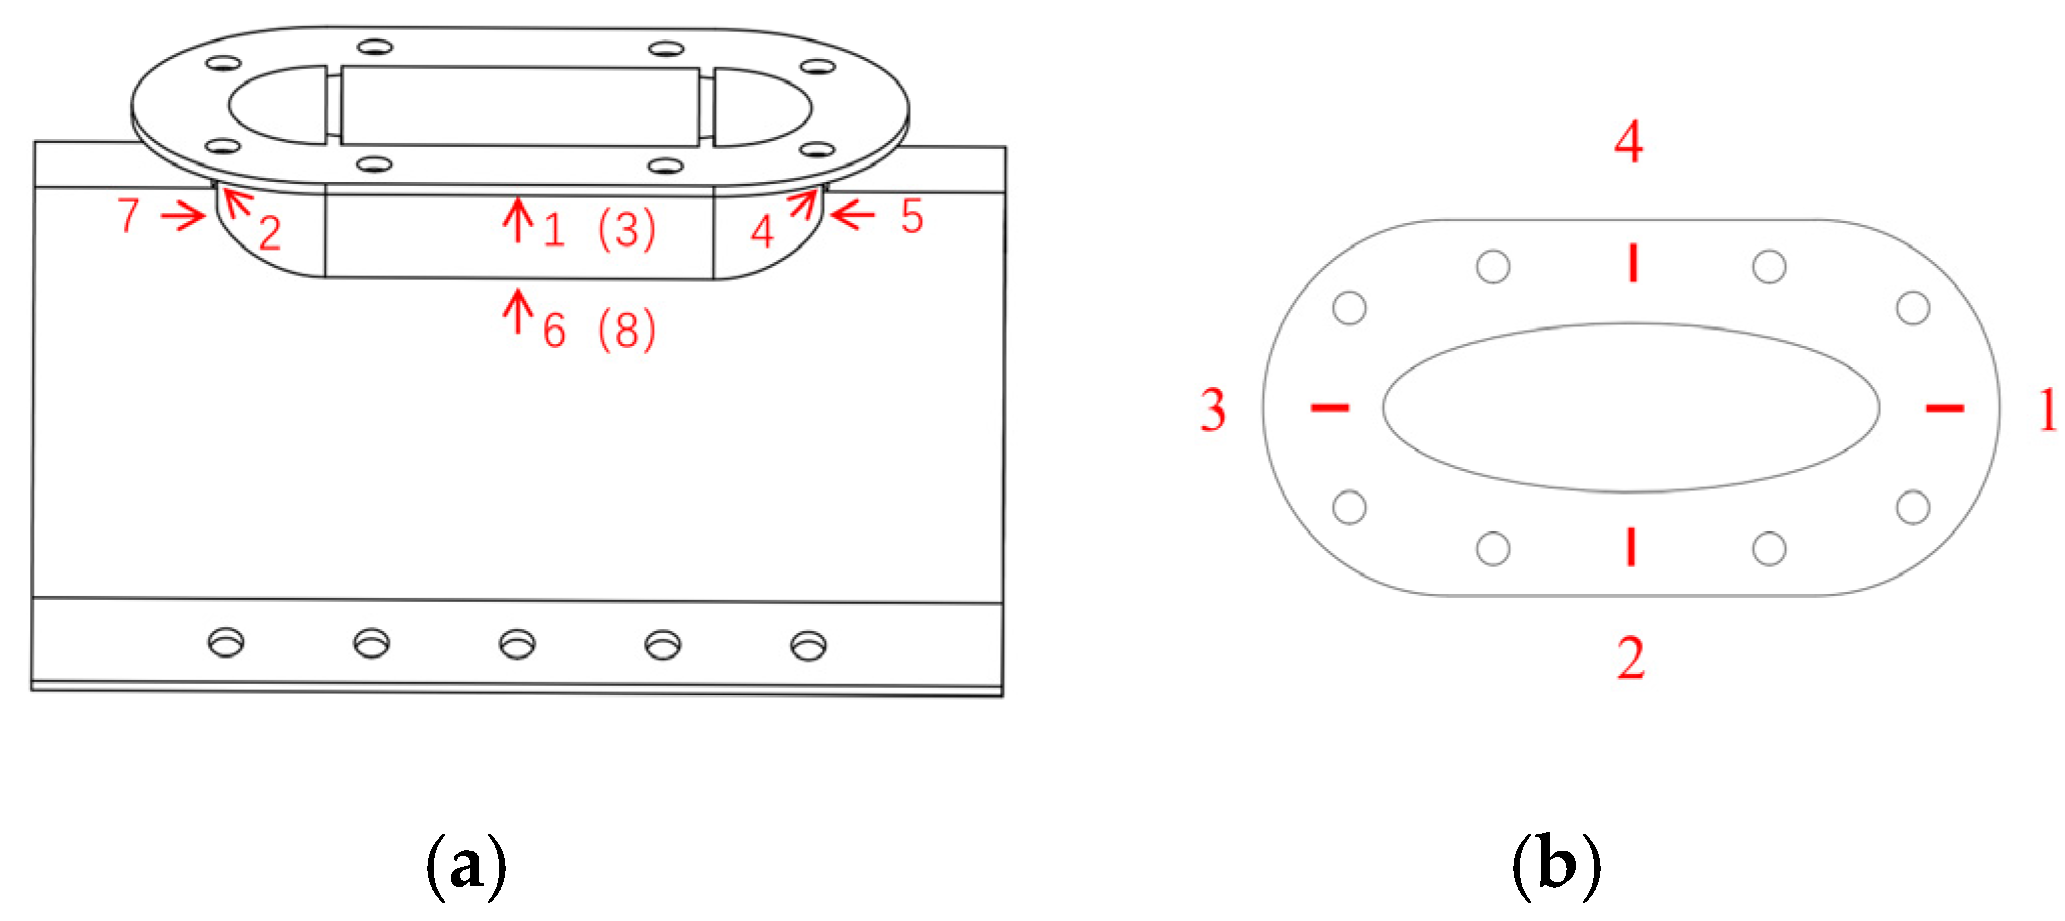
To accurately determine the stress–strain distribution of the weak parts of the sample and the displacement of the sample, displacement transducers and strain gauges were placed at the locations shown in Figure 6 and Figure 7. The axial load displacement curves of the tensioned and compressed web members were obtained by arranging displacement meters 1–4 along the axial direction at the loading end of the web member. The ball table acts to limit the rotation of the bolt ball in all directions, and there are specific welds between it and the object that it encloses. The function of the pressure plate is to prevent the bolt ball from falling off the upper part of the ball table. These two parts are prone to stress concentration. Consequently, triaxial strain gauges were installed at the welding points between the ball table and the wrapped item, and two sets of strain gauges were located at the long and short edges of the press plate. The test was conducted using a DH3820 high-speed static strain gauge to collect data from the above measurement points.
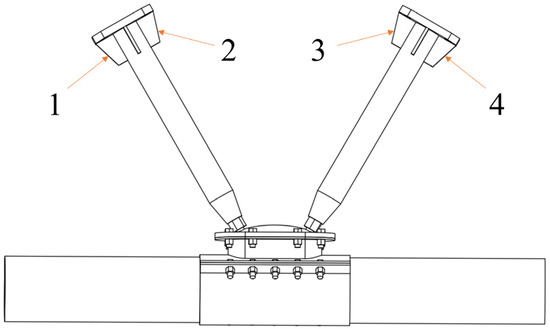
Figure 6.
Layout of displacement gauge.
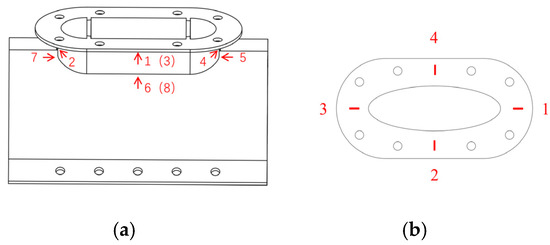
Figure 7.
Layout of strain gauge. (a) Ball table (b) pressure plate of ball table.
3. Analysis of Test Results
3.1. Sample Damage Phenomenon
The failure modes of the joints are shown in Figure 8. For JD-1, when the tension web member load increased by 186 kN, the tension table press plate and ball table bearing plate began to show plastic deformation. When the tension web load increased to 213 kN, the thrust side press plate and ball table support plate also began to show plastic deformation. When the load was increased to 235 kN, the ellipsoid began to distort toward the tensile side of the ball table, causing a certain degree of bending deformation in the cylinder body on that side. When the load increased to 278 kN, the sample ball table area at the tensile side issued a “bang” sound, the ball table area tensile side of the ball table cylinder and the ball table support plate weld cracked, and JD-1 was damaged. For JD-2, when the load of the tensile web member was increased to 245 kN, plastic deformation occurred on the tensile side of both the pressure plate and the ball table support plate, When the load was increased to 260 kN, the ellipsoidal ball on the tensile side emitted the sound of metal collision, obvious deformation traces were found at the bolt holes of the tensile side, and the ball table support plate on the thrust side showed plastic deformation. When the load was increased to 290 kN, the high-strength bolts connecting the tensile web and ellipsoid were pulled out and JD-2 was damaged. For JD-3, when the load on the tensile web member was increased to 198 kN, plastic deformation was observed in the tensile side pressure plate and ball table support plate, and at a load of 290 kN, the thrust side ball table support plate also started to exhibit plastic deformation. When the load was increased to 330 kN, the inner edge of the ball table support plate exhibited noticeable cracks on the tensile side of the sample. When the load increased to 342 kN, the table area on the tension side of the press plate buckled and broke, the tension side of the press plate was torn through, and JD-3 was destroyed. For JD-4, when the tensioned web member load increased to 240 kN, plastic deformation began to appear on the tensioned side pressure plate and table support plate. When the load increased to 310 kN, a metallic friction and collision sound was detected from the tension side ball table area and a clear gap appeared at the connection between the web member and the ellipsoid. When the load reached 390 kN, the high-strength bolts of the tension web member were pulled out of the ellipsoid, and JD-4 failed.
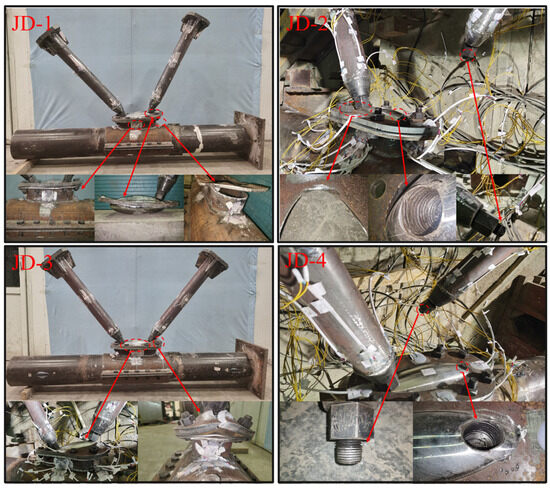
Figure 8.
Destruction phenomenon.
Overall, during the loading process, none of the four joints exhibited significant plastic deformation under tension or thrust of the web member, and none of the tower columns displayed noticeable bending. The primary damage was concentrated at the junction where the ball table and the web member intersect or join. The damage modes of the ellipsoid joints can be roughly divided into three types: tearing of the weld between the ball table cylinder and the table support plate, tearing of the press plate, and damage to the high-strength bolt threads of the tension web member. A comparison of the failure modes of JD-1 and JD-3 revealed that for a thinner ball table wall (6 mm), the weak part of the ellipsoid joint is located in the ball table area, because in this case, the tip of the ellipsoid is tangent to the weld of the table support plate, which is a stress concentration area of the test piece. During the loading process, the tension and thrust web members squeeze the table cylinder under the action of the horizontal force along the column, and the ball table cylinder and press plate deform and buckle to a certain extent. At the same time, the force of the tension and thrust web members perpendicular to the column direction has a greater impact on the failure mode. The force of the thrusted web member in the vertical direction squeezes the table support plate and the ball table’s inner area, but due to the high stiffness of the table interior, the impact on the overall structure is minimal.
The force of the tensioned web member in the vertical direction will cause the tip of the ellipsoid to squeeze the press plate and tear upward at the weld between the ball table and the table support plate, thus causing fatal damage to the structure. Comparison of the JD-1 and JD-3 test pieces showed that under the same ball table wall thickness, the impact of the web member thickness on the failure mode is as follows: when the web member thickness is small, the weld where the ball table support plate is joined to the ball table cylinder is susceptible to tearing and breaking, particularly in the ball table area, whereas a thicker wall in the web member enhances its axial stiffness, increases the energy absorption capacity of the web member, and reduces the deformation of the table cylinder, so that only buckling damage of the press plate material occurs. The JD-2 and JD-4 pieces have similar damage characteristics. An increase in the wall thickness of the ball table support plate leads to a decrease in the volume of the exposed area of the ellipsoid. The tension web member bolt is interfered with by the press plate when it is screwed into the ellipsoid bolt hole, and the thread rotation and depth only reach 1/3~1/2 of the design depth; thus, it is not possible to fully screw into the bolt hole, and the tension bearing capacity of the bolt is directly proportional to the depth of the bolt thread, so that both groups of test pieces exhibited high-strength bolt pull-out failure at the end of the test. Although the bearing capacity of the JD-2 and JD-4 pieces was not fully utilized, a comparison of the two groups of test pieces revealed that as the web member thickness of the web member increased, the degree of deformation in the ball table area of test piece JD-4 decreased significantly, and the joint’s ability to bear loads increased considerably.
3.2. Load Displacement Curves of Specimens
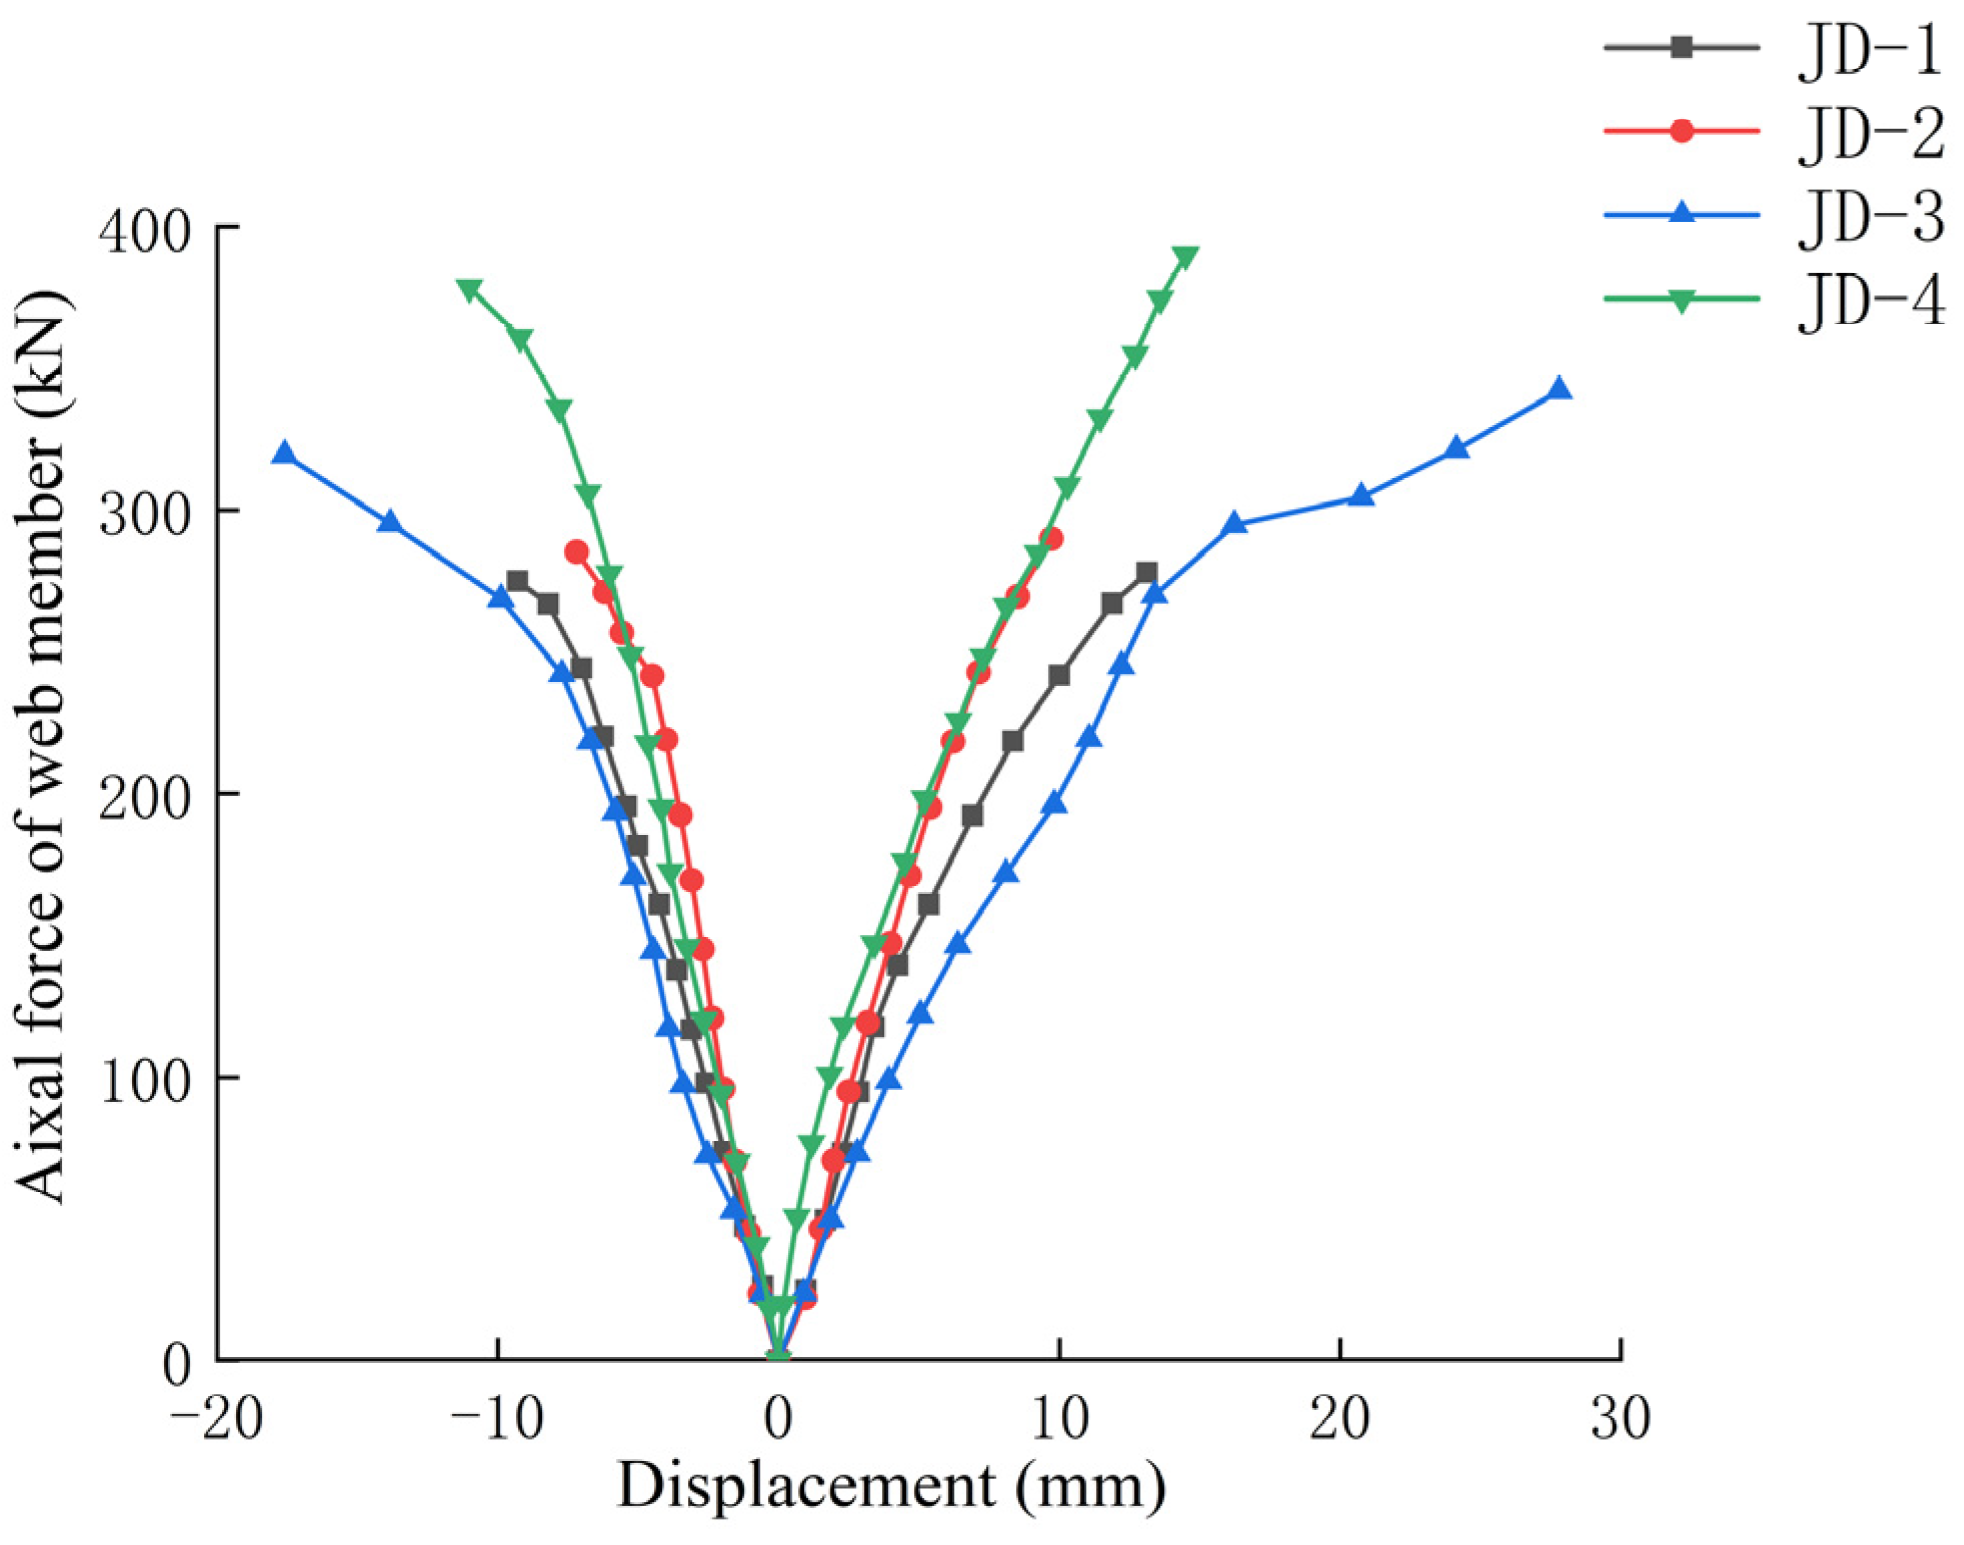
To accurately demonstrate the deformation of the sample under loading, the axial force deformation curves of the tension and thrust web members were plotted for the four joints as shown in Figure 9.
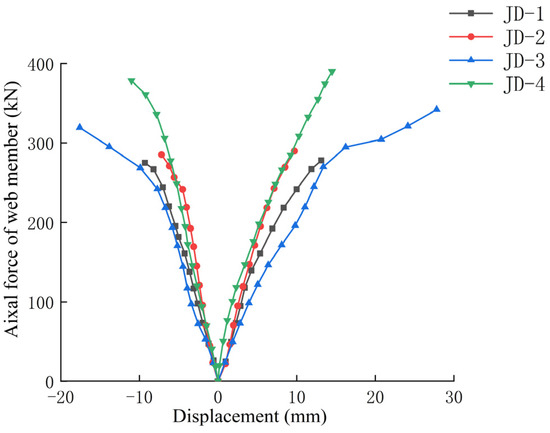
Figure 9.
Axial force displacement curves of web members.
Figure 9 shows that JD-1 to JD-4 show a decreasing trend in the slope of the curve when the tensioned web member load is 180 kN, 240 kN, 200 kN, and 320 kN, respectively. This is due to the obvious plastic deformation exerted on the tensioned side table pressure plate and the ball table support plate. The curve changes of each test piece are different. For JD-1, when the load increased to 278 kN, a substantial reduction in the slope of the curve was observed; at this time, it entered the elastoplastic deformation stage. The weld between the ball table and the ball table support plate on the tension side of test piece JD-1 tore, and the test piece experienced instantaneous failure, ending the test. For JD-2, when the load increased to 290 kN, the slope of the curve decreased significantly, and the sample entered the elastoplastic deformation stage. The high-strength bolts of the tension web member of the JD-2 sample were pulled out of the ellipsoid, and the deformation increased rapidly, causing the joint to exit the working state. For JD-3, when the load increased to 310 kN, the slope of the curve decreased significantly, which was caused by the obvious cracks that appeared on the inner edge of the tension side of the press plate. JD-3 entered the elastoplastic development stage. When the load reached 342 kN, the press plate was completely torn apart, and the joint exited service. For JD-4, when the load increased to approximately 320 kN, the curve of the test piece gradually began to rise, and the test piece entered the elastoplastic working stage. When the load increased to 390 kN, the high-strength bolt connecting the ellipsoid and the tension web member was instantly pulled out. The web member axial force displacement curve was still in the rising stage, but the joint had exited the working state.
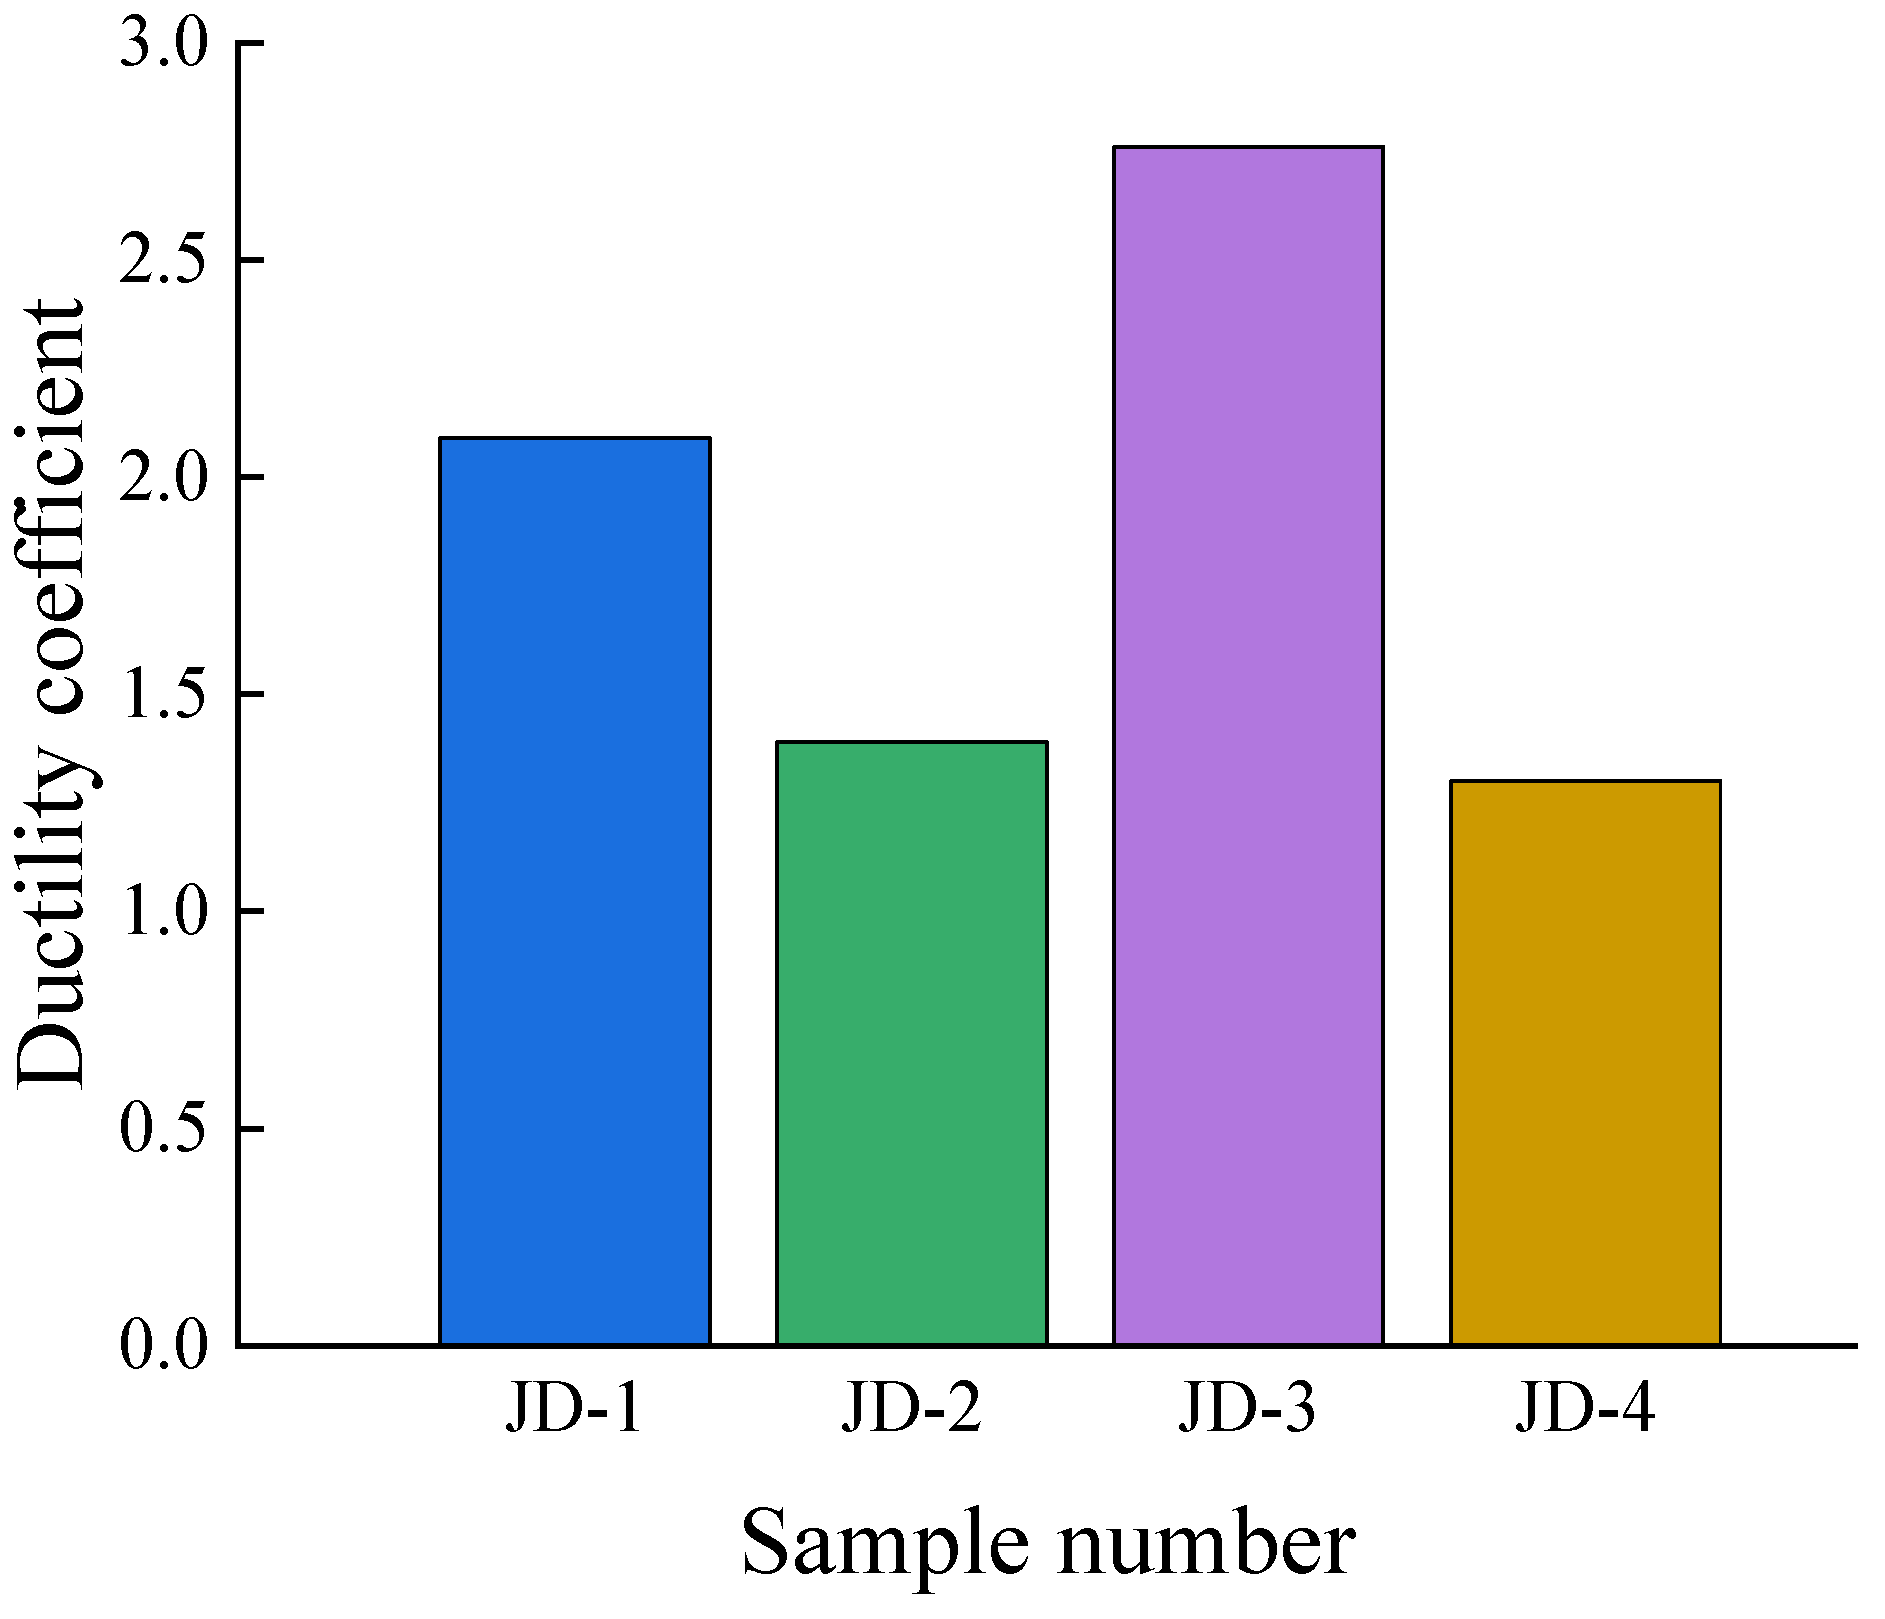
According to the “Code of Test Methods for Seismic Resistance of Buildings” [23], the displacement at which plastic deformation begins at a joint is defined as the yield displacement, and the displacement at which the sample completely fails is defined as the failure displacement. The ductility coefficient of the sample is given by: .
The calculation results are shown in Figure 10. A comparison of the ductility coefficients of JD-1 and JD-3 reveals that when the wall thickness of the ball table is 6 mm and the wall thickness of the web member is increased from 3.5 mm to 5 mm, the ductility coefficient increases by approximately 32.1%, showing a pronounced increase. The ductility coefficients of JD-3 and JD-4 with a 10 mm wall thickness of the ball table are much smaller than those of JD-1 and JD-2, indicating that the total deformation ability of the sample is compromised by the increase in the wall thickness of the ball table. A comparison of the ductility coefficients of JD-3 and JD-4 reveals that when the wall thickness of the ball table is 10 mm and the web member wall thickness is increased to 3.5 mm, the ductility coefficient does not change significantly. This is because the increase in the wall thickness of the ball table leads to high-strength bolts connecting the web member, and the ellipsoid cannot be completely tightened, which ultimately results in the underutilization of the deformation capacity of the sample.

Figure 10.
Ductility factors of samples.
A comparison of the JD-1 and JD-2 curves reveals that under the same thickness of the web member, the two test samples show essentially the same behavior in the elastic stage. However, the JD-2 test piece has a larger slope because the increase in web member thickness results in higher bearing capacity and smaller deformation in JD-2 than in JD-1. The overall test piece is more stable during loading. A comparison of the curves of JD-1 and JD-3 reveals that under the same ball table wall thickness conditions, the elastic-plastic development stage of JD-3 is longer, it has a more obvious plastic deformation stage, and its deformation capacity is better. Thus, increasing the wall thickness of the web member can efficiently increase the deformation and energy absorption ability of the sample.
In summary, no significant deformation or instability occurred during loading for any of the four samples, and the web members were always under axial force. The deformation was coordinated before specimen failure, and the measured deformation was minimal. The wall thicknesses of the ball table and web members of the joint significantly affect the bearing capacity and deformation capacity of this type of joint. An increase in both can significantly enhance the load-bearing ability of the joint. The difference between the two conditions is that increasing the thickness of the table wall improves the overall stiffness of the joint and significantly increases the slope of the curve but reduces the deformation capacity to a certain extent. By contrast, increasing the thickness of the web member significantly improves the joint’s ability to deform and significantly enhances its energy absorption capacity.
3.3. Stress Distribution in Critical Parts
3.3.1. Stress Distribution in the Ball Table Area
The table requires considerable welding work and has complex stress conditions; therefore, stress change analysis was performed on the ball table.
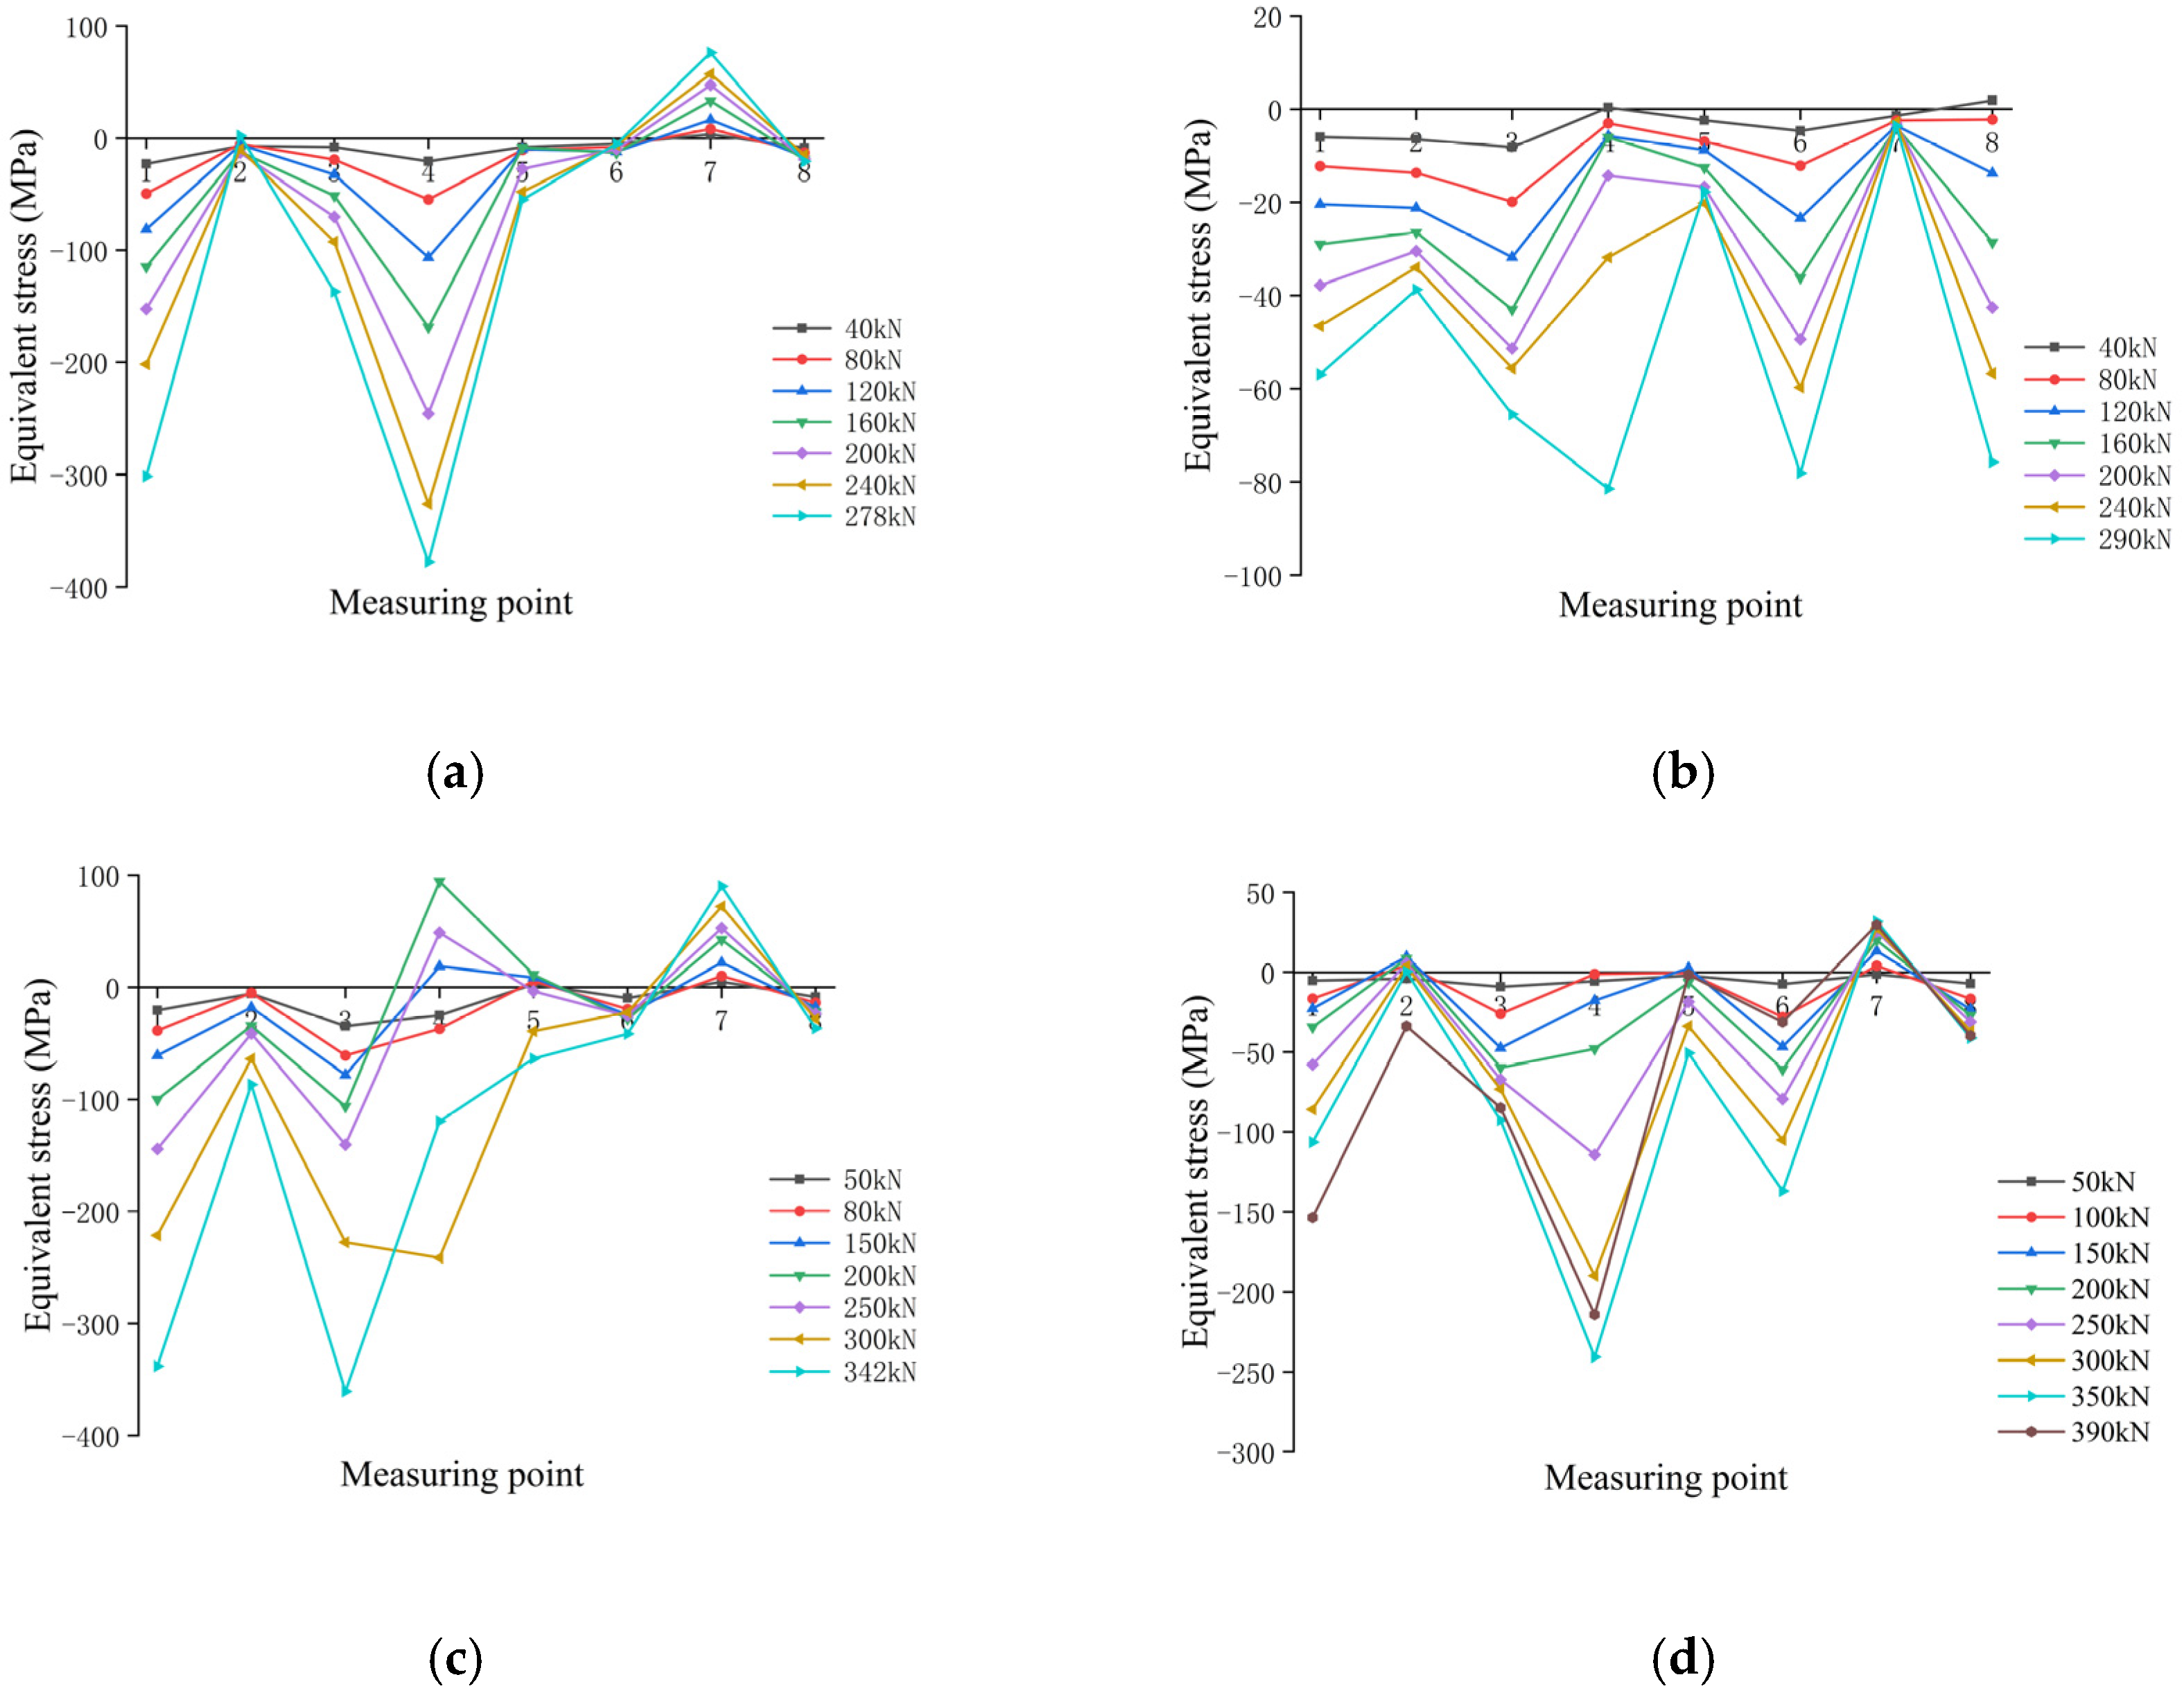
As shown in Figure 11, the maximum stress for the JD-1 samples is observed for measurement point No. 4, corresponding to the weld between the ball table plate and the ball table cylinder along the long axis of the ball table, and the stress value is 378 MPa. The minimum stress is only 2 MPa and is observed at measurement point No. 2 on the cylinder body, which is symmetrical to the long axis of measurement point No. 4. Thus, a large stress variation is observed. This stress variation arises because the ellipsoid warps toward the tension side under the tension and thrust of the two web members and directly collides and extrudes against the ball table cylinder and table support plate at measurement point No. 4, resulting in extremely high compressive stress in this measurement area. However, because two ball trays are present inside the ball table, the internal ellipsoid is deflected toward the ball table cylinder on the tension side under the action of the horizontal force of the tension and thrust web member, there is no direct contact with the area of measurement point No. 2, and it is far from the damaged area of the ball table, so that it is less affected by material deformation. The overall JD-2 stress level is relatively small, with the maximum stress value of 82 MPa observed at test point No. 4 and the minimum stress value of 4 MPa observed at test point No. 7. Before the load is increased to 240 kN, the growth rate at each test point is relatively low, and all test points experience compression stress. When the load increased to 285 kN, the stress at measuring points No. 4, 6 and 8 increased sharply. This increase occurred because at this time, the press plate had undergone plastic deformation, the restraint on the internal ellipsoid had weakened, and the degree of extrusion of the ellipsoid tip against the table cylinder had increased. The maximum stress for the JD-3 sample was 360 MPa and was observed at measurement point No. 3 located at the weld between the cylinder and the support plate in the middle of the ball table along the short axis, while the minimum value of the equivalent stress was 37 MPa and was observed at measurement point No. 8 below measurement point No. 3. Except for test point No. 7, which showed tensile stress, all of the other test points showed compressive stress after the test loading began. When the load increased to 100 kN, the stress at test point No. 4 suddenly changed from compression to tension. This change was caused by the buckling of the two web members under tension and thrust, causing the ellipsoid to warp toward the tension side. The ellipsoid collided with the press plate and was compressed, causing the tip of the ellipsoid, which had previously been pressed against the ball table cylinder, to deflect upward, causing the applied force to deviate from its original direction. When the load increased to 300 kN, the press plate on the side of the tension web member tore. At this time, the stress at the measurement points No. 1, No. 3, and No. 4 jumped significantly, and measurement point No. 4 changed from tensile stress to compressive stress. When the load continued to increase to 342 kN, the tearing of the press plate intensified, the restraining effect on the ellipsoid decreased, the degree of deflection of the ellipsoid increased, the extrusion on the side of the tension web member ball table wall weakened, and the stress at test point No. 4 decreased significantly. The maximum stress on the JD-4 table was 241 MPa and was observed at measurement point No. 4, and the minimum stress was only 1 MPa and observed at measurement point No. 2. JD-4 showed a large stress difference and an uneven overall stress distribution. When the load increased to 250 kN, the stress at measurement point No. 4 jumped sharply. This is because the press plate had undergone plastic deformation at this point, the restraint on the internal ellipsoid had weakened, and the extrusion of the ellipsoid tip in the area of measurement point No. 4 had intensified, resulting in a sudden stress change. When the load increased to 390 kN, the tension web member bolts were pulled out of the bolt ball, and the stresses at the measurement points No. 3, 4, 5, 6 and 8 all decreased significantly.
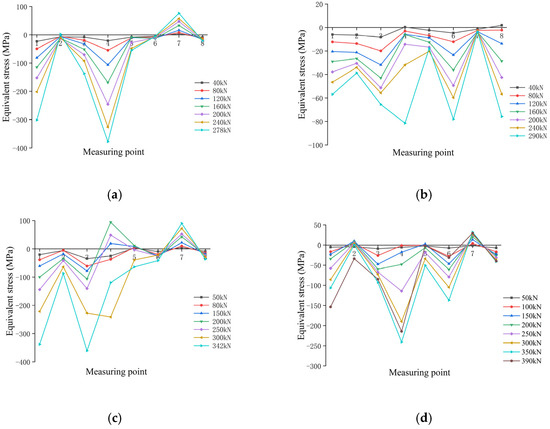
Figure 11.
Equivalent stress curve of the ball table. (a) JD-1, (b) JD-2, (c) JD-3, and (d) JD-4.
Comparison of the JD-1 and JD-2 samples showed that for a web thickness of 3.5 mm, the increase in the ball table wall thickness reduced the maximum stress in the table area from 378 MPa to 82 MPa, corresponding to a decrease of 78%. Comparison of the JD-3 and JD-4 samples showed that for a web thickness of 5 mm, the increase in the table wall thickness reduced the maximum value from 360 MPa to 241 MPa, corresponding to a decrease of 33%. Under the condition of the same web member thickness, as the ball table wall thickness increased, the peak value of the equivalent stress in the ball table area showed a significant downward trend, but a large stress difference between the measurement points still existed. The ball table’s radial stiffness was significantly increased by increasing its wall thickness, which weakened the deformation of the joint and facilitated the stress distribution on the pressure plate, weakening the stress concentration at measurement point No. 4. However, due to the ellipsoid shape, the inner part of the ball table and the main contact area of the ellipsoid are very small, so that the stress level is small for most of the measurement points, leading to a large stress difference from the high-stress area of the ball table.
Comparison of the JD-1 and JD-3 samples showed that for the wall thickness of the ball table of 5 mm, when the wall thickness of the web member increased, the load-bearing ability of the joint increased from 278 kN to 342 kN, corresponding to an increase of 23%, and the maximum decreased from 378 MPa to 360 MPa, corresponding to a decrease of 5%. When the ball table wall thickness is 10 mm, the high-strength bolts of the JD-2 and JD-4 tensile web members are in a false tightening state. Comparison of the two ball table area stress distributions showed that as the web member wall thickness increased from 3.5 mm to 5 mm, the joint load carrying capacity increased from 290 kN to 390 kN, corresponding to an increase of 34%, and the maximum stress increased from 82 MPa to 241 MPa, corresponding to an increase of 194%. When the wall thickness of the ball table remains constant, an increase in the wall thickness of the web member results in significant improvements in the joint bearing capacity, and under the same load, the maximum shows a decreasing trend, but overall, a large difference between the maximum stress and minimum stress still exists; this is because the increase in the wall thickness of the web member improves the ductility of the sample, and the overall deformation of the sample increases, while the ball table set up two groups of spherical pallets to a greater extent to limit the ellipsoid deflection. The tip of the ellipsoid that provides the horizontal force of the web member always collides with the ball table No. 4 measurement point area, giving rise to stress concentration in this area.
In summary, the stresses in the ball table region were consistently higher on the tension side across all specimens. The overall stress distribution in the ball table was non-uniform, exhibiting significant variation. When the wall thickness of the web member was held constant, increasing the wall thickness of the ball table decreased the maximum stress value, thereby alleviating the stress concentration. Conversely, when the wall thickness of the ball table was held constant, increasing the wall thickness of the web member resulted in lower stress levels at the same measurement points under the same load conditions. This better utilized the bearing and deformation capacity of the structure.
3.3.2. Stress Distribution of the Pressure Plate
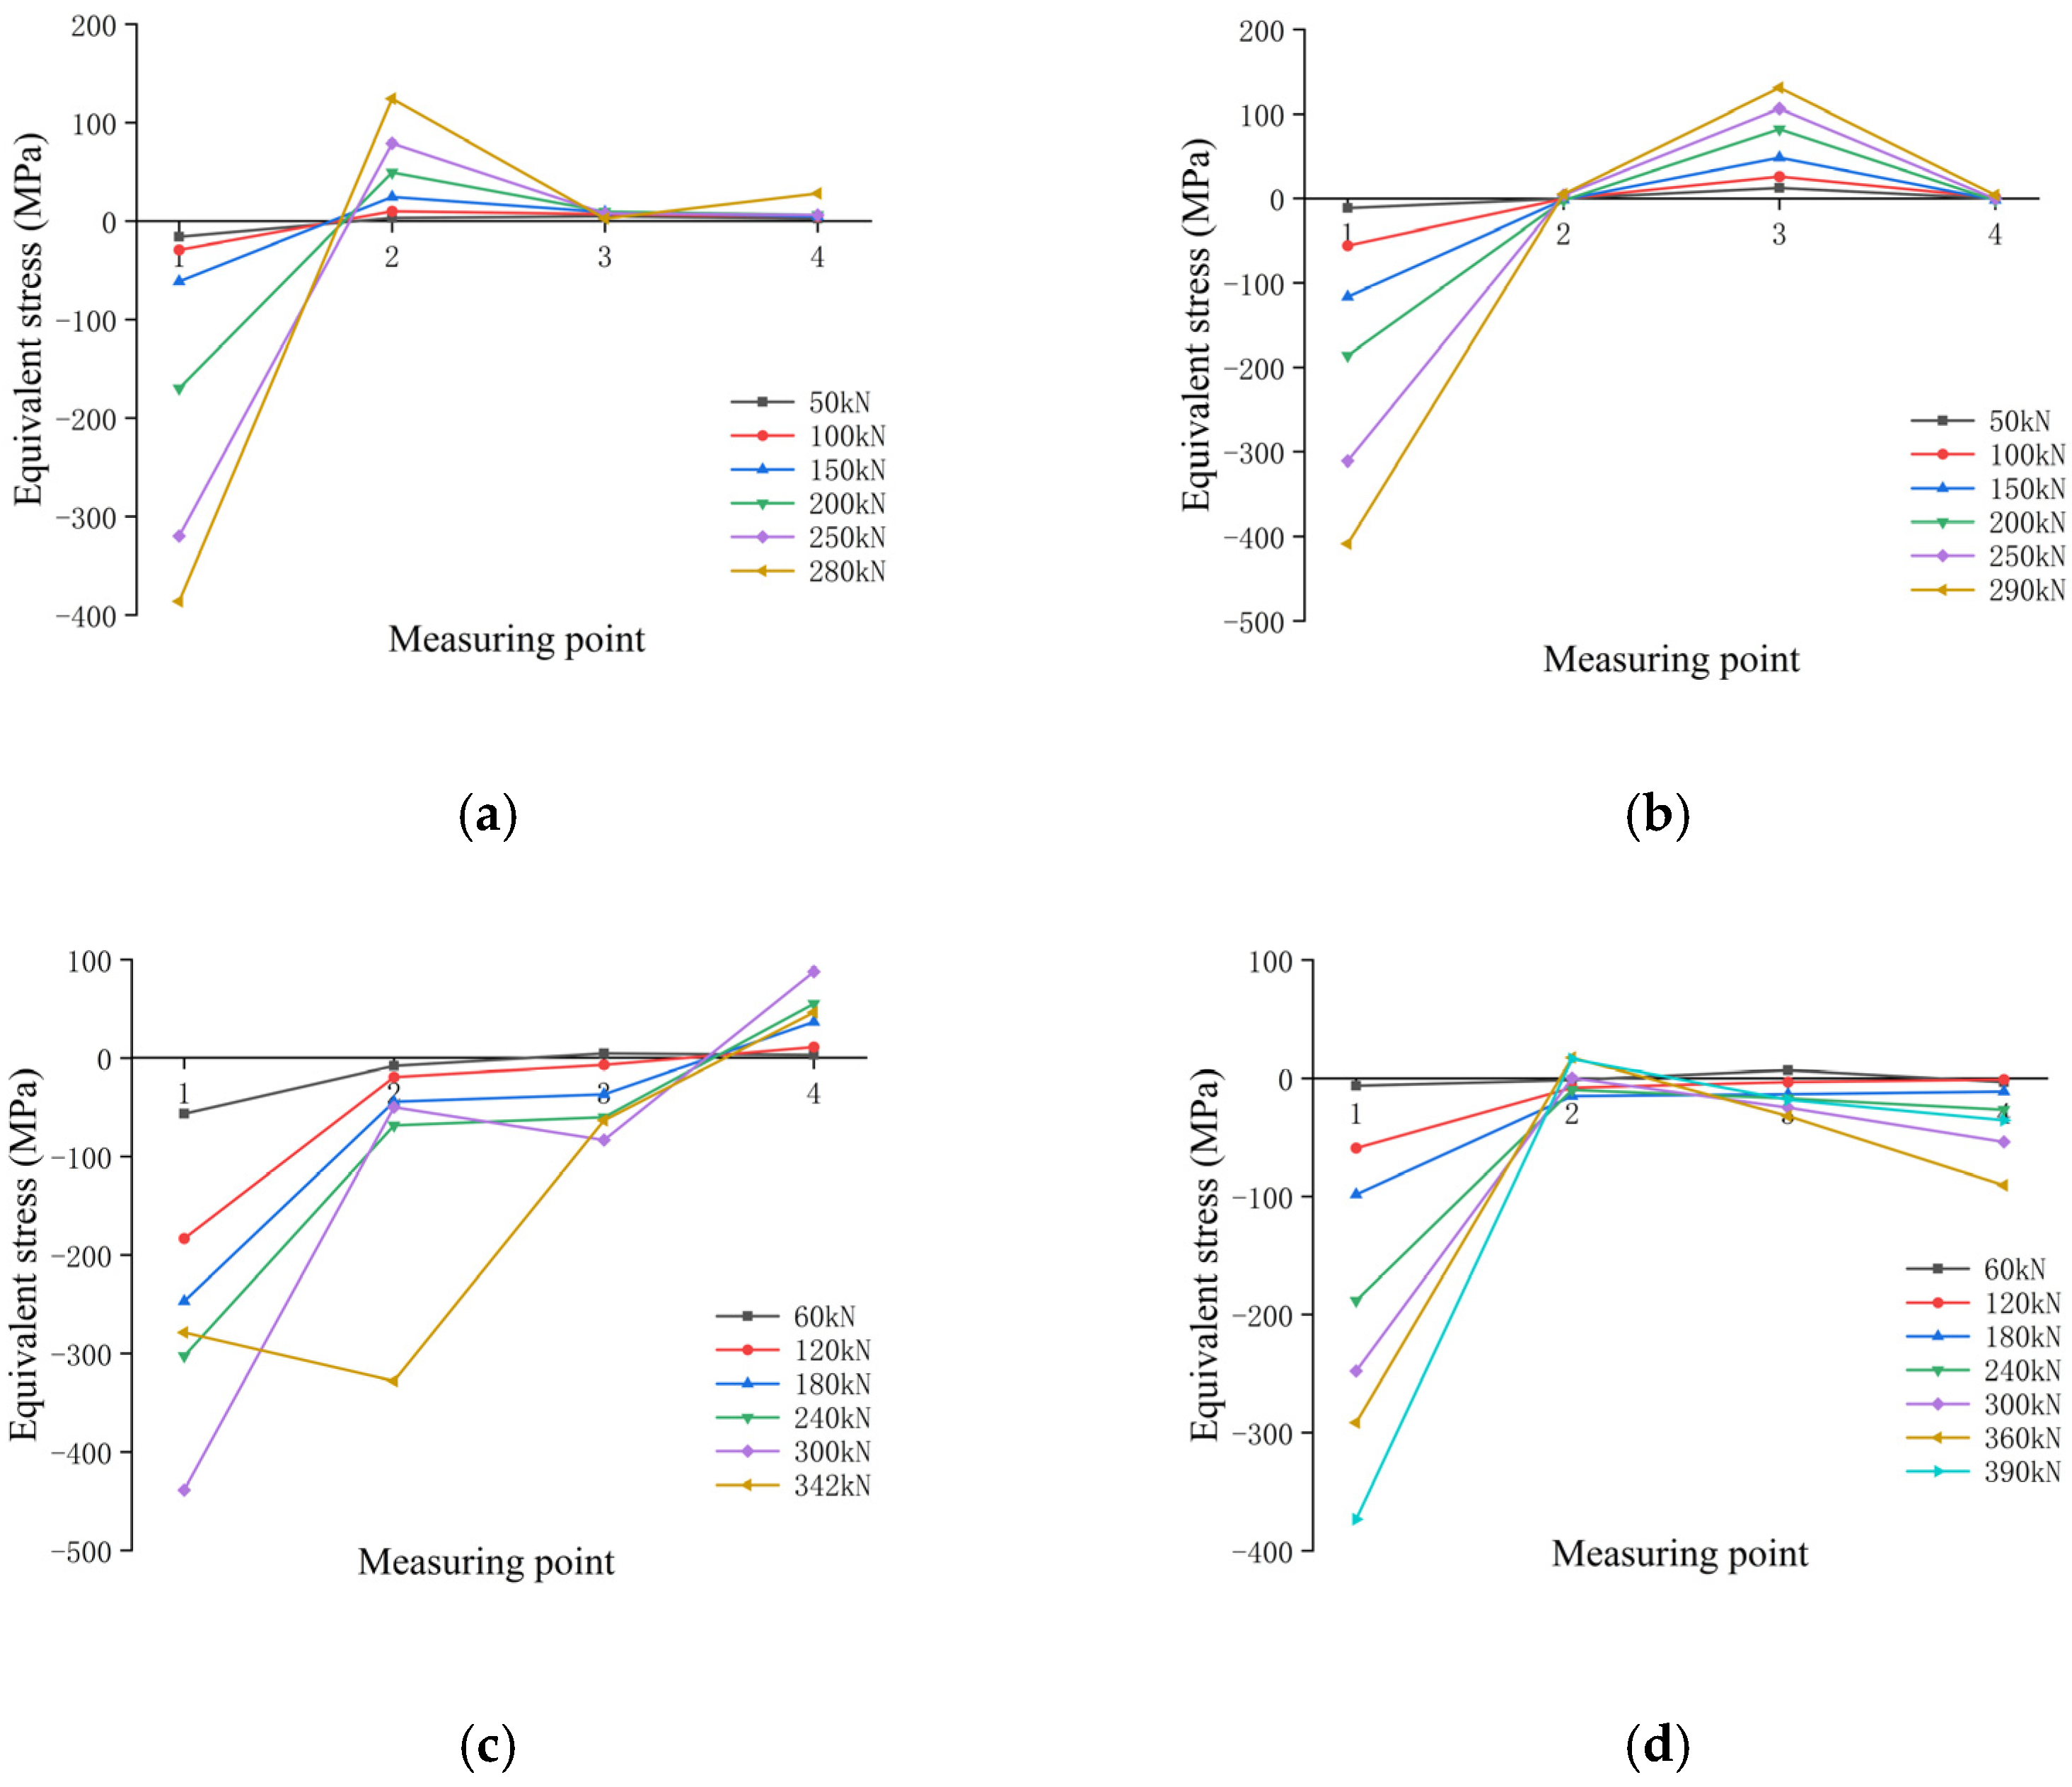
As an important load-bearing part to restrain the upward rotation of the ellipsoid, the internal ellipsoid is extruded, and can easily tear and become damaged. To clearly understand the damage process and stress distribution in the loading process, it is highly important to analyze the stress. Figure 12 shows the stress distribution for each sample. The maximum equivalent stresses of the four joints are found at the measurement point No. 1, and for all four samples, the measurement point No. 1 and the various parts of the pressure plate show high stress variations due to the loading process. In the test, the two limbs of the web member are under tensile stress, thrusting under the action of the ellipsoid to the tensile side of the warping, but the other measurement points are in different conditions. The equivalent stress at point 1 of JD-1 reached 386 MPa at maximum tension, that at point 2 reached 124 MPa, and the stresses at the remaining points were lower. Due to the ellipsoid warpage, the measurement point No. 2 slightly deviated from the axis, which led to deflection and extrusion to the side of the No. 2 measuring point, causing a certain deformation of the curved bevel here, giving rise to tensile stress. The stress at measurement point No. 1 of JD-2 reached 408 MPa, and that at measuring point No. 3 was 131 MPa. When the wall thickness of the JD-2 ball table increased to 10 mm, there was collision and interference between the pressure plate and the thrusted web member sleeve, leading to extrusion and deformation at measuring point No. 3. The tensile force at the JD-3 pressure plate measurement point No. 1 was approximately 300 kN, with a maximum value of 438 MPa. When loaded to the destruction load of 342 kN, the equivalent stress of measurement point No. 1 was reduced to 279 MPa. This point is located in the short axis direction of the pressure plate measurement point No. 2, with a higher stress of 328 MPa; owing to the presence of a large pressure plate, the stress is very poor. The maximum stress was small before loading to 300 kN, but after loading to the destructive load, the pressure plate was completely torn and the deformation was generated dramatically, leading to a sharp jump in the stress at the testing point; this was due to the fact that during the loading process, the ellipsoid warped to the tensile side, and a processing error inevitably occurred in the processing of the pressure plate. The short axis direction and the ellipsoid body do not fully adhere to the ellipsoid body, resulting in the ellipsoid extruding toward the No. 4 position. When the load reached 360 kN, the stress at measurement point No. 4 jumped, and as the load further increased, the JD-4 specimen in the destruction of the tensile web member was extracted, and then the stress at measurement point No. 4 stress dropped significantly.
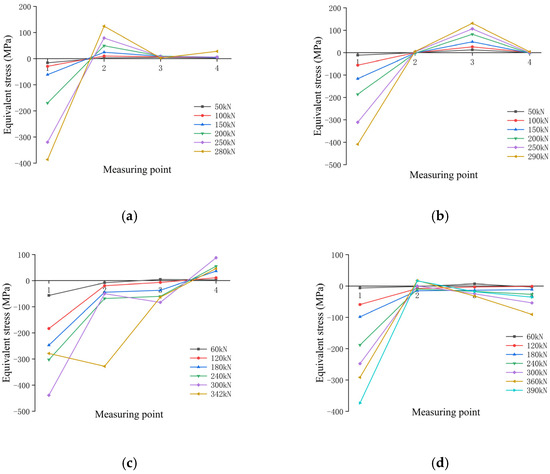
Figure 12.
Equivalent stress curve of pressure plate. (a) JD-1, (b) JD-2, (c) JD-3, and (d) JD-4.
A comparison of the JD-1 and JD-2 samples revealed that when the wall thickness of the web member was 3.5 mm, as the thickness of the ball table wall increased, the maximum value of the equivalent stress at measurement point No. 1 decreased from 386 MPa to 342 MPa, corresponding to a decrease of 11%. Comparison of the JD-3 and JD-4 samples showed that when the ball table wall thickness was 5 mm, as the wall thickness of the table increased, the maximum wall thickness decreased from 438 MPa to 373 MPa, corresponding to a decrease of 15%. Under the same conditions of web member wall thickness, when measurement point No. 1 was the main stress area, an increase in the ball table wall thickness led to a clear decrease in the stress area of measurement point No. 1; this is because the thicker walls of the ball table significantly improve the radial stiffness, weaken the joint deformation, improve overall energy consumption capacity, promote the pressure plate stress diffusion, and thus decrease the stress at measurement point No. 1.
Comparison of the JD-1 with JD-3 samples showed that under the condition that the wall of the ball table was 6 mm thick, as the web member’s thickness increased, the maximum stress at measurement point 1, which is the main stress-stricken part of the pressure plate, increased from 386 MPa to 438 MPa, corresponding to an increase of 13%. When the ball table wall thickness was 10 mm, the JD-2 and JD-4 tensile web member bolts were in the false tightening state. Comparison of the stress distributions of the two pressure plate showed that as the thickness of the web member wall increased, the maximum stress increased from 342 MPa to 373 MPa, corresponding to an increase of 9%. Under the same wall thickness of the ball table, with an increase in the wall thickness of the web member, the stress level in this region decreased significantly under the same load. An increase in the wall thickness of the web member increases the ability of the sample to deform overall, weakens deformation of the ball table and the pressure plate, improves the overall energy dissipation capacity, and promotes the diffusion of the stress in the pressure plate, thus weakening the stress concentration at measurement point No. 1.
In summary, it is evident that the wall thickness of the ball table and the web member significantly influence the stress values in the pressure plate. The maximum stress values for all specimens were observed at No. 1. This is attributed to the upward movement of the constrained ellipsoid, which is squeezed by the tip of the ellipsoid on the tension side. The specimens exhibited large stress extremes, and the test variables had a relatively minor effect on these extremes. It has been concluded that, under the same load, increasing the wall thickness of the ball table and the web member can significantly reduce the stress concentration at No. 1 of the pressure plate. This improvement enhances the working performance of the pressure plate.
4. Finite Element Analysis
Due to the limited number of samples, an Abaqus finite element model was established and parametrically expanded to analyze the specific effects of the ball table wall thickness and web member wall thickness on the joint bearing capacity and the damage mode.
4.1. Pre-Processing
First, the actual test sample was modeled in 1:1 3D using the SolidWorks software, and the related material properties were defined by the ABAQUS software. In the finite element definition of the material, the steel adopts the quadratic plastic flow model proposed by Han Linhai to characterize the material properties, such as 20 Mn, and the concrete inside the material applies the Han Linhai stress–strain model together with the plasticity damage model to simulate the behavior of the concrete in the plastic deformation stage [26]. In simulating the interaction between the steel pipe and the concrete, tangential contact was defined as “hard contact”, whereas for normal contact, a friction coefficient of 0.5 was applied as “penalty friction”. A similar contact setup was applied to the steel ball, where the friction coefficient was set to 0.15. Other contacts are defined by Tie binding [27].
According to the relevant literature, the core concrete, steel pipe and other components in this type of steel pipe concrete tower column were modeled by eight-node linear hexahedral C3D8R cell element for meshing, while the ellipsoid cannot be modeled by the hexahedral cell setup due to the special structure of the bolt opening; thus, tetrahedral cell mesh division was adopted. One side of the tower column was welded with a loading plate and connected to the bearing support through bolts, and ground bolts attached the other side to the supporting beam, so that one end was fixed, and the other end was set up with a sliding support for the definition of the model. The end of the loading plate was connected to the loading device through bolts and the boundary conditions were set up as a sliding support.
4.2. Damage Pattern Analysis
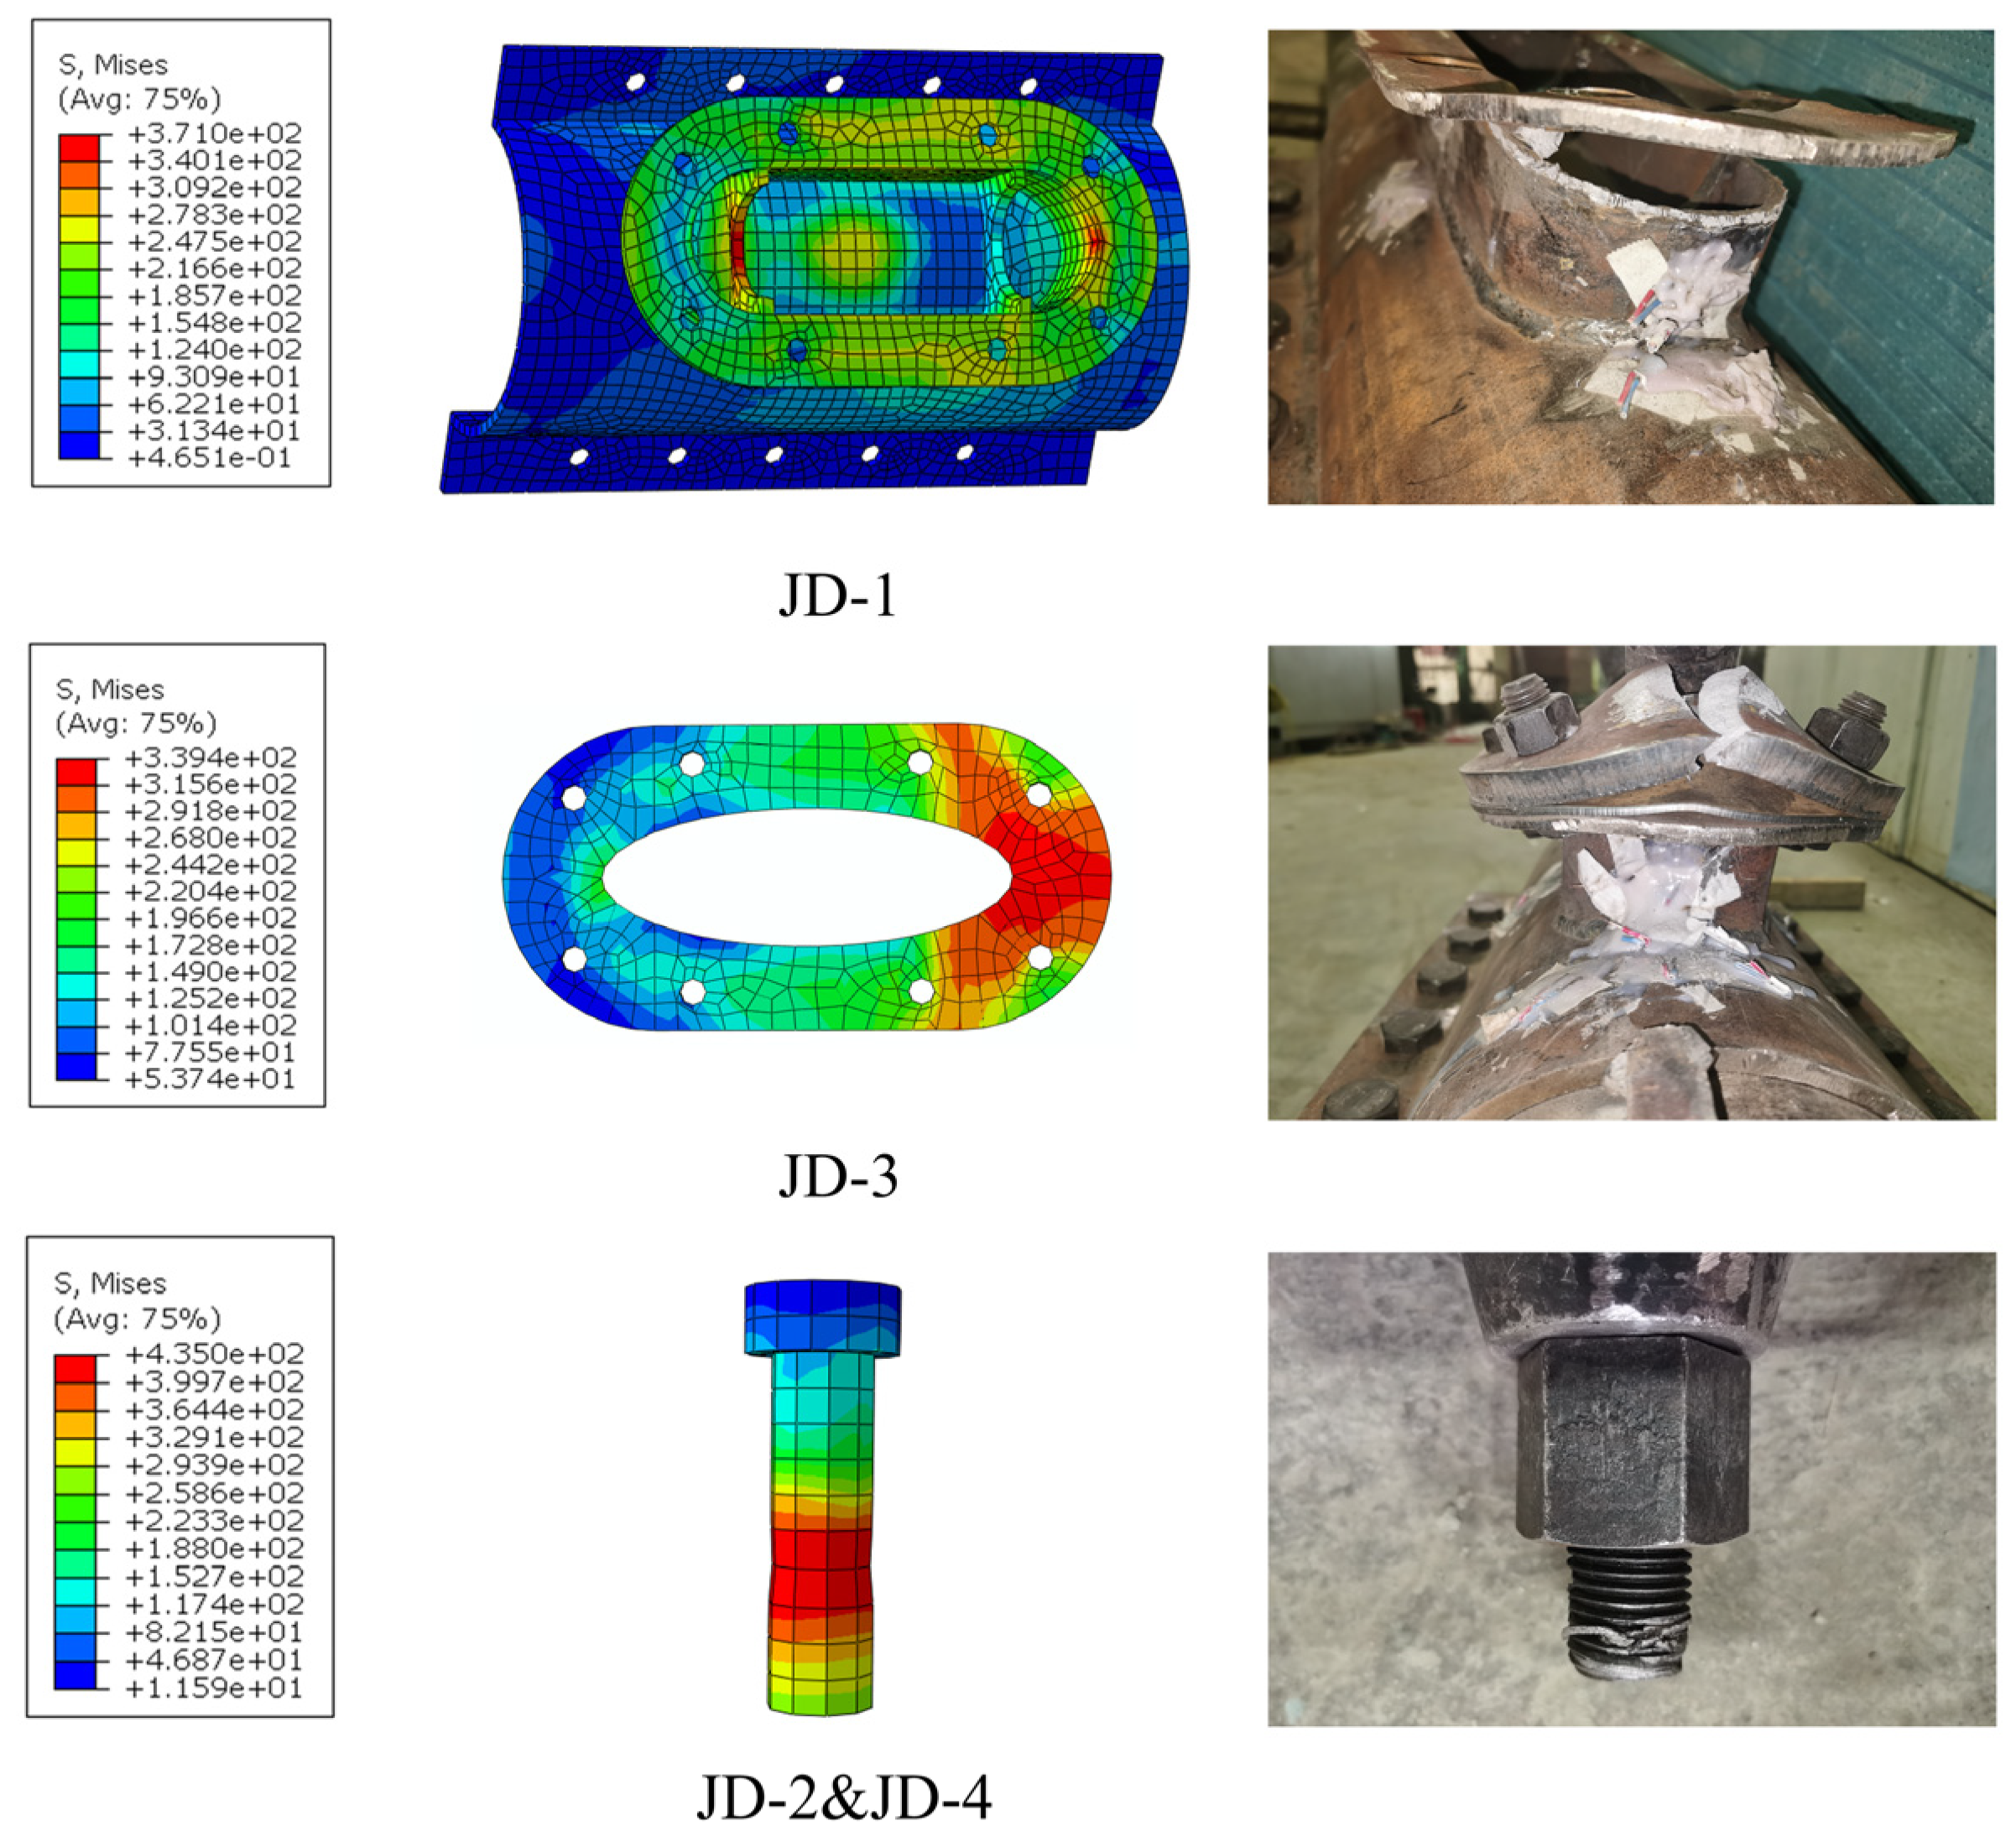
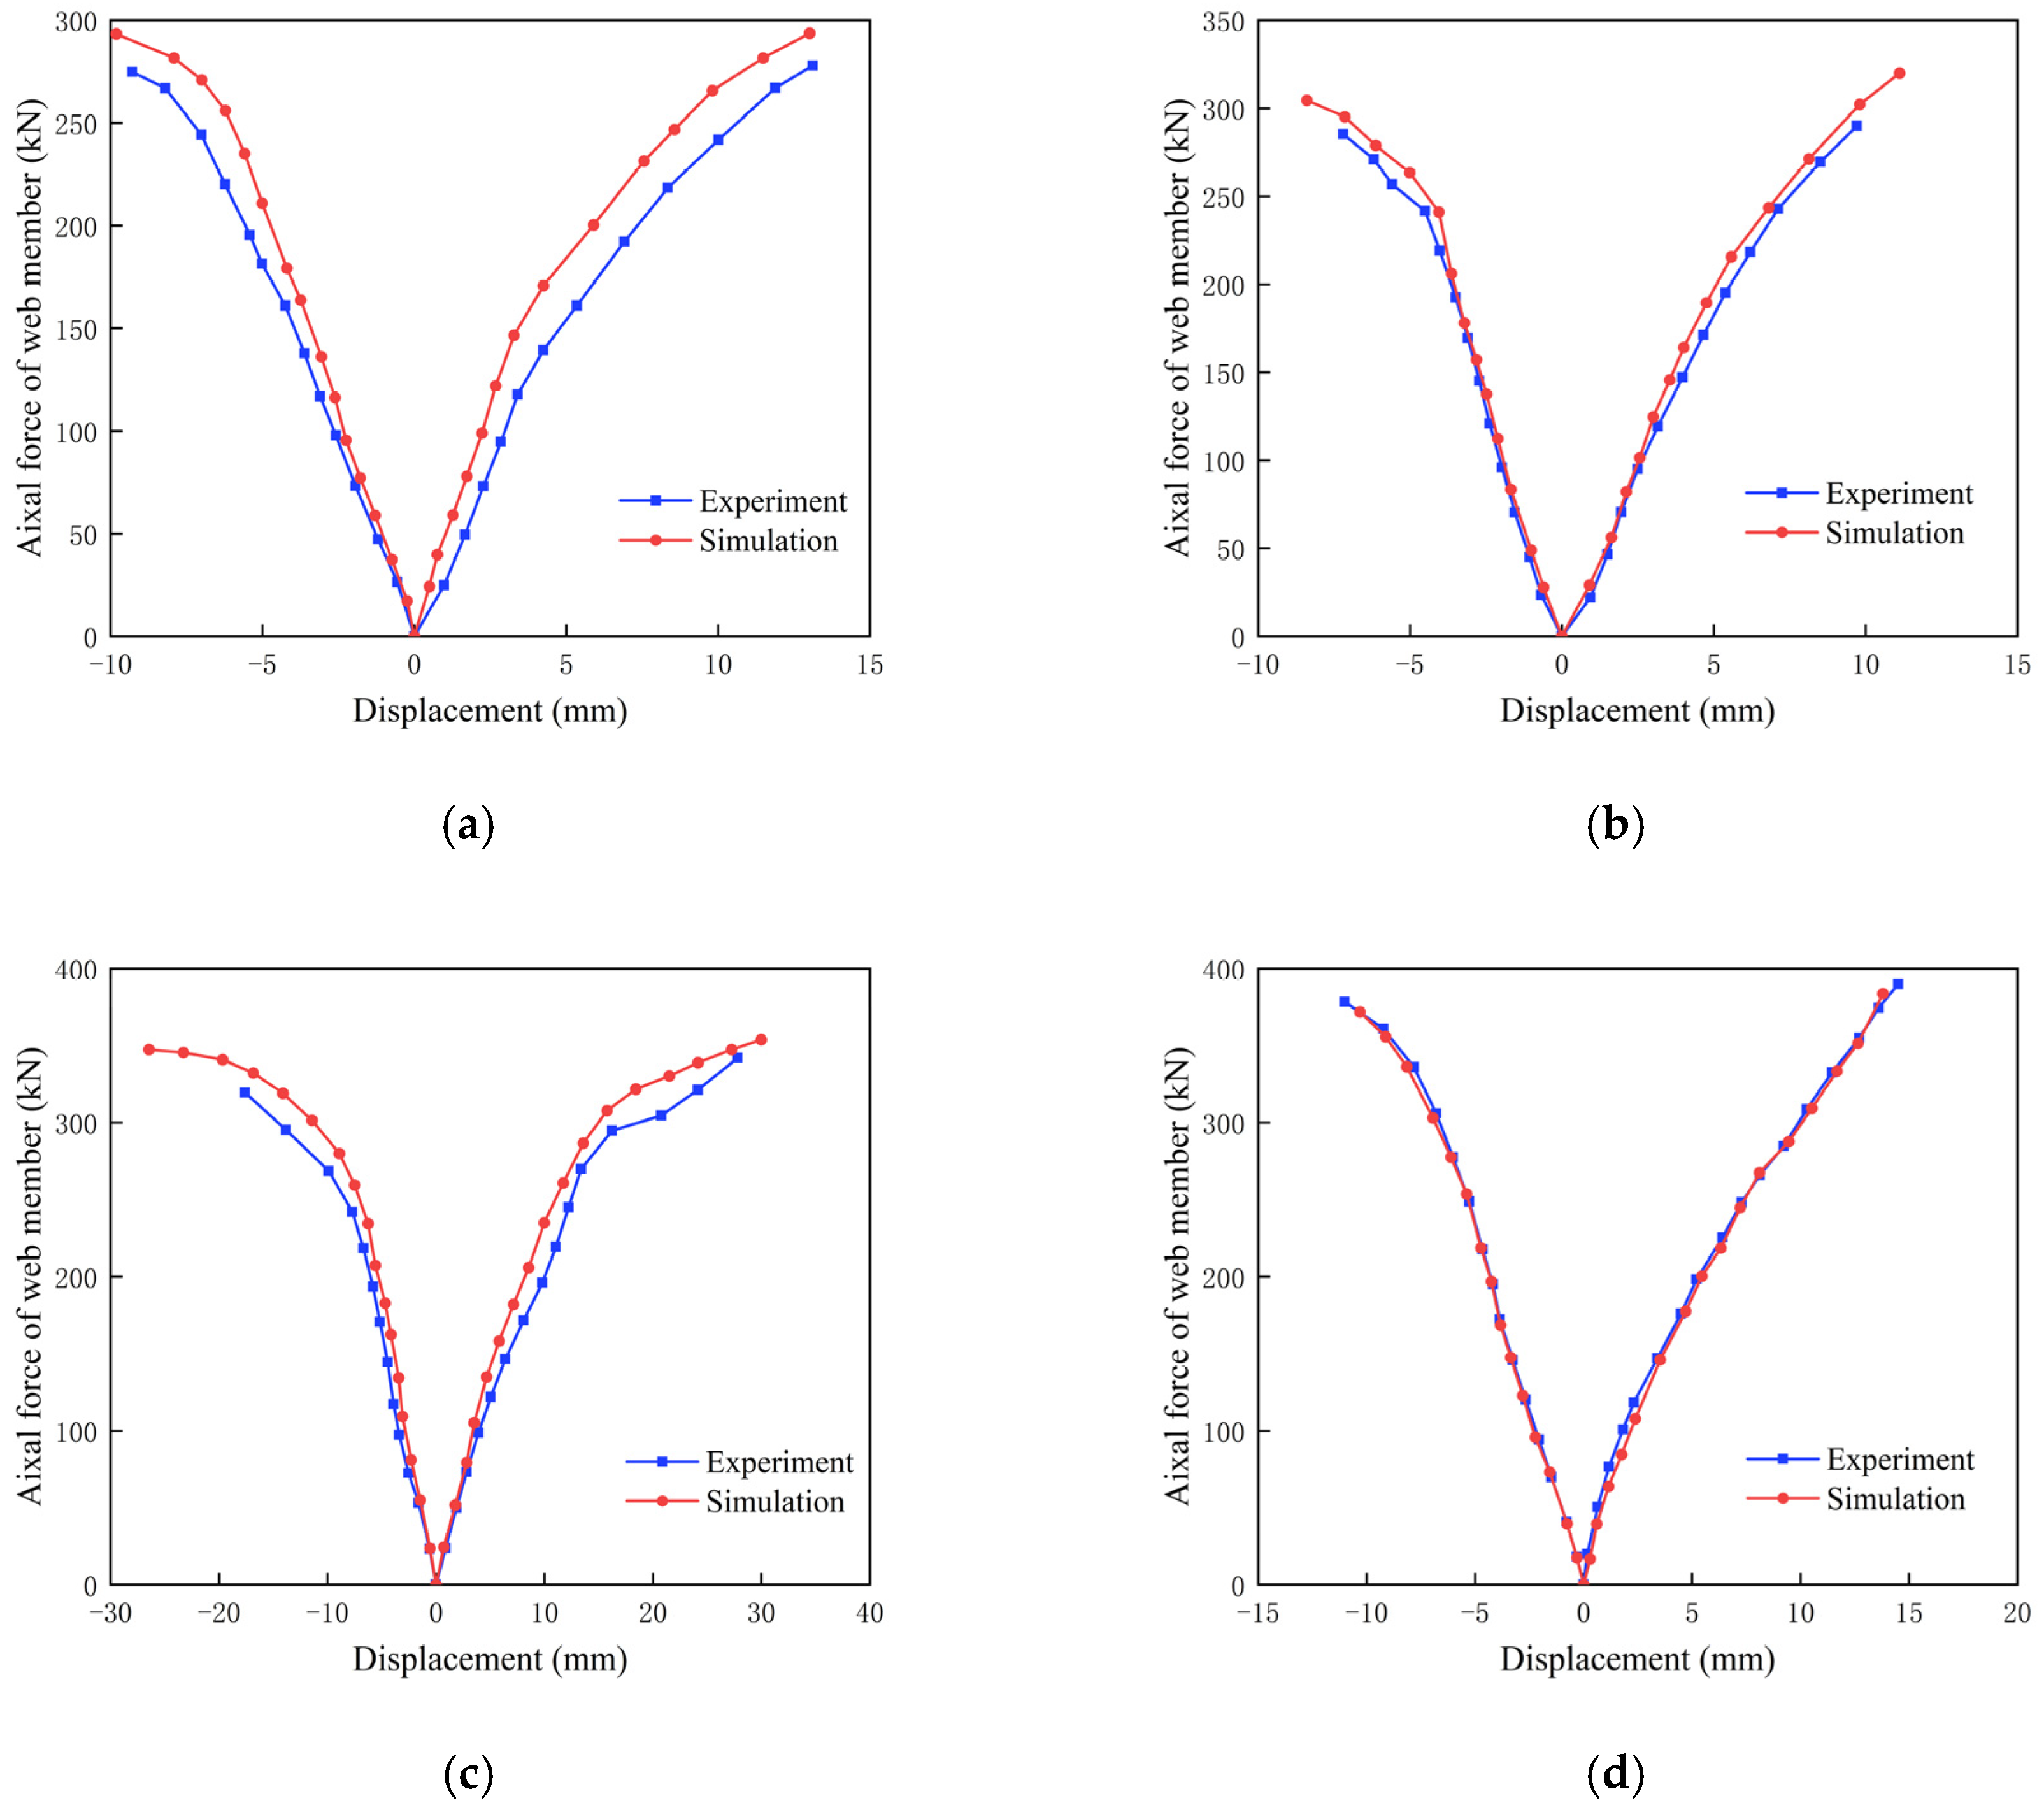
The finite element simulation results are shown in Figure 13. Comparison of the red high-stress area in the cloud diagram with the actual damaged parts of the four samples shows that the model simulation of the damage phenomenon and the actual test damage morphology are in agreement, and the high-stress area of the sample coincides with the damaged parts of the four samples. A comparison of the damaged parts was conducted, namely JD-1 for the ball table cylinder and pressure plate tensile side weld tear, JD-3 for the pressure plate tensile side tear, JD-2 and JD-4 for the tensile web member and ellipsoidal connection of high-strength bolt thread damage. These parts, according to the results of the finite element analysis, are also high-stress areas (red areas). The equivalent stress distribution of each major component is closer to the equivalent stresses measured at the corresponding test points of the sample. By extracting the axial force and displacement of the web member from the finite element analysis results, the load-displacement curves were plotted and compared to the test results, as shown in Figure 14 and Table 4. The error between them is within 11%, indicating that the finite element analysis results and the test results have a high degree of agreement, and the trends of the curves are also highly similar. This shows that ABAQUS can accurately simulate these types of joints and can be used for the subsequent investigation of a greater range of parameters.
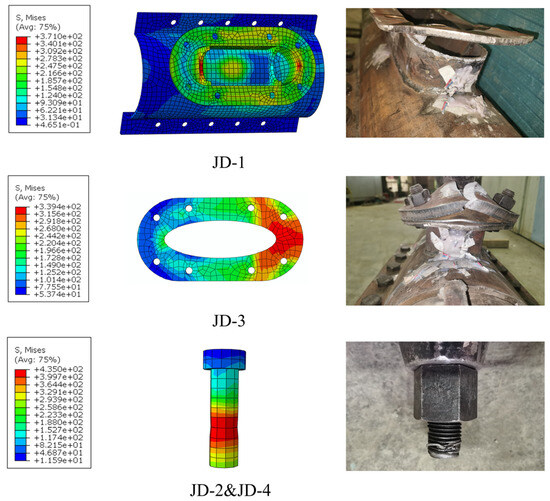
Figure 13.
Comparison of test failure characteristics.
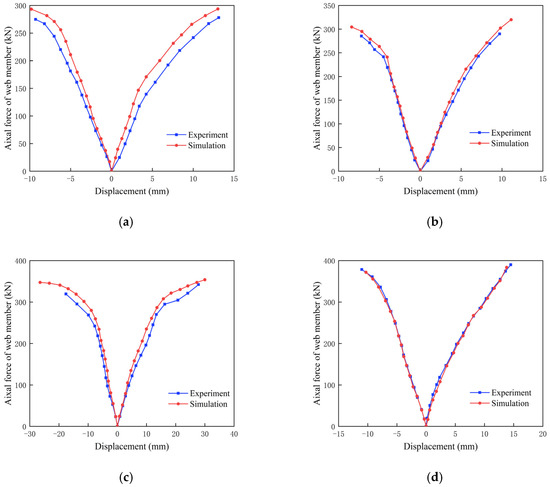
Figure 14.
Comparison diagram of load displacement curve of web member. (a) JD-1, (b) JD-2, (c) JD-4, and (d) JD-4.
Table 4.
Finite element simulation accuracy.
4.3. Parameter Expansion
Due to the limited number of samples, to investigate the effects of the wall thickness of the ball table and web member on the damaged pattern and loading capacity in detail, a greater range of the sample parameters were investigated by finite element simulations.
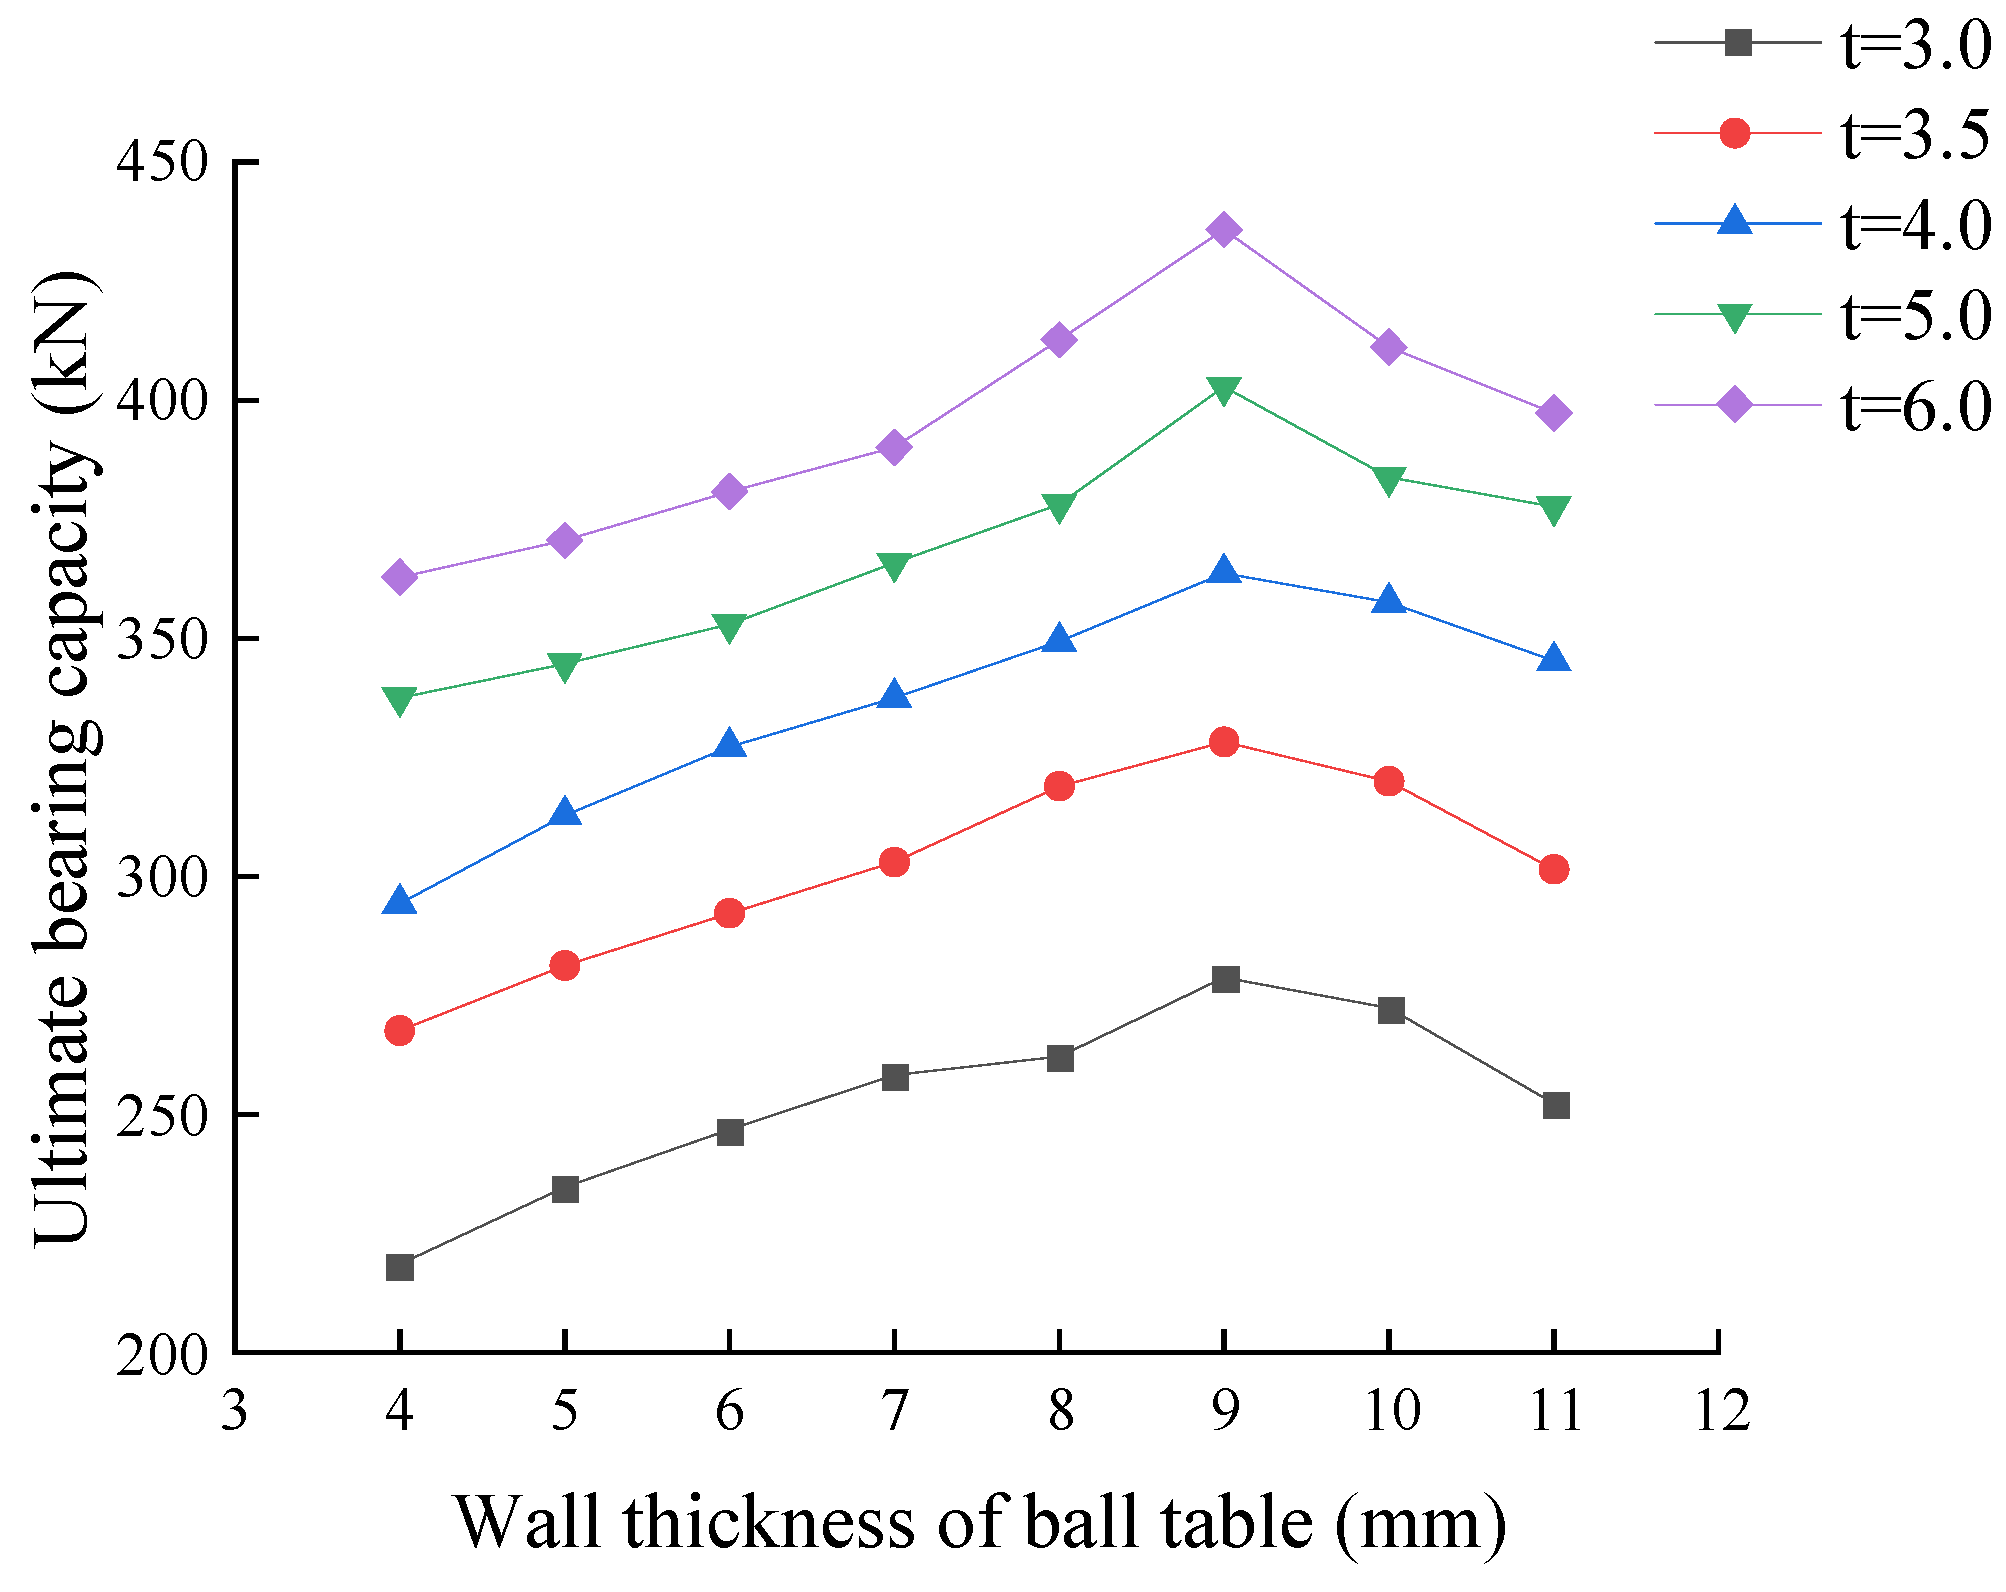
The specific expansion parameters are shown in Table 5, and the changes in the bearing capacity parameters were plotted, as presented in Figure 15. In the case of the same wall thickness of the web member, with a thicker wall on the ball table, the early curve slope is smoother, and the joint load capacity improves; however, when the thickness reaches 10 mm and 11 mm, the joint bearing capacity shows a significant decreasing trend. ‘‘this is because with the increase in the ball table wall thickness, the ball table’s radial stiffness is greatly improved, the ability to resist ellipsoid extrusion deformation is greatly strengthened, the joint damage mode from the tensile side support plate weld tearing into the pressure plate material damage. and the joint’s energy dissipation capacity is significantly enhanced. However, when the wall thickness of the ball table becomes 10 mm, collision interference between the web member bolt sleeve and the ball table pressure plate occurs, resulting in a false tightening state of the bolts, so that the joint load carrying capacity cannot be fully utilized and the curve begins to show a downward trend. Therefore, the ellipsoidal joint is recommended for subsequent design improvement, and the ball table wall thickness should not be greater than 10 mm. An increase in the wall thickness of the web member from 3.5 mm to 5 mm leads to a clear increase in the load-bearing capacity of the joint and a steeper curve slope, but exceeding 5 mm reduces the sensitivity of the joint; with thicker walls, the load-bearing sensitivity of the joint diminishes, leading to a gradual flattening of the curve. Thicker web member walls contribute to greater stiffness in the web member, and the ability of the web member to resist deformation is strengthened. The joint energy-consuming capacity is further increased, but when the wall thickness is greater than 5 mm, the web member stiffness and the joint overall stiffness are not coordinated, the web member performance cannot be fully utilized, the utilization of the material is reduced dramatically, and the joint’s load-bearing capacity enters a plateau. Therefore, for the ellipsoidal joint’s web member, to guarantee that the joint’s stiffness is coordinated and that each component operates effectively, it is advised that the web member’s wall thickness should not exceed 5 mm.
Table 5.
Ball table and web member parameter expansion.
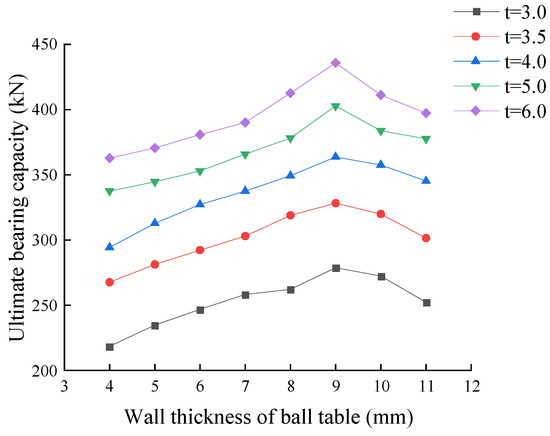
Figure 15.
Finite element ultimate bearing capacity.
5. Conclusions
(1) The parts of the ellipsoidal joints that are susceptible to failure are located in the connection area of the tensile web member and ball table, and the damage modes can be divided into three types: tearing damage to the weld joints between the ball table cylinder body and the ball table supporting plate, damage to the pressure plate material, and damage to the tensile web member threads by tensile strength bolts.
(2) The wall thickness of the ball table and the web member strongly affect the joint bearing capacity and damage mode. Increasing the thickness of these walls can effectively enhance the joint’s load-bearing ability. A thicker wall of the ball table significantly improves the overall stiffness of the joint, but leads to a weakening of the deformation capacity to a certain extent. A thicker wall of the web member significantly improves the joint deformation capacity and significantly enhances the energy dissipation capacity.
(3) Thickening the walls of the ball table as well as the web member sections can reduce the peak equivalent stresses, which is conducive to stress diffusion.
(4) According to the results of the finite element method calculations, if the ball table wall thickness exceeds 9 mm, the enhancement effect on the joint’s ability to bear a load is significantly weakened, and a ball table wall thickness of 10 mm negatively affects the joint bearing capacity. When the web member wall thickness exceeds 5 mm, the joint bearing capacity is less sensitive to the increase in the wall thickness.
Author Contributions
Conceptualization, M.L.; writing—original draft preparation, J.M.; writing—review and editing, J.M. and M.L.; investigation, Y.W.; funding acquisition, Y.W. All authors have read and agreed to the published version of the manuscript.
Funding
National Natural Science Foundation of China (51768056).
Data Availability Statement
All data generated or analyzed in this study are included in the published article.
Conflicts of Interest
The authors declare no conflicts of interest.
References
- Shan, L. Structural Performance and Design of Wind Turbine Towers. Master’s Thesis, Harbin Institute of Technology, Harbin, China, 2009. [Google Scholar]
- Zagubien, A.; Wolniewicz, K. The impact of supporting tower on wind turbine noise emission. Appl. Acoust. 2019, 155, 260–270. [Google Scholar] [CrossRef]
- Li, M.; Li, H.; Wen, Y. Design and Performance Study of a Six-Leg Lattice Tower for Wind Turbines. Buildings 2024, 14, 965. [Google Scholar] [CrossRef]
- Wu, Q.; Luo, J.; Yang, Y. Fatigue performance experiment of concrete-filled steel tubular-KK joint. J. Traffic Transp. Eng. 2024, 24, 100–116. [Google Scholar]
- Jiang, L.; Liu, Y.; Zhou, X.; Zhao, X. Calculation Method for the Bearing Capacity of Concrete-filled Steel Tube Joints. China J. Highw. Transp. 2022, 35, 86–100. [Google Scholar]
- Fu, H.; Wang, X.; Luo, K. Analysis of influence of welding residual stress and geometric defects on stability of lattice boom. J. Dalian Univ. Technol. 2022, 62, 60–69. [Google Scholar]
- Pei, J.; Wang, X.; Qin, S. Experimental and Numerical Simulation Study on Residual Stress of Single-Sided Full-Penetration Welded Rib-to-Deck Joint of Orthotropic Steel Bridge Deck. Buildings 2024, 14, 2641. [Google Scholar] [CrossRef]
- Acevedo, C.; Drezet, M.; Nussbaumer, A. Numerical modelling and experimental investigation on welding residual stresses in large-scale tubular K-joints. Fatigue Fract. Eng. Mater. Struct. 2013, 36, 177–185. [Google Scholar] [CrossRef]
- Cao, Y.; Meng, Z.; Zhang, S. FEM study on the stress concentration factors of K-joints with welding residual stress. Appl. Ocean Res. 2013, 43, 195–205. [Google Scholar] [CrossRef]
- Yuan, Z.; Yao, Y.; Lu, W. Hot Spot Stress Distribution of CHS T-joints under Out-of-plane Bending. J. Hunan Univ. 2022, 49, 151–159. [Google Scholar]
- Liu, Y.; Zhao, R.; Jiang, L.; Fu, Y. Study on calculation method for equivalent stress intensity factor of rectangular hollow section k-joints. Eng. Mech. 2023, 40, 182–194. [Google Scholar]
- Wang, J.; Chen, Y.; Guo, Y.; Chen, C.; Sun, B. Experimental study on the mechanical behavior of detached tubular k-joints of narrow foundation transmission towers. Eng. Mech. 2019, 36, 66–70. [Google Scholar]
- Chen, K.; Huang, H.; Wu, Q.; Zheng, Q. Calculation method of stress concentration factor for CFST K-joint. China Civ. Eng. J. 2022, 55, 94–104. [Google Scholar]
- Wang, P.; Wang, Z.; Pan, J.; Chen, L. Investigation on mechanical behavior of X-shaped welded spatial partition plate tubular joints. J. Build. Struct. 2019, 40, 221–229. [Google Scholar]
- Pandey, M.; Young, B. Stress concentration factors of cold-formed high strength steel tubular T-joints. Thin-Walled Struct. 2021, 166, 107996. [Google Scholar] [CrossRef]
- Sakai, Y.; Hosaka, T.; Isoe, A.; Ichikawa, A.; Mitsuki, K. Experiments on concrete filled and rein-forced tubular K-joints of truss girder. J. Constr. Steel Res. 2004, 60, 683–699. [Google Scholar] [CrossRef]
- Ozyurt, E. Axial resistance of elliptical hollow section K-joints made of high strength steel. J. Constr. Steel Res. 2024, 213, 108422. [Google Scholar] [CrossRef]
- Pandey, M.; Young, B. Ultimate resistances of member-rotated cold-formed high strength steel tubular T-joints under compression loads. Eng. Struct. 2021, 244, 10. [Google Scholar] [CrossRef]
- Wen, Y.; Cai, J.; Fu, L. Study on cooperative performance of spherical and plate joints of lattice concrete-filled steel tube wind power tower. Acta Energiae Solaris Sin. 2021, 42, 21–27. [Google Scholar]
- Yu, Y. Mechanical Behavior Research on the Bolt Ball Universal Joints of Concrete Filled Steel Tubular Lattice Wind Tower. Master’s Thesis, Inner Mongolia University of Science and Technology, Baotou, China, 2018. [Google Scholar]
- Wen, Y.; Liu, Z.; Xiong, W. Research on stress performance of universally wrapped assembled joints of lattice wind power tower with concrete-filled steel tube. Sci. Rep. 2023, 13, 1670. [Google Scholar] [CrossRef] [PubMed]
- Wen, Y.; Li, Z.; Yu, J. Mechanical property analysis of spherical Joints of concrete-filled steel tubular wind power towers. J. Southwest Jiao Tong Univ. 2023, 58, 1440–1448. [Google Scholar]
- GB 50017—2017; Standard for Design of Steel Structures. China Architecture & Building Press: Beijing, China, 2017.
- GB50135—2019; Standard for Design of High-Rising Structures. China Planning Press: Beijing, China, 2019.
- Technical Code for Concrete Filled Steel Tubular Structures; China Architecture & Building Press: Beijing, China, 2014.
- Han, L. Concrete-Filled Steel Tubular Structures: Theory and Practice; Science Press: Beijing, China, 2007. [Google Scholar]
- Nassiraei, H. Probabilistic Analysis of Strength in Retrofitted X-Joints under Tensile Loading and Fire Conditions. Buildings 2024, 14, 2105. [Google Scholar] [CrossRef]

Disclaimer/Publisher’s Note: The statements, opinions and data contained in all publications are solely those of the individual author(s) and contributor(s) and not of MDPI and/or the editor(s). MDPI and/or the editor(s) disclaim responsibility for any injury to people or property resulting from any ideas, methods, instructions or products referred to in the content. |
© 2025 by the authors. Licensee MDPI, Basel, Switzerland. This article is an open access article distributed under the terms and conditions of the Creative Commons Attribution (CC BY) license (https://creativecommons.org/licenses/by/4.0/).