
Development of an Optimal Machine Learning Model to Predict CO2 Emissions at the Building Demolition Stage


Abstract
1. Introduction
- Construction of CO2 inventory raw data at the demolition stage based on the analysis of building features, demolition equipment, and energy consumption for 186 buildings;
- Data preprocessing and dataset construction to improve the performance of ML models;
- Development of CO2-prediction models with optimal performance by performing feature engineering and HPs tuning for various ML algorithms;
- Analysis of factors that affect CO2 emissions at the building demolition stage;
- Derivation of a CO2-prediction model with the highest prediction performance and an examination of its generalization performance;
- Proposal of research directions through the comparison of results with previous studies and discussion.
2. Materials and Methods
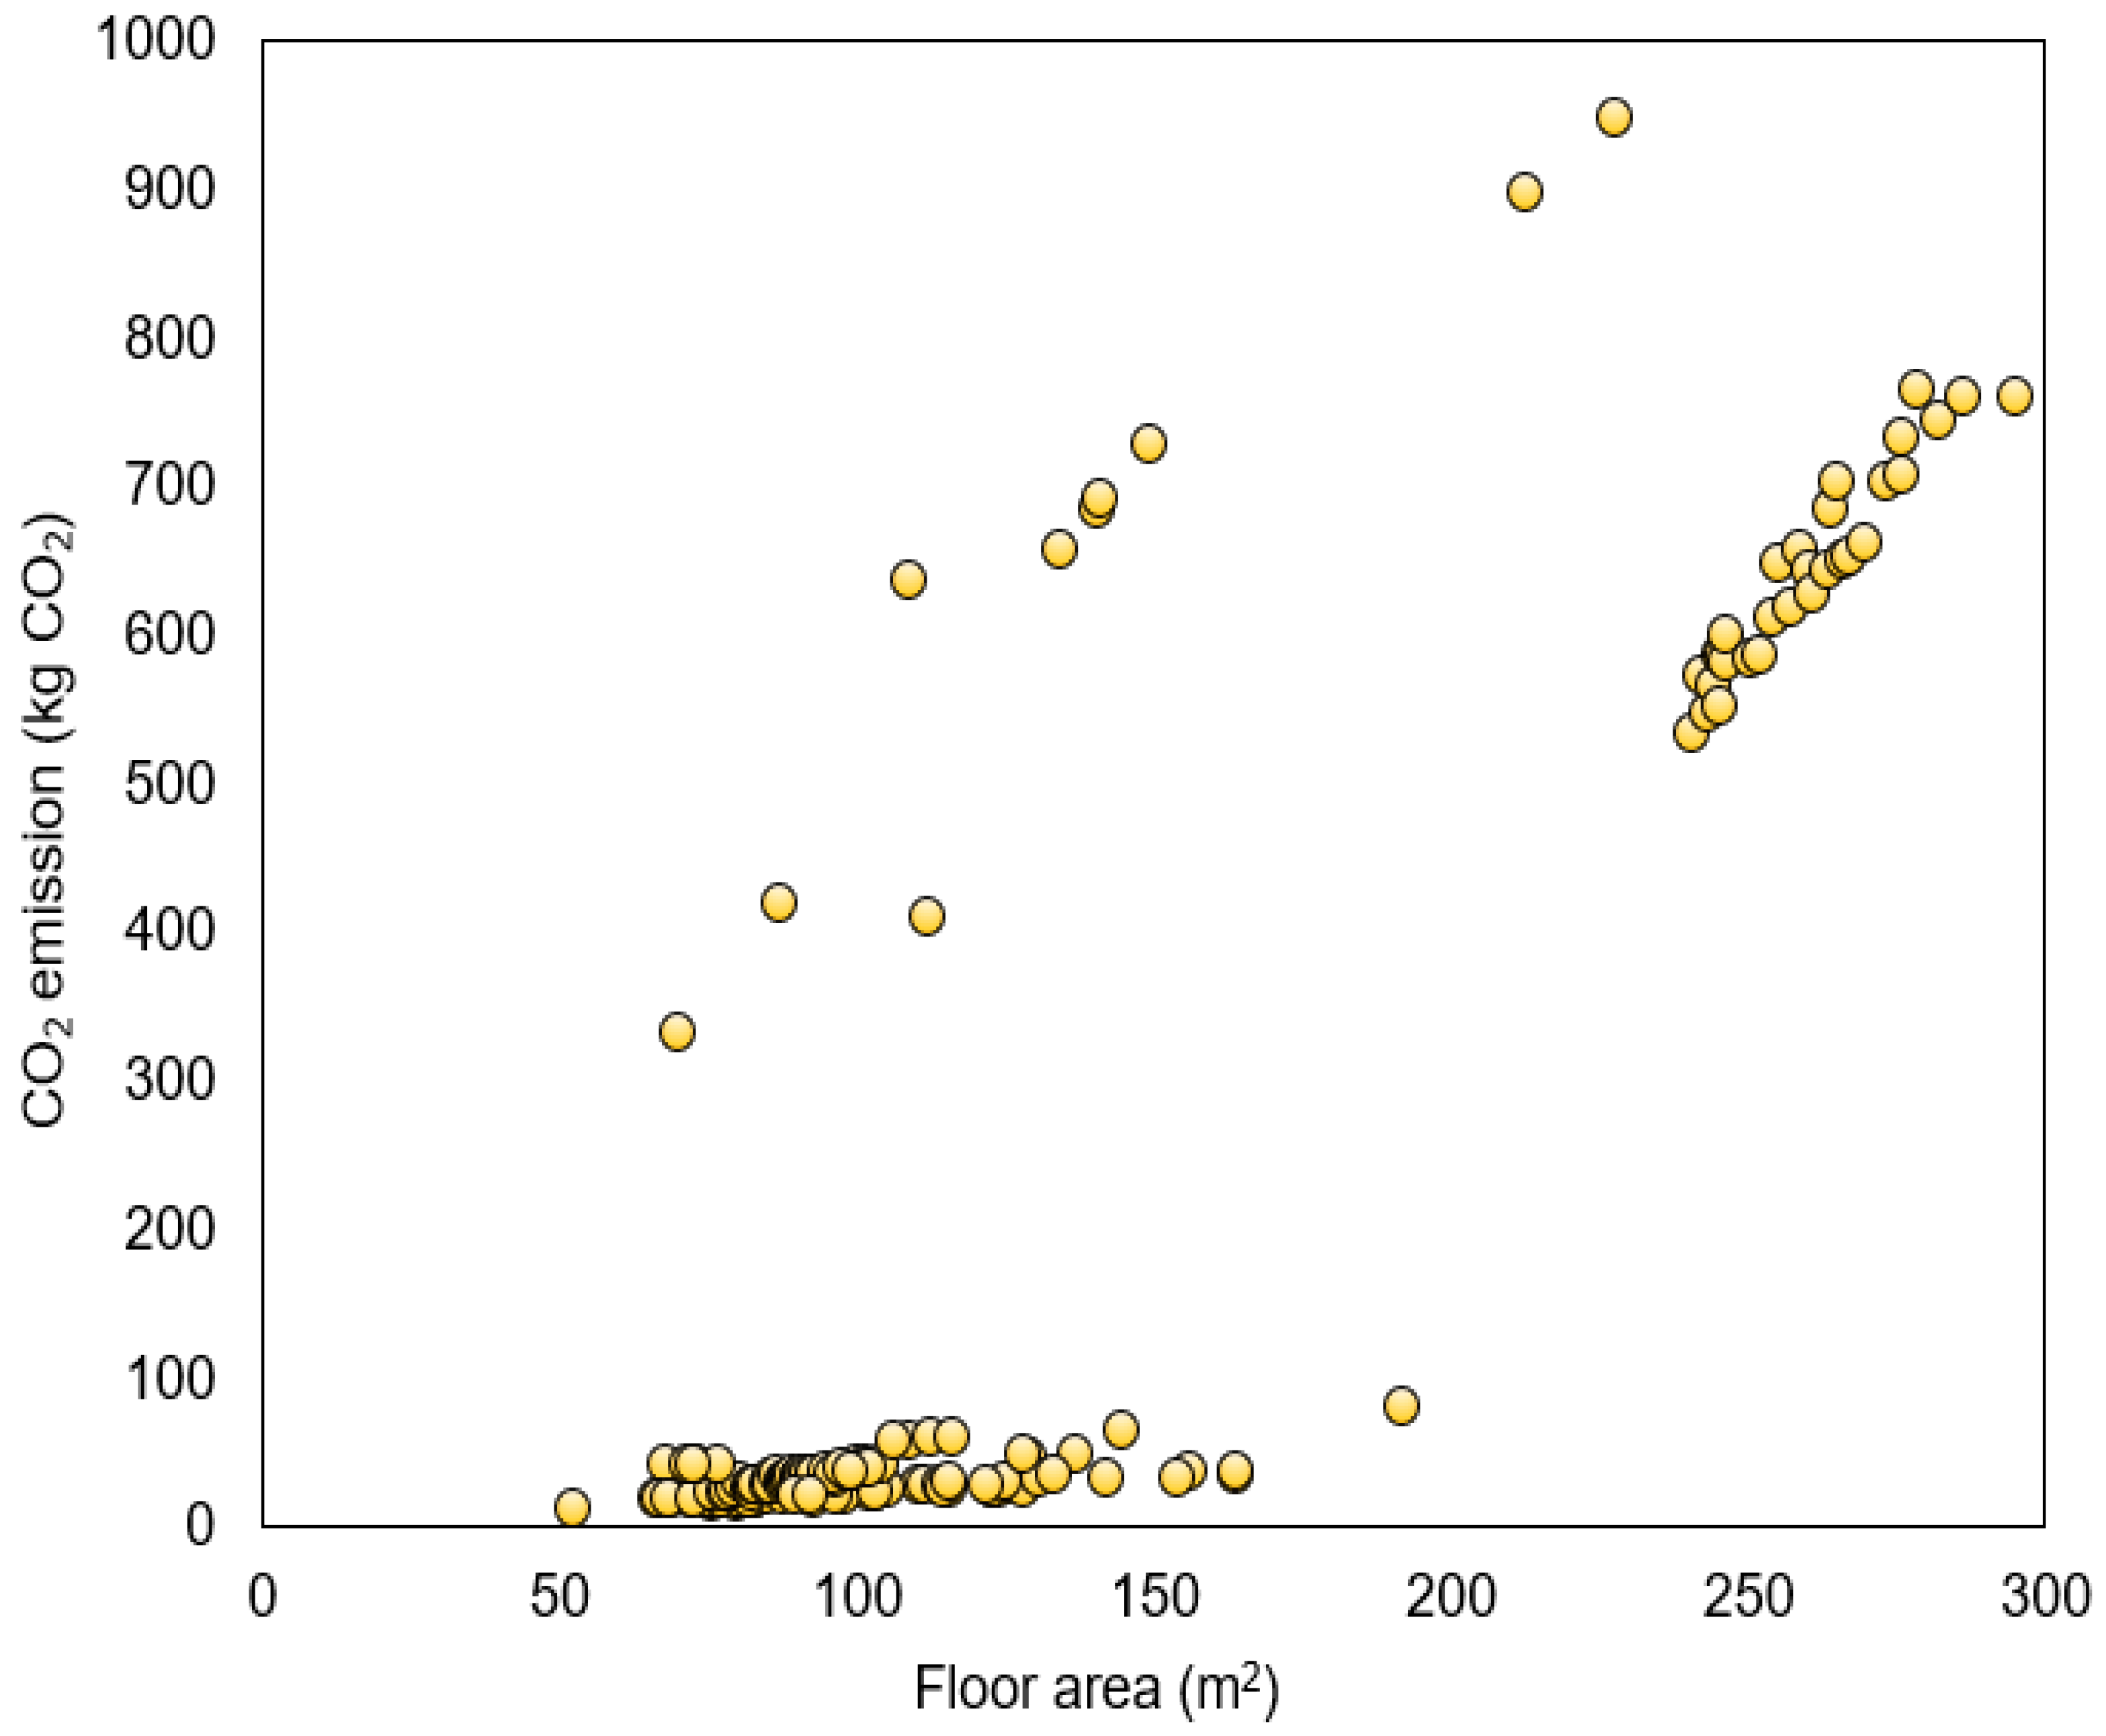
2.1. Data Collection of the Building Demolition Stage
2.2. Calculation of CO2 Emissions at the Demolition Stage
2.3. Feature Engineering
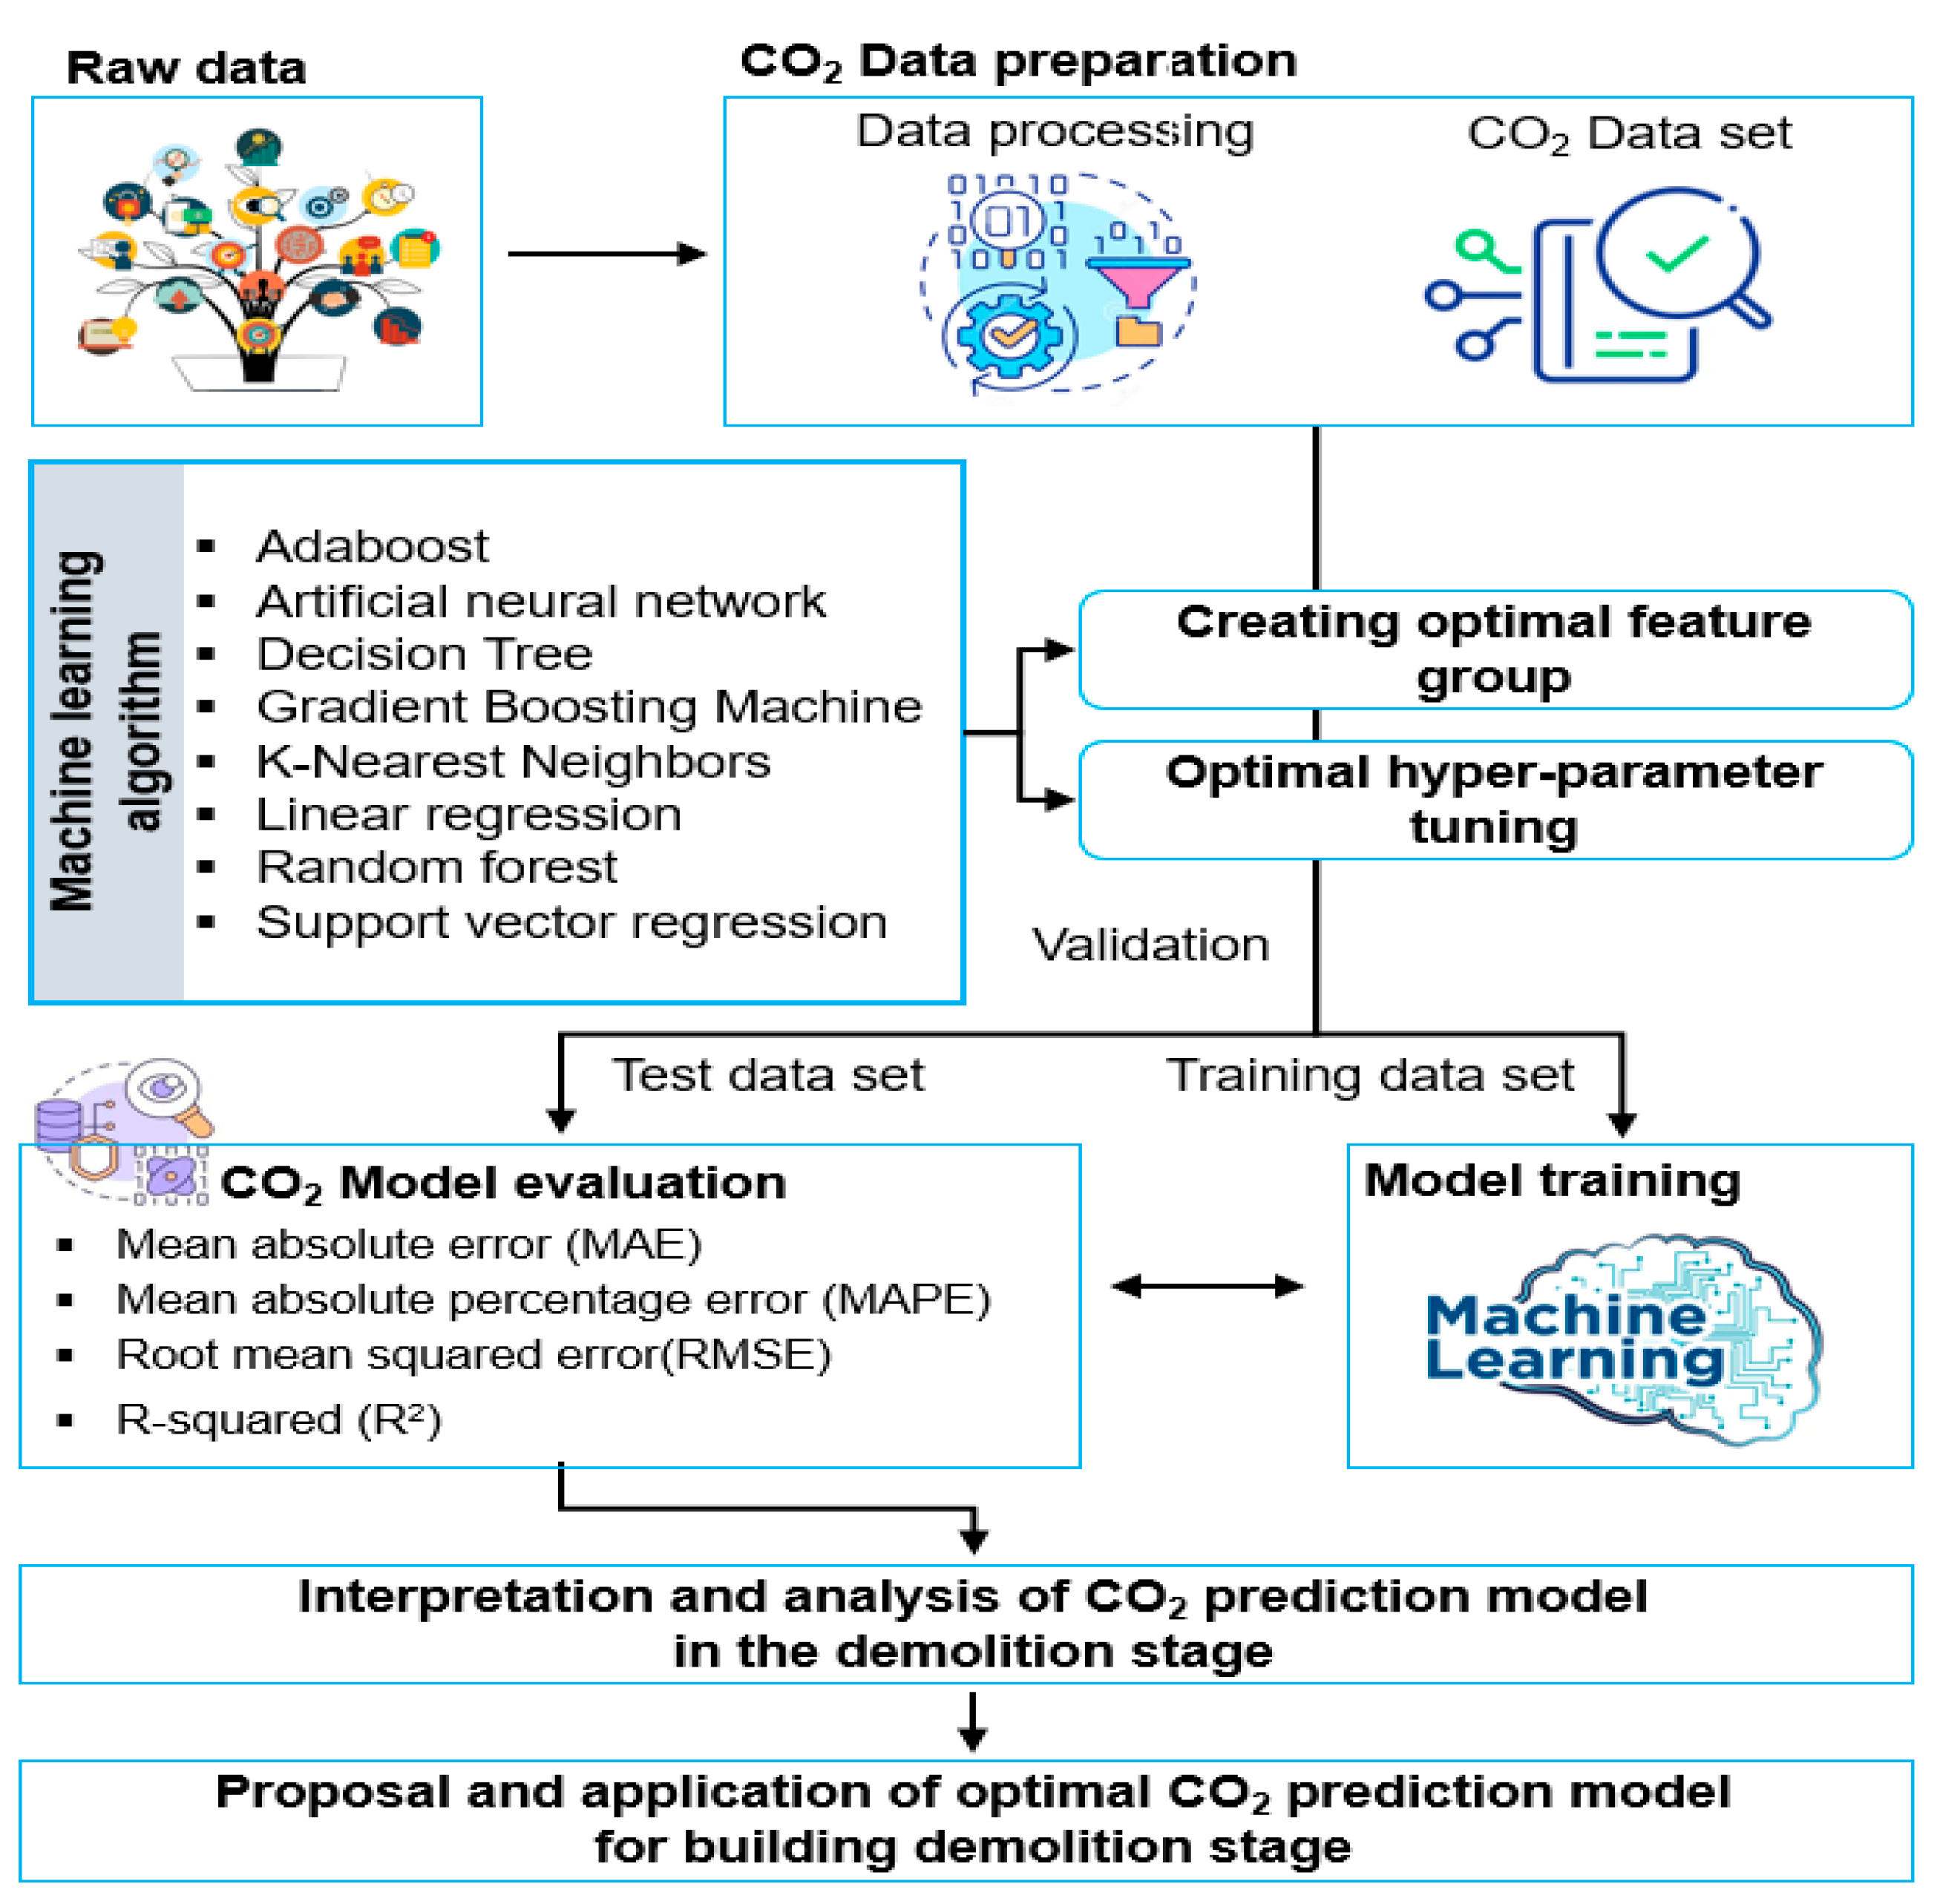
2.4. Development of CO2-Prediction Models for the Building Demolition Stage
2.4.1. Machine Learning Algorithm Used in This Study
2.4.2. Hyper-Parameter Tuning
2.5. Model Performance Evaluation
3. Results
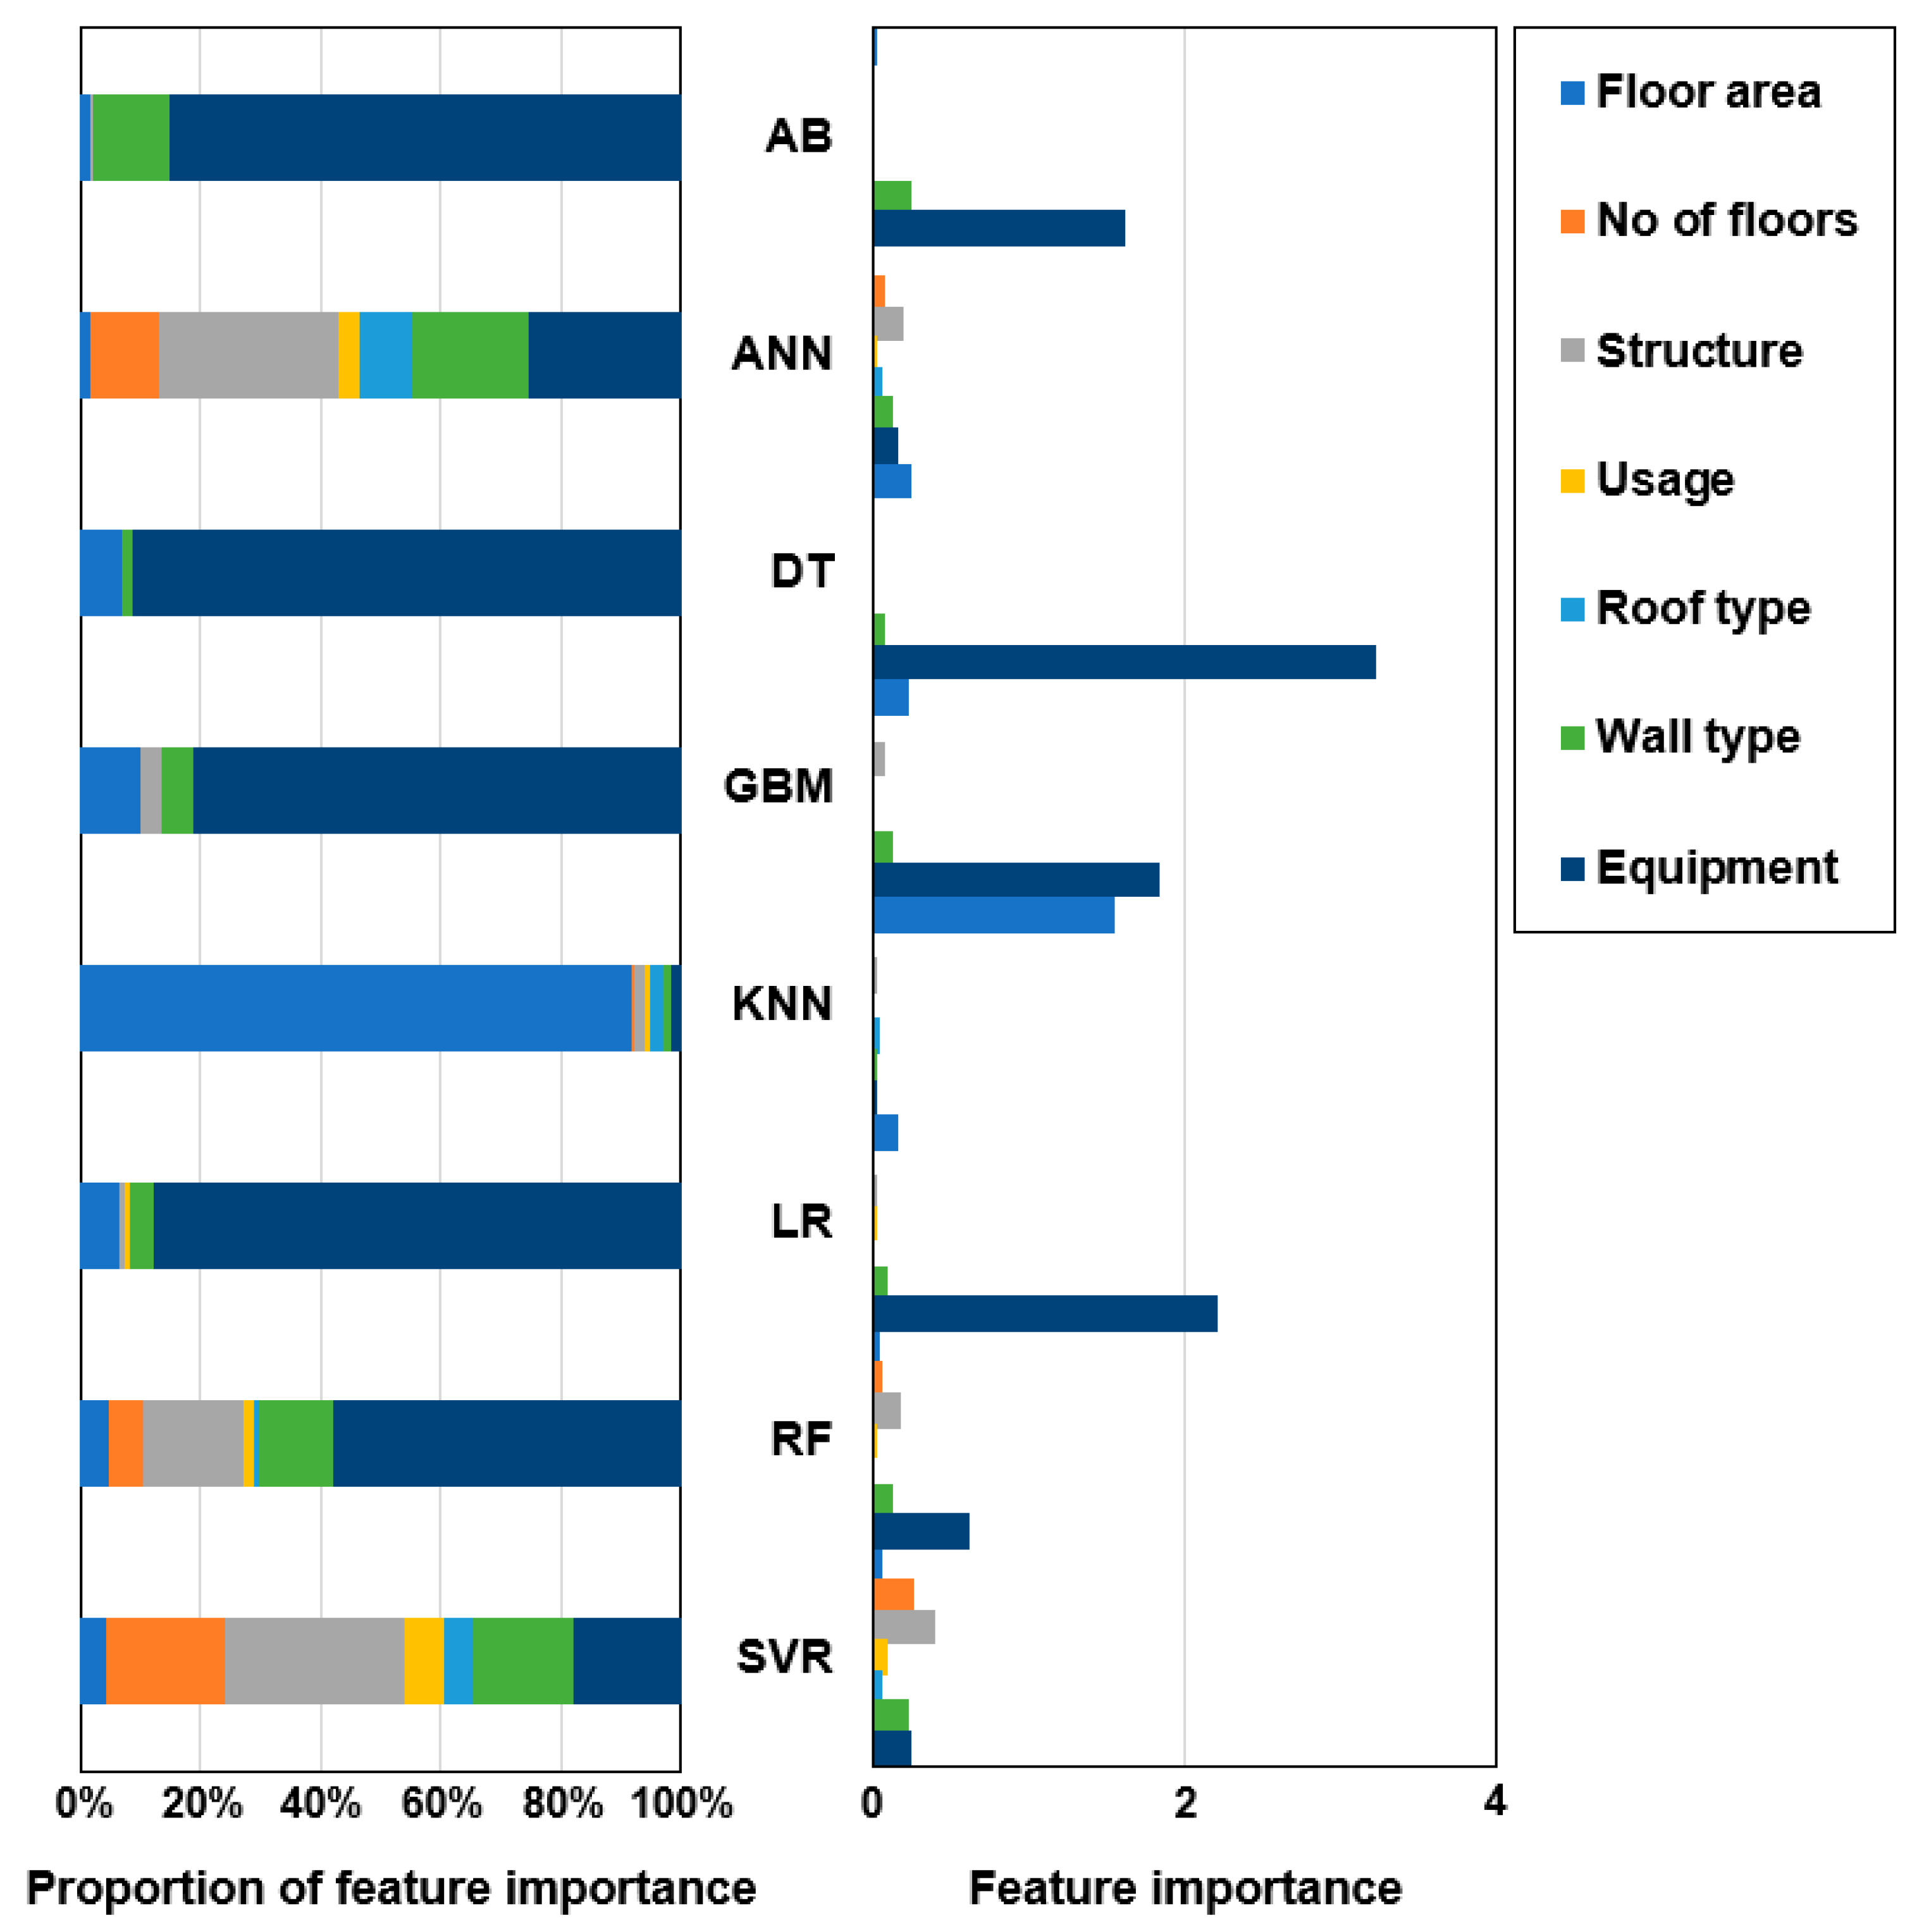
3.1. Feature Importance Analysis for Models
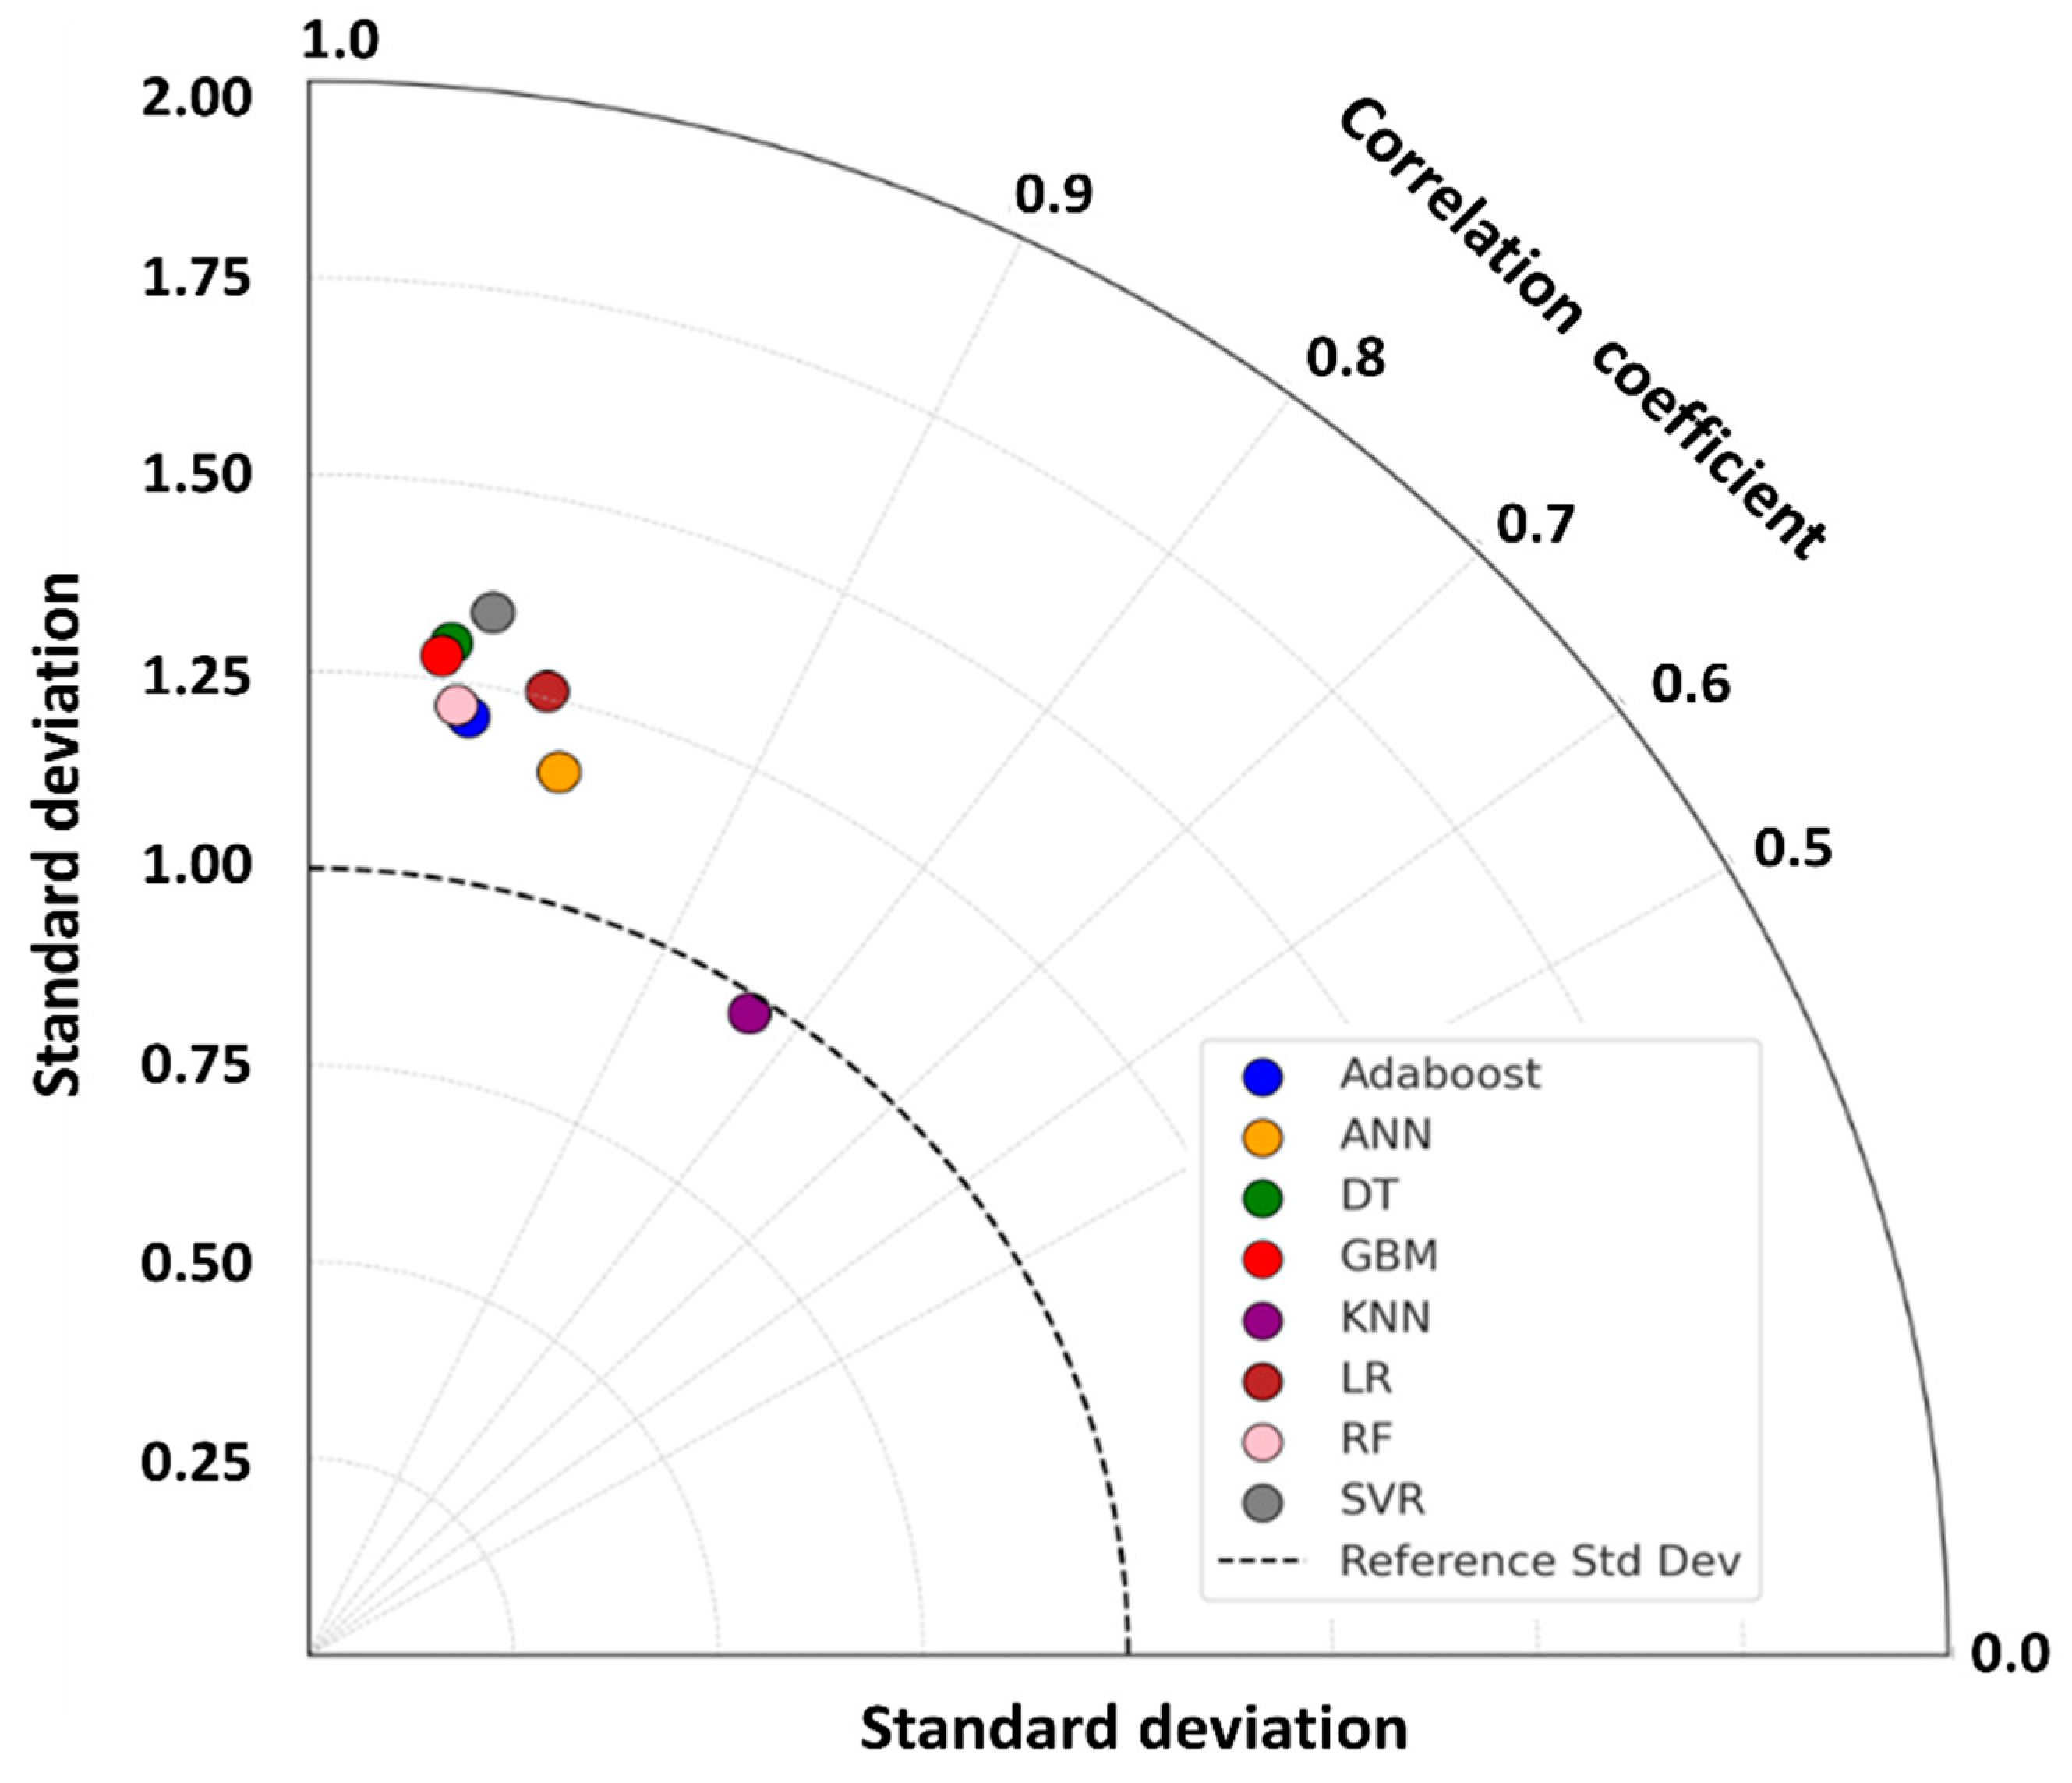
3.2. Comparison of the Performance of Prediction Models
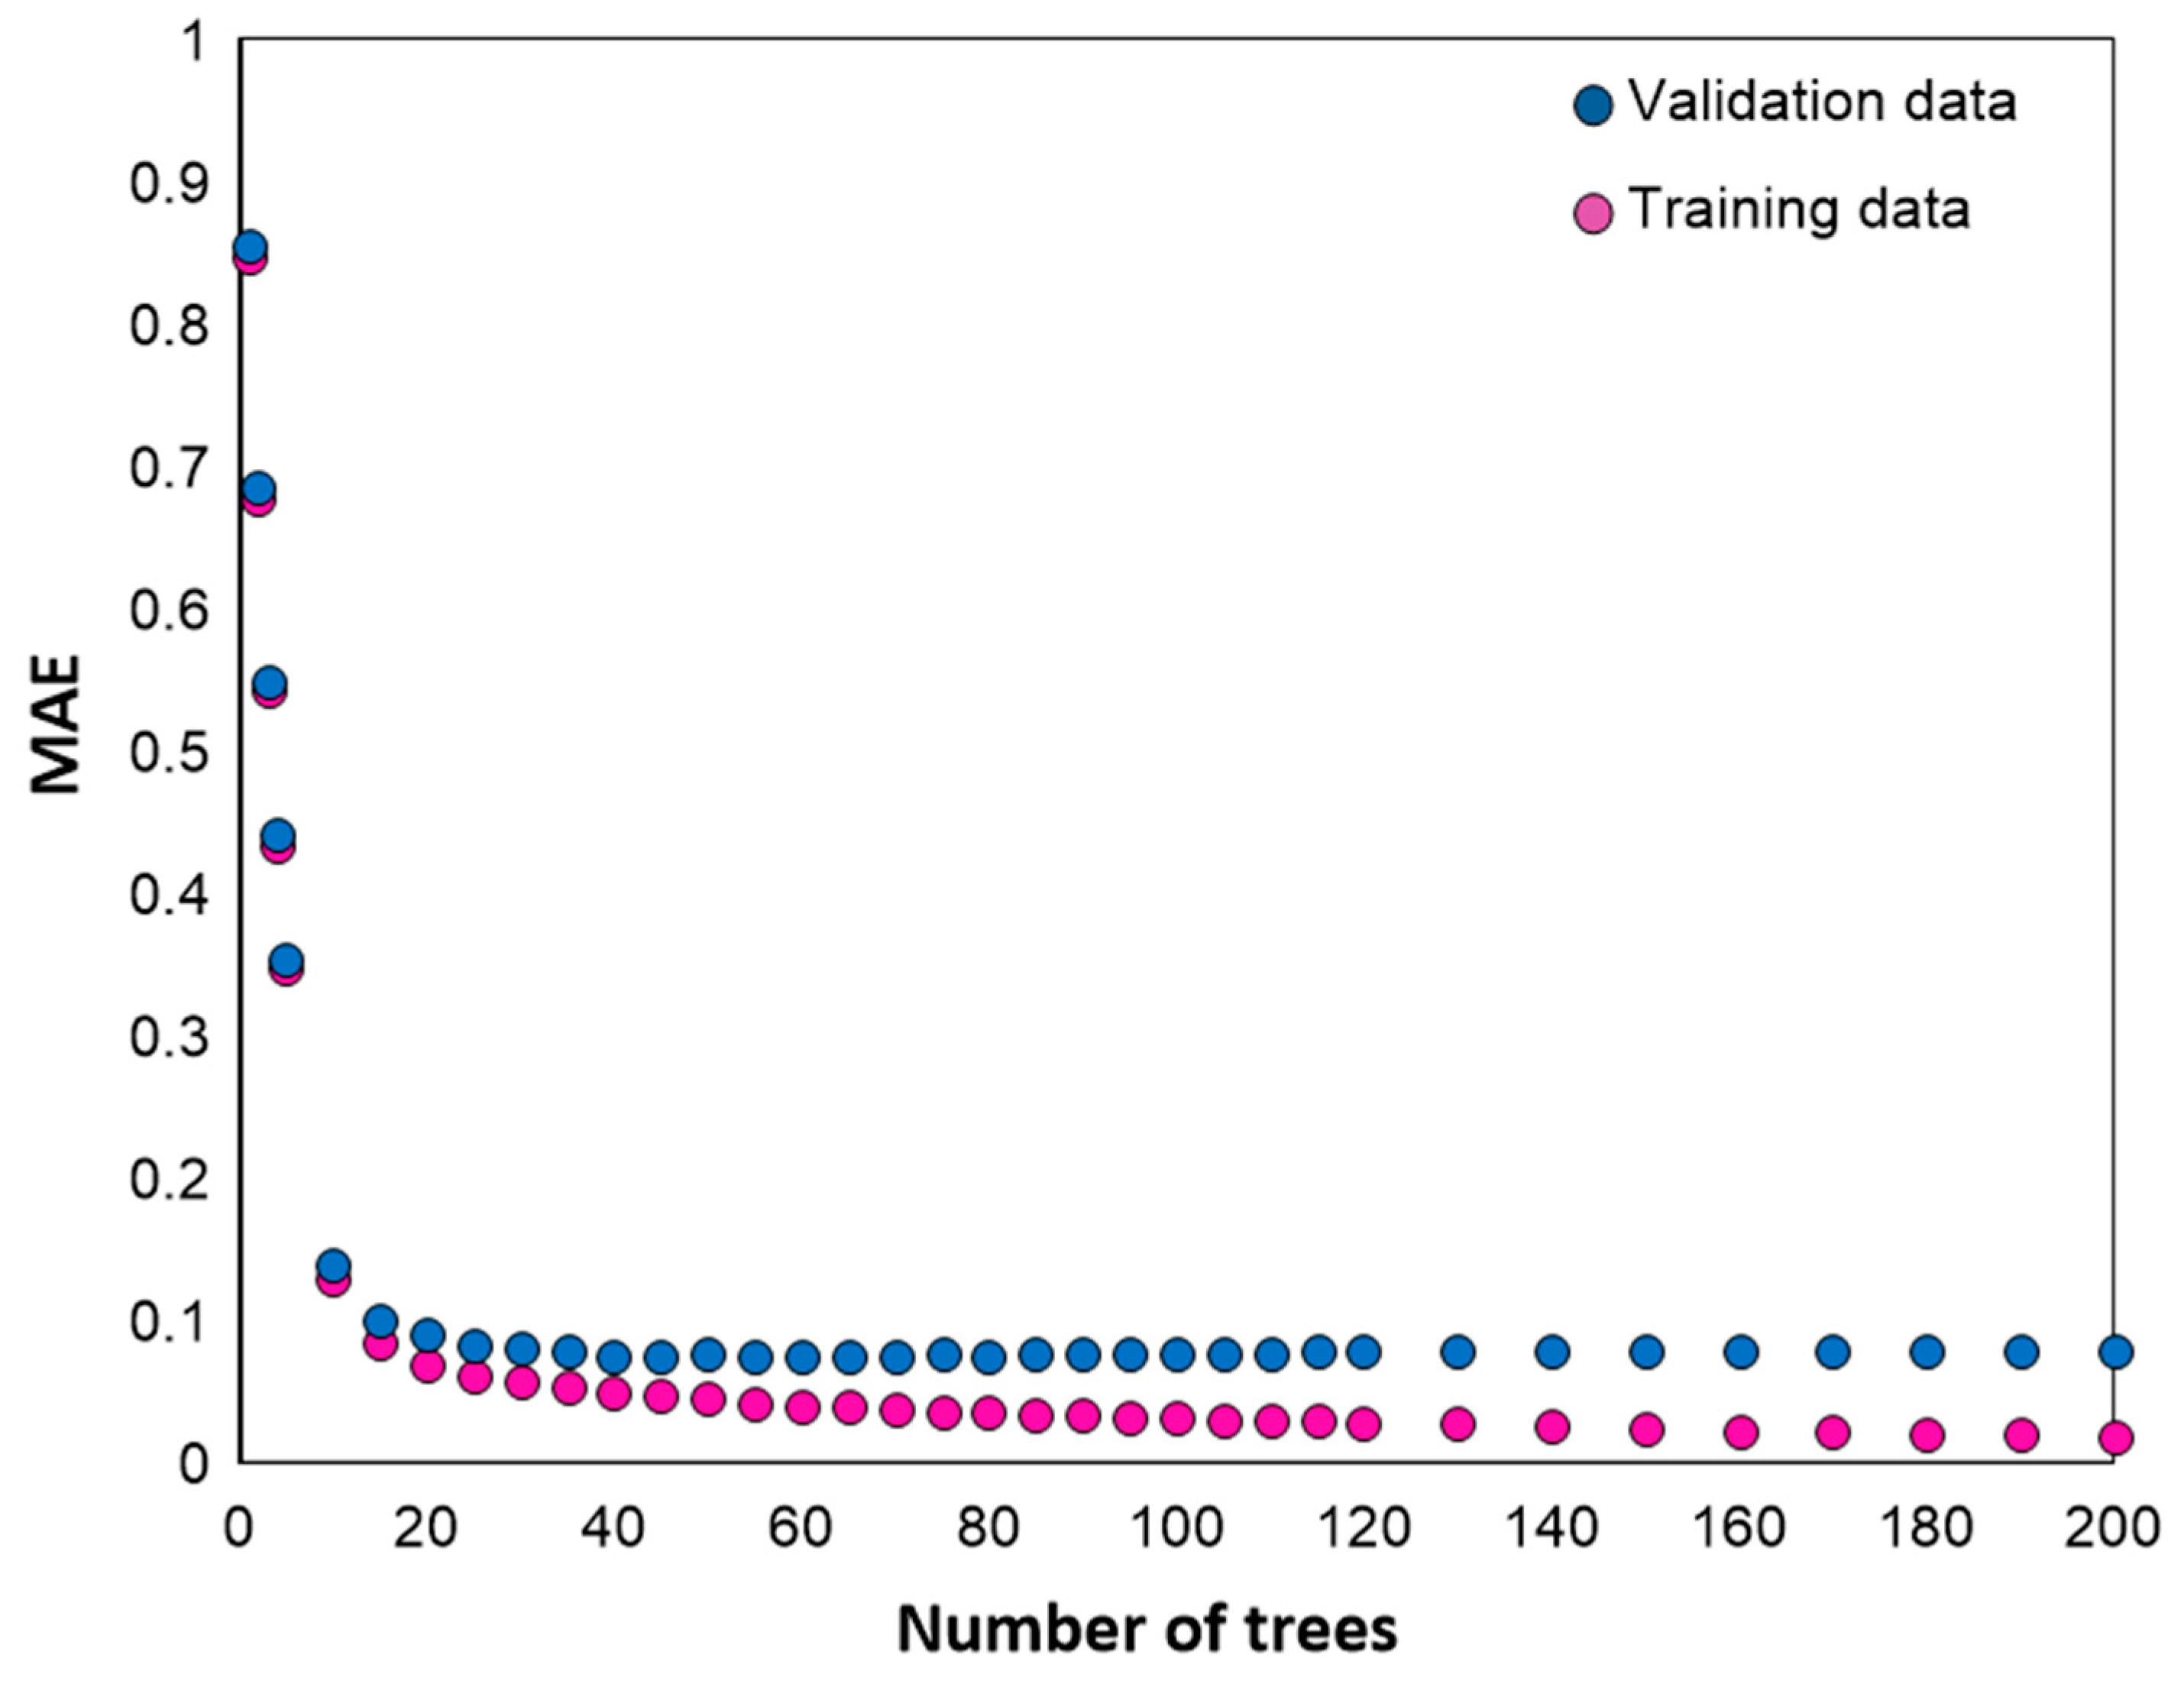
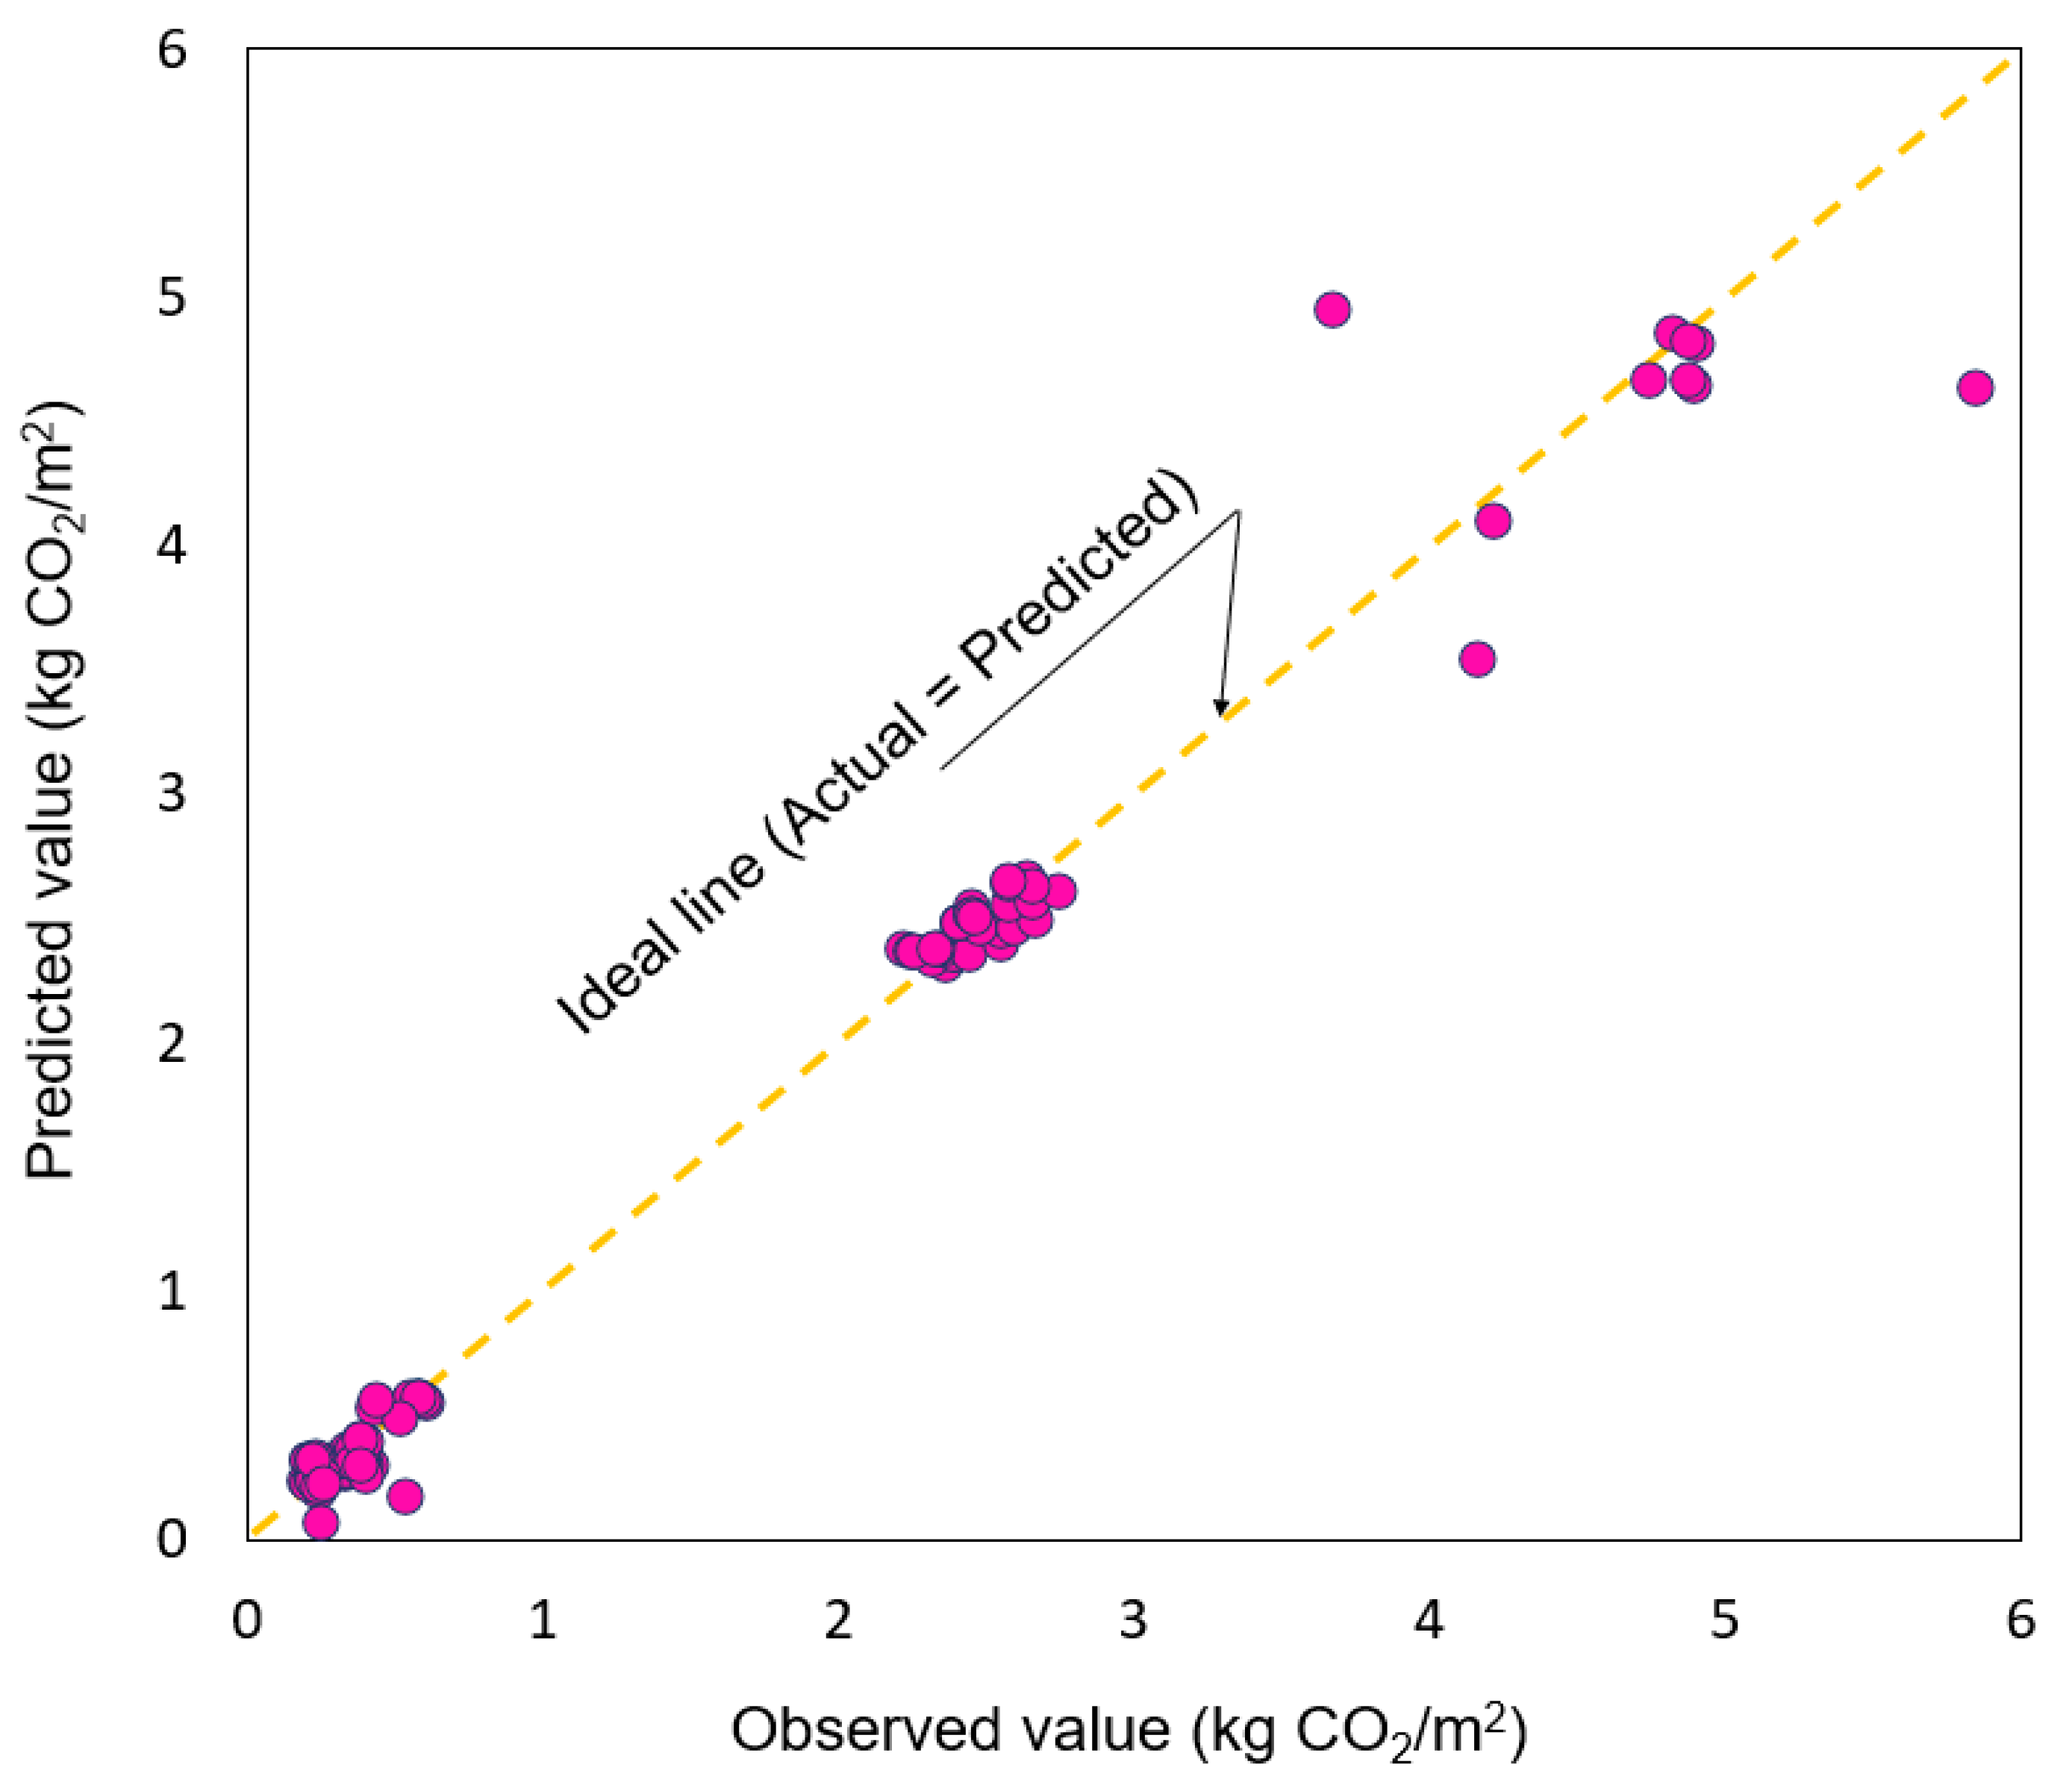
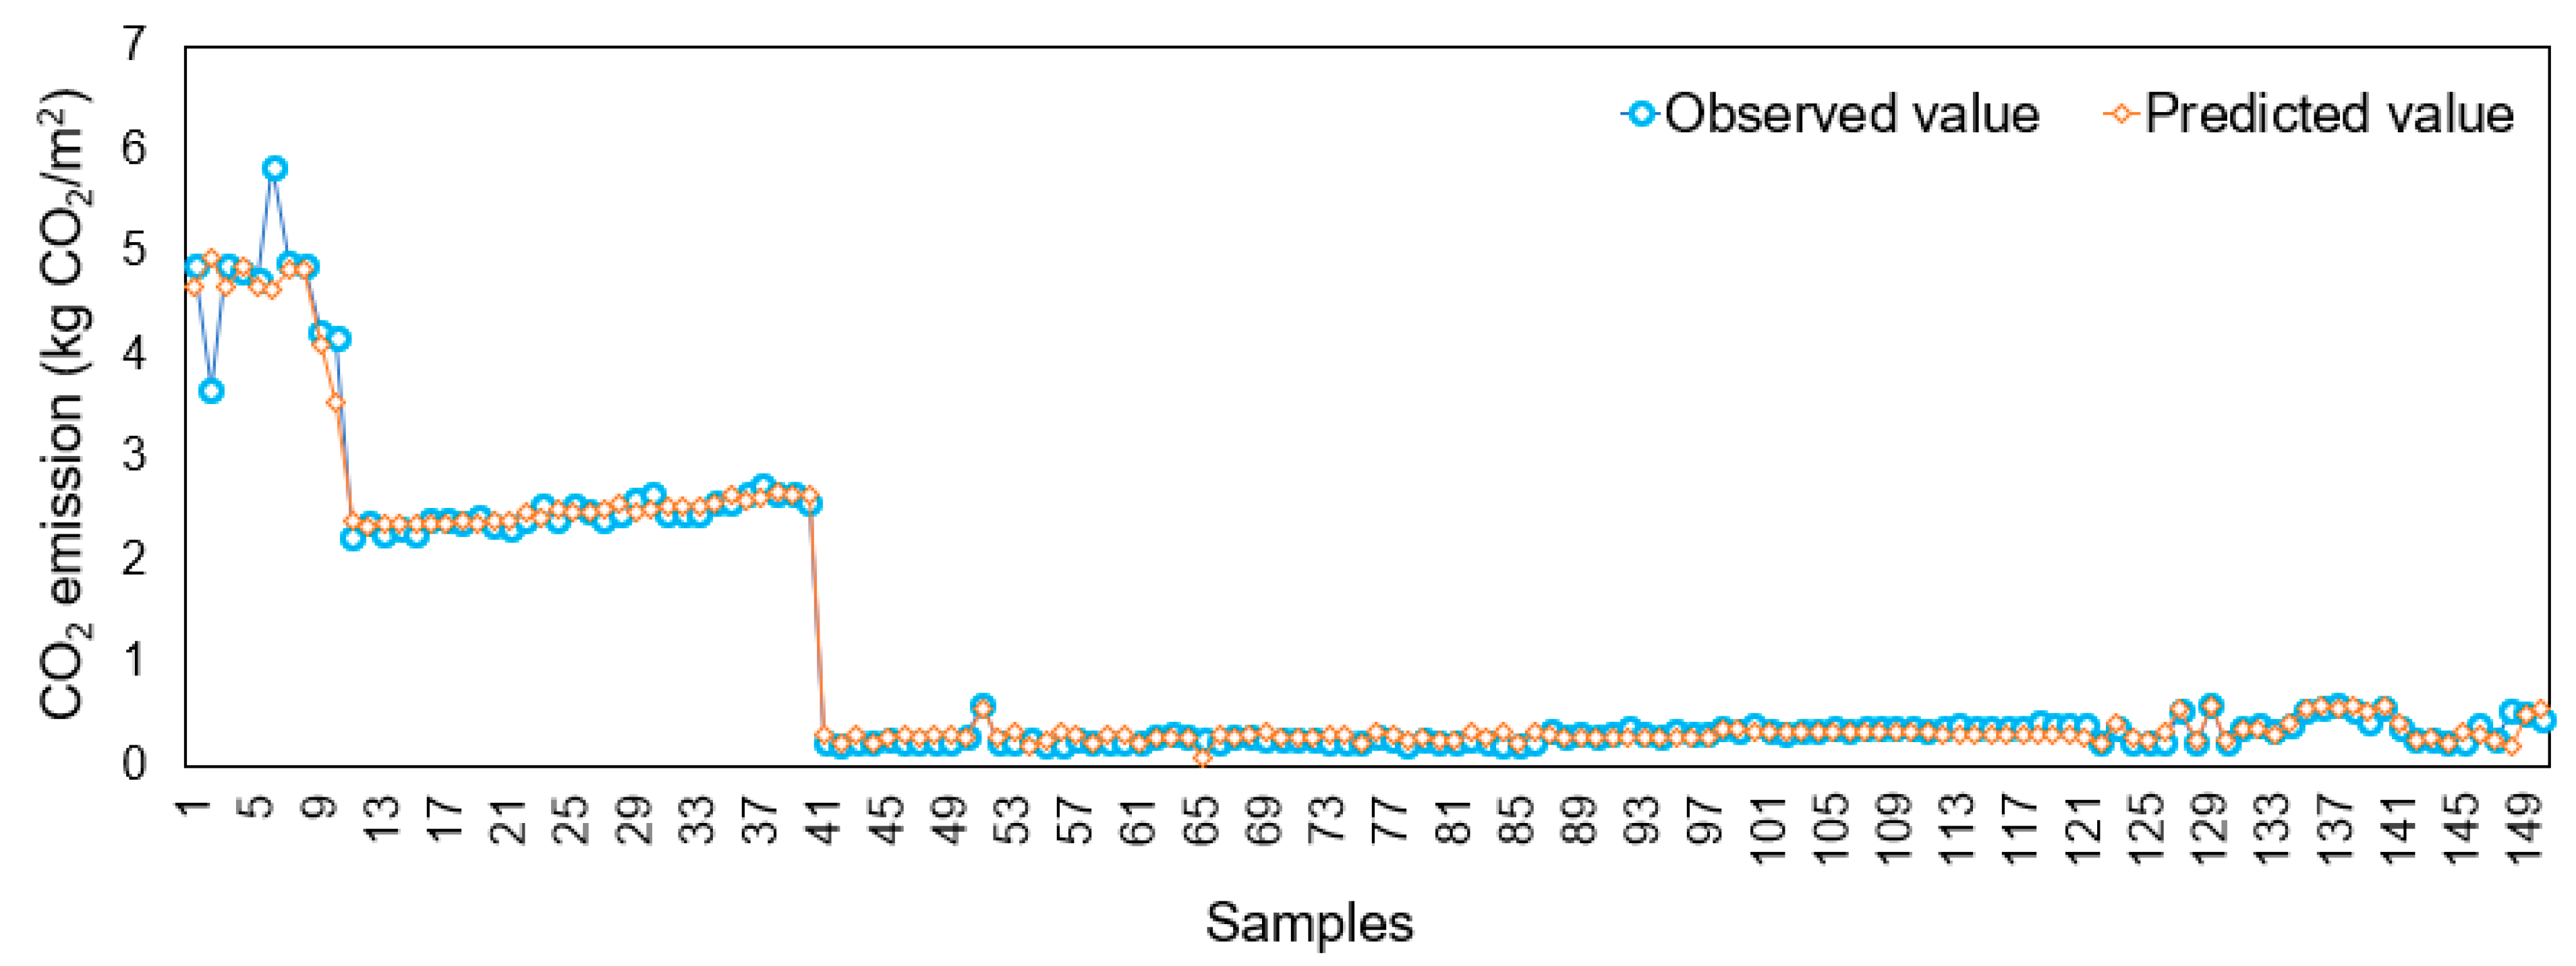
3.3. Generalization Performance and Accuracy of the Optimal Model for Predicting CO2 Emissions at the Demolition Stage
4. Discussion
5. Conclusions
- ML models with high prediction and generalization performance for the building demolition stage were developed, and the GBM model exhibited the best performance. The GBM model showed high prediction performance for the demolition stage and other life cycle stages (e.g., renovation stage). It is expected that the model can be applied to various system boundaries for research on the environmental impacts of the building life cycle. The model is also expected to have much higher scalability compared to the existing LCA methodology in the efficient utilization of data, reduction in the time required for data collection and CO2 prediction, and strategic plans for projects;
- When various algorithms were applied to predict CO2 emissions at the building demolition stage based on the data used in this study, it was found that the development of appropriate feature sets is important to ensure optimal performance for each algorithm. The GBM model with the highest performance in this study exhibited sufficiently high prediction-performance results using only four features (i.e., equipment, floor area, wall type, and structure). The DT model, which exhibited performance close to that of the GBM model, used only three features (i.e., equipment, floor area, and wall type). This indicates that accurately understanding the importance of features along with HP selection in ML models is important for model selection and optimization strategies;
- Equipment was found to be a factor that has the largest effect on CO2 emissions at the building demolition stage, followed by the floor area, wall type, and structure. Equipment and the floor area were found to be key influence factors. This finding indicates that it is necessary first to consider variables, such as equipment and the floor area, for the development of models to predict CO2 emissions at the building demolition stage;
- The findings of this study, as well as previous studies, show that it is necessary to fully consider various ML algorithms, system boundaries, and the characteristics of the data collected according to the setting of system boundaries in developing CO2-prediction models for the building life cycle. In addition, it is believed that a reliable model should be presented by adding the evaluation of validation and generalization performance along with the training and test results of the model.
Author Contributions
Funding
Data Availability Statement
Conflicts of Interest
Acronyms
| AB | AdaBoost |
| ANN | artificial neural network |
| CDW | construction and demolition waste |
| DT | decision tree |
| EoL | end-of-life GBM, gradient boosting machine |
| HP | hyper parameter |
| KNN | K-nearest neighbors |
| LCA | life cycle assessment |
| LOOCV | leave-one-out cross-validation LR, linear regression |
| MAE | mean absolute error |
| ML | machine learning |
| R2 | coefficient of determination |
| RF | random forest |
| RMSE | root mean square error |
| SVR | support vector regression |
References
- Kabir, M.; Habiba, U.E.; Khan, W.; Shah, A.; Rahim, S.; Rios-Escalante, P.R.D.l.; Farooqi, Z.-U.-R.; Ali, L.; Shafiq, M. Climate change due to increasing concentration of carbon dioxide and its impacts on environment in 21st century; a mini review. J. King Saud. Univ.-Sci. 2023, 35, 102693. [Google Scholar] [CrossRef]
- Li, R.; Kang, L.; Wu, S.; Zhou, X.; Wang, X. Effect of dust formation on the fate of indoor phthalates: Model analysis. Build. Environ. 2023, 229, 109957. [Google Scholar] [CrossRef]
- Webster, M.D.; Meryman, H.; Kestner, D.M. Carbon emissions and building structure: What the structural engineer needs to know about carbon in the 21st century. Proc. Struct. Congr. 2011, 2011, 472–482. [Google Scholar]
- He, W.; Li, W.; Xu, S.; Wang, W.; An, X. Time, cost, and energy consumption analysis on construction optimization in high-rise buildings. J. Constr. Eng. Manag. 2021, 147, 04021128. [Google Scholar] [CrossRef]
- Li, B.; Han, S.; Wang, Y.; Li, J.; Wang, Y. Feasibility assessment of the carbon emissions peak in China’s construction industry: Factor decomposition and peak forecast. Sci. Total Environ. 2020, 706, 135716. [Google Scholar] [CrossRef] [PubMed]
- Wu, Y.; Chau, K.W.; Lu, W.; Shen, L.; Shuai, C.; Chen, J. Decoupling relationship between economic output and carbon emission in the Chinese construction industry. Environ. Impact Assess. Rev. 2018, 71, 60–69. [Google Scholar] [CrossRef]
- Ivanica, R.; Risse, M.; Weber-Blaschke, G.; Richter, K. Development of a life cycle inventory database and life cycle impact assessment of the building demolition stage: A case study in Germany. J. Clean. Prod. 2022, 338, 130631. [Google Scholar] [CrossRef]
- Liu, J.; Huang, Z.; Wang, X. Economic and environmental assessment of carbon emissions from demolition waste based on LCA and LCC. Sustainability 2020, 12, 6683. [Google Scholar] [CrossRef]
- Cha, G.W.; Moon, H.J.; Kim, Y.C.; Hong, W.H.; Jeon, G.Y.; Yoon, Y.R.; Hwang, C.; Hwang, J.H. Evaluating recycling potential of demolition waste considering building structure types: A study in South Korea. J. Clean. Prod. 2020, 256, 120385. [Google Scholar] [CrossRef]
- Hao, J.L.; Ma, W. Evaluating carbon emissions of construction and demolition waste in building energy retrofit projects. Energy 2023, 281, 128201. [Google Scholar] [CrossRef]
- Peng, Z.; Lu, W.; Webster, C.J. Quantifying the embodied carbon saving potential of recycling construction and demolition waste in the Greater Bay Area, China: Status quo and future scenarios. Sci. Total Environ. 2021, 792, 148427. [Google Scholar] [CrossRef] [PubMed]
- Zhao, Q.; Gao, W.; Su, Y.; Wang, T.; Wang, J. How can C&D waste recycling do a carbon emission contribution for construction industry in Japan city? Energy Build. 2023, 298, 113538. [Google Scholar]
- Wu, H.; Zuo, J.; Zillante, G.; Wang, J.; Yuan, H. Status quo and future directions of construction and demolition waste research: A critical review. J. Clean. Prod. 2019, 240, 118163–118178. [Google Scholar] [CrossRef]
- Quéheille, E.; Ventura, A.; Saiyouri, N.; Taillandier, F. A life cycle assessment model of end-of-life scenarios for building deconstruction and waste management. J. Clean. Prod. 2022, 339, 130694. [Google Scholar] [CrossRef]
- Razi, N.; Ansari, R. A prediction-based model to optimize construction programs: Considering time, cost, energy consumption, and CO2 emissions trade-off. J. Clean. Prod. 2024, 445, 141164. [Google Scholar] [CrossRef]
- Fang, Y.; Lu, X.; Li, H. A random forest-based model for the prediction of construction-stage carbon emissions at the early design stage. J. Clean. Prod. 2021, 328, 129657. [Google Scholar] [CrossRef]
- Akanbi, L.A.; Oyedele, A.O.; Oyedele, L.O.; Salami, R.O. Deep learning model for demolition waste prediction in a circular economy. J. Clean. Prod. 2020, 274, 122843. [Google Scholar] [CrossRef]
- Cha, G.W.; Moon, H.J.; Kim, Y.C. A hybrid machine-learning model for predicting the waste generation rate of building demolition projects. J. Clean. Prod. 2022, 375, 134096. [Google Scholar] [CrossRef]
- Guerra, B.C.; Koo, H.J.; Caldas, C.; Leite, F. Prediction of waste diversion and identification of trends in construction and demolition waste data using data mining. Int. J. Constr. Manag. 2024, 24, 374–383. [Google Scholar] [CrossRef]
- Gulghane, A.; Sharma, R.L.; Borkar, P. A formal evaluation of KNN and decision tree algorithms for waste generation prediction in residential projects: A comparative approach. Asian J. Civ. Eng. 2024, 25, 265–280. [Google Scholar] [CrossRef]
- Hu, R.; Chen, K.; Chen, W.; Wang, Q.; Luo, H. Estimation of construction waste generation based on an improved on-site measurement and SVM-based prediction model: A case of commercial buildings in China. Waste Manag. 2021, 126, 791–799. [Google Scholar] [CrossRef]
- Lu, W.; Long, W.; Yuan, L. A machine learning regression approach for pre-renovation construction waste auditing. J. Clean. Prod. 2023, 397, 136596. [Google Scholar] [CrossRef]
- Maged, A.; Elshaboury, N.; Akanbi, L. Data-driven prediction of construction and demolition waste generation using limited datasets in developing countries: An optimized extreme gradient boosting approach. Environ. Dev. Sustain. 2024, 1–25. [Google Scholar] [CrossRef]
- Cha, G.W.; Park, C.W.; Kim, Y.C.; Moon, H.J. Predicting Generation of Different Demolition Waste Types Using Simple Artificial Neural Networks. Sustainability 2023, 15, 16245. [Google Scholar] [CrossRef]
- Cha, G.W.; Park, C.W.; Kim, Y.C. Optimal Machine Learning Model to Predict Demolition Waste Generation for a Circular Economy. Sustainability 2024, 16, 7064. [Google Scholar] [CrossRef]
- Mallikharjuna Rao, K.; Saikrishna, G.; Supriya, K. Data preprocessing techniques: Emergence and selection towards machine learning models—A practical review using HPA dataset. Multimed. Tools Appl. 2023, 82, 37177–37196. [Google Scholar] [CrossRef]
- Xu, X.; Chong, W.; Li, S.; Arabo, A.; Xiao, J. MIAEC: Missing data imputation based on the evidence chain. IEEE Access 2018, 6, 12983–12992. [Google Scholar] [CrossRef]
- Liu, X.; Wang, H. A discretization algorithm based on a heterogeneity criterion. IEEE Trans. Knowl. Data Eng. 2005, 17, 1166–1173. [Google Scholar] [CrossRef]
- Seyedzadeh, S.; Rahimian, F.P.; Glesk, I.; Roper, M. Machine learning for estimation of building energy consumption and performance: A review. Vis. Eng. 2018, 6, 5. [Google Scholar] [CrossRef]
- Gao, Y.; Wang, J.; Xu, X. Machine learning in construction and demolition waste management: Progress, challenges, and future directions. Autom. Constr. 2024, 162, 105380. [Google Scholar] [CrossRef]
- Abdallah, M.; Talib, M.A.; Feroz, S.; Nasir, Q.; Abdalla, H.; Mahfood, B. Artificial intelligence applications in solid waste management: A systematic research review. Waste Manag. 2020, 109, 231–246. [Google Scholar] [CrossRef] [PubMed]
- Cha, G.W.; Moon, H.J.; Kim, Y.C. Comparison of random forest and gradient boosting machine models for predicting demolition waste based on small datasets and categorical variables. Int. J. Environ. Res. Public Health 2021, 18, 8530. [Google Scholar] [CrossRef] [PubMed]
- Lu, W.; Lou, J.; Webster, C.; Xue, F.; Bao, Z.; Chi, B. Estimating construction waste generation in the Greater Bay Area, China using machine learning. Waste Manag. 2021, 134, 78–88. [Google Scholar] [CrossRef] [PubMed]
- Ali, Y.A.; Awwad, E.M.; Al-Razgan, M.; Maarouf, A. Hyperparameter search for machine learning algorithms for optimizing the computational complexity. Processes 2023, 11, 349. [Google Scholar] [CrossRef]
- DeCastro-García, N.; Munoz Castaneda, A.L.; Escudero Garcia, D.; Carriegos, M.V. Effect of the sampling of a dataset in the hyperparameter optimization phase over the efficiency of a machine learning algorithm. Complexity 2019, 2019, 6278908. [Google Scholar] [CrossRef]
- Cheng, J.; Dekkers, J.C.; Fernando, R.L. Cross-validation of best linear unbiased predictions of breeding values using an efficient leave-one-out strategy. J. Anim. Breed. Genet. 2021, 138, 519–527. [Google Scholar] [CrossRef] [PubMed]
- Rani, R.; Arora, G. A comparative study of PSO and LOOCV for the numerical approximation of sine–gordon equation with exponential modified cubic B-Spline DQM. Oper. Res. Forum. 2024, 5, 89. [Google Scholar] [CrossRef]
- Wang, J.; Wu, H.; Duan, H.; Zillante, G.; Zuo, J.; Yuan, H. Combining life cycle assessment and Building Information Modelling to account for carbon emission of building demolition waste: A case study. J. Clean. Prod. 2018, 172, 3154–3166. [Google Scholar] [CrossRef]
- Tsay, Y.S.; Yeh, C.Y.; Chen, Y.H.; Lu, M.C.; Lin, Y.C. A machine learning-based prediction model of lcco2 for building envelope renovation in taiwan. Sustainability 2021, 13, 8209. [Google Scholar] [CrossRef]


| Parameter | Unit | Source | Comment | |
|---|---|---|---|---|
| Characteristic | Detailed Characteristic | |||
| Floor area | m2 | On-site measurements | Check the dimensions by measuring with a laser measuring device by two people on-site | |
| Usage | Residential Residential and commercial | - | Documents and observations | Confirm building ledger document |
| Structure | Reinforced concrete Concrete-brick Masonry-block Wood | - | Documents and observations | Confirm building ledger document |
| Wall type | Concrete Brick Bock Mud-plastered and mortar | - | Observations | Check through on-site observation |
| Roof type | Slab Slab and roofing tile Slate Roofing tile | - | Observations | Check through on-site observation |
| Number of floors | Floor | Observations | Check through on-site observation | |
| Equipment type | A type B type C type | Piece | Observations and inquiry | Check the type of equipment used and work capability |
| Energy consumption | L/m2 | Inquiry | Contact the company | |
| Classification | Min | Max | Mean | Median | Standard Deviation | Variance |
|---|---|---|---|---|---|---|
| Diesel consumption (L) | 4.37 | 364.29 | 74.46 | 12.96 | 106.78 | 11,401.05 |
| Diesel-consumption rate(L/m2) | 0.08 | 2.25 | 0.4 | 0.14 | 0.5 | 0.25 |
| CO2 emission (kg-CO2) | 11.36 | 947.15 | 193.59 | 33.69 | 277.62 | 77,071.12 |
| CO2-emission rate (kg-CO2/m2) | 0.2 | 5.84 | 1.04 | 0.36 | 1.31 | 1.72 |
| Machine Learning Algorithm | Description |
|---|---|
| Adaboost (AB) | AdaBoost, a meta-estimator, first performs the learning of the regression model using the original dataset and then the learning of the additional regression model copy using the same dataset with adjusted weights of each instance according to the error of the current prediction. |
| Artificial Neural Networks (ANN) | ANN is a computing system composed of multiple layers (input–hidden–output) and neurons. The basic structure of ANN consists of three layers (i.e., input, hidden, and output), and nonlinear transfer functions that allow the learning of nonlinear and linear relationships between input and output neurons constitute several layers of neurons. |
| Decision tree (DT) | The DT algorithm, a supervised learning model to deal with classification and regression problems, is used to efficiently extract a set of rules from unfamiliar data. |
| Gradient boosting machine (GBM) | GBM, one of the most robust ML algorithms, has been widely applied in engineering fields, and it corresponds to the boosting technique. This algorithm creates strong learners by continuously adding weak learners to the model. It improves the performance of the model and minimizes the loss or error of the model by repeatedly integrating various predictor variables. |
| K-nearest neighbor (KNN) | KNN is a simple and easy-to-implement supervised learning method used for classification and regression problems. This method uses training data and distance calculation for the pre-defined k value, and finds k closest values using the clustering algorithm. |
| Linear regression (LR) | LR is a regression model that estimates the relationship between one independent and one dependent variable using a straight line. |
| Random forest (RF) | RF is a bagging-based representative ensemble technique that generates bootstrap sampling. It creates a tree for each subset by extracting several subsets from the original dataset. Strong learners are determined through a majority vote on the results of each tree, and the final prediction is based on the average prediction of all submodels. |
| Support vector regression (SVR) | SVR uses the same principle as the support vector machine (SVM). Its basic concept is to find the line of best fit. The line of best fit indicates a hyperplane that contains as many data points as possible. |
| Algorithms | HP Title | Tested HP and Values | Selected HP |
|---|---|---|---|
| AB | No. of estimators | x ∈ {5, 10, 15, …, 150} | 30 |
| Learning rate | x ∈ {0.0001, 0.001, 0.01, 0.1, 0.2, 0.3, …, 1} | 1 | |
| Loss (regression) | Linear, square, exponential | Linear | |
| ANN | Activation function | ReLu, tanh, logistic, identity | ReLu |
| No. of neurons | x ∈ {1, 2, 3, 4, 5, 6, 7, …, 60} | 5 | |
| Solver | L-BFGS-B, SGD, Adam | L-BFGS-B | |
| Regularization | x ∈ {0.0001, 0.001, 0.01, 0.1, 10, 20, 30, 40, …, 100, 1000} | 30 | |
| Iteration | x ∈ {10, 20, 30, …, 150} | 10 | |
| DT | Min_samples_split | x ∈ {1, 2, 3, …, 10} | 6 |
| Criterion | x ∈ {1, 2, 3, …, 10} | 1 | |
| Max_depth | x ∈ {1, 2, 3, …, 15} | 3 | |
| GBM | No. of trees | x ∈ {5, 10, 15, …, 150} | 40 |
| Criterion | x ∈ {1, 2, 3, …, 10} | 2 | |
| Max_depth | x ∈ {1, 2, 3, …, 15} | 2 | |
| Learning rate | x ∈ {0.001, 0.01, 0.1, 0.2, 0.3, …, 1} | 0.2 | |
| KNN | No. of neighbors | x ∈ {1, 2, 3, …, 15} | 3 |
| Metric | Euclidean, Manhattan, Chebyshev, mahalanobis | Manhattan | |
| Weight | Uniform, by distances | By distances | |
| LR | Regularization method | Ridge, lasso, elastic net | Elastic net |
| L1:L2 | x ∈ {0.1, 0.2, 0.3, …, 1} | 0.8:0.2 | |
| x ∈ {0.0001, 0.001, 0.01, 0.1, 1, 10, 100, 1000} | 0.001 | ||
| RF | No. of trees | x ∈ {5, 10, 15, …, 150} | 60 |
| Criterion | x ∈ {1, 2, 3, …, 10} | 6 | |
| Max_depth | x ∈ {1, 2, 3, …, 15} | 5 | |
| Max_features | x ∈ {1, 2, 3, 4, 5, 6, 7} | 2 | |
| SVR | Regression Cost | x ∈ {0.1n∣n ∈ {1, 2, …, 10}} ∪ {n∣n ∈ {1, 2, …, 10}} ∪ {10n∣n ∈ {1, 2, …, 10}} | 0.9 |
| Regression loss epsilon | x ∈ {0.1n∣n ∈ {1, 2, …, 10}} ∪ {n∣n ∈ {1, 2, …, 10}} ∪ {10n∣n ∈ {1, 2, …, 10}} | 0.5 | |
| Kernel type | Linear, RBF, polynomial, sigmoid | Polynomial | |
| Gamma | x ∈ {0.01, 0.05, 0.1, 0.15, …, 0.95, 1.0} | 1 | |
| Coefficient | x ∈ {0.01, 0.05, 0.1, 0.15, …, 0.95, 1.0} | 0.01 | |
| Degree | x ∈ {1, 2, 3, …, 10} | 2 |
| Algorithm | Training | Test | ||||||
|---|---|---|---|---|---|---|---|---|
| RMSE | MAE | MAPE | R-Squared | RMSE | MAE | MAPE | R-Squared | |
| AB | 0.213 | 0.073 | 0.124 | 0.973 | 0.213 | 0.074 | 0.124 | 0.973 |
| ANN | 0.284 | 0.177 | 0.309 | 0.953 | 0.356 | 0.197 | 0.289 | 0.926 |
| DT | 0.173 | 0.079 | 0.115 | 0.983 | 0.155 | 0.069 | 0.105 | 0.986 |
| GBM | 0.067 | 0.045 | 0.098 | 0.997 | 0.169 | 0.075 | 0.129 | 0.983 |
| KNN | 0.698 | 0.205 | 0.169 | 0.716 | 0.746 | 0.224 | 0.275 | 0.653 |
| LR | 0.263 | 0.181 | 0.341 | 0.960 | 0.321 | 0.202 | 0.350 | 0.940 |
| RF | 0.103 | 0.058 | 0.115 | 0.994 | 0.221 | 0.097 | 0.180 | 0.977 |
| SVR | 0.211 | 0.108 | 0.149 | 0.974 | 0.282 | 0.152 | 0.267 | 0.954 |
| ML Algorithm | Validation | |||
|---|---|---|---|---|
| RMSE | MAE | MAPE | R-Squared | |
| AB | 0.213 | 0.075 | 0.141 | 0.972 |
| ANN | 0.354 | 0.214 | 0.374 | 0.927 |
| DT | 0.225 | 0.087 | 0.115 | 0.970 |
| GBM | 0.165 | 0.071 | 0.127 | 0.984 |
| KNN | 0.743 | 0.237 | 0.224 | 0.677 |
| LR | 0.303 | 0.199 | 0.361 | 0.946 |
| RF | 0.227 | 0.101 | 0.196 | 0.970 |
| SVR | 0.271 | 0.165 | 0.326 | 0.957 |
| Reference | System Boundary | Structure | CO2 Emission (kg CO2/m2) | |
|---|---|---|---|---|
| Observed | Predicted | |||
| This study | Demolition stage | Reinforced concrete | 4.696 | 4.570 |
| Con-brick | 2.461 | 2.469 | ||
| Masonry (block) | 0.292 | 0.289 | ||
| Wood | 0.382 | 0.383 | ||
| Average of all data | 1.037 | 1.028 | ||
| Ivanica et al., 2022 [7] | Demolition, waste sorting, and loading stage | concrete-brick concrete-block | 7.534–10.342 GIA | |
| Quéheille et al., 2022 [14] | Demolition stage | Metal frame | 2.13 * | |
| Wang et al., 2018 [38] | Demolition stage | Reinforced concrete (high-rise residential building) | 8.7 GIA | |
| Reference | Optimal Algorithm | System Boundary | Performance (R2) |
|---|---|---|---|
| This study | GBM | Demolition stage | Training 0.997 Test 0.983 Validation 0.984 |
| Razi and Ansari. (2024) [15] | ANN | Construction stage | Training 0.9949 Test 0.9799 |
| Fang et al. (2021) [16] | RF | Construction stage | Training 0.6403 |
| Tsay et al. (2021) [39] | GBM | Renovation stage | Training 0.993 Test 0.989 |
Disclaimer/Publisher’s Note: The statements, opinions and data contained in all publications are solely those of the individual author(s) and contributor(s) and not of MDPI and/or the editor(s). MDPI and/or the editor(s) disclaim responsibility for any injury to people or property resulting from any ideas, methods, instructions or products referred to in the content. |
© 2025 by the authors. Licensee MDPI, Basel, Switzerland. This article is an open access article distributed under the terms and conditions of the Creative Commons Attribution (CC BY) license (https://creativecommons.org/licenses/by/4.0/).
Share and Cite
Cha, G.-W.; Park, C.-W. Development of an Optimal Machine Learning Model to Predict CO2 Emissions at the Building Demolition Stage. Buildings 2025, 15, 526. https://doi.org/10.3390/buildings15040526
Cha G-W, Park C-W. Development of an Optimal Machine Learning Model to Predict CO2 Emissions at the Building Demolition Stage. Buildings. 2025; 15(4):526. https://doi.org/10.3390/buildings15040526
Chicago/Turabian StyleCha, Gi-Wook, and Choon-Wook Park. 2025. "Development of an Optimal Machine Learning Model to Predict CO2 Emissions at the Building Demolition Stage" Buildings 15, no. 4: 526. https://doi.org/10.3390/buildings15040526
APA StyleCha, G.-W., & Park, C.-W. (2025). Development of an Optimal Machine Learning Model to Predict CO2 Emissions at the Building Demolition Stage. Buildings, 15(4), 526. https://doi.org/10.3390/buildings15040526