Article

Investigation of Welding-Induced Residual Stresses in a Herringbone Column Using the Blind Hole Technique: An Experimental and Numerical Study

by
Jianbo Ren
1,2,
Yanchao Yue
1,
Xiangwei Zhang
1,2,*,
Zheng Yang
1,
Zhihang Liu
2,
Yuanyuan Dong
3,
Jihao Ma
2,
Chenlu Liu
4,5 and
Jianjun Ma
4,5
1
School of Habitat and Civil Engineering, Xi’an Jiaotong University, Xi’an 710049, China
2
Installation Engineering Co., Ltd., China Construction Seventh Engineering Bureau, Zhengzhou 450011, China
3
Ningbo Huakang Luting Construction Co., Ltd., Ningbo 315700, China
4
School of Civil Engineering and Architecture, Henan University of Science and Technology, Luoyang 471023, China
5
Henan Province Engineering Technology Research Center of Building Safety and Protection, Luoyang 471023, China
*
Author to whom correspondence should be addressed.
Buildings 2025, 15(3), 398; https://doi.org/10.3390/buildings15030398
Submission received: 31 December 2024 / Revised: 24 January 2025 / Accepted: 24 January 2025 / Published: 26 January 2025
(This article belongs to the Section Building Structures)

Abstract

The current research investigates the effect of residual stresses from welding on the stability of steel structures, particularly the herringbone column undulating cross-truss structure in the Zhengzhou New International Exhibition Center project. Residual stresses at 30 key points were measured using the blind hole method, and the temperature and stress fields under thermal coupling were analyzed using numerical simulation techniques. The measured residual stresses of the welded herringbone columns are generally higher than the theoretical calculated values, with the relative error of most measuring points being less than 10% and the minimum difference being 0.98 MPa. It was confirmed that the welding quality meets the design and acceptance standards. Through a combination of experimental measurements and numerical simulations, this study provides valuable reference information for the construction of similar projects. The results indicate that the residual stresses in the herringbone columns are controllable, ensuring the overall safety and reliability of the structure.

1. Introduction

Welding is one of the main connection methods for steel structure buildings, offering advantages like good sealing and strong bearing capacity. However, the heat-affected zone (HAZ) created during the welding process can lead to changes in material properties and the formation of residual stress. Residual stress refers to the non-uniform deformation caused by temperature changes during the welding process within the material and the internal stress that remains without external load [1,2,3,4]. Recently, scholars both domestically and internationally have conducted extensive research on the welding residual stress of different cross-sections and materials. The methods for detecting welding residual stress are mainly divided into non-destructive testing and destructive testing. Non-destructive testing methods refer to technologies that measure residual stress through physical or chemical means without damaging or affecting the performance of the tested object. Common non-destructive testing methods include X-ray diffraction, neutron diffraction, ultrasonic detection, optical methods, and acoustic emission methods [5,6,7,8,9]. Although non-destructive testing methods can measure residual stress without damaging the tested object, destructive testing methods are particularly important for specific needs due to their directness and high accuracy. Destructive testing methods refer to techniques that cause a certain degree of damage or alteration to the properties of a sample during the inspection process. These methods mainly include the drilling method, the cutting method, and the sectioning method. The cutting method [10] involves making a fine slit on the material’s surface and measuring the deformation caused by the cut to calculate the residual stress. The sectioning method [11,12,13] is another destructive approach for measuring residual stress, where the material or structure is sliced into thin sections to release the internal residual stress. The deformation of these thin sections after cutting is then measured to infer the original residual stress distribution. This method is typically applicable to specimens with simple geometric shapes, such as plates and pipes. The drilling method [14,15,16,17] is a traditional residual stress measurement technique that involves drilling a complete through-hole in the object to be measured. The method assumes that during drilling, residual stress is released, causing elastic deformation of the material around the hole. By measuring this deformation, the state of the residual stress can be calculated.
The primary distinction between the blind hole method and the drilling method lies in the fact that the former [18,19,20,21] requires creating a non-through hole, known as a blind hole, on the material’s surface. This feature allows for more precise measurement of residual stresses close to the surface because the hole does not pass through the entire thickness of the material. Although the operation of the blind hole method is relatively complex, it does not significantly change the overall stress state of the measured object, especially in shallow stress measurements, where it can provide higher accuracy. Additionally, the strain gauge used in the blind hole method is small in size, light in weight, and easy to install, which ensures the accuracy of the measurement results and makes it suitable for residual stress fields with large gradient changes. Moreover, unlike other destructive testing methods, the blind hole method causes less damage to the tested component, making it more suitable for practical engineering applications. When applying the blind hole approach to quantify welding residual stresses, plastic deformation may occur at the edge of the blind hole due to stress concentration. Zuo et al. introduced a strain release coefficient to eliminate the influence of plastic deformation at the blind hole edge [22]. If the rate and depth of drilling are not appropriate, additional stress may be introduced into the material during drilling [23]. Li et al. introduced a validated rapid method for evaluating welding residual stresses, incorporating considerations of stress magnitude and biaxial stress ratios [18]. This method was then employed to analyze the pattern of residual stresses in T-joints within steel truss bridges. It was observed by Pei et al. that under low-stress conditions, employing a calibrated stress release coefficient led to a significant overestimation of the residual stresses within the weld area, sometimes even beyond the material’s tensile strength limit [24]. In response, they introduced an iterative technique for refining residual stress estimates. Blödorn et al. observed that when drilling with an end mill, a chamfer is formed at the corner of the hole edge, and, based on this, proposed calibration coefficients that take into account the actual geometry of the blind hole [25].
With the development of computer technology, numerical simulation has become an important tool for studying welding residual stress. Finite element analysis (FEA) and other numerical methods are widely used to predict and analyze the distribution of welding residual stress. Cai [26] improved the speed and accuracy of numerical simulations for large actual structures by using segmented processing of moving heat sources, providing an effective way to solve the convergence problem in large structures. Feng et al. analyze the effects of solid-state phase transformation and transverse constraints on the distribution of weld residual stress and found that transverse constraint significantly increased the transverse residual stress on the upper surface, while having little effect on the longitudinal residual stress distribution [27]. Horváth [28] conducted a numerical analysis of the residual stress in a box-shaped cross-section under inert gas shielded welding with different heat source powers and welding speeds. Yan [29] studied the residual stress in components under CO2 gas-shielded metal arc welding, using Q355 steel square tube Y-joints as the research subject. Wang [11] studied the distribution pattern of membrane residual stress in welded box-shaped sections of Q690 steel. Based on experimental results, the influence of cross-sectional dimensions and welding process parameters on membrane residual stress was also investigated.
For connection components of irregular structures, Han [30] conducted experimental research on L-shaped steel–concrete composite columns, considering the seismic performance of L-shaped steel–concrete composite columns under different cross-sectional dimensions, combinations, and restraint levels. Abdul [31] explored the cyclic behavior of a new type of infilled web plate shear wall and traditional unstiffened steel plate shear walls through a combination of experimental and numerical simulations. Tao [32] studied the axial compressive load-bearing capacity and failure mechanisms of the new type of cruciform steel–concrete composite columns and traditional cruciform steel–concrete composite columns.
Currently, analyses and research on welding residual stress in large structures are still insufficient. Therefore, this study combines field tests and numerical simulation methods to explore this area in depth. Specifically, the welding residual stress of the herringbone columns was measured on-site using the blind hole method. Thereafter, a 3D model for analyzing welding-induced residual stresses was developed through finite element analysis (FEA), designed to simulate the thermal and mechanical stress environments encountered in welding. The model was employed to examine how welding residual stresses specifically affect the structure under thermal coupling conditions, thus ensuring the safety and quality of the construction. This study not only provides a scientific basis for the current project but also accumulates valuable experience for the construction of similar steel structures in the future.

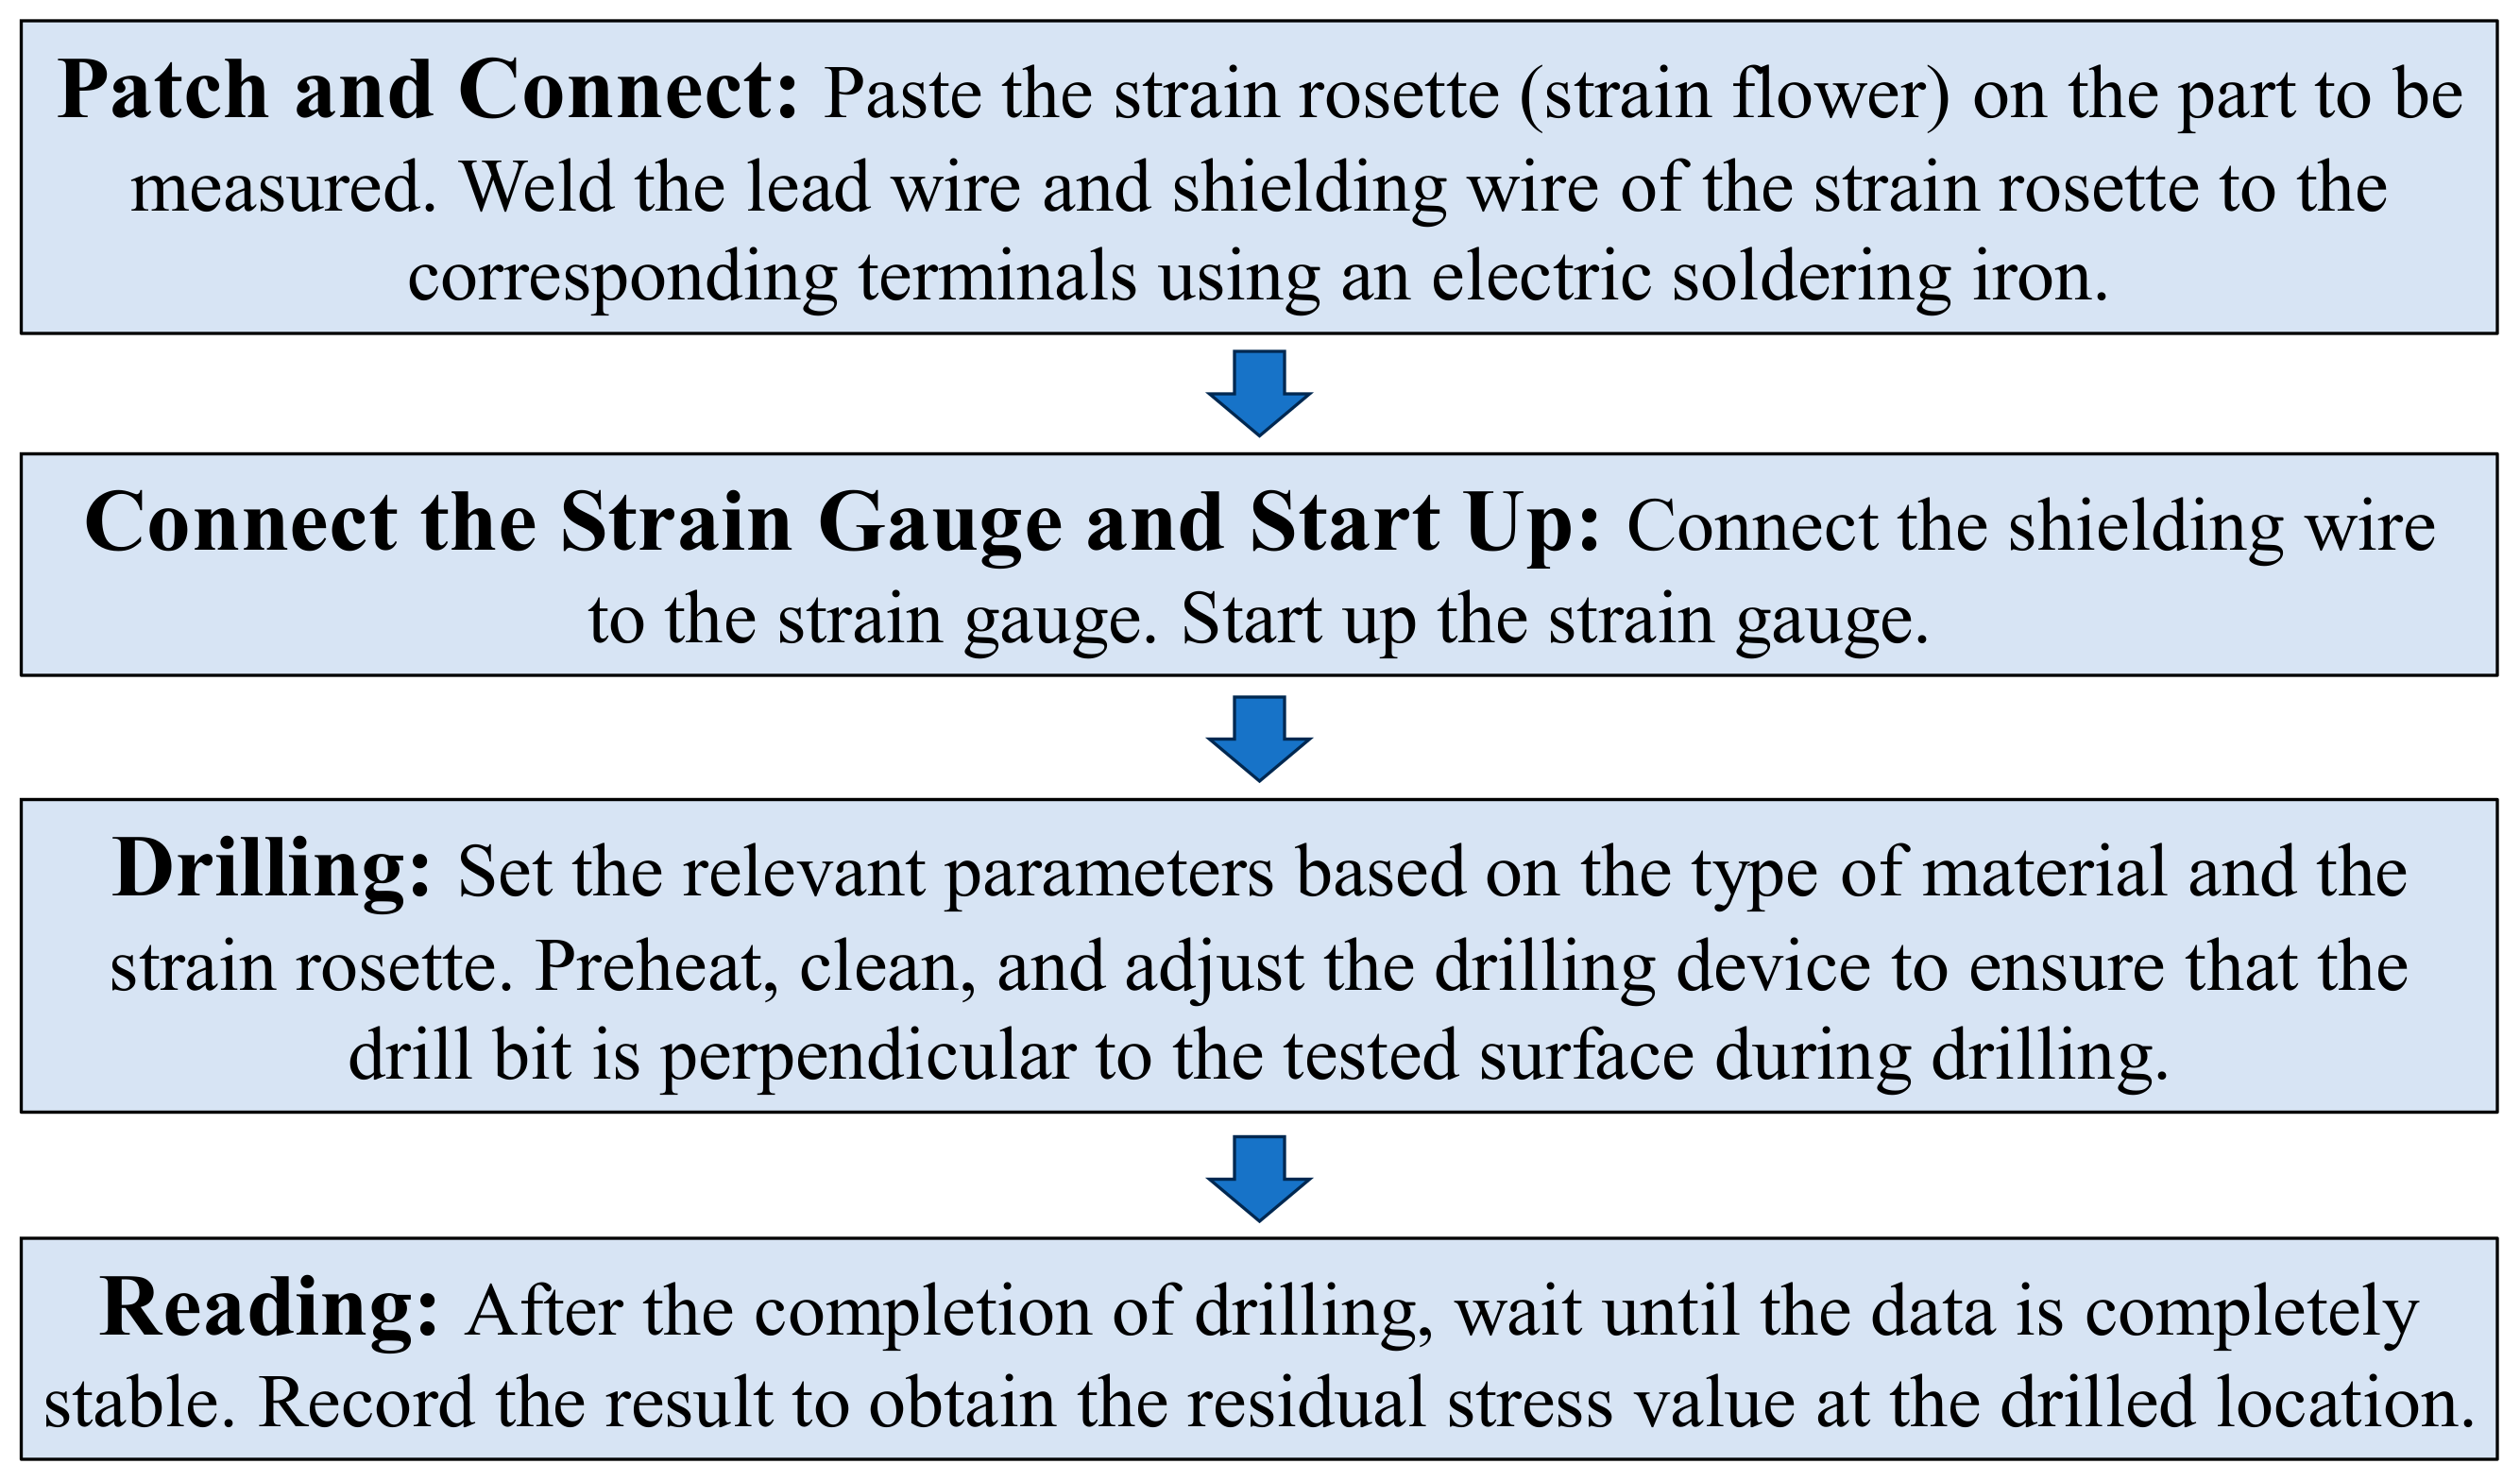
2. The Blind Hole Method for Measuring Residual Stress

When the welding area is heated, the increase in temperature causes the yield strength of the material to decrease. As a result, thermal stresses may exceed the lowered yield strength, leading to plastic deformation. Cooling causes the weld zone to contract, making it relatively shorter or narrower with respect to the surrounding areas, thereby inducing tensile residual stresses within the weld and compressive residual stresses in the adjacent regions. During the cooling process, if volume expansion occurs due to microstructural transformations and this happens at temperatures where the yield strength is higher, then compressive residual stress will be generated in the weld zone, while tensile residual stress will develop in the surrounding material.
The blind hole drilling approach is now broadly employed for the measurement of residual stresses in welding components and casting materials. It involves making a small, shallow hole, which is not a full penetration hole, at the specific measurement point on the part. A strain gauge, which has been pre-attached near the location where the hole will be drilled, measures the strain released as a result of the hole being drilled. The residual stress can then be calculated based on the principle of elasticity, using the measured strain data. By maintaining the smallest possible diameter and depth for the drilled hole, this technique is considered minimally invasive and does not significantly affect the structural integrity or normal use of the component. Due to its high precision, the blind hole drilling method has become a widely adopted technique for measuring residual stresses.

2.1. Basic Principle

Where residual stresses exhibit uniform distribution along the thickness, the single borehole approach allows for the measurement of the residual stress value. A small hole drilled into a welded steel plate with existing residual stresses causes a change in the residual stress field around the hole as the surrounding stress is released. Calculating the strain changes in the local area enables the determination of the original residual stress values (σ1 and σ2) before the drilling process (refer to Equations (1)–(3)).
σ 1 = E 2 ε 0 + ε 90 1 μ + 1 1 + μ ε 0 ε 90 2 + 2 ε 45 ε 0 ε 90 2
σ 2 = E 2 ε 0 + ε 90 1 μ 1 1 + μ ε 0 ε 90 2 + 2 ε 45 ε 0 ε 90 2
θ = 1 2 t a n 1 2 ε 45 ε 0 ε 90 ε 90 ε 0
where ε0, ε45, and ε90 represent the strains released in the directions of 0°, 45°, and 90°, respectively. σ1 and σ2 are the maximum and minimum principal stresses, respectively; θ is the angle between the direction of the maximum principal stress and the 0° direction; E is the elastic modulus of Q355B steel, which is 206,000 MPa; and μ is the strain release coefficient, with a value of 0.29.
The residual equivalent stress is calculated with Equation (4).
σ ¯ = 1 2 σ 1 σ 2 2 + σ 1 2 + σ 2 2 = σ 1 2 + σ 2 2 σ 1 σ 2
The angular stress under residual stress is calculated using Equation (5).
σ τ 0 = 1 2 σ 1 + σ 2 + 1 2 σ 1 + σ 2 c o s 2 θ σ θ 0 = 1 2 σ 1 + σ 2 1 2 σ 1 + σ 2 c o s 2 θ τ θ 0 = 1 2 σ 1 σ 2 s i n 2 θ
For the measurement of residual stress, the main equipment used is the ASMB2 resistance strain gauge and the RSD1 residual stress drilling device. The main experimental steps are as follows (Figure 1).

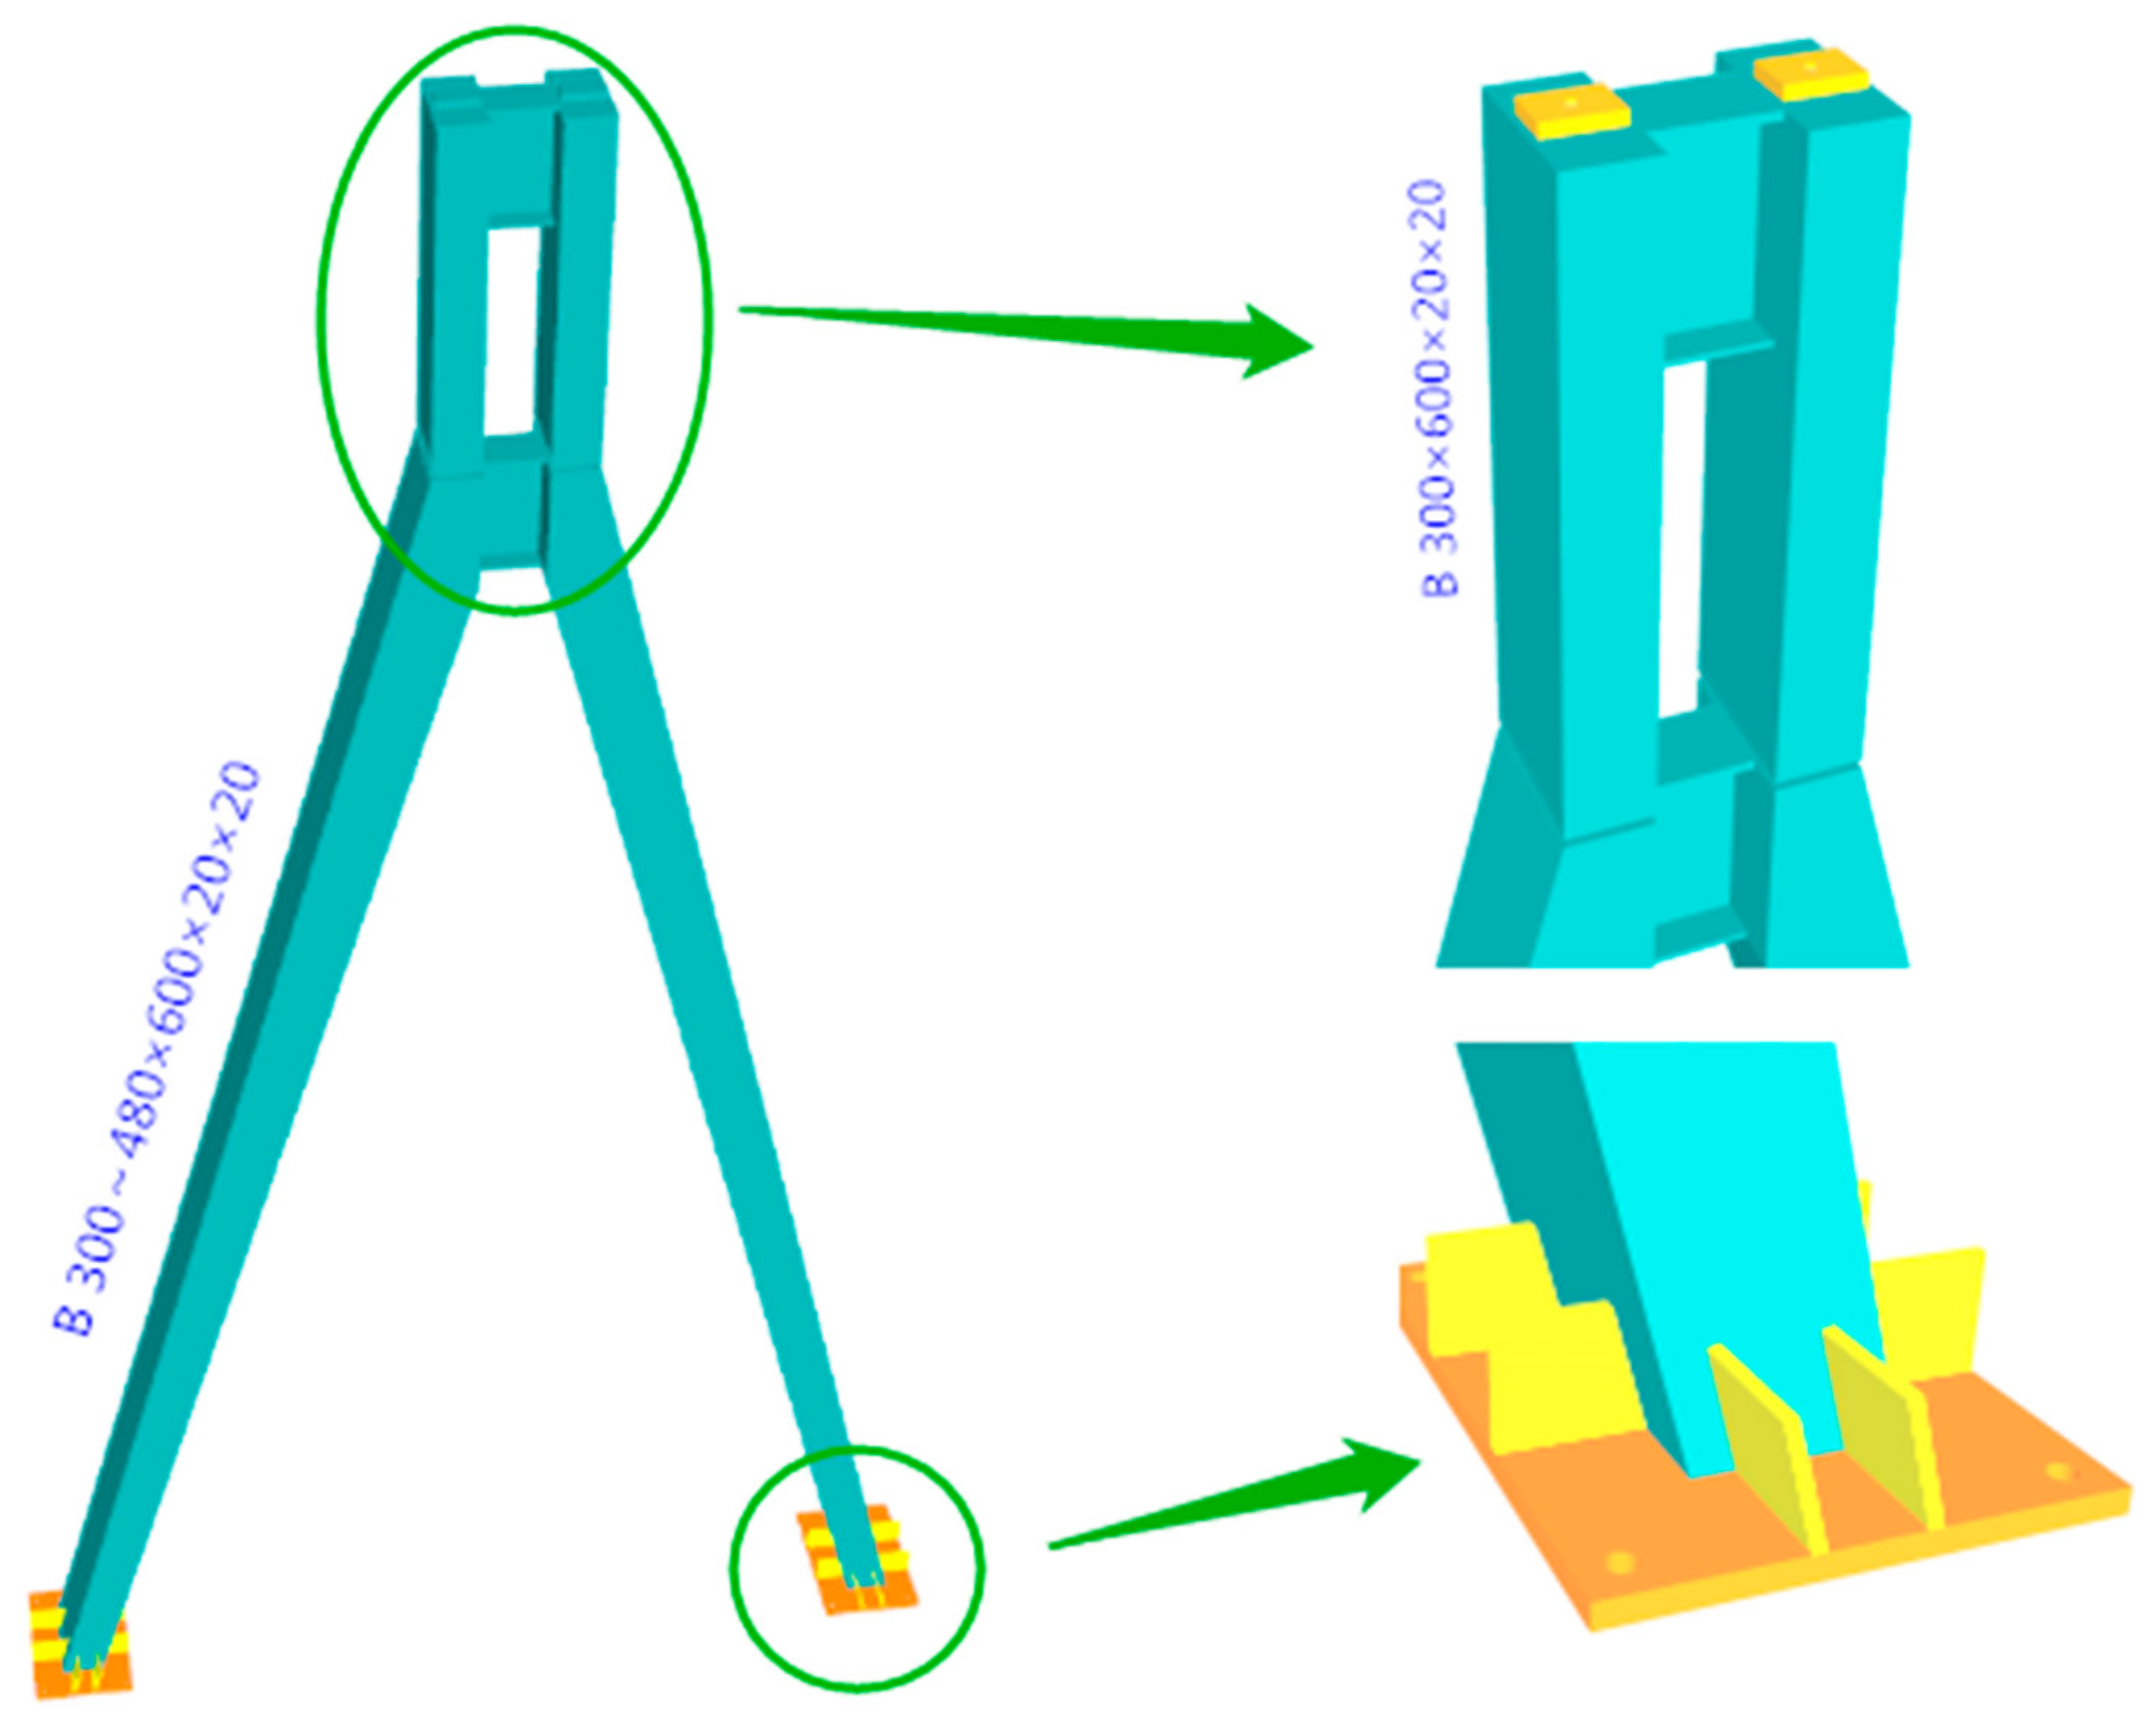
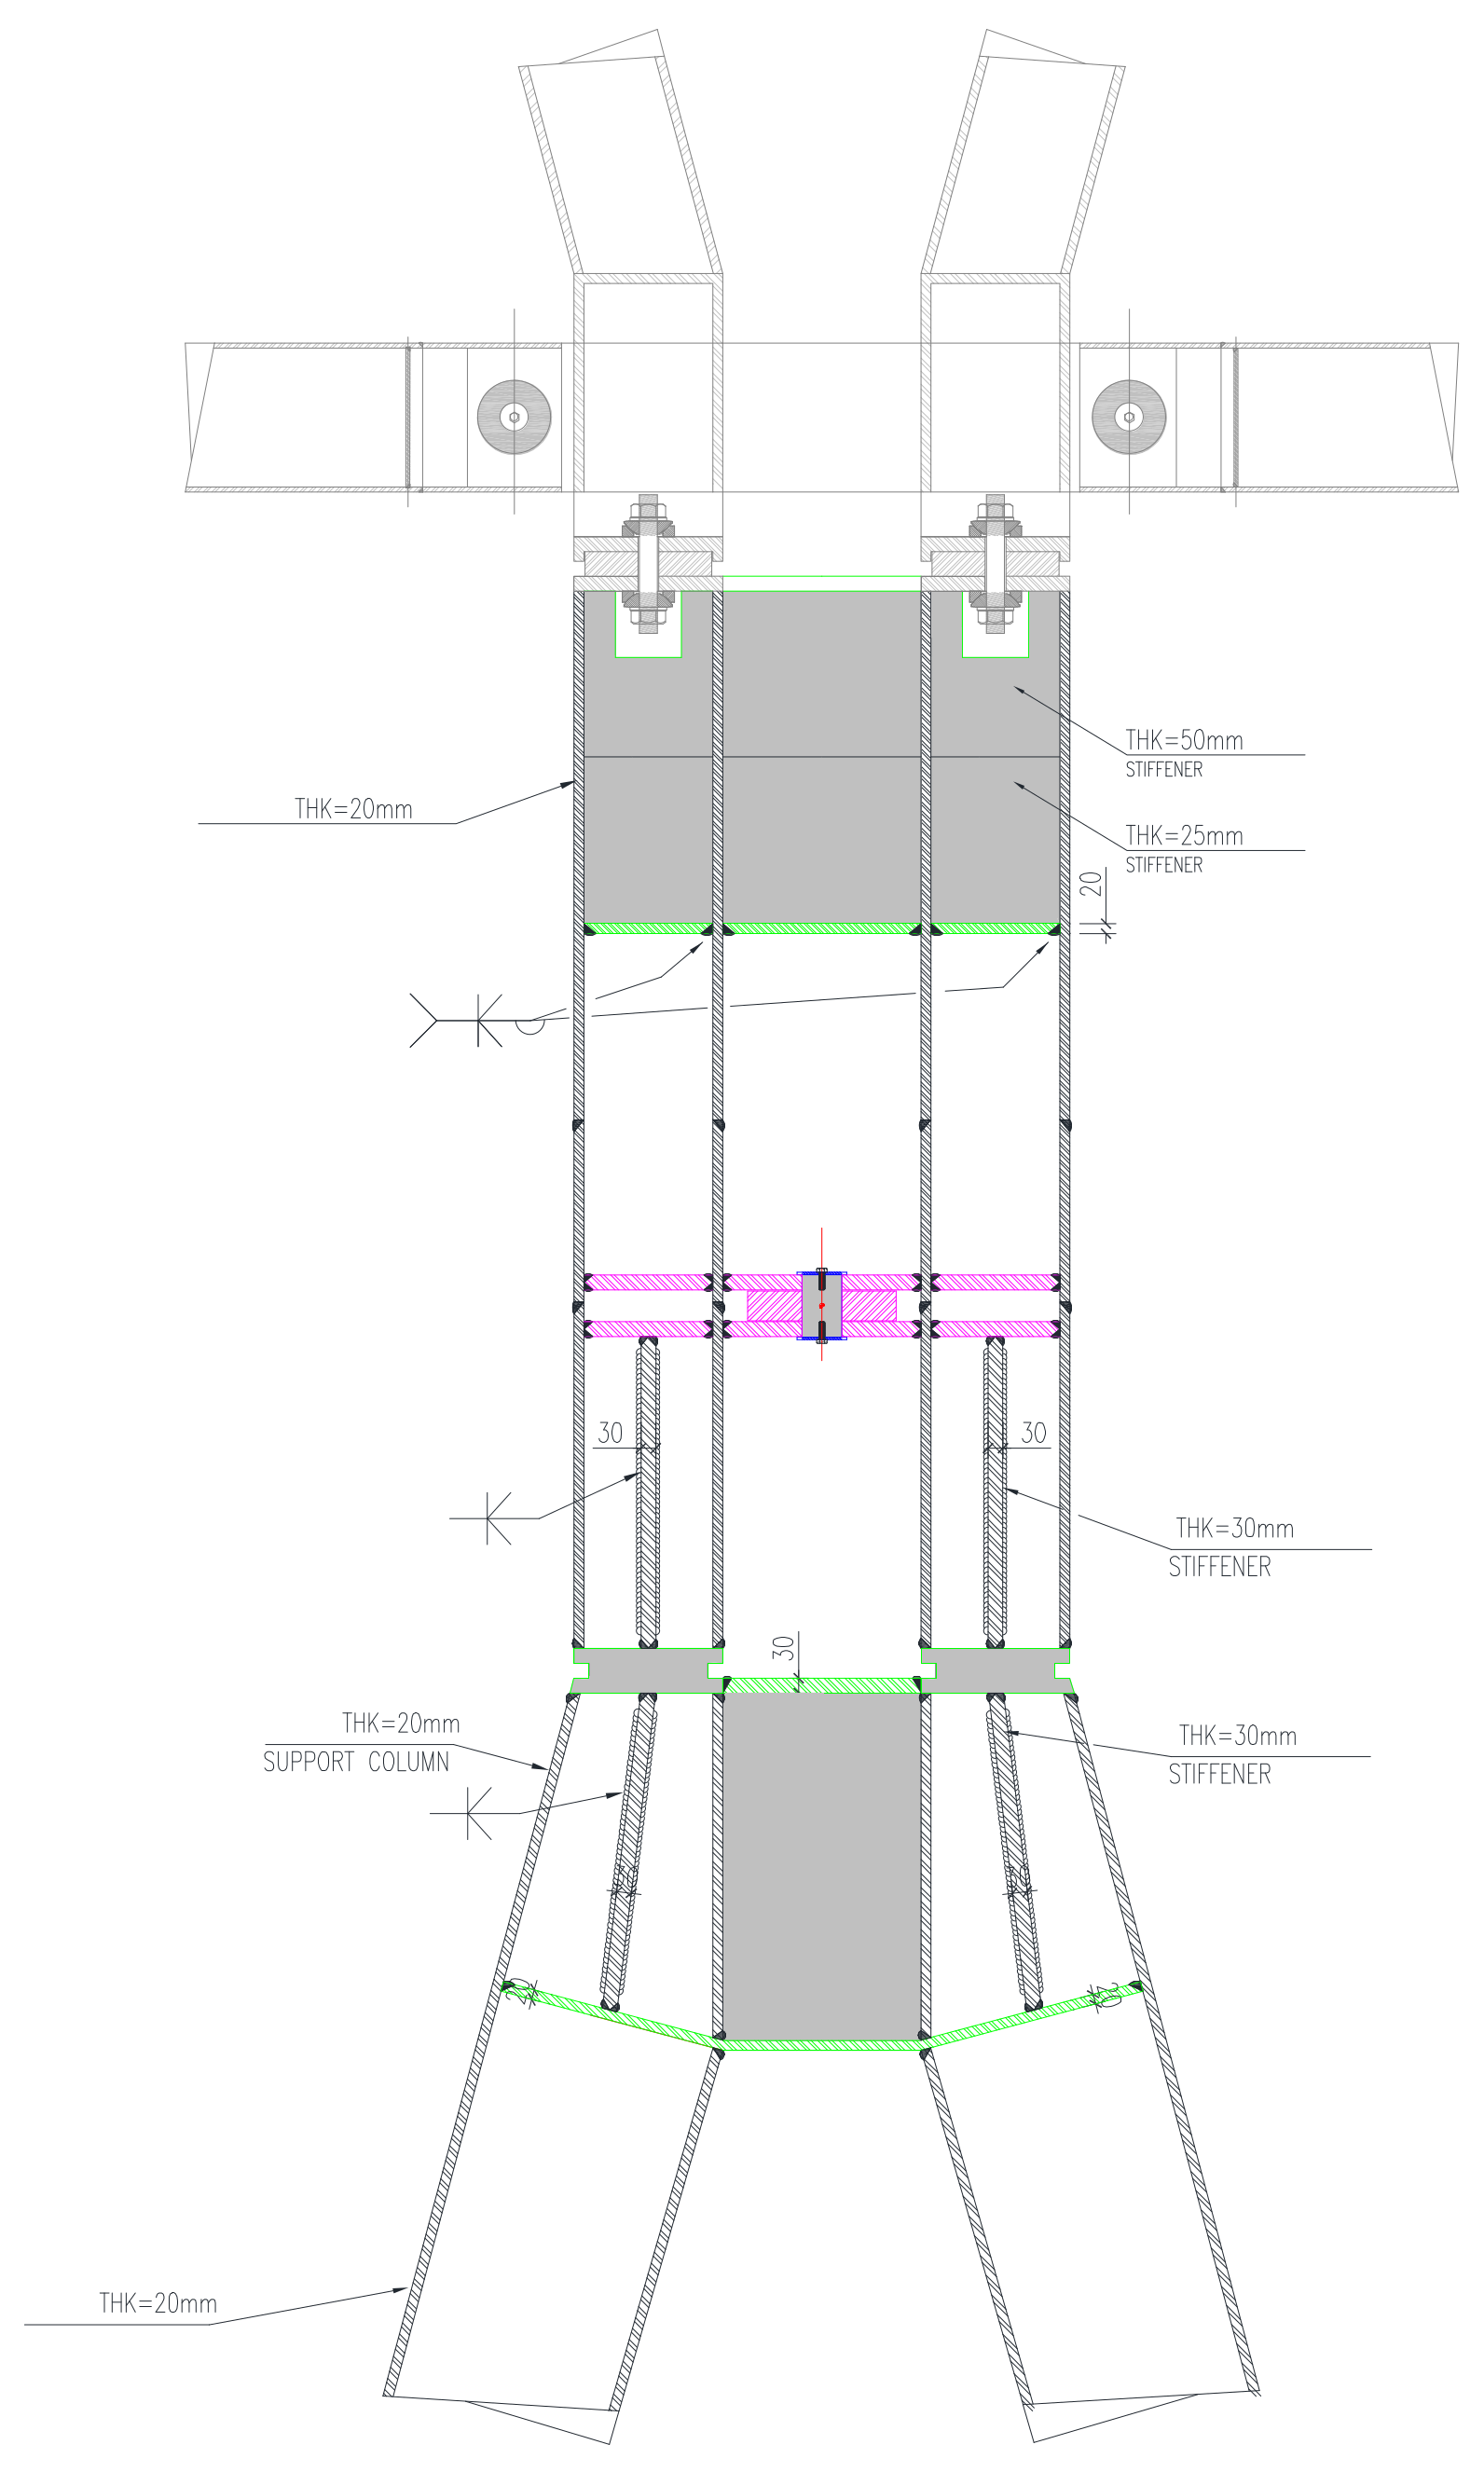
2.2. Project Overview and Welding Procedure

The project adopts a door-type shelving structure composed of an upper space truss beam and lower herringbone columns. In view of the large span required for the exhibition center, the herringbone columns were selected as the main support structure to ensure that the structure has sufficient stability and load-bearing capacity. Throughout construction, the accuracy of welding the herringbone columns is essential, and the residual stresses that arise from this process are pivotal in determining the structural integrity and performance of the steel framework. To ensure the safety and quality of construction, a thorough examination of the residual stresses generated during the welding of the herringbone columns is essential.
The Zhengzhou New International Convention and Exhibition Center project is located in the Zhengzhou Aviation Port, Henan Province. The site measures approximately 600 m in width from east to west and 970 m in length from north to south. The entire building is a steel structure with a maximum height of 21.03 m (at the highest point of the curtain wall). The exhibition hall’s steel structure is a door-type shelving system composed of space truss beams and herringbone columns, with a structural plane size of 162 m by 84 m. The main truss structure has a height of 19.048 m, a span of 84 m, and a spacing of 24 m. The secondary trusses are spaced 12 m apart. The main structure is shown in Figure 2.
The steel columns in the exhibition hall are box-section columns arranged on the north and south sides of the exhibition hall. As an important part of the steel structure, the residual stress generated in the herringbone columns during the welding process may affect the overall stability and service life of the structure. Therefore, to ensure the overall safety and reliability of the structure, it is necessary to analyze the residual stress generated by the welding process.
Engineered steel components need to be assembled on-site, and the amount of welding required is substantial. The maximum thickness of the steel plates welded on-site is 30 mm, making it challenging to control the welding quality, prevent welding shrinkage and deformation, and eliminate the residual stress caused by welding. Additionally, because the structure is primarily a space frame, the field splicing weld forms are diverse, and controlling welding quality and deformation is a key focus of this project.
The steel structure columns in this project are made of high-strength steel, and the welding process for the column bodies adopts manual arc welding technology. During the welding process, large residual stresses may be generated due to the uneven distribution of temperature gradients, especially at the junction joints and joints of the herringbone columns. To ensure the long-term stability and safety of the steel columns, it is necessary to accurately calculate and analyze the residual stress generated during the welding process and optimize it through reasonable design and construction measures.
The herringbone column facade model is shown in Figure 3. The top elevation of the herringbone column is 12 m, and the height of the intersection of the two legs of the herringbone column is 9.75 m. The section size at the top of the foundation is 600 mm × 300 mm, the section size at the elevation of 9.75 m is 600 mm × 480 mm, the section size of the superstructure is 600 mm × 300 mm, and the plate thickness is 20 mm. The distance between the neutral axes of the bottom of the two column legs is 6.226 m. The thickness of the stiffening plate inside of the column foot is 30 mm. The connection parts of the components are all in accordance with the requirements of GB50661-2011 [33] “Welding Code for Steel Structures”, and the distribution of welding seams can be seen in Figure 4.

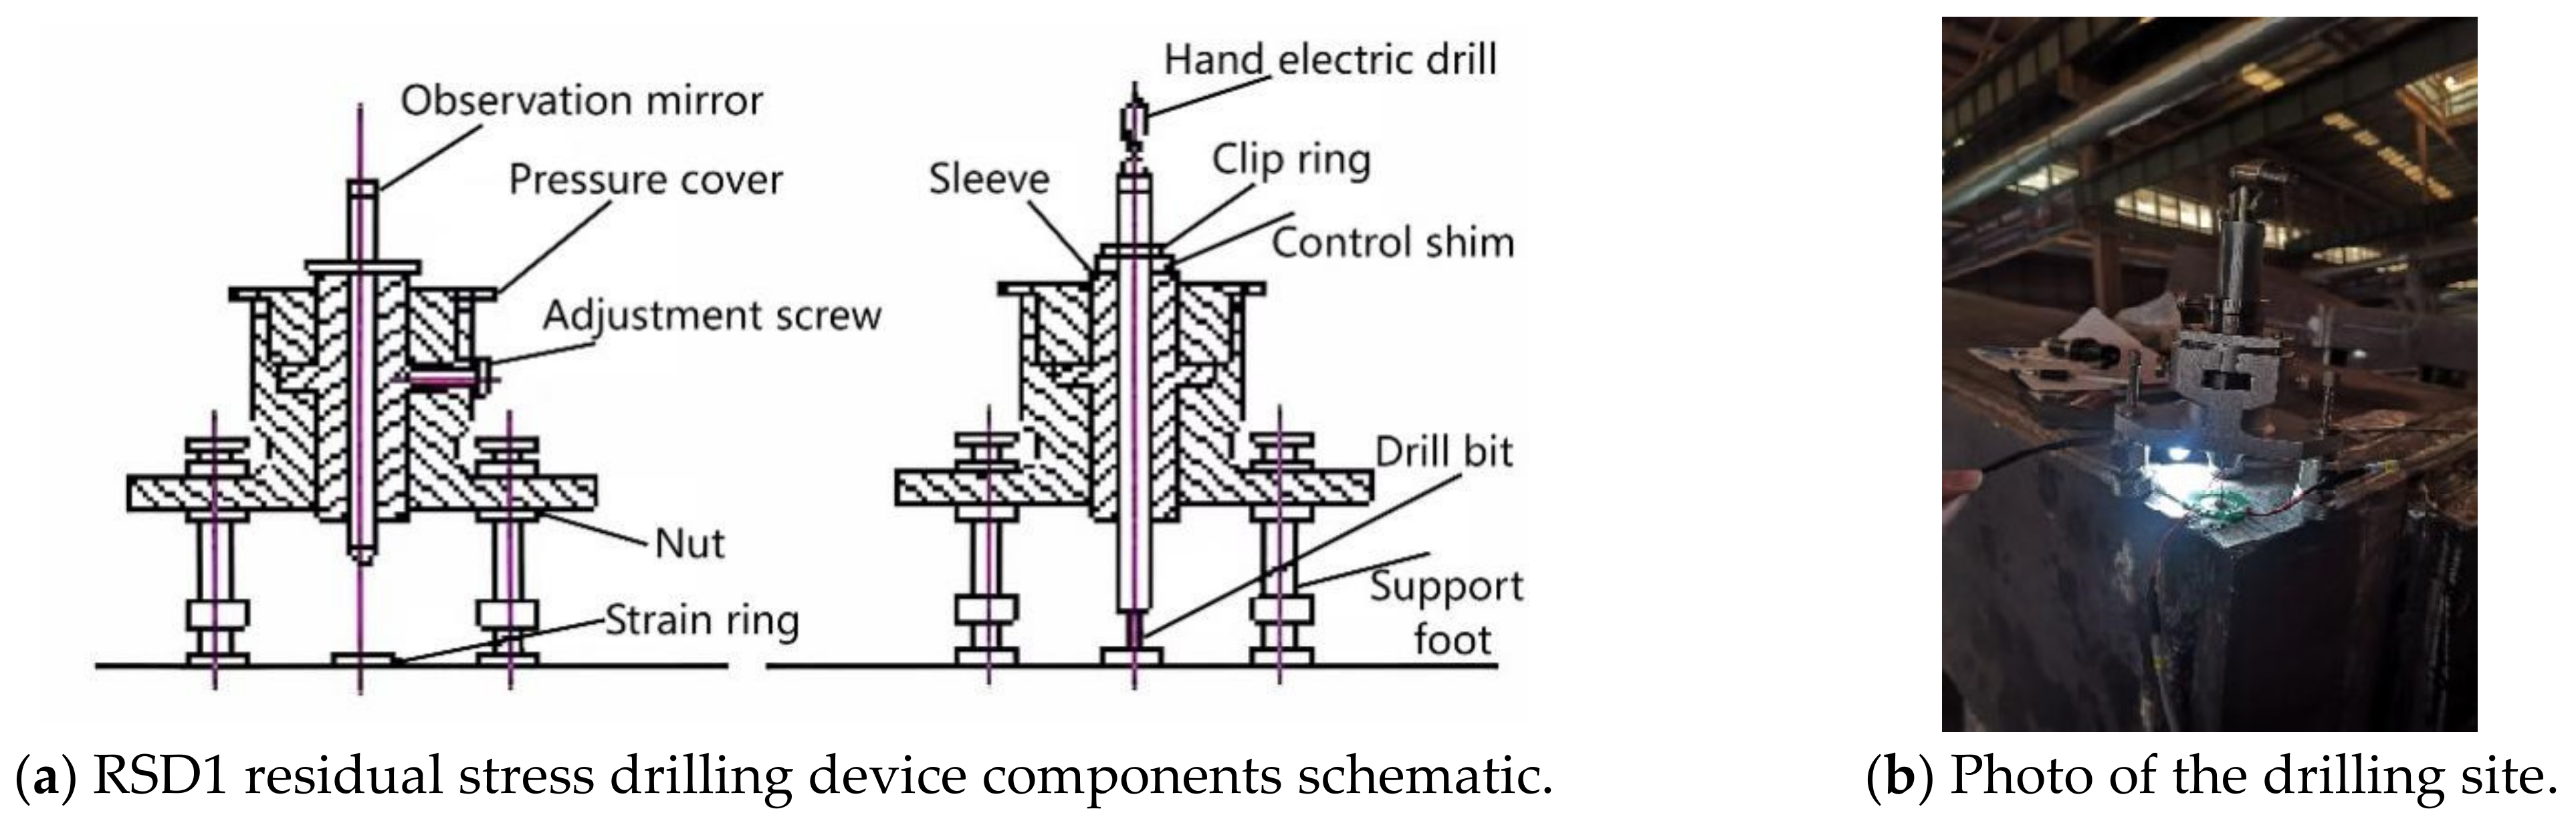
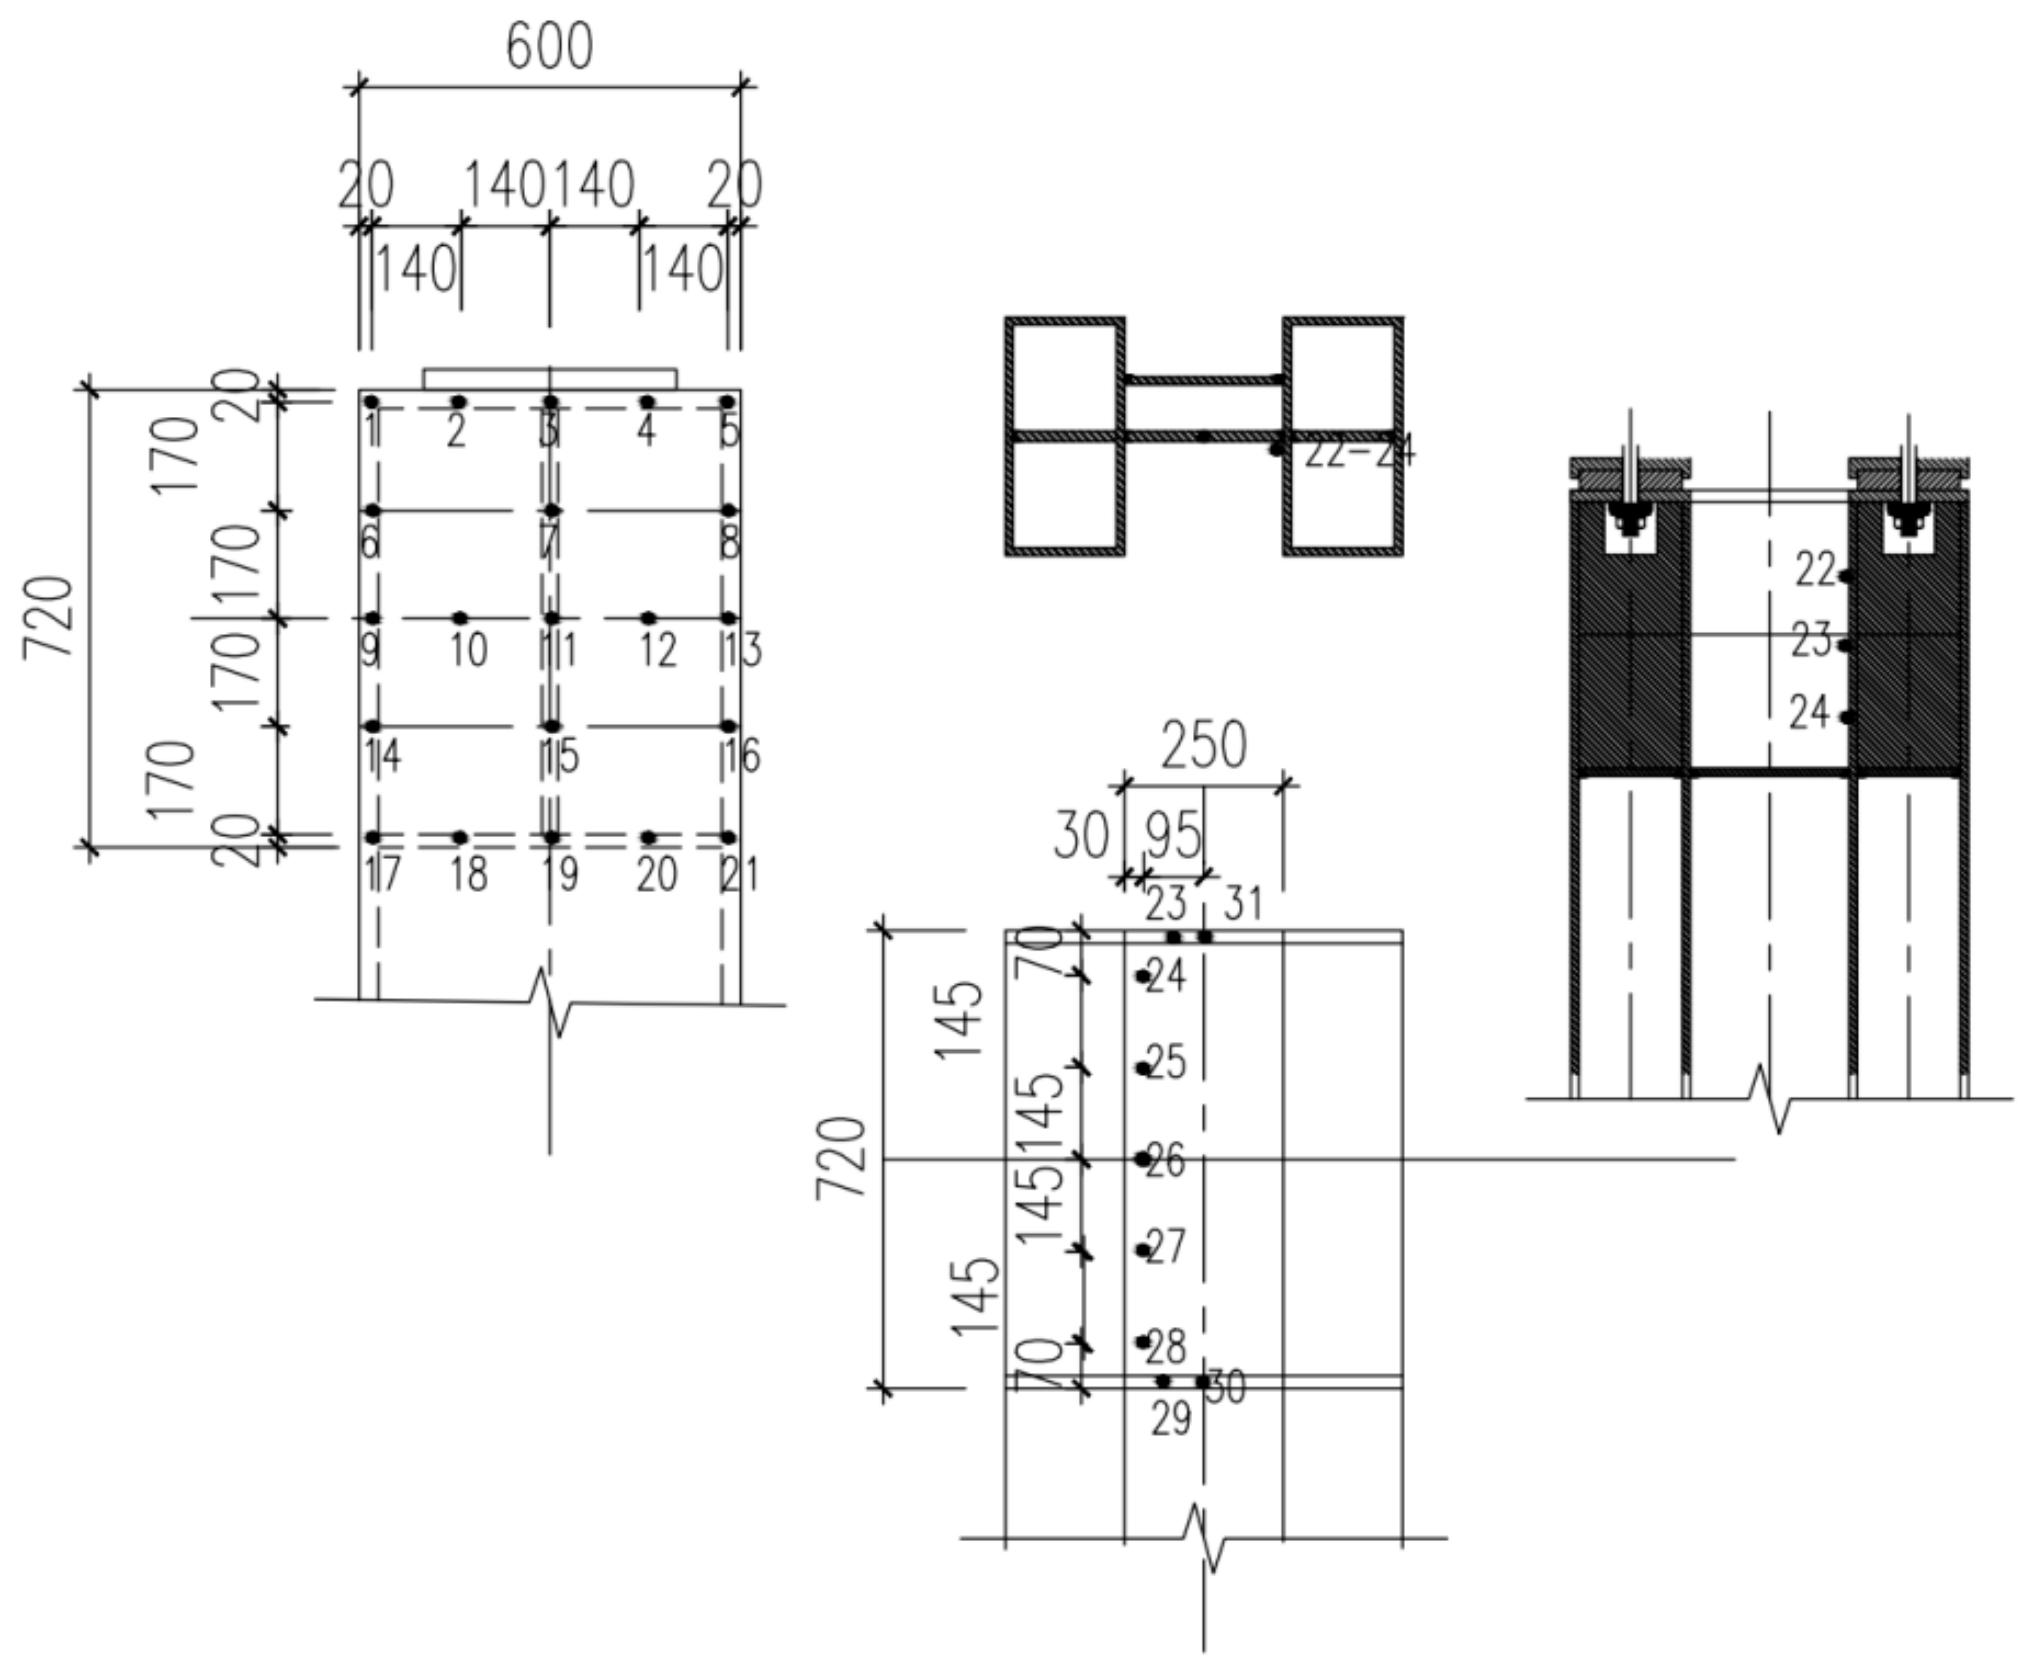
2.3. Experimental Instruments and Measurement Point Layout

Residual stress can only be locally released by drilling a small hole at the measurement point. As a result, the strain gauge detects a very slight strain value, and a high-precision strain gauge must be used. To continuously improve measurement accuracy, it is necessary to pay close attention to various factors that can introduce errors. The main sources of error include the accuracy of the drilling equipment and the drilling technique, as well as strain measurement errors. Generally speaking, the drilling depth should be greater than 2a. The punching method is shown in Figure 5. Figure 5a is a schematic diagram of the parts of the RSD1 residual stress drilling device, and Figure 5b is a photo of the drilling site.
In order to observe the welding quality, the measuring points are mainly concentrated near the welds of the upper half of the herringbone column. Measuring points 1 to 21 are distributed on the side of the column, while measuring points 22 to 30 are primarily concentrated on the front of the column.
Finally, a drill with a diameter of 1.5 mm is selected for reaming, which can reduce the cutting amount and minimize additional strain. The hole center should be at least 8 times the aperture (12 mm) from the edge of the interface, and the drilling depth should be 1.2 times the diameter of the drill bit, resulting in a drilling depth of 2 mm. When drilling multiple holes for the same specimen for calibration, the distance between holes should be greater than 5 times the aperture. The layout of the measurement points is illustrated in Figure 6. The optimal ratio of hole depth to aperture is 1.0 to 1.2 [34]. Figure 7 presents the site diagram for the welding of the herringbone column.

3. Residual Stress Detection

3.1. Stress Detection of the Right Column Leg

The residual stress at points 1 to 21 on the right column leg was measured using the blind hole method. Figure 8 depicts the measurement process, and Table 1 shows the outcomes of the measured values.

3.2. Intermediate Joint Stress Detection

The top of a herringbone column is usually the fulcrum for other structural members, such as beams. This means that most of the vertical load will be concentrated at the vertex where the legs meet. In addition to tensile and compressive stresses, there may also be shear forces at the point where the legs meet. This is because if the column is subjected to a lateral force, the joint between the legs will need to resist this lateral force. Furthermore, the design of the herringbone column needs to take into account its stability, which is particularly important to prevent the column from displacing or overturning in the horizontal direction. This is typically achieved by using bracing or by securely attaching the foot of the column to the foundation.
Considering the complexity of the forces at the joint of the two column feet, it is especially crucial to keep track of the welding residual stresses in this area. Table 2 lists the residual stress values measured at points 22 to 30 using the blind hole drilling technique.

4. Finite Element Modeling

The arc welding process involves complex physical phenomena, such as heat conduction, convection, and radiation. Due to the size of the model and the number of components, fully simulating the temperature field in the actual welding process requires a significant amount of time and memory. To simplify the calculation process, the material is assumed to be continuous and uniform in the simulation, and the liquid flow and metallurgical reactions within the weld pool are not considered. Additionally, it is presumed that the weld material properties align with those of the base material, and consistent thermophysical parameters are used [35].

4.1. The Creation of the Finite Element Model

4.1.1. Material Property Definition and Modeling

The welding plate is primarily made of Q355B steel, and the E5015 electrode is used for welding. The yield strength of Q355B steel is generally around 355 MPa, while the yield strength of the weld metal after E5015 welding is approximately 500 MPa. This ensures that the weld metal has sufficient strength to maintain the structural integrity.
In the weld and heat-affected zone (HAZ), residual stress from welding can promote the diffusion and accumulation of hydrogen, which can deteriorate material properties and lead to hydrogen-induced cracking [27]. The E5015 electrode is a low-hydrogen electrode, and its coating contains alkaline substances that effectively reduce the hydrogen content in the weld, thereby minimizing the risk of hydrogen-induced cracks. This is particularly important for Q355B steel, which is susceptible to cold cracking during the welding process. The chemical properties of Q355B steel are shown in Table 3.
According to GB/T20801.2-2020 [36] “Pressure Pipeline Specification”, the thermal expansion coefficient of Q355B steel is provided in Table 4. Considering that the welding material is generally similar and compatible with the base plate, it is assumed that the material properties of the welding material and the base plate are the same. Feng [27] used SYSWELD software to analyze the impact of solid-state phase transformation and transverse constraints on the residual stress distribution in the weld. The results showed that the solid-state phase transformation has a minimal effect on the residual stress in the weld. It was assumed that the flowability of the weld metal in the molten state during heating was not considered, and the stresses caused by the solid-state phase transformation were not taken into account. Additionally, the simulation disregards the fluidity of the weld metal when it is in a molten state during the heating process.
According to GB985-88 [37], “Basic Forms and Dimensions of Gas Welding, Manual Arc Welding, and Gas Shielded Welding Weld Grooves”, as shown in Figure 4, the thickness of the plates used for the H-shaped column is either 20 mm or 30 mm, and the joint groove form is illustrated in Figure 9.

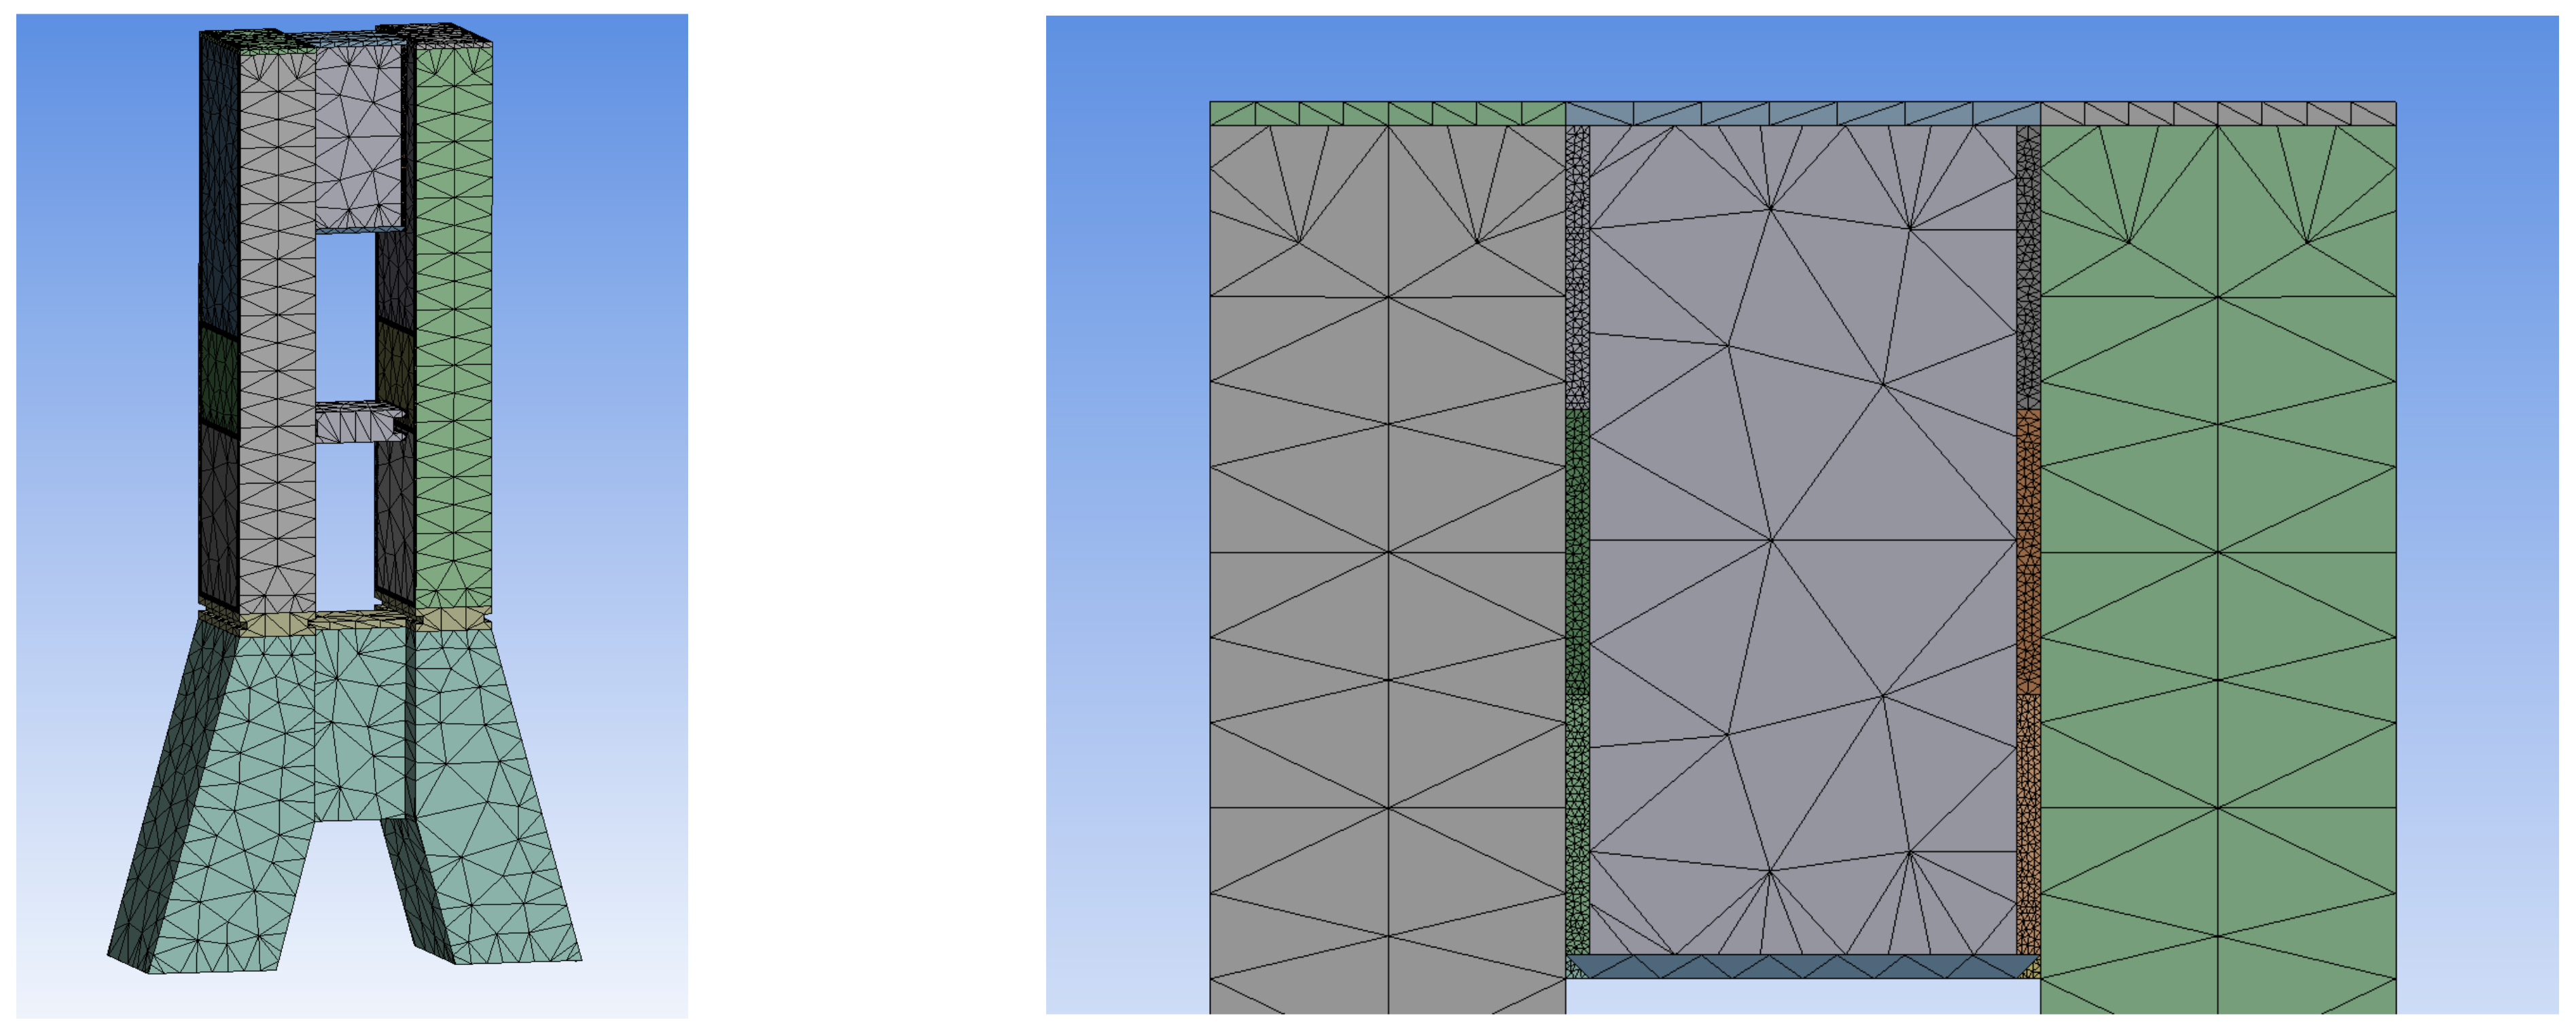
4.1.2. Element Division

In the welding process, the welding material is primarily heated using a local instantaneous heat source. This results in a significant temperature gradient in the plate near the weld, with the temperature gradient decreasing as the distance from the weld increases. Therefore, as shown in Figure 10, the weld and the area near the weld should be separately meshed with higher density to ensure the accuracy of the calculation. The grid density for the more distant parts of the plate can be lower, allowing for a balance between accuracy and computational speed.
For the lower part of the herringbone column, due to its complex structure and minimal influence on the residual stress at the measuring points, a patch conformal method with faster computational speed is used for grid division. This approach helps to maintain the overall efficiency of the simulation while ensuring that the critical areas are accurately modeled.

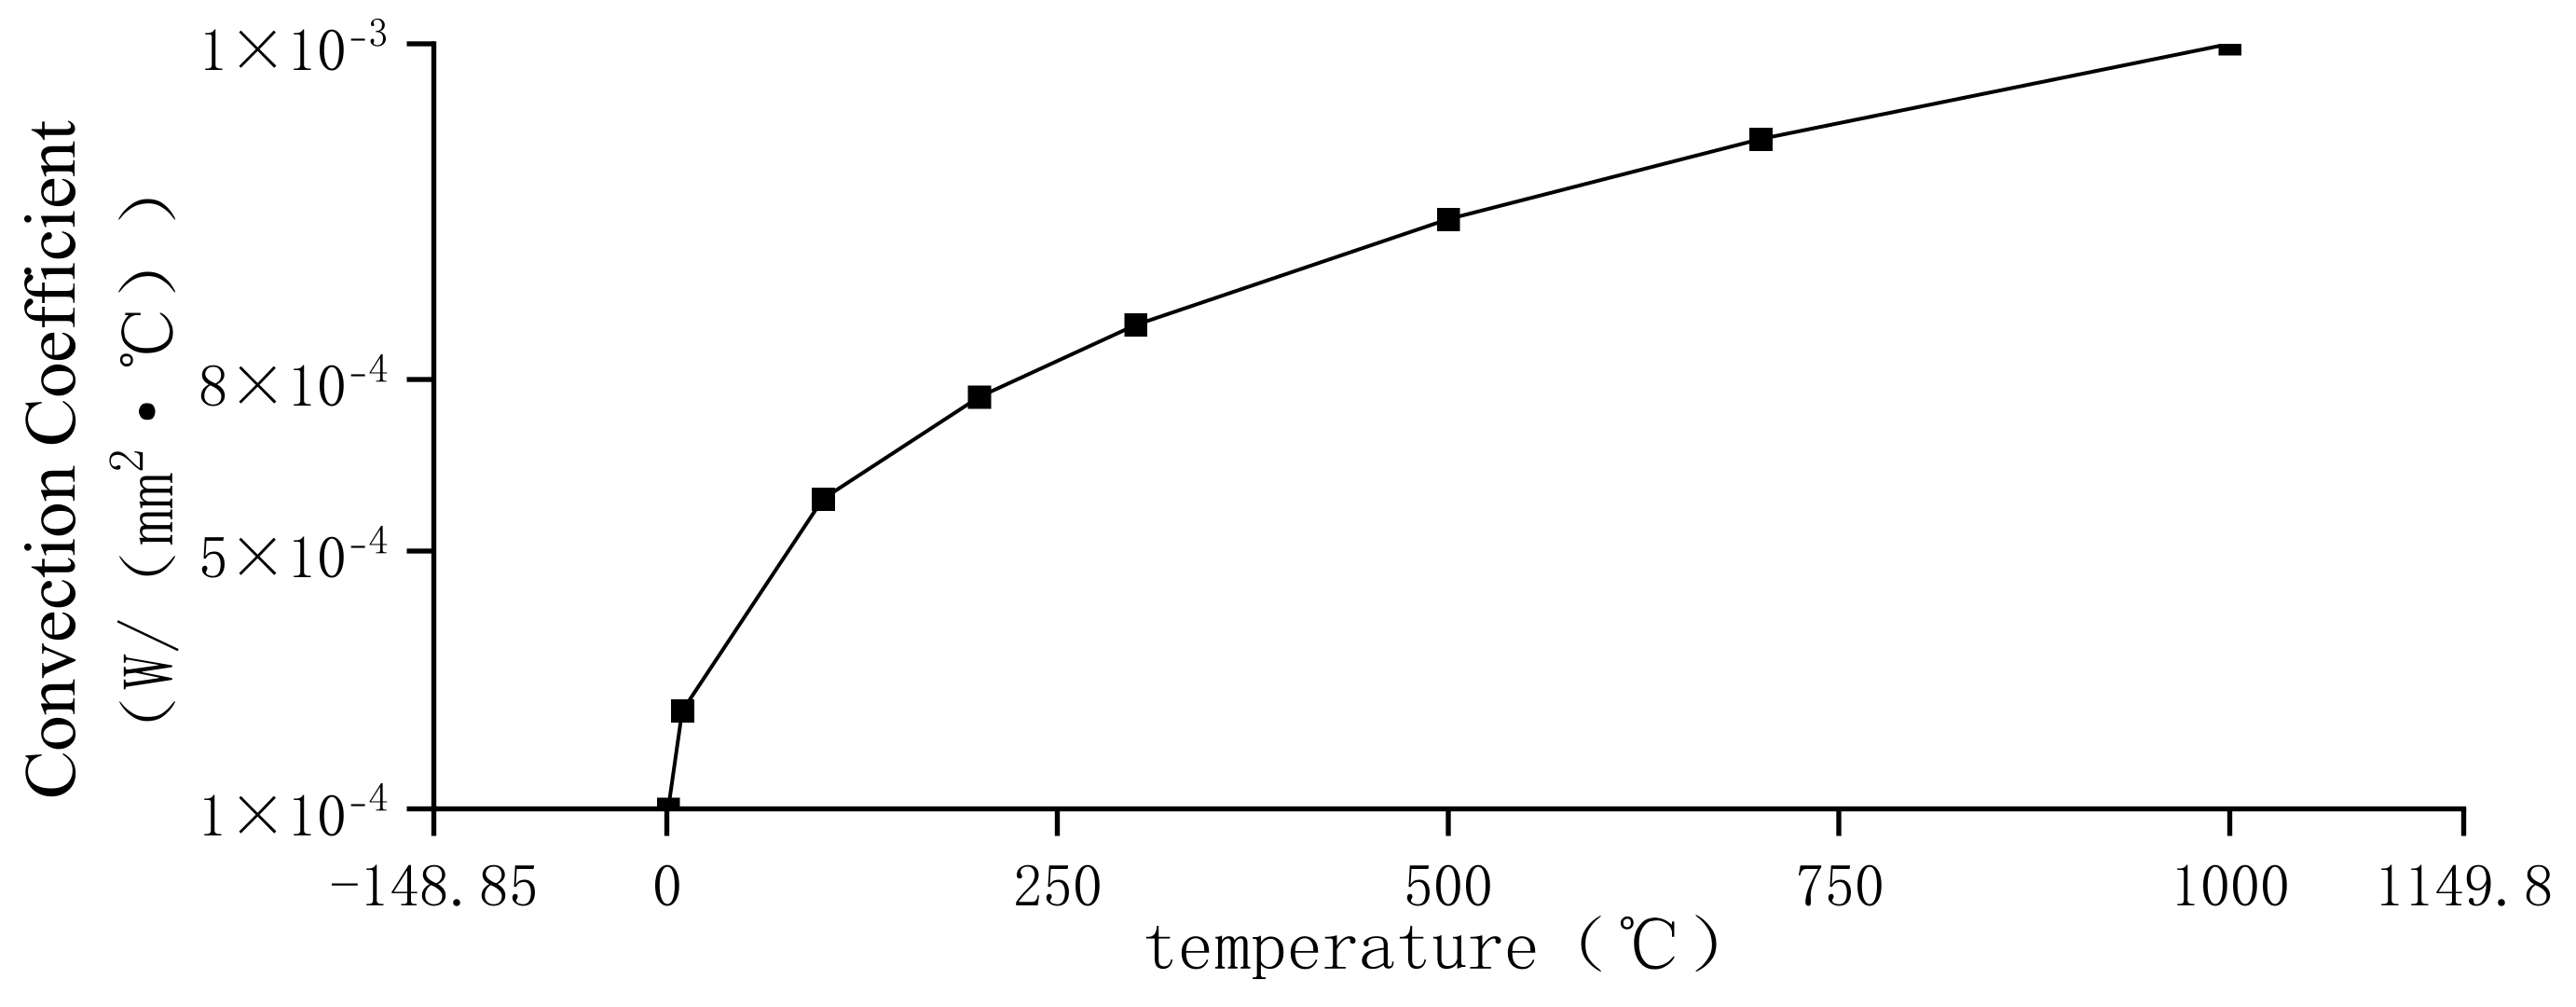
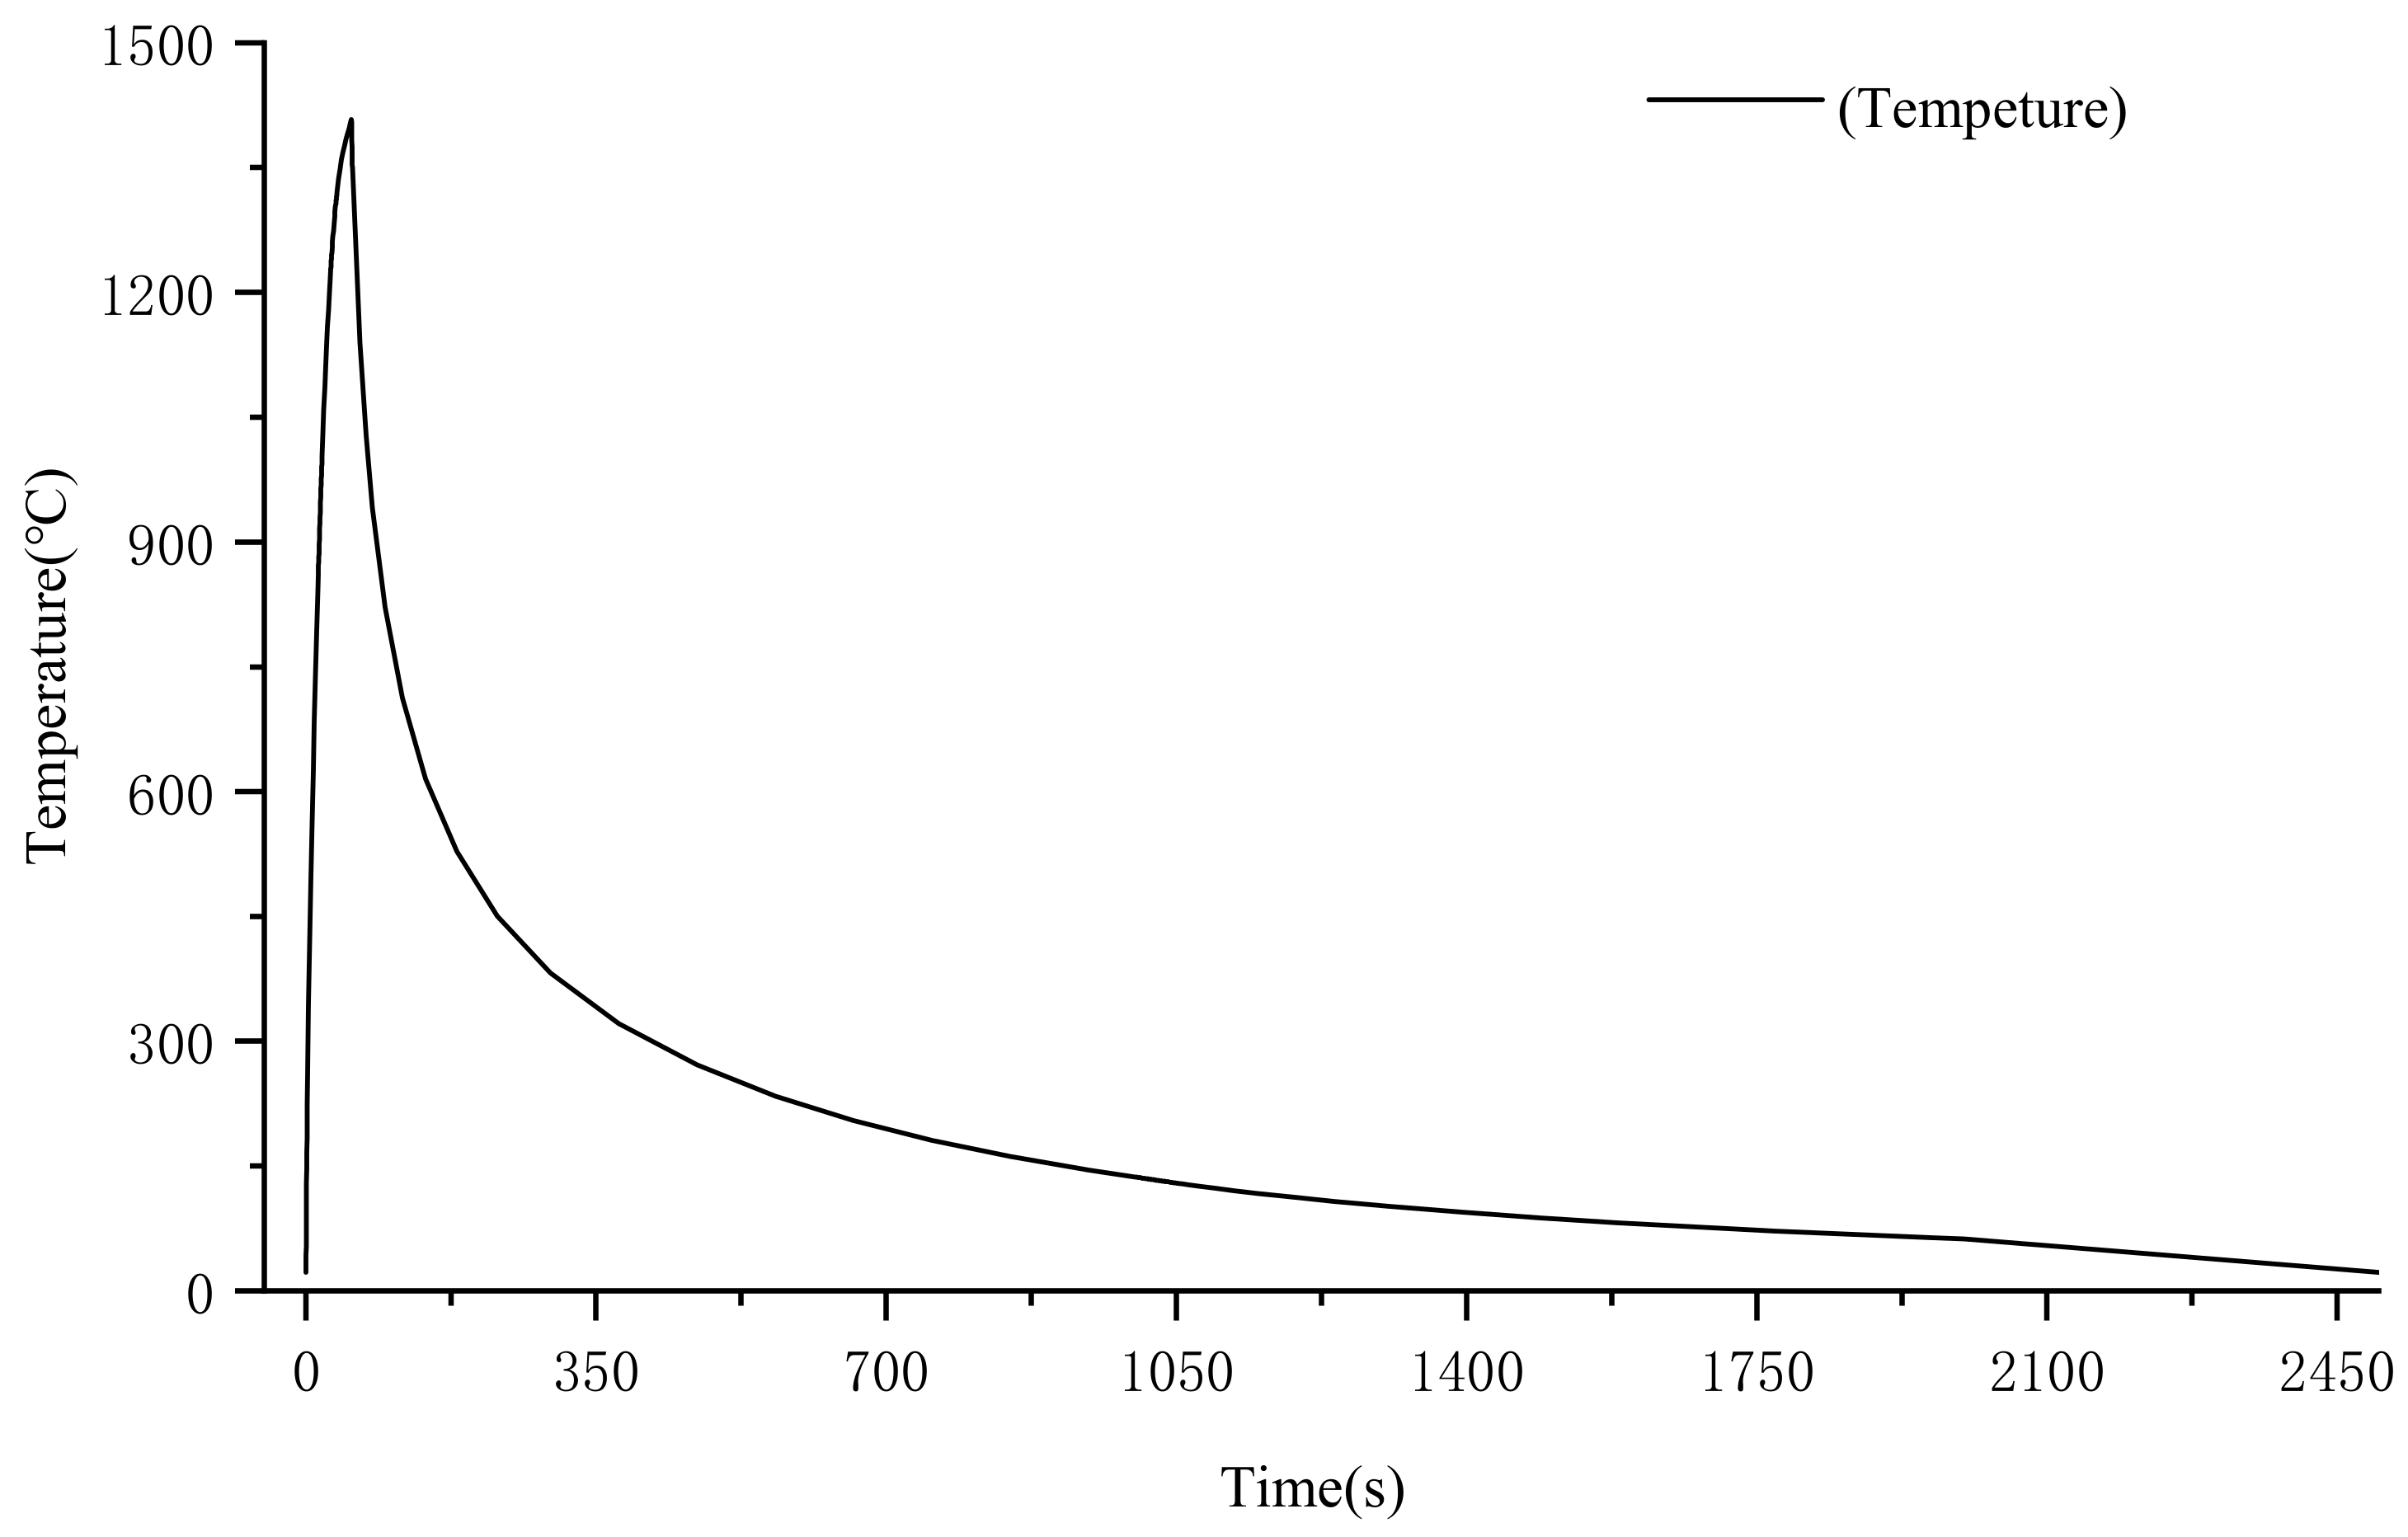
4.2. Loading and Solving of Loads

The welding process is as follows (Table 5): wire diameter 1.2 mm, current 220~320 A, voltage 29~34 V, welding speed 350~450 mm/min, interlayer temperature 60~220 °C, wire extension length about 20 mm, CO2 gas flow 20~80 L/min. The concept of welding heat input involves the heat energy introduced per unit length of the weld seam during fusion welding, correlating with the welding current, the voltage, the welding speed, and thermal efficiency. The thermal efficiency coefficient, in particular, is categorized based on the welding method: argon arc welding, 0.5; gas shielded welding, 0.6 to 0.8; and submerged arc welding, 0.8 to 0.9. The thermal efficiency coefficient is set to 0.7. The heat input is calculated with Equation (6).
Q = I U η V
The welding process mainly takes place inside of the workshop, so the environmental temperature is assumed to be 22 °C when considering the heat convection between the plate and the surrounding environment. For metals above 1000 °C, in addition to convection, there will also be some radiation. The thermal emissivity of the Q355B steel used in this study is 0.7. The convection is shown in Figure 11.
The figure demonstrates the thermal cycles across various regions of the welded joint, simulating the temperature variations and equivalent residual stress distributions in a butt weld of two 20 mm thick plates subjected to thermal effects. Figure 12 shows the temperature changes at the weld, while Figure 13 illustrates how residual stress varies with distance from the weld. Figure 14 shows the heat transfer cloud image.

4.3. Model Reduction Calculation

The model consists of 450 geometric elements, which necessitates significant computational resources in terms of time and memory, imposing stringent requirements on the equipment. The calculations are complex and prone to errors. Considering the symmetrical structure of the herringbone column, only half of the structure is modeled, and a sliding support is added to the symmetry axis for restraint. Additionally, as shown in Figure 13, the residual stress in areas farther away from the weld is smaller. Therefore, welding-induced residual stresses in elements situated at heights below 10.5 m are not considered, with the joint being simplified to a solid connection.
The model is shown in Figure 15. The minimum element edge length is 2.1 mm, and the maximum element edge length is 112.49 mm. As for the mechanical constraints of the model, the base of the column is fixed at the column foot, while the middle cross-section and the top of the column are supported with frictionless supports.
According to the research by Cai Zhipeng [26] on the welding of large and complex steel structures, a segmented heat source model was adopted in this study to describe the material deposition during the welding process. This model simplifies the welding material at the weld joint into a prismatic shape and simulates the segmented and stepwise movement of a point heat source by applying heat input. The study assumes that the length of the weld, l, can be divided into n segments, with each segment not exceeding the effective range d of the welding heat source, and it considers each segment as an equivalent strip heat source acting for a certain period. Although the actual material deposition process is not directly simulated, it is assumed that the weld is heated, and the effects of solid-state phase transformations or liquid metal flow are neglected.

5. Comparison and Analysis of the Test Results

5.1. Residual Stress Comparison at Right Column Leg

The residual stress at 21 measuring points on the right side of the herringbone column after welding was determined through finite element simulation and compared with the measured values. The comparison results are shown in Table 6. According to the data in the table, the calculated theoretical values are generally smaller than the measured values. This discrepancy is attributed to the fact that in the actual welding process, unstable voltage and current, as well as varying welding speeds, can lead to a more uneven temperature field, which in turn results in greater residual stress.
Figure 16 shows the layout diagram of measuring points No. 1 to 21 on the right side of the herringbone column, along with the measured values of welding residual stress at each point after welding.
It is evident from Figure 16 that residual stresses are more pronounced at measurement points adjacent to the weld and near the plate’s midsection. This is related to the cause of residual stress, which is essentially due to uneven shrinkage caused by temperature variations. The closer a measuring point is to the center, the more it is constrained by the surrounding plate, leading to higher residual stress. The measured values reflect this trend, with points 3, 7, 11, 15, and 19 showing higher residual stress compared to the points on either side. Measuring point No. 19, located at the junction of the horizontal partition, the stiffened plate, and the vertical plate, is more constrained and exhibits greater residual stress than the surrounding areas. This same trend is evident in the stress nephograms.
Additionally, it can be seen from Figure 16 that the residual stress is not symmetrically distributed along the central axis. This observation is consistent with the conclusions of Zheng [35].
As illustrated in Figure 17, the measured residual stress exhibits an overall trend that aligns consistently with the numerical simulation outcomes. The qualitative analysis of the welding process and the quantitative assessment of residual deformation through similar methodologies both suggest that the numerical simulation outcomes closely match the experimentally predicted results.
According to Figure 17, it can be seen that the measured values of most measurement points are close to the theoretical values, demonstrating that the numerical simulation results offer a faithful depiction of reality within certain limits. This also suggests that there are no quality problems or safety hazards in the construction process. Among the measurement points, the percentage of deviation for most is within ±10%, while a few points have a percentage of deviation exceeding 20%. Notably, the 17th measurement point has a percentage of deviation as high as 72.93%. Considering the possibility of errors in actual measurements, the difference between the simulated results and the measured values ranges from at least 0.98 MPa to at most 135.94 MPa.

5.2. Comparison of Residual Stress at the Middle Joint

The residual stress at nine measuring points on the right side of the herringbone column after welding was determined through finite element simulation and compared with the measured values. The comparison results are shown in Table 7. According to the data in the table, the calculated theoretical values are generally smaller than the measured values. This discrepancy is attributed to the fact that in the actual welding process, unstable voltage and current, as well as varying welding speeds, can lead to a more uneven temperature field, which in turn results in greater residual stress.
Figure 18 shows the layout diagram of measuring points No. 22 to No. 30 on the herringbone column, along with the measured values of welding residual stress at each point after welding. The residual stress values from measuring point No. 23 to measuring point No. 29 exhibit a trend of first increasing and then decreasing. This phenomenon occurs as the horizontal constraint does not change, but the vertical constraint demonstrates an initial increase followed by a decrease.
It can be seen from Figure 19 that the measured residual stress shows a consistent overall trend with the numerical simulation results. Both the qualitative comparison of the welding process and the quantitative comparison of the residual deformation using similar methods indicate that the numerical simulation results are relatively close to the experimentally predicted results.
As illustrated in Figure 19, the peak residual stress value occurs at measuring point No. 22, situated at the midpoint of the upper end of the herringbone column. This location is the intersection of the herringbone column and the upper roof truss, which bears a more complex upper load and thus requires more monitoring. The measured values of most test points are close to the theoretical values, with the percentage of deviation mostly within ±10%. However, the relative errors for measuring points 23 and 29 are the largest, at approximately 63.23% and 48.87%, respectively, indicating that the difference between the measured and theoretical values is most significant at these two locations. The difference between the simulated results and the measured values ranges from at least 9 MPa to at most 108.74 MPa. Overall, these results indicate that the construction process is free from quality problems and safety hazards.

5.3. Construction Result

Through the detection of residual stress in the welding process and comparison with the numerical simulation results, it is found that the measured values of most measurement points are close to the theoretical values, with small error values. The exceptions are the measurement points at the edges and the corners, where the discrepancies may be due to the difficulty in obtaining accurate measurements. It can be concluded that the welding quality meets the design requirements and can satisfy the acceptance criteria.

6. Conclusions

In this paper, the residual stress caused by the welding of herringbone columns in the exhibition hall is analyzed in detail in connection with the steel structure construction project of the Zhengzhou Exhibition Center. The blind hole method was used to detect residual stress at 30 key measuring points on the column body. Combined with numerical simulation, the causes and distribution of welding residual stress were analyzed, leading to the following conclusions:
(1)
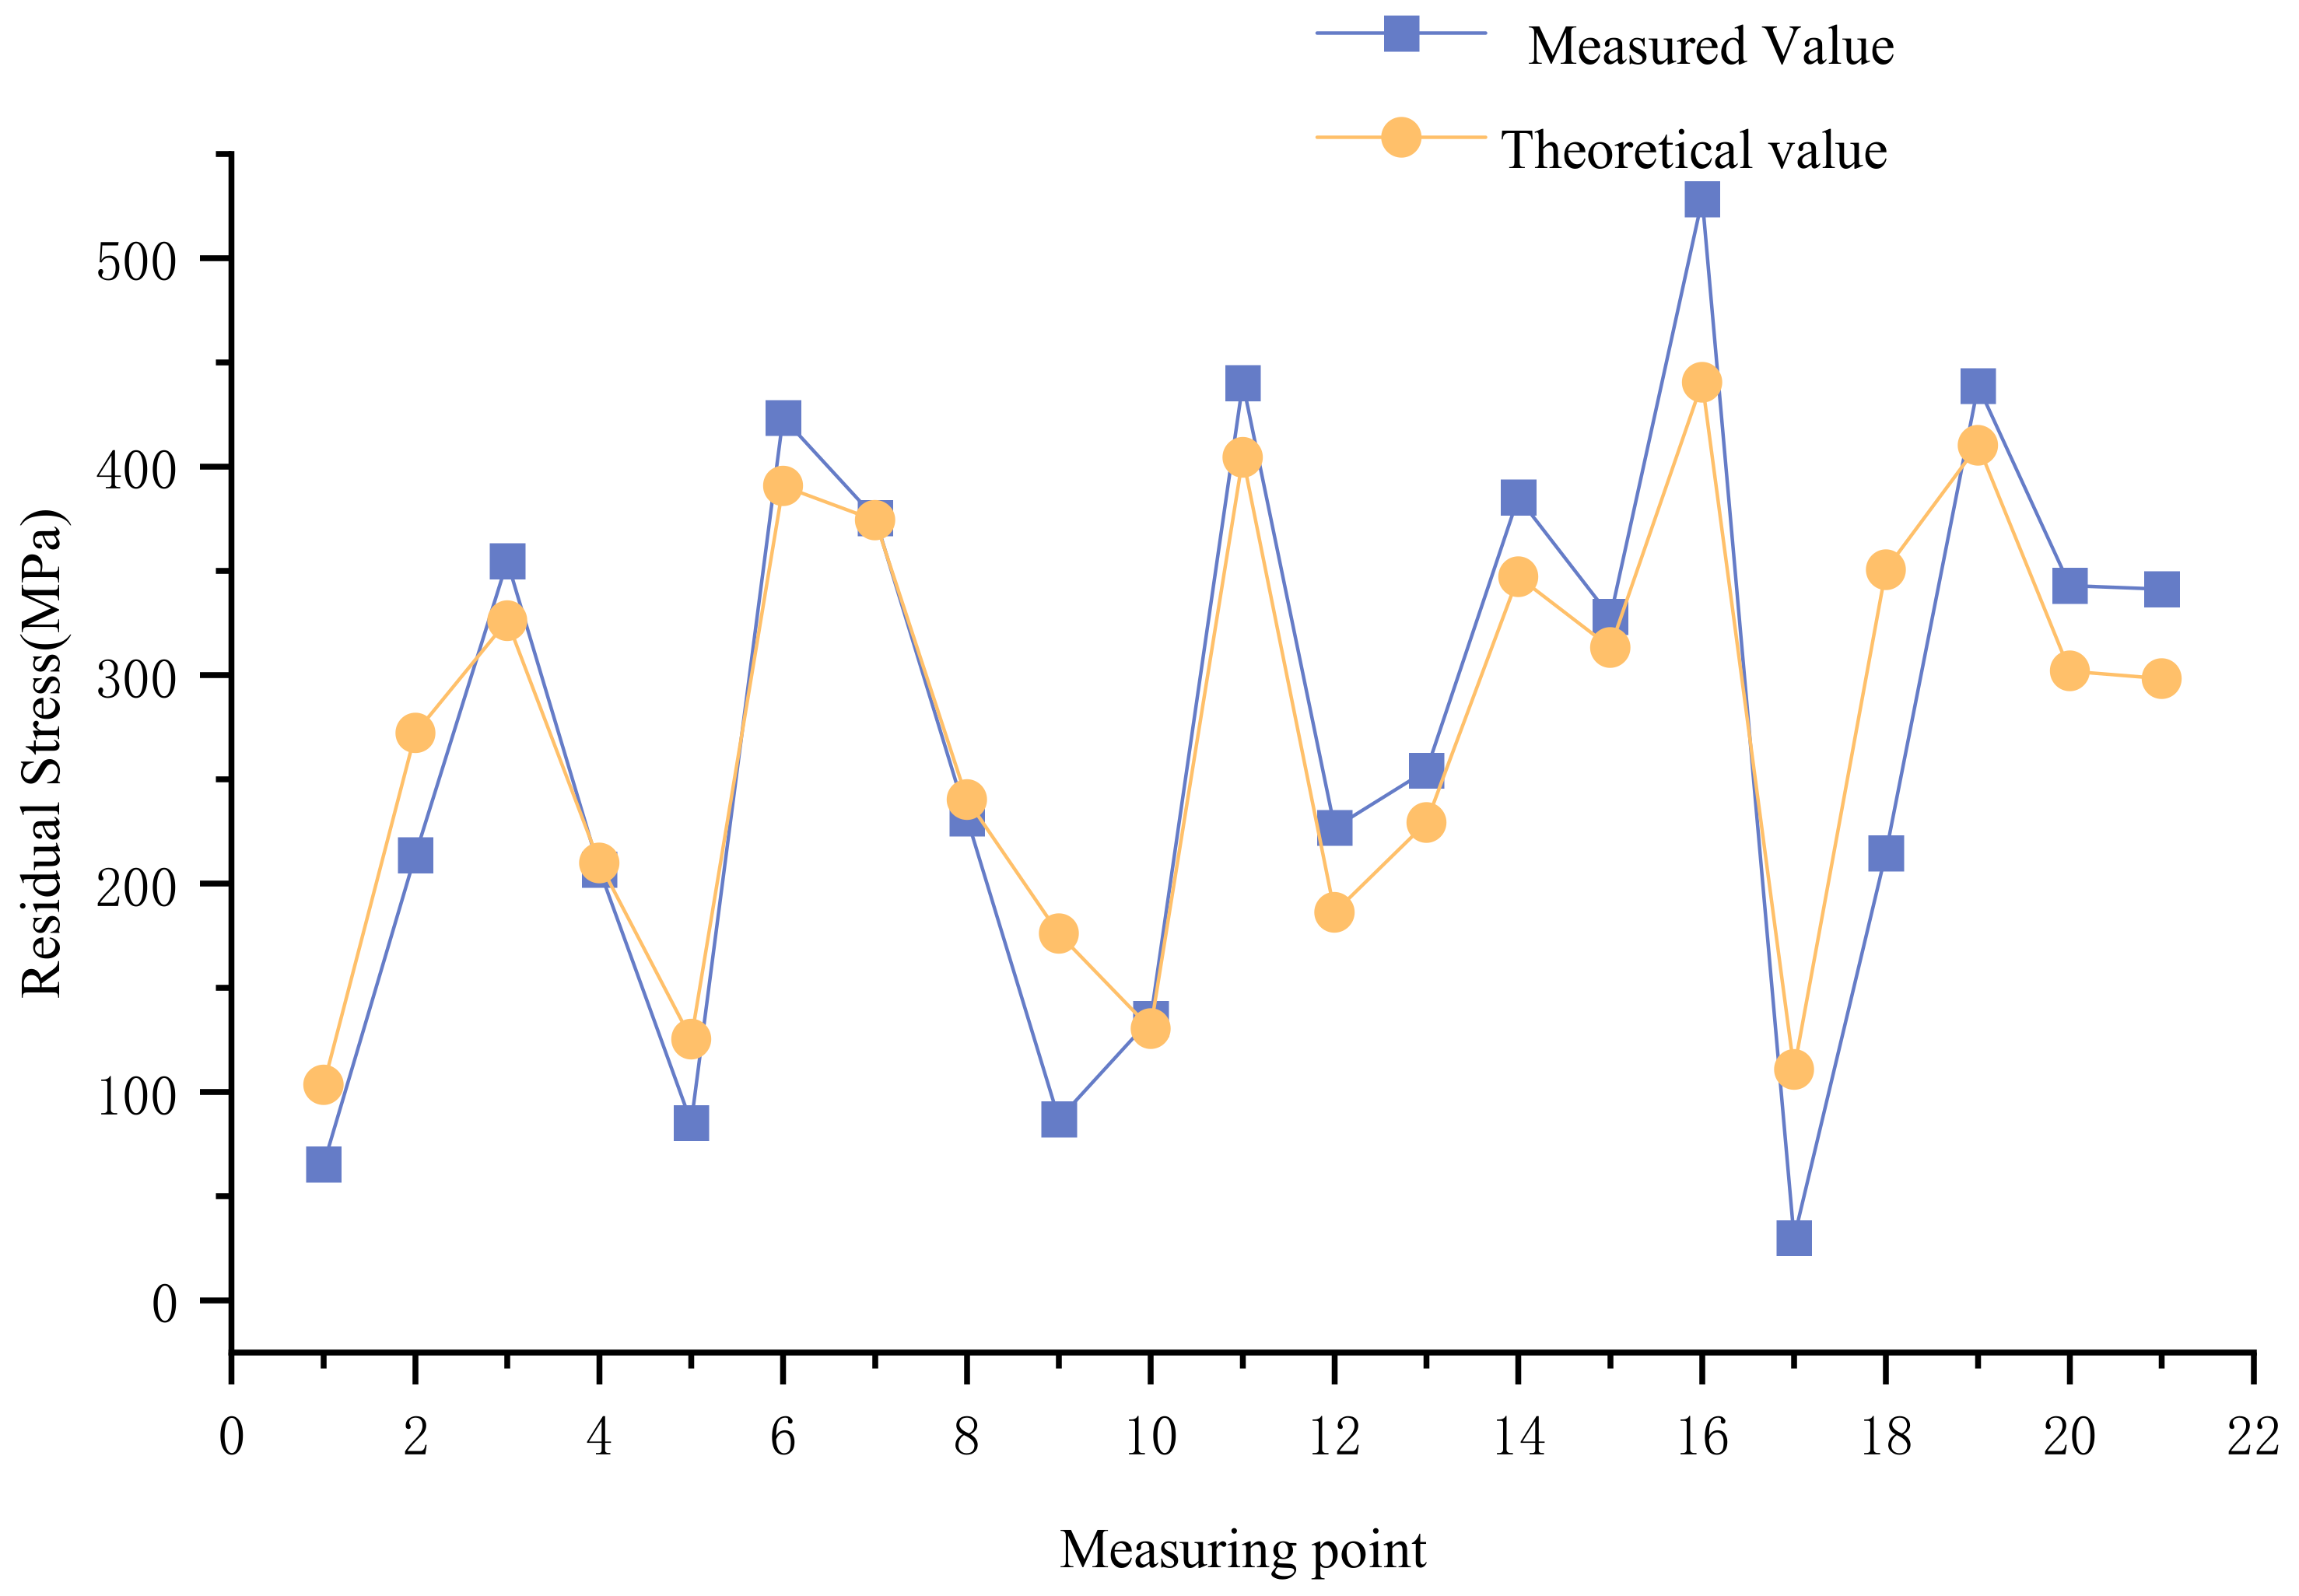
Through comparative analysis of the monitoring values and the theoretical values at the key positions of the herringbone column, the variation trend of the residual stress values at all the measuring points is consistent, and the measured values are close to the theoretical values, with a minimum relative error of 0.26%. This proves that the residual stress of the herringbone column is within the safe construction range and ensures safe construction.
(2)
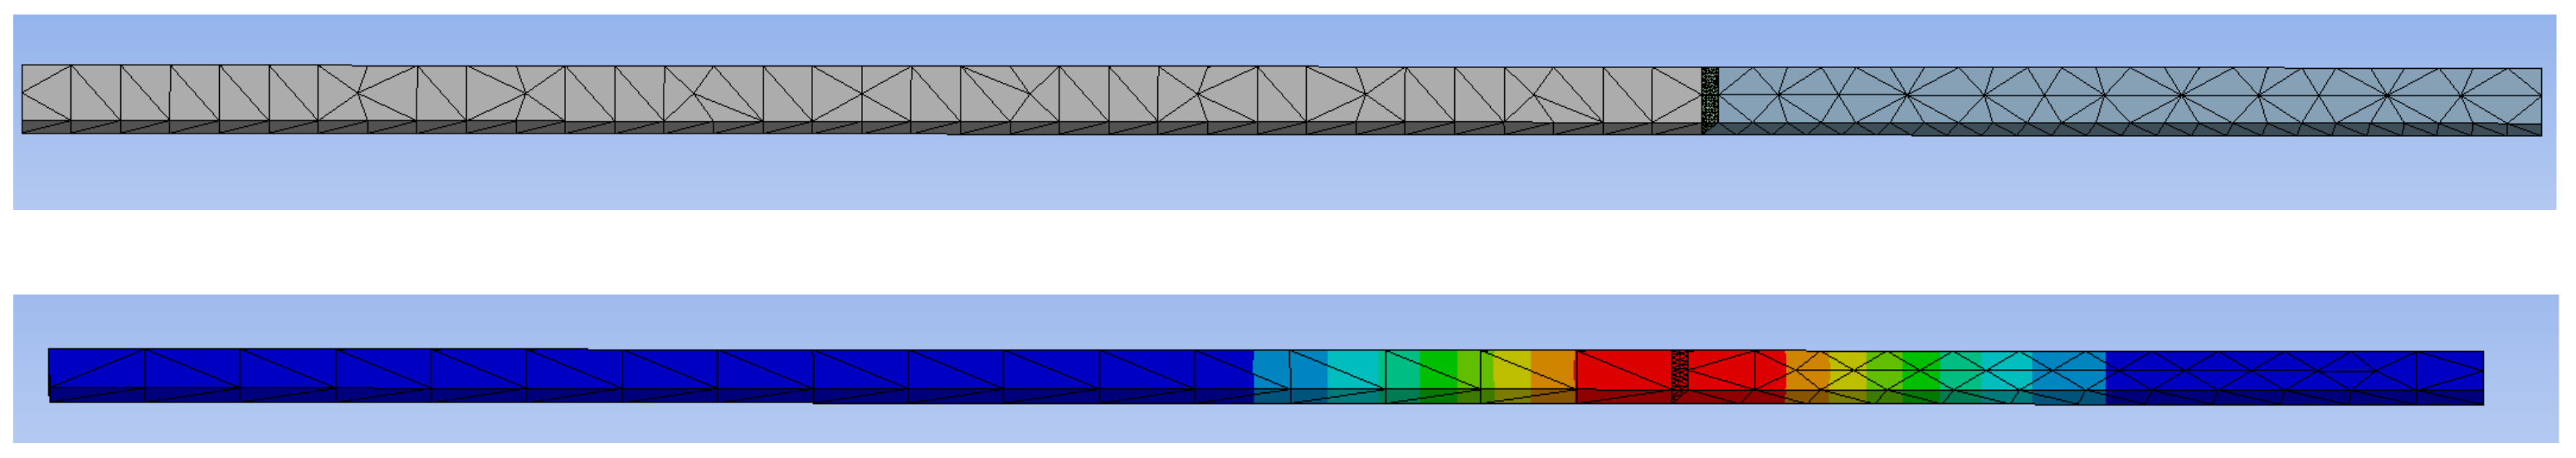
The experimental results and numerical simulation show that the residual stress is mainly concentrated near the weld, and its magnitude is mainly affected by the constraint degree and temperature field of the surrounding components, but the distribution along the central axis is not completely symmetrical.
(3)
In the numerical simulation method, the weld seam is assumed to be uniformly heated, whereas in the actual measurement, the welding sequence involves first welding a connection point in the center, followed by welding the connection points on both sides, and finally welding from the center to both ends. It can be observed that the residual stress at the center of the weld is higher in the measured values compared to the simulated values, which may be due to the construction sequence.
(4)
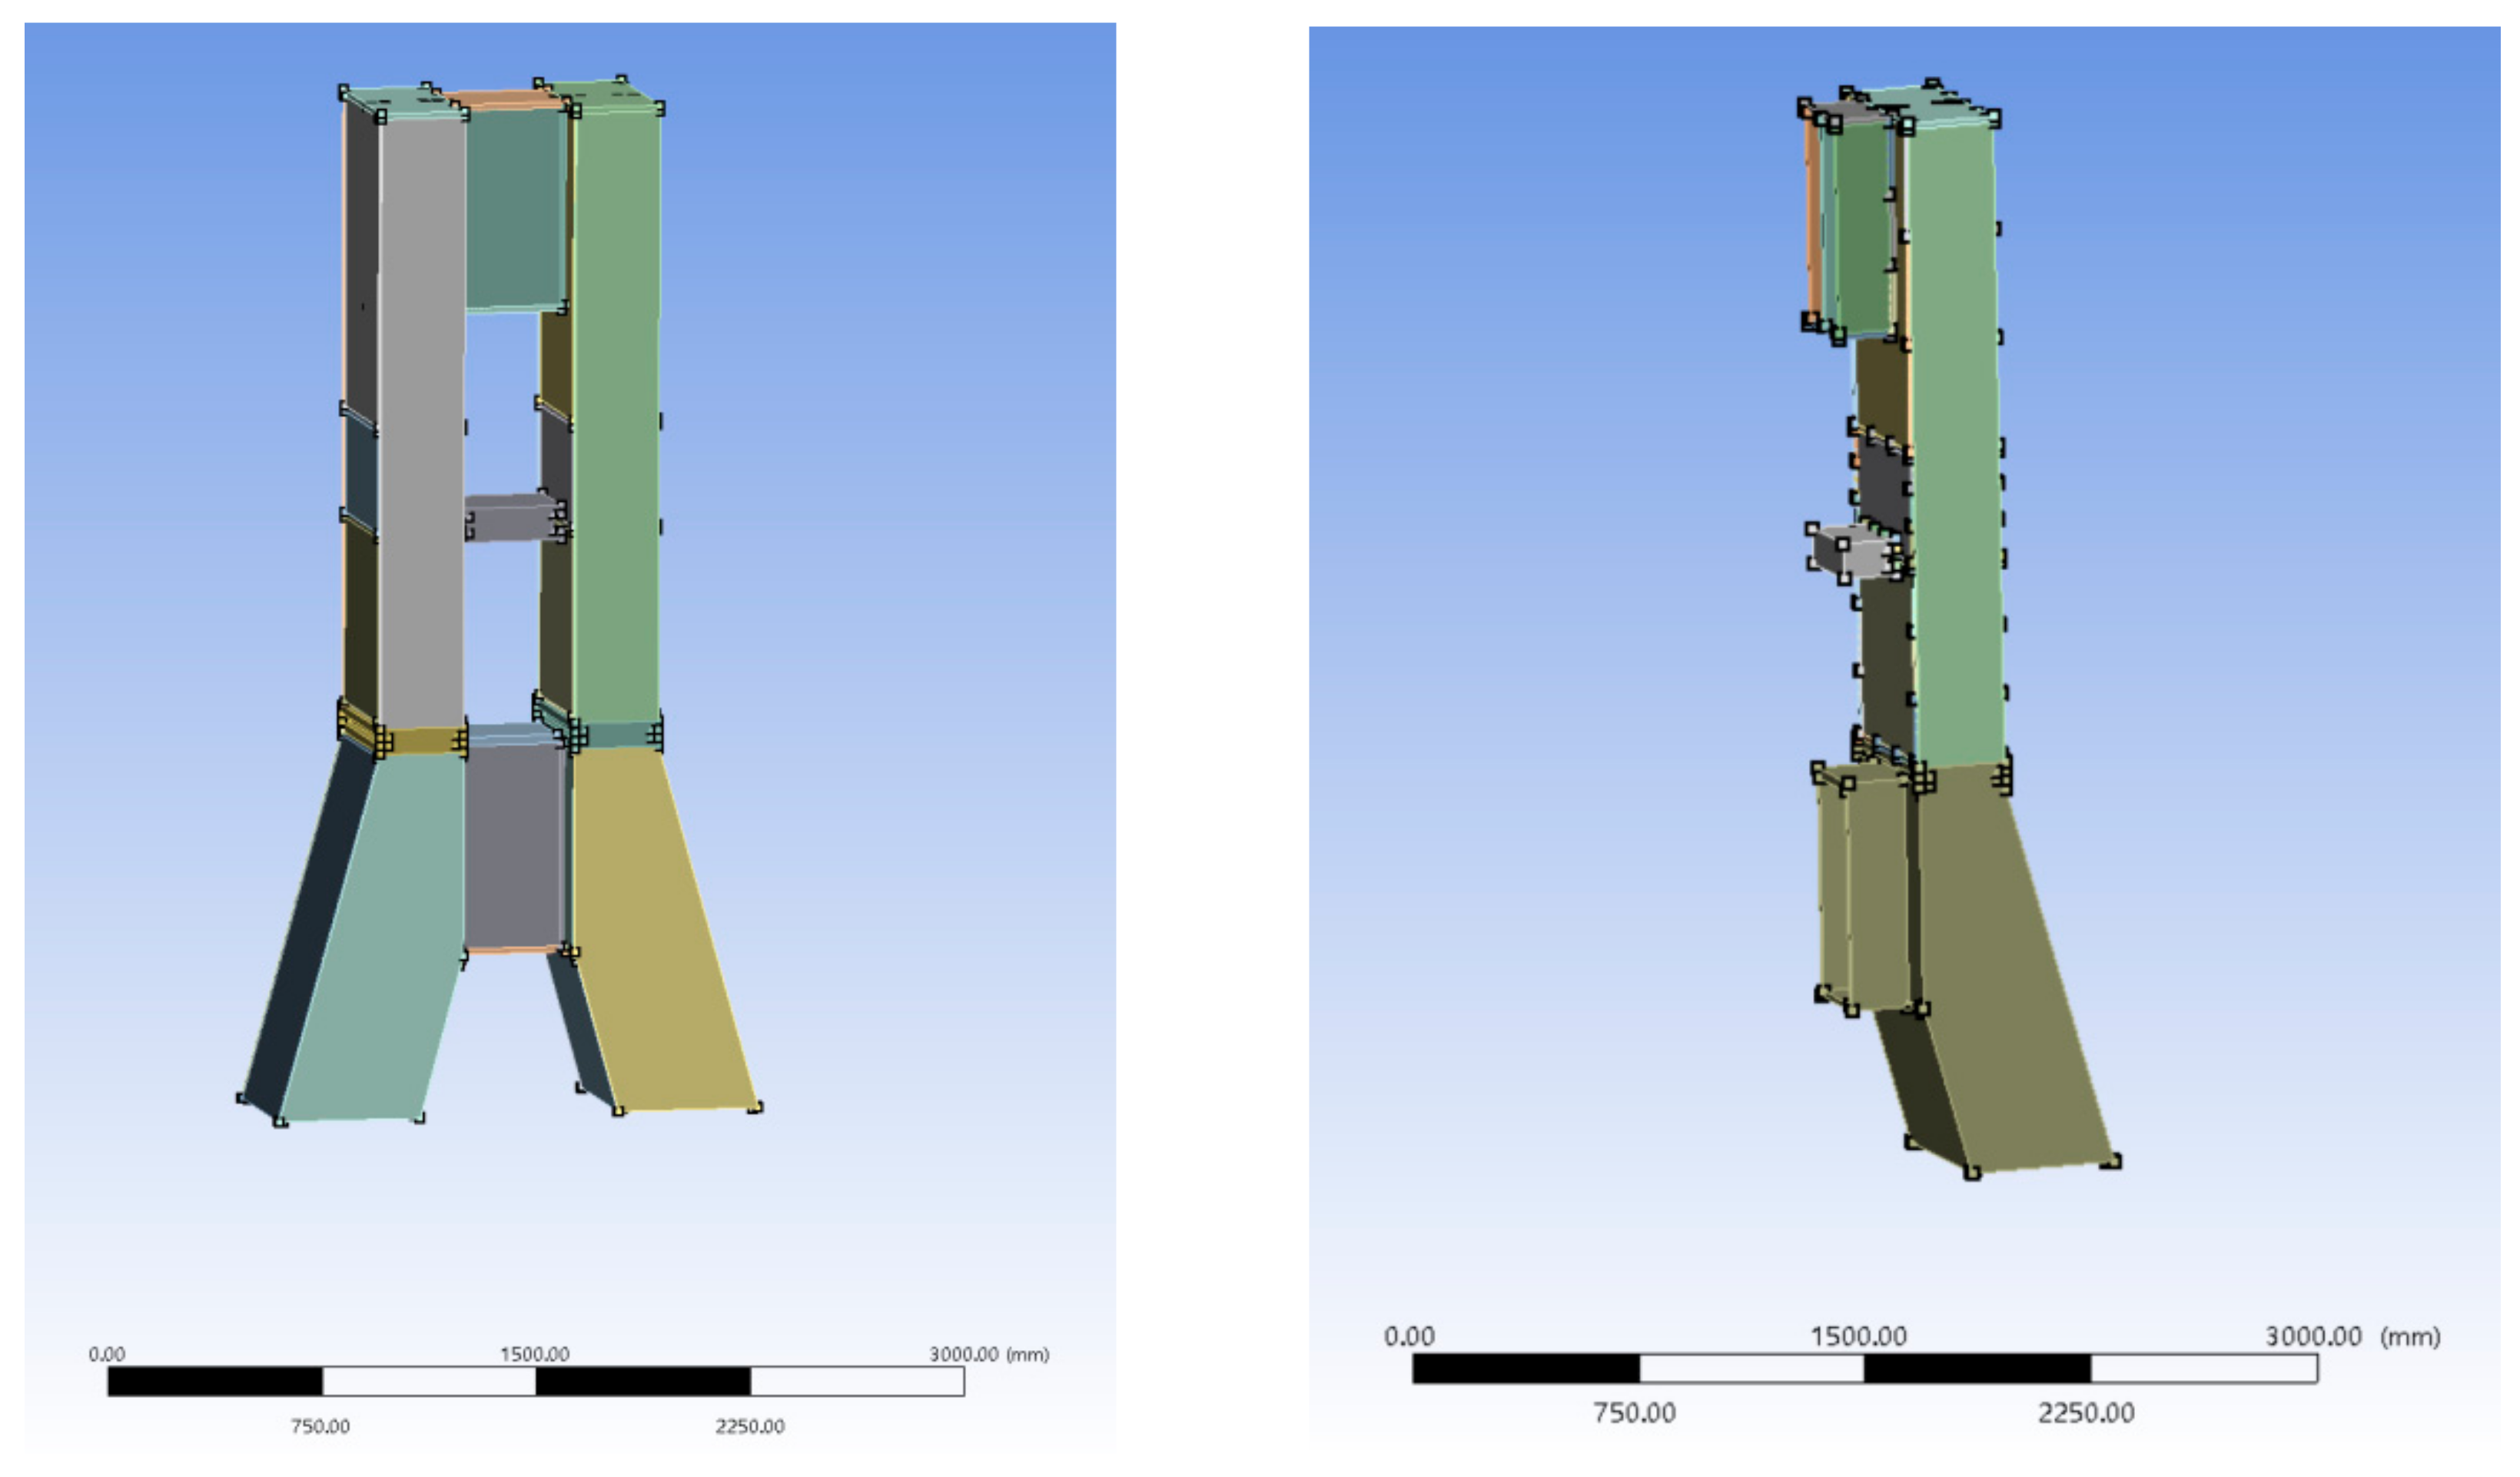
The central point of the top of the herringbone column is the intersection point of the herringbone column and the upper truss, which bears more complex upper loads and is also the largest point of the residual stress of the whole column, so it is more dangerous. This location should be monitored to ensure the safety and quality of construction.
(5)
Considering that construction took place in winter, the room temperature is low, and the temperature at the weld drops faster. At the same time, during manual welding, it is difficult to maintain absolute uniform speed, resulting in the actual residual stress being slightly higher than the ideal state of numerical simulation, but it is still within the safe range.
(6)
Some measurement points (such as points 17 and 23) showed a deviation of more than 50%, which may be due to operational errors. It is also possible that the measurement procedure was not properly set up or that repeated tests were not conducted to eliminate errors. In the future, different testing methods will be used to further detect and analyze the residual stresses in the welds of the lattice columns.
In the numerical simulation, in order to reduce computational complexity and improve solution efficiency, simplifications were made to the model in terms of structure, mesh division, boundary conditions, material properties, environment, and other aspects. This may lead to discrepancies between the simulation results and the actual situation. With the improvement of computer performance, more refined 3D finite element models can be developed in the future, considering additional details, such as the microstructure of the weld, phase change effects during heat conduction, and so on, in order to obtain simulation results that are closer to reality. Furthermore, future research can focus on long-term performance tracking of lattice columns and other key components, including, in particular, the impact of residual stresses on the structural fatigue life, providing a more comprehensive design reference for similar projects in the future.

Author Contributions

Conceptualization, J.R.; methodology, J.R. and X.Z.; software, Y.Y.; validation, J.R., Y.Y. and Z.L.; formal analysis, X.Z., Z.L. and Z.Y.; investigation, Z.Y., Y.D., J.M. (Jihao Ma) and C.L.; resources, X.Z.; data curation, Z.Y. and C.L.; writing—original draft preparation, J.R. and X.Z.; writing—review and editing, J.R., Y.Y. and Z.L.; funding acquisition, X.Z. and J.M. (Jianjun Ma). All authors have read and agreed to the published version of the manuscript.

Funding

This work was supported by the Key R&D and Promotion Special Project in Henan Province—Science and Technology Research (joint fund) Project (Grant No. 232103810082).

Data Availability Statement

The original contributions presented in the study are included in the article, further inquiries can be directed to the corresponding author.

Conflicts of Interest

Authors Jianbo Ren, Xiangwei Zhang, Zhihang Liu and Jihao Ma are employed by the Installation Engineering Co., Ltd. Author Yuanyuan Dong is employed by the Ningbo Huakang Luting Construction Co., Ltd. The remaining authors declare that the research was conducted in the absence of any commercial or financial relationships that could be construed as a potential conflict of interest.

References

  1. Wang, W.X.; Wang, D.P.; Qi, F.J. Welded Structures; Chemical Industry Press: Beijing, China, 2012. [Google Scholar]
  2. Wang, J.H.; Lu, H. Some Discussions on Principle of Causing and Relieving Welding Residual Stress, 3rd ed.; Hanjie Xuebao: Harbin, China, 2002; pp. 75–79+1. (In Chinese) [Google Scholar]
  3. Fang, H.Y. Theory of Welded Structures; China Machine Press: Beijing, China, 2008. [Google Scholar]
  4. Yan, R.; Ji, H.; Wang, S. Influence of Welding Residual Stress on Axial-Mechanical Properties of Hollow Spherical Joints. SSRN 2024. [Google Scholar] [CrossRef]
  5. Yang, L.; Chuai, R.; Cai, G. Ultrasonic Non-Destructive Testing and Evaluation of Stainless-Steel Resistance Spot Welding Based on Spiral C-Scan Technique. Sensors 2024, 24, 4771. [Google Scholar] [CrossRef] [PubMed]
  6. Liu, Z.; Wasil, R.; Shen, Y. Magneto Acoustic Emission Technique: A Review of Methodology, Applications, and Future Prospects in Non-destructive Testing. NDT E Int. 2024, 103171. [Google Scholar] [CrossRef]
  7. Mishra, P.; Rani, A.; Sekhar, R. Comparative Analysis of Infrared Thermographic Techniques for Non-destructive Testing and Evaluation of Materials. In Conference and Exhibition on Non Destructive Evaluation; Springer Nature: Singapore, 2021. [Google Scholar]
  8. Mathiszik, C.; Koal, J.; Zschetzsche, J. Non-destructive characterization of resistance projection welded joints by ultrasonic and passive magnetic flux density testing. Weld. World 2024, 68, 2671–2682. [Google Scholar] [CrossRef]
  9. Wei, H.; Lina, L. Application of non-destructive testing technology in construction steel structure industry. J. Physics Conf. Ser. 2021, 2011, 012039. [Google Scholar] [CrossRef]
  10. Ammar, M.M.A.; Shirinzadeh, B.; Elgamal, H.; Nasr, M.N.A. On the role of damage evolution in finite element modeling of the cutting process and sensing residual stresses. Sensors 2022, 22, 8547. [Google Scholar] [CrossRef]
  11. Wang, J.; Xu, A.; Di, J.; Qin, F.; Men, P. Experimental and Numerical Study of Membrane Residual Stress in Q690 High-Strength Steel Welded Box Section Compressed Member. Materials 2024, 17, 2296. [Google Scholar] [CrossRef]
  12. Li, Y.; Xue, J.; Qi, L.; Wang, X.; Yuan, Z.; Xue, G. Residual stress model of welded steel L-shaped and T-shaped sections. J. Constr. Steel Res. 2024, 218, 108724. [Google Scholar] [CrossRef]
  13. Yang, B.; Nie, S.D.; Kang, S.B.; Xiong, G.; Hu, Y.; Bai, J.; Zhang, W.F.; Dai, G.X. Residual stress measurement on welded Q345GJ steel H-sections by sectioning method and method improvement. Adv. Steel Constr. 2017, 13, 78–95. [Google Scholar]
  14. Gu, Y.; Chen, J.; Gu, S. Eliminating eccentricity error in measuring residual stresses via hole-drilling method using strain gauge rosette with five measuring grids: For thin plates using through-holes. J. Strain Anal. Eng. Des. 2024, 59, 475–490. [Google Scholar] [CrossRef]
  15. Zhang, W.; Wu, Z.; Chen, J. Experimental research on surface residual stress of high strength welded circular steel tube based on hole-drilling strain-gage method. J. Build. Struct. 2022, 43, 332. [Google Scholar]
  16. Halabuk, D.; Návrat, T. Determination of residual stresses in cylindrical components by the hole-drilling method. Exp. Mech. 2022, 62, 87–99. [Google Scholar] [CrossRef]
  17. Olson, M.D.; DeWald, A.T.; Watanabe, B.T. Near Edge Residual Stress Measurement Using Incremental Hole Drilling. Exp. Mech. 2024, 64, 501–517. [Google Scholar] [CrossRef]
  18. Li, C.; Ji, B.; Yao, Y. Stress biaxiality-based residual stress assessment in welded T-joints using the blind-hole method. J. Constr. Steel Res. 2024, 216, 108610. [Google Scholar] [CrossRef]
  19. Peng, Y.; Zhao, J.; Chen, L. Residual stress measurement combining blind-hole drilling and digital image correlation approach. J. Constr. Steel Res. 2021, 176, 106346. [Google Scholar] [CrossRef]
  20. Vasylevskyi, K.; Tsukrov, I.; Drach, B. Identification of process-induced residual stresses in 3D woven carbon/epoxy composites by combination of FEA and blind hole drilling. Compos. Part A Appl. Sci. Manuf. 2020, 130, 105734. [Google Scholar] [CrossRef]
  21. Beghini, M.; Bertini, L.; Santus, C. A procedure for evaluating high residual stresses using the blind hole drilling method, including the effect of plasticity. J. Strain Anal. Eng. Des. 2010, 45, 301–318. [Google Scholar] [CrossRef]
  22. Zuo, S.; Wang, D.; Du, B. Plasticity Effects in the Hole-drilling Residual Stress Measurements in Welded Structure. J. Mech. Eng. 2022, 58, 206–214. (In Chinese) [Google Scholar]
  23. Blödorn, R.; Viotti, M.R.; Schroeter, R.B. Analysis of blind-holes applied in the hole-drilling method for residual stress measurements. Exp. Mech. 2015, 55, 1745–1756. [Google Scholar] [CrossRef]
  24. Pei, J.; Wang, S.; Qin, S. Using Iterative Correction to Improve the Accuracy of the Blind-Hole Welding Residual Stress Test. Sensors 2024, 24, 6243. [Google Scholar] [CrossRef]
  25. Blödorn, R.; Bonomo, L.A.; Viotti, M.R. Calibration coefficients determination through FEM simulations for the hole-drilling method considering the real hole geometry. Exp. Tech. 2017, 41, 37–44. [Google Scholar] [CrossRef]
  26. Cai, Z.P. Study on Numerical Simulation of Welding Distortions in Huge Fabrications and Its Application. Ph.D. Thesis, Tsinghua University, Beijing, China, 2001. [Google Scholar]
  27. Feng, R.; Liu, D.; Zhang, C. Effect of Solid-State Phase Transformation and Transverse Restraint on Residual Stress Distribution in Laser–Arc Hybrid Welding Joint of Q345 Steel. Materials 2024, 17, 2632. [Google Scholar] [CrossRef]
  28. Horváth, A.; Kollár, D. Dimensional Analysis and Validity of Uniaxial Residual Stress Distribution for Welded Box Sections. J. Manuf. Mater. Process. 2024, 9, 5. [Google Scholar] [CrossRef]
  29. Yan, Z.; Ju, J. Numerical Study on Welding Residual Stress and Microstructure in Gas Metal Arc Welding Square Tube–Plate Y-Shaped Joints. Buildings 2024, 14, 3686. [Google Scholar] [CrossRef]
  30. Han, D.; Tao, Z.; Abdul Ghafar, W.; Hasan, M.M.; Xiao, W.; Wang, T.; Zhou, K.; Dai, H. Experimental Study on the Seismic Performance of L-Shaped CFST Columns in Different Combinations. Buildings 2023, 13, 2320. [Google Scholar] [CrossRef]
  31. Abdul Ghafar, W.; Tao, Z.; Tao, Y.; He, Y.; Wu, L.; Zhang, Z. Experimental and numerical study of an innovative infill web-strips steel plate shear wall with rigid beam-to-column connections. Buildings 2022, 12, 1560. [Google Scholar] [CrossRef]
  32. Tao, Z.; Hasan, M.M.; Han, D.; Qin, Q.; Abdul Ghafar, W. Study of the Axial Compressive Behaviour of Cross-Shaped CFST and ST Columns with Inner Changes. Buildings 2023, 13, 423. [Google Scholar] [CrossRef]
  33. GB50661-2011; Code for Welding of Steel Structures. Ministry of Housing and Urban-Rural Development of the People’s Republic of China, General Administration of Quality Supervision, Inspection and Quarantine of the People’s Republic of China: Beijing, China, 2011.
  34. Huang, Z.; Li, J.; Wang, L. Welding residual stress analysis of the X80 pipeline: Simulation and validation. Mech. Sci. 2024, 15, 305–314. [Google Scholar] [CrossRef]
  35. Zheng, X.; Li, D.; Liao, W. Residual Stress and Fatigue Strength Analysis of Stiffener Welds of Steel-Plate Composite Girder Bridge Considering Welding Sequence. Buildings 2024, 14, 1801. [Google Scholar] [CrossRef]
  36. GB/T 20801.2-2020; Code for Pressure Piping—Industrial Pipelines—Part 2: Materials. Standardization Administration of China (SAC): Beijing, China, 2020.
  37. GB 985-88; Basic Forms and Dimensions of Welded Joint Grooves for Oxyacetylene Welding, Manual Arc Welding, and Gas Shielded Welding. Standardization Administration of China (SAC): Beijing, China, 1988.
Figure 1. Procedure flowchart for the blind hole method.
Buildings 15 00398 g001
Figure 2. Main structure model of the steel truss in the exhibition hall.
Buildings 15 00398 g002
Figure 3. Herringbone elevation and typical node model.
Buildings 15 00398 g003
Figure 4. Herringbone column weld diagram.
Buildings 15 00398 g004
Figure 5. Schematic diagram of the drilling layout.
Buildings 15 00398 g005
Figure 6. Photo of strain gauge attachment on measurement point.
Buildings 15 00398 g006
Figure 7. Measuring point layout diagram (units: mm).
Buildings 15 00398 g007
Figure 8. Residual stress was measured using the blind hole method.
Buildings 15 00398 g008
Figure 9. Groove form diagram.
Buildings 15 00398 g009
Figure 10. Finite element mesh.
Buildings 15 00398 g010
Figure 11. Convection.
Buildings 15 00398 g011
Figure 12. Temperature change at weld.
Buildings 15 00398 g012
Figure 13. Residual stress variation with distance.
Buildings 15 00398 g013
Figure 14. Heat conduction temperature field.
Buildings 15 00398 g014
Figure 15. Herringbone column model.
Buildings 15 00398 g015
Figure 16. The measured residual stress of the upper part.
Buildings 15 00398 g016
Figure 17. Comparison of measured residual stress and simulation results at measuring points 1–21.
Buildings 15 00398 g017
Figure 18. Measured value of welding residual stress at joint.
Buildings 15 00398 g018
Figure 19. Comparison between the measured residual stress and the simulation results at No. 22–30 measuring points.
Buildings 15 00398 g019
Table 1. Measured residual stress on the right column leg.
Station Number0° Stress
(MPa)
45° Stress
(MPa)
90° Stress
(MPa)
Maximum Principal Stress (MPa)Minimum Principal Stress (MPa)Equivalent Residual Stress (MPa)
123.345.2−2.847.6−27.165.4
2199.155.541.4222.218.2213.7
3333104.5−18.6340.8−26.3354.6
444.9−103.8−166.653.2−175206.8
5−69.3−81.7−25.2−6.4−88.285.2
6370.5246.3−48.3387.2−64.9423.4
7345.5166.4−51.3346.4−52.2375.3
8−217.4−94.9−126.6−82.5−261.4231.4
998.873.160.799.959.687
10−29.966109.8114.5−34.6135.1
11114.1413342.9445.611.4440.1
12−19.3−62.2113.8175.3−80.8226.8
13−103.2−146.8−277.9−92.9−288.2254.2
14439309.2159.8439.4159.5385.3
15256.4143.6262.4375.3143.6328
16486.2214.5−75.8486.3−76528.4
17−2.692828.4−330
18177130.4−27.1191.1−41.2214.6
19389.235242.5436.3−4.7438.7
20−224.71−98.912.8−336.3342.9
21234.3120.9−130246.9−142.5341.2
Table 2. Residual stress measured at the joints.
Station Number0° Stress
(MPa)
45° Stress
(MPa)
90° Stress
(MPa)
Maximum Principal Stress (MPa)Minimum Principal Stress (MPa)Equivalent Residual Stress (MPa)
22−93.297.1−256109−458.2521.3
231.5−15.91634.5−1745.4
24146.1173.8250.4255.9140.6221.9
25260.5241.9112.6278.994.2245.8
26357.3263.715.3374−1.4374.7
27441.3160.6160.6499.4102.5456.9
28283.7321.662.7358.2−11.9364.3
29252.98.3−84269.3−100.4331.2
30−48−31.3−131.7−17.8−161.9153.7
22−93.297.1−256109−458.2521.3
231.5−15.91634.5−1745.4
24146.1173.8250.4255.9140.6221.9
25260.5241.9112.6278.994.2245.8
26357.3263.715.3374−1.4374.7
27441.3160.6160.6499.4102.5456.9
28283.7321.662.7358.2−11.9364.3
29252.98.3−84269.3−100.4331.2
30−48−31.3−131.7−17.8−161.9153.7
Table 3. The elemental composition of the base and welding materials.
MaterialsCSiMnPSCrNiCu
Q355B0.240.551.60.0350.0350.30.30.4
E50150.150.91.60.0350.0350.20.30.3
Table 4. Properties of Q355B steel.
Temperature (°C)205010020030040050060080010001300
Coefficient of thermal expansion (106/°C)11.511.812.112.713.313.814.414.815.415.415.4
Isotropic thermal conductivity
(W/(m °C))
5653494541373737373737
Density(g/cm3)7.857.847.827.797.767.737.707.677.647.587.49
Specific heat capacity (J/(g·K))0.460.470.480.490.490.490.500.500.500.500.50
Young’s modulus (MPa)210,000208,000205,000202,000198,000194,000190,000185,000180,000100,00070,000
Yield strength (MPa)35534032030028026024022020015080
Poisson’s ratio (-)0.30.30.30.30.30.30.30.30.30.30.3
Table 5. Welding process parameters.
Electric CurrentVoltageWelding RateHeat Input
I (A)U (V)V (mm/min)Q (J/mm)
220~32029~34350~450<1500
Table 6. Comparison of measured values and calculated results for measurement points 1 to 21.
Measuring point1234567
Measured value (MPa)65.4213.7354.6206.885.2423.4375.3
Theoretical value (MPa)103.43272.21326.06209.81125.39390.7374.32
Measuring point891011121314
Measured value (MPa)231.487135.1440.1226.8254.2385.3
Theoretical value (MPa)240.24175.98130.34404.4186.09229.24347.14
Measuring point15161718192021
Measured value (MPa)328528.430214.6438.7342.9341.2
Theoretical value (MPa)313.17440.43110.76350.54410.26301.94298.3
Table 7. Comparison of measured values and calculated results for measurement points 22 to 30.
Measuring Point222324252627282930
Measured value (MPa)521.345.4221.9245.8374.7456.9364.3331.2153.7
Theoretical value (MPa)457.39123.58212.9223.15303.94423.44300.54222.46175.95
Disclaimer/Publisher’s Note: The statements, opinions and data contained in all publications are solely those of the individual author(s) and contributor(s) and not of MDPI and/or the editor(s). MDPI and/or the editor(s) disclaim responsibility for any injury to people or property resulting from any ideas, methods, instructions or products referred to in the content.

