
Multi-Criteria Optimal Operation Strategy for Photovoltaic Systems in Large-Scale Logistics Parks Concerning Climate Impact


Abstract
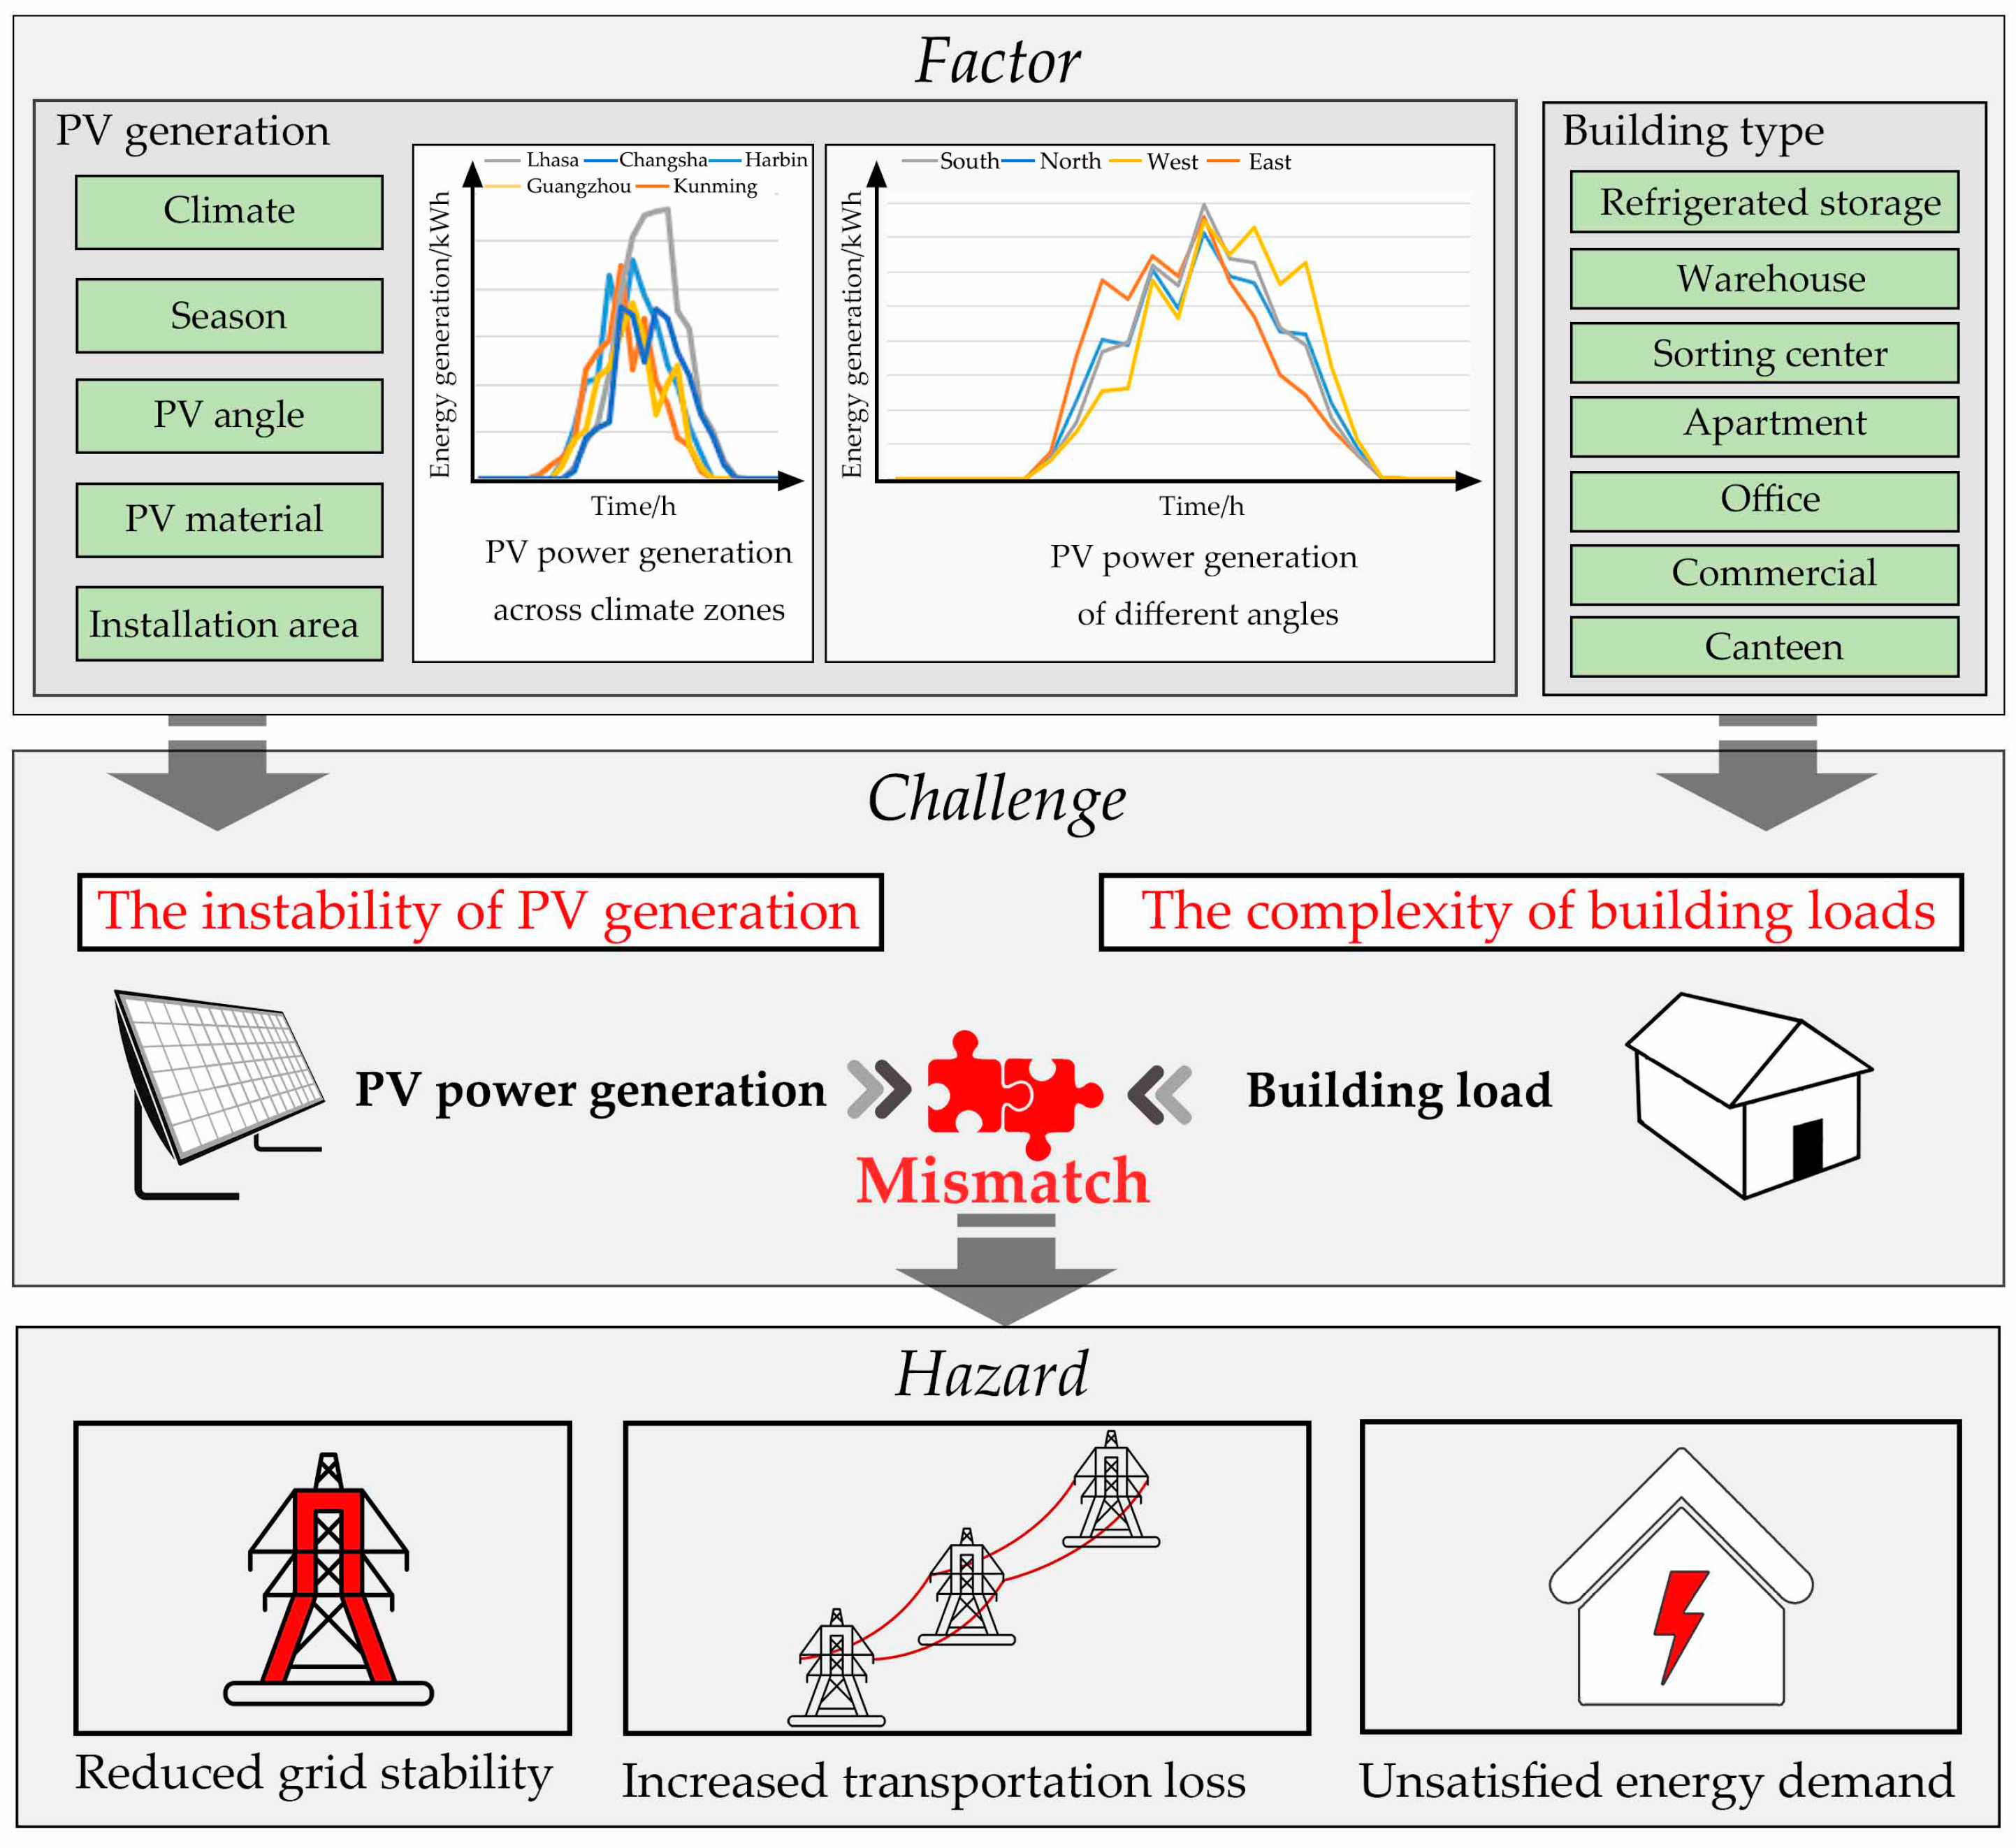
1. Introduction
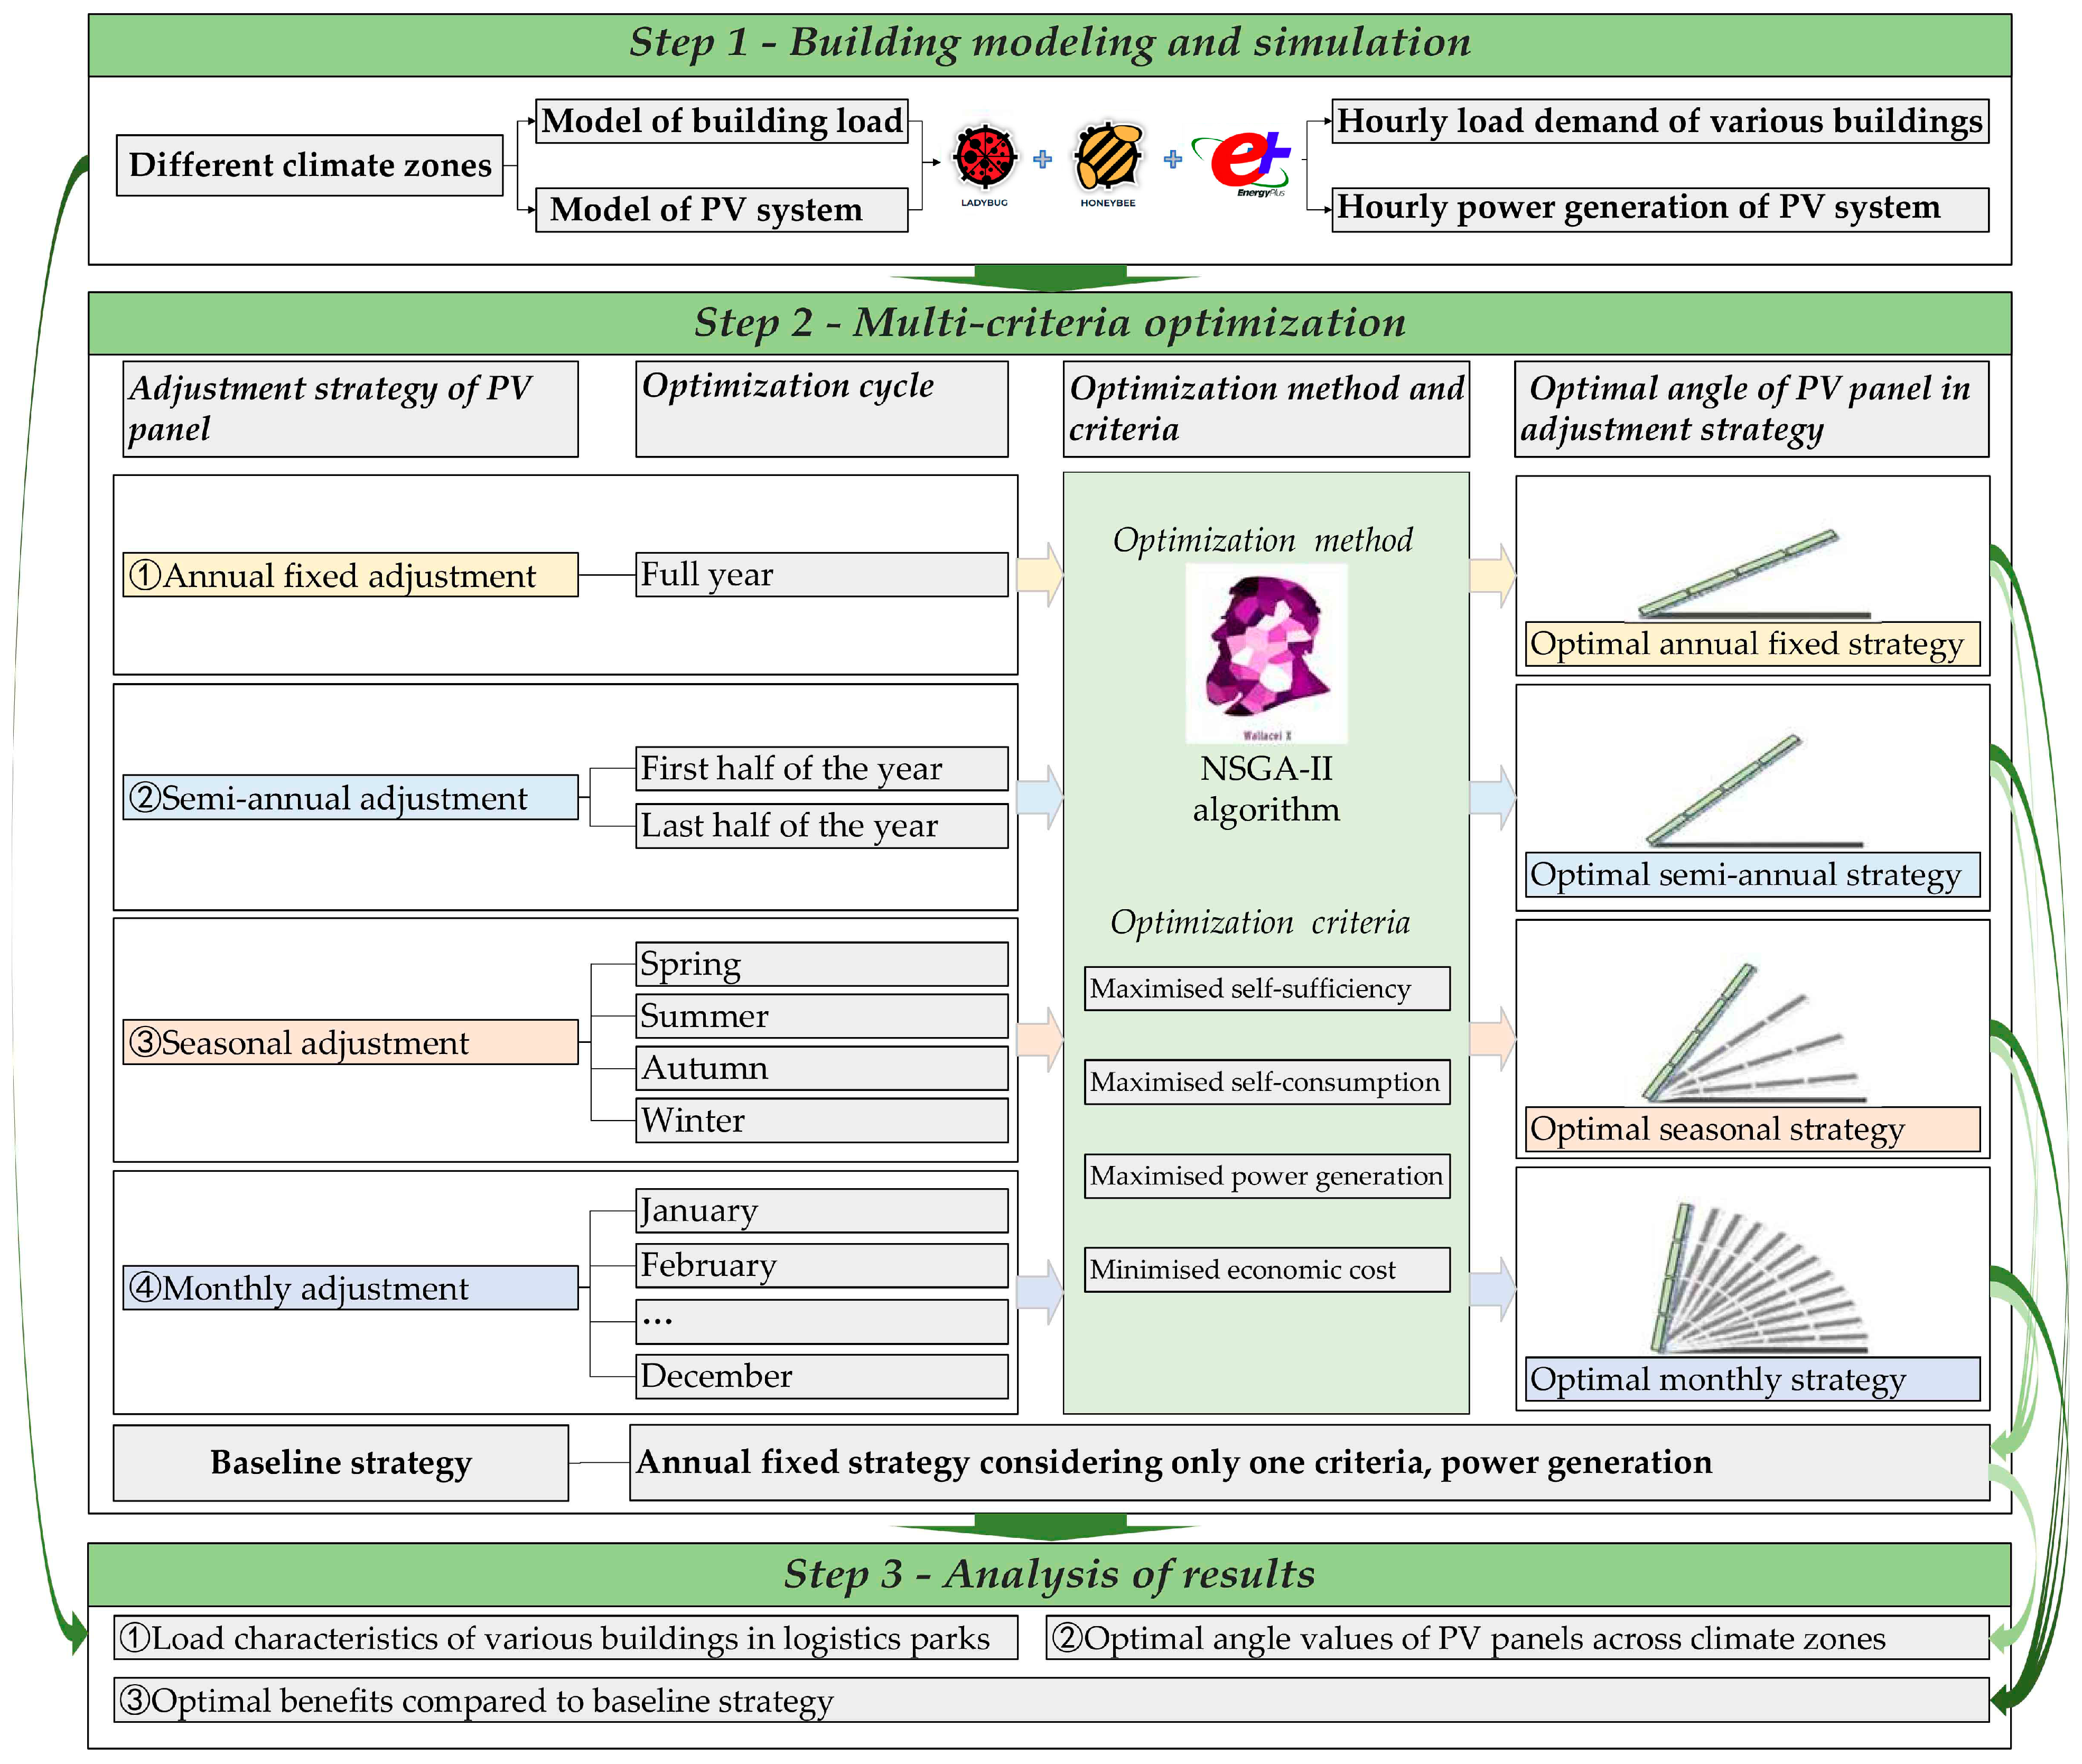
2. Methodology
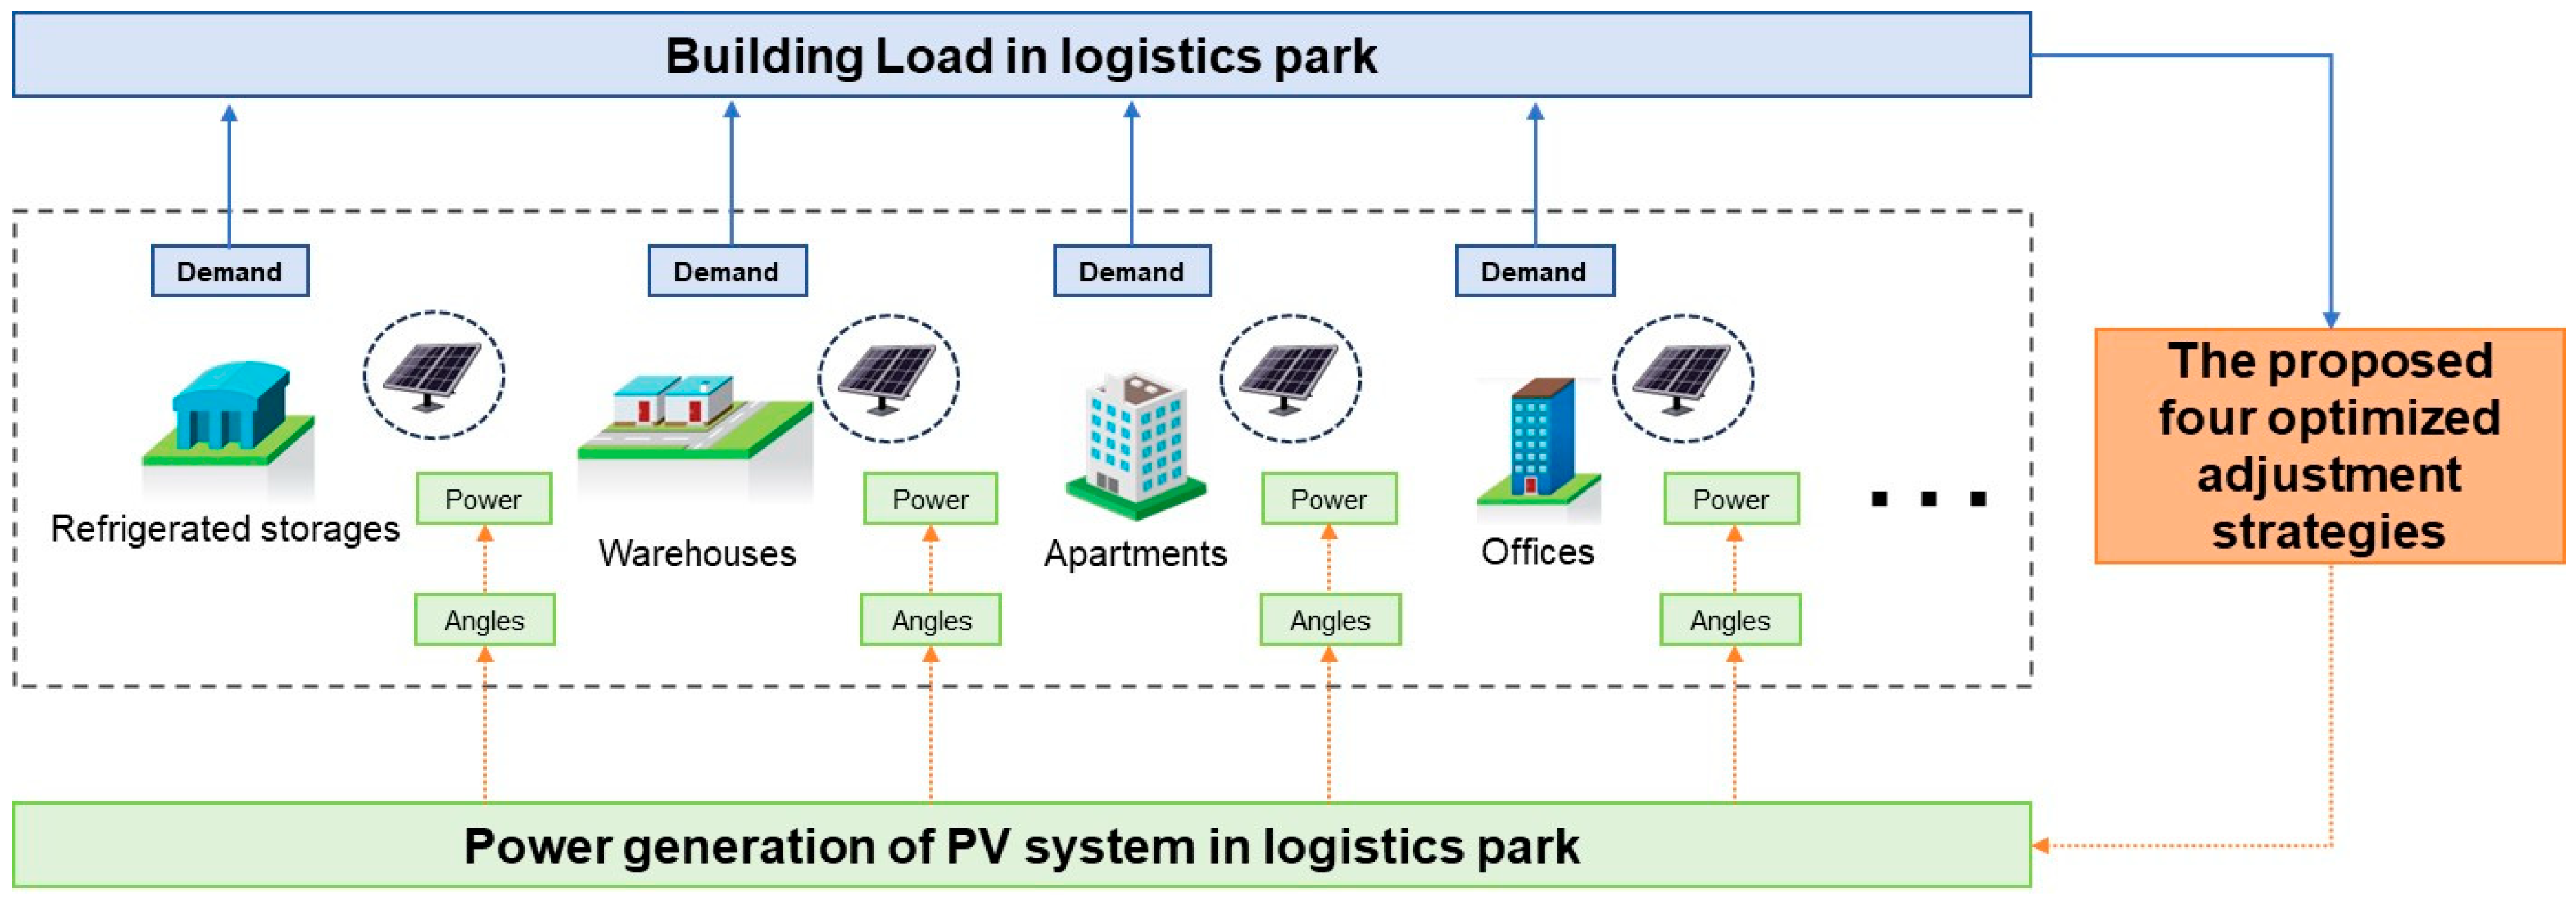
2.1. The Outline of Proposed Optimal Operation Strategies for PV Systems of Large-Scale Logistics Parks
2.2. Building Modeling and Simulation
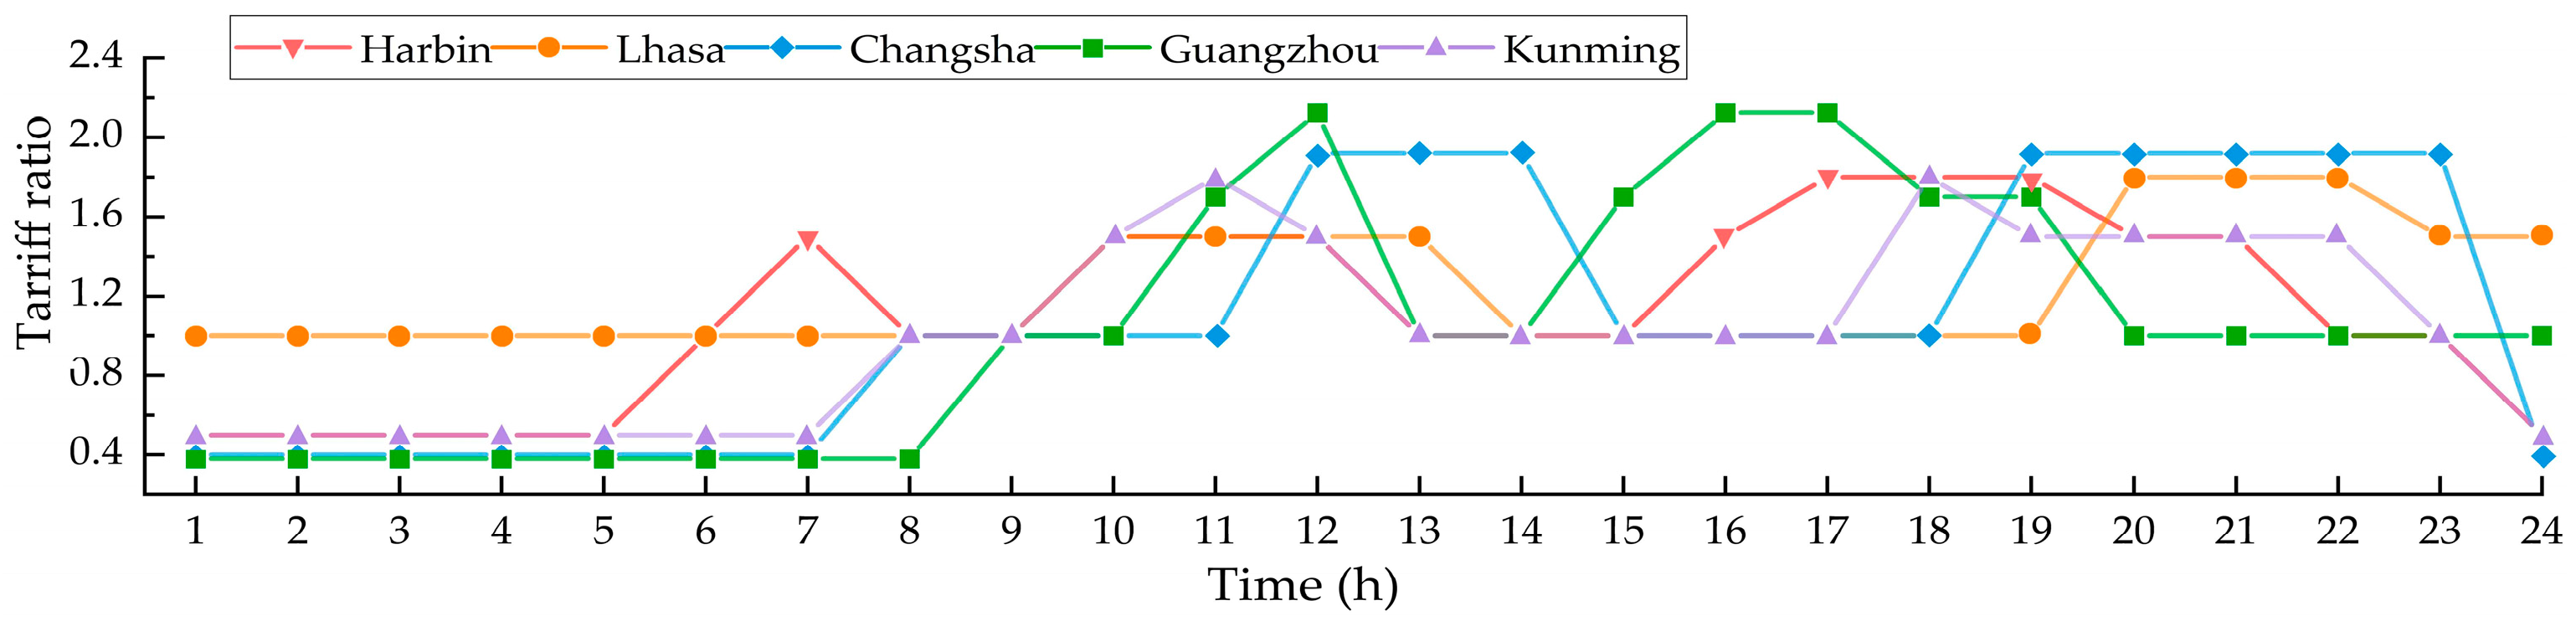
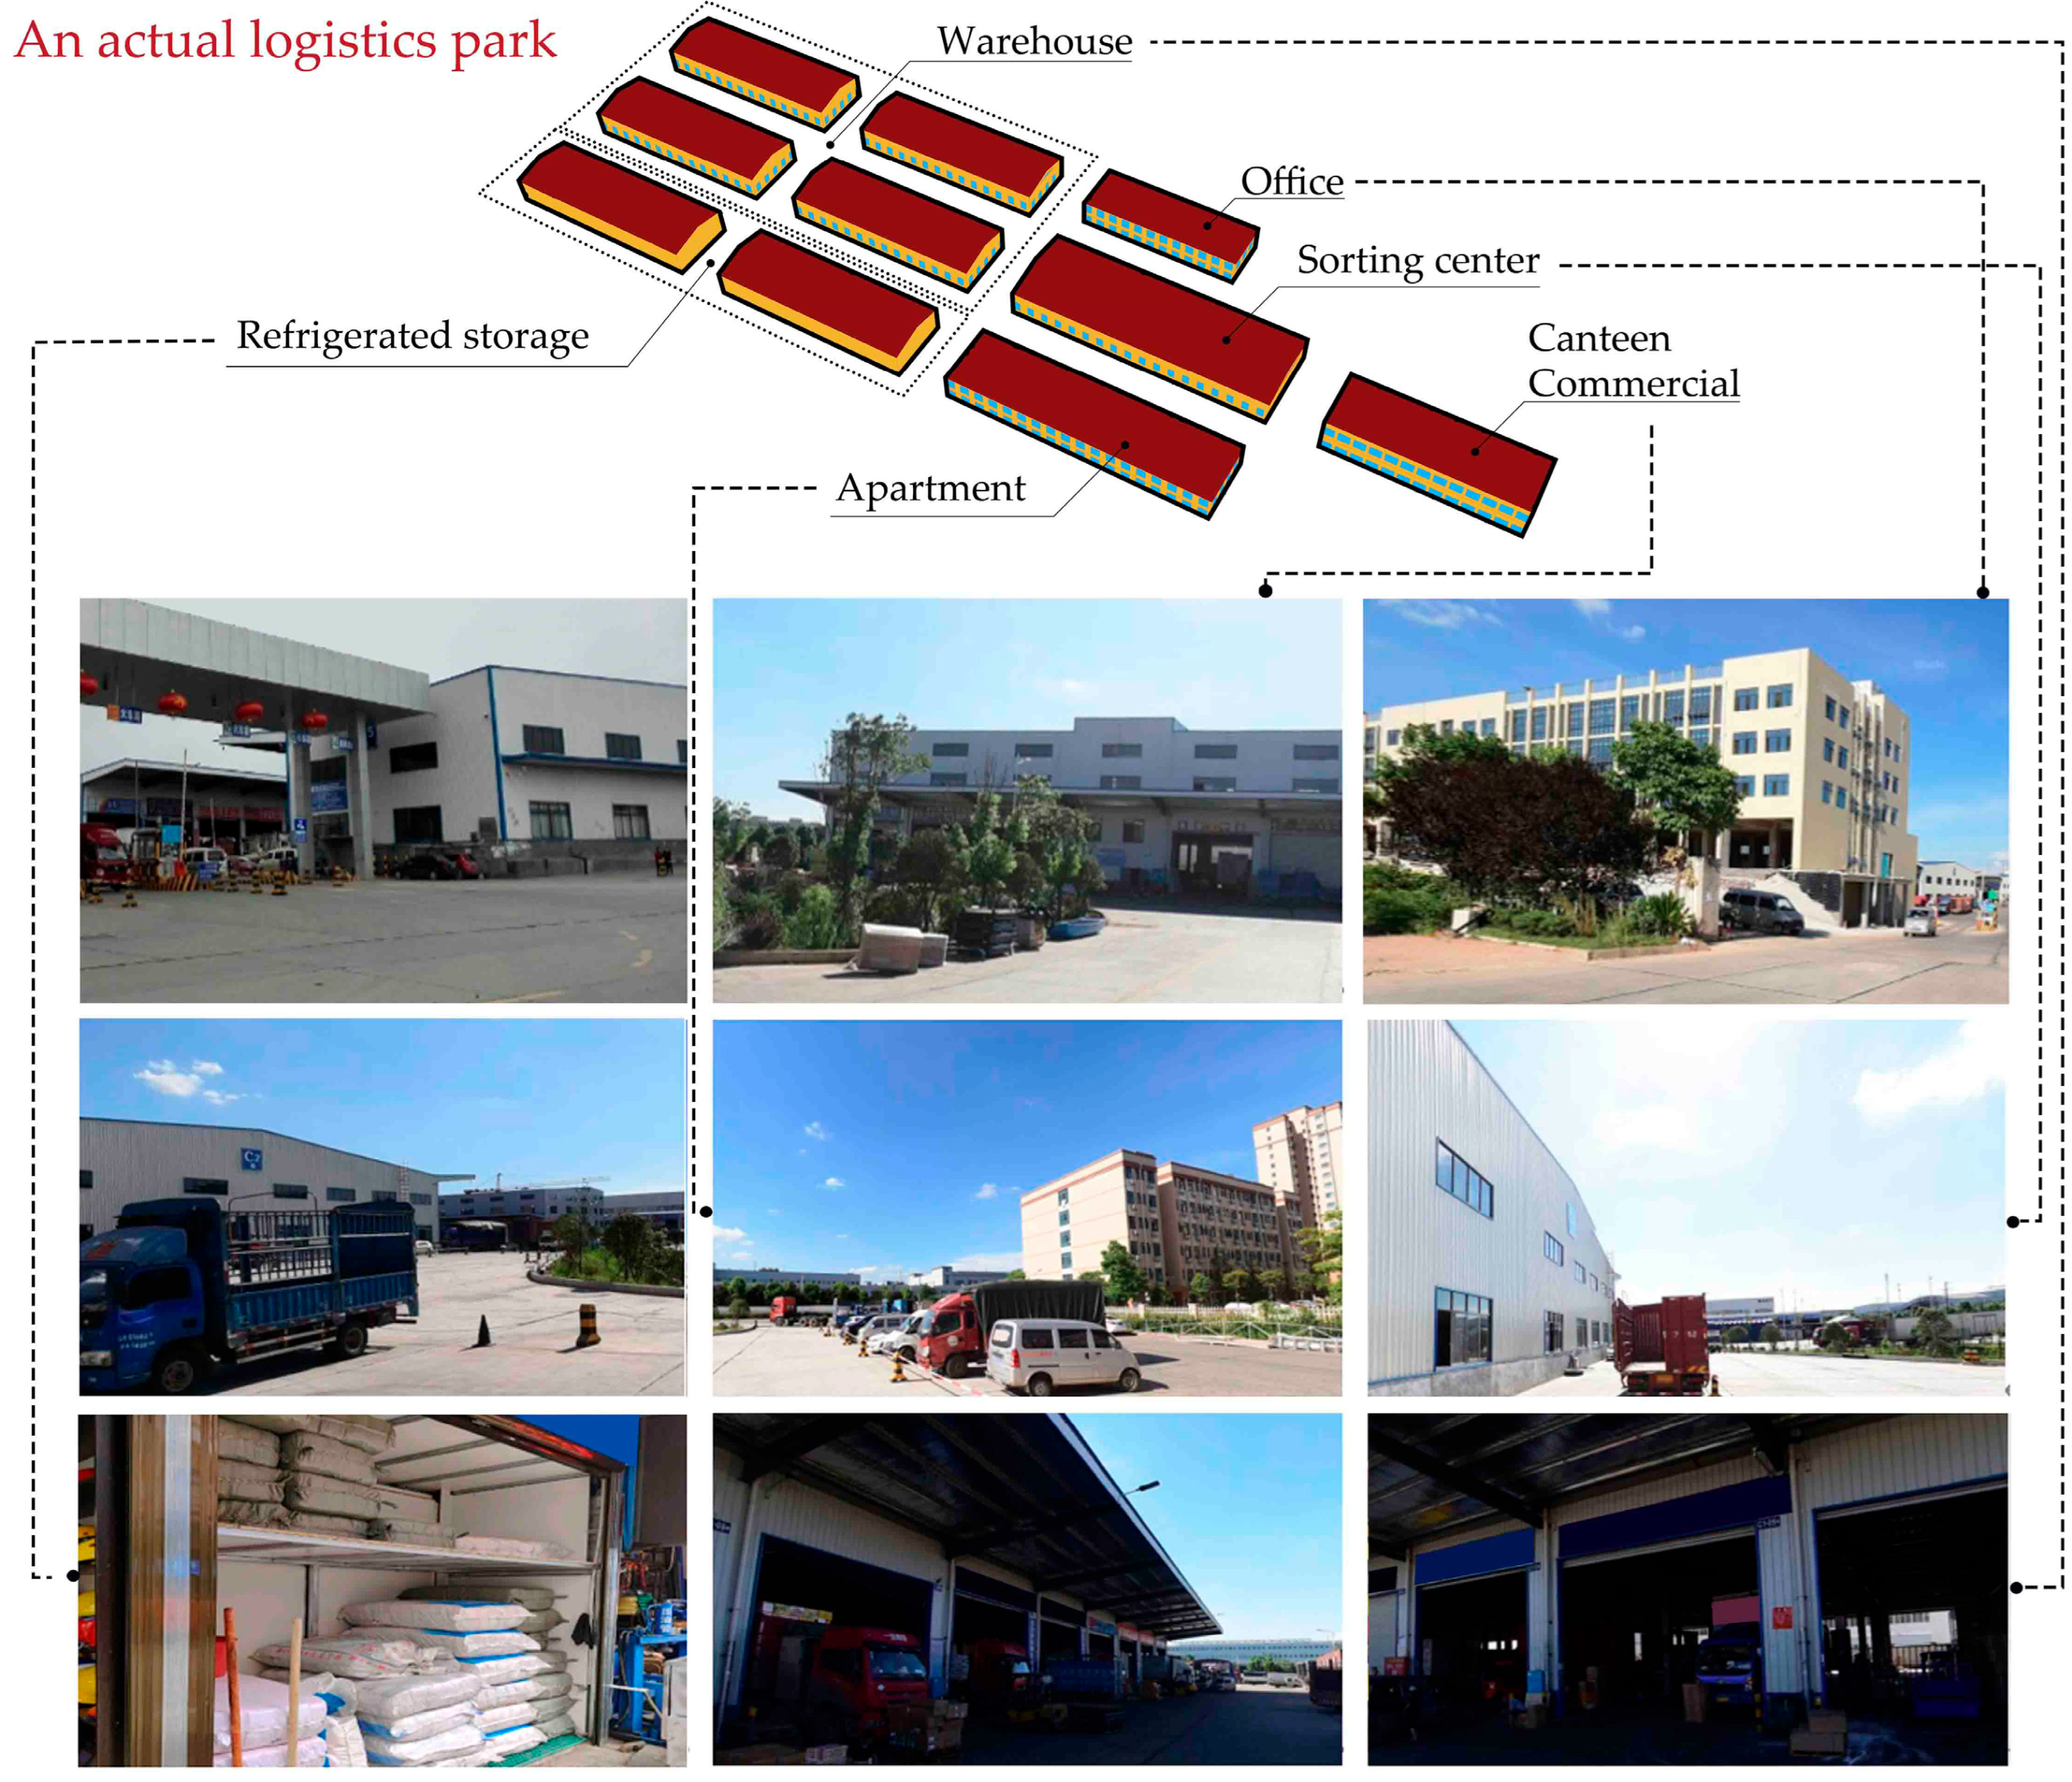
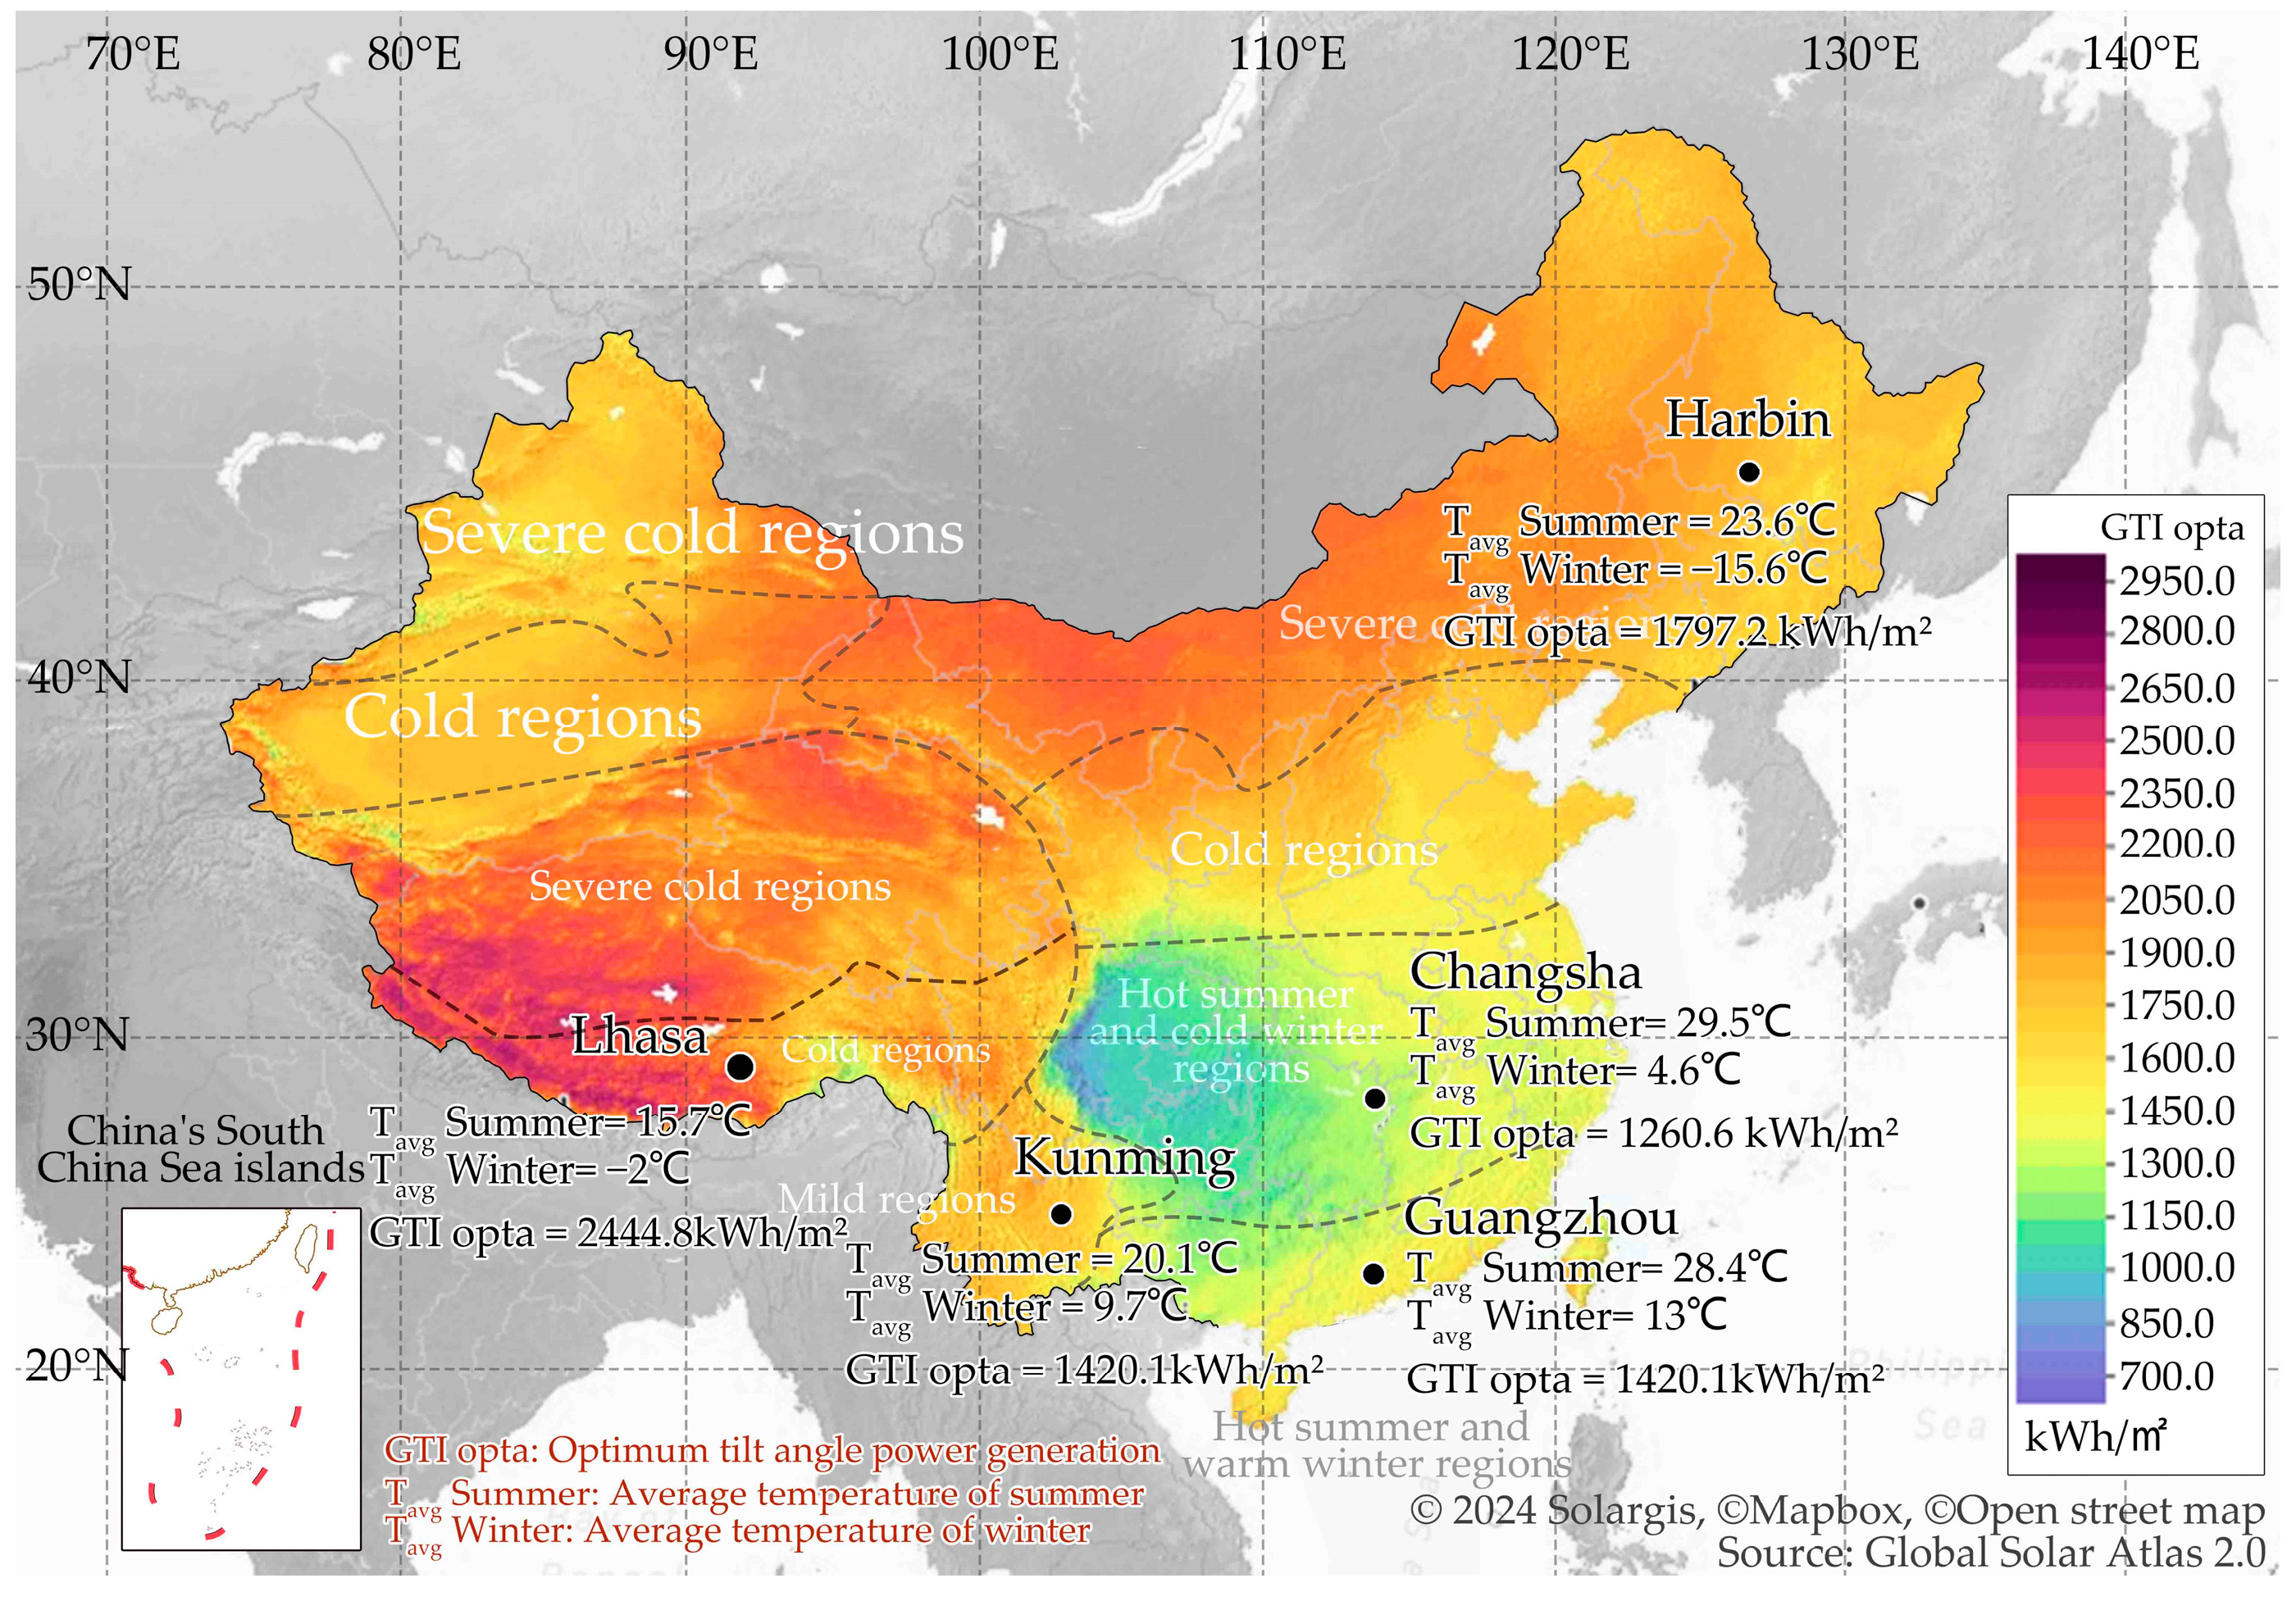
2.2.1. Study Area and Data Access
2.2.2. Energy Modeling for Logistics Parks and PV Systems
2.3. Multi-Criteria Optimization
2.3.1. Multi-Criteria Optimization Process
2.3.2. Optimal Solution Selected from the Pareto Front Set
3. Results and Analysis
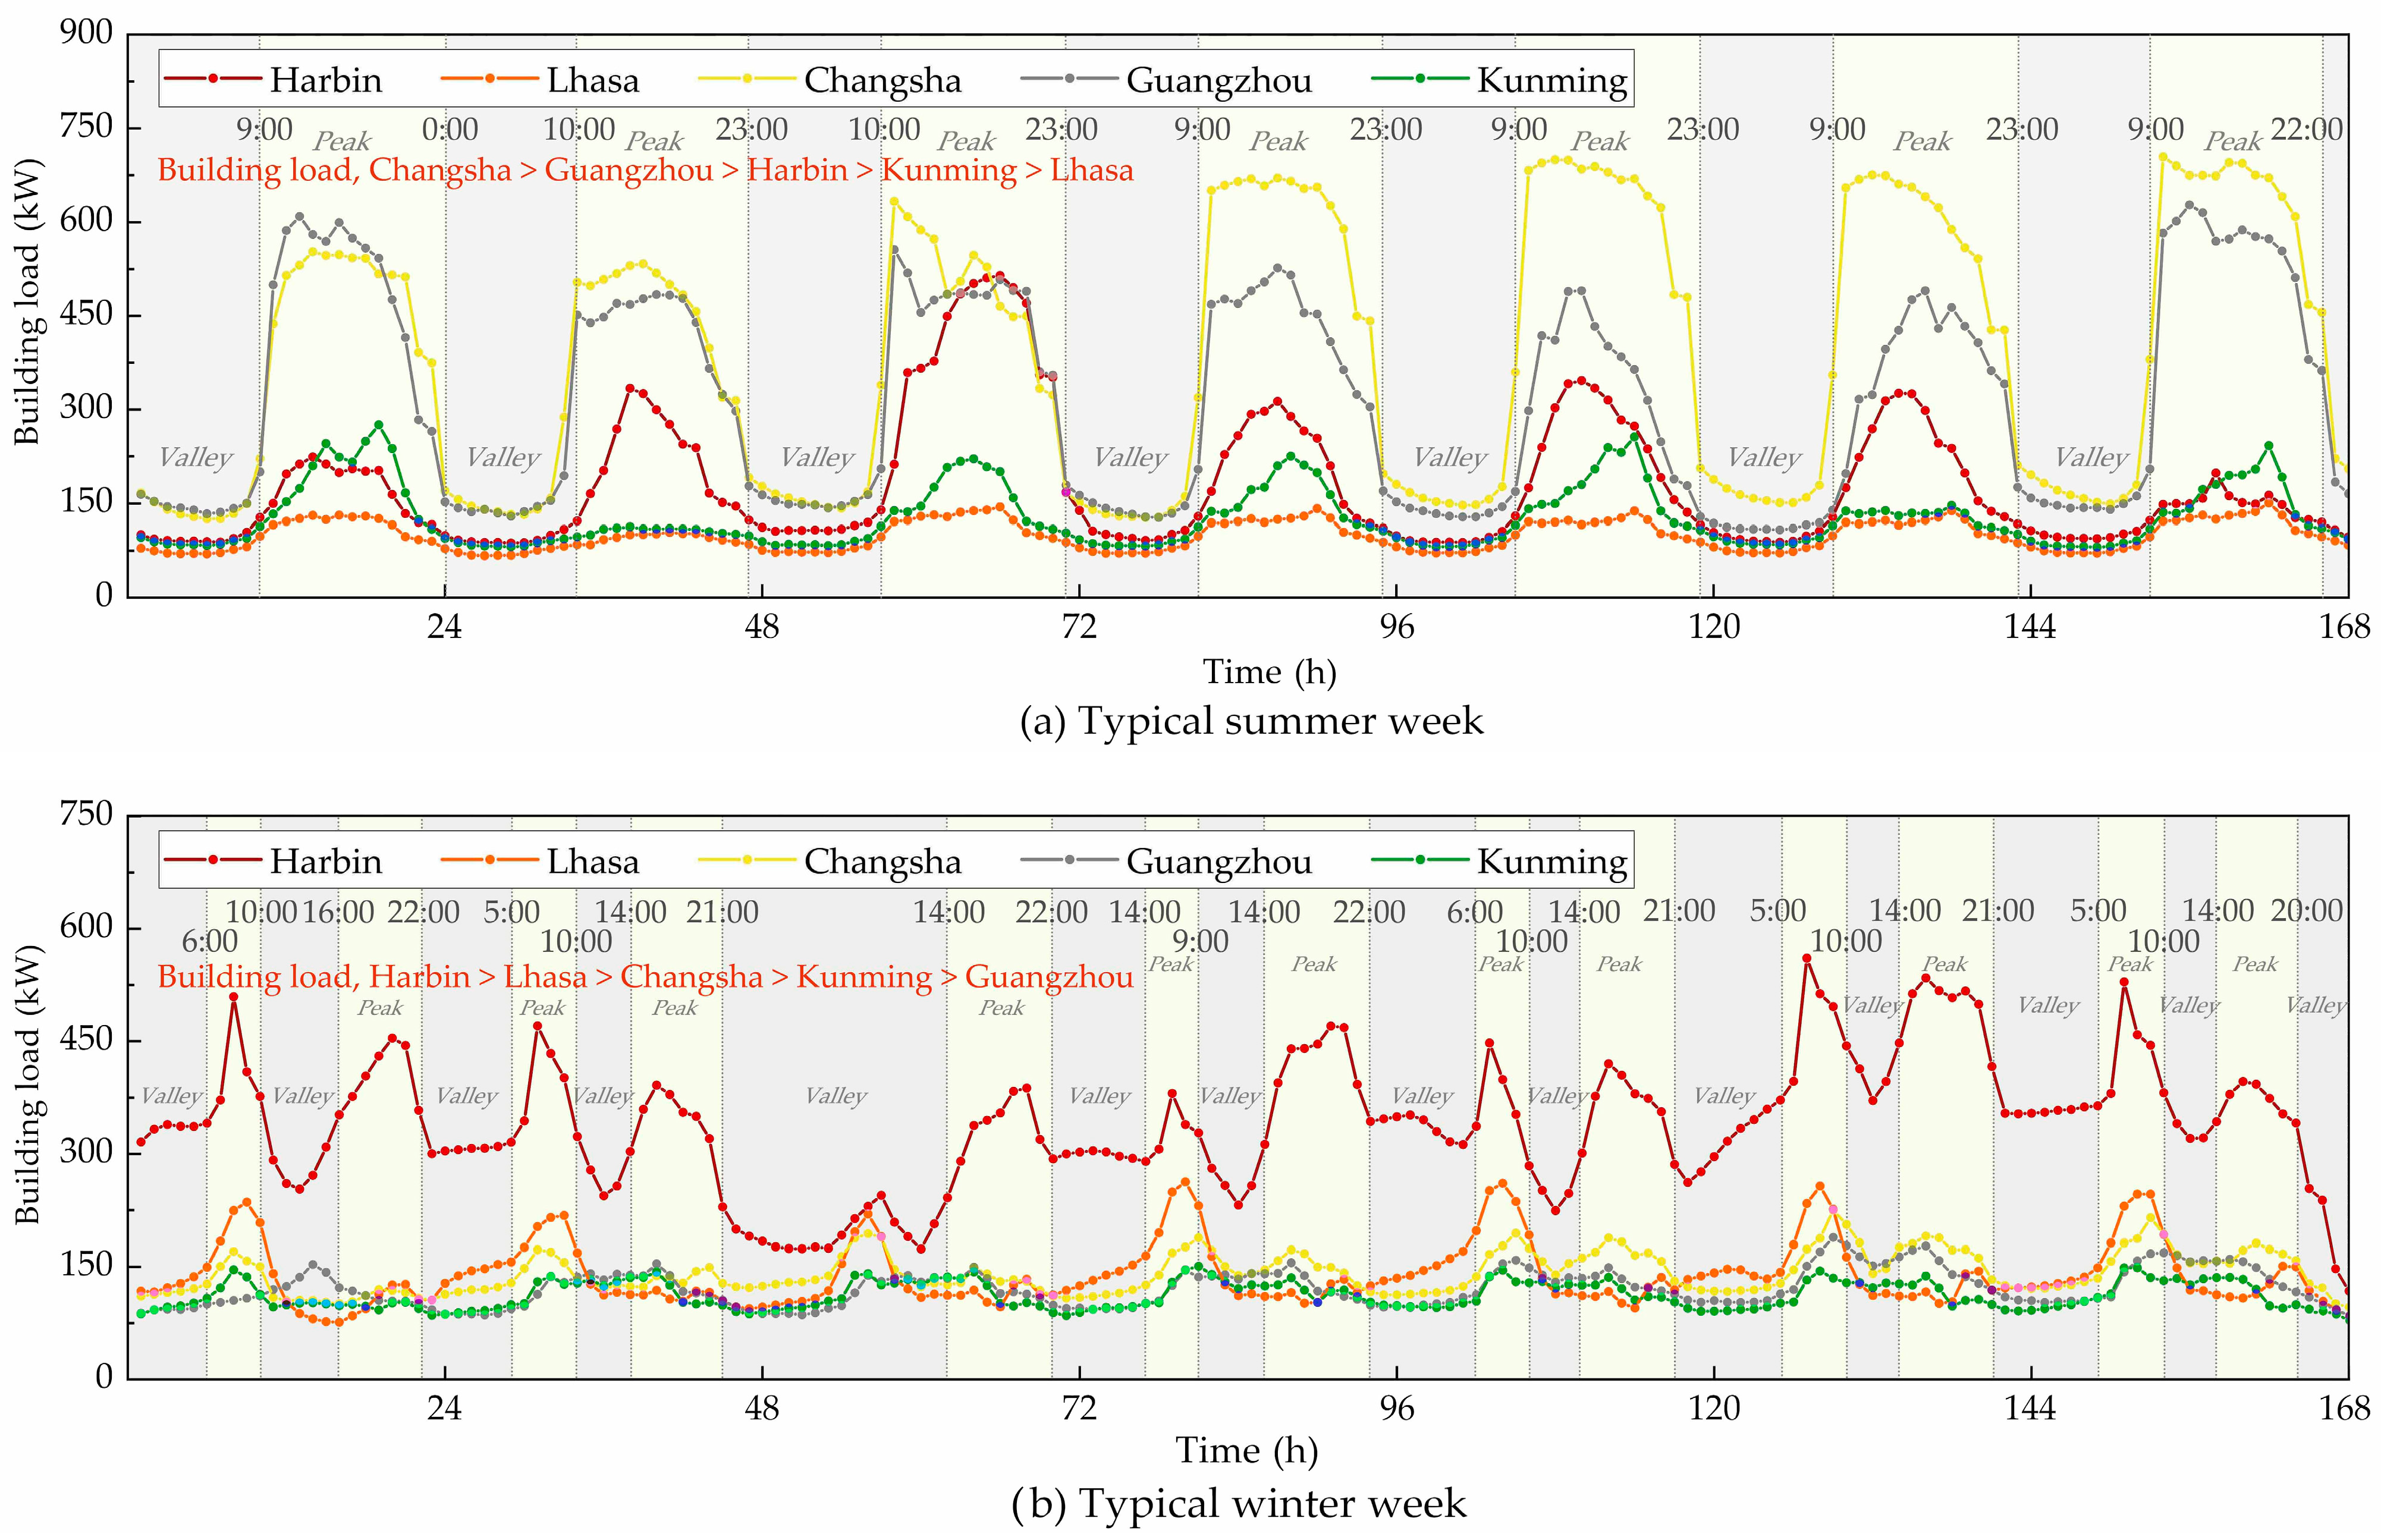
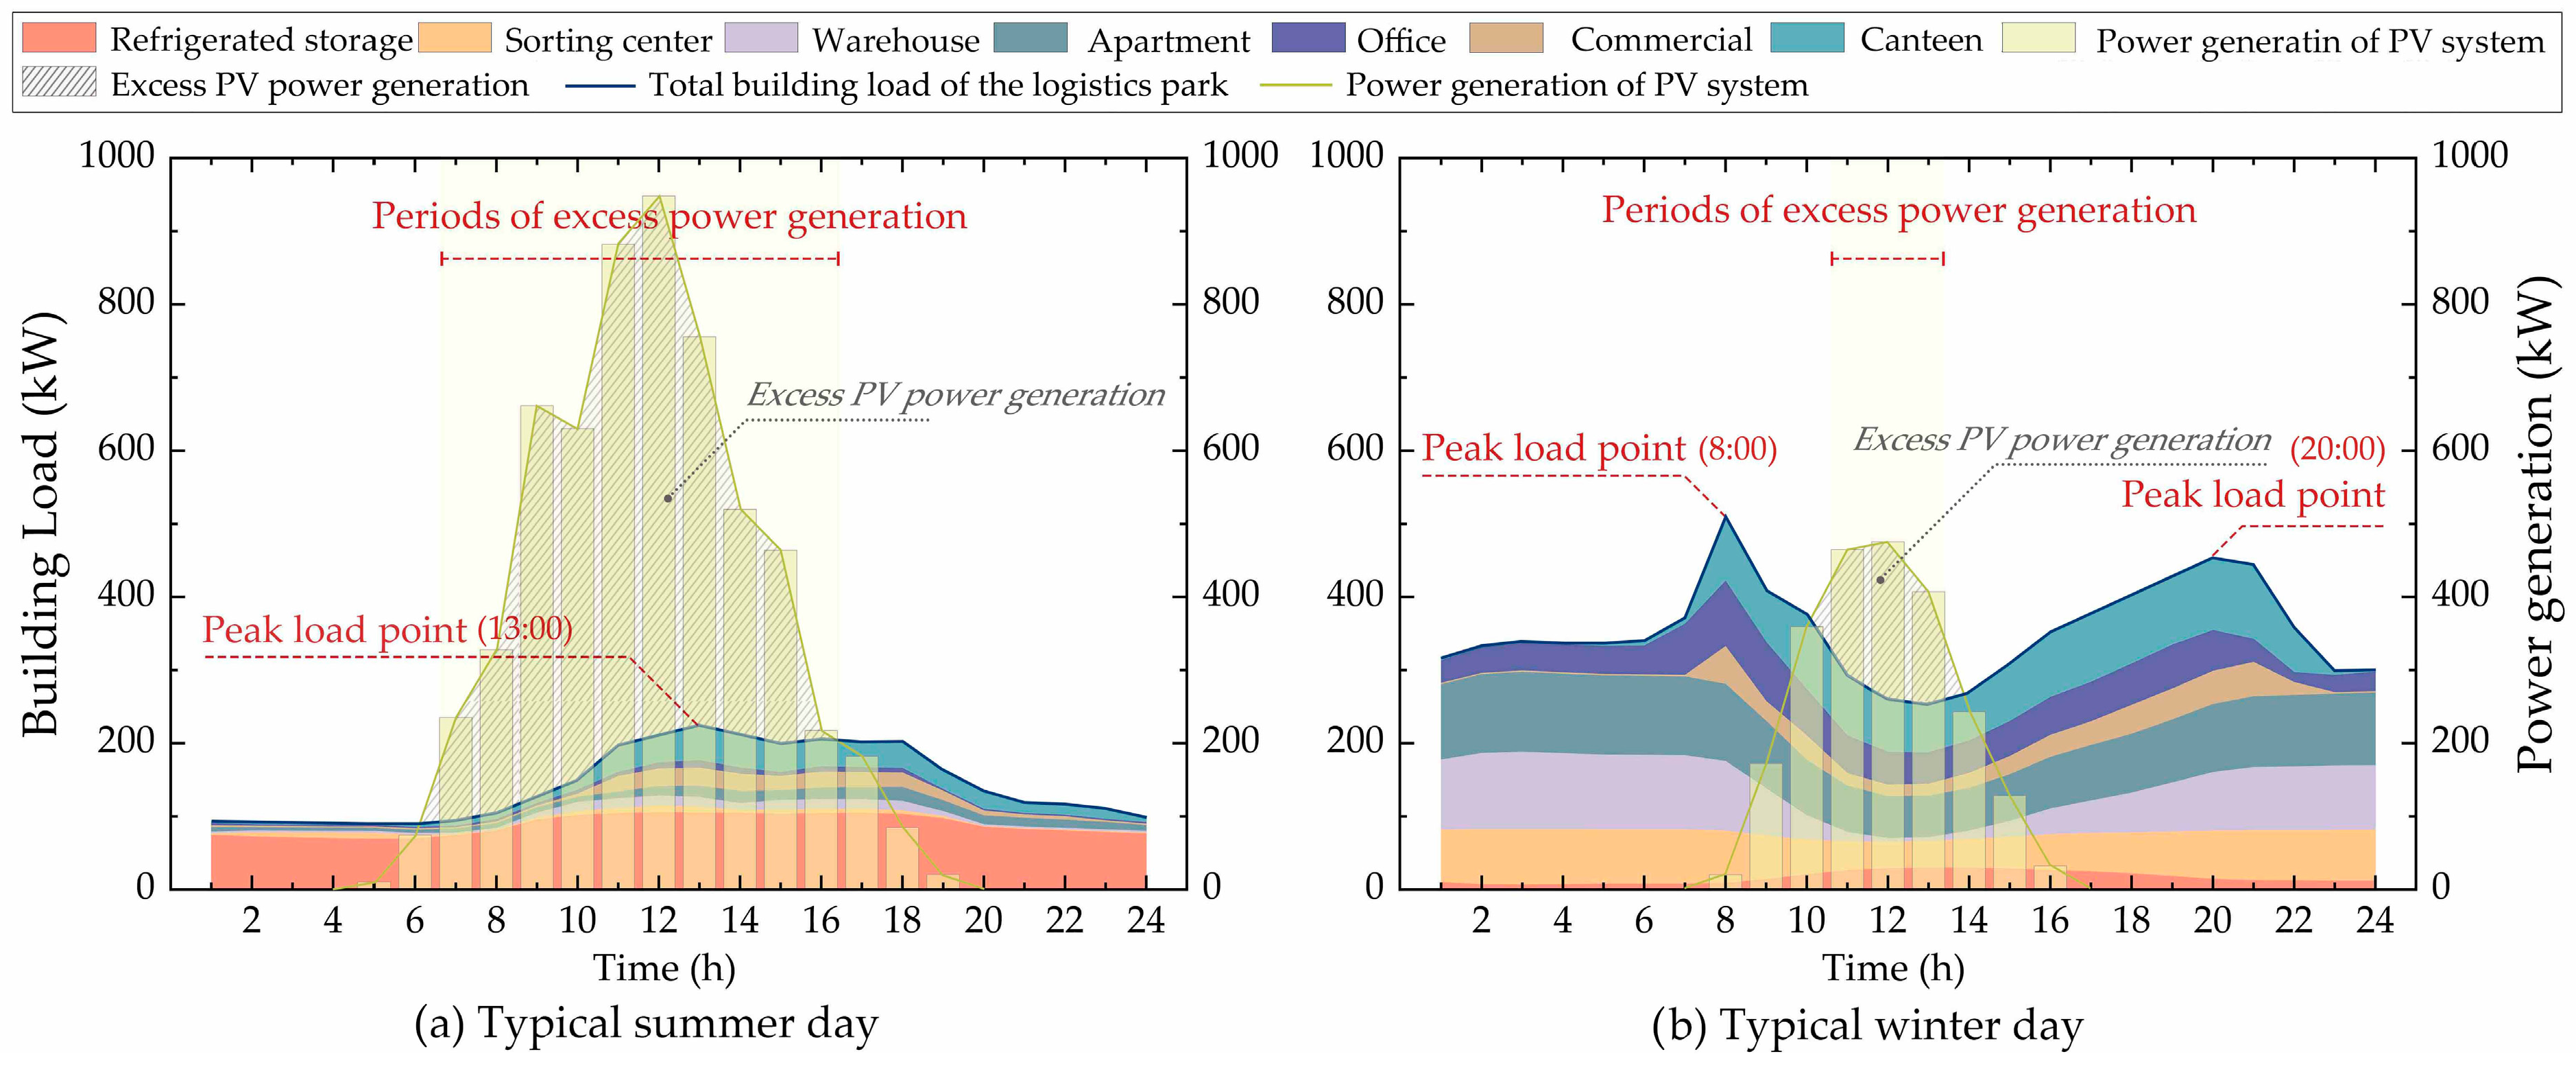
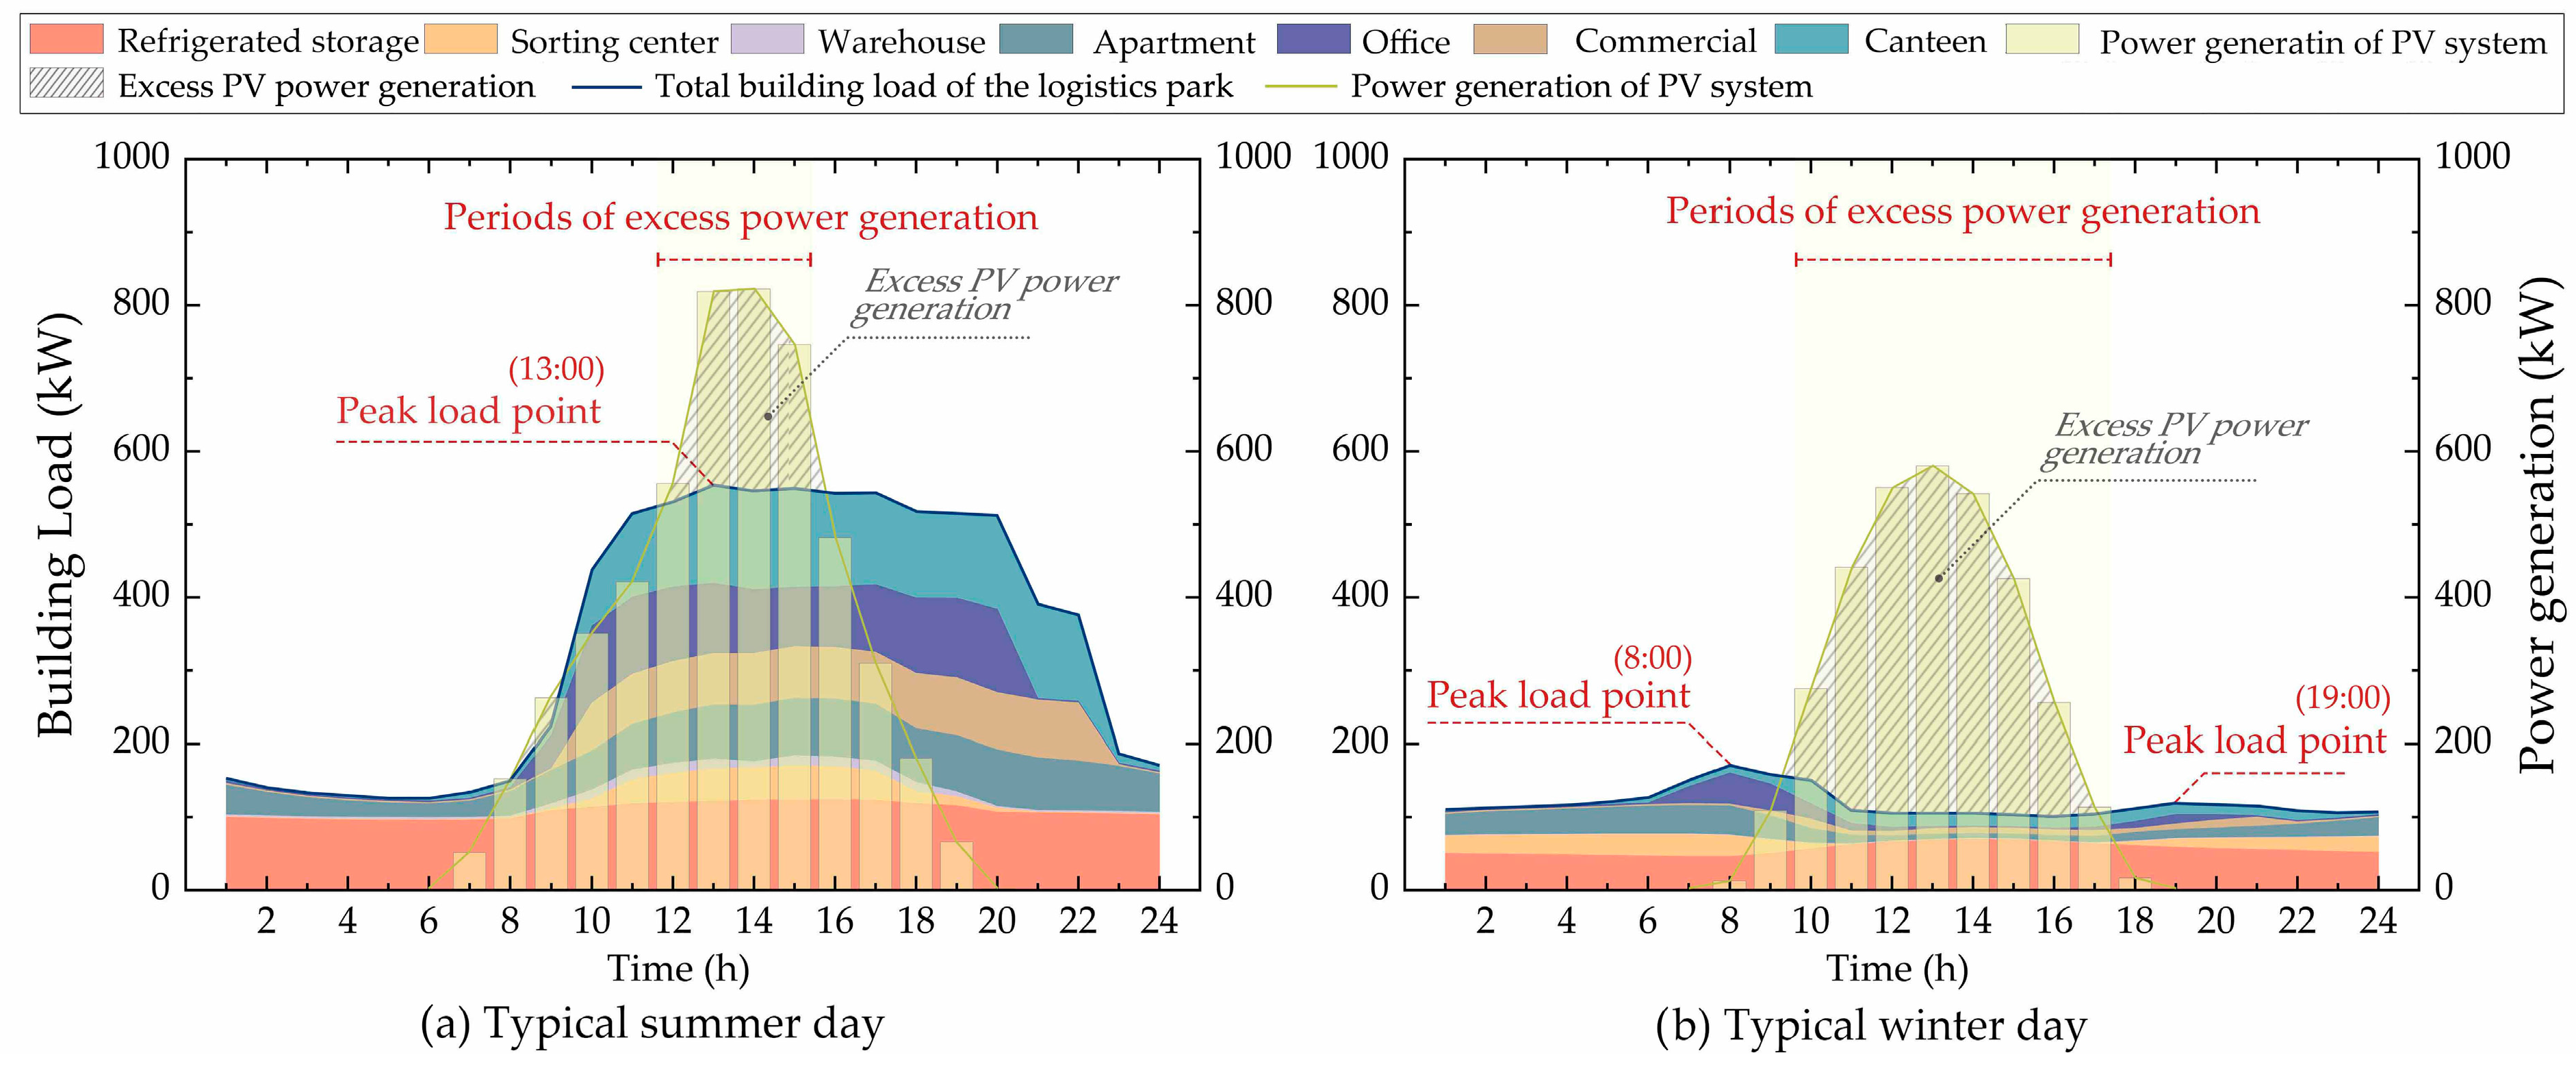
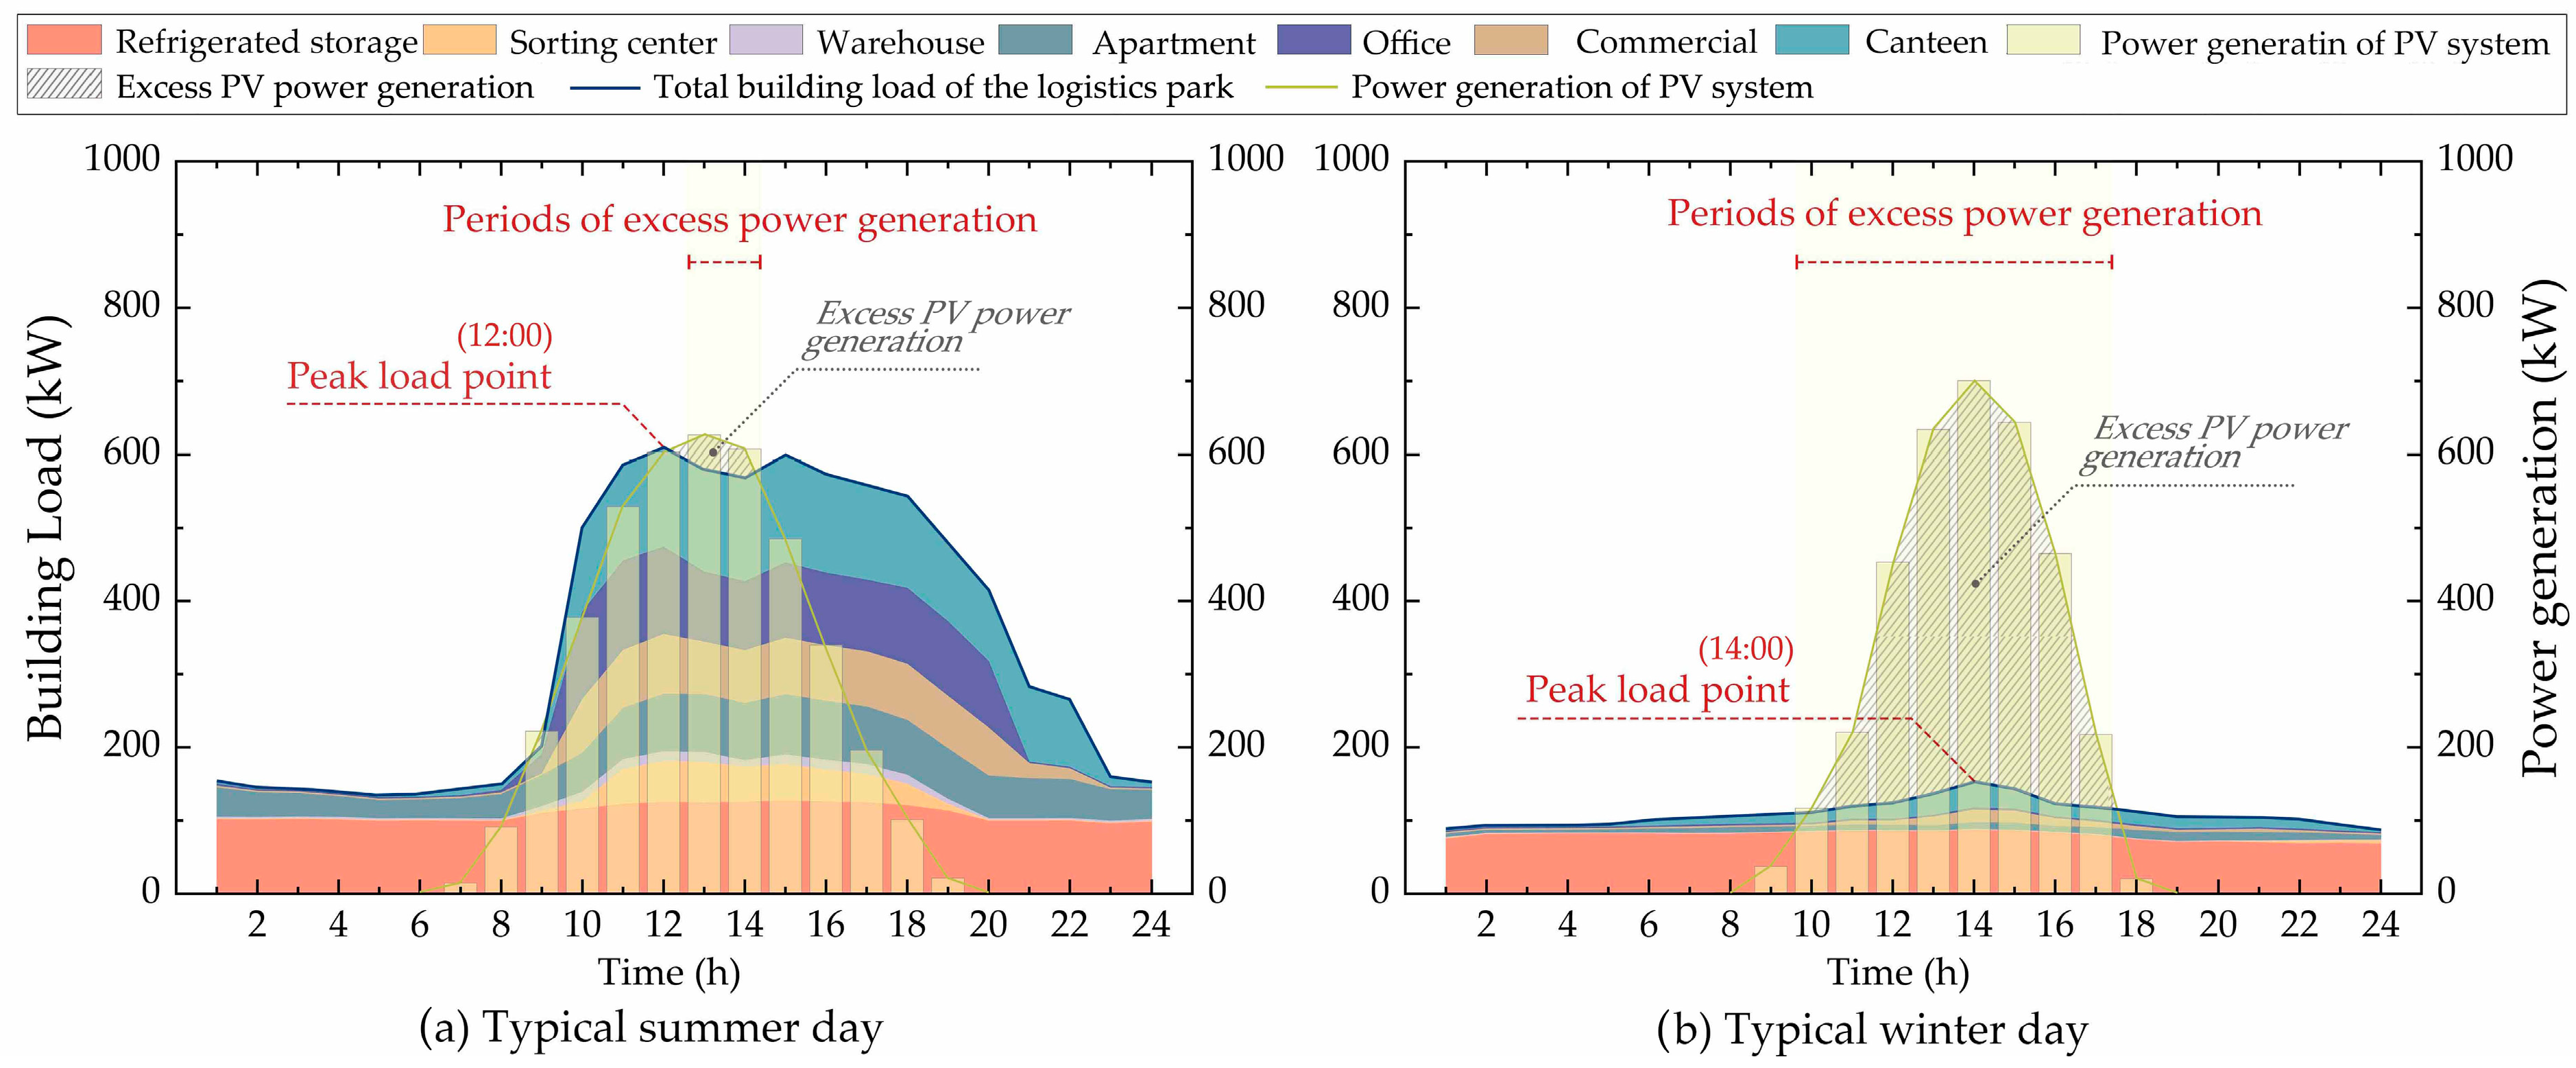
3.1. Load Characteristics of Various Buildings in Logistics Parks
3.2. Optimal Angle Values of PV Systems Across Climatic Regions
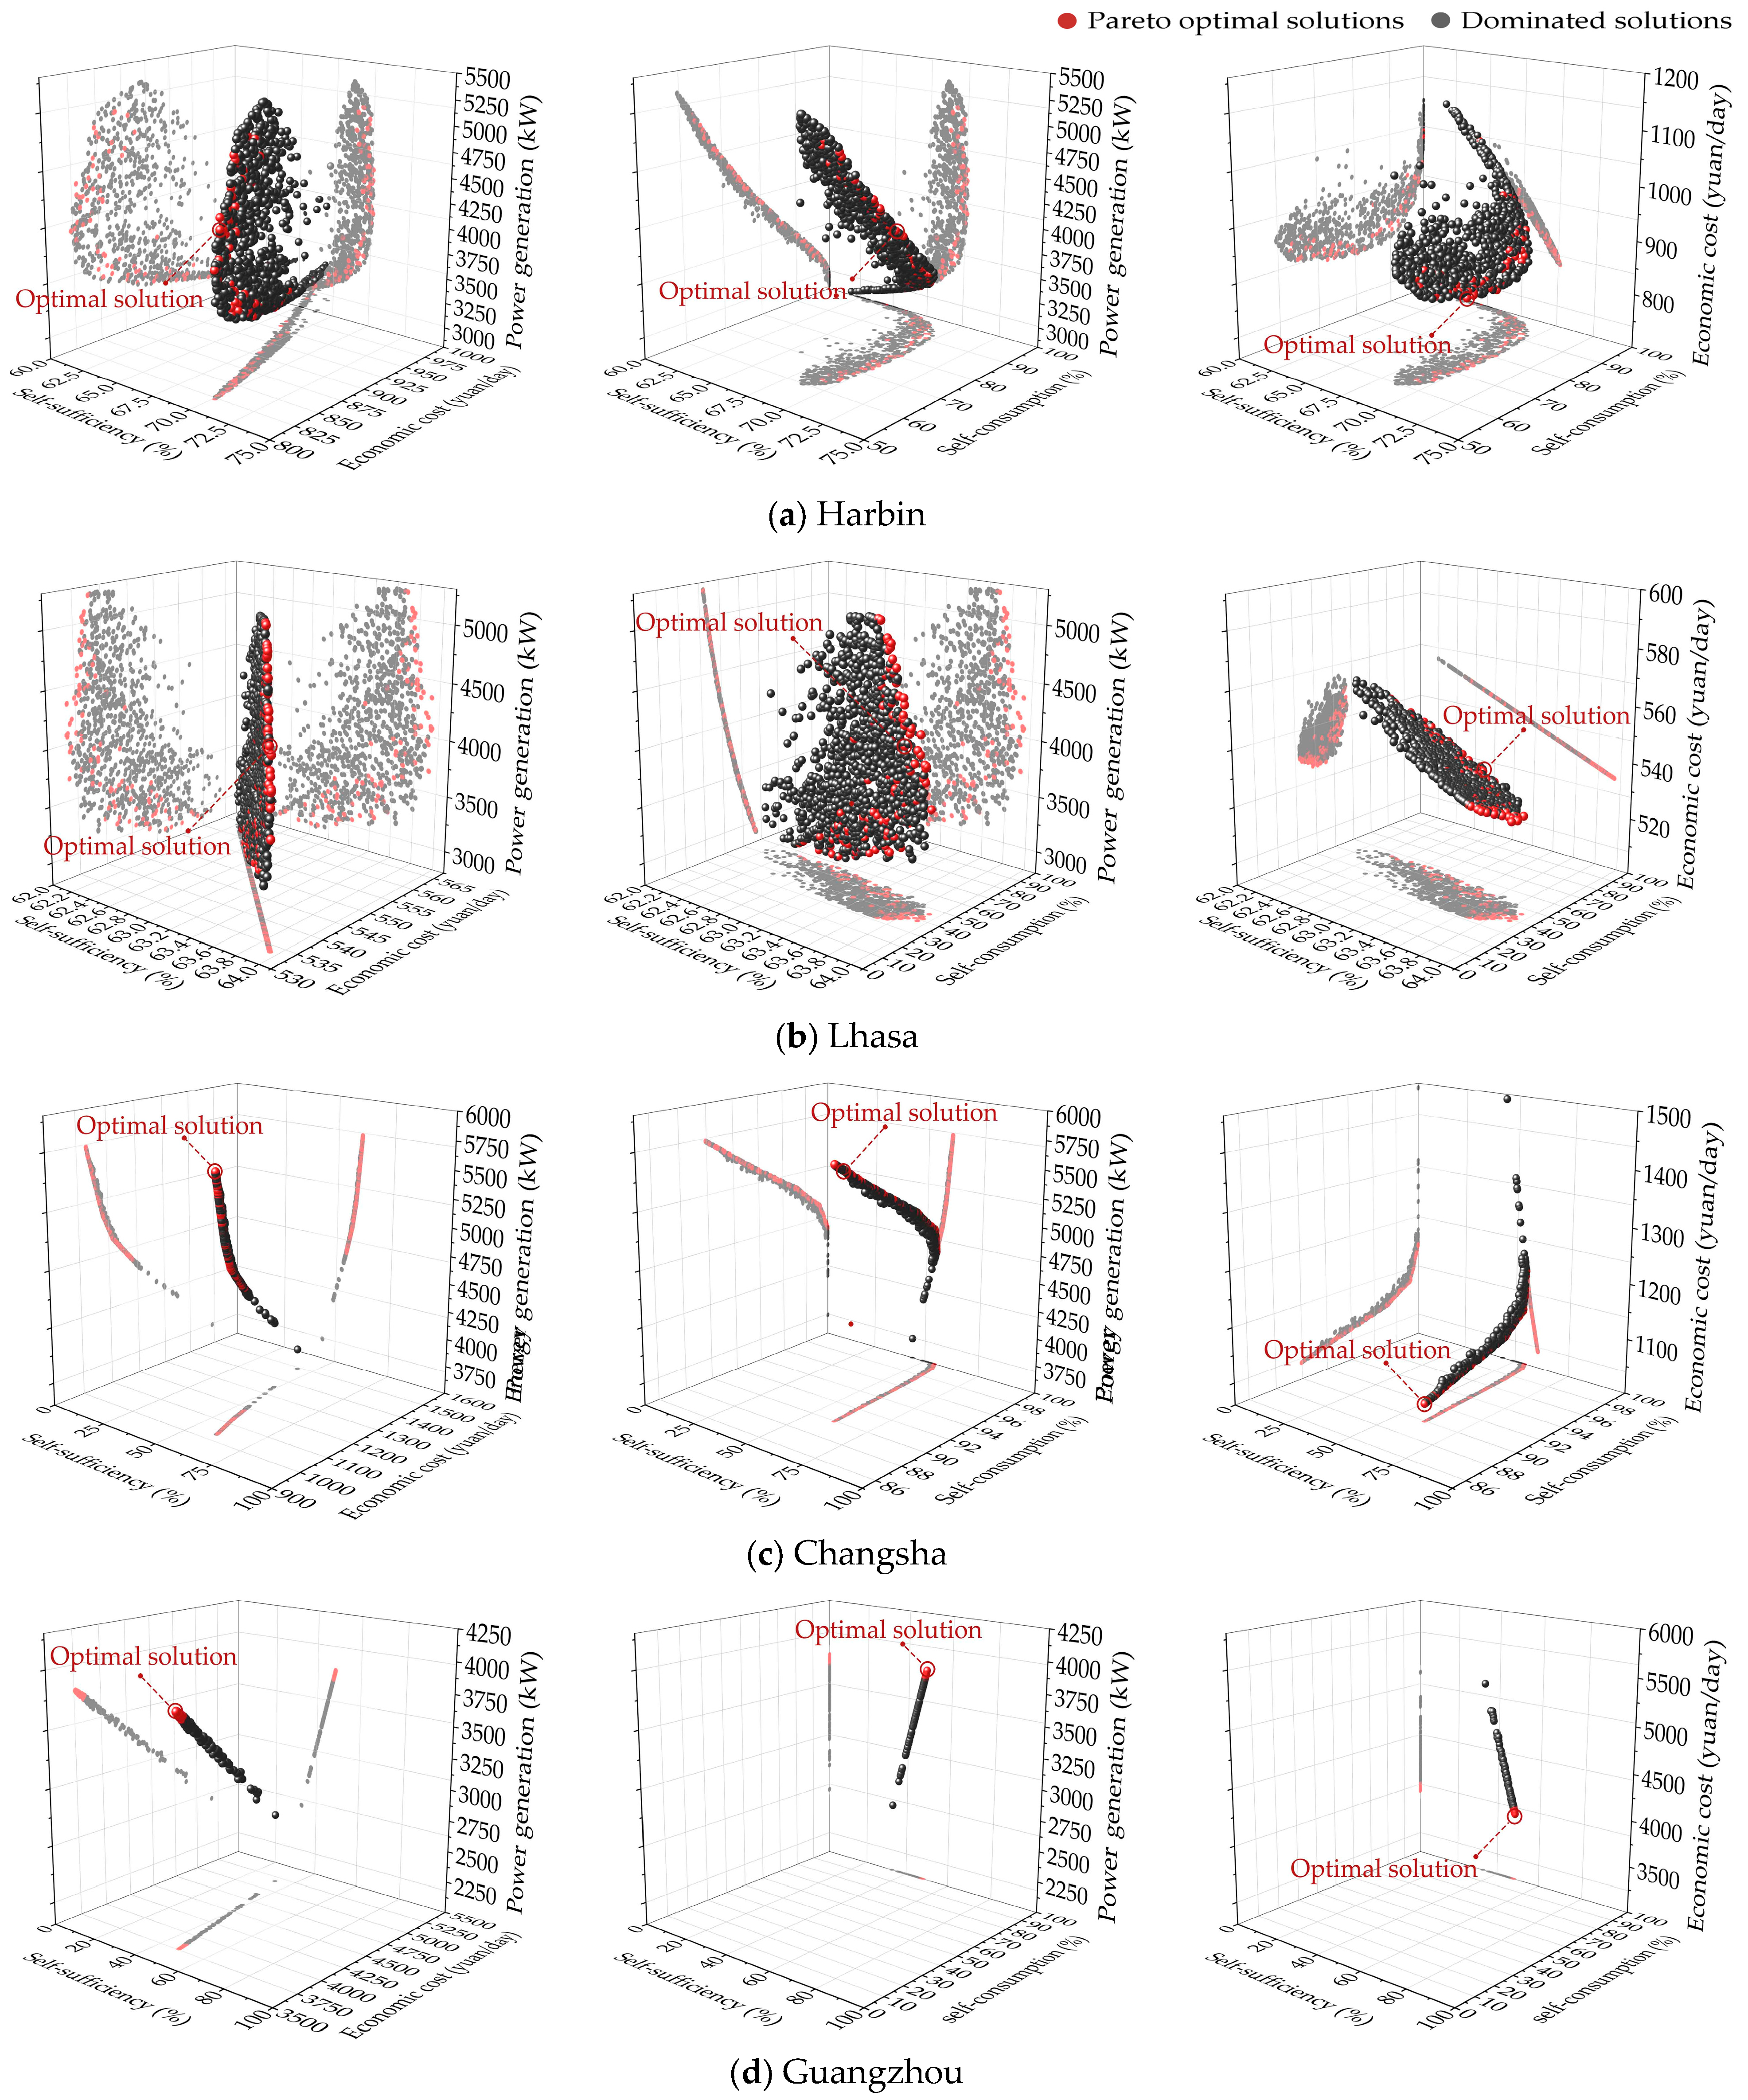
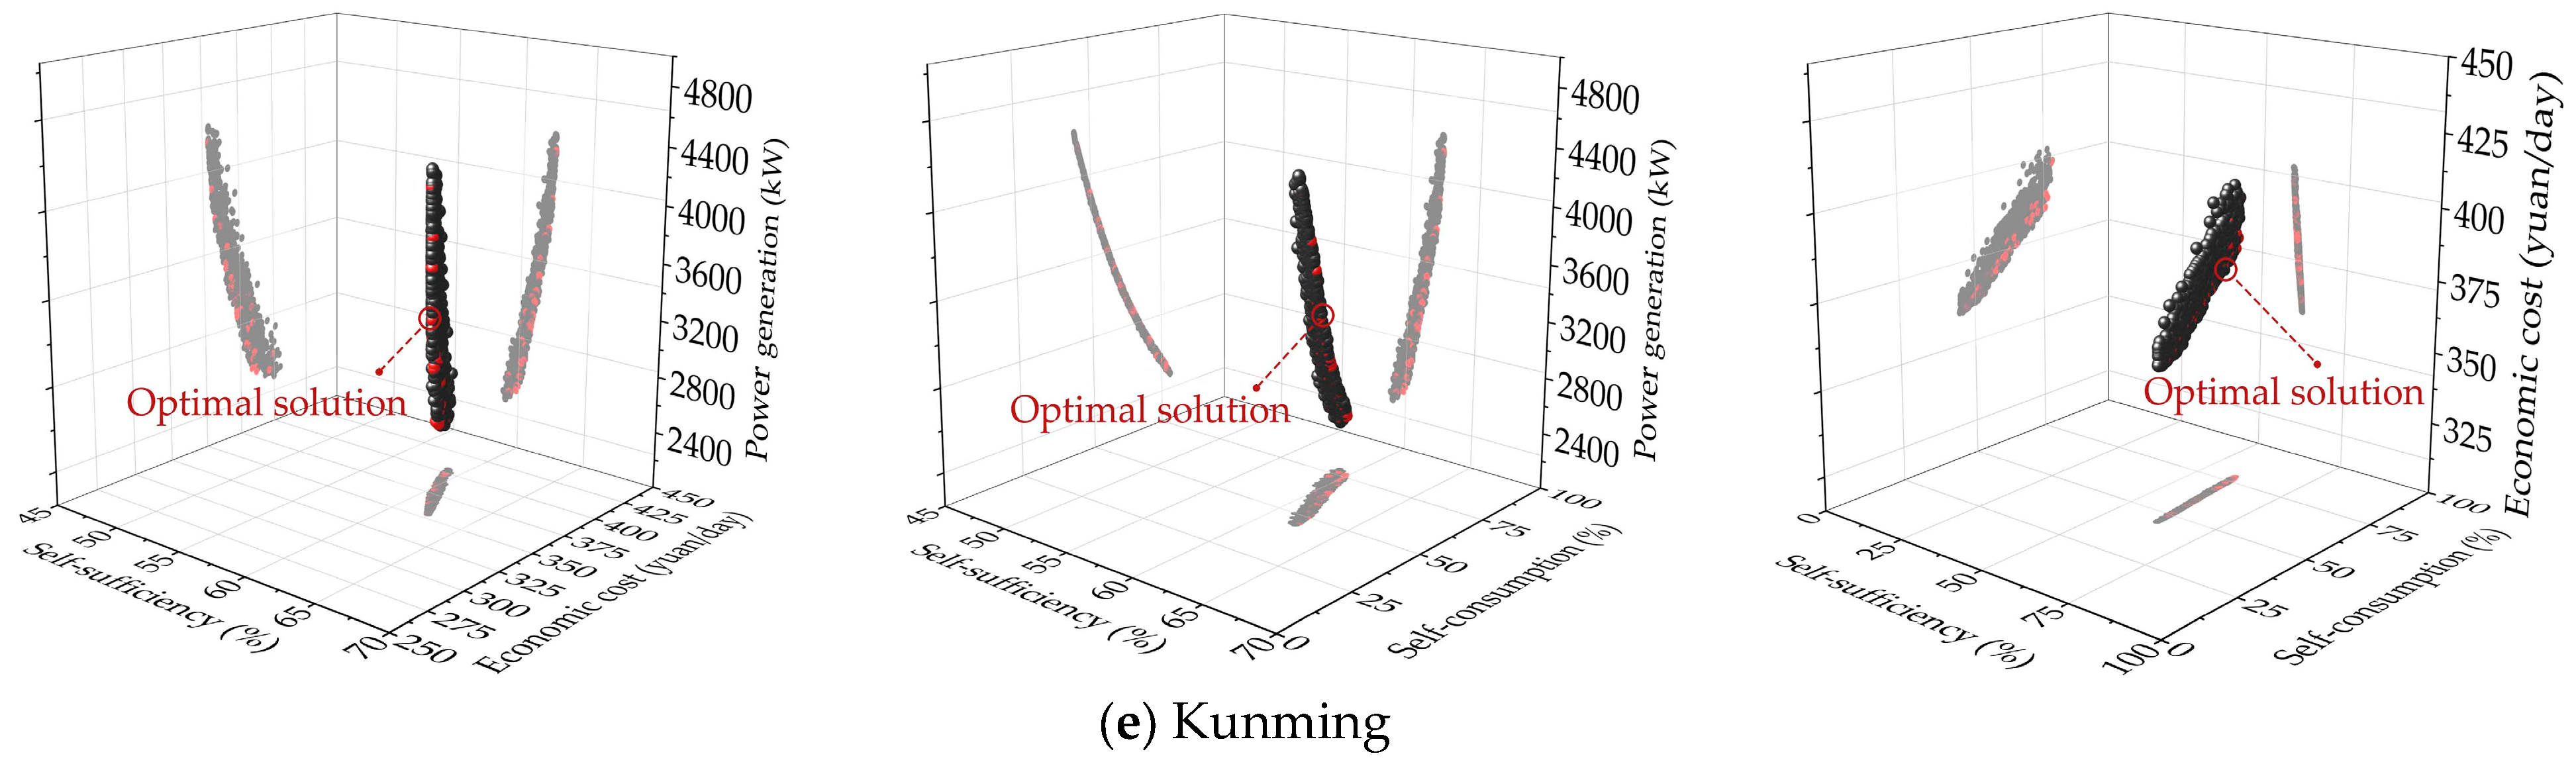
3.2.1. Optimization Process and Selection of Solutions
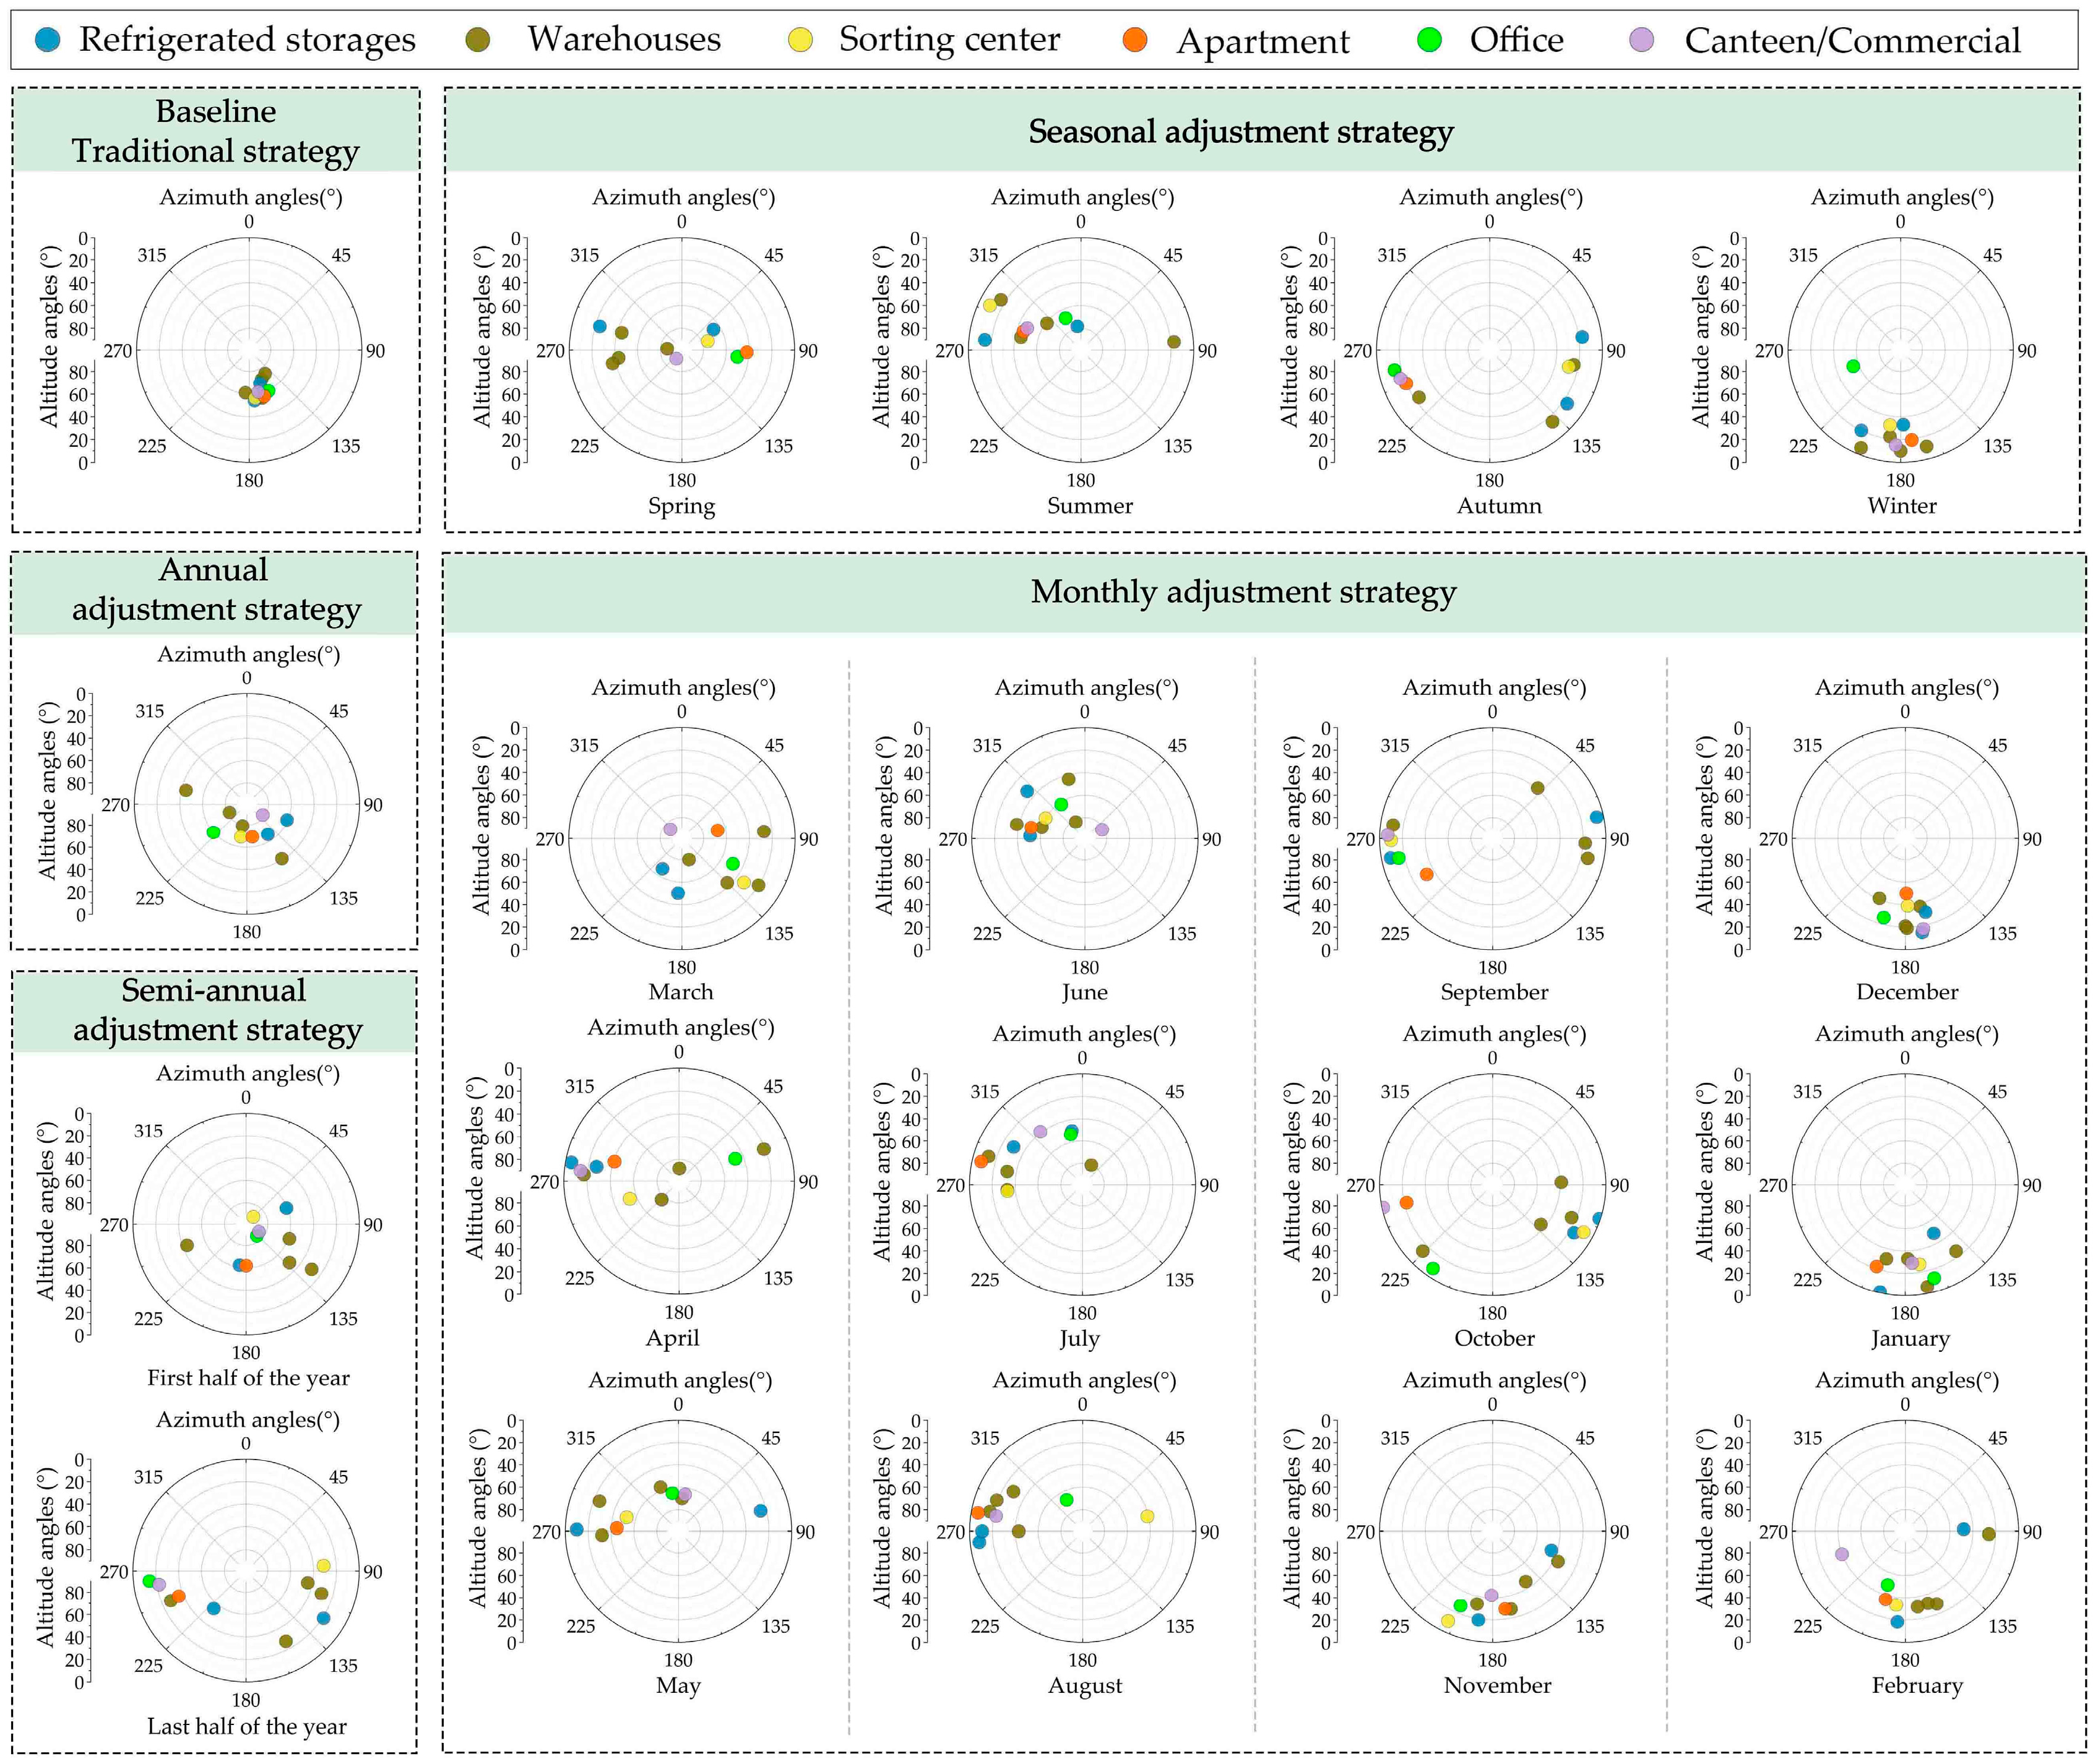
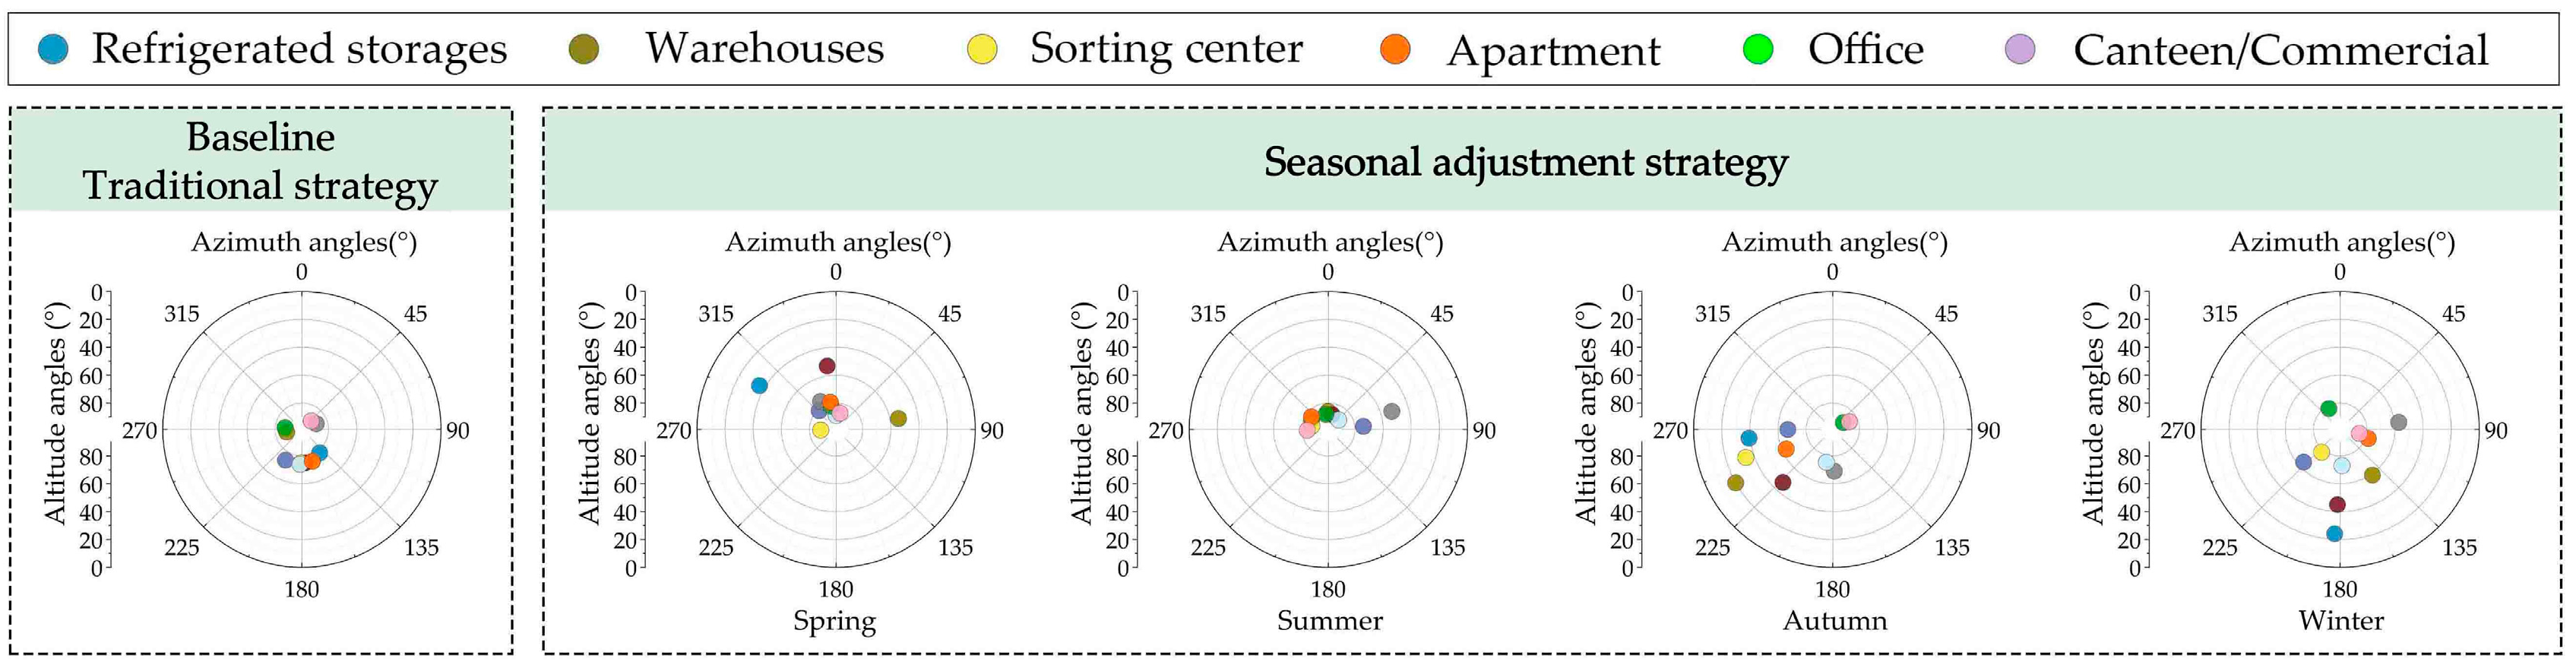
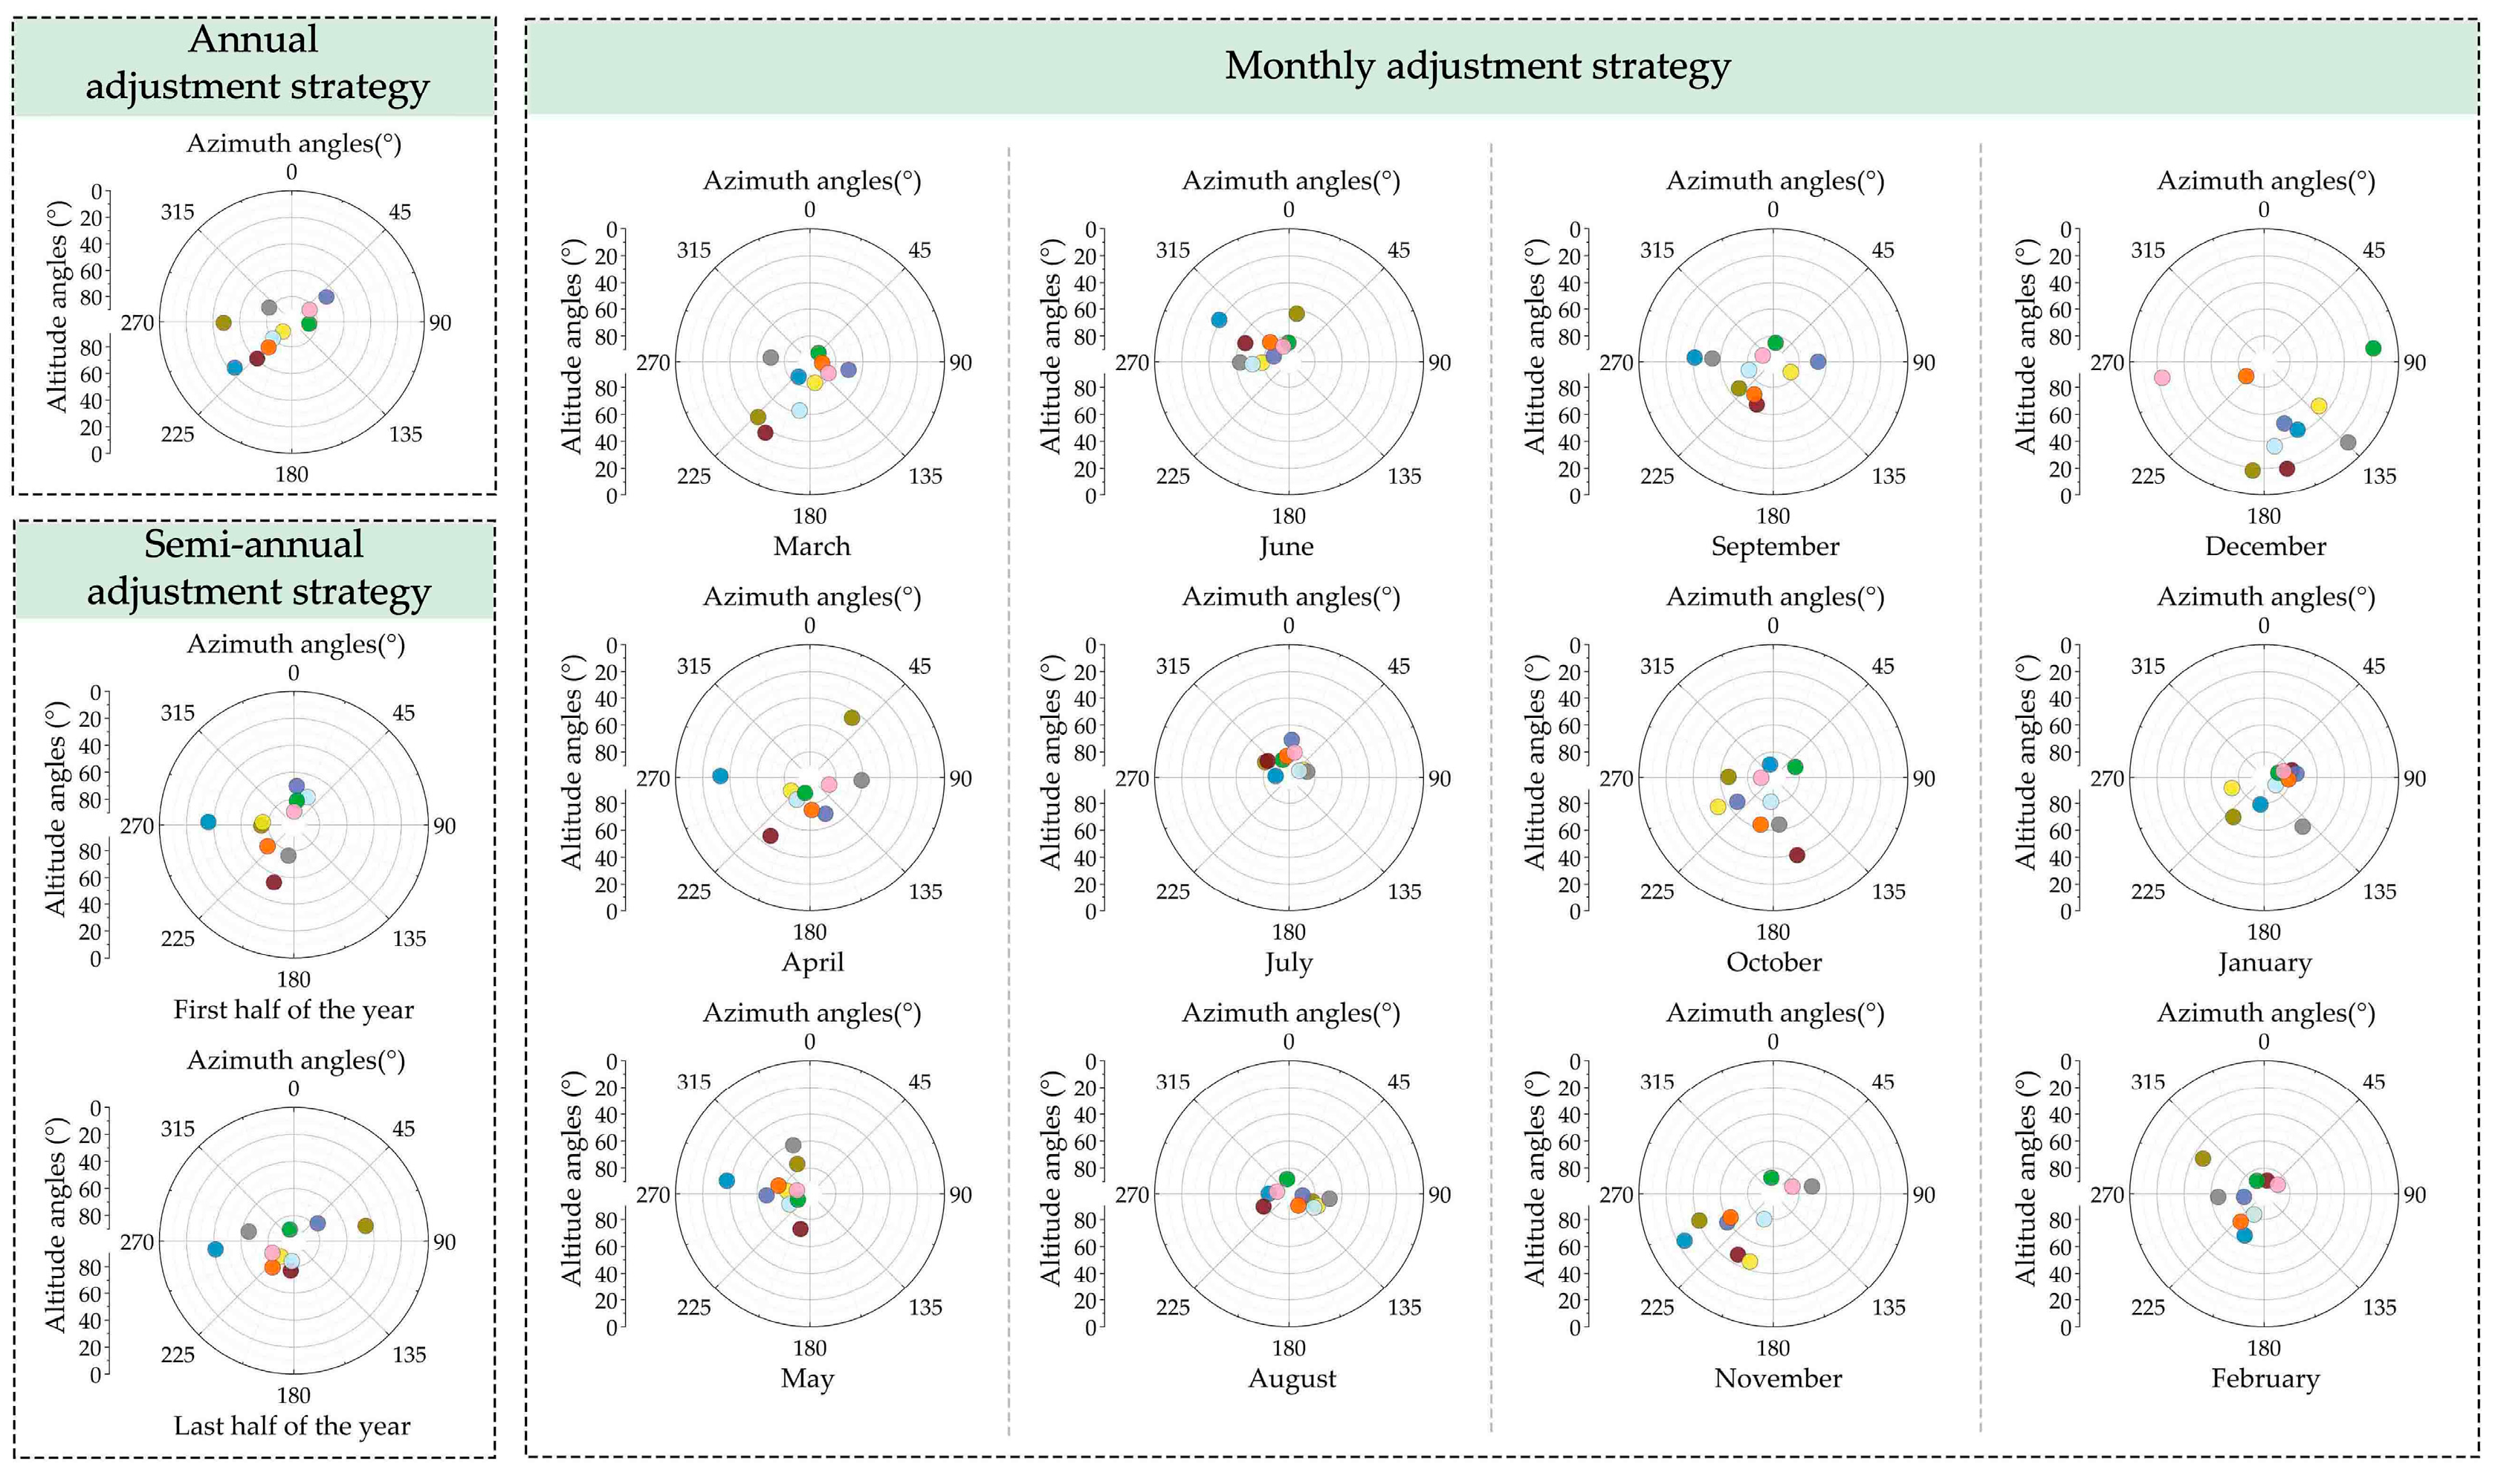
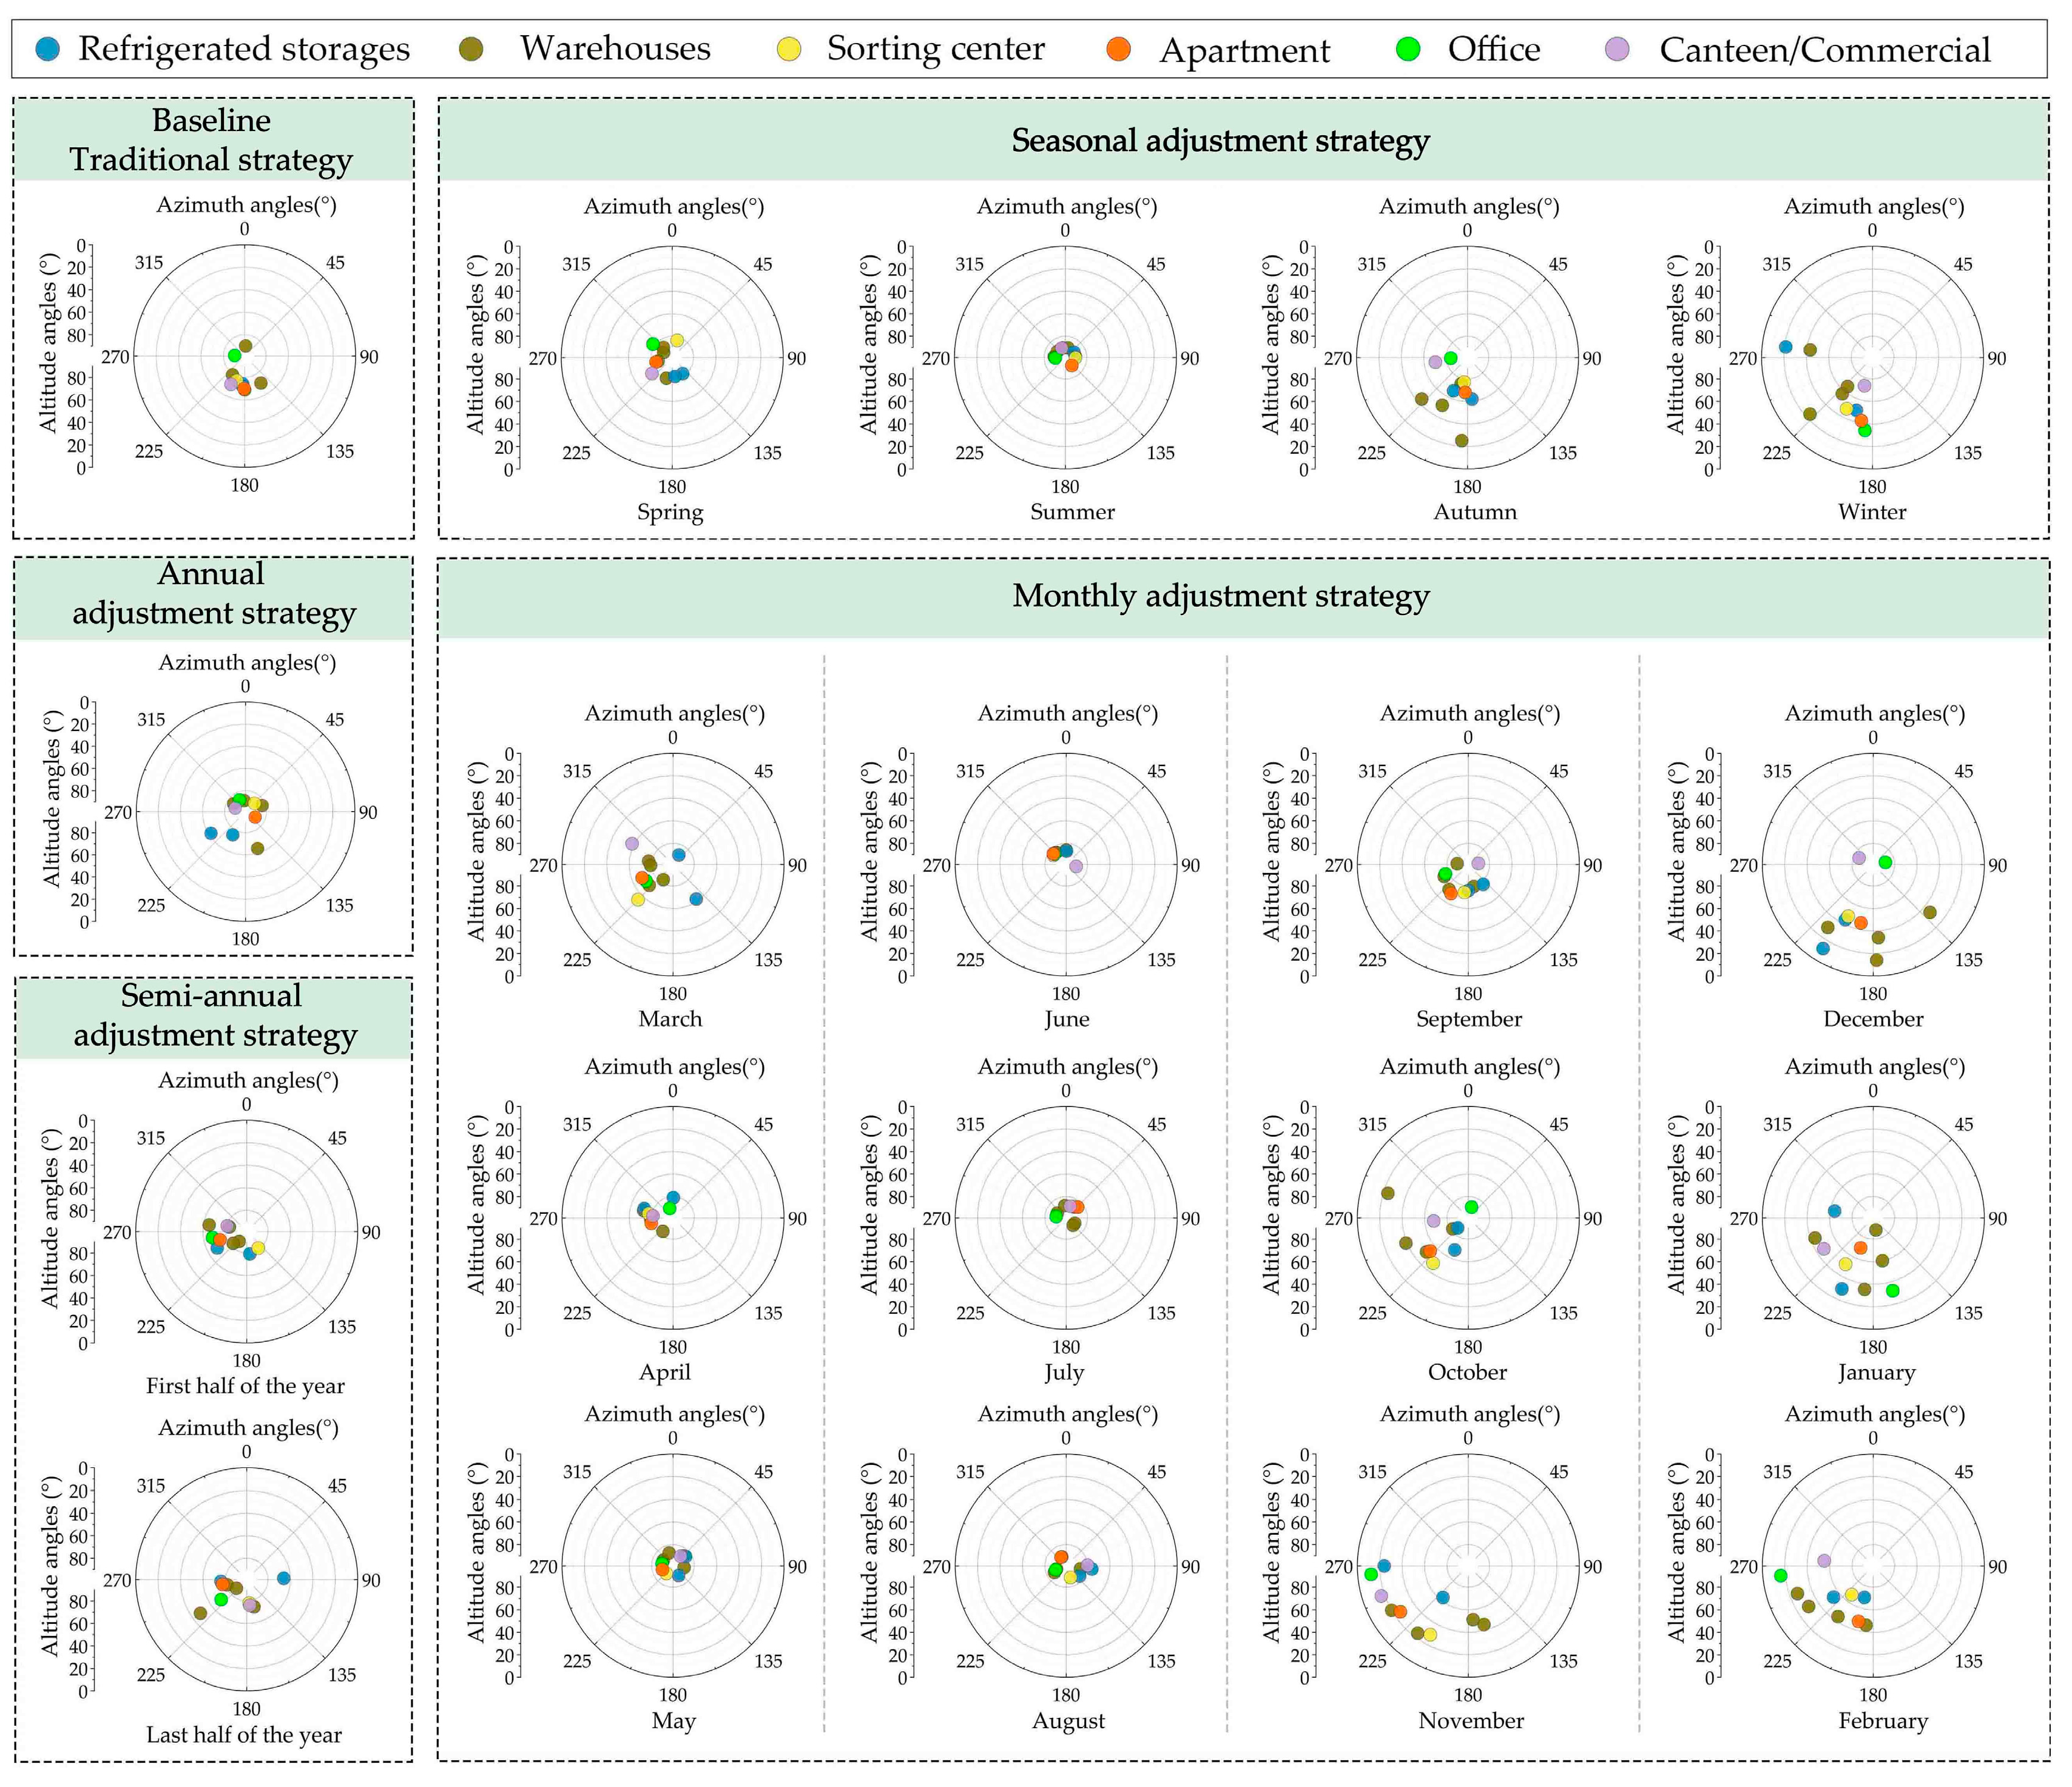
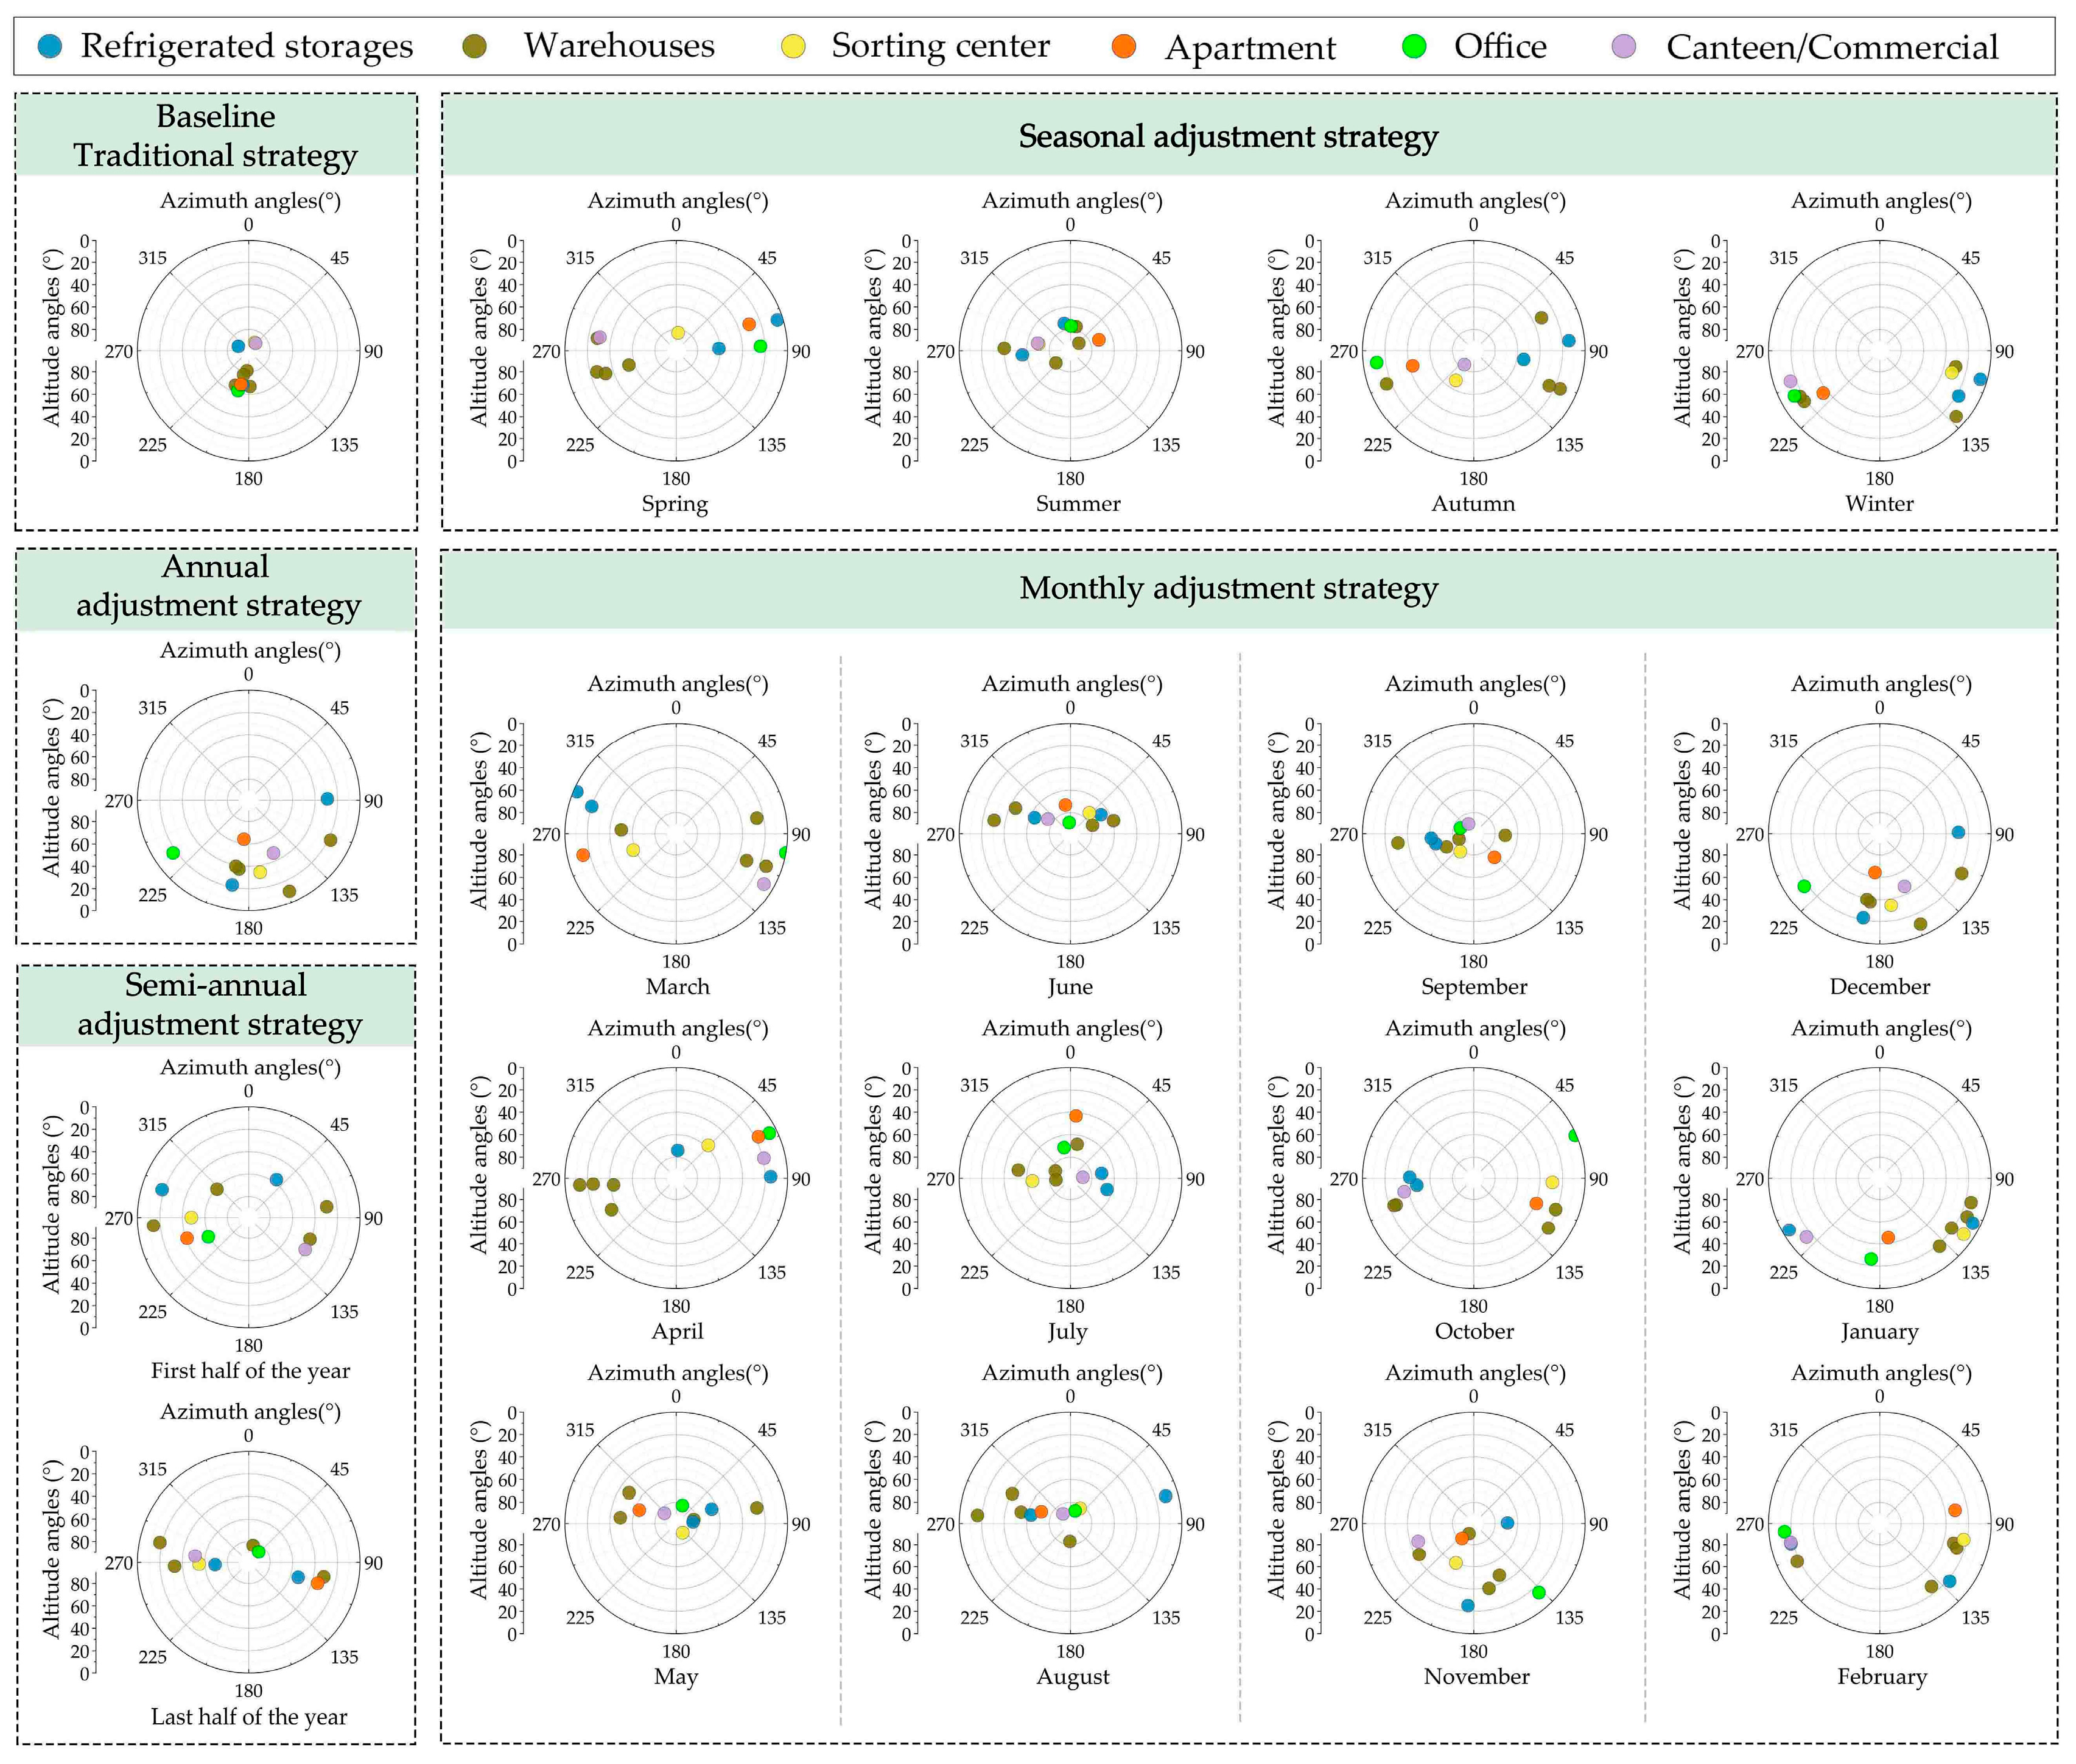
3.2.2. Optimal Angle Values of PV Panels for the Proposed Adjustment Strategies
- (i)
- The optimal angle values when adopting different adjustment strategies
- (ii)
- The optimal angle values across different climatic regions
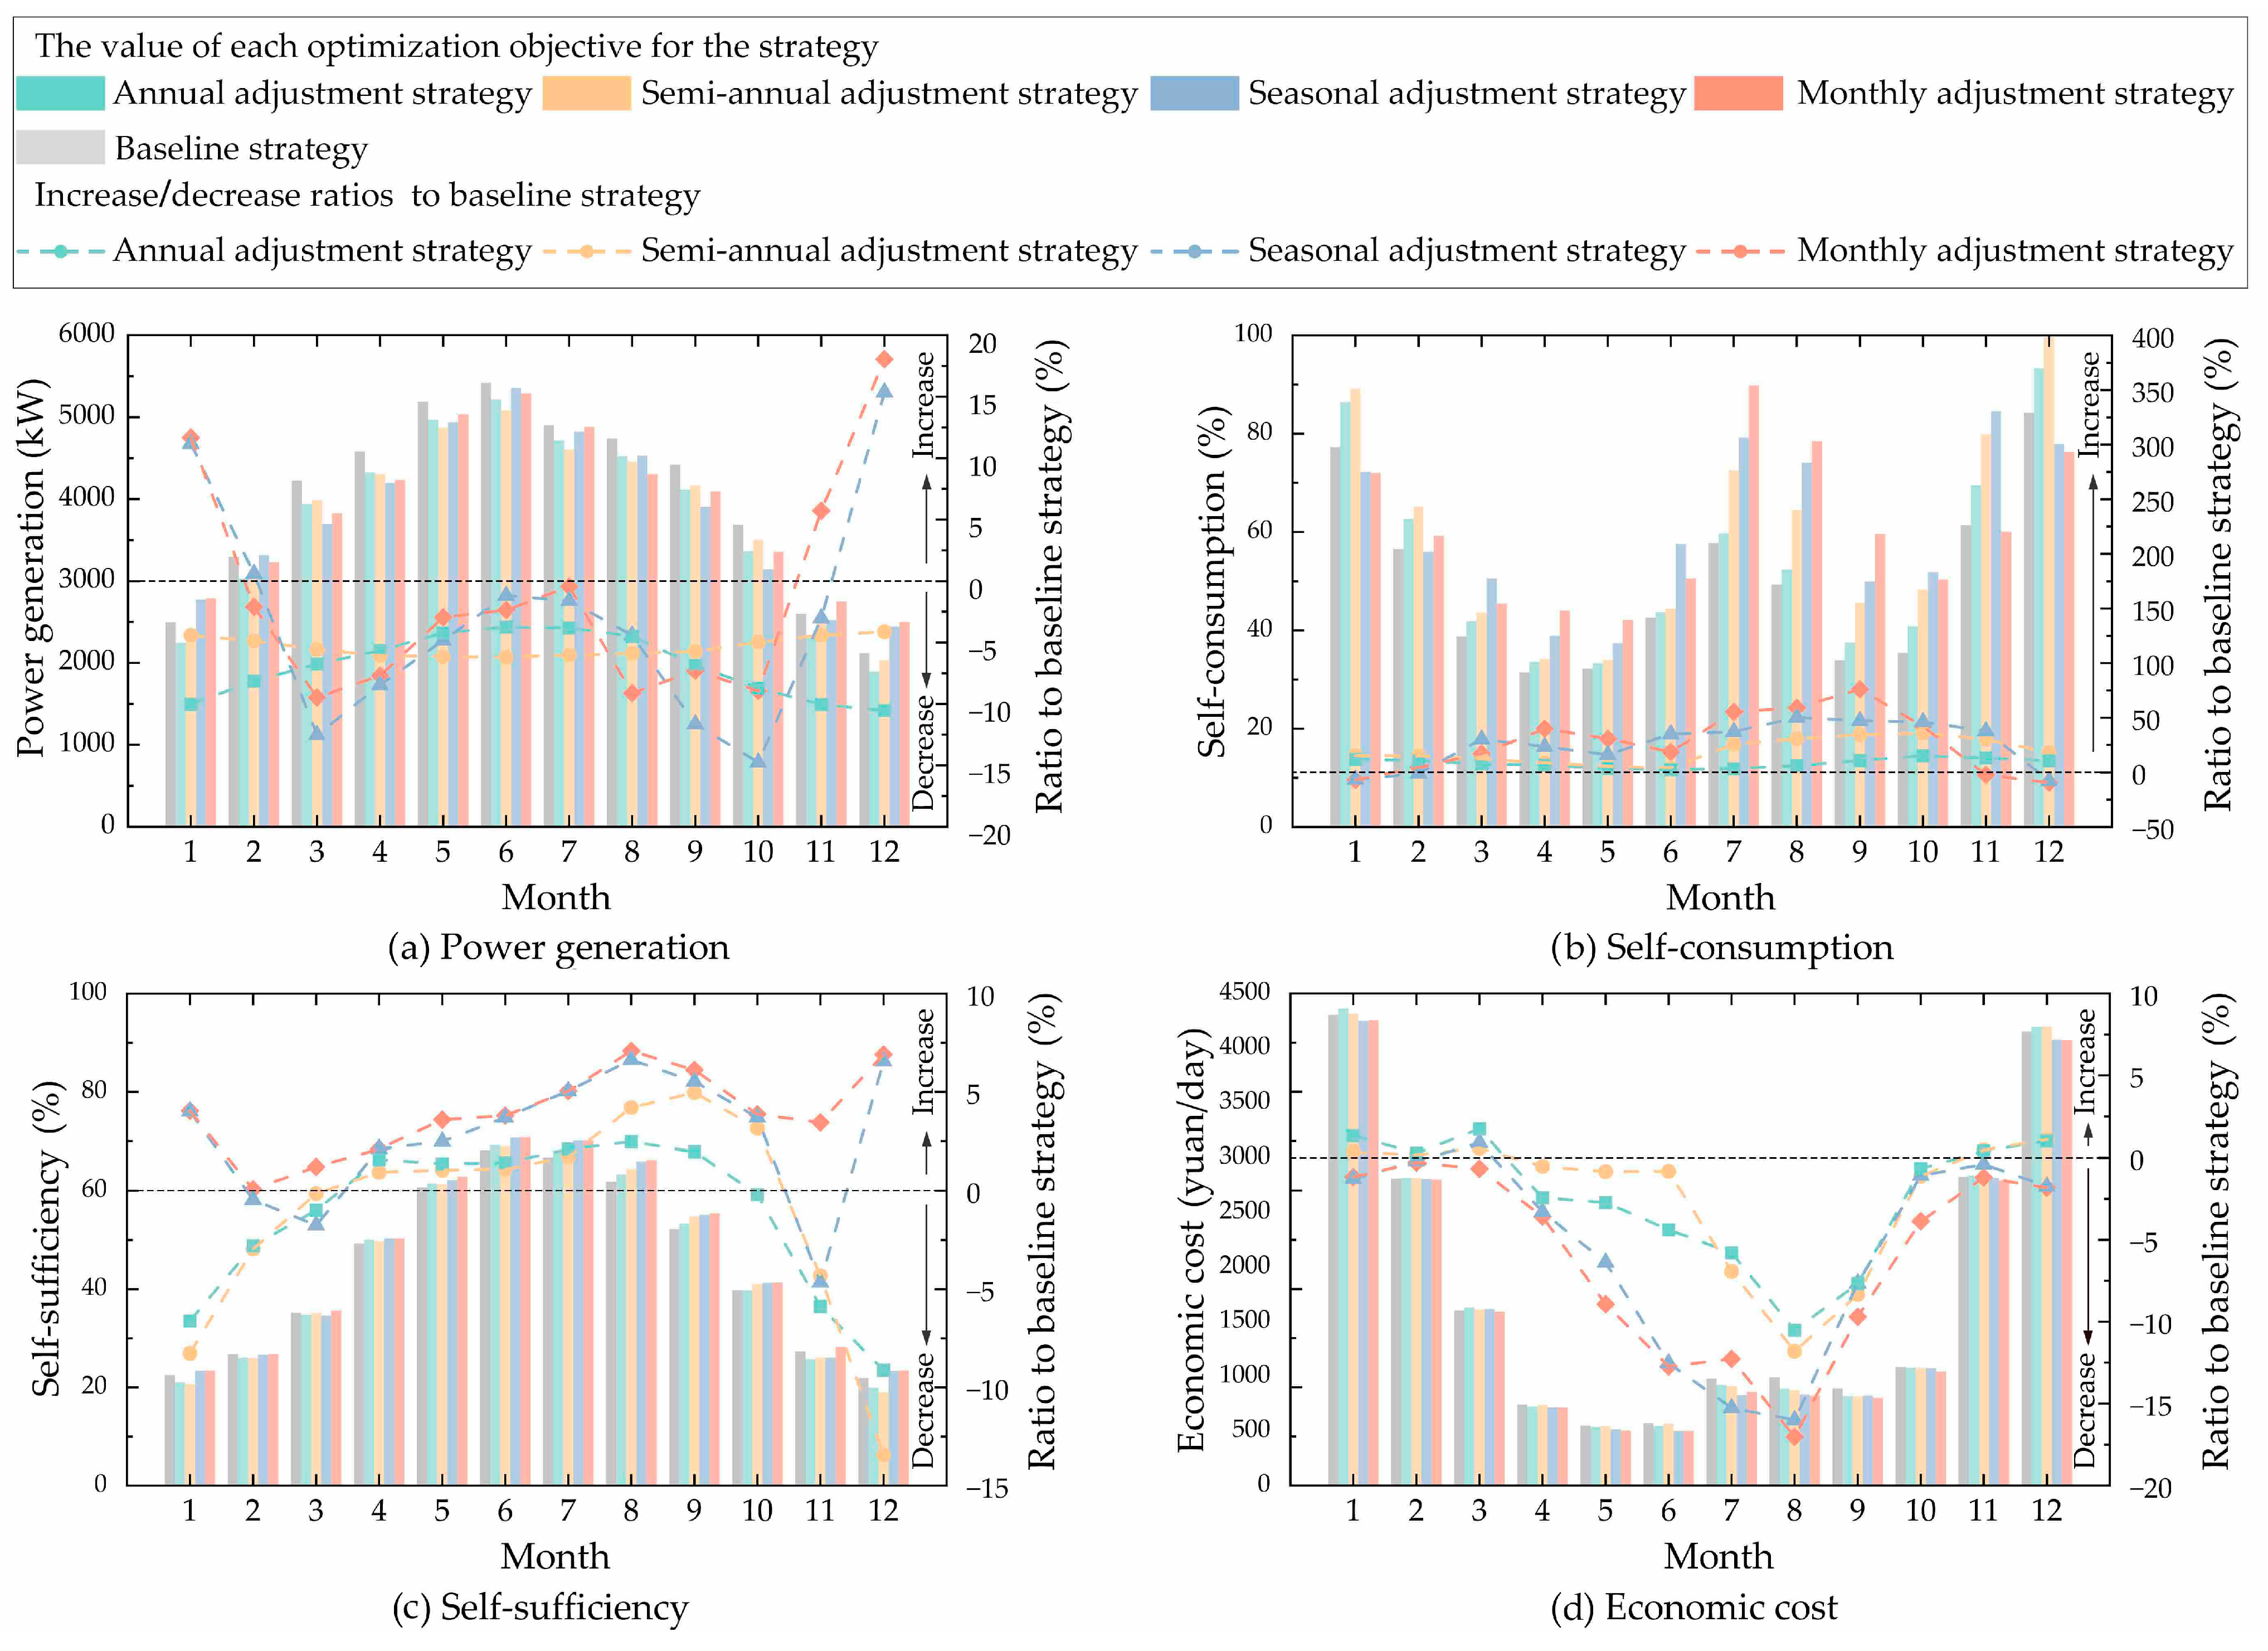
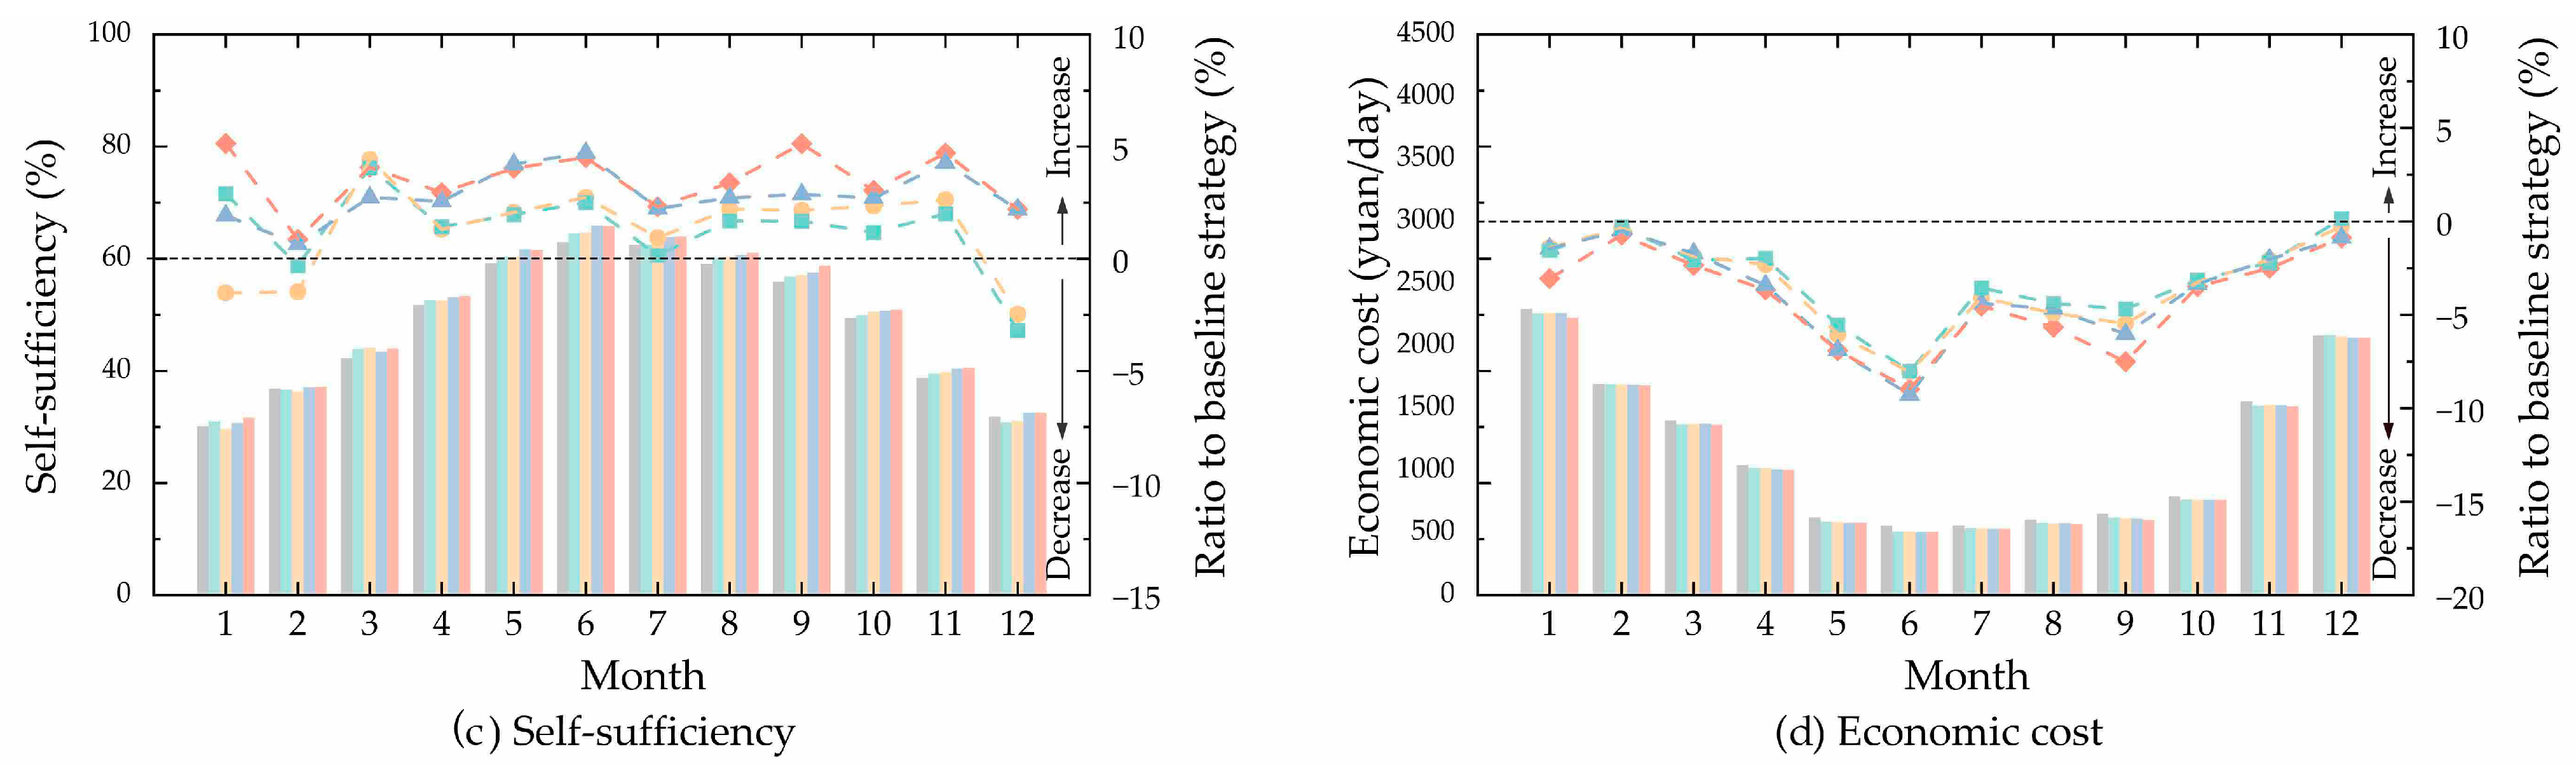
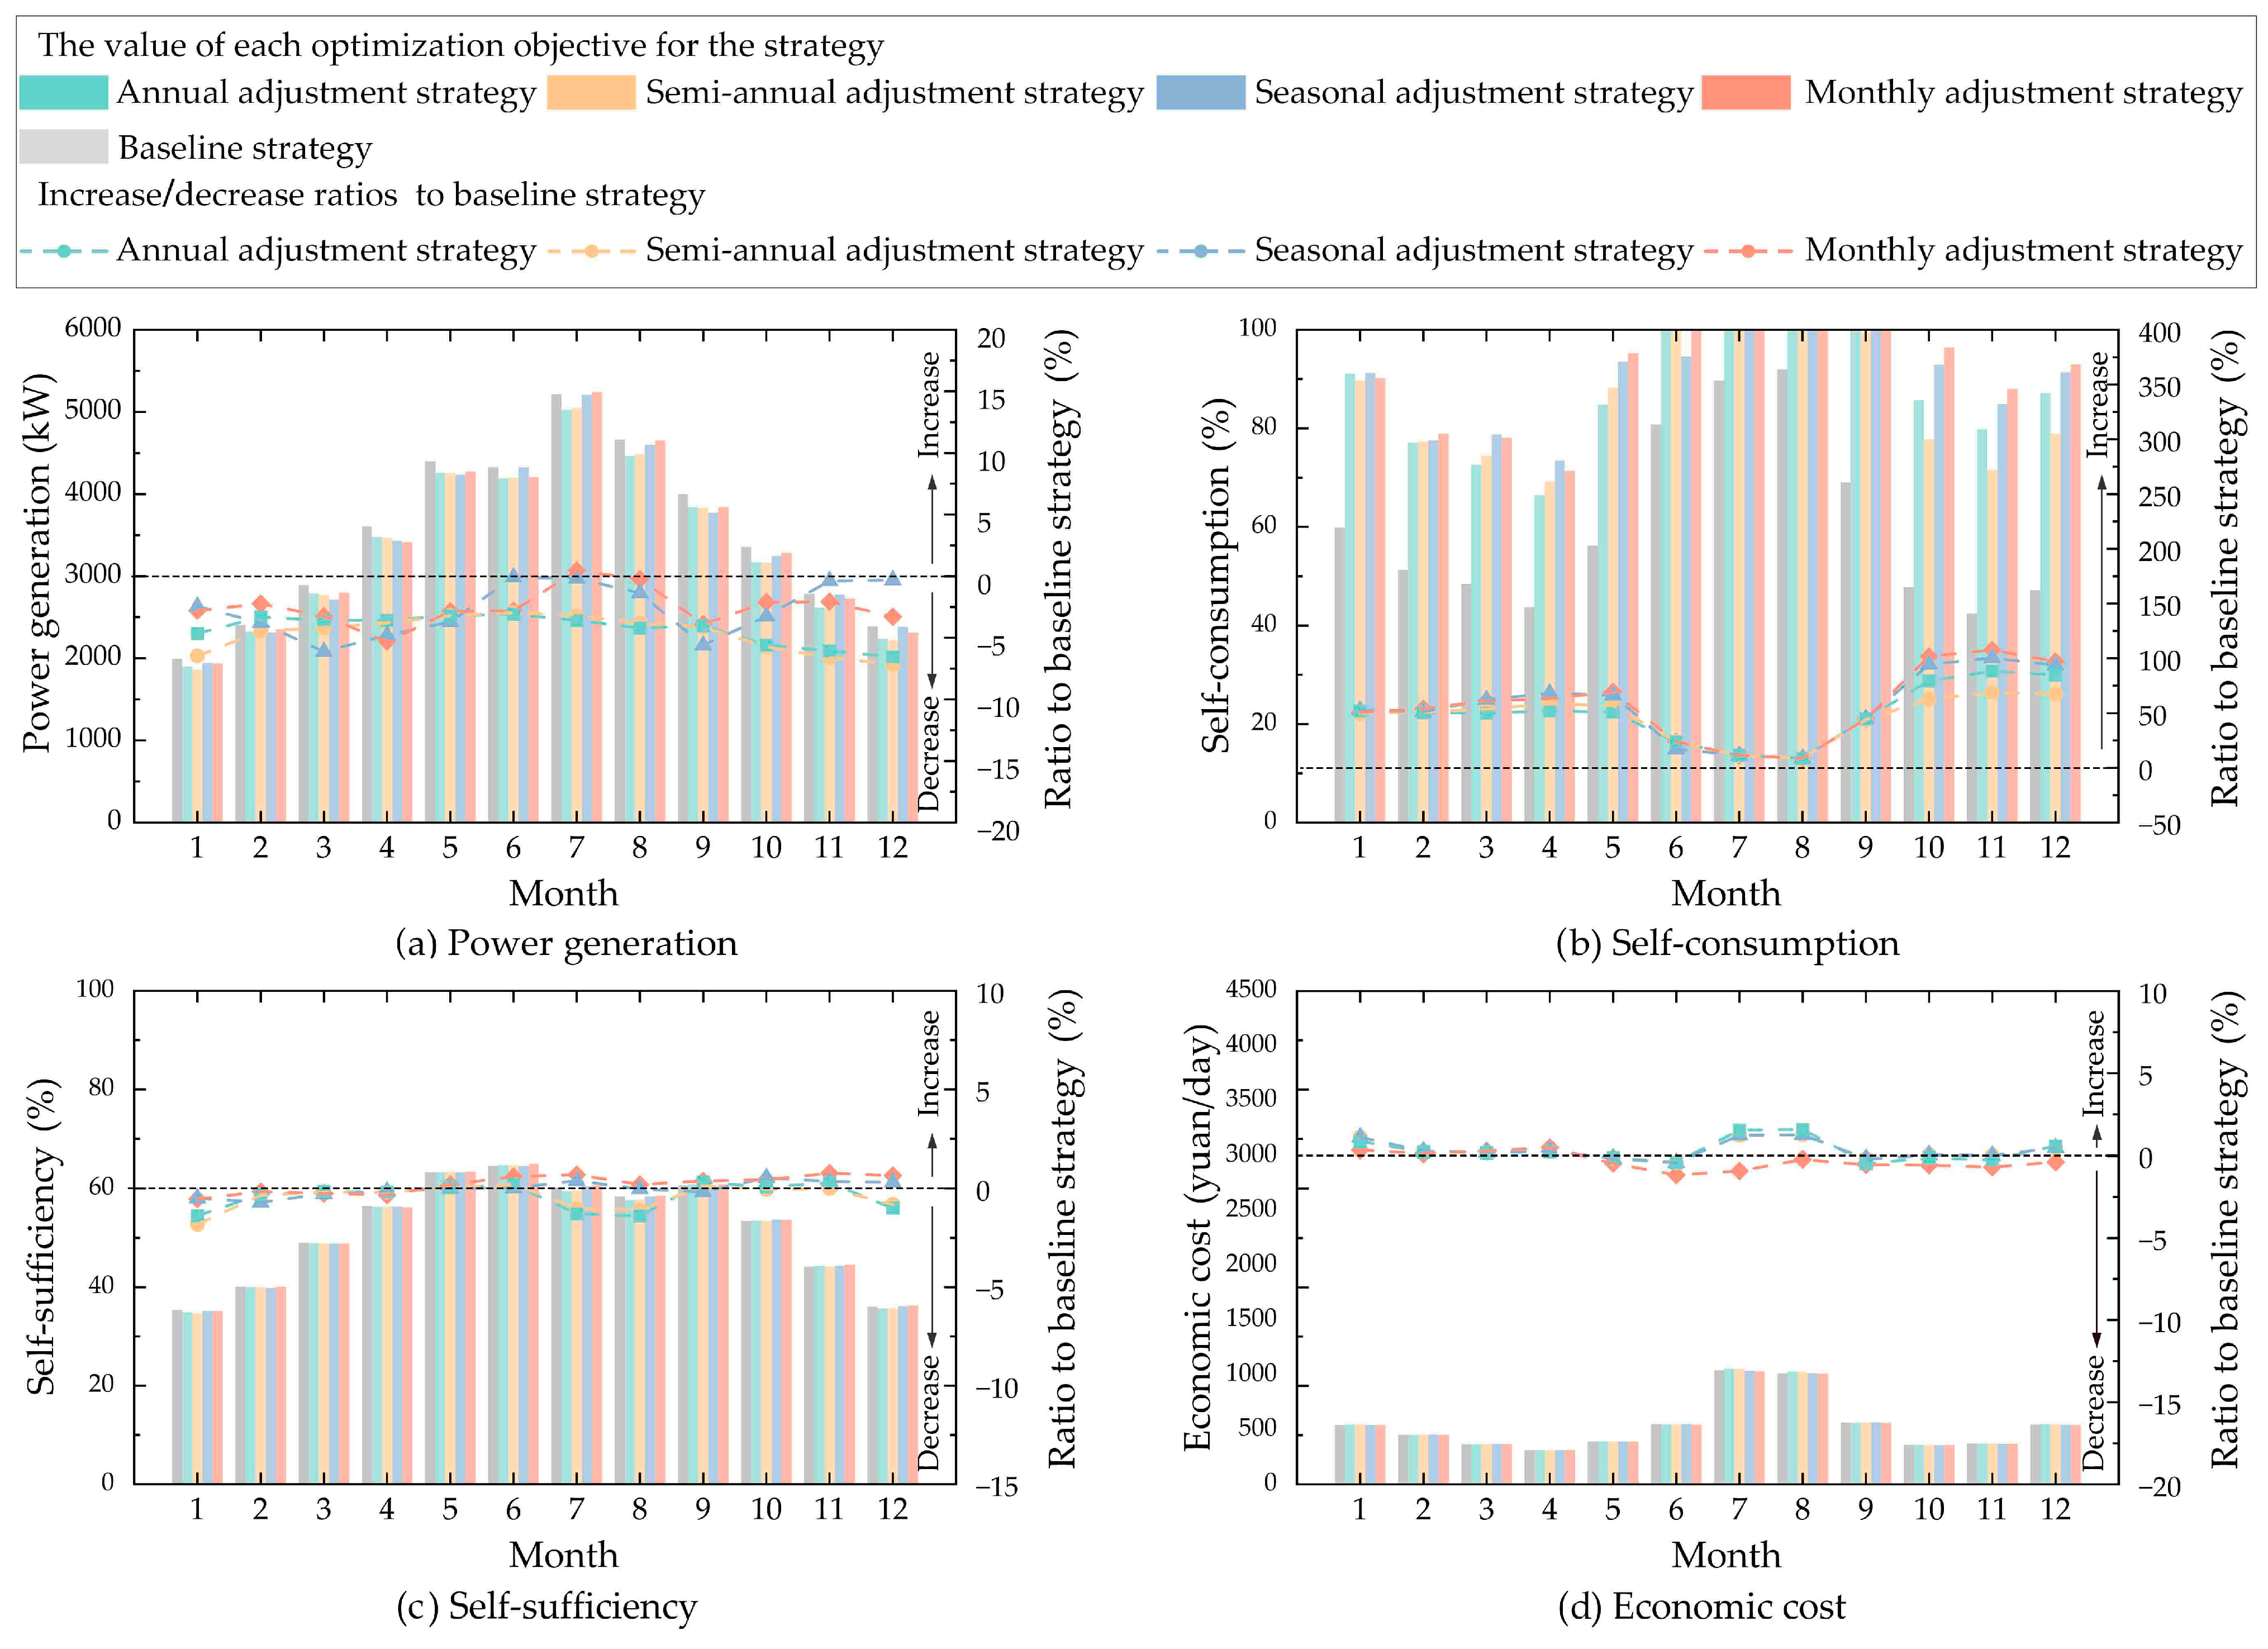
3.3. Optimal Benefits of the Proposed Four Strategies Compared to the Baseline Strategy
- (i)
- The optimal benefits of the four adjustment strategies
- (ii)
- The optimal benefits across different climatic regions
- (iii)
- The optimal benefits on the four optimization objectives
4. Discussions
5. Conclusions
- The proposed four strategies can achieve better performance than the baseline strategy that fixes the PV panel angles on a yearly basis. The monthly adjustment strategy has the best performance, followed by the seasonal strategy, semi-annual strategy, and annual strategy. The performance improvements between the monthly adjustments and seasonal adjustments are finite. In practical applications, seasonal adjustments can be prioritized to minimize the operational and maintenance costs. The decision makers need to weigh the investment costs against the actual benefits to choose more reasonable optimization strategies.
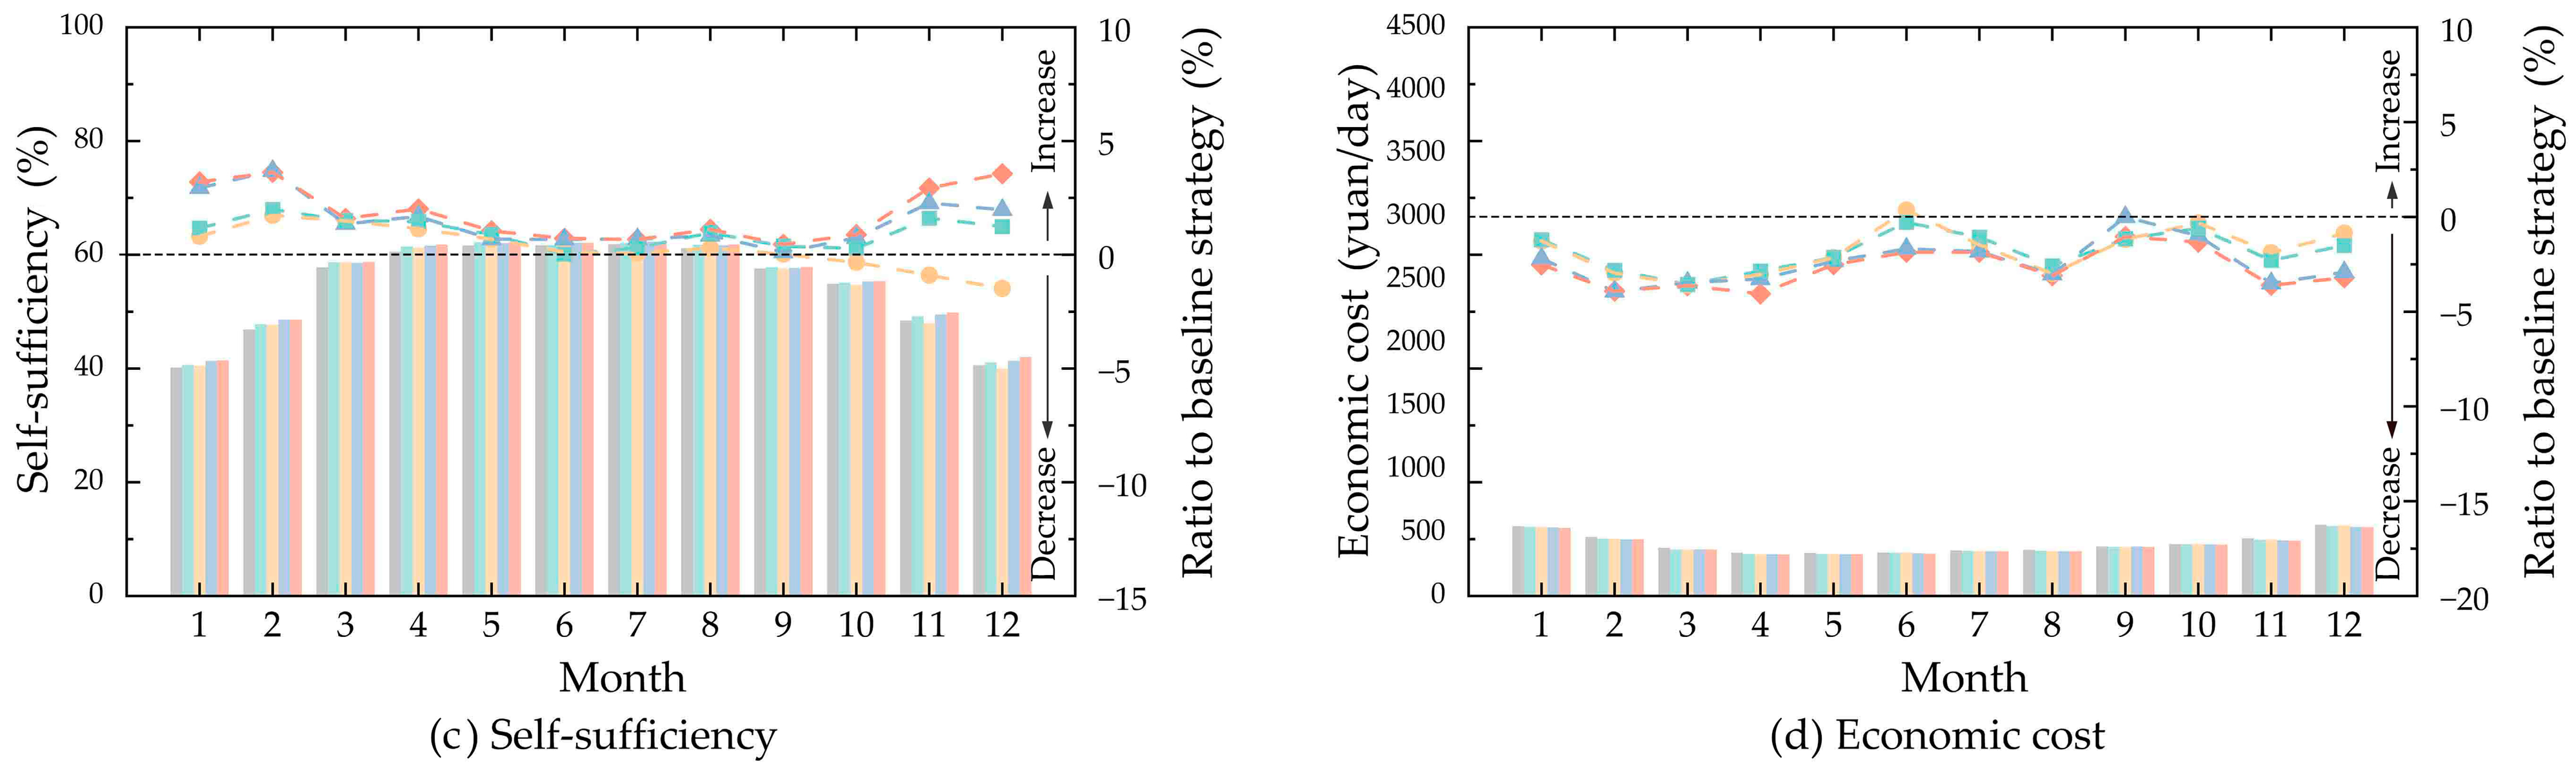
- The proposed four adjustment strategies show the greatest improvement in self-consumption, followed by economic cost, self-sufficiency, and power generation. Applying the proposed four optimized strategies of PV systems in logistics parks, the increase in self-consumption reaches 82.44% to 359.04%, and the reduction in economic costs can run up to 17.02%, compared to the baseline strategy. However, the increase in self-sufficiency and power generation from the proposed optimized strategies is not significant, with growth rates of only 2% to 7%.
- Climatic factors significantly affect the benefits of adjustment strategies. Cold regions with higher solar potential experience greater optimization benefits. In hot regions with lower solar radiation intensity, such as Changsha and Guangzhou, the benefit gaps among the proposed four strategies are relatively small. This means that operators of logistics parks in regions like these can choose the annual strategy or semi-annual strategy to reduce the frequency of adjustment adaptively, in order to balance the costs of regulation and control.
- Climatic factors significantly affect the optimized angle values of PV panels. In hot regions with lower solar radiation intensity, the optimized azimuth angles of PV panels tend to south orientations and the altitude angles tend to higher angles. Specifically, in regions like Guangzhou and Changsha, the optimized PV panels generally face south with an altitude angle between 70° and 90°, while the panels are often oriented east or west with an altitude angle between 20° and 60° in Lhasa.
Author Contributions
Funding
Data Availability Statement
Conflicts of Interest
Nomenclature
| Abbreviation | |||
| PV | Photovoltaic | SS | Self-sufficiency (%) |
| PG | Power generation (kW) | SC | Self-consumption (%) |
| EC | Economic cost (yuan/day) | HVAC | Heating, ventilation and air conditioning |
| Symbol | |||
| Power generation (kW) | max fPG | Maximized power generation | |
| HA | Solar irradiance on the PV panel (kW/m2) | max fSS | Maximized self-sufficiency |
| A | Installation area of PV panel (m2) | max fSC | Maximized self-consumption |
| ηi | Integrated system efficiency (%) | min fEC | Minimized economic cost |
| K | Conversion efficiency (%) | ali | Altitude angles of PV system |
| Power generation consumed on-site (kW) | azi | Azimuth angles of PV system | |
| Total load of the logistics park (kW) | x | The original value | |
| D | Day | x′ | The normalized value |
| Ch | Electricity price (yuan/kW) | min(x) | The minimum value in the solution set |
| w | Weight coefficient | max(x) | The maximum value in the solution set |
References
- Liu, K.; Xu, X.; Huang, W.; Zhang, R.; Kong, L.; Wang, X. A multi-objective optimization framework for designing urban block forms considering daylight, energy consumption, and photovoltaic energy potential. Build. Environ. 2023, 242, 110585. [Google Scholar] [CrossRef]
- Xue, P.; Zhang, R.P.; Cheng, Y.D. High-performance envelope for low-carbon buildings. Build. Simul. 2023, 16, 2207–2209. [Google Scholar] [CrossRef]
- Zhao, W.X.; Li, H.X.; Wang, S.W. A generic design optimization framework for semiconductor cleanroom air-conditioning systems integrating heat recovery and free cooling for enhanced energy performance. Energy 2024, 286, 129600. [Google Scholar] [CrossRef]
- Liu, B.; Su, X.; Shi, J.; Hou, R. Does urbanization drive economic growth decoupled from energy consumption in China’s logistics? J. Clean. Prod. 2020, 257, 120468. [Google Scholar] [CrossRef]
- Yang, J.; Tang, L.; Mi, Z.; Liu, S.; Li, L.; Zheng, J. Carbon emissions performance in logistics at the city level. J. Clean. Prod. 2019, 231, 1258–1266. [Google Scholar] [CrossRef]
- Panagiotidou, M.; Brito, M.C.; Hamza, K.; Jasieniak, J.J.; Zhou, J. Prospects of photovoltaic rooftops, walls and windows at a city to building scale. Sol. Energy 2021, 230, 675–687. [Google Scholar] [CrossRef]
- Feng, X.Y.; Ma, T.; Yamaguchi, Y.; Peng, J.Q.; Dai, Y.J.; Ji, D.X. Potential of residential building integrated photovoltaic systems in different regions of China. Energy Sustain. Dev. 2023, 72, 19–32. [Google Scholar] [CrossRef]
- Wang, J.; Guo, Q.; Sun, H. Planning approach for integrating charging stations and renewable energy sources in low-carbon logistics delivery. Appl. Energy 2024, 372, 123792. [Google Scholar] [CrossRef]
- Ding, B.; Li, Z.; Li, Z.; Xue, Y.; Chang, X.; Su, J.; Jin, X.; Sun, H. A CCP-based distributed cooperative operation strategy for multi-agent energy systems integrated with wind, solar, and buildings. Appl. Energy 2024, 365, 123275. [Google Scholar] [CrossRef]
- Sheikholeslami, M.; Khalili, Z. Investigation of solar photovoltaic-thermoelectric system for building unit in presence of helical tapes and jet impingement of hybrid nanomaterial. J. Build. Eng. 2023, 74, 106871. [Google Scholar] [CrossRef]
- Dezfouli, M.M.S.; Sopian, K.; Kadir, K. Energy and performance analysis of solar solid desiccant cooling systems for energy efficient buildings in tropical regions. Energy Convers. Manag. X 2022, 14, 100186. [Google Scholar] [CrossRef]
- Satpathy, P.R.; Ramachandaramurthy, V.K.; Roslan, M.; Motahhir, S. An adaptive architecture for strategic Enhancement of energy yield in shading sensitive Building-Applied Photovoltaic systems under Real-Time environments. Energy Build. 2024, 324, 114877. [Google Scholar] [CrossRef]
- Zhang, C.; Chen, X.; Feng, Y.; Luo, R. Modeling and functional design of logistic park using IDEFO method. In Proceedings of the 2010 7th International Conference on Service Systems and Service Management, Tokyo, Japan, 28–30 June 2010; pp. 1–5. [Google Scholar] [CrossRef]
- Khoshbakht, M.; Gou, Z.; Dupre, K. Energy use characteristics and benchmarking for higher education buildings. Energy Build. 2018, 164, 61–76. [Google Scholar] [CrossRef]
- Ma, H.; Du, N.; Yu, S.; Lu, W.; Zhang, Z.; Deng, N.; Li, C. Analysis of typical public building energy consumption in northern China. Energy Build. 2017, 136, 139–150. [Google Scholar] [CrossRef]
- Guan, J.; Nord, N.; Chen, S. Energy planning of university campus building complex: Energy usage and coincidental analysis of individual buildings with a case study. Energy Build. 2016, 124, 99–111. [Google Scholar] [CrossRef]
- Chen, S.; Zhang, Z.; Wang, C.; Tan, L.; Liu, H.; Yuan, H.; Zhang, R.; Hu, R. Evaluation Model of Distributed Photovoltaic Utilization in Urban Built-Up Area. Buildings 2024, 14, 943. [Google Scholar] [CrossRef]
- Dewi, T.; Risma, P.; Oktarina, Y. A review of factors affecting the efficiency and output of a PV system applied in tropical climate. IOP Conf. Ser. Earth Environ. Sci. 2019, 258, 012039. [Google Scholar] [CrossRef]
- Venkateswari, R.; Sreejith, S. Factors influencing the efficiency of photovoltaic system. Renew. Sustain. Energy Rev. 2019, 101, 376–394. [Google Scholar] [CrossRef]
- Long, J.; Lu, Z.; Miller, P.A.; Pongratz, J.; Guan, D.; Smith, B.; Zhu, Z.; Xu, J.; Zhang, Q. Large-scale photovoltaic solar farms in the Sahara affect solar power generation potential globally. Commun. Earth Environ. 2024, 5, 11. [Google Scholar] [CrossRef]
- Sepúlveda-Mora, S.B.; Hegedus, S. Making the case for time-of-use electric rates to boost the value of battery storage in commercial buildings with grid connected PV systems. Energy 2021, 218, 119447. [Google Scholar] [CrossRef]
- Aelenei, D.; Lopes, R.A.; Aelenei, L.; Gonçalves, H. Investigating the potential for energy flexibility in an office building with a vertical BIPV and a PV roof system. Renew. Energy 2019, 137, 189–197. [Google Scholar] [CrossRef]
- Machidon, D.; Istrate, M. Tilt Angle Adjustment for Incident Solar Energy Increase: A Case Study for Europe. Sustainability 2023, 15, 7015. [Google Scholar] [CrossRef]
- Alqaed, S.; Mustafa, J.; Almehmadi, F.A.; Jamil, B. Estimation of ideal tilt angle for solar-PV panel surfaces facing south: A case study for Najran City, Saudi Arabia. J. Therm. Anal. Calorim. 2022, 148, 8641–8654. [Google Scholar] [CrossRef]
- Liu, Y.; Yao, L.; Jiang, H.; Lu, N.; Qin, J.; Liu, T.; Zhou, C. Spatial estimation of the optimum PV tilt angles in China by incorporating ground with satellite data. Renew. Energy 2022, 189, 1249–1258. [Google Scholar] [CrossRef]
- Kurdi, Y.; Alkhatatbeh, B.J.; Asadi, S. The role of demand energy profile on the optimum layout of photovoltaic system in commercial buildings. Energy Build. 2022, 271, 112320. [Google Scholar] [CrossRef]
- Liu, C.; Xu, W.; Li, A.; Sun, D.; Huo, H. Analysis and optimization of load matching in photovoltaic systems for zero energy buildings in different climate zones of China. J. Clean. Prod. 2019, 238, 117914. [Google Scholar] [CrossRef]
- Hassan, Q.; Jaszczur, M. Self-Consumption and Self-Sufficiency Improvement for Photovoltaic System Integrated with Ultra-Supercapacitor. Energies 2021, 14, 7888. [Google Scholar] [CrossRef]
- Zhang, W.; Zhao, Y.; Huang, F.; Zhong, Y.; Zhou, J. Forecasting the Energy and Economic Benefits of Photovoltaic Technology in China’s Rural Areas. Sustainability 2021, 13, 8408. [Google Scholar] [CrossRef]
- ANSI/ASHRAE/IES Standard 90.1-2019; Energy Standard for Buildings Except Low-Rise Residential Buildings. ASHRAE: Peachtree Corners, GA, USA, 2020.
- Solargis. Available online: https://apps.solargis.com/home/ (accessed on 6 November 2024).
- Crawley, D.B.; Lawrie, L.K.; Winkelmann, F.C.; Buhl, W.; Huang, Y.; Pedersen, C.O.; Strand, R.K.; Liesen, R.J.; Fisher, D.E.; Witte, M.J.; et al. EnergyPlus: Creating a new-generation building energy simulation program. Energy Build. 2001, 33, 319–331. [Google Scholar] [CrossRef]
- Naboni, E.; Natanian, J.; Brizzi, G.; Florio, P.; Chokhachian, A.; Galanos, T.; Rastogi, P. A digital workflow to quantify regenerative urban design in the context of a changing climate. Renew. Sustain. Energy Rev. 2019, 113, 109255. [Google Scholar] [CrossRef]
- Li, J.; Wang, Y.; Xia, Y.; Song, Y.; Xie, H. Optimization of Urban Block Form by Adding New Volumes for Capacity Improvement and Solar Performance Using A Multi-Objective Genetic Algorithm: A Case Study of Nanjing. Buildings 2022, 12, 1710. [Google Scholar] [CrossRef]
- Liu, K.; Xu, X.; Zhang, R.; Kong, L.; Wang, W.; Deng, W. Impact of urban form on building energy consumption and solar energy potential: A case study of residential blocks in Jianhu, China. Energy Build. 2023, 280, 112727. [Google Scholar] [CrossRef]
- Sinsomboonthong, S. Performance Comparison of New Adjusted Min-Max with Decimal Scaling and Statistical Column Normalization Methods for Artificial Neural Network Classification. Int. J. Math. Math. Sci. 2022, 2022, 3584406. [Google Scholar] [CrossRef]
- Ezell, B.; Lynch, C.J.; Hester, P.T. Methods for Weighting Decisions to Assist Modelers and Decision Analysts: A Review of Ratio Assignment and Approximate Techniques. Appl. Sci. 2021, 11, 10397. [Google Scholar] [CrossRef]
- Abdallah, R.; Juaidi, A.; Abdel-Fattah, S.; Manzano-Agugliaro, F. Estimating the Optimum Tilt Angles for South-Facing Surfaces in Palestine. Energies 2020, 13, 623. [Google Scholar] [CrossRef]
- Bawazir, R.O.; Cetin, N.S. Comprehensive overview of optimizing PV-DG allocation in power system and solar energy resource potential assessments. Energy Rep. 2020, 6, 173–208. [Google Scholar] [CrossRef]
- Gönül, Ö.; Duman, A.C.; Barutçu, B.; Güler, Ö. Techno-economic analysis of PV systems with manually adjustable tilt mechanisms. Eng. Sci. Technol. Int. J. 2022, 35, 101116. [Google Scholar] [CrossRef]
- Liu, J.; Chen, X.; Yang, H.; Li, Y. Energy storage and management system design optimization for a photovoltaic integrated low-energy building. Energy 2020, 190, 116424. [Google Scholar] [CrossRef]


| Building Type | Number of Floors | Floor Height/m | Window to Wall Ratio | Floor Area/m2 | Building Aspect Ratio | PV Panel Installation Area/m2 |
|---|---|---|---|---|---|---|
| Refrigerated storage | 1 | 8.0 | 0.00 | 600 | 2.50 | 480 |
| Sorting center | 1 | 6.0 | 0.15 | 1000 | 1.60 | 800 |
| Warehouse | 1 | 6.0 | 0.15 | 600 | 2.50 | 480 |
| Apartment | 2 | 3.2 | 0.40 | 750 | 4.50 | 600 |
| Office | 2 | 3.5 | 0.40 | 400 | 4.50 | 320 |
| Commercial | 1 | 4.0 | 0.40 | 500 | 1.80 | 0 |
| Canteen | 2 | 4.0 | 0.40 | 500 | 1.80 | 400 |
| City | Climatic Region in China | Average Summer Temperature | Average Winter Temperature | Sunshine Duration |
|---|---|---|---|---|
| Harbin | Severe cold region | 23.6 °C | −15.6 °C | 2480 h |
| Lhasa | Cold region | 15.7 °C | −2.0 °C | 2955 h |
| Changsha | Hot summer and cold winter region | 29.5 °C | 4.6 °C | 1484 h |
| Guangzhou | Hot summer and warm winter region | 28.4 °C | 13.0 °C | 1659 h |
| Kunming | Mild region | 20.1 °C | 9.7 °C | 2200 h |
| Parameter | Setting | |||||
|---|---|---|---|---|---|---|
| Climate Data | EPW Files are from EnergyPlus website | |||||
| Simulation Period | 1 July–31 December, Hourly simulation | |||||
| Construction | Harbin | Lhasa | Changsha | Guangzhou | Kunming | |
| Wall | Refrigerated storage | R = 8.33 m2·K/W | R = 6.67 m2·K/W | R = 10.00 m2·K/W | R = 10.00 m2·K/W | R = 8.33 m2·K/W |
| Warehouse /sorting center | R = 2.00 m2·K/W | R = 1.43 m2·K/W | R = 1.25 m2·K/W | R = 0.67 m2·K/W | R = 0.91 m2·K/W | |
| Apartment | R = 4.00 m2·K/W | R = 2.86 m2·K/W | R = 1.67 m2·K/W | R = 1.43 m2·K/W | R = 1.67 m2·K/W | |
| Office/commercial/canteen | R = 2.86 m2·K/W | R = 2.00 m2·K/W | R = 1.67 m2·K/W | R = 1.43 m2·K/W | R = 1.25 m2·K/W | |
| Roof | Refrigerated storage | R = 8.33 m2·K/W | R = 6.67 m2·K/W | R = 10 m2·K/W | R = 10 m2·K/W | R = 8.33 m2·K/W |
| Warehouse /sorting center | R = 2.50 m2·K/W | R = 1.67 m2·K/W | R = 1.43 m2·K/W | R = 1.12 m2·K/W | R = 1.43 m2·K/W | |
| Apartment | R = 6.7 m2·K/W | R = 4 m2·K/W | R = 2.5 m2·K/W | R = 2.5 m2·K/W | R = 2.5 m2·K/W | |
| Office/commercial/canteen | R = 4 m2·K/W | R = 2.5 m2·K/W | R = 2.5 m2·K/W | R = 2.5 m2·K/W | R = 2 m2·K/W | |
| Floor | Refrigerated storage | R = 8.33 m2·K/W | R = 6.67 m2·K/W | R = 10 m2·K/W | R = 10 m2·K/W | R = 8.33 m2·K/W |
| Warehouse /sorting center | R = 2.5 m2·K/W | R = 1.67 m2·K/W | R = 1.43 m2·K/W | R = 1.12 m2·K/W | R = 1.43 m2·K/W | |
| Apartment | R = 2.86 m2·K/W | R = 2 m2·K/W | R = 2.5 m2·K/W | R = 2 m2·K/W | R = 2.5 m2·K/W | |
| Office/commercial/canteen | R = 2 m2·K/W | R = 1 m2·K/W | R = 2.5 m2·K/W | R = 2.5 m2·K/W | R = 1.5 m2·K/W | |
| Window | Warehouse /sorting center | U = 3.0 W/m2·K SHGC = 0.4 | U = 4.0 W/m2·K SHGC = 0.4 | U = 4.5 W/m2·K SHGC = 0.4 | U = 5.0 W/m2·K SHGC = 0.35 | U = 4.5 W/m2·K SHGC = 0.35 |
| Apartment | U = 2.0 W/m2·K SHGC = 0.4 | U = 2.5 W/m2·K SHGC = 0.4 | U = 2.5 W/m2·K SHGC = 0.4 | U = 2.5 W/m2·K SHGC = 0.35 | U = 3.2 W/m2·K SHGC = 0.35 | |
| Office/commercial/canteen | U = 2.5 W/m2·K SHGC = 0.4 | U = 2.7 W/m2·K SHGC = 0.4 | U = 3.0 W/m2·K SHGC = 0.4 | U = 4.0 W/m2·K SHGC = 0.35 | U = 3.0 W/m2·K SHGC = 0.35 | |
| Building Type | Refrigerated Storage | Warehouse | Sorting Center | Apartment | Office | Commercial | Carteen | |
|---|---|---|---|---|---|---|---|---|
| Indoor load | Density people/m2 | 0 | 0 | 0.05 | 0.028 | 0.05 | 0.086 | 0 |
| Active level W/person | 0 | 0 | 120 | 95 | 120 | 120 | 0 | |
| Lighting W/m2 | 3.55 | 3.55 | 3.55 | 9.36 | 7.97 | 11.3 | 6.46 | |
| Infiltration m3/(s·m2) | 0.00023 | 0.00023 | 0.00023 | 0.00057 | 0.00022 | 0.00023 | 0.00057 | |
| Equipment W/m2 | 2.55 | 2.55 | 2.55 | 6.67 | 9.36 | 10.98 | 116.79 | |
| HVAC | Heating setpoint | – | 0 °C | 16 °C | 18 °C | 20 °C | 18 °C | 18 °C |
| Cooling setpoint | −25 °C | – | 28 °C | 26 °C | 26 °C | 26 °C | 26 °C | |
| Climatic Region | Angle | Refrigerated Storage | Warehouse | Sorting Center | Office | Apartment | Canteen | ||||
|---|---|---|---|---|---|---|---|---|---|---|---|
| Severe cold region | Azimuth angle/° | 295 | 349 | 2 | 253 | 308 | 267 | 249 | 258 | 280 | 323 |
| Altitude angle/° | 7 | 22 | 7 | 22 | 13 | 5 | 71 | 87 | 2 | 27 | |
| Cold region | Azimuth angle, ° | 28 | 84 | 270 | 66 | 279 | 269 | 60 | 286 | 353 | 296 |
| Altitude angle, ° | 14 | 39 | 28 | 12 | 43 | 15 | 20 | 9 | 25 | 23 | |
| Hot summer and cold winter region | Azimuth angle, ° | 4 | 72 | 277 | 303 | 308 | 61 | 56 | 341 | 354 | 12 |
| Altitude angle, ° | 71 | 85 | 89 | 78 | 79 | 87 | 90 | 85 | 83 | 80 | |
| Hot summer and warm winter region | Azimuth angle, ° | 36 | 33 | 299 | 122 | 137 | 354 | 30 | 277 | 47 | 19 |
| Altitude angle, ° | 87 | 87 | 90 | 90 | 90 | 88 | 87 | 90 | 85 | 88 | |
| Mild region | Azimuth angle, ° | 95 | 302 | 317 | 315 | 9 | 241 | 188 | 358 | 62 | 87 |
| Altitude angle, ° | 1 | 4 | 3 | 36 | 4 | 1 | 4 | 17 | 33 | 5 | |
Disclaimer/Publisher’s Note: The statements, opinions and data contained in all publications are solely those of the individual author(s) and contributor(s) and not of MDPI and/or the editor(s). MDPI and/or the editor(s) disclaim responsibility for any injury to people or property resulting from any ideas, methods, instructions or products referred to in the content. |
© 2025 by the authors. Licensee MDPI, Basel, Switzerland. This article is an open access article distributed under the terms and conditions of the Creative Commons Attribution (CC BY) license (https://creativecommons.org/licenses/by/4.0/).
Share and Cite
Peng, K.; Ma, M.; Zhao, W.; Zhang, R. Multi-Criteria Optimal Operation Strategy for Photovoltaic Systems in Large-Scale Logistics Parks Concerning Climate Impact. Buildings 2025, 15, 377. https://doi.org/10.3390/buildings15030377
Peng K, Ma M, Zhao W, Zhang R. Multi-Criteria Optimal Operation Strategy for Photovoltaic Systems in Large-Scale Logistics Parks Concerning Climate Impact. Buildings. 2025; 15(3):377. https://doi.org/10.3390/buildings15030377
Chicago/Turabian StylePeng, Kai, Mingzhu Ma, Wenxuan Zhao, and Rongpeng Zhang. 2025. "Multi-Criteria Optimal Operation Strategy for Photovoltaic Systems in Large-Scale Logistics Parks Concerning Climate Impact" Buildings 15, no. 3: 377. https://doi.org/10.3390/buildings15030377
APA StylePeng, K., Ma, M., Zhao, W., & Zhang, R. (2025). Multi-Criteria Optimal Operation Strategy for Photovoltaic Systems in Large-Scale Logistics Parks Concerning Climate Impact. Buildings, 15(3), 377. https://doi.org/10.3390/buildings15030377