Abstract
Split reinforced concrete column (SRCC), recognized for their exceptional ductility as seismic members, have faced developmental challenges due to the complexities of on-site casting. This study presents an innovative steel sleeve dry connection assembled SRCC, which is highly modular and simplifies construction, aiming to promote the engineering application of this innovative ductile seismic structural system. This study used a validated 3D finite element (FE) method to analyze internal joint forces. Key parameters influencing joint performance, such as the axial compression ratio (u) and cross-sectional equal division ratio (n), were analyzed in detail. Subsequently, a comparative of dynamic analysis of SRCC and normal reinforced concrete column (NRCC) frames was conducted, leading to recommendations for structural strengthening. The analysis revealed that the sleeve can provide effective protection for the core area of the joint. The ductility of SRCC is 2–3 times higher than that of NRCC. A detailed formula for calculating the shear-bearing capacity of SRCC joints was derived, showing strong agreement with numerical simulations. At a high seismic intensity of 9°, the acceleration response of the SRCC frame is significantly reduced compared to the NRCC frame, with the maximum base shear (MBS) decreasing by approximately 4 times, which significantly enhances its seismic performance. However, due to the larger inter-story displacements, it is necessary to incorporate energy-dissipating braces to comply with code requirements. Collectively, these findings underscored that the proposed SRCC system significantly enhances seismic performance by improving ductility and energy dissipation, providing a robust foundation for future studies and practical applications in seismic design.
1. Introduction
Reinforced concrete (RC) frames are the most commonly employed structural configuration. Seismic damage surveys and model experiments have shown that the lack of ductility in frame columns is a major factor leading to seismic damage in reinforced concrete frame structures. In the event of infrequent earthquakes, the insufficient ability of columns to deform between floors can result in the complete failure of structures. This poses a significant risk to the safety of individuals and undermines the effectiveness of the seismic design objective of “withstanding major earthquakes without collapsing” [1,2]. Seismic damping is categorized into seismic source isolation, propagation isolation [3,4], and the inherent seismic resistance of the structure [5,6,7]. The initial two measures frequently lack target specificity and exhibit a degree of uncertainty. In contrast, enhancing the ductility of the frame columns is a crucial approach to directly augmenting the seismic performance of the structure, holding substantial significance.
Current methods to improve the ductility of RC frame columns include the following: (1) enhancing the confinement of concrete in the core area to improve its plasticity [8,9]; (2) applying external wrapping restraints such as steel tube concrete and CFRP reinforcement to transform the damage pattern into plastic damage [10,11,12,13,14]; and (3) employing high-strength materials like ultra-high-performance concrete (UHPC) to reduce the axial pressure ratio [15]. Generally, these approaches aim to enhance the material plasticity of concrete through increased three-dimensional confinement. However, it is well known that strength and plasticity are often mutually exclusive properties in materials, limiting the extent to which material plasticity can improve the ductility of structural members.
Metamaterials are advanced engineered materials with periodic structures that transcend the limitations of conventional materials, showcasing exceptional performance and promising applications in engineering [16,17]. These materials can manipulate wave propagation, creating band gaps that block specific frequencies, thereby enhancing structural design techniques [18,19]. Inspired by these principles, the split column technique was developed, utilizing natural fractal [20,21,22,23] and periodic behaviors to improve the ductility and seismic performance of reinforced concrete columns. An SRCC is defined as the splitting of a NRCC into multiple small columns of equal cross-sections outside the joint’s core area, as illustrated in Figure 1b. Figure 1c presents the relationship between the lateral shift resistance stiffness of a SRCC and that of a NRCC. The trend of the stiffness ratio between the two is shown in Figure 1d. For frame columns with a conventional shear-span ratio (λ) > 2, their lateral displacement stiffness decreases approximately with the cross-sectional equal division ratio (n) by a factor of the square, thereby significantly increasing the lateral deformation capacity. Since the cross-sectional area remains unchanged, the SRCC’s vertical load-carrying capacity is essentially unaltered. In this case, the improvement in its lateral deformation capacity translates to an indirect enhancement of the frame column’s ductility under horizontal loads. As a result, the SRCC can be considered a method of enhancing column ductility at the structural, in contrast to the aforementioned method of improving column ductility at the material level [24].
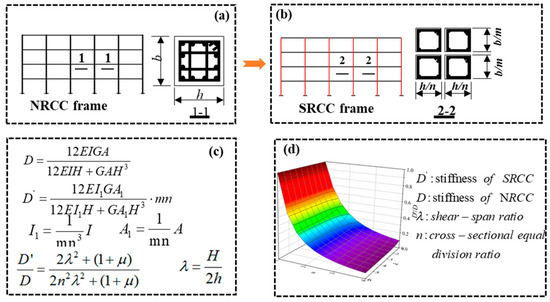
Figure 1.
Schematic diagram of the anti-seismic and energy-dissipating mechanism of the SRCC frame: (a) simplified schematic of the NRCC frame; (b) simplified schematic of the SRCC frame; (c) equation for deriving the stiffness between the SRCC and the NRCC; (d) ratio of stiffness of the SRCC to that of the NRCC. Note: For the meaning of the symbols in the (c), see nomenclature.
In recent years, extensive research has yielded significant insights into the behavior and advantages of SRCCs. Li and Hao validated the relevant theoretical analysis through a systematic experimental study, demonstrating that the seismic ductility and energy dissipation capacity of SRCC frames were remarkably improved compared with NRCC frames [25,26,27,28]. Due to their favorable deformation capacity, SRCCs were studied and applied in mitigating seismic damage to columns in subway stations [29,30]. Consequently, it is anticipated that the SRCC frames will evolve into a high-ductility seismic structure. Although reduced lateral stiffness may result in excessive inter-story displacement, these issues can be mitigated by using replaceable energy-consuming bracing, putting up multiple seismic defenses, and controlling inter-story movement. In conclusion, the SRCC structure represents an innovative seismic system that warrants comprehensive and in-depth investigation. In conventional cast-in-place construction, implementing SRCCs poses substantial challenges due to complexities in formwork fabrication, reinforcement tying, and concrete vibration, among other factors. These challenges have led to a near stagnation in research and application over the past few years. In the context of the ongoing industrialization of the construction industry, these limitations are expected to be overcome.
This study proposed a fully dry-connected steel sleeve joint assembled SRCC, wherein standard-size small cross-section columns are prefabricated in a factory setting and subsequently inserted into the corresponding compartments of the steel sleeves in the field, where they are assembled into RC-framed columns of various cross-sectional sizes. This assembled column can be utilized to enhance the standardization rate of prefabricated components, simultaneously reducing the self-weight of individual assembled components and facilitating installation. Additionally, the presence of steel sleeves in the node area facilitates the connection of nodes to the frame beams using various types of steel frame joint connections, such as short bull legs that extend outward and energy-dissipating artificial hinges [31,32,33]. A schematic diagram of the assembly process is provided in Figure 2.
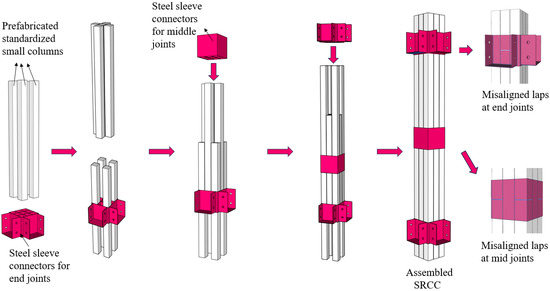
Figure 2.
Schematic diagram of prefabricated SRCC.
The mechanical properties of joints in assembled structures are crucial in determining the structural performance, particularly when considering different configurations [34,35,36,37]. The joint stress performance of the SRCC frame with a steel sleeve connection, shown in Figure 2, is a key part of figuring out how well this structure will hold up against horizontal earthquakes. Furthermore, the dynamic behavior of the frame structure is also important [38,39,40,41].
This study employed a three-dimensional finite element (FE) analysis method, rigorously validated by experimental data, to investigate the internal force distribution within joints. Furthermore, it conducts a comprehensive analysis of relevant joint parameters and derives a novel formula for calculating shear-bearing capacity. Using the time history analysis method, this study explored the inter-story drift angle (ISDA), acceleration response, and maximum base shear (MBS) of the SRCC frame under different intensity actions. The objective of this study was to investigate the mechanical characteristics of SRCC joints with sleeve dry connections and seismic performance of the SRCC frame to establish a theoretical basis for future research in this area.
2. Methodology Validation
2.1. Overview of the Test
Li et al. conducted an experimental study on the seismic behavior of connections in cast-in-place SRCC frame beam–column joints. Figure 3 depicts the experimental setup and loading system [27]. The experiment utilized four different types of frame joint components: J1 (NRCC), J2 (upper part is an NRCC and lower part is an SRCC), J3 (SRCC with a transitional section), and J4 (SRCC without a transitional section). To verify the accuracy and reliability of the numerical analysis model and parameters, this study replicated the mechanical performance of components J1 to J4 by ABAQUS CAE 2022, as outlined in reference [27].
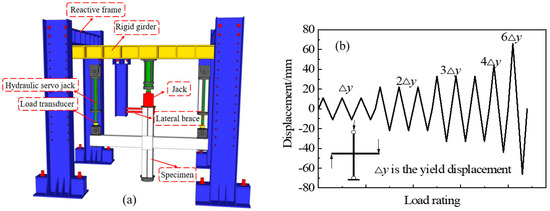
Figure 3.
Experimental setup: (a) Test setup; (b) Load protocol.
Figure 4 presents the solid models and details of the joint for J1 to J4. The solid unit has a side length of 50 mm. Concrete is modeled using an 8-node linear reduced integration element (C3D8R), while reinforcement is modeled separately using element B31.
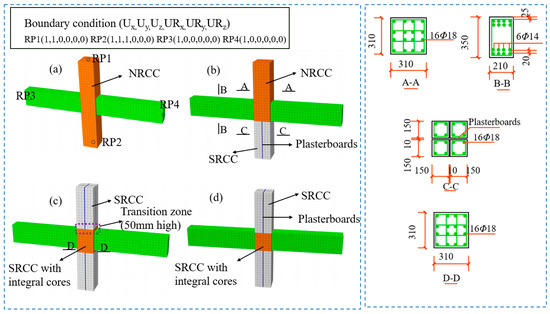
Figure 4.
FE model and details of the joint: (a) J1 FE model; (b) J2 FE model; (c) J3 FE model; (d) J4 FE model.
To simulate concrete, this section utilized the plastic damage model, which accurately represents the damage caused by tensile cracking (Figure 5a) and compressive crushing (Figure 5b) and defines the corresponding damage factors. The modeling of reinforcing steel employs a bilinear hardening elastoplastic model (Figure 5c). The pertinent parameters in FE models are configured in Table 1. The gypsum board, having minimal impact on the results, is represented using a conventional elastic material model. To consider the nonlinear deformation of reinforced concrete structures, the bond–slip constitutive model (Figure 5d) is employed to simulate the interaction between steel and concrete [42].
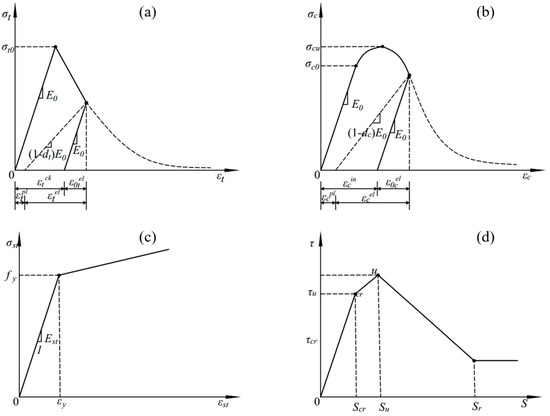
Figure 5.
Constitutive curve: (a) Diagram of uniaxial tensile stress-strain curve; (b) Diagram of uniaxial compression stress-strain curve; (c) Stress-strain diagram of reinforcement; (d) Bond-slip curves.

Table 1.
Material properties.
2.2. Simulation Validation
Figure 6 presents a comparison between the simulation results and the test results. The numerical simulation results accurately replicate the test conditions for both the hysteresis curves and the skeleton curves. This indicates that the modeling method and constitutive parameters used in this study are dependable. Also, the figure demonstrates that the SRCC member J4 exhibits a significantly enhanced pinching effect compared to the NRCC J1. Additionally, the skeleton curve of J4 shows a more gradual decrease, indicating that the SRCC frame possesses superior seismic ductility. For accuracy, the assembly SRCC joint model below will use the same intrinsic parameters.
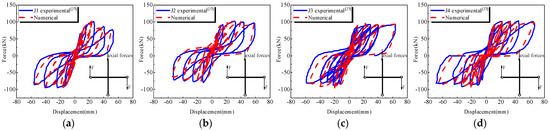
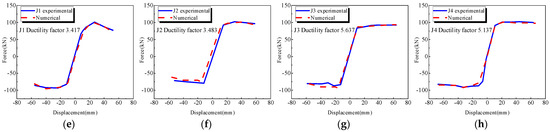
Figure 6.
Comparison of test and simulation results: (a) J1 hysteresis curve; (b) J2 hysteresis curve; (c) J3 hysteresis curve; (d) J4 hysteresis curve; (e) J1 skeleton curve; (f) J2 skeleton curve; (g) J3 skeleton curve; (h) J4 skeleton curve.
3. Numerical Simulation
3.1. Finite Element Model
A standard RC frame beam–column joint model is employed as the reference for developing both SRCC and NRCC models. Table 2 presents the specific design parameters. The model depicts a standard column with a cross-section size of 600 mm × 600 mm, and the SRCC consists of nine standard columns, each measuring 200 mm × 200 mm. The SRCC beam–column joints are connected by Q345 steel sleeves, with a thickness of 10 mm for the periphery of the sleeve and the inner spacer plate. The sleeve has a cross-section of 640 mm × 640 mm and a total height of 610 mm. To exclude interference factors, the influence of the beam–column connection on the joint performance is not considered for the time being. It is, therefore, assumed that the beam is a homogeneous, rigid beam that is rigidly connected to the sleeve. The beam–column joint model for three-dimensional solid modeling is made up of a SRCC and a steel sleeve that connects to the column via contact. The friction coefficient is set to 0.35 [43], with the normal force designated as a “penalty” term. The mesh is uniformly divided into 50 mm intervals, and the material constitutive model and parameter selection are identical to those described in Section 2.1. Concrete is modeled using an eight-node linear reduced integration element (C3D8R), while reinforcement is modeled separately using element B31. Figure 7 displays the configuration of the joints’ meshing and boundary conditions.
Table 2.
Specimen design parameters.
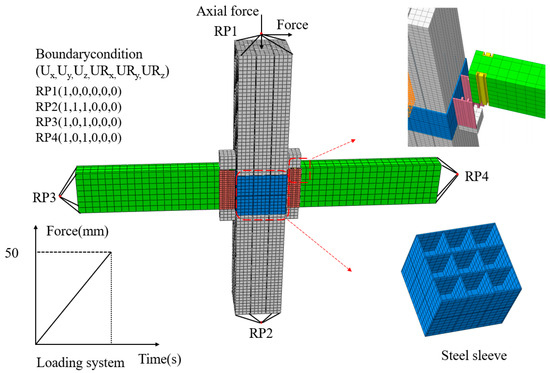
Figure 7.
Meshing and boundary condition.
3.2. Loading Scheme
In the initial analysis phase, vertical axial pressure was applied at the top of the column with axial pressure ratios (u) of 0.1, 0.3, 0.5, and 0.7. In the second analysis step, the horizontal load was monotonically loaded at the same loading point as in the first analysis step, using a displacement-controlled manner to enhance the model’s convergence behavior. The displacement was increased from 0 to 50 mm in 10 mm increments. The loading method is illustrated in Figure 7.
3.3. Measurement Scheme
Five observation cross-sections were designed. Cross-section 1 is 150 mm away from the lower surface of the upper column. Cross-section 2 is 10 mm inside the sleeve’s inner and outer junctions. Cross-section 3 is 10 mm outside of the sleeve’s inner and outer junctions. Cross-section 4 is 300 mm outside the sleeve’s inner and outer junctions. Cross-section 5 is 600 mm outside of the sleeve’s inner and outer junctions. In each cross-section, a total of 15 observation points were established. This was achieved by dividing the observation points for each small column in the cross-section into four units. To enhance the reliability of the data, the internal force values of the joints parallel to the X-axis in the column cross-section are averaged to obtain the internal force at each observation point. The arrangement of observation points is depicted in Figure 8. Notably, due to the proximity of sections 2 and 3 to the edge of the sleeve, there is a discrepancy in the numerical values of the stress integrals of the nodes in these sections. This discrepancy leads to an irregular and haphazard distribution of internal forces in the joints, and therefore, these values are not currently included in the analysis.
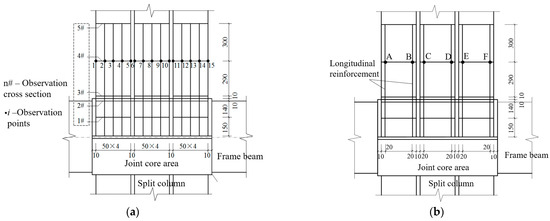
Figure 8.
Layout of observation points: (a) column; (b) longitudinal reinforcement.
4. Performance of SRCC Joint
4.1. Displacement Analysis
The primary concern is whether the flat section assumption remains valid for each cross-section of the small columns and the column bundle in the SRCC, considering the geometrical discontinuities caused by potential gaps between individual small columns. The vertical displacements of each section joint under different horizontal loading displacements are given in Figure 9.
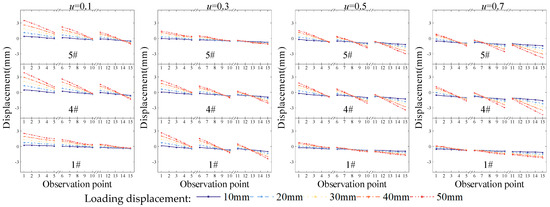
Figure 9.
Displacement of the SRCC at different axial pressure ratios μ.
The displacement of each small column in the SRCC is essentially linear, indicating that the flat section assumption remains valid. When the axial compression ratio is low, the neutral axis is biased toward the compressed side. As the axial compression ratio increases, the neutral axis moves in the opposite direction of loading. The overall movement of the small column on the tension side is relatively small, while the relative movement of the column on the compression side is large.
The slopes of the joint displacements in the same section of each small column are nearly identical, indicating that the bending moments borne by each small column are essentially equal. This implies that the shear forces distributed by each small column are equal under the horizontal load.
A notable degree of rigid body slip occurs between the prefabricated small columns and the sleeve wall. This occurs because, in a dry connection, the friction between the two is influenced by normal stress. Under horizontal loading, the initial normal stress at the interface opposite to the direction of loading is zero or minimal. Consequently, the friction at this interface is also minimal. This is insufficient to withstand the frictional shear stress at the interface in the positive loading direction, leading to a certain degree of rigid body displacement. This displacement, along with shear deformation in the reverse loading direction, causes the standard small column to come into close contact with the sleeve wall at the interface. At this point, the interface is in close contact with the sleeve wall, producing sufficient friction to re-equilibrate, as illustrated in Figure 10.
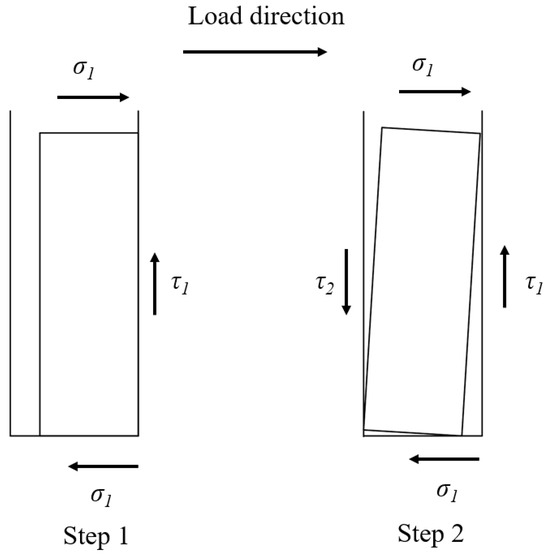
Figure 10.
SRCC slip force mechanism.
The axial compression ratio exerts a pronounced influence on the magnitude and direction of rigid body slip between the standard small columns and the sleeve. When the axial compression ratio is low, small columns slip upward opposite to horizontal loading. Conversely, when the axial compression ratio is high, small columns slide downward in alignment with horizontal loading. For moderate axial compression ratios (0.3 to 0.5), the slip between each small column and the sleeve is not statistically significant.
4.2. Strain and Stress Analysis
The strain–stress evolution pattern of the critical section at different axial compression ratios is presented in Figure 11. An example is shown for an axial compression ratio of 0.7.
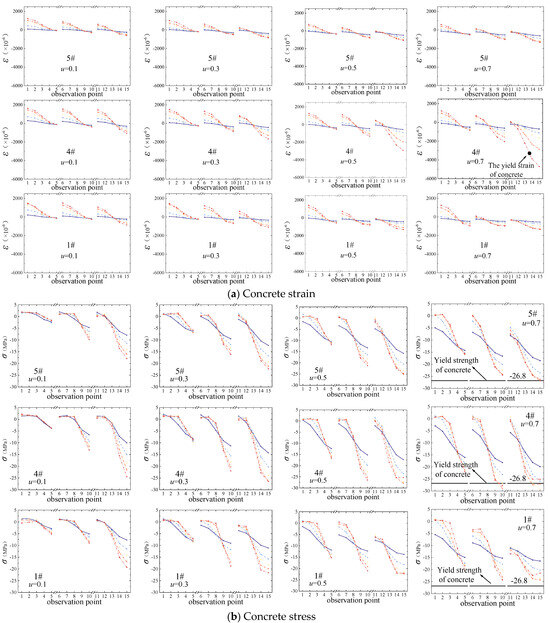
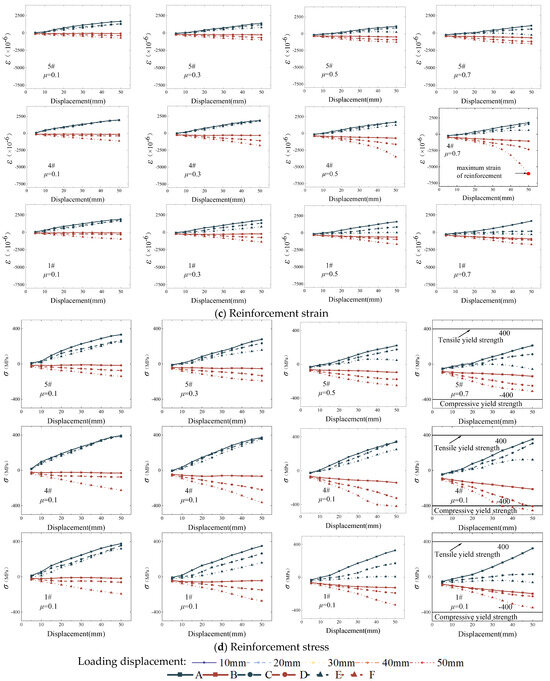
Figure 11.
Z-direction strain and stress in SRCC.
The strain in the same section increases gradually with increasing displacement at the top of the column. Among them, the farthest end of the loading side yields first. When designing the member, it is important to consider the bidirectional seismic action, which necessitates emphasizing the stress condition of the small column at the outer edge.
Outside the compression side column sleeve, the concrete was crushed because it exceeded its ultimate compressive strain by 3300 με. In the pressurized side column sleeve, the concrete strain is consistently minimal. The underlying principle is that concrete expands after being pressurized, and the connection between the steel sleeves becomes more secure. Moving force to the sleeve happens when the beam bends because of lateral compressive stress. This stops the beam from deforming laterally and stops the concrete from getting microcracks inside it because of axial pressure. As a result, the compressive strength of the concrete increases.
The strain analysis of the reinforcement bars can reflect the distribution of plastic damage in the specimens. In the core area of the sleeve, the strains of the reinforcement bars did not reach the ultimate tensile strain of 2000 με, which is within the elastic range. While the maximum value outside the sleeve reached 6000 με, which is higher than the strain value inside the sleeve, this further demonstrated the protective effect of the sleeve on the concrete in the core area of the joint.
The above results show that the sleeve can play a role in dry connection at the same time, but it can also play a similar role in the continuous spiral hoop on the core of the node to protect the role of the concrete. This is the real realization of the “strong nodes and weak components” design principle, so the use of steel sleeve connection joints is reasonable.
4.3. Parametric Analysis
To investigate the key factors influencing the mechanical properties of the sleeve-connected assembled SRCC frame connections, the parametric analysis of the joint stress behavior was conducted by considering the variation in factors such as the cross-sectional equal division ratio (n), the axial compression ratio (u) of the columns, the concrete strength (Gc), the hoop ratio (ρ), the strength grade of the steel sleeve (Gs), and the thickness of the vertical spacer plate (tw). Table 3 shows the relevant working conditions, and Figure 12 illustrates the load–displacement curves obtained under various parameter variations.
Table 3.
Parameter analysis of working conditions.
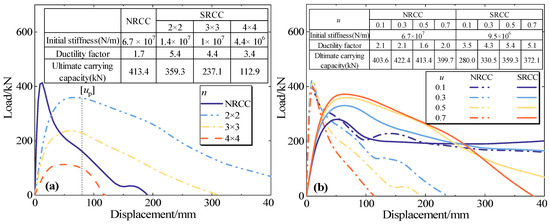
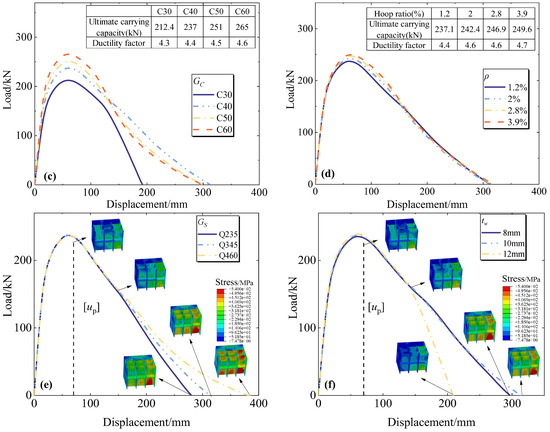
Figure 12.
Analysis of force performance parameters of assembled SRCC frame joints with steel sleeve connection: (a) effect of equivalent division ratio n; (b) effect of axial pressure ratio u; (c) effect of concrete grade Gc; (d) effect of hoop ratio ρ; (e) effect of steel sleeve strength Gs; (f) effect of inner bulkhead thickness tw.
4.3.1. Influence of the Cross-Sectional Equal Division Ratio
Figure 12 illustrates the load–displacement curves of the SRCC joints with different cross-sectional equal division ratio and NRCC. According to the Code for Seismic Design of Buildings [44], the inter-story drift angle of the RC frame is 1/50, as indicated by the black dotted line. The load-carrying capacity of the 2 × 2 and 3 × 3 SRCC is significantly higher than that of the NRCC. This suggests that it is justifiable to substitute NRCC with SRCC in order to achieve the seismic objective of “no structural collapse during a significant earthquake”.
The ratio of the two is shown in Figure 13 for a more intuitive comparison. The load-carrying capacity of the SRCC decreases relative to the NRCC, which decreases approximately linearly with the increase in the cross-sectional equal division ratio. This phenomenon is similar to the stress concentration observed in metamaterials when structural unit size decreases. As the cross-sectional equal division ratio increases, the number of small columns also increases while their size decreases. This leads to the formation of stress concentration in localized areas and a reduction in the overall load-carrying capacity. The ductility coefficients of SRCCs are significantly greater than 1 compared to NRCCs across various cross-sectional equal division ratios. This is due to the friction and hysteresis effects within the SRCCs enhancing the damping performance of the structure. The ductility coefficients decrease in a nearly linear fashion as the cross-sectional equal division ratio increases. This decrease is attributed to the increase in the length-to-slenderness ratio of split columns as the cross-sectional equal division ratio increases. As a result, the critical stress for instability decreases, leading to a decrease in ductility due to the more noticeable gravity effect of the second order of SRCC.
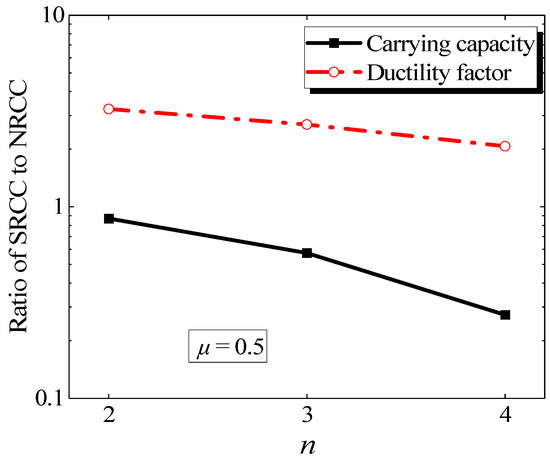
Figure 13.
Influence of n on ductility and load-carrying capacity.
The SRCC structure effectively utilizes the mechanical properties of the materials by strategically arranging and optimizing the small columns. Specifically, the steel and concrete in the small column experience a stress state that is more conducive to plastic deformation and the dissipation of energy. NRCC has a low material utilization because of its significant volume.
4.3.2. Influence of the Axial Compression Ratio
At different axial compression ratios, the load–displacement curves of the NRCC and the 2 × 2 SRCC are presented in Figure 12. To see the difference between the two more intuitively, Figure 14 illustrates the variation in the ratio of ultimate bearing capacity and ductility coefficient of SRCCs relative to NRCCs with n. As the axial compression ratio increases, the ductility coefficient ratio between SRCC and NRCC initially rises and then declines. The SRCC utilizes a mechanism similar to the “stress shielding” effect observed in metamaterials, which enables the structural units within the SRCC to efficiently distribute stresses and prevent stress concentration. The localized stress distribution enables the structure to maintain stability under high loads, thereby enhancing its ductility. Nevertheless, as the axial compression ratio continues to rise, the SRCC experiences a decrease in ductility as a result of overall instability. Notably, with a reasonable axial compression ratio(u < 0.5), the load-carrying capacity of SRCC can be maintained at a comparable level to NRCC while significantly increasing the ductility coefficient. This suggests that it is practical to substitute SRCC for NRCC in engineering applications.
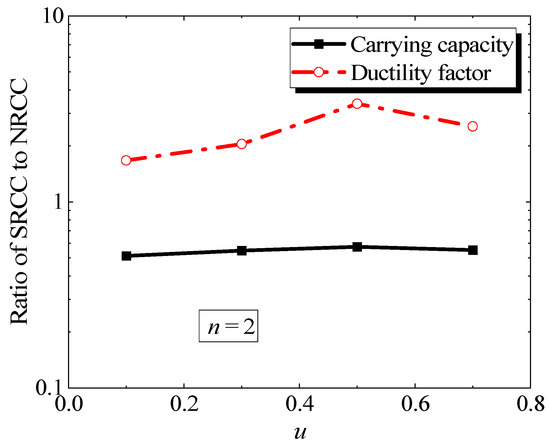
Figure 14.
Influence of u on ductility and load-carrying capacity.
4.3.3. Influence of the Concrete Strength
Figure 12c shows the load–displacement curves of 3 × 3 SRCCs under different concrete grades. As the concrete strength grade increases, the load–displacement curve of the sleeve-connected assembled SRCC frame joint rises gradually, accompanied by a rise in the maximum load it can hold. The change is relatively modest, with a 25% increase in load-carrying capacity and a 6% rise in the ductility coefficient when the concrete grade is elevated from C30 to C60.
4.3.4. Influence of the Hoop Ratio
The effect of the hoop ratio on the load–displacement curves of sleeve-connected SRCC frame nodes in the range of joints is illustrated in Figure 12d. As the hoop ratio increases, the load–displacement curves slightly increase in the peak section and essentially overlap in the descending section. The ultimate load capacity increases modestly from 237 kN to 249 kN (a 5.4% increase) as the hoop ratio increases from 1.3% to 3.9%. The hoop ratio exerts a negligible influence on the ductility coefficient, attributed to the considerable restraining effect of the steel sleeve on the concrete at the column end in the joint area, comparable to continuous helical hoop reinforcement. Thus, the restraining effect on the concrete at the column end in the node area is significantly less affected by changes in the hoop ratio. This demonstrates that using steel sleeves for SRCC joints can significantly improve the ductility of the node area, achieving the desired outcome of “strong nodes and weak members”.
4.3.5. Influence of the Strength Grade of the Steel Sleeve
The load–displacement curves of the joints with different steel sleeve strengths are presented in Figure 12e. The strength of the sleeve steel has a negligible effect on the stress performance of the joints within the range of commonly used steel strength grades, particularly before reaching the floor’s plastic inter-story displacement limit. This suggests that the proposed method of connecting steel sleeves with internal longitudinal and transverse partitions is viable. As the strength grade of the sleeve steel increases, the plastic deformation of the sleeve also increases, leading to an increase in the ultimate displacement of the curve.
4.3.6. Influence of the Thickness of the Vertical Spacer Plate
Figure 12f presents the load–displacement curves of the joints with varying vertical internal partition thicknesses. When the thickness is between 8 mm and 12 mm, the horizontal load–displacement curves of the joints show the same trend in both the initial ascending and initial descending segments until the displacement is greater than the ultimate plastic displacement. After surpassing the ultimate plastic displacement, the load–displacement curves for the 12 mm internal partition thickness show a faster decline and a noticeable decrease in the ultimate displacement. The stress cloud diagram of the sleeve with different spacer thicknesses under the ultimate displacement is depicted in the figure. The inner spacer of the sleeves with spacer thicknesses of 8 mm and 10 mm clearly exhibits a yielding region, while the sleeve with a 12 mm inner spacer thickness does not yield, indicating no plastic deformation. Consequently, the joint’s ultimate displacement is solely generated by the plastic deformation of the column, whereas the final displacement of the first two nodes includes the plastic deformation of the sleeve. This indicates that the node load–displacement curve for the 12 mm thick inner wall shows less final movement compared to the first two node load–displacement curves. This suggests that, from the perspective of enhancing the overall ductility of sleeve-connected SRCC frame joints, the thickness of the spacer in the sleeve exhibits a similar issue to that of the bounding reinforcement ratio in the “suitable reinforced beams”, warranting further investigation.
4.4. Shear-Bearing Capacity Prediction of Core Area
4.4.1. Underlying Assumption
By analyzing the stress damage of each member in the core area (Figure 15), the calculation method of the joint shear capacity is proposed based on the steel “frame-shear wall” mechanism and the “concrete diagonal compression short column” mechanism. The basic assumptions are as follows:
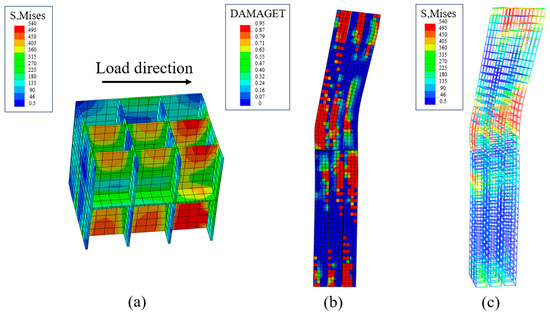
Figure 15.
Cloud diagram of each component: (a) Sleeve stress clouds; (b) Column damage clouds; (c) Rebar damage clouds.
The joint is equated to a concrete joint of “section steel” wrapped by a “steel pipe”, where the “steel pipe” is a steel sleeve, and the “section steel” is a well steel section consisting of an inner vertical steel diaphragm. The core joint’s shear-carrying capacity is composed of four primary components: concrete, hoop reinforcement, steel sleeves, and internal vertical steel partitions. The internal transverse steel partitions are not included in the analysis because they are subjected to relatively low stresses. Under flexural failure, the concrete’s shear contribution in the joint’s core zone is neglected. After cracking occurs in the core zone of the joint, the concrete’s tensile strength is disregarded. There is no local buckling of the steel section in the joint’s core zone. The shear capacities of the joint’s various components can be simply superimposed.
Thus, the formula for calculating the shear capacity of the core zone of the composite joint can be expressed as follows:
where represents the calculated shear capacity of the joint; , , , and represent the shear capacities of the internal vertical steel partitions, hoop reinforcement, steel sleeves, and concrete parts of the joint’s core region, respectively.
4.4.2. Shear Capacity of Internal Vertical Steel Partitions Vw
Through the stress analysis of the core region sleeve, it is evident that the steel web plate parallel to the loading direction is the main shear-critical component, while the flange perpendicular to it contributes less to shear resistance due to its lower lateral stiffness and is therefore disregarded. Referring to Technical Specification for Combined Structures [45], the calculation formula is as follows:
where represents the shear capacity of the steel web plate in the core region of the node; represents the tensile yield strength of the steel; and represent the thickness and height of the web plate respectively.
4.4.3. Shear Capacity of Hoop Reinforcement Vsv
According to the Code for Design of Concrete Structures [42], the formula is as follows:
where denotes the shear capacity of the hoop reinforcement in the core zone of the joint; denotes the tensile strength of the hoop reinforcement; denotes the cross-sectional area of the horizontal hoop reinforcement at each limb of the same section in the core area of the joint; denotes the spacing of the hoop reinforcement in the core area of the node; denotes the computed height of the beam cross-section; and denotes the distance from the top surface of the beam to the center of the hoop reinforcement.
4.4.4. Shear Capacity Provided by Steel Sleeves Vjw
According to the method described in Technical Specification for Steel Pipe Concrete Structures [46], the calculation formula is as follows:
where is the thickness of the column web, is the height of the column section, is the design value of the tensile strength of steel, and is the axial pressure transmitted from the column by the web of the steel tube.
4.4.5. Shear-Bearing Capacity Provided by Concrete Vc
Referring to Refs. [47,48,49,50], the concrete diagonal compression bar model is shown in Figure 16b, and the effective shear height is shown in Figure 16c. Since each of the small columns is subjected to the double constraints of the hoop bars and the steel sections, all the concretes are set to be the core zone concrete. The shear capacity of concrete can be expressed as follows:
where denotes the section height of the section concrete column, denotes the effective shear height, denotes the effective compressive strength of the concrete, which can be calculated by . denotes the total horizontal shear in the core area of the joint, is the shear in the steel plate, is the shear in the hoop reinforcement, and is the shear in the web of the steel pipe. is the shear influence coefficient of the concrete in the core area, which is proportional to the magnitude of the axial compression ratio , all else being equal. can be fitted numerically to by linear regression. As shown in Figure 17, the relationship between and axial pressure ratio can be obtained as follows:
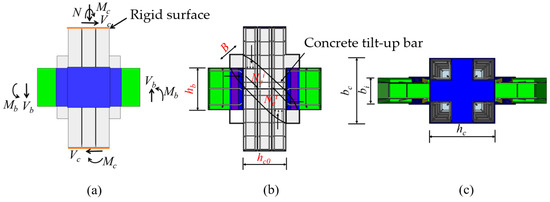
Figure 16.
Core force mechanism and modeling of concrete inclined compression bar: (a) Force mechanisms in the core; (b) Inclined pressure bar model; (c) Effective shear height.
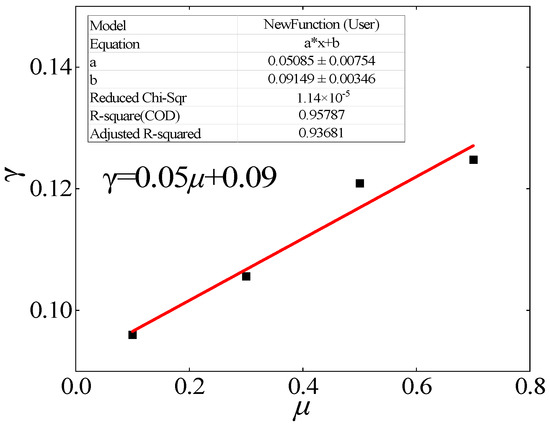
Figure 17.
Results of fitting to .
Therefore, the shear capacity of concrete can be expressed as follows:
where denotes the strength reduction factor for high strength concrete, 1.0 is used for concrete below C50, and 0.7 for concrete C50 and above.
In summary, considering joints (1), (2), (3), (4), and (8) and the friction contact between the sleeve and the concrete, the friction coefficient [51] is taken into account. The formula for calculating the shear load-bearing capacity is expressed as follows:
4.4.6. Comparison of Shear-Bearing Capacity Calculation Results
As shown in Table 4, the calculated results were compared with the simulation ones. The errors in the results were found to be within 8%, which meets the current code requirements. This may be due to simplifying the formula and the numerical integration errors introduced by the software. Therefore, it can be concluded that the load-carrying capacity calculation method proposed in this paper is both reasonable and effective.
Table 4.
Comparison of calculation results.
5. Performance of SRCC Frame
5.1. Mechanism Analysis
Figure 1c presents the formula for the stiffness ratio between the SRCC to NRCC.
where m is the structural mass, which can be considered essentially the same for both the SRCC and the NRCC. k is the structural stiffness.
The ratio of the periods of the SRCC to the NRCC can be obtained from Equations (10) and (11):
As shown in Figure 18 and Figure 19, the period of the SRCC has significantly increased, thereby greatly reducing its acceleration response.
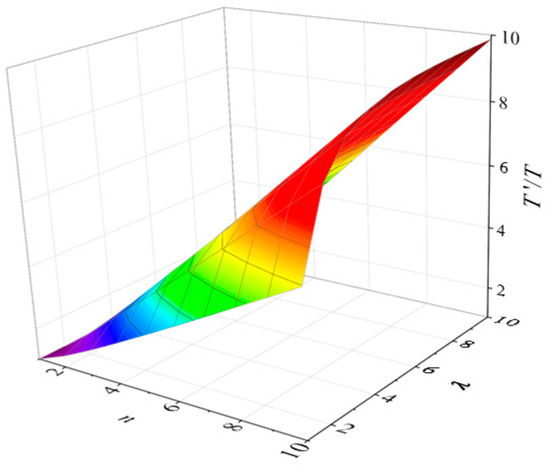
Figure 18.
Ratio of the period of the SRCC to NRCC.
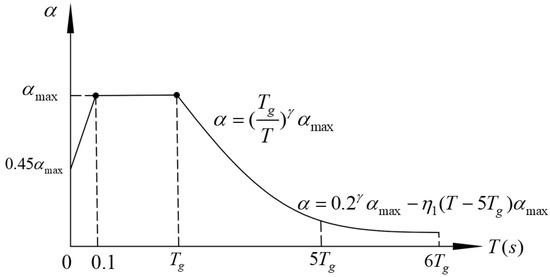
Figure 19.
Seismic impact factor curve.
Meanwhile, to bridge the gap between the detailed numerical analysis proposed in the research and practical engineering applications, reference is made to the formulas put forward by Ditommaso et al. [52]. The meanings of the relevant parameters in Equation (13) can be found in Table 5.
Table 5.
Parameters used in the proposed formulations at SLS and DLS.
According to Equation (14), the ratio of the shear force in SRCC and NRCC can be obtained, as shown in Figure 20.
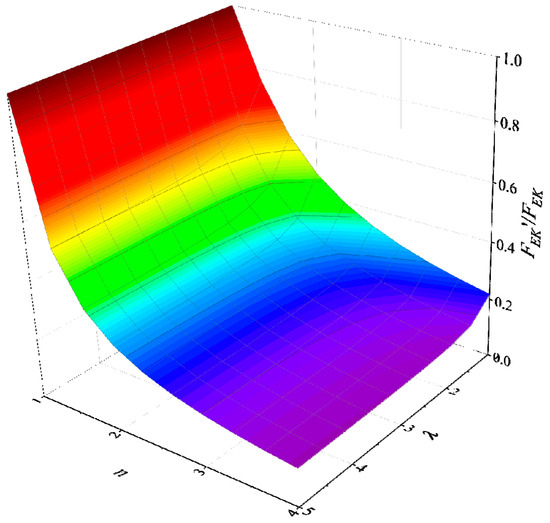
Figure 20.
The ratio of the shear force in SRCC and NRCC.
5.2. FE Modle of the Frame
The SRCC and NRCC frame models are set up separately, and the detailed parameters are shown in Figure 21.
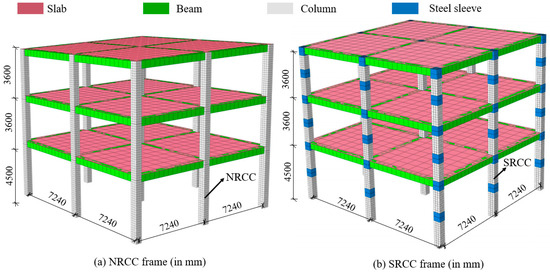
Figure 21.
FE model of the frame.
5.3. Modal Analysis
To gain a better understanding of the dynamic characteristics of the SRCC structure, modal analysis was first performed on both the SRCC frame and NRCC frame. The results of the modal analysis are presented in Figure 22 and Table 6. The figure illustrates that the SRCC frame has a relatively longer natural vibration period, leading to a smaller dynamic response compared to the NRCC frame. However, due to the lower stiffness of SRCC frame compared to NRCC frame, the displacement of the corner columns is significantly increased (Figure 22c). Therefore, it is crucial to emphasize the strengthening of this area during the design process.
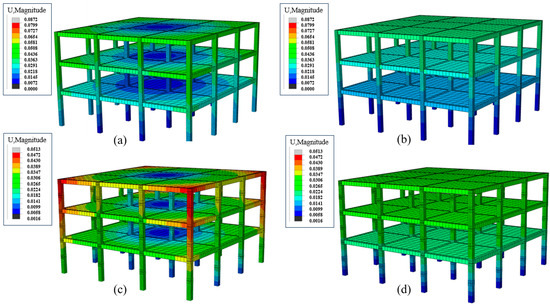
Figure 22.
Results of model analysis: (a) NRCC fram’s first mode; (b) NRCC fram’s second mode; (c) SRCC fram’s first mode; (d) SRCC fram’s second mode.
Table 6.
Results of model analysis for the frame structure.
5.4. Time History Analysis
5.4.1. Selection of Seismic Wave
According to GB 50010-2010 [44], seismic analysis involves the use of time history analysis techniques, which include selecting actual strong ground motion records and artificially simulated acceleration time history curves. The selection of seismic waves must satisfy three criteria of seismic motion: spectral characteristics, effective peak value, and duration. This study selected the representative actual seismic wave, the El Centro wave. Detailed information about these seismic waves is provided in Table 7, while the time history curves are illustrated in Figure 23.
Table 7.
Information of original seismic wave.
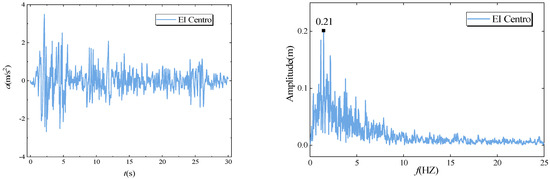
Figure 23.
Original seismic waves.
Due to the mismatch between the peak accelerations of the selected seismic waves and the basic intensity of the building structure in the time history analysis, these seismic waves cannot be directly used as input for structural analysis. Therefore, the seismic accelerations are adjusted by a certain proportion, typically using the amplitude scaling method. This method preserves the shape of the seismic waves while adjusting only the acceleration amplitudes. The adjustment formula is expressed as Equation (16).
where is the peak ground acceleration (PGA) of the original seismic wave, is the target PGA, is the original seismic wave, and is the normalized seismic wave.
The 6°, 7°, 8°, and 9° seismic intensity levels were analyzed. Therefore, the peak accelerations of the selected three seismic time history curves are adjusted, according to Equation (1), to match the maximum seismic accelerations specified in standard [29] for rare seismic event. The purpose of this adjustment was to investigate the dynamic reaction of the frame structure during the most severe seismic situations it may encounter. The peak accelerations for the seismic effects under rare seismic conditions are 125 gal, 220 gal, 400 gal, and 620 gal at different seismic intensities.
5.4.2. Inter-Story Drift Angle
To assess compliance with code requirements, the inter-story drift angle (ISDA) θ of two types of frames are extracted and analyzed. The ISDA of each floor is calculated using the formulae specified in the standard GB 50010-2010 [44]. The resulting values are then compared to the limit values of the ISDA for the framed structure, as indicated by the yellow cone in Figure 24. Figure 24 illustrates the curves of ISDA for SRCC and NRCC frames.
where is the inter-story drift of the i-th story, is the displacement of the i-th story, is the displacement of the i-1 story, and is the story height of the i-th story.
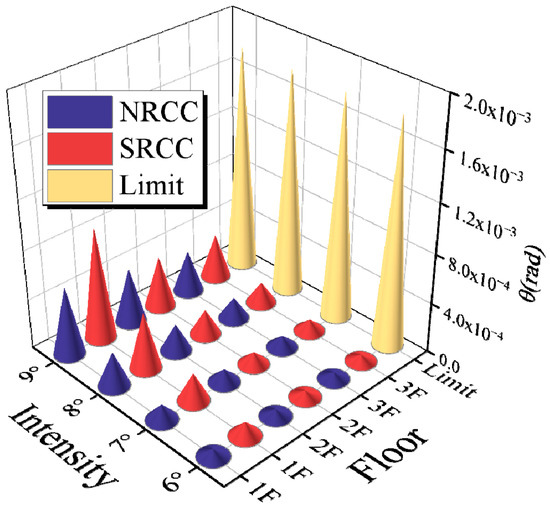
Figure 24.
Comparative curves of inter-story drift angle.
Due to its smaller stiffness, the SRCC results in a larger ISDA than the NRCC. The natural frequency of the SRCC is significantly lower than that of the NRCC (approximately 1/2), as demonstrated by the modal analysis in Section 5.4. Consequently, the structure presents a first-order mode shape, which significantly enhances the displacement of the first floor. To achieve the limit values for interlayer displacement while dissipating energy, it is, therefore, necessary to incorporate an energy-dissipating interlayer support at a later stage.
5.4.3. Acceleration Response
Figure 25 illustrates the acceleration response curves. The SRCC frame exhibits lower acceleration responses than the NRCC frame, particularly under high-frequency seismic waves. Due to the superior ductility of SRCC, which dissipates seismic energy during deformation. The SRCC frame, possessing a longer fundamental period, is more adept at mitigating the impacts of earthquakes when exposed to high-frequency seismic waves. Therefore, the SRCC frame is more suitable for areas prone to earthquakes.
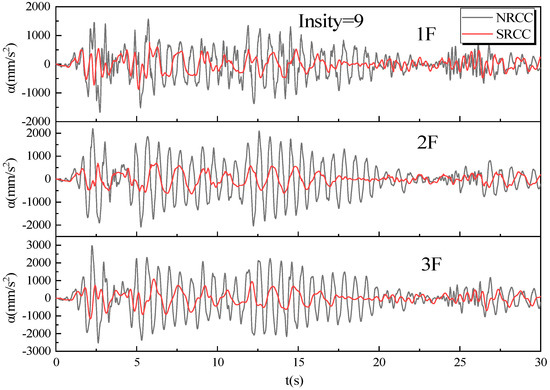
Figure 25.
Time history.
5.4.4. Maximum Base Shear
Figure 26 illustrates the maximum base shear (MBS) of the NRCC and SRCC frames at various intensities. The SRCC frame exhibits lower MBS than the NRCC frame, particularly under high seismic intensity (8° and 9°). The SRCC frame demonstrates superior energy dissipation and shock absorption during seismic events, effectively mitigating the horizontal force response of the structure. The explanations are as follows:
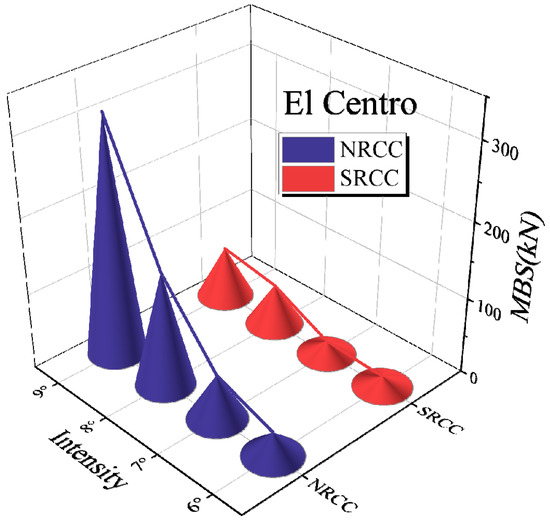
Figure 26.
Comparative of maximum base shear.
- The relative motion among SRCCs during seismic events will induce friction and localized plastic deformation. These mechanisms effectively dissipate energy, reducing the shear force transmitted to the foundation.
- The SRCC structure’s small units can transmit and absorb seismic force independently, avoiding force concentration on a single component and reducing MBS growth.
- In high seismic intensity, the NRCC structure exhibits dynamic amplification due to its rigidity, resulting in a significant increase in MBS. The SRCC structure effectively mitigates dynamic amplification through its inherent flexibility and energy dissipation capabilities.
6. Conclusions
This study presents the outcomes of parametric analyses and dynamic analysis conducted to evaluate the seismic performance of steel sleeve dry connection assembled SRCC frame. The key findings are summarized as follows:
- Under horizontal loading, the shear forces distributed among the small columns are uniform. Also, the strain distribution in each section of the split small columns adheres to the flat section assumption, validating the structural integrity under such loading conditions.
- The stress levels in the concrete within the core area of the node are significantly lower than those outside the core area. This demonstrates that the steel sleeve effectively serves its function in the dry connection, akin to continuous spiral reinforcement, thereby providing concrete protection. This observation corroborates the design principle of “strong joints and weak components”.
- The axial compression ratio and cross-sectional equal division ratio are key factors affecting the performance of the SRCC joint. As the axial compression ratio increases, both stiffness and ultimate load-carrying capacity increase, while ductility decreases. Similarly, an increase in the cross-sectional equal division ratio results in reductions in stiffness, ultimate load-carrying capacity, and ductility. The ductility of SRCC is 2–3 times higher than that of NRCC.
- Theoretical formulations for the shear capacity of sleeve-jointed SRCC frame joints have been developed. Comparative analysis with numerical simulations indicates a high degree of concordance between the theoretical values and the simulation results. These formulations provide a reliable reference for future investigations and practical applications in engineering.
- The displacement response of the SRCC frame is greater than that of the NRCC, and ISDA exceeds the limit, with the first story being the most serious. Additional support will be added for further study.
- The acceleration response and the base shear of the SRCC frame structure is smaller than that of the NRCC, indicating that the split columns are more effective in reducing the dynamic amplification effect, distributing the force, and dissipating energy.
Author Contributions
Methodology, F.L.; Formal Analysis, F.L., Y.H.; Writing—Original Draft, F.L., Y.H., W.Z. and R.G.; Funding Acquisition, F.L. and Y.Y.; Visualization, W.Z., R.G. and J.H. (Jie Hu); Writing—Review and Editing, R.G.; Data Curation, J.H. (Jie Hu); Resources, J.H. (Jie He); Supervision, J.H. (Jie He) and Y.Y. All authors have read and agreed to the published version of the manuscript.
Funding
This research was funded by [the Natural Science Foundation of Hunan Province] grant number [2021JJ40171], [the Key Research Project of Hunan Provincial Department of Education] grant number [21A0357] and [the Postdoctoral Fellowship Program of CPSF] grant number [GZB20230487].
Data Availability Statement
The original contributions presented in this study are included in the article. Further inquiries can be directed to the corresponding author.
Acknowledgments
The authors would like to thank Mengtao Wu from Sichuan University for participating in many helpful discussions that helped us improve the manuscript.
Conflicts of Interest
The authors declare that they have no known competing financial interests or personal relationships that could have appeared to influence the work reported in this paper.
References
- Celik, O.C.; Ulker, M.B.C.; Gocer, C.; Guntepe, S.; Koz, O.; Eyupgiller, M.M.; Aksu, M.; Yaz, A. Multidisciplinary reconnaissance investigation covering structural, geotechnical, and architectural based damage to mid-rise residential buildings following the February 6th, 2023 Kahramanmaraş, Türkiye earthquake doublets (Mw 7.8, Mw 7.6). Soil Dyn. Earthq. Eng. 2024, 182, 108738. [Google Scholar] [CrossRef]
- Yetkin, M.; Dedeoglu, İ.Ö.; Tunc, G. February 6, 2023, Kahramanmaraş twin earthquakes: Evaluation of ground motions and seismic performance of buildings for Elazığ, southeast of Türkiye. Soil Dyn. Earthq. Eng. 2024, 181, 108678. [Google Scholar] [CrossRef]
- Wang, J.; Wu, M.; Liu, F.; Bin, J.; He, J. Rubber-sand infilled soilbags as seismic isolation cushions: Experimental validation. Geosynth. Int. 2024, 1–14. [Google Scholar] [CrossRef]
- Liu, F.; Wang, J.; Zhou, B.; Wu, M.; He, J.; Bin, J. Shaking table study on rubber-sand mixture cored composite block as low-cost isolation bearing for rural houses. J. Build. Eng. 2023, 76, 107413. [Google Scholar] [CrossRef]
- Liu, H.; Qu, Z. Effect of loading sequence on the ultra-low-cycle fatigue performance of all-steel BRBs. J. Constr. Steel Res. 2024, 222, 108987. [Google Scholar] [CrossRef]
- Wang, X.; Qu, Z.; Gong, T. Role of dampers on the seismic performance of pin-supported wall-frame structures. Earthq. Eng. Eng. Vib. 2023, 22, 453–467. [Google Scholar] [CrossRef]
- Qu, Z.; Ji, X.; Shi, X.; Wang, Y.; Liu, H. Cyclic loading test of steel coupling beams with mid-span friction dampers and RC slabs. Eng. Struct. 2020, 203, 109876. [Google Scholar] [CrossRef]
- Zhang, P.; Lv, X.; Zhang, H.; Liu, Y.; Chen, B.; Gao, D.; Sheikh, S.A. Experimental investigations of GFRP-reinforced columns with composite spiral stirrups under concentric compression. J. Build. Eng. 2022, 46, 103768. [Google Scholar] [CrossRef]
- Yu, M.; Liao, W.; Liu, S.; Wang, T.; Yu, C.; Cheng, S. Axial compressive performance of ultra-high performance concrete-filled steel tube stub columns at different concrete age. Structures 2023, 55, 664–676. [Google Scholar] [CrossRef]
- Hui, C.; Li, Y.; Li, K.; Hai, R.; Myers, J.J.; Li, C. Experimental study and analysis on seismic performance of special-shaped steel reinforced concrete column frame. Structures 2022, 37, 353–363. [Google Scholar] [CrossRef]
- Fayaz, Q.; Kaur, G.; Bansal, P.P. Numerical Modelling of Seismic Behaviour of an Exterior RC Beam Column Joint Strengthened with UHPFRC and CFRP. Arab. J. Sci. Eng. 2021, 47, 4971–4986. [Google Scholar] [CrossRef]
- Du, Y.; Zhang, Y.; Chen, Z.; Dong, S.; Deng, X.-F.; Qian, K. Seismic behavior of CFRP confined rectangular CFST columns using high-strength materials: Numerical analysis and restoring force model. Structures 2021, 34, 4237–4253. [Google Scholar] [CrossRef]
- Wang, Q.; Lv, J.; Lu, C.-L.; Zhu, W.-X. Experimental study on seismic performance of square RC columns strengthened with multi-layer prestressed CFRP fabric. J. Build. Eng. 2022, 45, 103589. [Google Scholar] [CrossRef]
- Wang, Q.; Liang, X.-H.; Liu, S.-H.; Liu, Y.-H.; Lu, C.-L. Seismic performance of precast columns strengthened with prestressed CFRP. Structures 2023, 58, 105625. [Google Scholar] [CrossRef]
- Qian, K.; Xue, T.-Q.; Deng, X.-F.; Ma, J. Experimental investigation on seismic behavior of Ultra-high performance concrete columns reinforced with GFRP bars. Structures 2023, 53, 568–580. [Google Scholar] [CrossRef]
- Shi, Z.; Cheng, Z.; Xiang, H. Periodic Structures: Theory and Applications to Seismic Isolation and Vibration Reduction; Science Press: Beijing, China, 2017. [Google Scholar]
- Wu, M.; Wang, B.; Ba, Z.; Dai, K.; Liang, J. Vibration isolation of infinitely periodic pile barriers for anti-plane shear waves: An exact series solution. Soil Dyn. Earthq. Eng. 2024, 176, 108347. [Google Scholar] [CrossRef]
- Wu, M.; Wang, B.; Ba, Z.; Dai, K.; Liang, J. Propagation attenuation of elastic waves in multi-row infinitely periodic pile barriers: A closed-form analytical solution. Eng. Struct. 2024, 315, 118480. [Google Scholar] [CrossRef]
- Que, W.-Z.; Yang, X.-D. Longitudinal wave attenuation and bandgap analysis of a novel type hybrid tunable resonator metamaterial. Eng. Struct. 2024, 301, 117308. [Google Scholar] [CrossRef]
- Zhang, F.; Tao, Y.; He, Y.; Qiu, S. Optimization and thermal characterization of a new liquid-cooled plate with branching channels of fractal geometry. Appl. Therm. Eng. 2024, 254, 123881. [Google Scholar] [CrossRef]
- Balankin, A.S. A survey of fractal features of Bernoulli percolation. Chaos Solitons Fractals 2024, 184, 115044. [Google Scholar] [CrossRef]
- Das, A. Fractal pattern of [formula omitted]-hydride with stress-state. Chaos Solitons Fractals 2024, 186, 115148. [Google Scholar] [CrossRef]
- Qin, B.; Zhang, Y. Comprehensive analysis of the mechanism of sensitivity to initial conditions and fractal basins of attraction in a novel variable-distance magnetic pendulum. Chaos Solitons Fractals 2024, 183, 114933. [Google Scholar] [CrossRef]
- Liu, F.C.; Hu, J.; Wang, S.H. Study on the effect of axial compression ratio on lateral stiffness and energy dissipation performance of RC split columns. Build. Struct. 2021, 51, 968–973. [Google Scholar]
- Hao, Y.C.; Hu, Q.C.; Xu, Y.F.; Kang, G. Experimental study on the application of split columns to improve the seismic performance of short columns with high axial compression ratio. J. Build. Struct. 1998, 6, 2–11. [Google Scholar] [CrossRef]
- Hao, Y.C.; Hu, Q.C.; Xu, Y.F.; Kang, G. Experimental study on bearing capacity of split columns under repeated horizontal loads at low circumference. J. Build. Struct. 1999, 6, 18–25. [Google Scholar] [CrossRef]
- Li, Z.X.; Hao, Y.C.; Zhang, J.Y. Seismic performance of joints in beams and columns of reinforced concrete split column frames. J. Build. Struct. 2001, 22, 55–60. [Google Scholar]
- Li, Z.X.; Hao, Y.C.; Zhou, B.; Kang, G.Y.; Hu, Q.C.; Xu, Y.F. Model test study on seismic performance of reinforced concrete split column frames. J. Build. Struct. 2003, 6, 1–10+31. [Google Scholar]
- Xu, C.S.; Wang, Y.S.S.; Du, X.L.; Xu, Z.-G.; Zhang, Z.-H. Study on seismic damping effect of split columns in underground station structures. J. Geotech. Eng. 2021, 43, 624–633. [Google Scholar] [CrossRef]
- Wang, H.D.; Gong, Y.L.; Jiang, D.S.; Tan, W. Numerical simulation of seismic toughness of subway stations with split columns. J. Civ. Eng. Manag. 2023, 40, 1–6. [Google Scholar] [CrossRef]
- Borgohain, A.; Bediwy, A.G.; El-Salakawy, E.F. Performance of GFRP-Reinforced Concrete Corbels under Monotonic Loading. J. Compos. Constr. 2024, 28, 04023067. [Google Scholar] [CrossRef]
- Sophianopoulos, D.S.; Deri, A.E. Steel beam-to-column RBS connections with European profiles: I. Static optimization. J. Constr. Steel Res. 2017, 139, 101–109. [Google Scholar] [CrossRef]
- Li, J.; Wang, Y.; Zhang, Z.; Mou, B. Seismic behavior of steel frames with different joints: Shaking table test and finite element analysis. J. Build. Eng. 2023, 70, 106377. [Google Scholar] [CrossRef]
- Dong, J.; Zheng, S.; Zhang, Z.; Liu, H.; Li, Y. Experimental study on seismic performance of RC beam—CFST column joint combination using ECC. Eng. Struct. 2024, 312, 118188. [Google Scholar] [CrossRef]
- He, Y.X.; Zhao, Y.G.; Lin, S.Q.; Zhang, Z.J. Prefabricated bolted PEC beam-to-CFST column joints: Development and its seismic behavior. Eng. Struct. 2024, 314, 118442. [Google Scholar] [CrossRef]
- Hu, G.; Zhang, Z.; Cao, B.; Pan, Z.; Zeng, L. Seismic behavior of precast concrete beam-column joints with bending moment-shear separation controllable plastic hinge. Eng. Struct. 2024, 304, 117585. [Google Scholar] [CrossRef]
- Hung, C.-C.; Hsiao, H.-J. Retrofitting RC beam-column joint subassemblies using UHPC jackets reinforced with high-strength steel mesh. Eng. Struct. 2024, 305, 117764. [Google Scholar] [CrossRef]
- Zhang, J.; Zhang, X.; Pei, Z.; Yuan, W.; Zhang, T. Experimental investigation on seismic behavior of innovative buckling-restrained braced PC frames with energy dissipated connectors. Eng. Struct. 2024, 314, 118394. [Google Scholar] [CrossRef]
- Miceli, E.; Ferrara, S.; Castaldo, P. Confinement effects within the seismic design of reinforced concrete frames: Reliability assessment and comparison. Eng. Struct. 2024, 313, 118248. [Google Scholar] [CrossRef]
- Gu, X.-L.; Zhou, T.; Nagai, K.; Zhang, H.; Yu, Q.-Q. Prediction of seismic performance of a masonry-infilled RC frame based on DEM and ANNs. Eng. Struct. 2024, 316, 118531. [Google Scholar] [CrossRef]
- Dong, G.; Garcia, R.; Pilakoutas, K.; Hajirasouliha, I. A review of optimum seismic design of RC frames: State-of-the-art, challenges and future directions. Eng. Struct. 2024, 315, 118455. [Google Scholar] [CrossRef]
- GB 50010-2010; Code for Design of Concrete Structures. China Architecture & Building Press: Beijing, China, 2010.
- Deng, Y.; Li, A.; Zhang, Y.L.; Li, Y. Seismic performance analysis of new assembled pinned concrete beam-column joint. J. Southeast Univ. 2022, 52, 461–470. [Google Scholar] [CrossRef]
- GB 50010-2010; Code for Structural Design of Buildings. China Architecture & Building Press: Beijing, China, 2024.
- JGJ 138-2016; Technical Specification for Combined Structures. China Architecture & Building Press: Beijing, China, 2016.
- GB 50936-2014; Technical Specification for Steel Pipe Concrete Structures. China Architecture & Building Press: Beijing, China, 2014.
- Jia, J.Q.; Zhu, W.Q.; Wang, J.Z. Study on shear bearing capacity of joints in section steel ultrahigh-strength concrete frames. J. Civ. Eng. 2013, 46, 1–8. [Google Scholar] [CrossRef]
- Elghazouli, A.Y.; Elnashai, A.S. Performance of composite steel/concrete members under earthquake loading. Part II: Parametric studies and design considerations. Earthq. Eng. Struct. Dyn. 1993, 22, 347–368. [Google Scholar] [CrossRef]
- Parra-Montesinos, G.; Wight, J.K. Modeling Shear Behavior of Hybrid RCS Beam-Column Connections. J. Struct. Eng. 2001, 127, 3–11. [Google Scholar] [CrossRef]
- Ma, H.; Li, S.Z.; Li, Z.; Wang, Z.; Liang, J.F. Study on shear bearing capacity of section steel-recycled concrete column-steel beam combination frame joint. Eng. Mech. 2018, 35, 176–186. [Google Scholar] [CrossRef]
- Su, Q.T.; Du, X.; Li, C.; Jiang, X. Testing of basic physical parameters at the interface between steel and concrete. J. Tongji Univ. 2016, 44, 499–506. [Google Scholar]
- Ditommaso, R.; Lamarucciola, N.; Ponzo, F. Prediction of the fundamental period of infilled RC framed structures considering the maximum inter-story drift at different design limit states. Structures 2024, 63, 106422. [Google Scholar] [CrossRef]
Disclaimer/Publisher’s Note: The statements, opinions and data contained in all publications are solely those of the individual author(s) and contributor(s) and not of MDPI and/or the editor(s). MDPI and/or the editor(s) disclaim responsibility for any injury to people or property resulting from any ideas, methods, instructions or products referred to in the content. |
© 2025 by the authors. Licensee MDPI, Basel, Switzerland. This article is an open access article distributed under the terms and conditions of the Creative Commons Attribution (CC BY) license (https://creativecommons.org/licenses/by/4.0/).