Figure 1.
Technical architecture of the SAM 100 robotic bricklaying system, illustrating integrated components and automated workflow for precision construction (Source: Authors).
Figure 1.
Technical architecture of the SAM 100 robotic bricklaying system, illustrating integrated components and automated workflow for precision construction (Source: Authors).
Figure 2.
Operational comparison between traditional and SAM 100 robotic bricklaying methods under pandemic protocols, showing crew configuration, workflow differences, and resilience performance metrics (Source: Authors).
Figure 2.
Operational comparison between traditional and SAM 100 robotic bricklaying methods under pandemic protocols, showing crew configuration, workflow differences, and resilience performance metrics (Source: Authors).
Figure 3.
Simulation workflow for SAM 100 evaluation in a 10-building residential cluster under Jordanian building codes (JSBC 2020) and pandemic constraints (30% absenteeism, 50% density). Parameters include SAM 100 (3200 bricks/day, 15% mortar waste) and traditional methods (500 bricks/day, 20% waste). Scenarios compare standard operations and COVID-19 disruptions, with outputs demonstrating SAM 100’s 84%-time reduction, 15% waste savings, and alignment with SDG 9.
Figure 4.
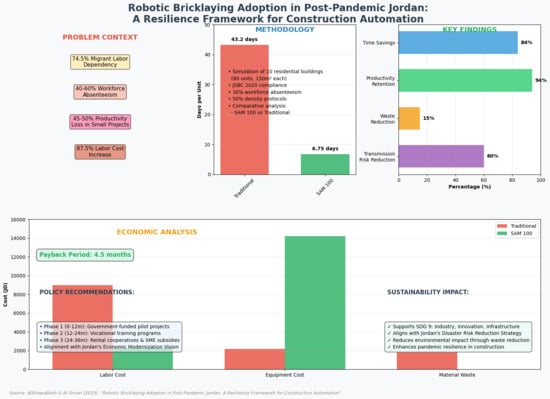
Bricklaying time per unit: SAM 100 vs. traditional methods under pandemic conditions (6.75 vs. 43.2 days).
Figure 4.
Bricklaying time per unit: SAM 100 vs. traditional methods under pandemic conditions (6.75 vs. 43.2 days).
Figure 5.
Productivity retention under workforce absenteeism: SAM 100 maintains 94% efficiency at 30% absenteeism, compared to traditional methods’ 40% decline.
Figure 5.
Productivity retention under workforce absenteeism: SAM 100 maintains 94% efficiency at 30% absenteeism, compared to traditional methods’ 40% decline.
Figure 6.
Mortar waste comparison: SAM 100 (15%) vs. traditional methods (20%).
Figure 6.
Mortar waste comparison: SAM 100 (15%) vs. traditional methods (20%).
Figure 7.
Cost structure comparison: SAM 100 vs. traditional methods. SAM 100’s higher equipment costs are offset by labor and waste savings, yielding a 4.5-month payback period.
Figure 7.
Cost structure comparison: SAM 100 vs. traditional methods. SAM 100’s higher equipment costs are offset by labor and waste savings, yielding a 4.5-month payback period.
Figure 8.
Close-contact transmission risk reduction: SAM 100 (40% risk) vs. traditional crews (100% baseline). Source: Author’s risk assessment based on workforce density simulations.
Figure 8.
Close-contact transmission risk reduction: SAM 100 (40% risk) vs. traditional crews (100% baseline). Source: Author’s risk assessment based on workforce density simulations.
Table 1.
Housing unit specifications for simulation modeling, including floor area, wall dimensions, and brick requirements (per Jordanian building codes).
Table 1.
Housing unit specifications for simulation modeling, including floor area, wall dimensions, and brick requirements (per Jordanian building codes).
| Parameter | Value | Source |
|---|
| Floor Area | 150 m2 | JHDA [24] |
| Wall Height | 3.0 m | JSBC [27] |
| Wall Thickness | 200 mm (double-layer brick) | JSBC [27] |
| Perimeter | 50 m | Calculated |
| Total Wall Area | 150 m2/unit × 80 units = 12,000 m2 | Calculated |
| Brick Size | 0.21 m × 0.07 m | Industry Standard |
| Bricks Required | ~21,600 bricks/unit × 80 | Jordan Contractors Association [28] |
Table 2.
SAM 100 operational parameters, including setup time, daily output, labor input, and equipment costs (values derived from industry standards and Jordanian labor data).
Table 2.
SAM 100 operational parameters, including setup time, daily output, labor input, and equipment costs (values derived from industry standards and Jordanian labor data).
| Parameter | Value | Source |
|---|
| Setup Time | 7 days (includes leveling, training) | Ismail et al. [17]; Madsen [29] |
| Daily Output | 2720 bricks/day (adjusted from 3200 for local conditions) | Construction Robotics [18]; Ismail et al. [17] |
| Labor Input | 1 operator + 1 technician + 2 helpers | Jordan Ministry of Labor [30] |
| Mortar Waste | 15% reduction | Construction Robotics [18] |
| Equipment Cost | $20,000/month rental | Ismail et al. [17] |
| Training and Maintenance | 15% of rental cost | Industry benchmarks |
Table 3.
Traditional bricklaying method parameters, including daily output, labor input, and material waste rates (based on contractor interviews and Jordanian workforce data).
Table 3.
Traditional bricklaying method parameters, including daily output, labor input, and material waste rates (based on contractor interviews and Jordanian workforce data).
| Parameter | Value | Source |
|---|
| Daily Output | 500 bricks/day | Sarireh [16] |
| Labor Input | 2 masons + 2 helpers | DOS Jordan [31] |
| Mortar Waste | 20% excess | Albtoush et al. [3] |
| Tools Cost | 50 JD/day | Industry benchmarks (Sarireh [16]; JHDA [24]) |
Table 4.
Bricklaying time comparison between SAM 100 and traditional methods under standard and pandemic-era constraints (80-unit residential cluster).
Table 4.
Bricklaying time comparison between SAM 100 and traditional methods under standard and pandemic-era constraints (80-unit residential cluster).
| Metric | SAM 100 | Traditional | Source |
|---|
| Setup Time | 7 days | 0–1 day | Ismail et al. [17] |
| Operational Speed | 2720/day | 500/day | Calculated |
| Days per Unit | 6.75 | 43.2 | Calculated |
| Days for 80 Units | 540 | 3456 | Calculated |
Table 5.
Per-unit cost breakdown for SAM 100 and traditional bricklaying, including labor, equipment, and material waste (values in Jordanian Dinar, JD).
Table 5.
Per-unit cost breakdown for SAM 100 and traditional bricklaying, including labor, equipment, and material waste (values in Jordanian Dinar, JD).
| Metric | SAM 100 (JD) | Traditional (JD) | Source |
|---|
| Labor Cost | 2268 | 8986 | Jordan Ministry of Labor [30] |
| Equipment Cost | 14,200 | 2160 | Ismail et al. [17] |
| Training and Maintenance | 2130 | 0 | Industry benchmarks |
| Material Waste Cost | 1300 saved | 1800 added | Albtoush et al. [3] |
Table 6.
Financial analysis assumptions for SAM 100 rental model, including annual rental costs, inflation rates, and projected savings.
Table 6.
Financial analysis assumptions for SAM 100 rental model, including annual rental costs, inflation rates, and projected savings.
| Parameter | Value | Source |
|---|
| Annual Rental Cost | 170,400 JD | Ismail et al. [17] |
| Training and Maintenance | 25,560 JD (15% of rental) | Industry benchmarks |
| Annual Projects Completed | 18 (vs. 5.78 traditionally) | Calculated |
| Net Savings | 257,262 JD/year | Derived |
Table 7.
Pandemic-adjusted productivity metrics for SAM 100 and traditional methods, accounting for workforce absenteeism and health restrictions.
Table 7.
Pandemic-adjusted productivity metrics for SAM 100 and traditional methods, accounting for workforce absenteeism and health restrictions.
| Metric | SAM 100 (COVID-19) | Traditional (COVID-19) | Source |
|---|
| Output | 2550/day (6.25% reduction) | 250/day (50% reduction) | Madsen [29]; Albtoush et al. [3] |
| Duration per Unit | 7.2 days | 86.4 days | Calculated |
| Total Duration (80 units) | 576 days | 6912 days | Calculated |
Table 8.
Indirect savings per unit from accelerated timelines using SAM 100, including reduced overhead, inflation impact, and financing costs.
Table 8.
Indirect savings per unit from accelerated timelines using SAM 100, including reduced overhead, inflation impact, and financing costs.
| Cost Category | Estimated Savings Per Unit (JD) | Notes |
|---|
| Overhead Expenses | 800 | Reduced site management, utilities |
| Inflation Impact | 350 | Based on 7.3% annual inflation rate [33] |
| Financing Costs | 400 | Lower interest due to shorter loan duration |
| Total Indirect Savings | 1550 | |
Table 9.
Benchmarking of SAM 100 against regional automation alternatives (e.g., 3D printing) for ROI, labor safety, and scalability in Jordan’s construction sector.
Table 9.
Benchmarking of SAM 100 against regional automation alternatives (e.g., 3D printing) for ROI, labor safety, and scalability in Jordan’s construction sector.
| Metric | SAM 100 | 3D Printing | Source |
|---|
| ROI (Months) | 4.5 | 8–12 | Al-Masri et al. [34] |
| Labor Safety | High (60% less contact) | Moderate | Shen et al. [35] |
| Environmental Impact | 15% waste reduction | 25–30% waste reduction | Al-Masri et al. [34] |
| Skill Requirements | 2–4 weeks training | 8–12 weeks training | Ismail et al. [17] |
| Local Supply Chain | Moderate | Limited | Industry analysis |


