Abstract
To better evaluate the comprehensive performance of Class C fly ash (FA) in terms of soundness and mechanical strength for engineering applications, this study analyzes the effects of CaO and free-CaO (f-CaO) on the strength activity index and soundness of FA. A prediction model for FA strength and soundness is established based on the projection pursuit regression (PPR) method. Through simulation calculations, contour maps of comprehensive performance are drawn, transforming the multi-objective performance optimization problem into single-objective optimization problems of mechanical strength and soundness. The model directly determines the strength activity and soundness of fly ash under different CaO and f-CaO contents. The results indicate that when the f-CaO content does not exceed 4.82%, increasing the CaO content can both ensure the soundness of FA and improve its strength activity index. This study provides guidance for the application of Class C FA in concrete engineering.
1. Introduction
Fly ash is a by-product of lignite and sub-bituminous coal combustion in thermal power plants. GB/T 1596 [1] classifies it into Class F (CaO < 10 wt %) and Class C (CaO ≥ 10 wt %) according to total calcium oxide content. The high CaO level in Class C fly ash includes a considerable fraction of free CaO (f-CaO). When this f-CaO hydrates after the main clinker reactions, it converts to portlandite (Ca(OH)2), accompanied by a 97.9% solid-volume increase. The associated crystallization pressure can generate localized tensile stresses sufficient to cause expansion and, ultimately, cracking [2,3]. Consequently, both the f-CaO content and the replacement level of Class C fly ash must be limited to preserve concrete soundness [4,5,6]. In many regions, Class F fly ash is scarce whereas Class C is abundant; local substitution of the latter for the former can secure supply and reduce cost, but only after a rigorous balance has been struck between mechanical performance and long-term stability.
With CaO levels approaching those of blast-furnace slag, Class C fly ash rapidly consumes portlandite from clinker hydration to precipitate supplementary calcium alumina silicate hydrates, while its own aluminate and silicate phases provide immediate hydraulic reactivity [7]. Study on the Influence of CaO Content in Fly Ash on the Strength Activity Index of Concrete shows that with the increase in CaO content, the mortar strength activity indices at 28 days and 90 days both increase significantly [8]. Research conducted by Shi, Feng, and others [9,10,11,12] demonstrated that the reduced retention time in combustion furnaces leads to finer crystalline particles and enhanced lattice distortion of uncombined CaO in C-type fly ash, thereby promoting rapid expansion evolution in cementitious systems during hydration processes. Li et al. [13] noted that although high-calcium fly ash contains reactive hydraulic phases capable of boosting long-term strength, its elevated free-CaO content frequently induces excessive expansion, severely limiting its large-scale utilization.
The strength activity index and volume stability are not independent indicators; they mutually influence and intrinsically constrain each other. As the CaO and f-CaO content in fly ash increases, volumetric expansion intensifies, leading to stability deterioration and even structural failure. Concurrently, the enhanced cementitious activity of fly ash promotes strength development, where increased internal resistance can constrain volumetric deformation. However, when stability damage exceeds a critical threshold, it causes substantial strength degradation. Their mutual interactions collectively determine the safe dosage range of fly ash in concrete.
The comprehensive performance optimization of concrete materials is essentially a multi-objective optimization problem in mathematics, which seeks the optimal solution while meeting specific indicators. Currently, multi-objective optimization methods include BP neural networks [14,15], MATLAB R2023b neural networks [16], etc. However, these methods often require assumption-based modeling on extensive sample data, involving substantial experimental workload and strong subjectivity. Projection Pursuit Regression (PPR) is an exploratory data analysis method based on the dimension reduction optimization concept, requiring less modeling data, achieving higher modeling accuracy, and eliminating the need for assumption-based processing of raw data. It has been widely applied in concrete performance prediction [17,18,19,20].
To this end, this study focuses on the influence of CaO and f-CaO content in C-class fly ash on stability and strength activity, establishing a strength and stability prediction model for C-class fly ash based on Projection Pursuit Regression (PPR) method, to address the performance evaluation issues when C-class fly ash is used as supplementary cementitious material in concrete. Using contour plots based on the stability and strength activity index prediction models, the optimal mixing ratios of C-class fly ash with varying CaO and f-CaO contents in concrete applications are determined. This provides data support and theoretical foundation for the application and performance optimization of C-class fly ash in hydraulic concrete.
2. Raw Materials and Test Methods
2.1. Raw Materials
Low-heat Portland cement (P·LH 42.5) produced by Burqin Tianshan Cement Co., Ltd., located in Burqin County, Altay Prefecture, Xinjiang Uygur Autonomous Region, China, was used. Its technical properties, chemical composition, and mineral composition are shown in Table 1 and Table 2, while the chemical composition of the fly ash is presented in Table 3.

Table 1.
Technical properties of cement.

Table 2.
Chemical composition and mineral composition of cement (%).

Table 3.
Chemical composition of fly ash (%).
2.2. Test Methods
2.2.1. Soundness Test
The specimens required for stability testing were prepared in accordance with the “Test Methods for Water Requirement of Normal Consistency, Setting Time, and Soundness of Portland Cement” (GB/T 1346-2011) [21], with the following procedures: (1) First, the standard consistency water requirement of the fly ash and cement was determined at the designed mixing ratio. (2) The mixed paste of fly ash and cement was prepared at the standard consistency water requirement according to the designed mixing ratio, and the paste was then filled into the Le Chatelier test mold. (3) After tamping, the oiled glass cover was placed over the mold, which was then transferred to a humidity curing chamber for 22–26 h. (4) Upon reaching the curing age, the distance between the tips of the Le Chatelier indicator needles (A) was measured. (5) The specimen was then transferred to a boiling tank, with sufficient water added to ensure that no additional water was required during the entire boiling process, and the temperature could reach boiling state within 25–35 min. The boiling process lasted between 175 and 185 min. (6) After the boiling process was completed, the tank cover was opened to drain the water, and the specimen was cooled to room temperature. (7) The distance between the tips of the Le Chatelier indicator needles (C) was measured again, and the average increase in distance (C–A) of the test specimens was used as the test result to characterize the expansion degree.
2.2.2. Strength Activity Index Test
The strength activity index was determined in accordance with the test method for fly ash strength activity index specified in Appendix C of Fly Ash for Cement and Concrete (GB/T 1596-2017) [1]. The specific procedures were as follows: (1) 135 g of fly ash, 315 g of low-heat cement, 225 g of test water, and 1350 g of standard sand were weighed and mixed to prepare the test mortar group. Subsequently, 450 g of low-heat cement, 225 g of test water, and 1350 g of standard sand were weighed and mixed to prepare the reference mortar group. (2) The mixed mortars were placed into 40 mm × 40 mm × 160 mm prism test molds, compacted, and then the molds were placed into a standard curing box (temperature: 20 ± 1 °C, humidity: ≥90%) for 24 h before demolding. (3) After demolding, the specimens were immediately placed into curing boxes with proper spacing between them, ensuring the water level was at least 5 mm above the specimens. They were then stored in a standard curing chamber (temperature: 20 ± 1 °C, humidity: ≥90%) until reaching the specified test age of 28 days. (4) Upon reaching the 28-day age, the specimens were removed from the water and subjected to compressive strength testing using a compressive strength testing machine. (5) The corresponding compressive strength results were recorded, and the average value was calculated (if one result deviated by more than ±10% from the average, it was excluded, and the average of the remaining five results was calculated). (6) The 28-day compressive strengths of the test mortar and reference mortar were determined according to Test method of cement mortar strength (ISO method) (GB/T 17671-2021) [22], and the ratio of the two values was used to determine the strength activity index of the fly ash.
where H28: Strength activity index, %;
- R: 28-day compressive strength of the test mortar, MPa;
- R0: 28-day compressive strength of the reference mortar, MPa.
3. Results and Analysis
3.1. Soundness of Class C Fly Ash
3.1.1. Effect of Free f-CaO Content in Class C Fly Ash on the Soundness of Specimens
f-CaO has the most significant impact on the stability of fly ash, and C-class fly ash is consequently restricted in hydraulic concrete applications due to its higher f-CaO content. Free CaO (f-CaO) has the most significant impact on the stability of fly ash, and C-class fly ash is consequently restricted in hydraulic concrete applications due to its higher f-CaO content. In Figure 1, when f-CaO content increases from 0–1% to 4–5%, the Le Chatelier expansion value rises by 5.0 mm, with the maximum increment (2.72 mm) occurring during the transition from 3–4% to 4–5% f-CaO. At 4–5% f-CaO content in C-class fly ash, the Le Chatelier expansion value reaches 5.92 mm, exceeding the stability limit specified in GB/T 1596-2017 (expansion value ≤ 5 mm).
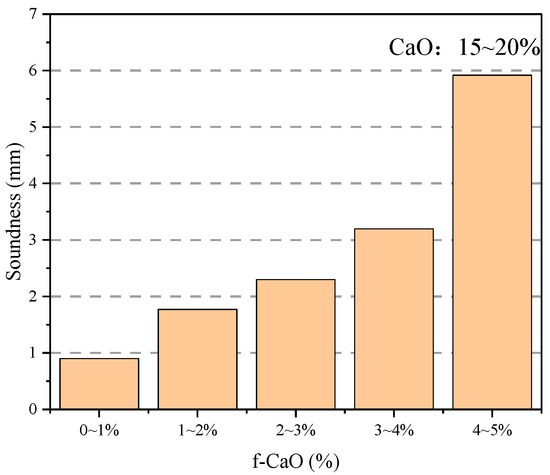
Figure 1.
Soundness of Fly Ash with Different f-CaO Contents.
3.1.2. Effect of Curing Age on the Soundness of Specimens
Fly ash samples with varying CaO and f-CaO contents were selected: a (18.7% CaO, 6.5% f-CaO), b (15.7% CaO, 3.0% f-CaO), and c (12.2% CaO, 0.7% f-CaO). These were mixed with cement at a mass ratio of 3:7 and a water-cement ratio of 0.4 to prepare the cementitious paste. The specimens were molded in Le Chatelier molds and subjected to standard curing from 0 to 180 days. The stability variations are shown in Figure 2. As shown, the Le Chatelier expansion values of all specimens increased with curing age, but the expansion rates varied across different periods, which can be divided into three stages: (1) Rapid expansion stage (1–7 days): characterized by high expansion rates and rapid value increase; (2) Deceleration stage (7–28 days): marked by reduced expansion rates and slowed value growth; (3) Stabilization stage (28–180 days): exhibiting minimal expansion rates and nearly constant volume. Taking sample a as an example, the Le Chatelier expansion values at 1, 7, 28, 90, and 180 days were 3.5 mm, 11.0 mm, 12.6 mm, 12.7 mm, and 12.7 mm, respectively. The average expansion rates were 1.25 mm/day during 1–7 days, 0.08 mm/day during 7–28 days, and nearly 0 mm/day during 28–180 days. At identical curing ages, higher f-CaO content in fly ash led to progressively greater Le Chatelier expansion values. At 28 days, sample a exhibited a 10 mm increase compared to sample b, failing the stability standard, whereas the increase was only 1.3 mm compared to sample c, maintaining acceptable stability.
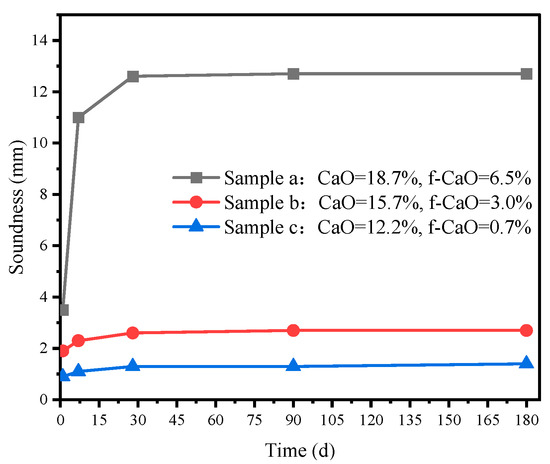
Figure 2.
Soundness of Class C Fly Ash at Different Hydration Ages.
3.2. Strength Activity Index of Class C Fly Ash
Figure 3 illustrates the strength activity indices of fly ash samples A (4.04% CaO, 0% f-CaO), B (7.30% CaO, 0.55% f-CaO), C (12.16% CaO, 0.69% f-CaO), and D (16.19% CaO, 1.39% f-CaO) after 28 and 90 days of curing. The results indicate that the strength activity index increases with both CaO content and curing age. Specifically, a 12.15% increase in CaO content led to a 16.13% relative improvement in the strength activity index at 28 days, while the corresponding increase was only 11.04% at 90 days. This suggests that although elevated CaO content contributes to strength development, its enhancing effect weakens as hydration progresses. Microstructurally, at 28 days, the hydration products of fly ash display distinct filling morphologies. Partially hydrated fly ash particles exhibit larger contact areas and stronger bonding compared to intact spherical particles, resulting in higher mechanical strength. By 90 days, however, the influence of this filling effect becomes less pronounced, leading to a reduced relative contribution to strength enhancement.
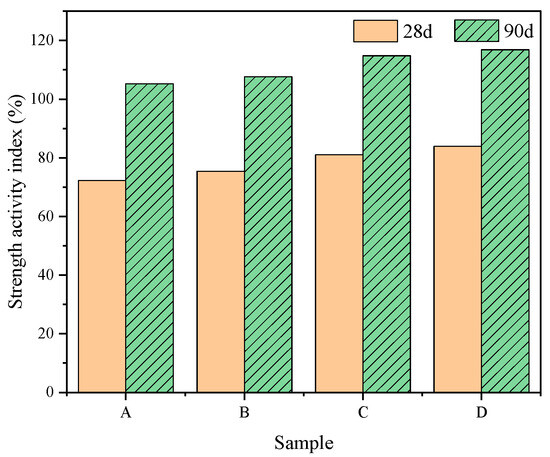
Figure 3.
Strength activity index of fly ash samples at different curing ages.
4. PPR-Based Performance Optimization Model for Fly Ash
4.1. Projection Pursuit Regression (PPR) Method
PPR stands out as a prominent approach in the field of Exploratory Data Analysis (EDA). However, the issue of “curse of dimensionality” tends to arise in complex system modeling. To address this, the projection method of PPR can be utilized: by selecting an appropriate projection direction for dimensionality reduction, it becomes possible to fully explore the information inherent in the structure or features of high-dimensional data [23,24,25]. The basic principle of PPR is as follows [26,27]: Let (X, Y) denote a set of random variables, where Y is a Q-dimensional random variable and X is a P-dimensional random variable. Through continuous observation and analysis of (X, Y) using PPR, a weighted sum of several ridge functions is obtained. The PPR model can be expressed by Equation (1) [19,28]:
In the formula: the m-th ridge function, = 0, ; M is the number of upper limits of the leading function, represents the contribution weight coefficient of the ridge function. Related theories and algorithms are detailed in the literature.
4.2. Modeling Sample Conditions and Parameter Selection
4.2.1. Modeling Sample Conditions
Table 4 presents the distribution of modeling and validation samples. As shown in the table, the modeling and validation samples are distributed as uniformly as possible within a relatively wide sample range. There are a total of 65 samples, among which 49 are used for modeling and 16 for validation. When the content of free calcium oxide (f-CaO) in fly ash is relatively high, the volume expansion of concrete tends to increase, and the soundness of concrete is likely to be unqualified [29]. The early-stage volume change in concrete occurs within approximately 28 days, and remains stable after 28 days [30]. In contrast, the strength activity index increases with the increase in curing age. Therefore, in the modeling process, the 28-day strength activity index and the soundness (determined by the Le Chatelier method) are adopted as the core indicators for model establishment. Since the modeling process for both indicators is identical, the following description will take the modeling of the strength activity index as an example.

Table 4.
Sample distribution of modeling and testing.
4.2.2. Selection of Modeling Parameters
The relative error between the experimental values and the calculated values was adopted as the criterion for determining the qualification rate. Specifically, a sample was judged as unqualified when the calculated value was ≤the relative error, and qualified when the calculated value was >the relative error. Table 5 presents the qualification rates of the modeling samples and validation samples for the PPR model. As shown in the table, the qualification rates of both modeling and validation samples increase with the decrease in the smoothing coefficient (Span). Span determines the sensitivity of the model: the smaller the Span value, the higher the model sensitivity. To ensure that the qualification rates of the modeling and validation samples are both high and close to each other, the smoothing coefficient (Span) can be set to 0.1, and the relative error (δ) to 10%.

Table 5.
Qualification Rates of Modeling Samples and Validation Samples for Strength Activity Index Modeling.
By comparing the modeling parameters in Table 5 and Table 6, the optimal modeling parameters were established. The final selected model parameter table is shown in Table 7. M represents the upper limit of ridge function levels, Mu denotes the optimal number of ridge functions, P indicates the relative error, N signifies the sample size, and Q represents the number of output variables. Together, these parameters determine the precision with which the model identifies the intrinsic structure of the data.

Table 6.
Qualification Rates of Modeling Samples and Validation Samples for Soundness Modeling.

Table 7.
Parameter Table of the PPR Model.
4.3. Model Data Analysis
The calculation model for the strength activity index was established and validated using the samples distributed as shown in Table 5. Substituting these samples into the PPR model formula, the resulting expression is given in Equation (2):
The contribution weight coefficients of the ridge functions are given in Equation (3):
The projection directions are given in Equation (4):
The ridge functions are shown in Figure 4:

Figure 4.
Strength Activity Index Ridge Function Curves of the PPR Model.
For the calculation model of soundness, the projection direction α (alpha) can be obtained through calculation, as shown in Equation (5):
The ridge functions are shown in Figure 5:

Figure 5.
Soundness Ridge Function Curves of the PPR Model.
The weight values β (beta) of the ridge functions in the projection direction α (alpha) are given in Equation (6):
By substituting Equations (5) and (6) into Equation (1), the prediction formula for fly ash soundness based on Projection Pursuit Regression (PPR) can be obtained, as shown in Equation (7):
The influence weights of various oxides are shown in Table 8 and Table 9. From the tables, it can be seen that the strength activity index oxide components are ranked by weight as follows: CaO > SiO2 > MgO > Fe2O3, with CaO having the greatest impact on stability; while the stability oxide components are ranked by weight as follows: f-CaO > SO3 > CaO > SrO, with f-CaO having the greatest impact on stability.

Table 8.
Factors Influencing the Weight of Strength Activity Index.

Table 9.
Weight of Stability Influencing Factors.
4.4. Model Accuracy Analysis
Figure 6 shows the comparison between the predicted and measured values of the strength activity index and soundness based on the PPR model. As can be seen from the figure, when the relative error |δ| between the predicted and measured values of the strength activity index for the modeling and validation samples is ≤10%, the pass rates for the modeling and validation samples reach 100% and 93.8%, respectively. For soundness, when the relative error |δ| between the predicted and measured values for the modeling and validation samples is ≤20%, the pass rates for the modeling and validation samples reach 78.3% and 75.0%, respectively. The pass rates for the modeling samples and the reserved validation samples are reduced.
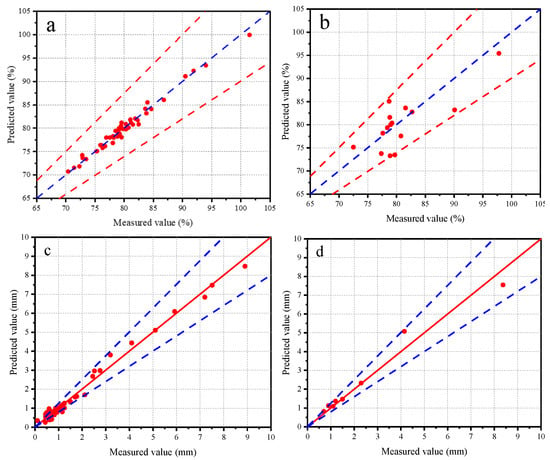
Figure 6.
Results of Consistency Test of Accuracy (a–d).
In this paper, Equations (8) and (9) are used to evaluate the stability and prediction accuracy of the model, and their mathematical expressions are presented as follows:
Here, yi represents the i-th group of experimental data; represents the predicted value of the i-th group from the PPR model; n denotes the number of data in the dataset; represents the average value of the experimental data. The coefficient of determination R2 is an indicator for evaluating the fitting performance of the model. The closer its value is to 1, the better the fitting performance of the model. The smaller the RMSE value, the better. Through calculation, we can obtain R2 = 0.982 and RMSE = 0.761.
4.5. Simulation Calculation
Based on the established PPR computational model, simulations were conducted to calculate the strength activity index and soundness of fly ash with CaO content ranging from 4% to 21% and f-CaO content ranging from 0% to 7%. This was performed to analyze the effects of CaO and f-CaO on the strength activity index. The results are shown in Figure 7. As can be seen from the figure, f-CaO has the greatest impact on the soundness of fly ash, with volume deformation increasing as the content of f-CaO increases. The strength activity index also primarily increases with the increase in CaO content.
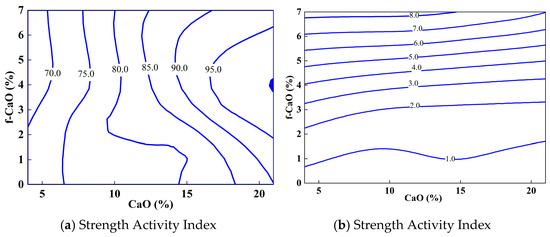
Figure 7.
Contour Map of Fly Ash Properties.
5. Discussion
In practical engineering applications, the primary concern for Class C fly ash is stability [31]. However, in addition to strict control of stability, its activity index is also a key consideration. Due to its higher CaO content compared to Class F fly ash, Class C fly ash exhibits a higher activity index. Under otherwise identical conditions, its use can enhance concrete strength. Therefore, when applying Class C fly ash in engineering projects, it is essential to comprehensively evaluate its impact on concrete performance by considering both stability and activity index. Overall, despite the higher f-CaO and CaO content in Class C fly ash, increasing the CaO content within a certain range can enhance the activity index, provided that stability requirements are met.
Taking an engineering project as an example, when local Class F fly ash supply is insufficient, partial replacement with Class C fly ash is necessary, provided that the strength activity index meets or exceeds 70% and stability criteria are satisfied. As indicated by the contour plot of fly ash stability and strength activity index (Figure 8) in prior research, stability is primarily influenced by f-CaO content, with volumetric expansion increasing proportionally [32]. In contrast, the strength activity index is predominantly governed by CaO content, showing positive correlation. When fly ash CaO content exceeds 5%, the strength activity index requirement is met, whereas f-CaO content must be ≤4.82% to satisfy stability criteria. Therefore, fly ash with ≥5% CaO and ≤4.82% f-CaO is recommended for optimal performance.
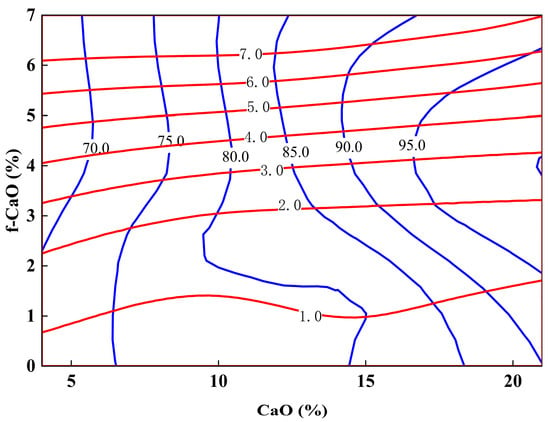
Figure 8.
Contour map of activity index and stability. (The red line represents stability, while the blue line indicates the strength activity index).
6. Conclusions
This study conducts a comprehensive evaluation of two key indicators for fly ash in concrete: stability and strength activity index. Based on computational analysis of stability and strength activity index data for Class C fly ash with varying CaO and f-CaO contents, the following conclusions are drawn:
- (1)
- A prediction model for strength activity index and stability of Class C fly ash was developed using the PPR method. Experimental validation demonstrates the model’s high accuracy and stability, with relative errors between predicted and measured values within 10% and 20% for training and test samples, respectively. The qualification rates for strength activity index reached 100% and 93.8%, while stability achieved 78.3% and 75%. The model enables prediction of strength activity index and stability for Class C fly ash with varying CaO and f-CaO contents.
- (2)
- In practical engineering, both the stability and the strength activity index of Class C fly ash should be comprehensively considered. Research shows that stability requirements are met when f-CaO content does not exceed 4.82%. Under this condition, appropriately increasing CaO content can enhance the strength activity index, thereby improving concrete strength.
- (3)
- Based on the predictive model, fly ash selection criteria can be determined according to engineering requirements, providing robust data support for the application of Class C fly ash in hydraulic concrete and theoretical references for similar projects.
Author Contributions
Conceptualization, X.K. and M.C.; Methodology, M.G. and J.G.; Writing—original draft, L.Y., L.J. and M.G.; Writing—review and editing, Y.W., M.C. and M.G.; Supervision, J.G. and X.K.; Funding acquisition, X.K. and M.C. All authors have read and agreed to the published version of the manuscript.
Funding
The authors are grateful for the funding of the Supported by Open Research Fund of State Key Laboratory of Water Cycle and Water Security (Grant No. SKL2025TDGG02) and Xinjiang Water Development Construction Group (EQ098/FY079, QBT067/FY28).
Data Availability Statement
The original contributions presented in the study are included in the article. Further inquiries can be directed to the corresponding authors.
Conflicts of Interest
Author Mingshan Chen was employed by the company Xinjiang Water Resources Development and Construction Group Co., Ltd. The remaining authors declare that the research was conducted in the absence of any commercial or financial relationships that could be construed as a potential conflict of interest.
References
- GB/T 1596-2017; Fly Ash Used for Cement and Concrete. China Standards Press: Beijing, China, 2017.
- Wang, Q.; Wang, D.; Zhuang, S. The soundness of steel slag with different free CaO and MgO contents. Constr. Build. Mater. 2017, 151, 138–146. [Google Scholar] [CrossRef]
- Zhang, Z.; Cao, P.; Wang, Y.; Zhao, X.; Liu, J. Effect of Fe and Mn on the hydration activity of f-CaO in steel slag. Constr. Build. Mater. 2024, 421, 135719. [Google Scholar] [CrossRef]
- Zhang, J.; Lv, T.; Han, Q.; Zhu, Y.; Hou, B. Effects of fly ash on MgO-based shrinkage-compensating cement: Microstructure and properties. Constr. Build. Mater. 2022, 339, 127648. [Google Scholar] [CrossRef]
- Yao, X.; Ren, X.; Ye, J.; Cao, F.; Xu, C.; Zhai, M.; Zhang, W. Prediction of f-CaO content in cement clinker using a GRU-based deep learning model with masked-attention mechanism for incomplete DCS data. J. Sustain. Cem.-Based Mater. 2025, 14, 1413–1426. [Google Scholar] [CrossRef]
- Zhao, Y.; Yang, C.; Bao, Y.; Lou, S.; Machingura, G.B.; Xiao, H.; Tian, P. SA-MSIFF: Soft sensing the cement f-CaO content with a self-adaptive multisource information fusion framework in clinker burning process. J. Process Control. 2024, 141, 103282. [Google Scholar] [CrossRef]
- Zhou, B. Study on the Volumetric Stability of High Calcium Fly Ash-Cement (Part 1). Fly Ash 2000, 4, 8–11. [Google Scholar]
- Uçurum, M.; Özdemir, A.; Teke, Ç. Optimization of surface modification parameters of fly ash with high calcium oxide (CaO) content to use as a filling material. Powder Technol. 2025, 451, 120463. [Google Scholar] [CrossRef]
- Shi, H. Research on intrinsic characteristics and hydration properties of fly ash with high calcium oxide. J. Tongji Univ. 2003, 31, 1440–1444. [Google Scholar]
- Shi, H. Microstructure and hydration activity of calcium oxide. J. Chin. Ceram. Soc. 1994, 22, 117–123. [Google Scholar]
- Shi, H.; Zhao, Y.; Li, W. Effect of temperature on the hydration characteristics of free lime. Cem. Concr. Res. 2002, 32, 789–793. [Google Scholar] [CrossRef]
- Feng, T.; Shi, H.; Fan, F. Research on the microstructure and hydration activity of f-CaO in some materials. J. Build. Mater. 1999, 2, 187–192. [Google Scholar]
- Li, H.; Shi, S.; Feng, S.; Shen, B.; Zhang, J. Experimental Study on the Decomposition of f-CaO in High Calcium Fly Ash. Silic. Bull. 2009, 28, 1263–1266+1275. [Google Scholar]
- Fang, J.; Tan, C.Y.; Janasekaran, S.; Tai, V.C.; Wang, D.; Wang, D.; Yang, Y.; Fan, Y. Multi-objective optimization of laser powder bed fusion parameters for SiC/Ti composites using a BP neural network and NSGA-II. J. Mater. Res. Technol. 2025, 39, 1466–1479. [Google Scholar] [CrossRef]
- Jie, H.; Rong, D.G.; Yunhua, L. Multi-objective Optimization for Axial Flow Fan Based on BP Neural Network and Genetic Algorithm. J. Chin. Soc. Mech. Eng. 2018, 39, 433–442. [Google Scholar]
- Golafshani, E.M.; Pazouki, G. Predicting the compressive strength of self-compacting concrete containing fly ash using a hybrid artificial intelligence method. Comput. Concr. 2018, 22, 419–437. [Google Scholar]
- Jiang, C.; Gong, J.; Tang, X.; Jiang, L.; Zheng, Z. Optimization Method of Comprehensive Properties of Low Heat Cement Cementitious System Based on Projection Pursuit Regression. J. Build. Mater. 2019, 22, 333–340. [Google Scholar]
- He, J.; Geng, X.; Yang, H.; Gao, P. Calculation Model for Moisture-Induced Deformation Based on PPR Unconditional Modeling. J. Wuhan Univ. 2024, 1–14. [Google Scholar]
- Yang, H.; Yang, W.; Liu, H.; Ma, J.; Wang, J. Stress-strain law fitting of sand and gravel based on PPR data modeling technology. Mater. Rev. 2023, 37, 137–142. [Google Scholar]
- Yang, Z.; Yang, W.; Yang, H.; Liu, L.; He, J. Study of stress-strain relationship of hydraulic asphalt concrete at low to intermediate temperatures based on experimental data regression. Constr. Build. Mater. 2023, 409, 134059. [Google Scholar] [CrossRef]
- GB/T 1346-2011; Test Methods for Water Requirement of Normal Consistency, Setting Time and Soundness of the Portland Cement. China Standards Press: Beijing, China, 2011.
- GB/T 17671-2021; Test Method of Cement Mortar Strength (ISO Method). China Standards Press: Beijing, China, 2021.
- Yang, Z.; He, J.; Li, Z.; Yang, W.; Lu, J. Optimization of asphalt concrete mix ratio based on PPR TOPSIS analysis. Adv. Water Resour. Hydropower Sci. Technol. 2023, 43, 82–88. [Google Scholar]
- Yang, Z.; He, J.; Yang, W.; Lu, J. Calculation model of deviational stress of hydraul ic asphalt concrete based on PPR assumption-free modeling. J. Wuhan Univ. 2024, 57, 1–9. [Google Scholar]
- Gong, J.; Zheng, R.; Qin, C.; Chen, R.; Cao, G. Prediction of thermal conductivity of concrete under variable temperatures in cold regions using projection pursuit regression. Cold Reg. Sci. Technol. 2022, 203, 103642. [Google Scholar] [CrossRef]
- Gong, J.; Jiang, C.; Tang, X.; Zheng, Z.; Yang, L. Optimization of mixture proportions in ternary low-heat Portland cement-based cementitious systems with mortar blends based on projection pursuit regression. Constr. Build. Mater. 2020, 238, 117666. [Google Scholar] [CrossRef]
- Zhu, X.; Bai, Y.; Chen, X.; Tian, Z.; Ning, Y. Evaluation and prediction on abrasion resistance of hydraulic concrete after exposure to different freeze-thaw cycles. Constr. Build. Mater. 2022, 316, 126055. [Google Scholar] [CrossRef]
- Qin, C.; Gong, J.; Xie, G. Modeling Hydration Kinetics of the Portland-Cement-Based Cementitious Systems with Mortar Blends by Non-Assumptive Projection Pursuit Regression. Thermochim. Acta 2021, 705, 179035. [Google Scholar] [CrossRef]
- Chen, T.; Weng, Y.; Liu, Y.; Ji, X.; Liu, J. Calculation of f-CaO Hydration Ratio in Steel Slag Based on Mathematical Model of Hydration Expansion of Steel Slag–Cement Cementitious Materials. JOM 2023, 75, 5243–5251. [Google Scholar] [CrossRef]
- Zhao, J.; Liu, Q.; Fang, K. Optimization of f-MgO/f-CaO phase in ladle furnace slag by air rapidly cooling. Mater. Lett. 2020, 280, 128528. [Google Scholar] [CrossRef]
- Yusra, I. Thermodynamic Simulation of Fly Ash’s Influence on the Phase Composition of Cement Paste Hydration Products. Ph.D. Thesis, Central South University, Changsha, China, 2023. [Google Scholar]
- Hui, D. Research on Data Augmentation and Soft Measurement Model for Free Calcium in Cement Clinker Based on Generative Adversarial Networks. Ph.D. Thesis, Yanshan University, Qinhuangdao, China, 2023. [Google Scholar]
Disclaimer/Publisher’s Note: The statements, opinions and data contained in all publications are solely those of the individual author(s) and contributor(s) and not of MDPI and/or the editor(s). MDPI and/or the editor(s) disclaim responsibility for any injury to people or property resulting from any ideas, methods, instructions or products referred to in the content. |
© 2025 by the authors. Licensee MDPI, Basel, Switzerland. This article is an open access article distributed under the terms and conditions of the Creative Commons Attribution (CC BY) license (https://creativecommons.org/licenses/by/4.0/).