Figure 1.
SEM images of HRB400 steel and HRB400 steel samples immersed in sol-gel solutions (pH = 10) with different metal ions: (a) Blank HRB400 steel; (b) Undoped sol-gel; (c) LS film; (d) NS film; (e) 0.8LNS film; (f) 0.2LNS film; (g) 0.05LNS film; (h) 0.5 wt% 2-MI—0.8LNS film; (i) 1 wt% 2-MI—0.8LNS film; (j) 2wt% 2-MI—0.8LNS film.
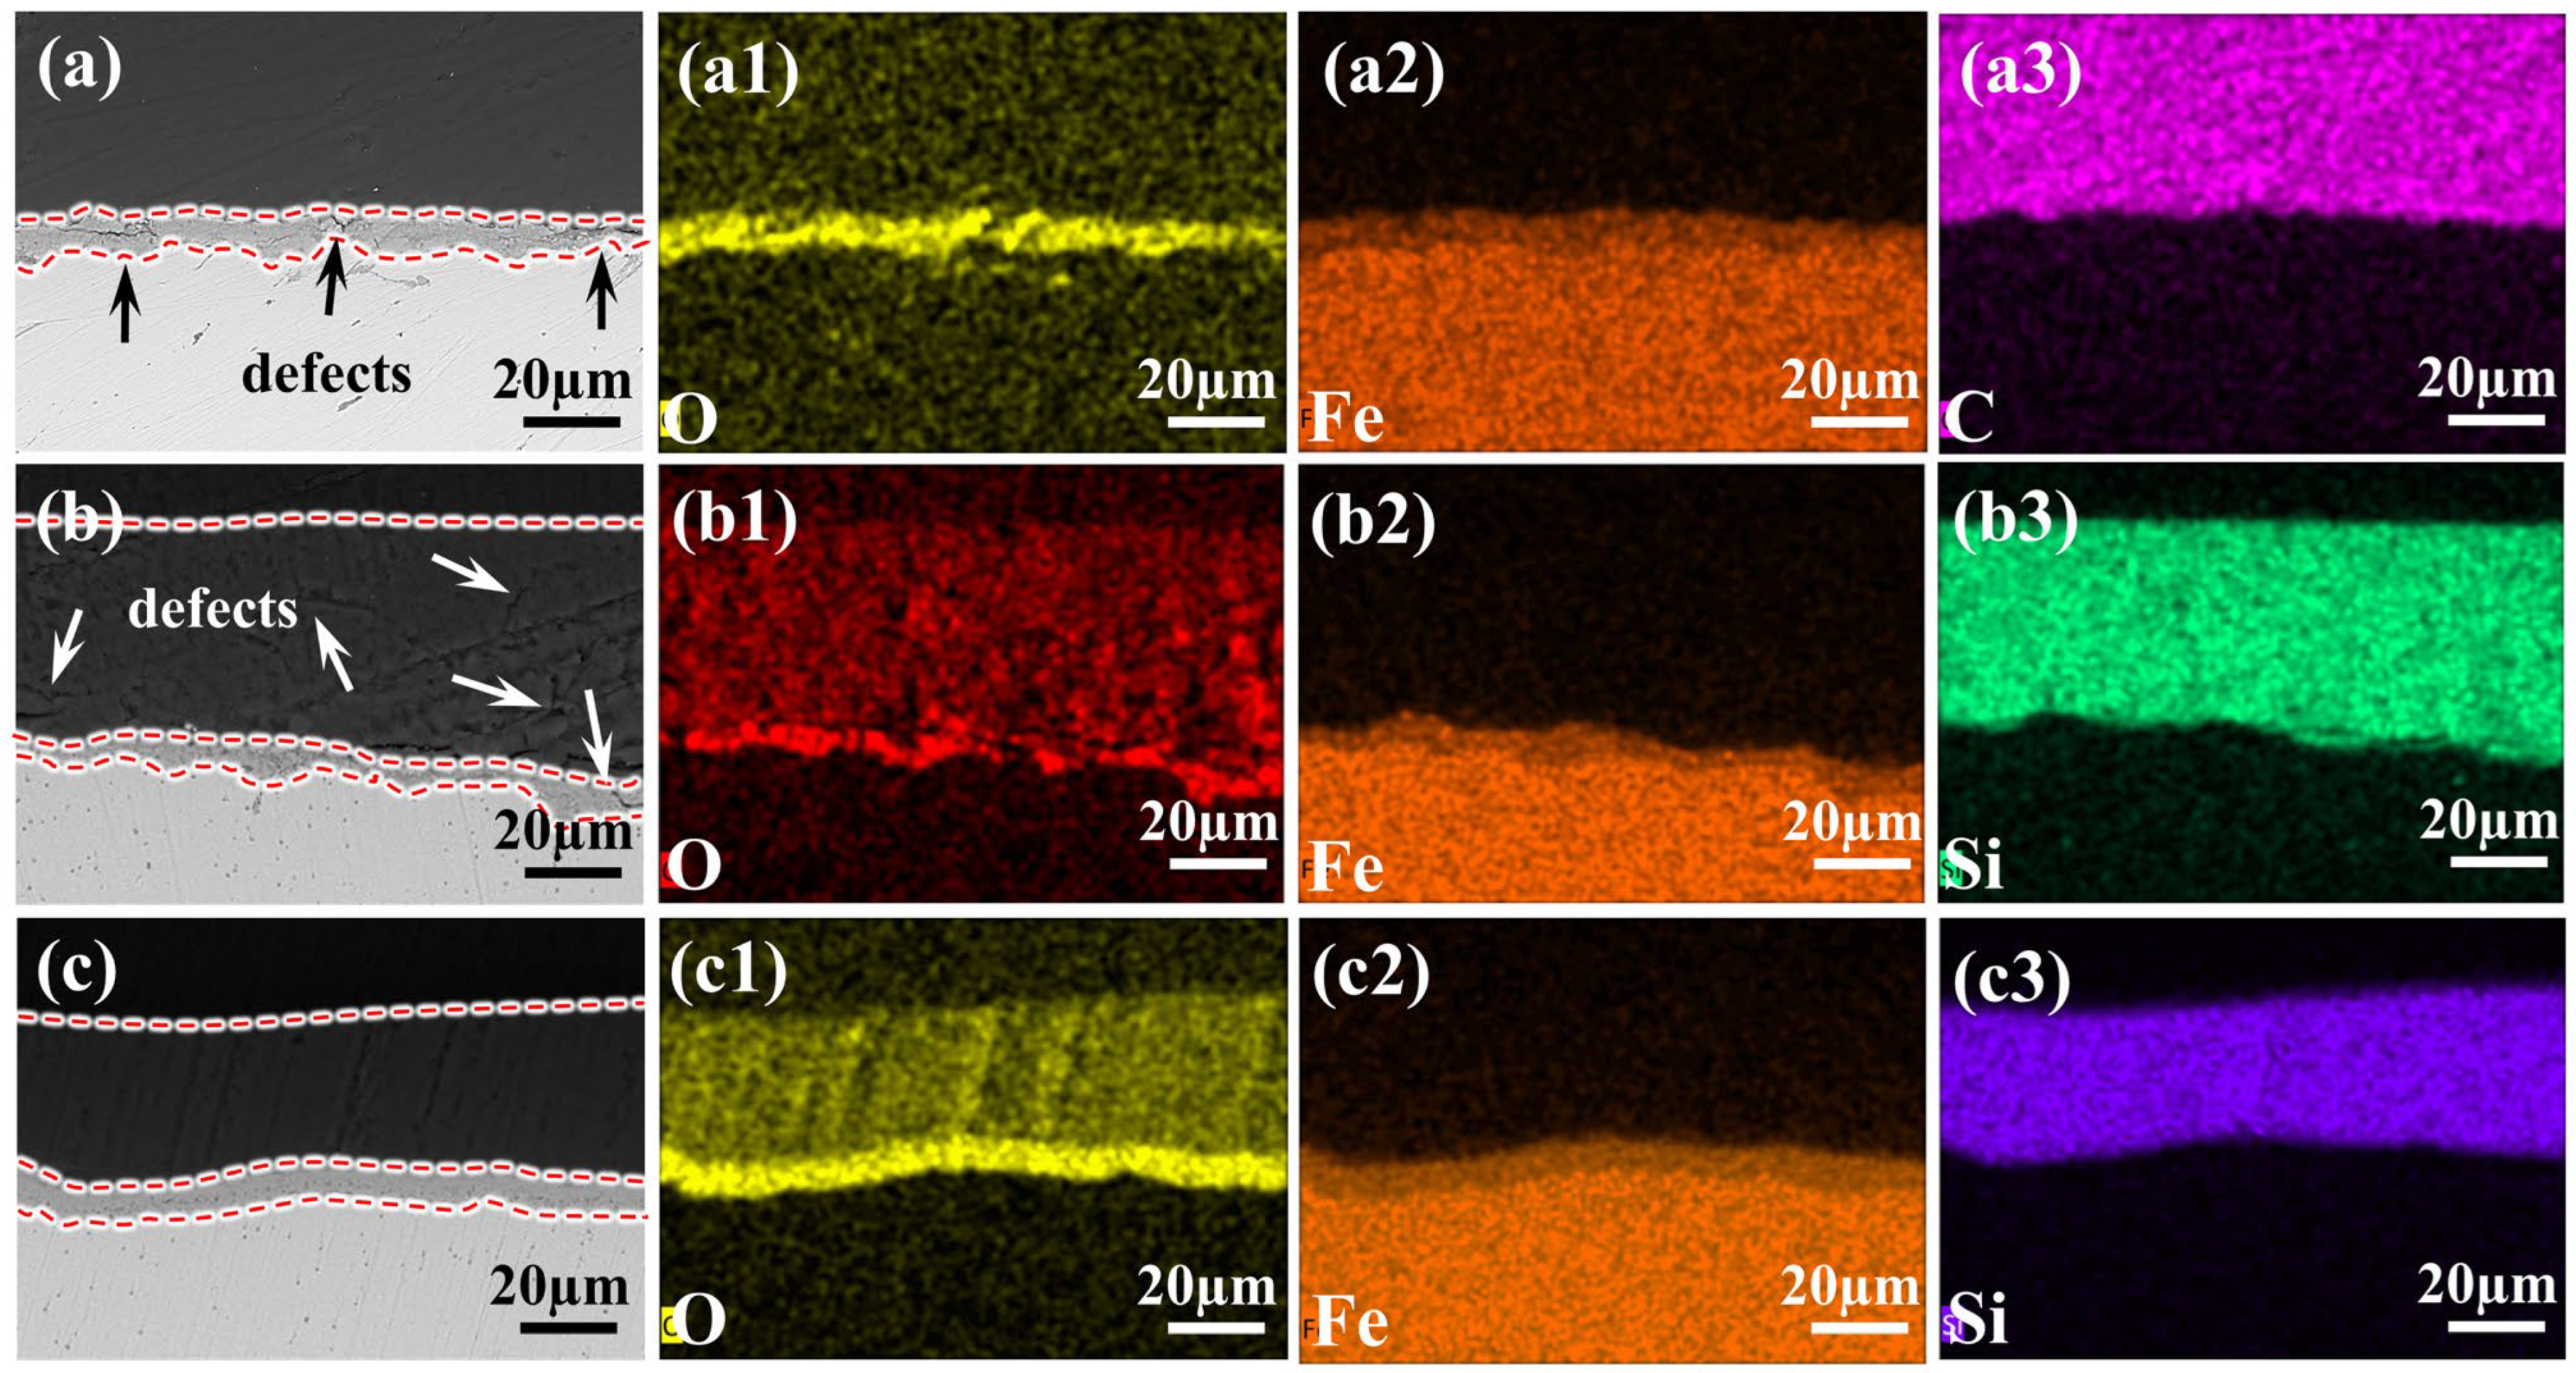
Figure 2.
Cross-sectional BSE images and EDS: (a,a1–a3) Blank sample and distribution of O, Fe, C elements; (b,b1–b3,c,c1–c3) cross-sectional BSE images and distribution of O, Fe, Si elements for samples modified with 0.8LNS film and 1wt% 2-MI—0.8LNS film, respectively. The added red dashed line demarcates the interface boundary.
Figure 3.
XRD spectra: (a) Blank HRB400, Undoped sol-gel, 0.8LNS film, 1 wt% 2MI—0.8LNS film; FTIR spectra: (b1,b2) Undoped sol-gel, 0.8LNS, 1 wt% 2-MI—0.8LNS solution FTIR spectra and magnified bands at 700 cm−1–400 cm−1; (c) sol-gel precursors GPTMS and TEOS; (d1,d2) FTIR spectra and magnified bands at 700 cm−1–400 cm−1 of Undoped sol-gel film, 0.8LNS film, 1 wt% 2-MI—0.8LNS film generated on high-temperature steel bar surface after immersion.
Figure 4.
(a1–a3) Blank HRB400; (b1–b6) 1 wt% 2-MI—0.8LNS film; XPS spectra of C 1s, O 1s, Si 2p, Fe 2p, Ni 2p, La 3d. (c1–c3) exposed surface after removing the 1 wt% 2-MI—0.8LNS film from sample.
Figure 4.
(a1–a3) Blank HRB400; (b1–b6) 1 wt% 2-MI—0.8LNS film; XPS spectra of C 1s, O 1s, Si 2p, Fe 2p, Ni 2p, La 3d. (c1–c3) exposed surface after removing the 1 wt% 2-MI—0.8LNS film from sample.
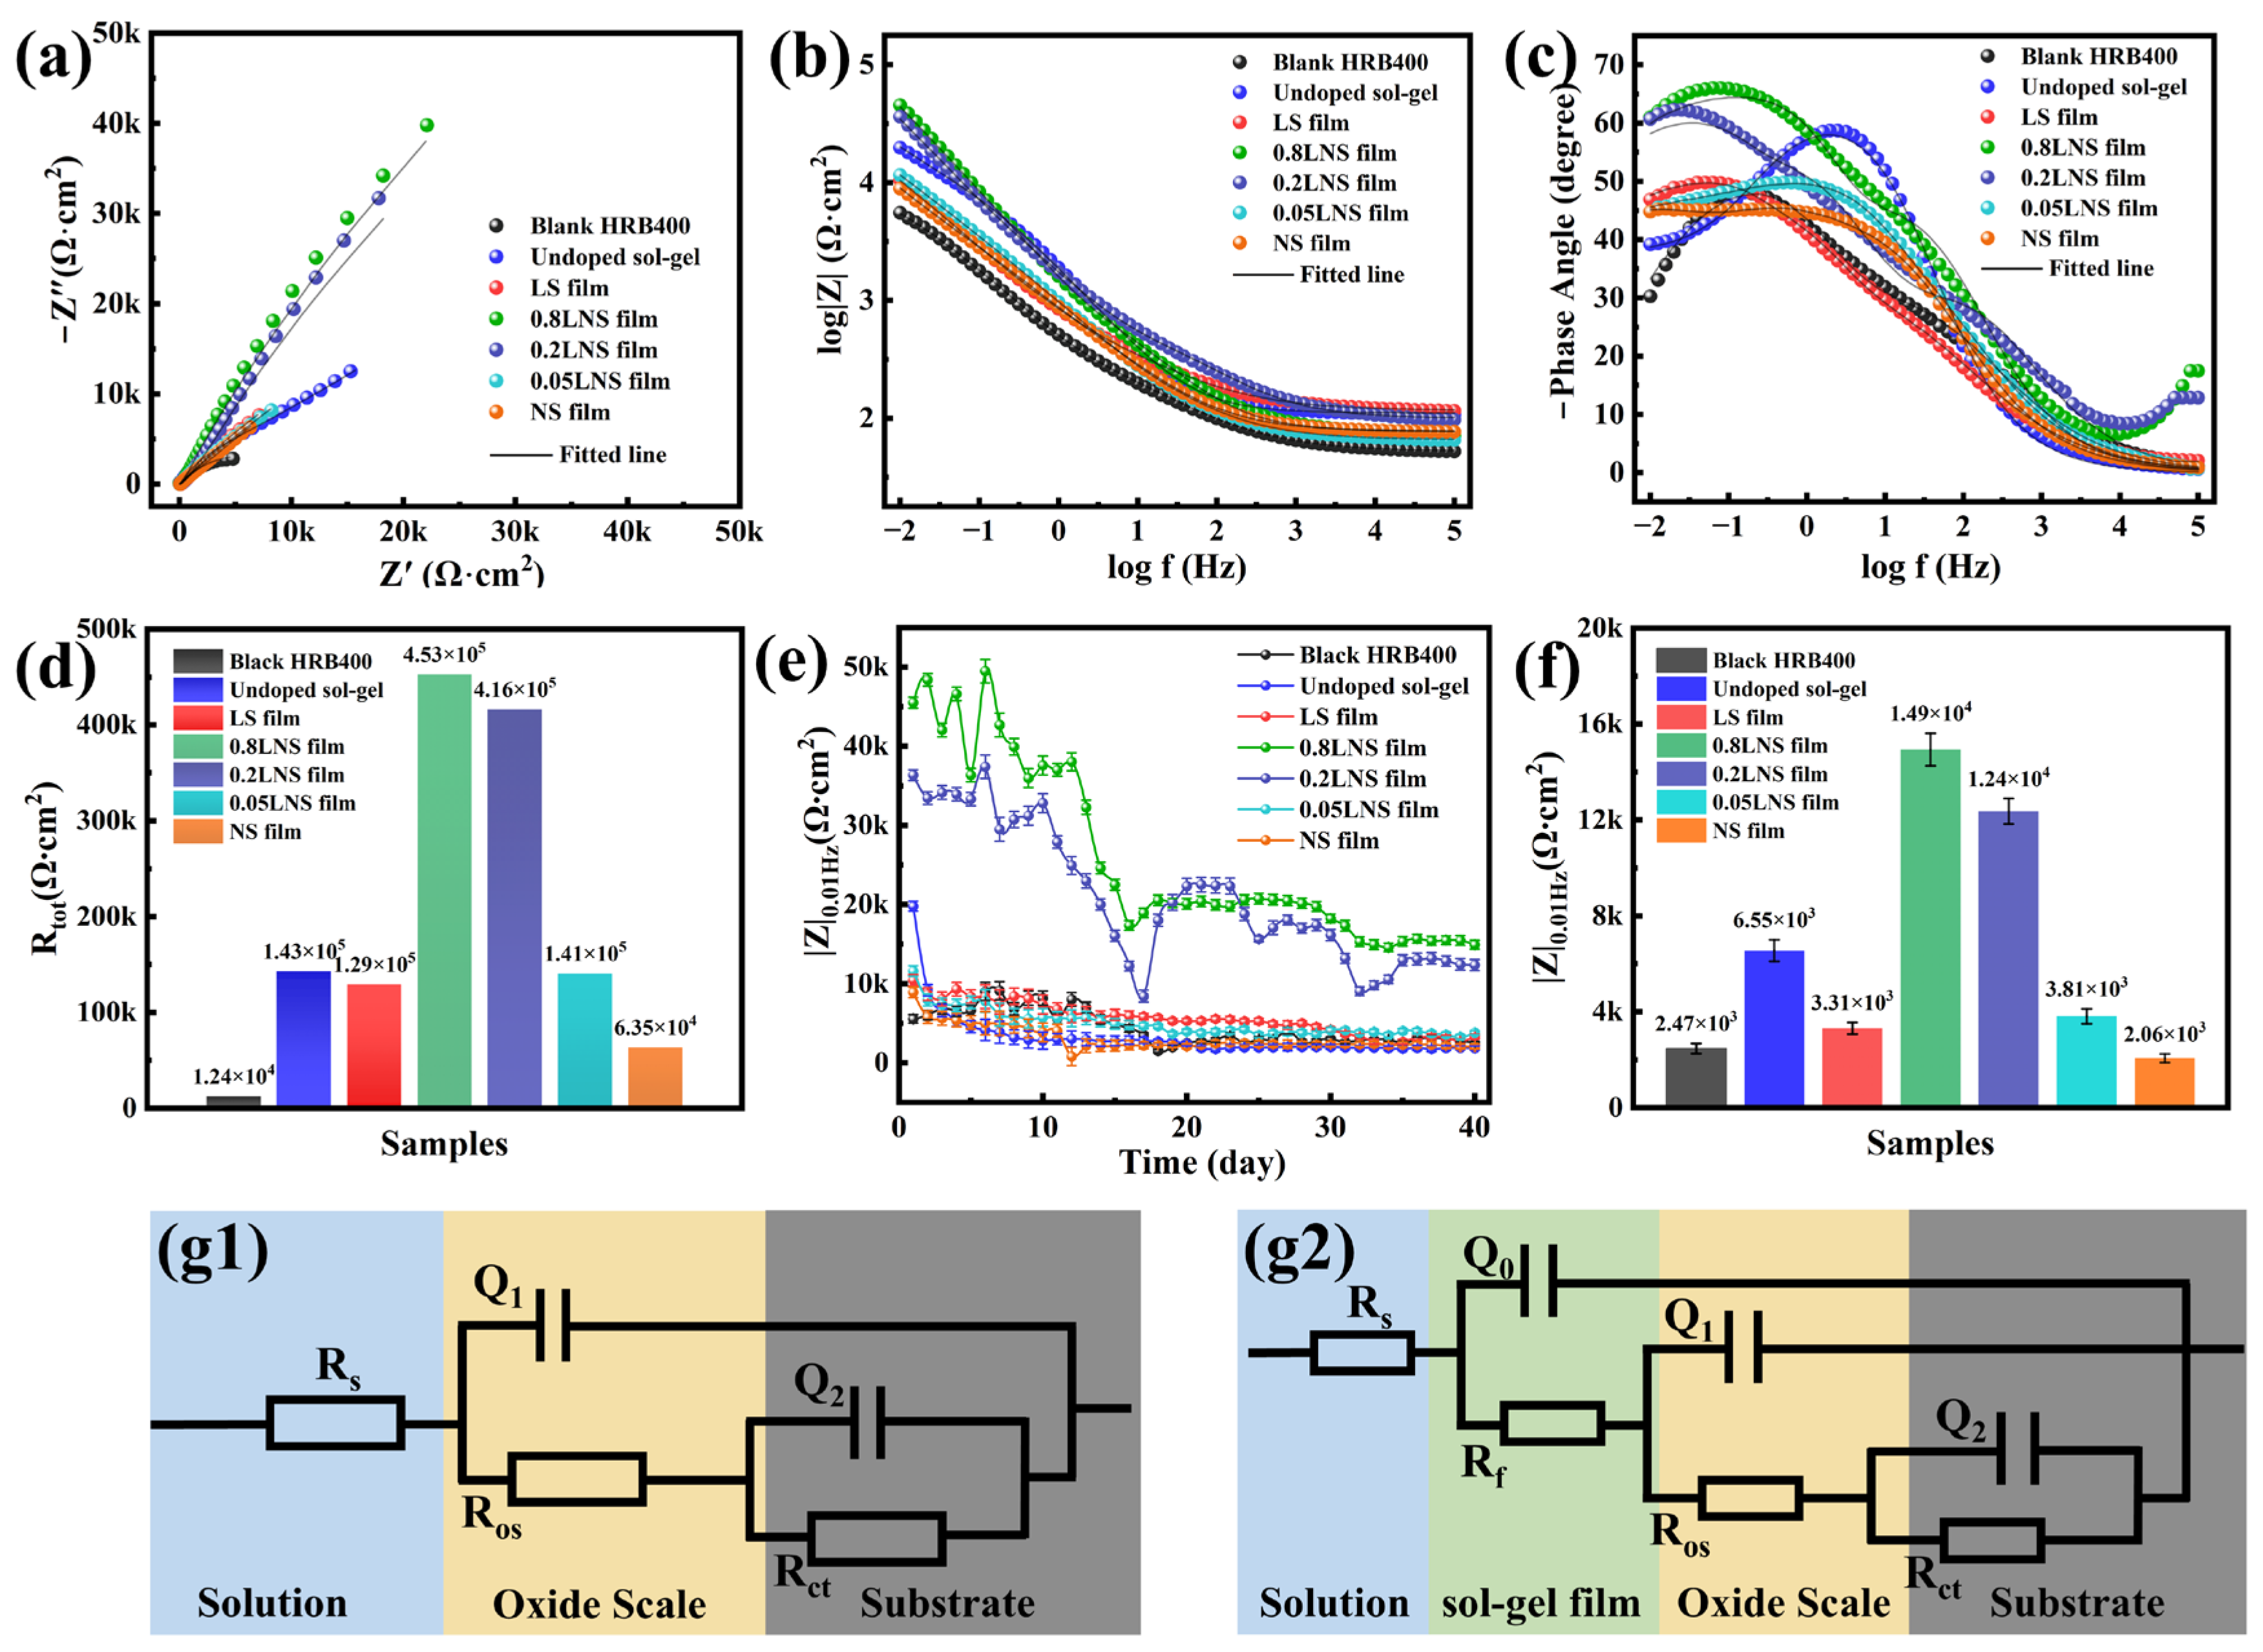
Figure 5.
Electrochemical impedance plots of steel bars immersed at 400 °C in sol-gel solutions with pH = 10 and different Cla3+:CNi2+ ratios after treatment in 0.1 M NaCl + SCP solution: (a) Nyquist plots and fitting data; (b,c) Bode plots and fitting data; (d) comparison of fitted Rtot for different samples; (e) variation in low-frequency |Z|0.01Hz modulus for different samples during 40 days of immersion; (f) comparison of low-frequency |Z|0.01Hz modulus for different samples on the 40th day of immersion; equivalent circuit diagrams for different samples: (g1) represents the fitting circuit for unmodified mill-scale steel; (g2) represents the fitting circuit for mill-scale steel with sol-gel film.
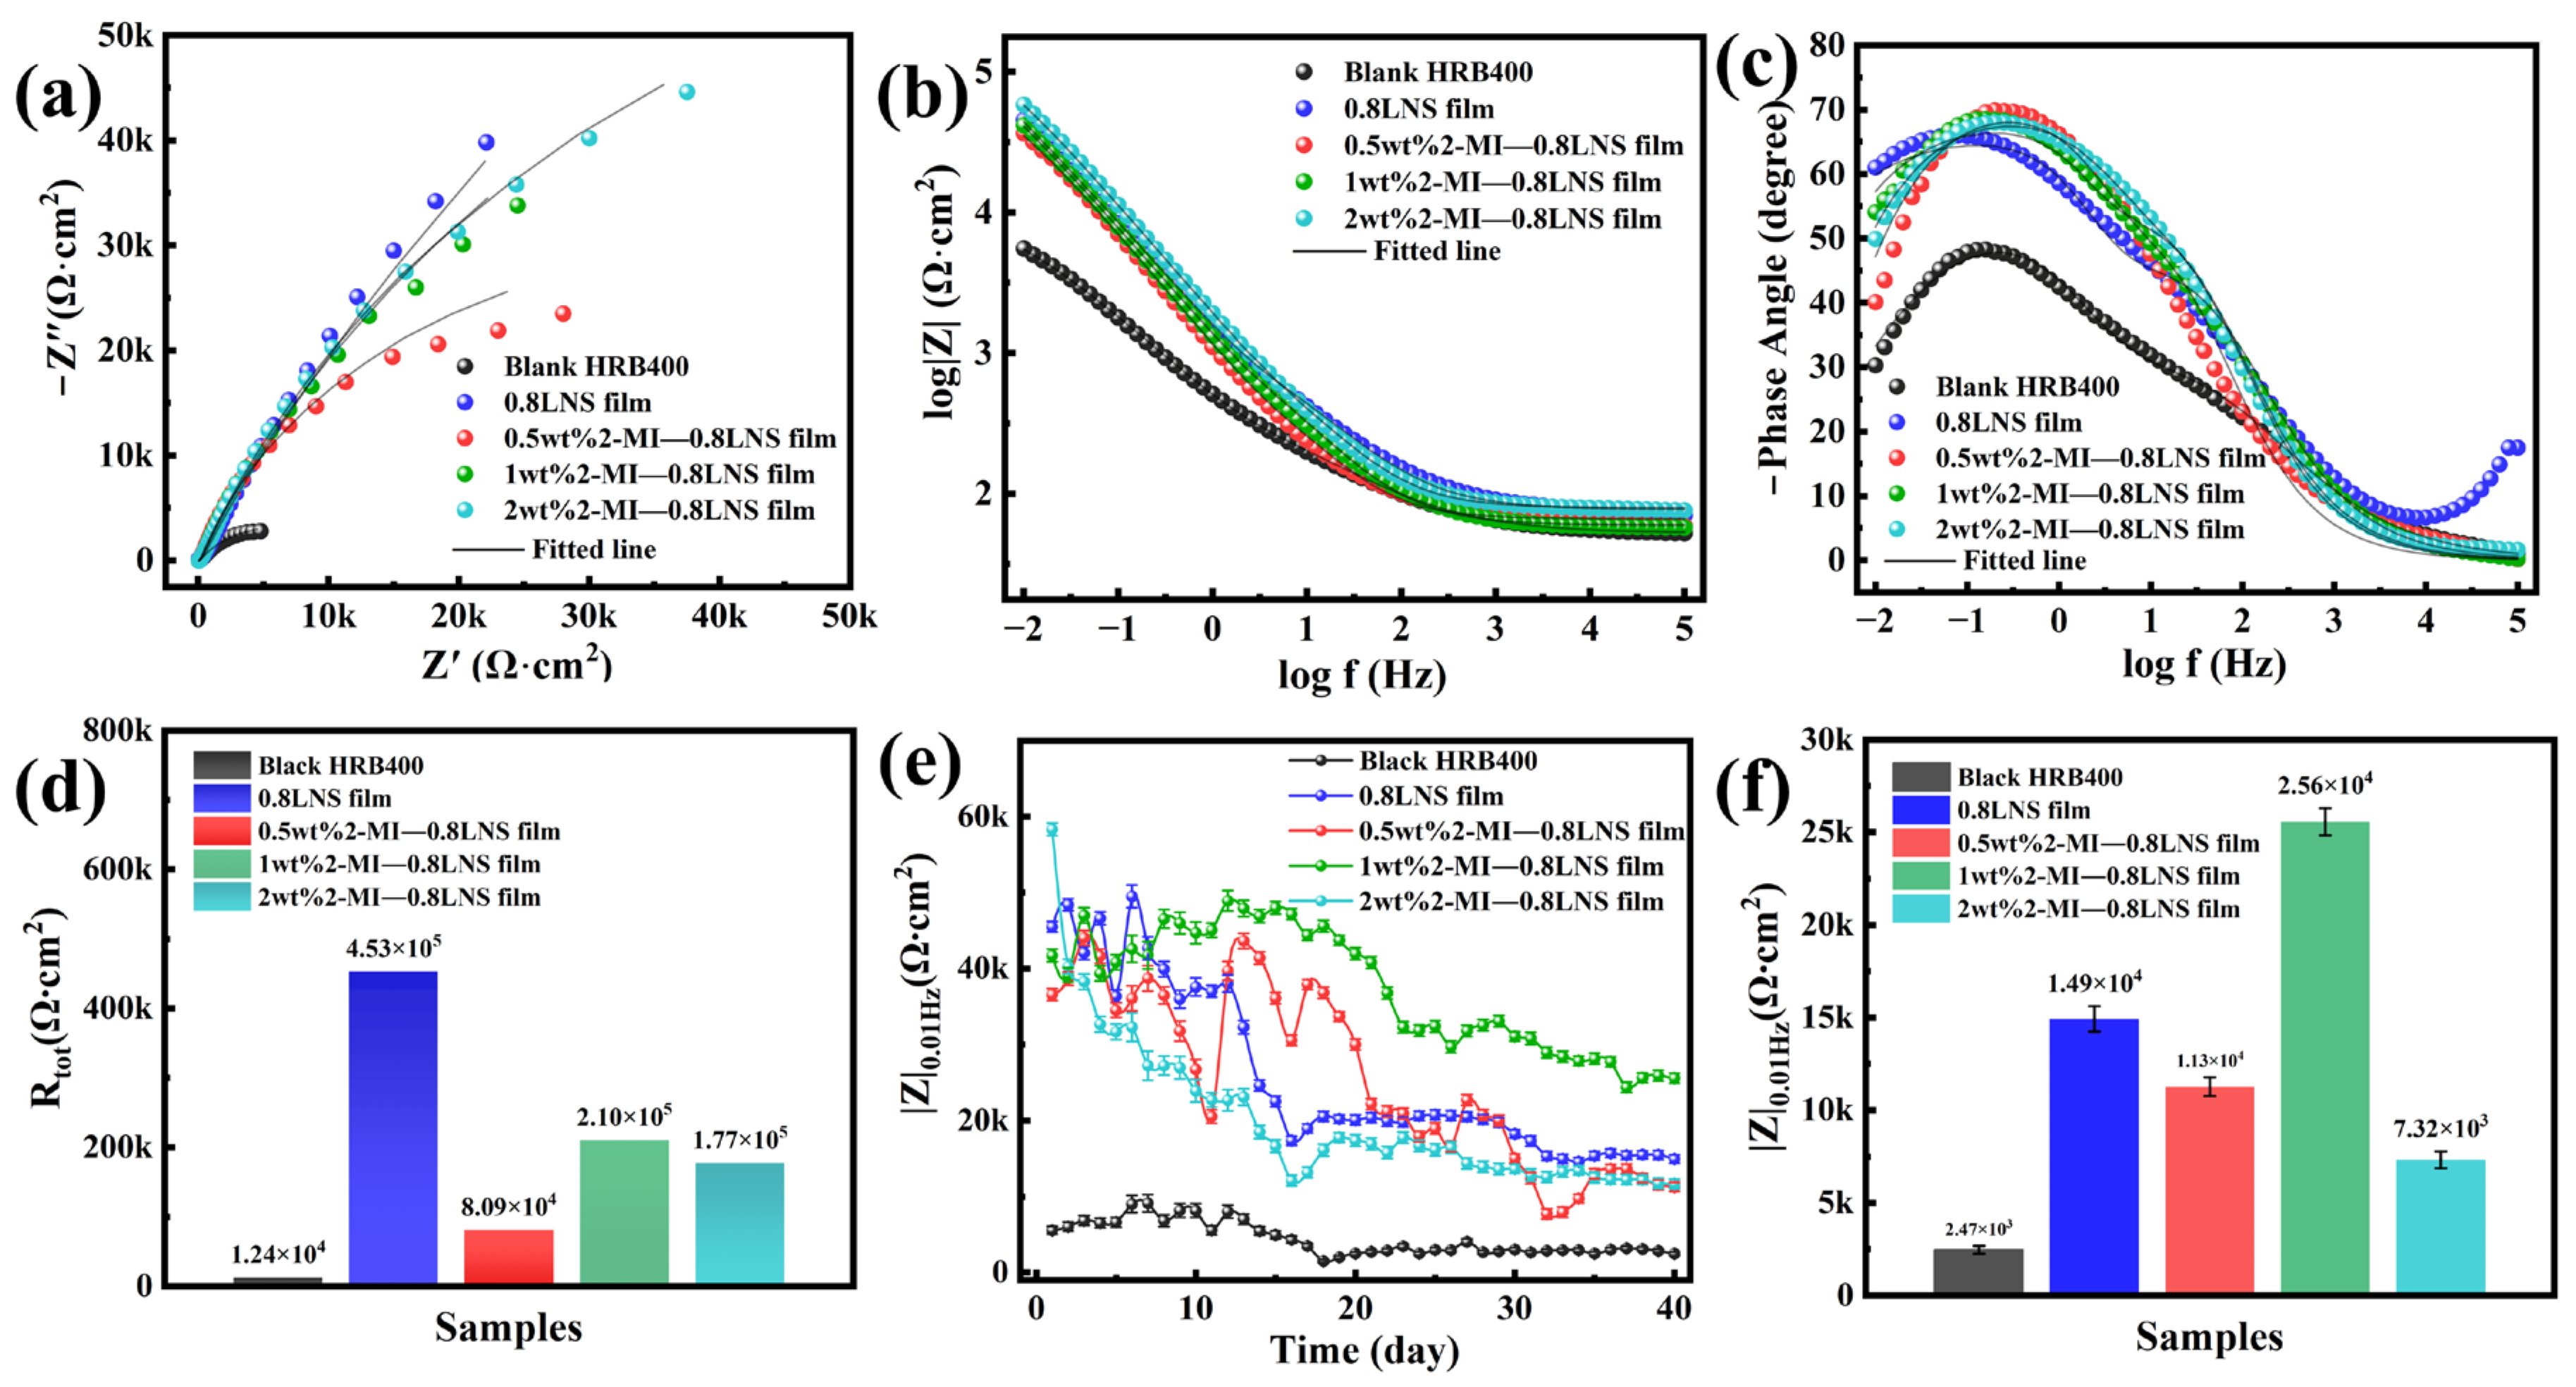
Figure 6.
Electrochemical impedance plots of steel bars immersed at 400 °C in pH = 10 solutions containing 0.8LNS film with different 2-Methylimidazole contents after treatment in 0.1 M NaCl + SCP solution: (a) Nyquist plots and fitting data; (b,c) Bode plots and fitting data; (d) domparison of fitted Rtot for different samples; (e) variation in low-frequency |Z|0.01Hz modulus for different samples during 40 days of immersion; (f) comparison of low-frequency |Z|0.01Hz modulus for different samples on the 40th day of immersion.
Figure 7.
(a,d) Nyquist plots and fitting data; (b,e) and (c,f) Bode plots and fitting data; (g) low-frequency |Z|0.01Hz modulus variation during 40 days of immersion for Blank HRB400 steel and 1 wt% 2-MI—0.8LNS film in 0.1 M NaCl + SCP solution; (h) comparison of fitted Ros for both samples; (i) low-frequency Rct modulus variation for both samples on the 40th day of immersion.
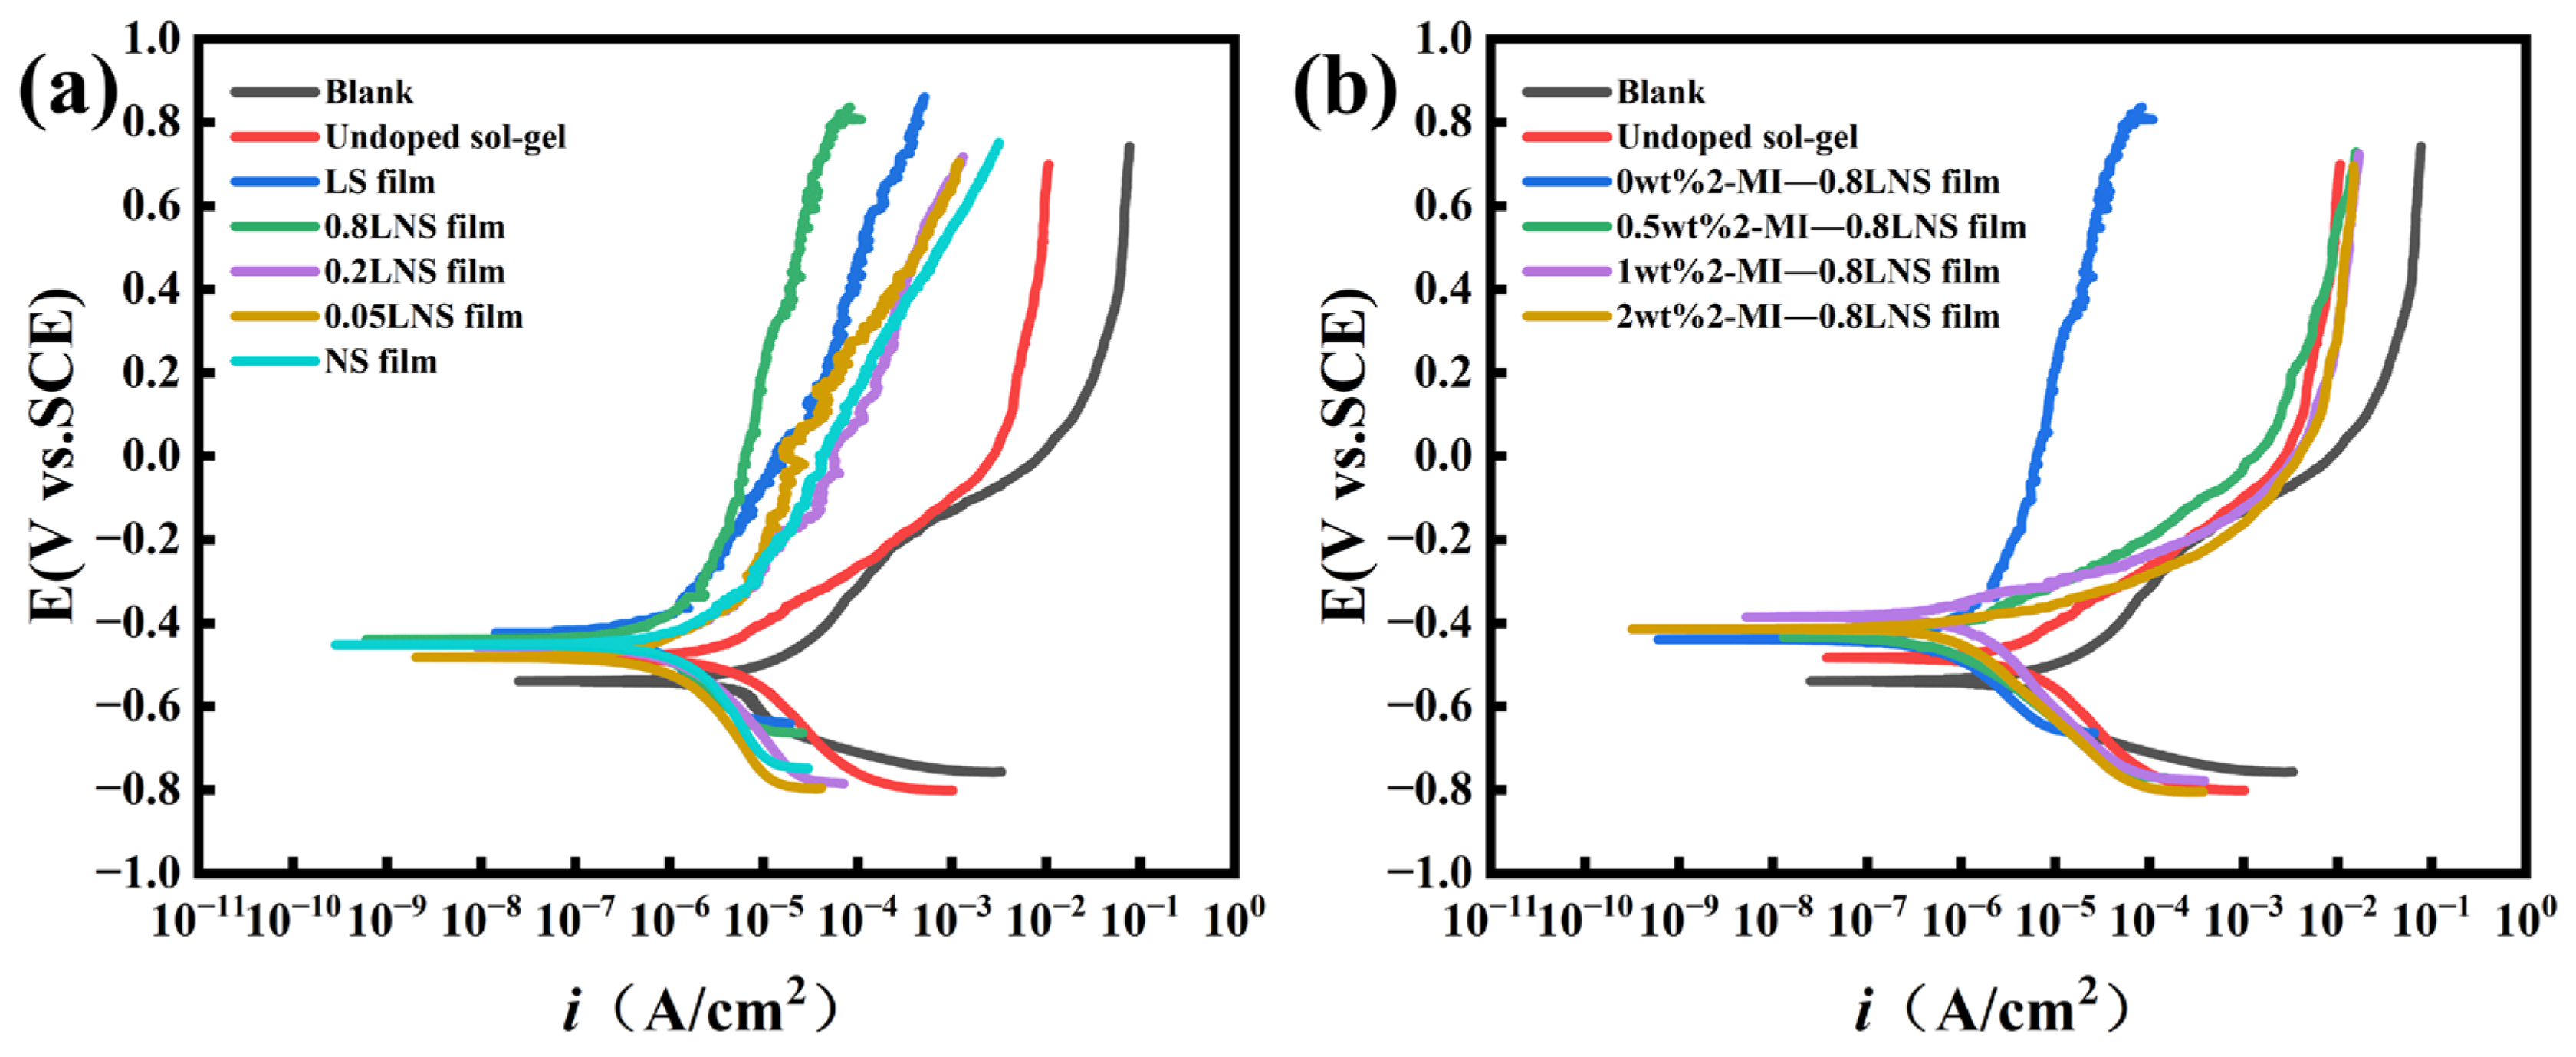
Figure 8.
(a) Potentiodynamic polarization curves of unmodified steel with mill-scale and steel with mill-scale coated with sol-gel films prepared at different La3+/Ni2+ concentration ratios in 0.1 M NaCl-containing simulated concrete pore solution; (b) potentiodynamic polarization curves of coated steel bars with varying 2-Methylimidazole content added to the base (La3+/Ni2+ concentration ratio = 0.8) in 0.1 M NaCl-containing simulated concrete pore solution.
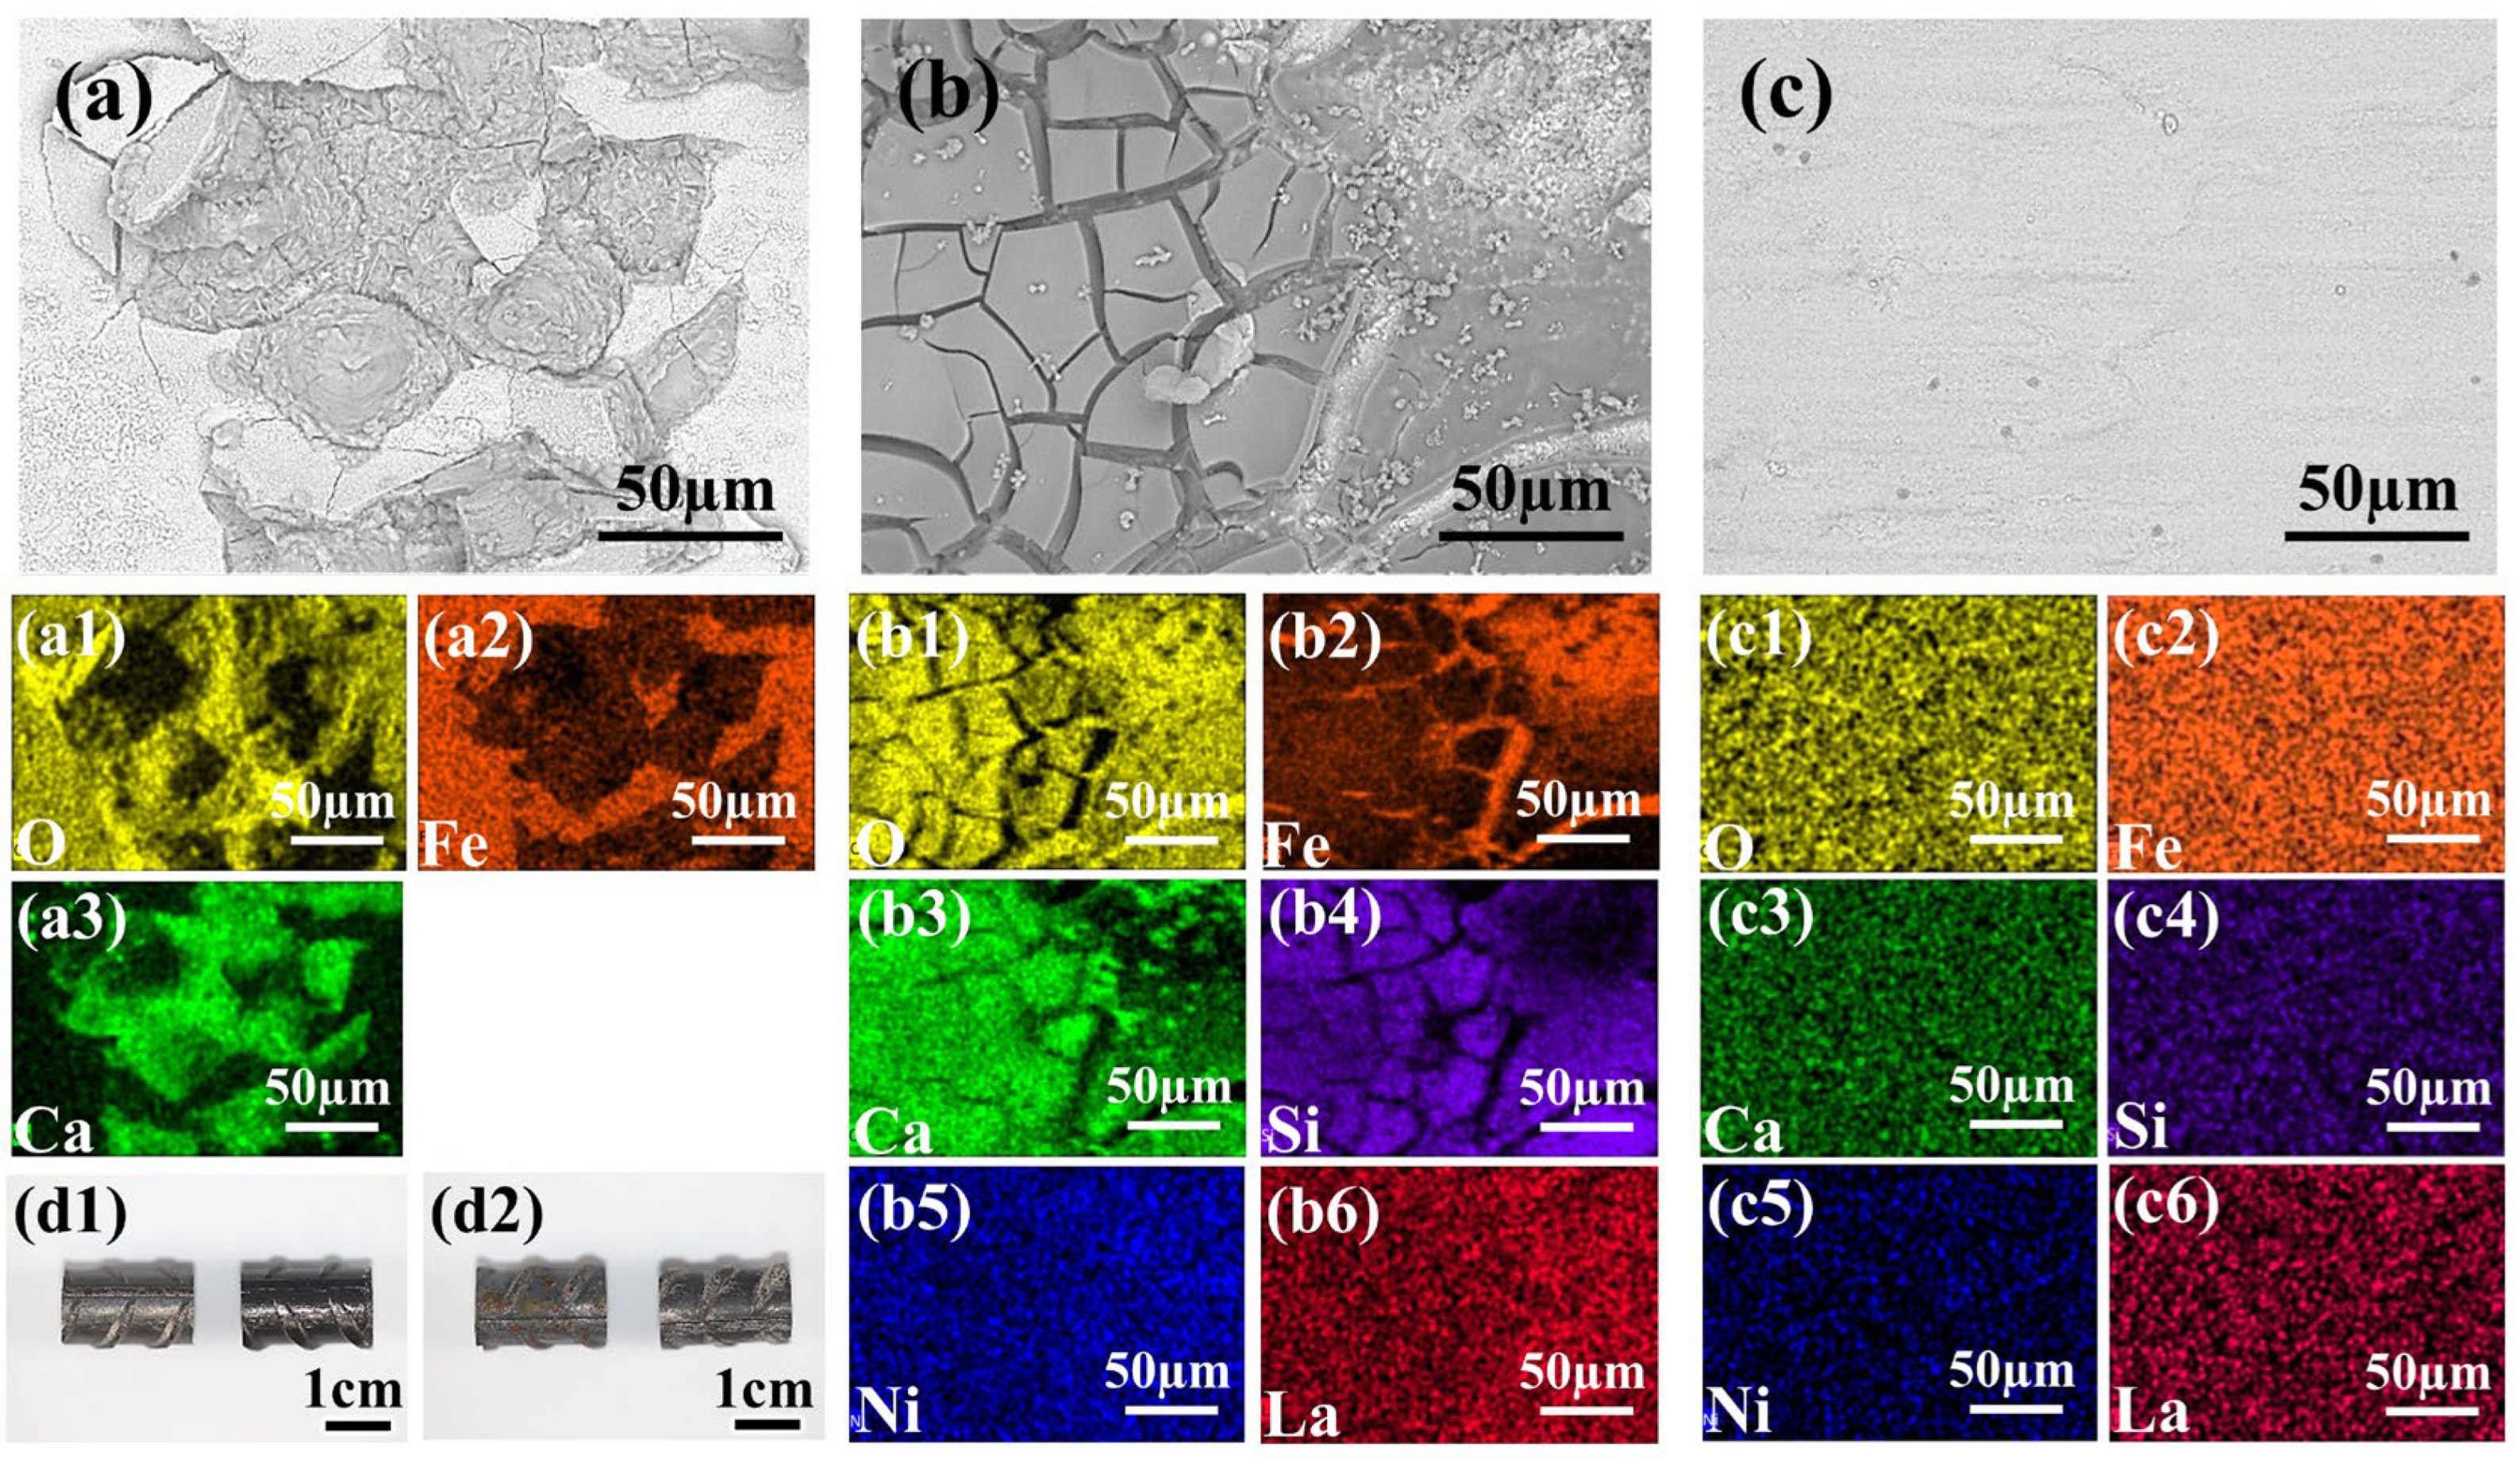
Figure 9.
(a–c) SEM images and corresponding elemental distribution maps of different sample surfaces after 40 days of immersion in 0.1 M NaCl + SCP solution. Specifically: (a,a1–a3) Untreated steel bar sample with mill-scale (showing O, Fe, Ca element distribution); (b,b1–b6) Sample coated with the 1 wt% 2-MI—0.8LNS film prepared under optimal conditions (showing O, Fe, Ca, Si, Ni, and La element distribution); (c,c1–c6) Sample coated with the 1 wt% 2-MI—0.8LNS film after 40 days immersion and subsequent ultrasonic cleaning (showing O, Fe, Ca, Si, Ce, and Ni element distribution). (d1) Blank HRB400 sample (left) and the 1 wt% 2-MI—0.8LNS film coated sample (right) before immersion. (d2) Blank HRB400 sample (left) and the 1 wt% 2-MI—0.8LNS film coated sample (right) after 40 days immersion and subsequent ultrasonic cleaning.
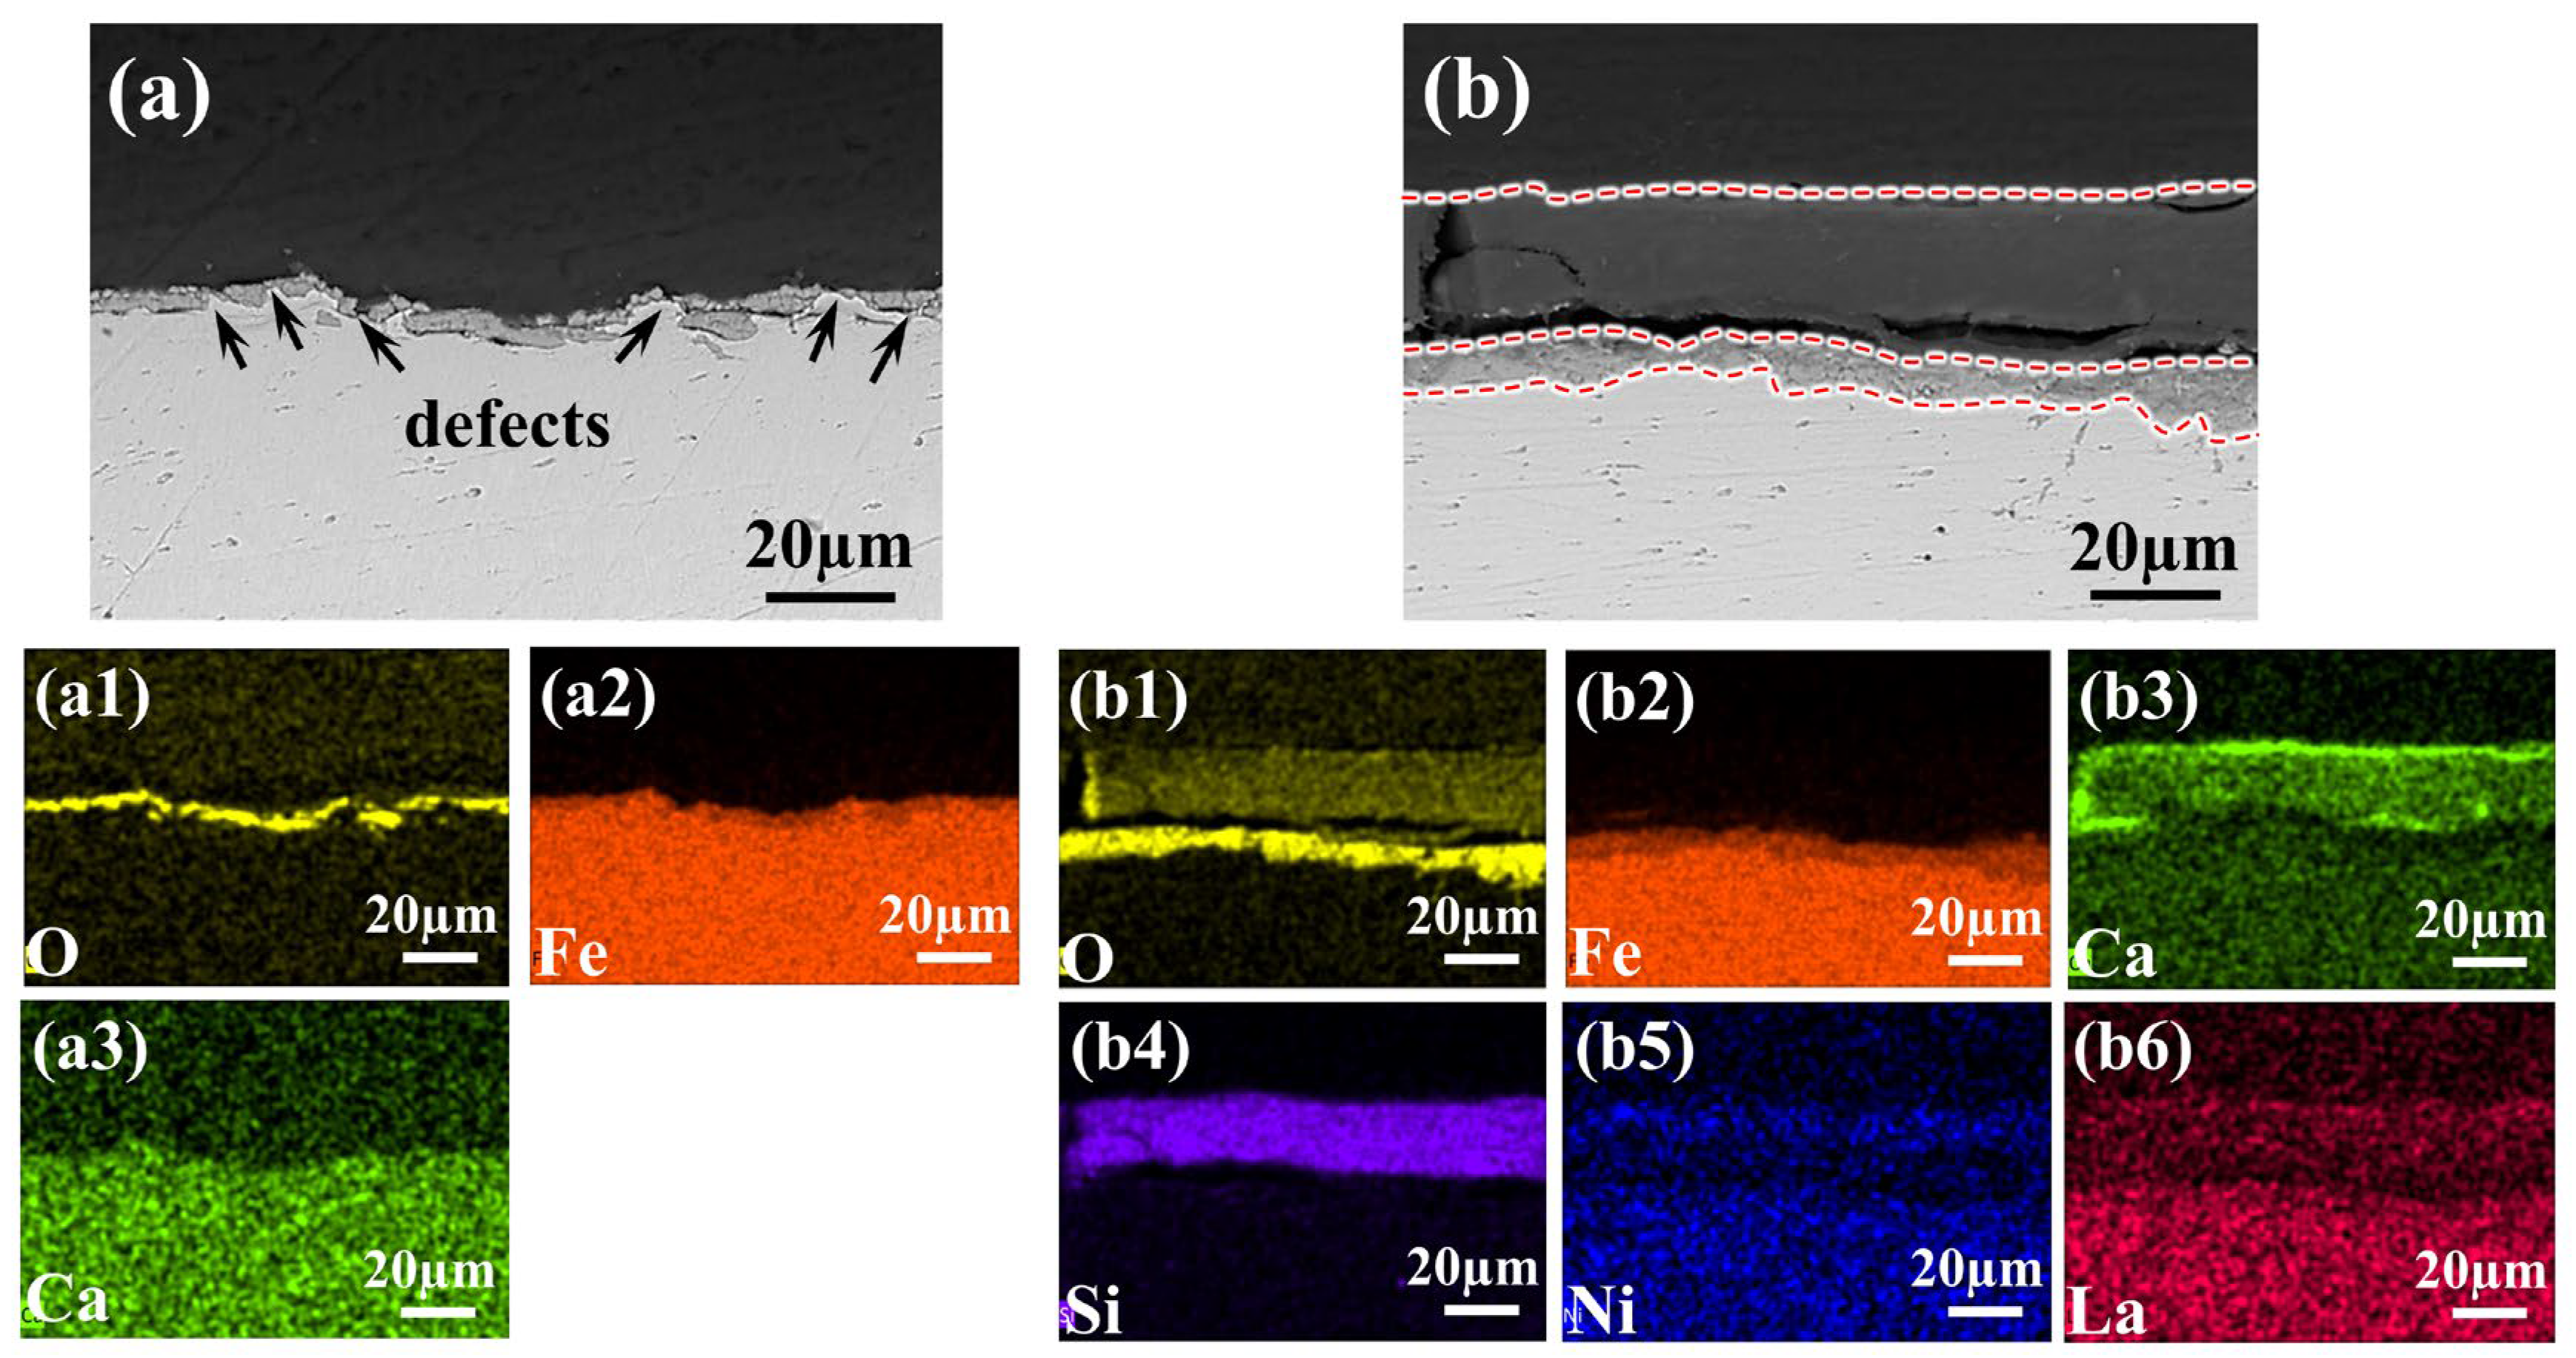
Figure 10.
SEM images and corresponding elemental distribution maps of the cross-sectional morphology of different samples after 40 days of immersion in 0.1 M NaCl + SCP solution. Specifically: (a,a1–a3) Blank HRB400 (untreated steel bar sample with mill-scale) showing O, Fe, Ca element distribution; (b,b1–b6) Sample coated with the 1 wt% 2-MI—0.8LNS film prepared under optimal conditions showing O, Fe, Ca, Si, Ni, and La element distribution. The added red dashed line demarcates the interface boundary.
Figure 11.
XPS and fitting spectra of (a1–a3) Blank HRB400 and (b1–b6) 1 wt% 2-MI—0.8LNS film after 40 days of immersion: C 1s, O 1s, Si 2p, Fe 2p, Ni 2p, La 3d.
Figure 11.
XPS and fitting spectra of (a1–a3) Blank HRB400 and (b1–b6) 1 wt% 2-MI—0.8LNS film after 40 days of immersion: C 1s, O 1s, Si 2p, Fe 2p, Ni 2p, La 3d.
Figure 12.
(a,d) Nyquist plots and fitting data; (b,e) and (c,f) Bode plots and fitting data; (g) low-frequency |Z|0.01Hz modulus variation in mortar blocks prepared with Blank HRB400 and 1 wt% 2-MI—0.8LNS film immersed in simulated seawater for 120 days; (h) equivalent circuit diagram fitted for mortar blocks.
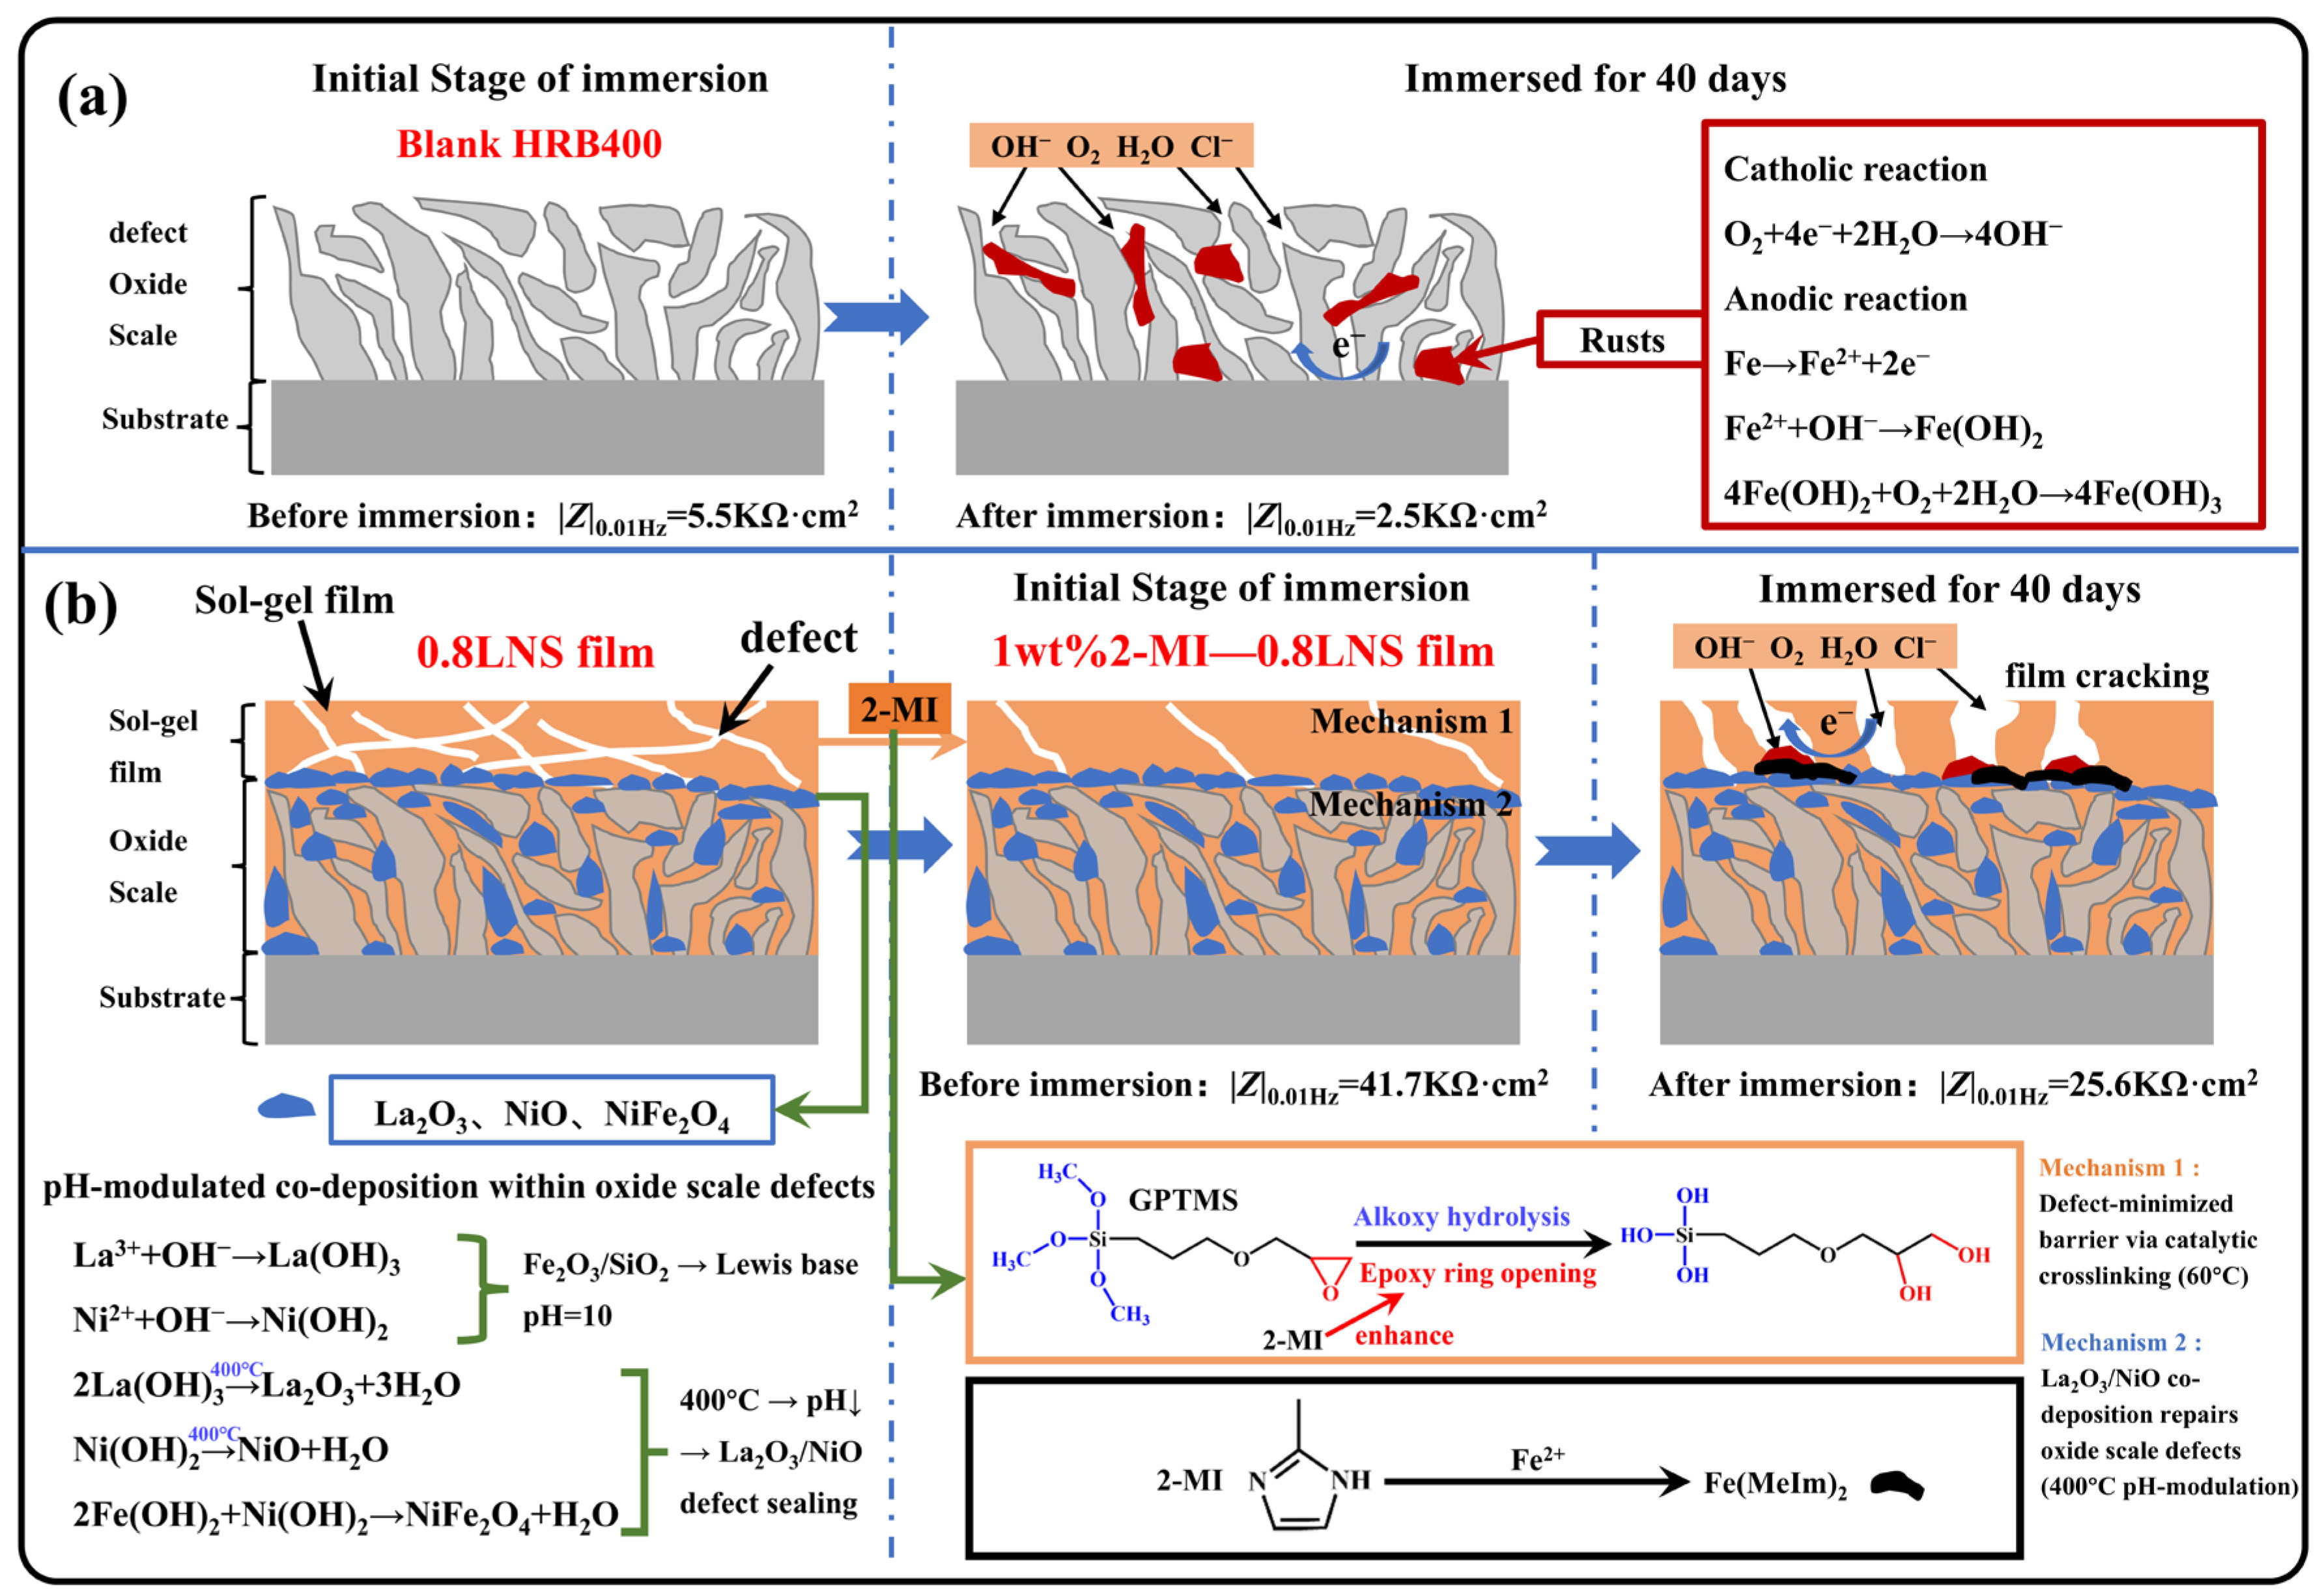
Figure 13.
Corrosion and protection mechanisms of different samples in 0.1 M NaCl + SCP solution: (a) Blank HRB400; (b) 1 wt% 2-MI—0.8LNS film.
Figure 13.
Corrosion and protection mechanisms of different samples in 0.1 M NaCl + SCP solution: (a) Blank HRB400; (b) 1 wt% 2-MI—0.8LNS film.
Table 1.
The chemical composition of HRB400 steel.
Table 1.
The chemical composition of HRB400 steel.
| Element | C | Si | Mn | V | Fe |
|---|
| Percent (wt%) | 0.23 | 0.37 | 1.57 | 0.07 | balance |
Table 2.
Mass fraction of main chemical composition of cement.
Table 2.
Mass fraction of main chemical composition of cement.
| Component | SiO2 | MgO | Al2O3 | Fe2O3 | CaO | SO3 | Loss |
|---|
| Content (%) | 20.86 | 3.50 | 5.90 | 3.61 | 62.54 | 2.43 | 1.16 |
Table 3.
Electrochemical data from EIS fitting for sol-gel films constructed on mill-scale steel with different La3+/Ni2+ concentration ratios in simulated concrete pore solution containing 0.1 M NaCl.
Table 3.
Electrochemical data from EIS fitting for sol-gel films constructed on mill-scale steel with different La3+/Ni2+ concentration ratios in simulated concrete pore solution containing 0.1 M NaCl.
| Sample | Rs (Ω·cm2) | Q1 (×10−5 Ω−1·cm−2·sn) | n1 | Rf (×103 Ω·cm2) | Q0 (×10−5 Ω−1·cm−2·sn) | n0 | Ros (×103 Ω cm2) | Q2 (×10−5 Ω−1·cm−2·sn) | n2 | Rct (×105 Ω·cm2) | Chi-Squared (×10−4) |
|---|
| Blank HRB400 | 52.56 | 45.00 | 0.56 | / | / | / | 0.44 | 26.76 | 0.75 | 0.12 | 4.0 |
| Undoped sol-gel | 111.10 | 0.89 | 0.76 | 1.42 | 11.98 | 0.76 | 9.40 | 22.29 | 0.54 | 1.32 | 6.2 |
| LS film | 116.60 | 9.67 | 0.78 | 0.96 | 34.85 | 0.54 | 11.20 | 4.60 | 0.89 | 1.17 | 1.7 |
| 0.8LNS film | 77.09 | 4.35 | 0.89 | 1.58 | 12.30 | 0.69 | 25.10 | 0.05 | 0.85 | 4.26 | 9.0 |
| 0.2LNS film | 99.94 | 9.53 | 0.73 | 0.57 | 7.60 | 0.64 | 22.59 | 3.30 | 0.92 | 3.93 | 7.3 |
| 0.05LNS film | 65.88 | 1.54 | 0.88 | 1.09 | 32.22 | 0.60 | 13.42 | 13.35 | 0.52 | 1.26 | 0.8 |
| NS film | 77.37 | 14.37 | 0.62 | 1.48 | 29.35 | 0.62 | 8.97 | 32.00 | 0.68 | 0.53 | 0.6 |
Table 4.
Electrochemical data from EIS fitting for sol-gel coatings constructed on mill-scale steel with varying 2-Methylimidazole content added to the base (La3+/Ni2+ concentration ratio = 0.8) in simulated concrete pore solution containing 0.1 M NaCl.
Table 4.
Electrochemical data from EIS fitting for sol-gel coatings constructed on mill-scale steel with varying 2-Methylimidazole content added to the base (La3+/Ni2+ concentration ratio = 0.8) in simulated concrete pore solution containing 0.1 M NaCl.
| Sample | Rs (Ω·cm2) | Q1 (×10−5 Ω−1·cm−2·sn) | n1 | Rf (×103 Ω·cm2) | Q0 (×10−5 Ω−1·cm−2·sn) | n0 | Ros (×103 Ω cm2) | Q2 (×10−5 Ω−1·cm−2·sn) | n2 | Rct (×105 Ω·cm2) | Chi-Squared (×10−4) |
|---|
| Blank HRB400 | 52.56 | 45.00 | 0.56 | / | / | / | 0.44 | 26.76 | 0.75 | 0.12 | 4.0 |
| 0.8LNS film | 77.09 | 4.35 | 0.89 | 1.58 | 12.30 | 0.69 | 25.10 | 0.05 | 0.85 | 4.26 | 9.0 |
| 0.5 wt% 2-MI—0.8LNS film | 66.30 | 4.37 | 0.90 | 1.05 | 15.95 | 0.77 | 27.80 | 0.11 | 0.92 | 0.52 | 7.2 |
| 1 wt% 2-MI—0.8LNS film | 59.75 | 3.05 | 0.93 | 2.17 | 15.20 | 0.73 | 31.10 | 0.04 | 0.89 | 1.77 | 9.3 |
| 2 wt% 2-MI—0.8LNS film | 79.32 | 1.86 | 0.91 | 1.73 | 10.49 | 0.75 | 26.55 | 0.33 | 0.92 | 1.49 | 7.3 |
Table 5.
Electrochemical data from EIS fitting for Blank HRB400 and 1 wt% 2-MI—0.8LNS film in 0.1 M NaCl + SCP solution after 40 days of immersion.
Table 5.
Electrochemical data from EIS fitting for Blank HRB400 and 1 wt% 2-MI—0.8LNS film in 0.1 M NaCl + SCP solution after 40 days of immersion.
| Sample | Time (Day) | Rs (Ω·cm2) | Q1 (×10−5 Ω−1·cm−2·sn) | n1 | Rf (×103 Ω·cm2) | Q0 (×10−5 Ω−1·cm−2·sn) | n0 | Ros (×103 Ω cm2) | Q2 (×10−5 Ω−1·cm−2·sn) | n2 | Rct (×105 Ω·cm2) | Chi-Squared (×10−4) |
|---|
| Blank HRB400 | 1D | 52.56 | 45.00 | 0.56 | / | / | / | 0.44 | 26.76 | 0.75 | 0.12 | 4.0 |
| 5D | 43.40 | 48.16 | 0.58 | / | / | / | 0.34 | 41.22 | 0.74 | 0.48 | 6.9 |
| 10D | 49.95 | 54.00 | 0.55 | / | / | / | 2.45 | 11.67 | 0.86 | 1.12 | 9.4 |
| 15D | 77.15 | 58.39 | 0.53 | / | / | / | 0.66 | 41.85 | 0.68 | 0.37 | 2.8 |
| 20D | 52.88 | 107.30 | 0.52 | / | / | / | 0.21 | 81.61 | 0.70 | 0.13 | 3.0 |
| 25D | 69.38 | 85.19 | 0.55 | / | / | / | 0.30 | 103.60 | 0.73 | 0.15 | 9.6 |
| 30D | 105.20 | 39.42 | 0.62 | / | / | / | 0.20 | 142.00 | 0.61 | 0.32 | 9.3 |
| 35D | 75.66 | 41.78 | 0.61 | / | / | / | 0.18 | 157.70 | 0.56 | 0.27 | 9.3 |
| 40D | 99.10 | 61.33 | 0.50 | / | / | / | 0.17 | 89.08 | 0.50 | 0.13 | 1.0 |
| 1 wt% 2-MI—0.8LNS film | 1D | 59.75 | 3.05 | 0.93 | 2.17 | 15.20 | 0.73 | 31.10 | 3.81 | 0.89 | 1.77 | 9.3 |
| 5D | 64.42 | 3.31 | 0.92 | 2.08 | 16.36 | 0.73 | 30.60 | 3.53 | 0.90 | 2.80 | 9.7 |
| 10D | 47.95 | 3.08 | 0.90 | 1.81 | 14.83 | 0.74 | 30.10 | 38.45 | 0.86 | 4.53 | 9.4 |
| 15D | 40.99 | 3.09 | 0.89 | 1.42 | 13.16 | 0.73 | 31.10 | 92.00 | 0.87 | 7.35 | 4.9 |
| 20D | 22.52 | 2.90 | 0.91 | 1.13 | 15.54 | 0.73 | 29.50 | 29.46 | 0.85 | 4.18 | 0.9 |
| 25D | 55.34 | 7.89 | 0.85 | 0.50 | 11.71 | 0.78 | 26.70 | 865.00 | 0.60 | 3.21 | 6.5 |
| 30D | 64.57 | 7.35 | 0.86 | 0.62 | 11.97 | 0.78 | 24.30 | 953.00 | 0.54 | 2.87 | 5.3 |
| 35D | 55.25 | 9.24 | 0.82 | 0.39 | 10.41 | 0.79 | 21.60 | 125.00 | 0.54 | 2.84 | 8.9 |
| 40D | 76.99 | 8.46 | 0.85 | 0.63 | 11.86 | 0.79 | 17.20 | 142.20 | 0.52 | 2.41 | 7.6 |
Table 6.
Electrochemical parameters from potentiodynamic polarization curves for sol-gel films constructed on mill-scale steel with different La3+/Ni2+ concentration ratios in simulated concrete pore solution containing 0.1 M NaCl.
Table 6.
Electrochemical parameters from potentiodynamic polarization curves for sol-gel films constructed on mill-scale steel with different La3+/Ni2+ concentration ratios in simulated concrete pore solution containing 0.1 M NaCl.
| Sample | icorr (µA/cm2) | Ecorr (V vs. SCE) | βa (mV/dec) | |βc| (mV/dec) |
|---|
| Blank HRB400 | 0.82779 | −0.54041 | 69.08 | 87.44 |
| Undoped sol-gel | 0.71633 | −0.48261 | 89.33 | 99.66 |
| LS film | 0.19144 | −0.42969 | 112.53 | 136.46 |
| 0.8LNS film | 0.13085 | −0.43933 | 196.12 | 151.06 |
| 0.2LNS film | 0.18628 | −0.45639 | 150.58 | 122.77 |
| 0.05LNS film | 0.12585 | −0.48048 | 102.37 | 104.24 |
| NS film | 0.19911 | −0.45290 | 102.48 | 100.86 |
Table 7.
Electrochemical parameters from potentiodynamic polarization curves for sol-gel coatings constructed on mill-scale steel with varying 2-MI content added to the base (La3+/Ni2+ concentration ratio = 0.8) in simulated concrete pore solution containing 0.1 M NaCl.
Table 7.
Electrochemical parameters from potentiodynamic polarization curves for sol-gel coatings constructed on mill-scale steel with varying 2-MI content added to the base (La3+/Ni2+ concentration ratio = 0.8) in simulated concrete pore solution containing 0.1 M NaCl.
| Sample | icorr (µA/cm2) | Ecorr (V vs. SCE) | βa (mV/dec) | |βc| (mV/dec) |
|---|
| Blank HRB400 | 0.82779 | −0.54041 | 69.08 | 87.44 |
| Undoped sol-gel | 0.71633 | −0.48261 | 89.33 | 99.66 |
| 0.8LNS film | 0.13085 | −0.43933 | 196.12 | 151.06 |
| 0.5 wt% 2−MI—0.8LNS film | 0.08300 | −0.43142 | 94.11 | 125.67 |
| 1 wt% 2−MI—0.8LNS film | 0.10870 | −0.38397 | 105.39 | 200.94 |
| 2 wt% 2−MI—0.8LNS film | 0.19502 | −0.40967 | 95.18 | 176.67 |
Table 8.
Comparative analysis of engineered sol-gel coatings versus previous studies.
Table 8.
Comparative analysis of engineered sol-gel coatings versus previous studies.
| Research System | Steel Bar Temperature (°C) | Sol-Gel Solution Temperature (°C) | Curing Temperature (°C) | Immersion Time in SCP Solution (days) | Impedance Gains (-Fold) |
|---|
| Ce Sol-gel film [25] | 25 | 25 | 130 | 30 | 3.0 |
| Ce-Ni Sol-gel film [26] | 25 | 35 | 130 | 30 | 5.8 |
| ZIF-8—Ce sol-gel film [24] | 25 | 25 | 130 | 30 | 5.0 |
| 1 wt%-2MI—0.8LNS | 400 | 25 | 60 | 40 | 10.4 |

