Article

Deep Learning-Based Safety Early-Warning Model for Deep Foundation Pit Construction with Extra-Long Weir Construction Method—A Case Study of the Jinji Lake Tunnel

1
School of Civil Engineering, Southeast University, Nanjing 211189, China
2
Office of Campus Construction, Nanjing Agricultural University, Nanjing 210095, China
*
Author to whom correspondence should be addressed.
Buildings 2025, 15(23), 4270; https://doi.org/10.3390/buildings15234270
Submission received: 29 September 2025 / Revised: 17 November 2025 / Accepted: 24 November 2025 / Published: 26 November 2025

Abstract

The Extra-Long Weir Construction method for deep foundation pit construction is crucial for urban underground development. However, as excavation projects become deeper and more complex, construction safety risks increase markedly. Existing monitoring technologies and numerical simulation models face persistent challenges: high uncertainty in risk occurrence, complex environmental interactions, and difficulties in extracting effective warning signals from multi-source data. To address these challenges, this study establishes a systematic risk evaluation framework comprising 6 primary and 29 secondary indicators through Fault Tree Analysis and develops a novel DL-MSD (Deep Learning and Multi-Source Data Prediction) model integrating CNN, ResUnit, and LSTM networks for spatiotemporal sequence analysis and multi-source data fusion. Validated using 6524 samples from the Jinji Lake Tunnel project, the model employs single-factor prediction for hazard source tracing and multi-factor fusion for comprehensive risk assessment. Results demonstrate exceptional performance: 90.2% average accuracy for single-factor warnings and 77.1% for multi-factor fusion, with, critically, all severe warnings (Level I risks) identified with zero omissions. Comparative analysis with T-S fuzzy neural networks, EWT-NARX, and Random Forest confirmed superior accuracy and computational efficiency. An integrated platform incorporating BIM and IoT technologies enables automated monitoring, intelligent prediction, and adaptive control. This study establishes a data-driven intelligent early warning framework that significantly improves prediction accuracy, timeliness, and reliability in deep foundation pit construction, marking a paradigm shift from reactive response to proactive prevention. The findings provide theoretical and methodological support for safety management in ultra-deep excavation projects, offering reliable decision-making evidence for enhancing construction safety and risk management.

1. Introduction

1.1. Background

Urban underground construction enables the effective utilization of multi-level subsurface space, alleviating severe urban congestion caused by rapid population growth, limited land resources for construction, and imbalances in environmentally sustainable development. It also supports the development of resource-efficient and environmentally friendly cities. Against this backdrop, many countries and regions are placing increasing emphasis on the utilization and development of urban underground space. As a key form of urban underground engineering, tunneling has expanded rapidly. Tunnel construction has undergone rapid developments in China, and China currently possesses the highest number and the greatest length of highways in the world. By the end of 2018, the total length of highways in China was recorded to be 4,846,500 km, which includes 17,236.1 km of highway tunnels [1]. Consequently, numerous deep foundation pit projects with significant excavation depth, large spans, and rapid excavation progress have emerged. However, such projects provide essential conditions for the advancement of underground space development; they are also accompanied by frequent safety incidents during construction. As shown in Figure 1, statistics compiled from the Chinese Society for Rock Mechanics and Engineering indicate that in 2021 alone, 106 underground space disasters and accidents occurred across 24 provincial-level regions in China. These incidents resulted in 129 fatalities and 242 injuries [2].
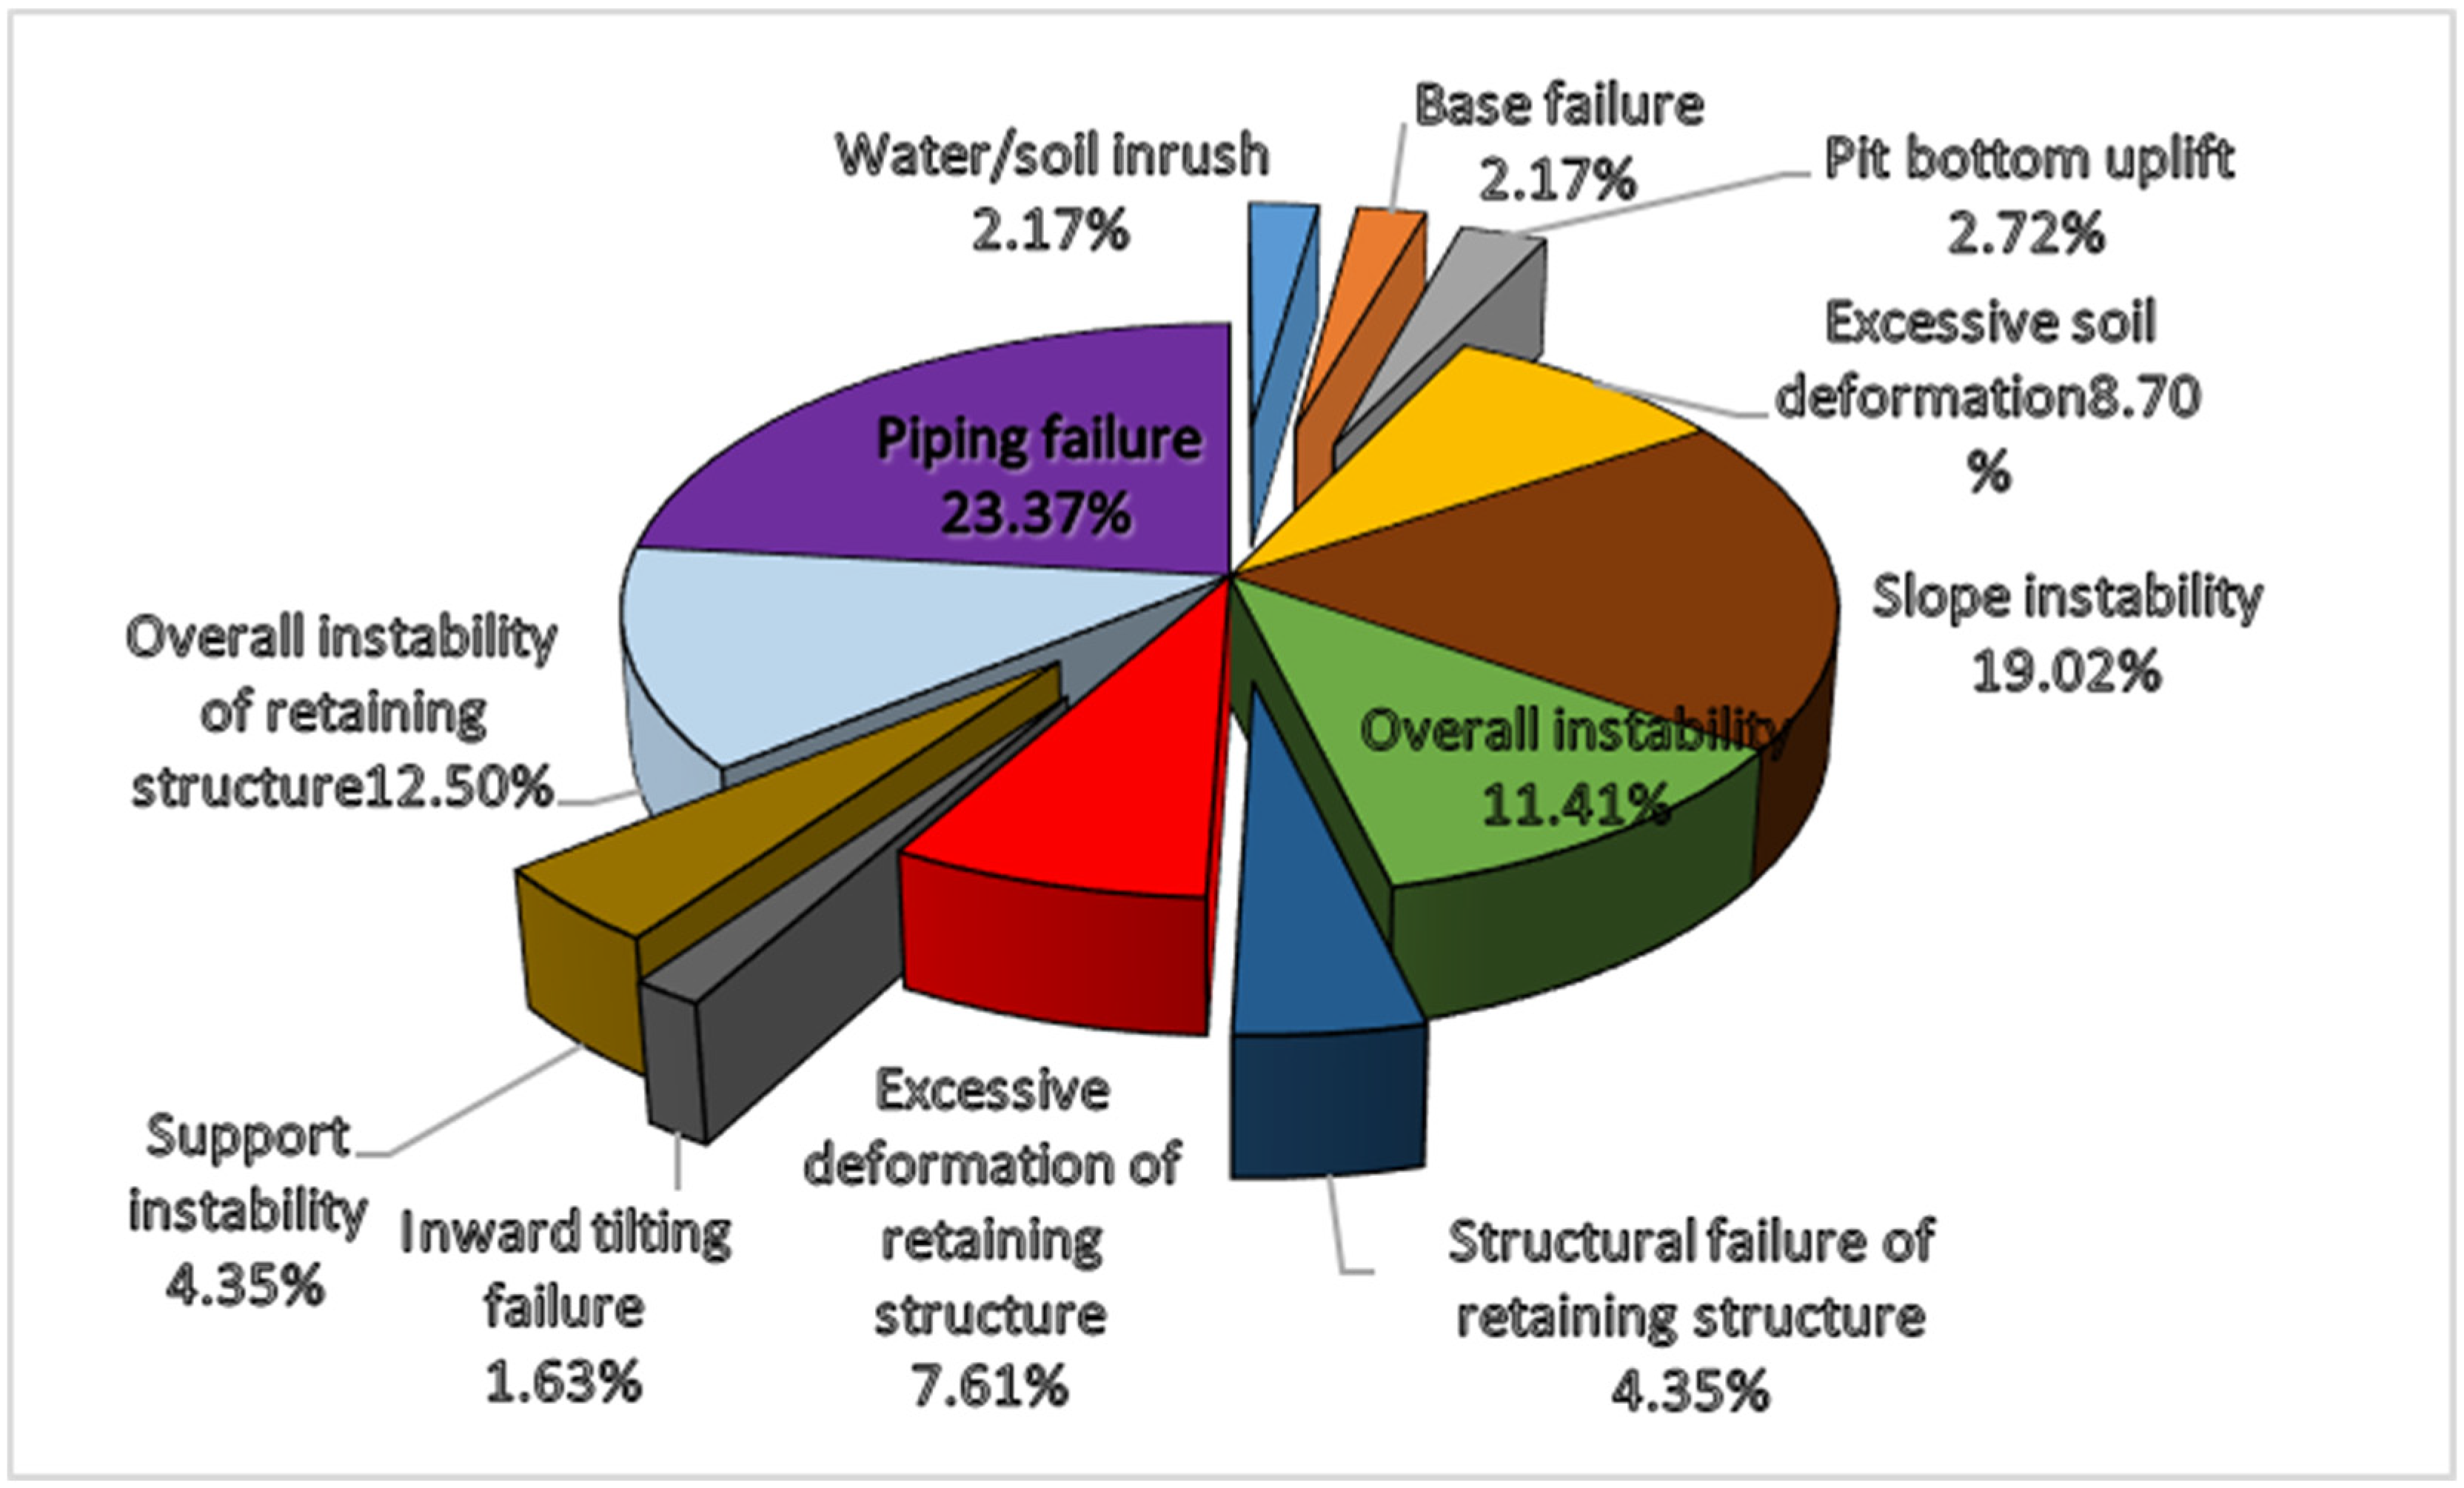
In fact, attempts to construct deep foundation pit projects can be traced back to earlier times [3,4]. For example, simple excavation with slope cutting for housing and bridge construction, or the use of rudimentary wooden piles for support, were once common [5]. However, such basic support methods could not meet the growing demands of construction, with increasing excavation depth and construction difficulties, and collapse accidents in deep foundation pits also became more frequent [6]. Based on the analysis of typical deep foundation pit construction accidents and disaster cases [7,8,9,10,11], the causes of accidents are summarized into the following twelve categories, which include water/soil inrush, base failure, pit bottom uplift, excessive soil deformation, slope instability, overall instability, structural failure of retaining structure, excessive deformation of retaining structure, inward tilting failure, support instability, overall instability of retaining structure, and piping failure. Based on this analysis, this study conducted a statistical analysis of 133 foundation pit engineering accidents, and the distribution of accident causes is shown in Figure 2. The causes of such accidents during the construction of foundation pits are highly diverse and complex. This indicates that achieving early warning and proactive control in foundation pit engineering is itself an extremely challenging task.
Therefore, the major reason for the frequent occurrence of such accidents lies in the inherent challenges of deep foundation pit construction: high construction difficulty and complex processes. Moreover, deep foundation pit projects constitute a highly uncertain and complex system involving numerous interrelated risk factors. Safety accidents are usually the result of the combined action of multiple factors, which makes the underlying causes highly random and unpredictable. In addition to the inherent drawbacks of deep foundation pits, deficiencies in risk management also play a critical role. The core of engineering risk management lies in risk assessment. At present, risk assessment is primarily based on expert judgment, supplemented by comparing monitoring data with warning thresholds to evaluate the safety state of a project. Such methods are clearly subjective, time-consuming, and labor-intensive. Furthermore, relying on single data comparisons for risk assessment lacks both a holistic and timely understanding of safety conditions. Additionally, inefficiencies in information transmission during construction, inadequate feedback, and poor adjustment of critical processes directly lead to shortcomings in early warning and crisis management, which in turn result in major engineering accidents. Therefore, developing a scientific and rational risk assessment approach and improving the effectiveness of risk early warning are pressing issues that must be addressed in deep foundation pit engineering.
These challenges are compounded by advances in sustainable construction materials. The emergence of high-toughness recycled aggregate concrete (HTRAC) and fiber-reinforced materials introduces additional monitoring complexities, as these materials exhibit unique mechanical behaviors [12,13,14,15,16]. Current monitoring systems lack frameworks for integrating microscale material behavior with macroscale structural performance.
For large-scale and extra-deep foundation pit construction, projects are becoming larger, deeper, and longer, while accidents occurring during construction are increasingly severe. The primary causes of such accidents include that excavation still relies heavily on manual operations, characterized by dynamic, complex, and variable processes. Most existing early warning methods are based on pre-construction design calculations. However, theoretical results often differ significantly from the actual construction process, and, in some cases, construction conditions deviate entirely from design predictions [17]; safety risks in foundation pit construction involve a wide range of factors, complex interactions, and strong correlations among influencing variables [18]. Thus, accurate spatiotemporal prediction of construction safety risks, together with corresponding proactive control measures, is particularly critical [19].
To address these challenges, this study establishes a data-driven risk early-warning system based on a deep learning framework. This system bridges the gap between advanced material characterization and practical construction monitoring while accommodating the complexity of modern construction materials and underground excavation scenarios. Unlike previous approaches that rely on single-scale monitoring or are calibrated exclusively for conventional materials, the core methodology of this study includes the following: (1) developing a systematic evaluation system comprising 6 primary indicators and 29 secondary indicators that covers construction safety influencing factors and accommodates the complexity of sustainable construction materials and methods; (2) developing a deep learning model integrating CNN, ResUnit, and LSTM architectures to achieve collaborative analysis of multi-source data fusion and single-factor prediction, providing adaptability to the nonlinear behaviors exhibited by advanced materials; (3) employing both single-factor prediction for hazard source tracing and multi-factor fusion for comprehensive risk assessment, enabling detection of anomalous patterns that might arise from novel material behaviors; and (4) validating the framework using extensive field data from a major infrastructure project. Using the Jinji Lake Tunnel project as an empirical case, an integrated early warning platform with automated monitoring, intelligent prediction, and adaptive control capabilities was constructed based on a cloud computing platform integrating BIM and IoT technologies, achieving a transformation from passive response to proactive prevention in safety management. The main innovation lies in developing a deep learning early-warning model that combines multi-source fusion with hazard source tracing, comprehensively reflecting the complex risk evolution patterns of multi-factor synergistic effects in deep foundation pit construction processes. By combining insights from advanced material characterization research with robust structural monitoring capabilities, this study establishes a data-driven intelligence framework that evolves beyond conventional monitoring paradigms, providing a scalable methodology for incorporating future advances in sustainable construction materials into real-time safety management systems. Through multi-level feature extraction of the deep learning model, significant improvements in risk early warning accuracy and timeliness are achieved, providing a new technical pathway for safety management and control of ultra-deep foundation pit engineering while supporting the construction industry’s transition toward environmentally responsible practices without compromising safety performance.
The remainder of this article is organized as follows: the second section reviews the relevant literature and practice experience; the third section describes the research methods of this study in detail; the fourth section presents the case application and validation; the fifth section conducts the discussion; and the sixth section concludes with the results and limitations of this study.

1.2. Scientific and Practical Significance

This study advances construction safety theory through four key contributions: (1) development of a novel deep learning framework integrating CNN, ResUnit, and LSTM for processing spatiotemporal heterogeneous monitoring data, where 3D matrix representation captures complex coupling relationships among risk factors; (2) establishment of systematic risk evaluation comprising 6 primary and 29 secondary indicators from Fault Tree Analysis and 4M1E theory, accommodating modern underground construction complexity; (3) provision of theoretical support for multi-source heterogeneous data fusion, proposing innovative methodologies for collaborative analysis of displacement, stress, groundwater, and environmental factors; and (4) enrichment of intelligent early warning theory by demonstrating how deep learning identifies complex nonlinear relationships among construction risk factors, enabling predictive capabilities surpassing traditional statistical methods. These contributions advance intelligent construction safety understanding and provide a foundation for future data-driven construction risk management research.
The practical value is substantial across five dimensions: (1) implementation of integrated monitoring and early warning platform for Jinji Lake Tunnel project combining BIM and IoT, achieving automated monitoring, intelligent prediction, and adaptive pre-control management, substantially improving efficiency and control standards; (2) transformation from passive emergency response to proactive risk prevention through real-time multi-source data fusion and intelligent prediction, enabling hazard identification before critical escalation; (3) validation with 6524 field samples achieving 90.2% accuracy for single-factor warnings and 77.1% for multi-factor fusion, with all severe warnings (Level I risks) identified with zero omissions, providing reliable evidence for engineering decision-making in complex construction scenarios; (4) practical guidance for formulating safety management protocols and early warning standards, with systematic approach to risk factor identification, monitoring layout, warning threshold determination, and pre-control measure selection providing replicable methodology; and (5) integration of BIM, IoT, cloud computing, and AI demonstrating viable pathway toward smart construction implementation with potential for widespread industry adoption.
In summary, this study contributes to both the academic advancement of intelligent construction safety theories and the practical enhancement of safety management in complex underground projects. Through systematic research on safety risk factors, development of advanced early-warning models, and successful platform implementation, this work addresses critical challenges in modern deep foundation pit construction, providing theoretical support and practical methodologies for achieving zero-accident production, improved management standards, and enhanced personnel safety. The outcomes support the industry’s transformation toward smart, data-driven, and proactive safety management paradigms.

2. Literature Review

2.1. Current Research Status

In recent years, accident early warning mechanisms have become an essential technical approach for the safe management of deep foundation pit construction, and numerous researchers have conducted in-depth studies on this topic.
By analyzing the mechanical correlations and statistical relationships among various construction parameters, it is shown that there exists a close correlation among various parameters in deep foundation pit construction [20,21]. A multi-parameter risk assessment program was developed, and case studies demonstrated that this method could identify risks that single-parameter approaches could not, effectively addressing their limitations [22]. Liu, Z. et al. [23] proposed a deformation prediction model for ultra-deep foundation pit retaining structures based on empirical mode decomposition (EMD) and recurrent neural networks (RNNs). The model identifies the degree of deviation between normal and abnormal deformations of the retaining structure, and on this basis, assesses the potential risks and construction quality defects during the foundation pit construction process, thereby providing a new approach for engineering early warning. Yongcheng, Z. et al. [24] considered the dynamic risk factors and risk scenarios during the excavation phase of deep foundation pits. C. Zhou et al. [25], to prevent unsafe behaviors and conditions in underground construction environments involving both equipment and workers, proposed an IoT-based underground construction safety barrier early-warning system for monitoring hazardous energy, preventing accidents, and enhancing safety management. Monitoring data from a river-crossing metro construction site demonstrated that the system improved safety performance and effectively prevented accidents caused by hazardous energy on site. Cheng, Z. et al. [26] extracted both macroscopic and microscopic decision-making information from multiple settlement time series in deep foundation pits, offering a novel method for predicting safety monitoring data in underground engineering. Jianjie, W. et al. [27] introduced unmanned aerial vehicle (UAV) technology into the safety monitoring of foundation pit construction and proposed a method for rapid safety monitoring and analysis of foundation pit construction, providing a new approach for the informatized management of foundation pit projects.
Ying, Z. et al. [28] proposed a novel risk analysis method combining complex networks and association rule mining (ARM), successfully revealing relationships between safety risk monitoring types and risk coupling, allowing preventive measures to be taken in advance. Yangqing, X. et al. [29] analyzed retaining wall deformation during excavation and established a comprehensive early warning mechanism based on horizontal displacement of the wall, with surface settlement and support axial force as auxiliary parameters, to predict abnormal deformations that could lead to safety hazards. Jianhong, H. et al. [30] employed the finite element method (FEM) to analyze the seepage field of a ship lock foundation pit basin, identifying key characteristics of diaphragm wall leakage. They proposed a comprehensive risk assessment and early-warning model for seepage safety in ship lock foundation pit projects. By adopting a multi-objective optimization principle, they further established a comprehensive evaluation index system for seepage safety, thereby enhancing the accuracy of safety assessments.
Sheikh, M. et al. [31] investigated an unstable slope monitoring system composed of tilt sensors, aiming to develop an advanced time prediction model (TPM) for landslide early warning, including a model associated with real-time slope surface tilt, capable of providing effective results during the continuous acceleration phase of a landslide. Jie, J. et al. [32], addressing the limitations of existing risk evaluation models and the challenges of risk fusion for deep foundation pit construction in metro stations, proposed a risk-assessment model for such pits based on fuzzy evidential reasoning and the two-tuple linguistic analytic network process (TL-ANP). This model can effectively identify the key factors and loss indicators that influence the overall risk grade of the pit. He, S. et al. [33] established a real-time, integrated, multi-system early-warning model for rock burst, achieving quantitative prediction of rock burst probability at specific times. Their integrated micro-seismic and acoustic emission (MS-AE) warning model combines multiple systems and indicators, showing higher predictive accuracy than individual systems. Yanhui, G. et al. [34] leveraged the powerful self-learning capability and time-series data processing ability of Long Short-Term Memory (LSTM) neural networks. Based on a safety evaluation method, actual monitoring data were transformed into quantitative risk measures. An LSTM-based safety risk early-warning model was then established to predict the short-term deformation at various monitoring points of the foundation pit. The results indicated that the absolute error between the predicted deformation values and the field-monitored values ranged from −0.24 mm to 0.16 mm. Wang, X. et al. [35] proposed a new method to detect early abnormal water inflow, using six indicators with long-term monitoring data, establishing single-indicator, multi-factor linear, and integrated intelligent early-warning models, achieving a correct warning rate of 95.2%.

2.2. Current Practice Status

During deep foundation pit construction, collapse incidents represent a serious safety hazard due to complex underground environments and challenging construction conditions. Such incidents may result in casualties and property losses. Therefore, identifying, warning, and controlling the factors that contribute to deep foundation pit collapses is critically important. This section conducts an in-depth analysis of the interrelationships among safety risk factors in deep foundation pit construction practices. The Characteristics of Deep Foundation Pit Construction with Extra-Long Weir Construction Method could be identified as follows:
(1) Segmented Construction: The Extra-Long Weir Construction Method divides the entire project into several relatively independent construction segments, completing them step by step. Each segment can be optimized and adjusted according to specific conditions, enhancing construction flexibility and controllability.
(2) Enhanced Safety: Segmented construction helps to improve the overall safety of the construction process. By dividing the project into relatively independent parts, construction site safety risks can be better controlled.
(3) Quality Control: Segmentation facilitates quality control. Each segment can undergo independent quality inspections and acceptance, ensuring that every part meets design and specification requirements.
(4) Shorter Construction Cycle: Due to the segmented approach, each construction segment is relatively small and can be completed in a shorter time. This improves construction efficiency and reduces the overall project duration.
(5) Adaptation to Complex Geological Conditions: The segmented approach allows the Extra-Long Weir Construction Method to better adapt to complex geological conditions.
By summarizing the spatial location information of deep foundation pit construction and warning information sources related to pit collapses, the data can be categorized into two main types: quantitative monitoring information and qualitative observational information. Quantitative monitoring information is collected using relevant monitoring instruments, providing measurable data through the recording of various physical parameters. Such data can be collected in real time or at regular intervals and processed using specialized software to provide quantitative evaluations of the construction status and soil stability. Qualitative observational information mainly derives from the sensory observations and experiential judgment of inspection personnel. These qualitative observations may include direct sensory perceptions, descriptive records, and visualized imagery.
Both types of information play an irreplaceable role during deep foundation pit construction. Quantitative monitoring provides precise data and imagery to assist engineers in scientific analysis and decision-making, forming the basis for timely intervention. Qualitative observational information complements what monitoring instruments cannot detect, offering a comprehensive understanding of the construction environment and helping engineers identify potential issues and take prompt corrective actions. To systematically identify risk factors in deep foundation pit construction, this study introduces Fault Tree Analysis (FTA) [36]. The FTA method employs logical reasoning to identify and evaluate hazards within various systems. It not only analyzes the direct causes of accidents but also reveals potential underlying causes. As a method combining both quantitative and qualitative analysis, FTA has been widely applied.
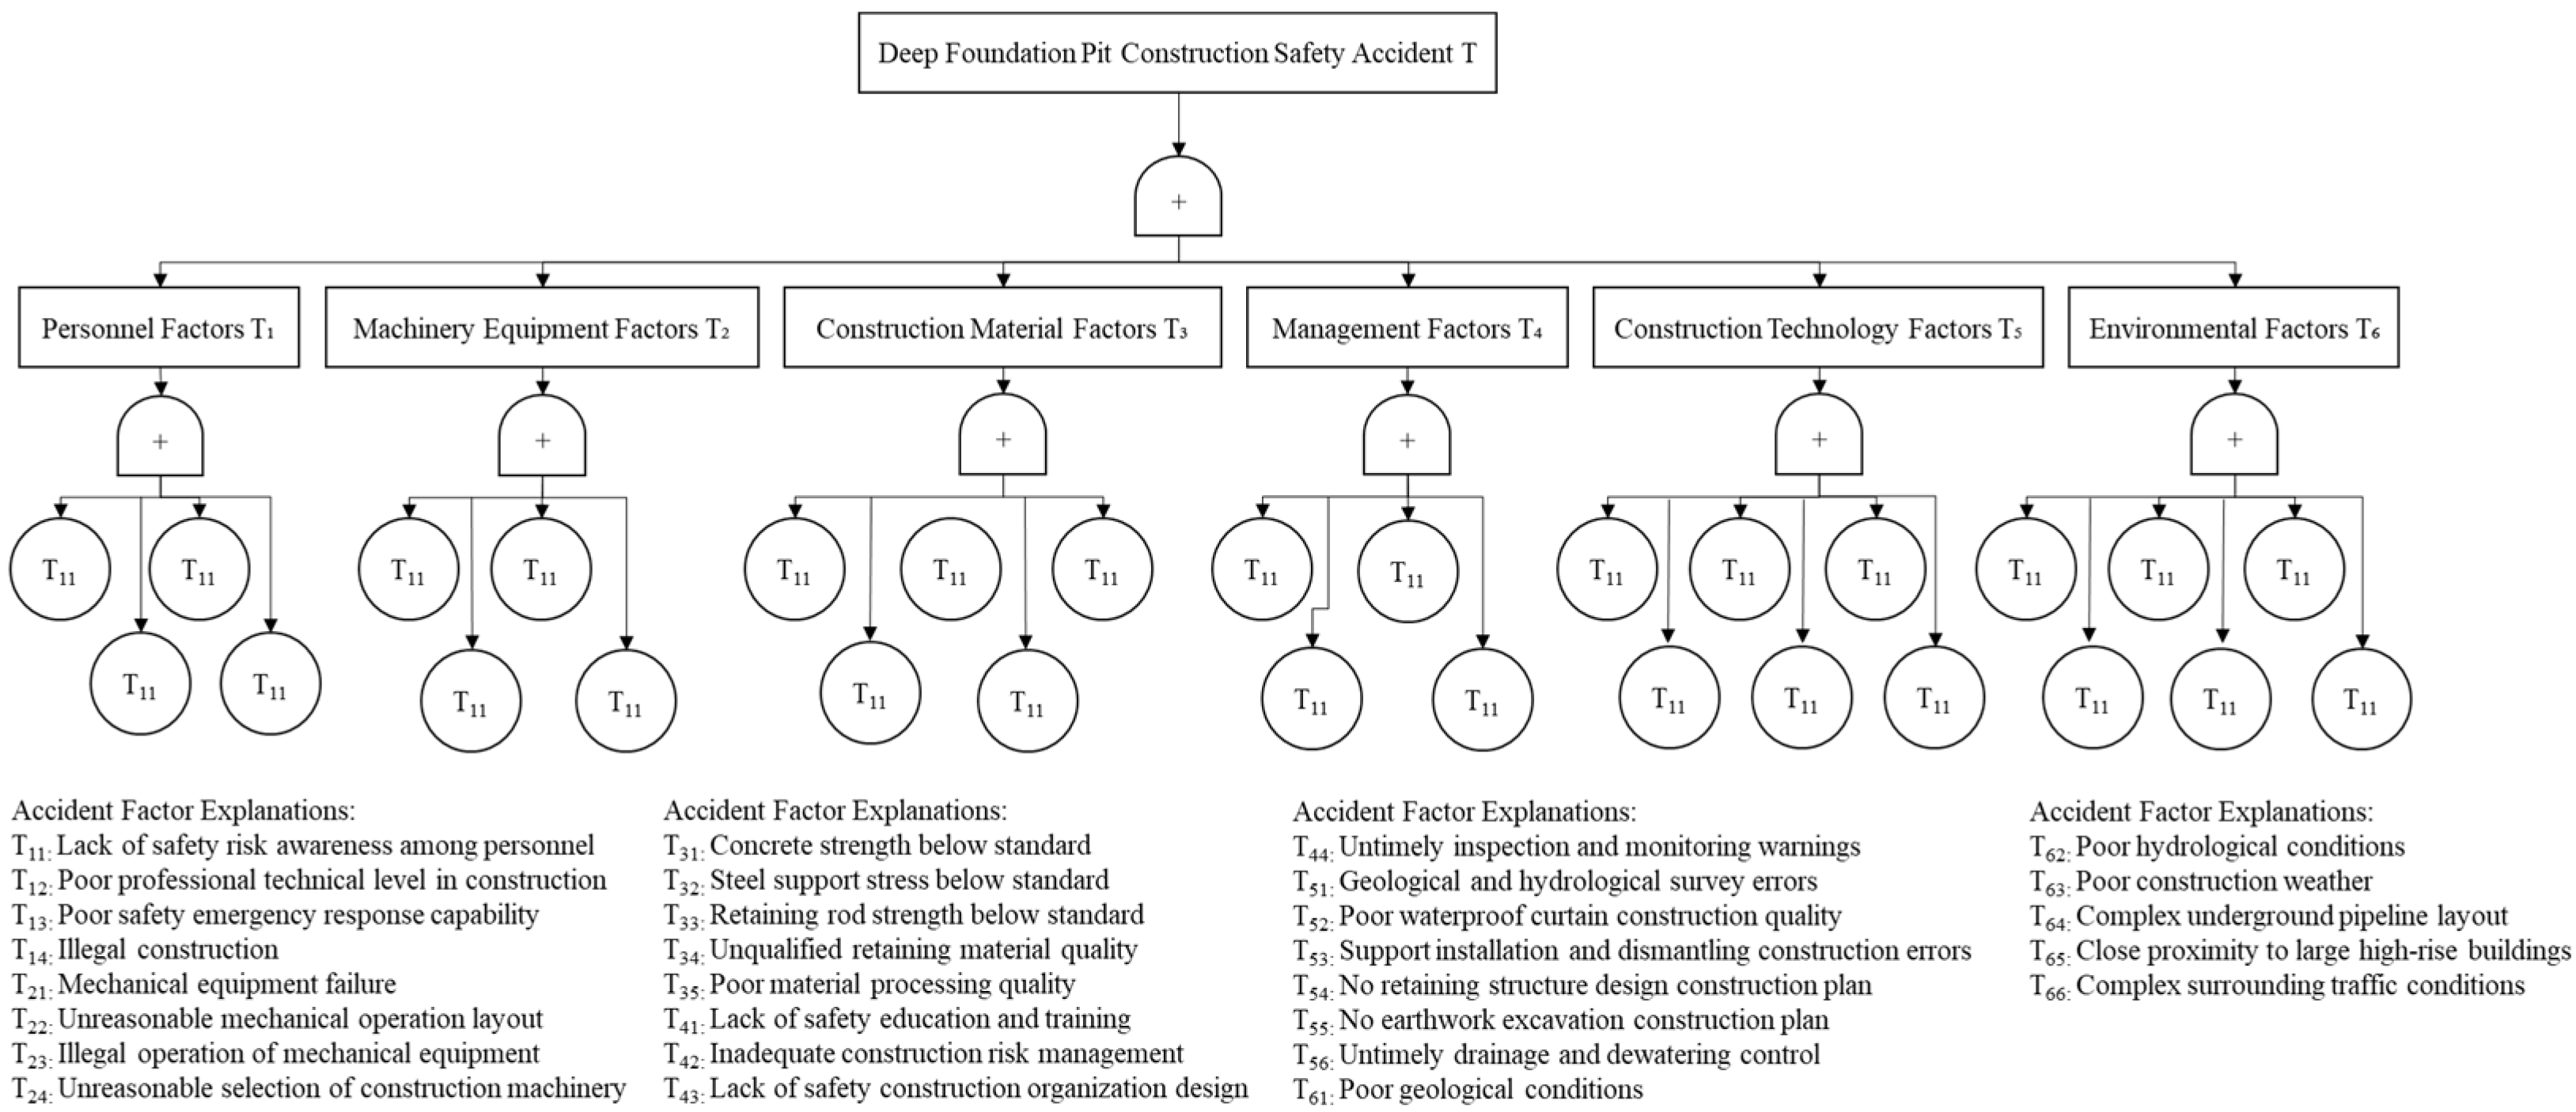
A statistical analysis of 132 deep foundation pit construction safety incidents shows that the main causes include insufficient stress in steel supports, adverse weather conditions, and improper operation of machinery. Tracing back to the root causes, a deep foundation pit construction safety fault tree is established based on accident tree theory and statistical risk source analysis, as illustrated in Figure 3.
This system comprises six primary indicators—personnel factors, machinery and equipment factors, construction material factors, management factors, construction technology factors, and environmental factors—and twenty-nine secondary indicators, as presented in Table 1.
Hence, based on an extensive literature review and practice experiences, significant progress has been made in monitoring, early warning, and proactive control research for foundation pit construction, providing a foundation and reference for this study. However, current early warning technologies still have limitations: existing studies are mainly divided into design-stage and construction-stage warnings. Design-stage warnings often differ significantly from actual construction conditions. Early-warning models based on measured data typically rely on single-factor regression analysis, neglecting the coupling effects among factors, leading to large discrepancies between predictions and actual results; in machine learning models for dynamic deformation prediction, most studies use single algorithms trained on measured samples, without accounting for missing pre-excavation data. This causes networks to be inactive before excavation, prone to local minima, slow learning, and non-convergence; research on real-time early warning for deep foundation pits using the diaphragm wall method remains insufficient both domestically and internationally, lacking efficient monitoring techniques to promptly detect potential risks.
Several key challenges remain in real-time safety risk early warning for diaphragm wall deep foundation pit construction:
(1) Multi-Scale Data Fusion: How to integrate multi-scale data from different monitoring devices and sensors to establish a comprehensive monitoring system.
(2) Early-Warning Model Accuracy: How to develop high-precision risk warning models that accurately capture potential risks.
(3) Emergency Response Mechanisms: How to establish robust emergency response procedures to implement effective measures in case of accidents.
In summary, real-time safety risk early warning and intelligent proactive control for deep foundation pits constructed with the diaphragm wall method hold significant scientific and practical value. However, multiple challenges must be overcome. Continued research and collaboration can enhance construction safety and efficiency, providing more reliable technical support for urban development and underground space utilization.

3. Materials and Methods

3.1. Research Methodology

This paper mainly studied the response patterns of influencing factors for safety risk early warning in deep foundation pit construction, factors and spatiotemporal characteristics between factors, as well as the establishment and application of early-warning models based on multi-source data. According to the content of this paper’s research topic, the research methods adopted mainly include theoretical analysis, laboratory experimental research, field data collection, and field verification. The connections between various parts of the paper, corresponding theories, and adopted methods are shown in Figure 4.

3.2. Framework of Early-Warning Model

Risk early warning refers to the scientific assessment and evaluation of unexpected situations caused by negative influencing factors during the construction process, and the preparation of contingency measures and emergency plans for potential impacts. Since the 1980s, with the frequent occurrence of safety accidents, safety risk evaluation and early warning have attracted widespread attention in domestic industries such as construction, coal, petroleum, metallurgy, and aerospace.
The identification of precursor features for deep foundation pit safety early warning usually relies on trend analysis or mathematical computation of the raw time-series data collected from the foundation pit. However, due to the complex excavation environment and the spatial- and temporal-frequency characteristics of potential hazard factors, the relationships among these factors are nonlinear. Convolutional Neural Networks (CNNs), as a deep learning method, can efficiently and rapidly extract features from two-dimensional data. Therefore, this chapter provides a detailed introduction and analysis of classic CNN structures, characteristics, and network architectures, and proposes a CNN-based deep foundation pit safety risk early-warning model, which is subsequently validated, providing a reliable and precise basis for precursor feature identification in pit safety risk warning.
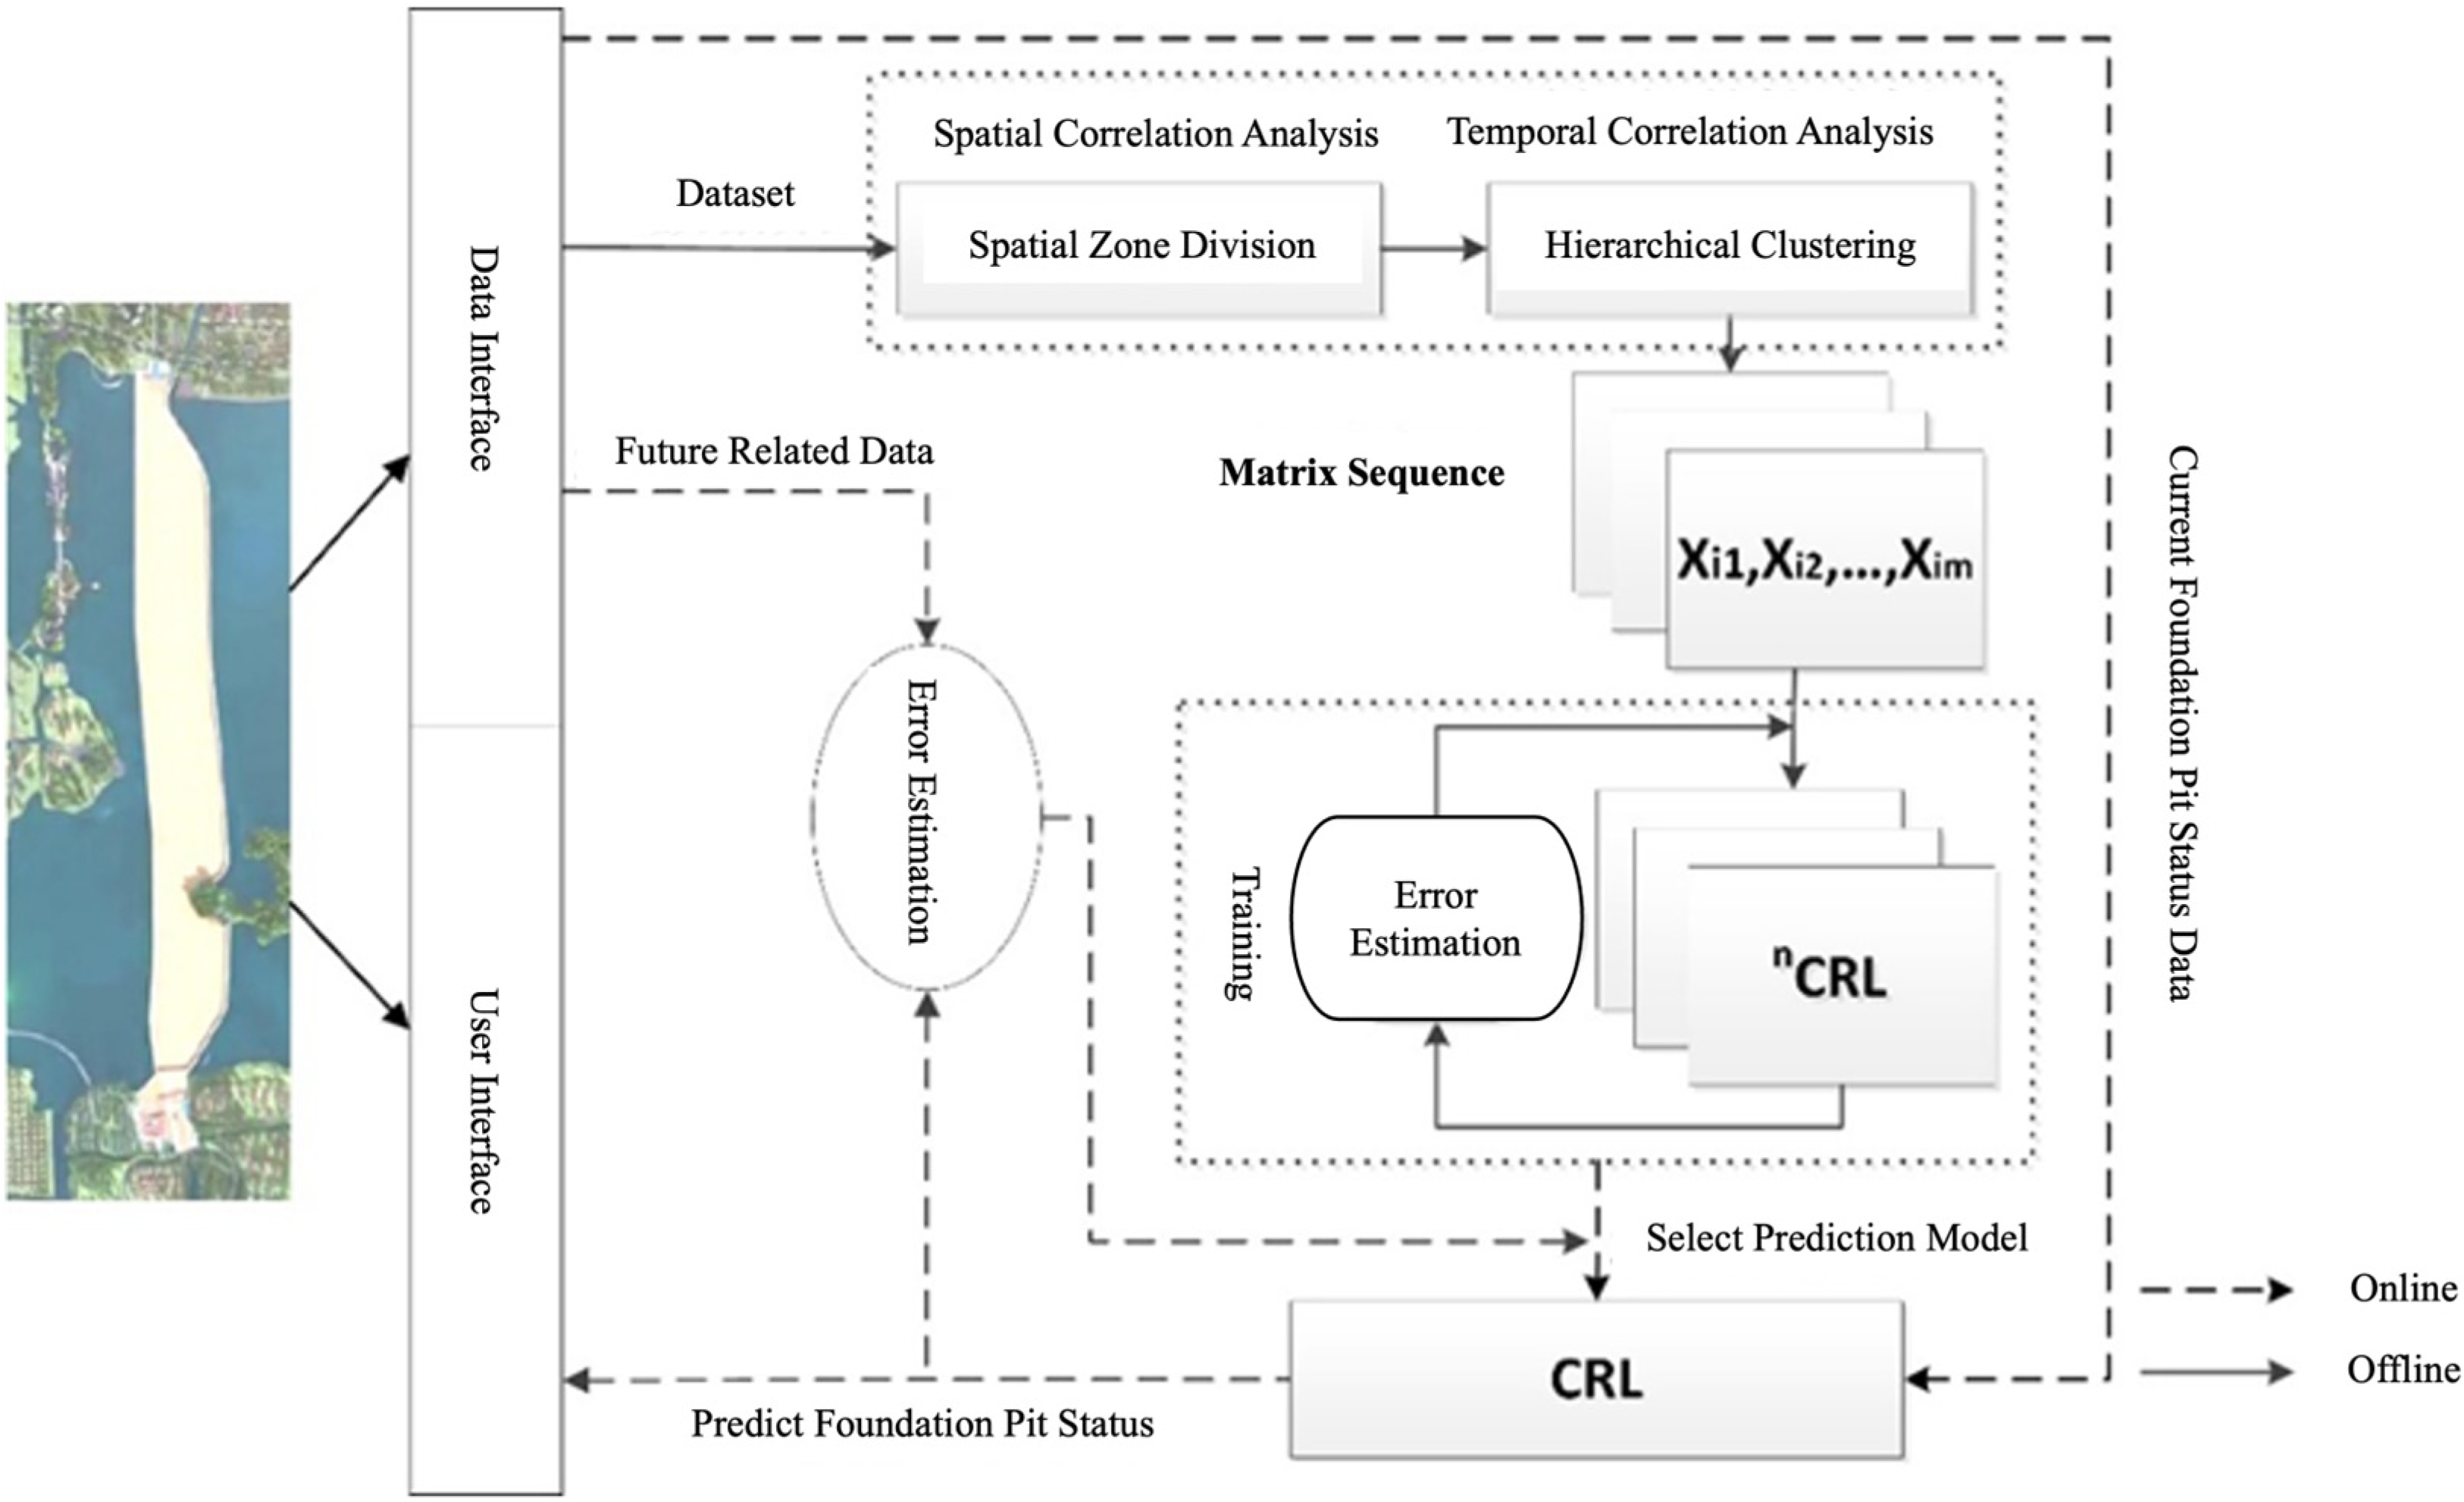
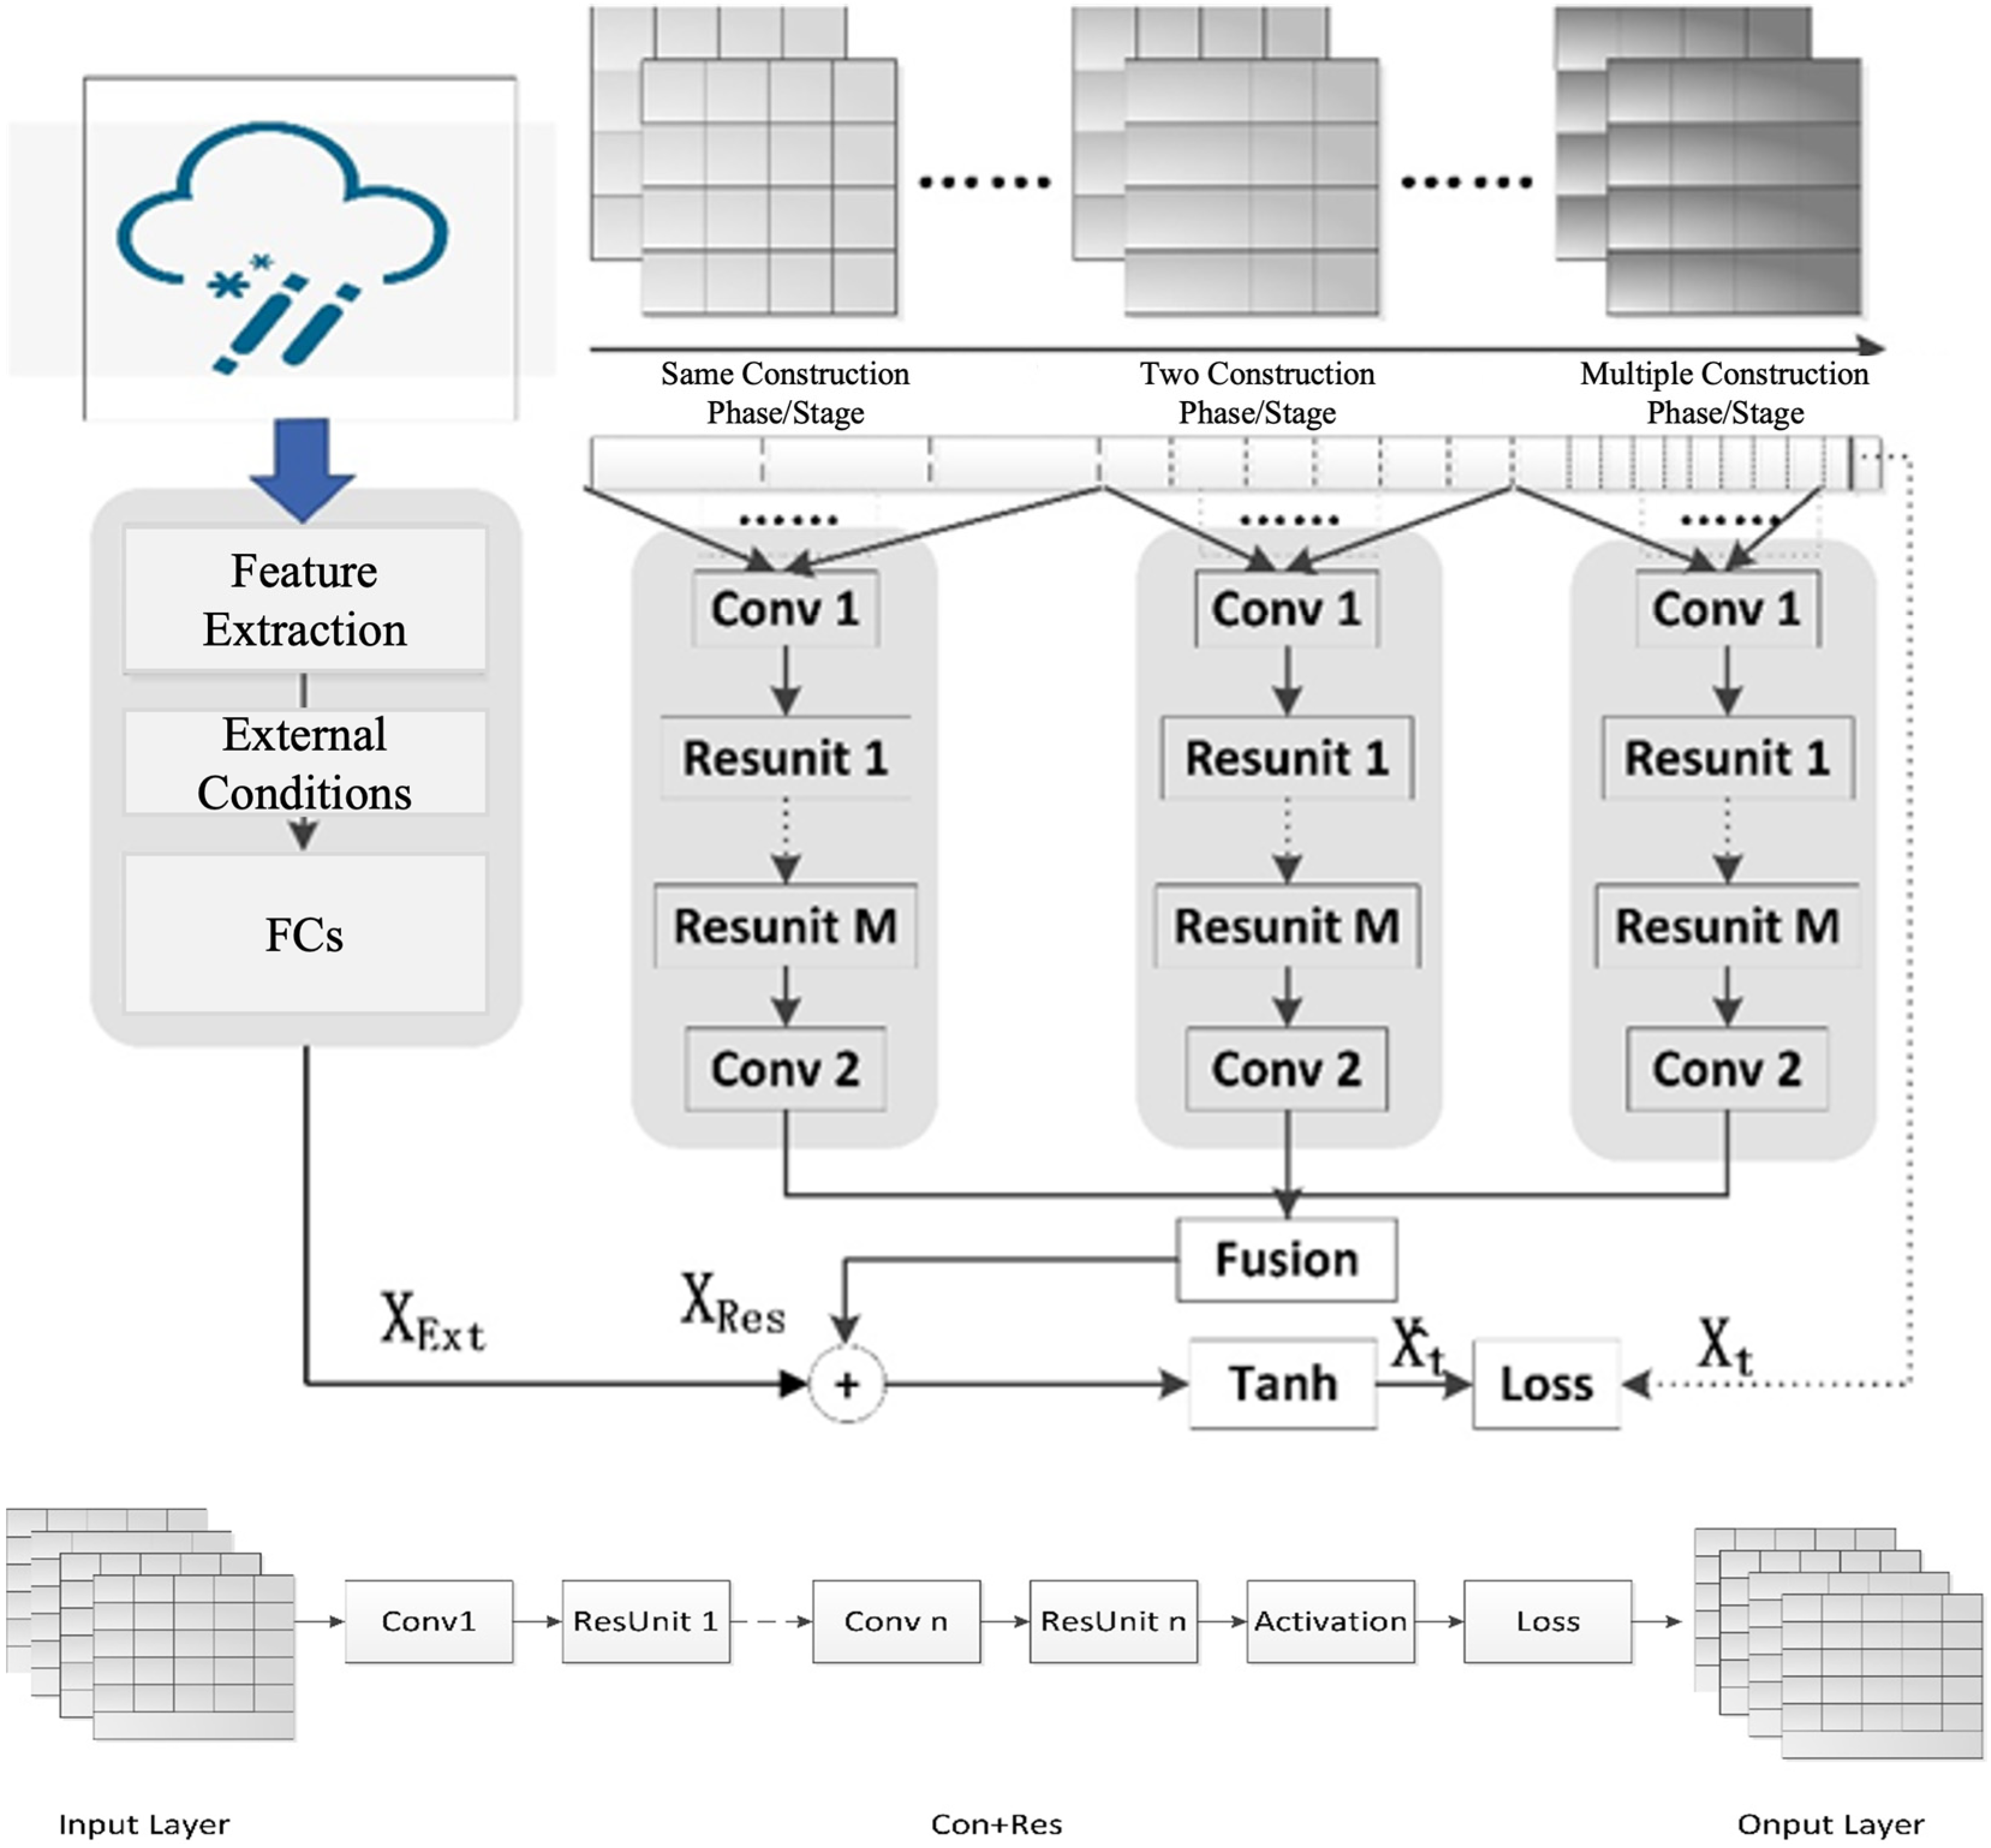
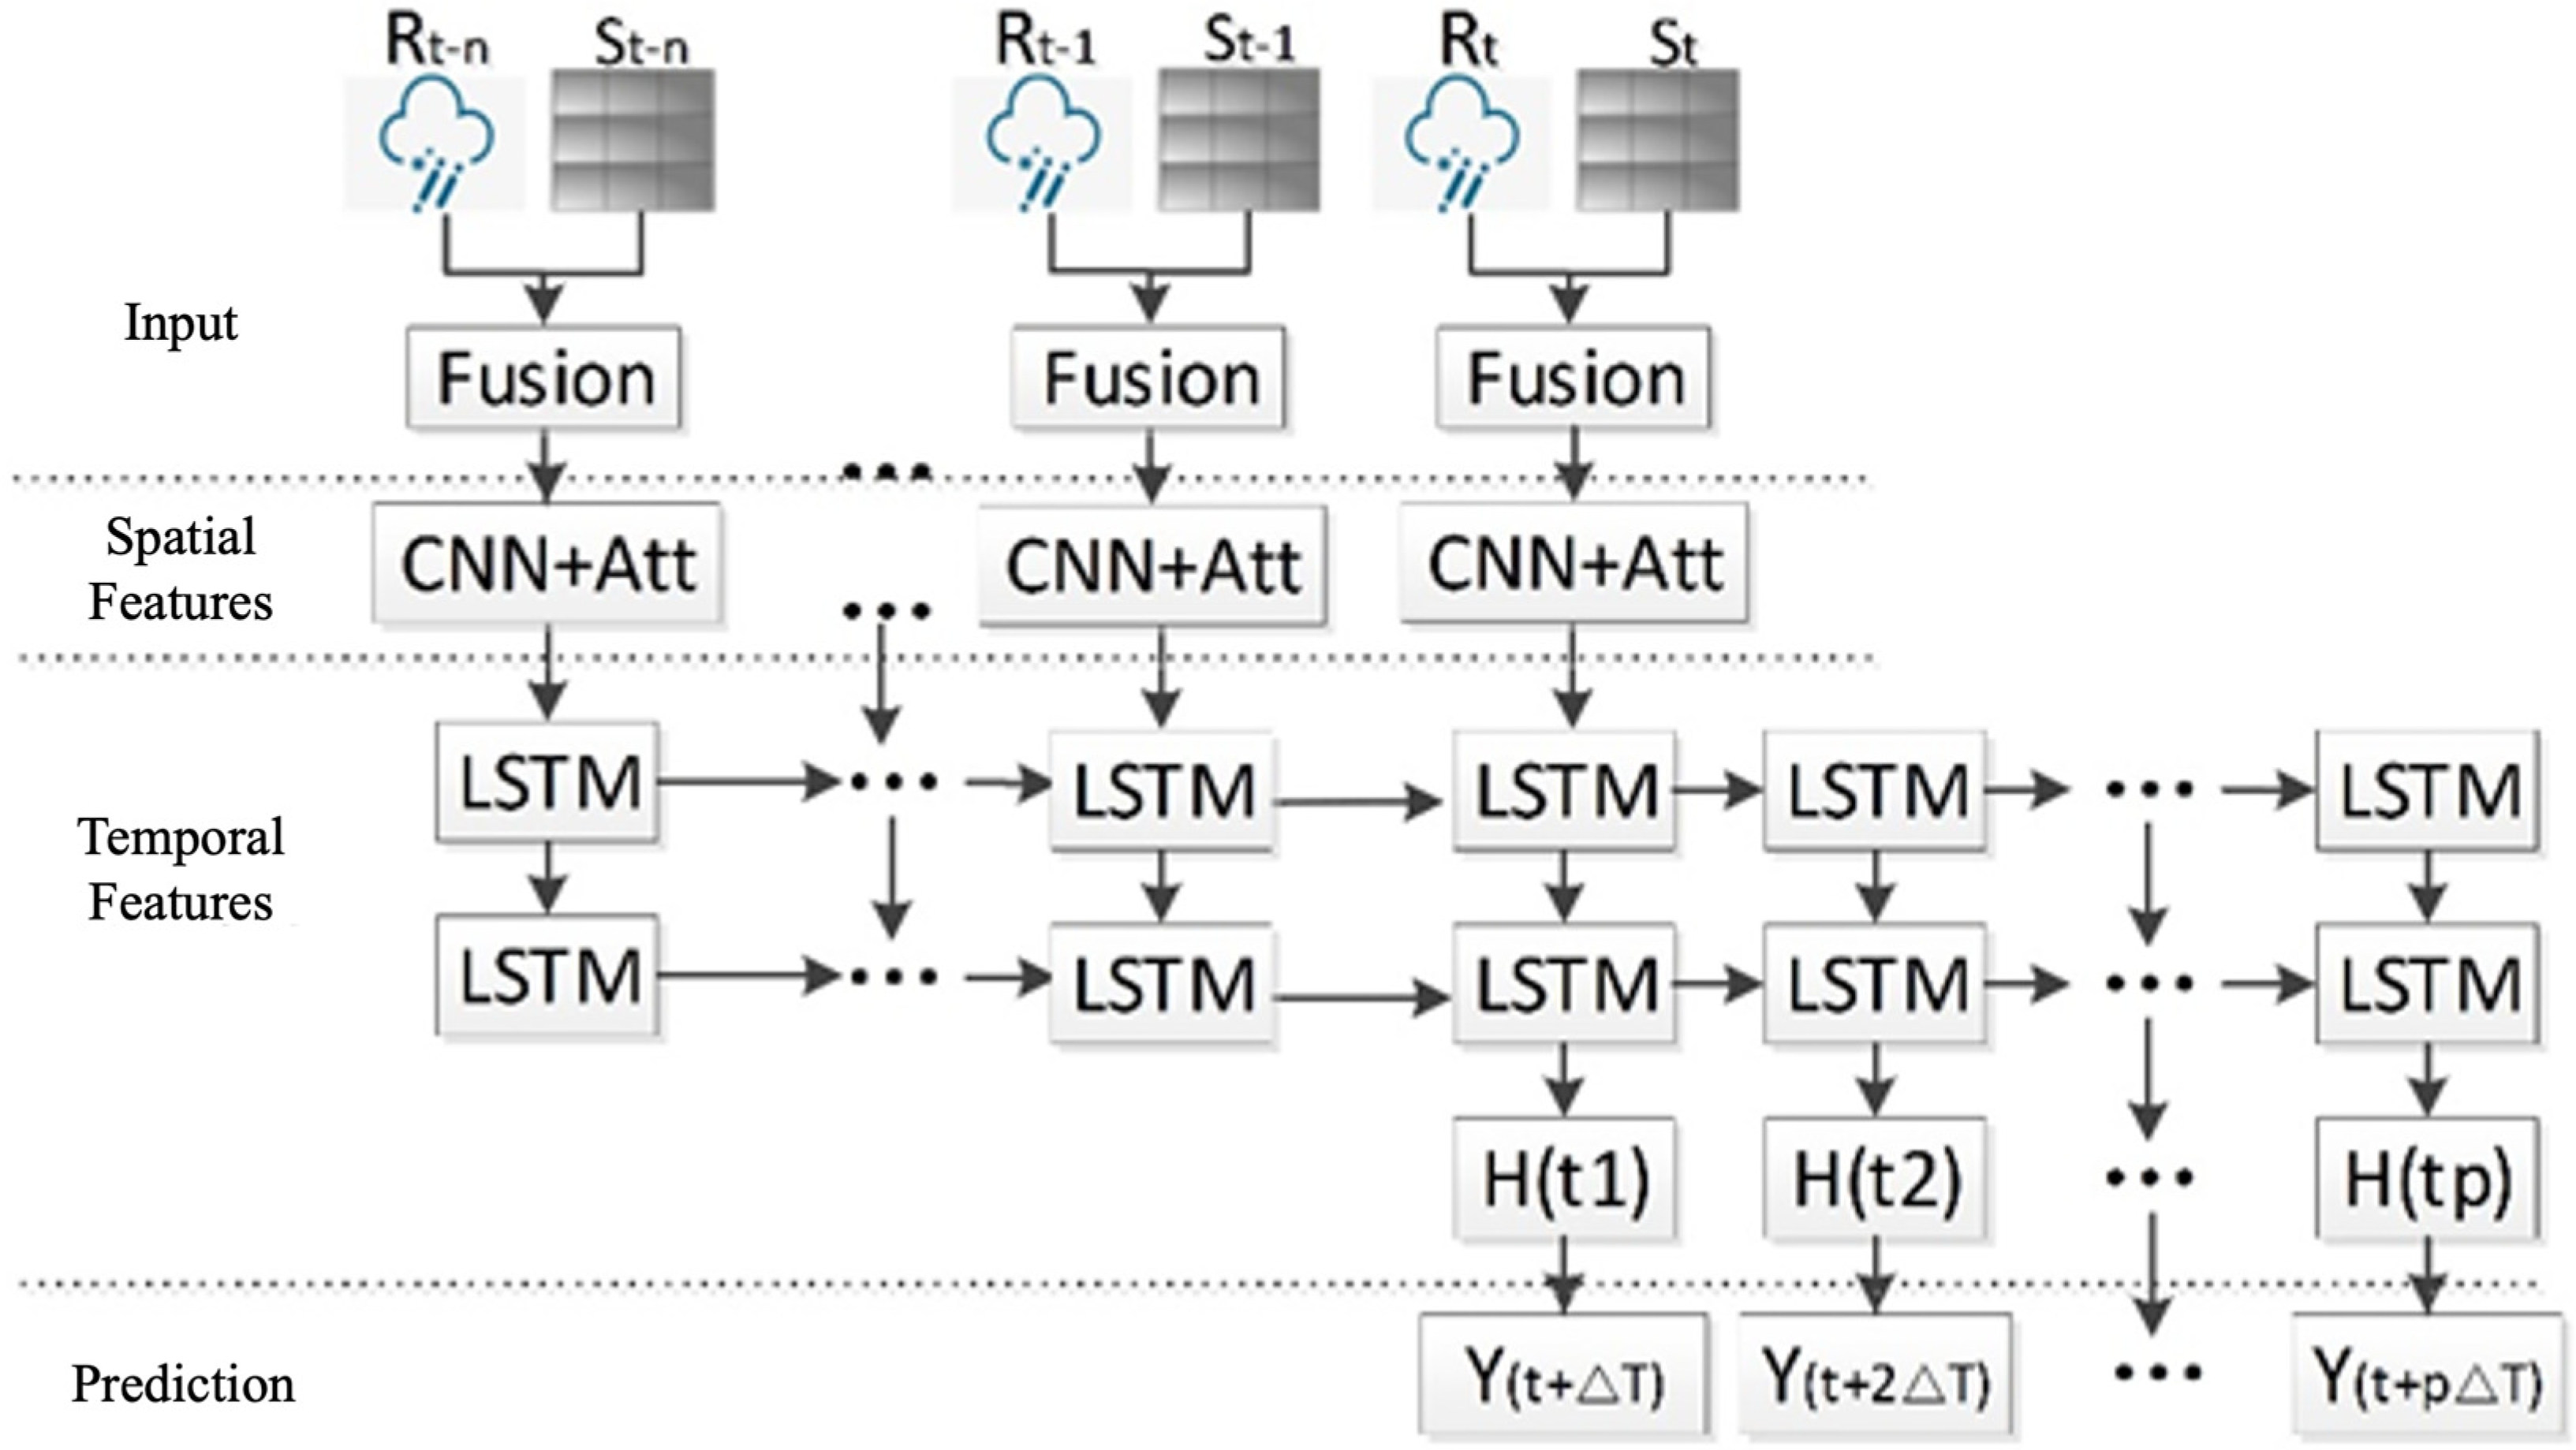
The deep foundation pit construction safety early-warning model based on Deep Learning and Multi-Source Data Prediction (DL-MSD, Deep Learning and Multi-Source Data Prediction method) consists of three layers: the input layer, the learning layer, and the output layer. The learning layer is built upon the 3D convolution process proposed by Shuiwang, J. et al. [37], the ST-ResNet (deep spatiotemporal residual network) model proposed by Zhang, J. et al. [38], and LSTM (Long Short-Term Memory) networks [39]. The model integrates CNN and residual units. CNNs can automatically learn and extract features from the data, demonstrating significantly stronger generalization capabilities compared with traditional methods such as mathematical fitting and classical machine learning. Residual units represent the difference between observed values and estimated values (i.e., fitted values); a residual layer is introduced to prevent gradient vanishing and enhance deep learning network performance. The output layer ensures that the output matrix size matches the input matrix size. The technical framework of the model is shown in Figure 5.
The construction of deep foundation pits using the Extra-Long Weir Construction Method is carried out in stages. Therefore, in terms of data processing, the model learns from and predicts based on spatiotemporal sequences of the samples. For the monitoring data acquisition process of deep foundation pits, a continuous time-series dataset can only be obtained after a period of monitoring. A time-series-based deep learning model can then be employed for construction safety risk early warning, shown in Figure 6. The specific implementation steps are as follows.
(1) Sample selection: When selecting sample data, the model first uses available time-series data as the input, with the subsequent point on the timeline serving as the output that the model needs to predict. Since the input data comes from multiple types of sources, normalization preprocessing is required beforehand.
(2) Model Structure: The core of the model is a deep learning framework. During prediction, calculations based on single-factor prediction models and multi-source data fusion prediction models run in parallel. This approach not only helps identify the early warning sources but also mitigates inaccuracies caused by occasional uncertainties (e.g., data errors or large-scale missing data), allowing the single-factor prediction results to substitute for multi-source fusion outputs when necessary.
(3) Output Utilization: The predicted values obtained from learning the sample data can serve directly as the early warning outputs, or as inputs for adaptive selection of pre-control measures for subsequent calculations.
(4) Sliding Window Training: A sliding window approach is adopted to construct training samples based on the time series. To avoid low prediction accuracy due to insufficient training samples in the early construction stage.
(5) Incremental Training: As new data become available, training samples are continuously expanded. Since the settings of deep learning parameters lack explicit theoretical guidance, parameter tuning must be conducted through repeated training. Increasing the sample size plays a crucial role in updating the model parameters and improving prediction accuracy.
The learning process of its multi-source data fusion 3D learning model is shown in Algorithm 1:
Algorithm 1: 3DM-DLM Training Algorithm
Input: Historical observations: {X0, ⋯, Xn−1};
     Lengths of time, day, week sequences: Lt, Ld, Lw;
Output: learned 3DM-DLM model
          // construct training instances
          D ← Ø
For all available time interval t ( 1 t n 1 ) do
     St = (Xt−1, ⋯, Xt−(Lt−1), Xt−Lt )
     Sd = (Xt−d, ⋯, Xt−(Ld−1)*d), Xt−Ld)
     Sw = (Xt−w, ⋯, Xt−(Lw−1)*w), Xt−Lw)
          // Xt is the target at the time t
               Put an training instance ({St, Sd, Sw}, X(t)) into D
          // train the model
Initialize all learnable parameters θ in 3DM-DLM
     Repeat
          Find θ by minimizing the Equation (1)
Until stopping criteria is met
L θ   =   | X t     X t | 2 2
where L(θ) is the loss function; X t is the real data at time t and X t is the predicted data at time t.
To extract the temporal correlation features of foundation pit states, the convolution process adopts 3D convolution. The convolution function is improved based on existing methods proposed by Shuiwang, Ji. et al. [37], and the process function is shown as follows:
X i j x y   =   R e L U ( m p = 0 p i 1 q = 0 q i 1 w i j m p q x i 1 m x + p y + q   +   b i j )
where ReLU is the Rectified Linear Unit function; X i j x y represents the value at position (x,y) on the j-th feature map of the i-th layer; bij represents a bias value for this feature map; m is the index of the feature map set from the (i−1)-th layer connected to the current feature map; w i j m p q is the weight value at coordinate (p,q) in the convolution kernel connecting to the m-th feature map; and pi and qi are the height and width of the kernel.
All neurons in the fully connected layer and output layer of this model are globally connected. To prevent the loss of corner information in the matrix, this paper adopts a boundary mode that allows filters to extend beyond the input boundaries, with zero padding applied to each region outside the boundaries.

3.2.1. CNN

CNN, or Convolutional Neural Network, is a type of deep learning model primarily used for image recognition and computer vision tasks. Its structural characteristics include local perception and weight sharing, which enable effective capture of spatial relationships and features within images. A CNN model typically consists of multiple convolutional layers, pooling layers, and fully connected layers, with each layer containing a certain number of neurons. Convolutional and pooling layers are alternately stacked, followed by a fully connected layer for classification or prediction.
(1) Convolution Layer: The convolutional layer is the core component of CNNs. By applying a series of filters (or kernels) through sliding window operations on the input data, it extracts relevant features.
(2) Pooling Layer: Pooling layers reduce the spatial dimensions of feature maps, thereby decreasing the number of parameters. Common pooling operations include max pooling and average pooling.
(3) Fully Connected Layer: Fully connected layers flatten the features extracted from previous layers and connect them to the output layer.
(4) Activation Function: Activation functions introduce nonlinearity to convolutional and fully connected layers.
(5) Dropout Layer: Dropout is a regularization technique used to prevent overfitting.
CNNs have achieved significant success in computer vision, widely applied to image classification, object detection, and segmentation tasks.

3.2.2. ResUnit

ResUnit, also known as a residual unit, is the fundamental building block of a residual network (ResNet). ResNet is designed to address the problems of gradient vanishing and degradation that often occur in very deep neural networks.
To overcome these problems, the residual unit introduces the concepts of skip connections and residual mapping. Specifically, a residual unit adds the input signal directly to the output signal, forming a “shortcut” that allows gradients to propagate more effectively to shallow layers. The basic structure of a residual unit is illustrated as follows:
Input
|- Convolution
|- Batch Normalization
|- Activation
|- Convolution
|- Batch Normalization
|- Add (with Input)
|- Activation
The core idea of the residual unit lies in the skip connection, which adds the input signal to the output signal and then applies the activation function. In practical applications, multiple residual units are typically stacked to form a deep residual network. The residual unit is the fundamental building block of deep residual networks. By introducing skip connections and residual mappings, it effectively addresses the problems of gradient vanishing and network degradation in deep networks. Its introduction has significantly improved the training performance and capabilities of deep neural networks, and it is widely applied in computer vision tasks such as image recognition and object detection.

3.2.3. LSTM

LSTM (Long Short-Term Memory) is a special type of recurrent neural network (RNN) designed to process and predict time-series data. Compared with traditional RNNs, LSTM is better at handling long-term dependencies. LSTM addresses gradient vanishing and exploding problems by introducing memory cells and gate mechanisms. The core idea of LSTM is the memory cell, which stores and updates information within the network. The memory cell includes a forget gate, which controls how much of the previous memory m(t − 1) should be forgotten based on the current input x(t). The forget gate applies a sigmoid function to produce a value between 0 and 1, indicating the proportion of information to be discarded. LSTM also incorporates an input gate and an output gate to regulate the updating and output of the memory cell. The input gate determines the amount of new information to store, while the output gate decides the quantity of information to output. The operation of LSTM can be summarized as follows:
(1) The input gate controls the updating of input signals through a sigmoid function to determine the new information to store.
(2) The forget gate regulates the retention of previous memory state using a sigmoid function to decide what to forget.
(3) The memory state update calculates the new memory state based on prior memory and current input data.
(4) The output gate governs the generation of output signals, determining how much information to output and applying a weighted function of the memory state.
In deep learning applications, LSTM is often combined with other network structures, such as Convolutional Neural Networks (CNNs) and attention mechanisms, achieving significant results.
In summary, LSTM is a neural network model specialized for time-series data. By introducing memory cells and gate mechanisms, it can effectively capture and utilize long-term dependencies, offering broad applicability and robust performance. Figure 7 and Figure 8 fully demonstrate how CNN is deeply integrated with ResUnit and LSTM.

3.3. Workflow of Early-Warning Model

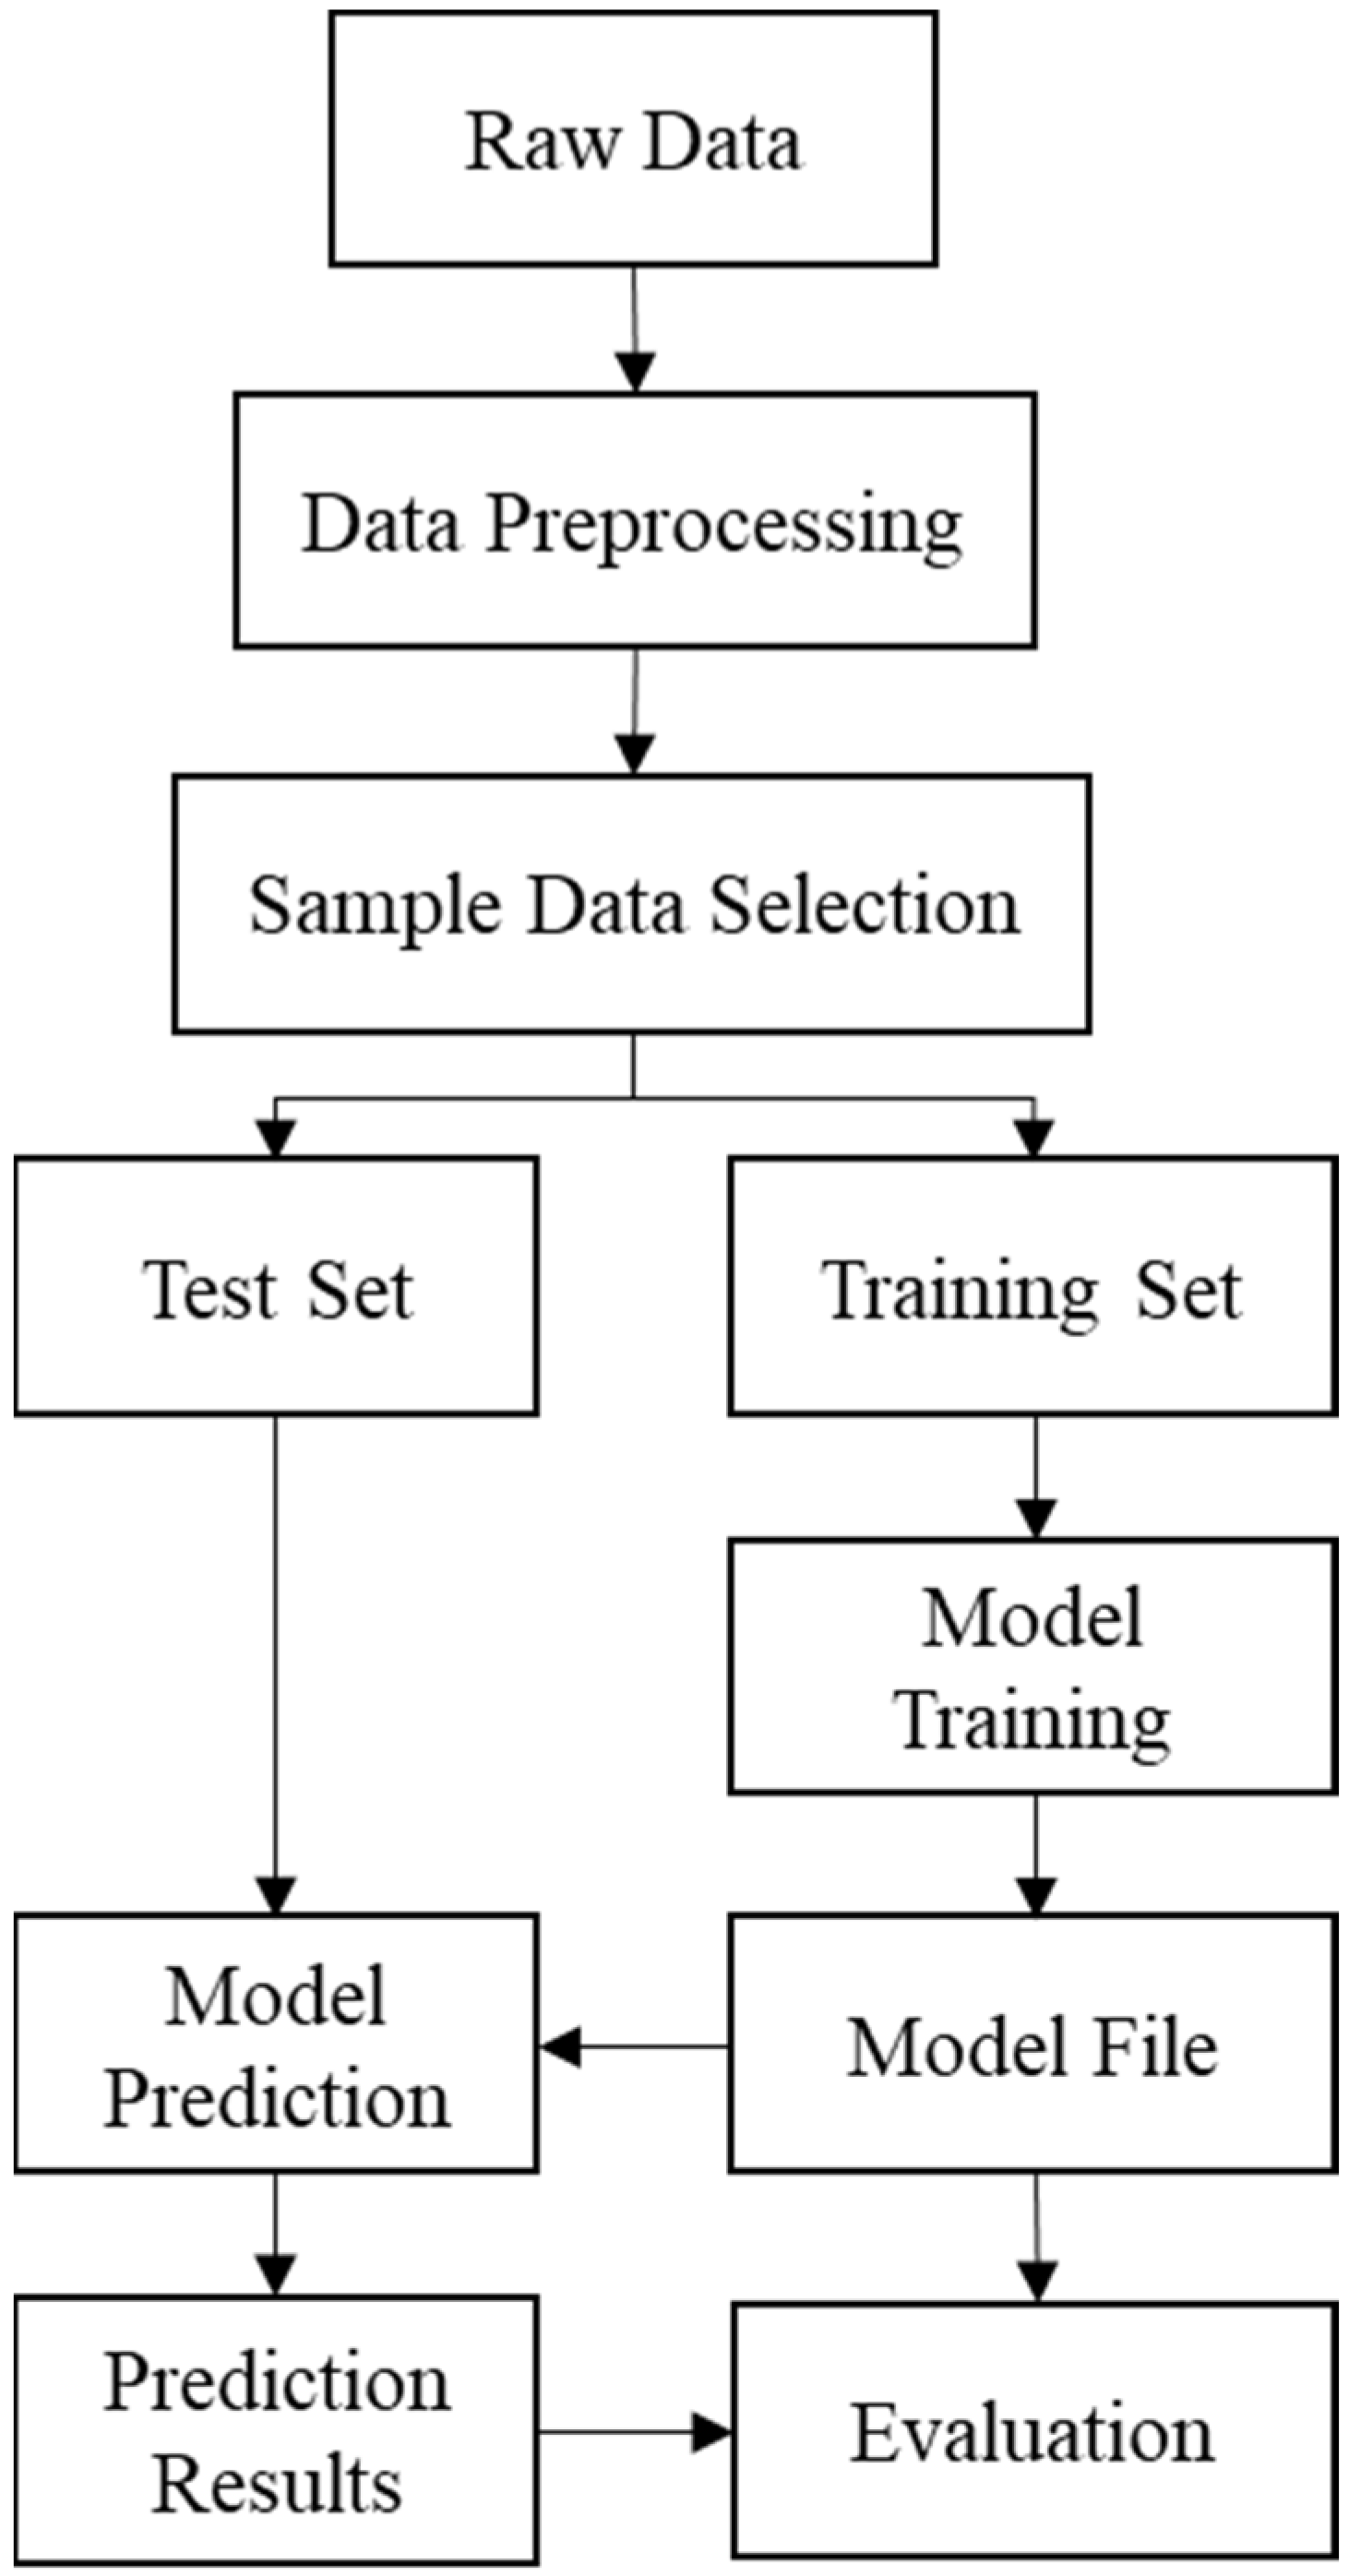
The establishment of the safety early-warning model for deep foundation pit construction with the Extra-Long Weir Construction Method primarily consists of two main stages: training and testing. The workflow of the intelligent prediction model for safety risk in deep foundation pit construction is shown in Figure 9.

3.3.1. Data Preprocessing

This study implements six key preprocessing steps:
(1)
Feature Standardization
Input data are standardized using min–max normalization to map values into the 0–1 range, eliminating magnitude differences and improving model convergence. The normalization formula is as follows:
y = x     x m i n x m a x     x m i n
where x is the original value, and xmax and xmin are the maximum and minimum values among all raw input data, respectively.
(2)
Outlier Processing
Outliers are handled using the Lagrange interpolation method, which constructs polynomial functions based on known data points. Given n + 1 data points, the Lagrange interpolation polynomial L(x) is expressed as follows:
L(x) = y0 × l0(x) + y1 × l1(x) + … + yn × ln(x)
where each l(x) is the Lagrange basis function, defined as follows:
li(x) = (x − x0)(x − x1)…(x − xi − 1)(x − xi + 1)…(x − xn)
(xi − x0)(xi − x1)…(xi − xi − 1)(xi − xi + 1)…(xi − xn)
The basis function li(x) has the property that li(x) = 1 when x = xi, and li(x) = 0 at all other data points. By weighting these basis functions with the coefficients yi, interpolation at the corresponding data points can be achieved. This method offers wide applicability and high interpolation accuracy for dense data points.
(3)
Data Balancing
The Python (version: 3.14.0a2) package imbalanced-learn (imblearn) provides various methods for addressing imbalanced datasets, including different approaches to under-sampling and over-sampling. In this study, the Tomek Links method is applied for under-sampling, and the Synthetic Minority Oversampling Technique (SMOTE) is employed for over-sampling. The core implementation code is shown in Table 2.
(4)
Data Clustering
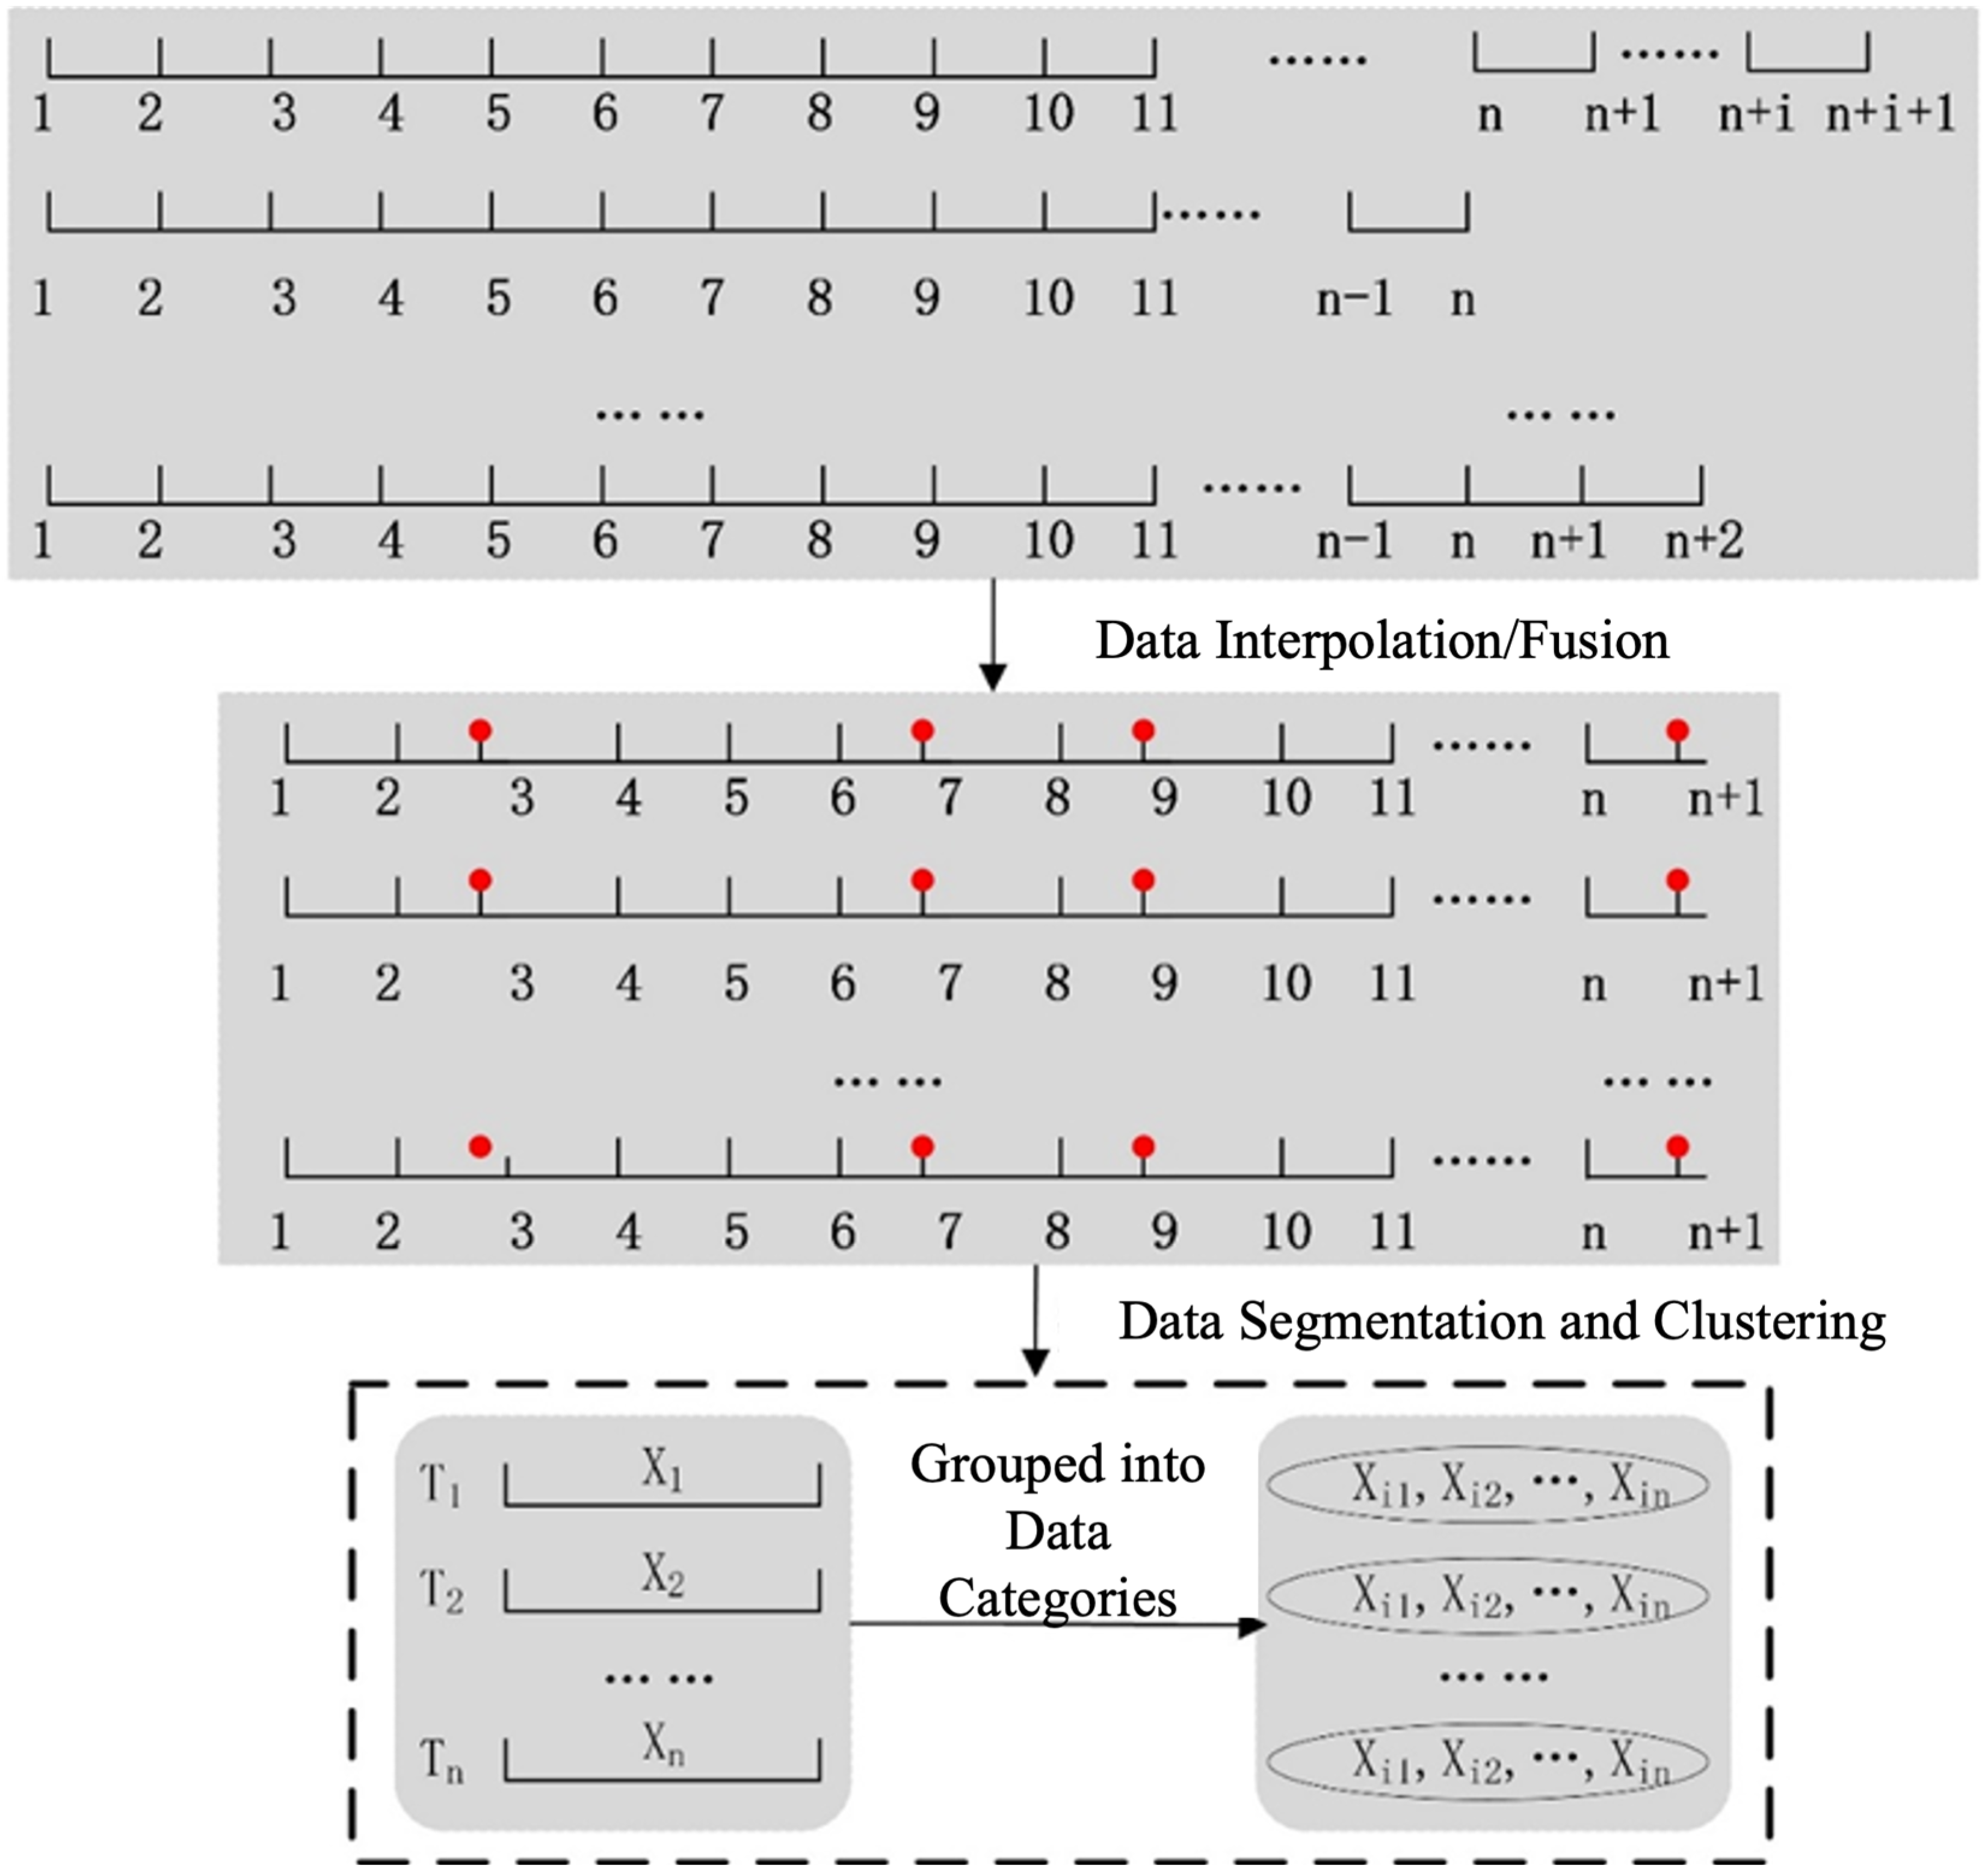
The database is constructed with the format (X, Y), where X represents state data and Y denotes prediction targets. Spatial location serves as the foundation, with accident-influencing factors as state variables and warning levels as prediction targets. Data clusters are shuffled to prevent overfitting during training, then divided into training and validation sets (shown in Figure 10).
(5)
Feature Weight Acquisition
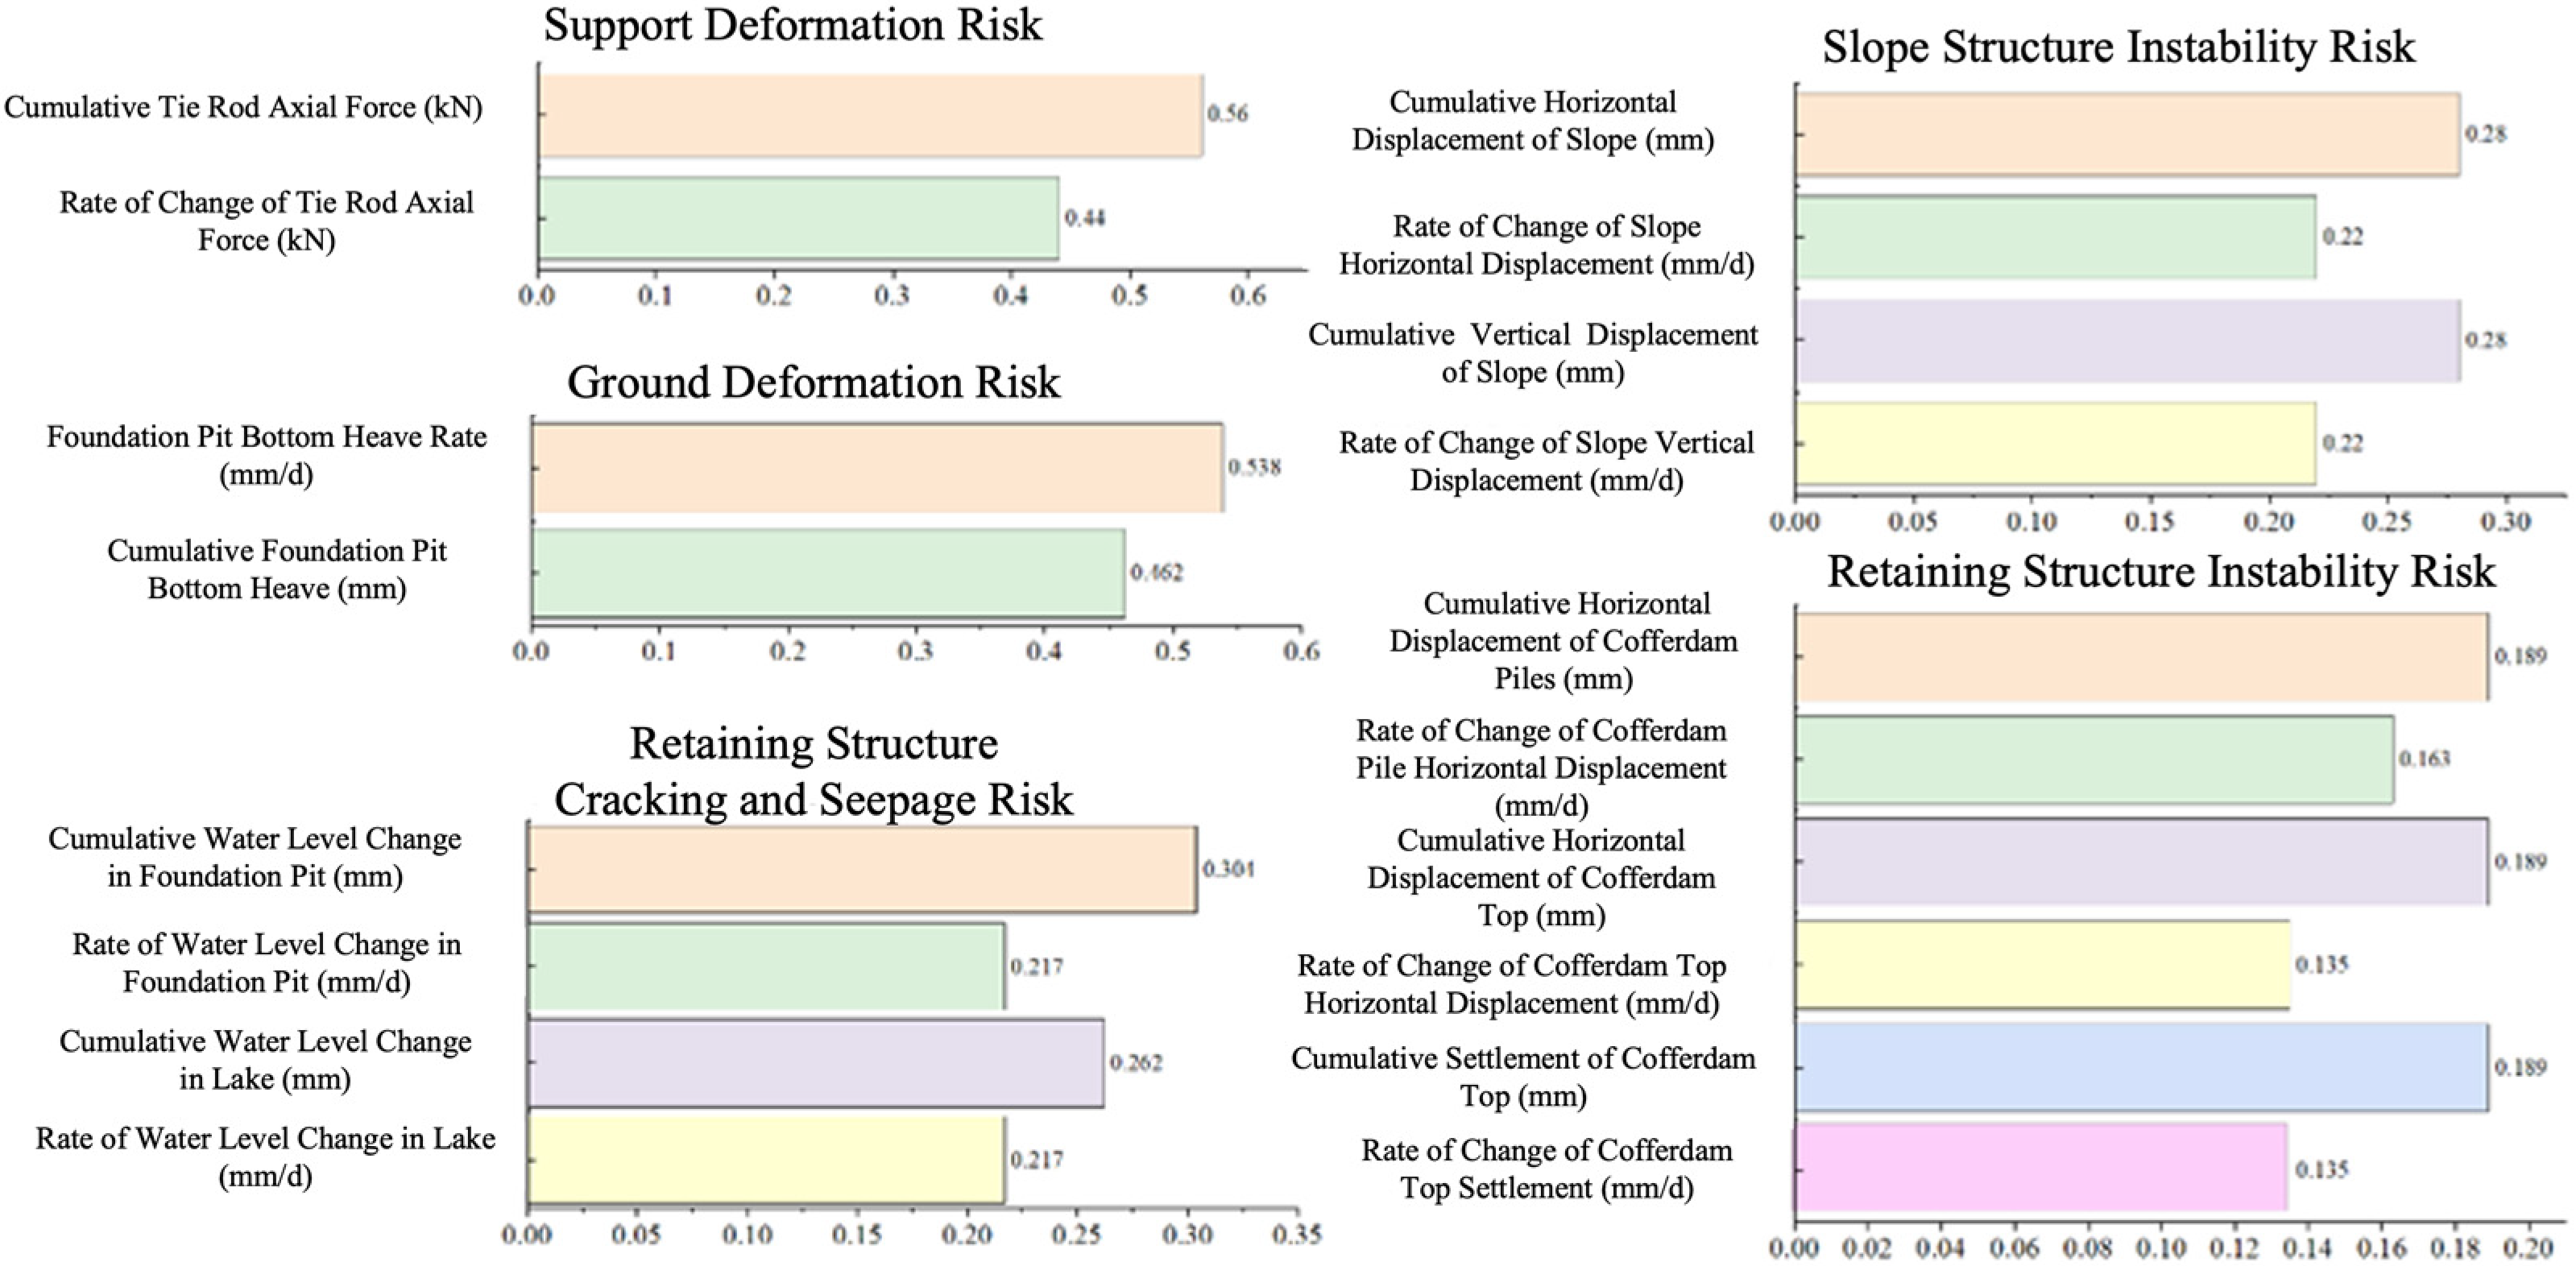
This part considers the close interrelationship among risk events, based on rough set theory was proposed for the reduction and weight determination of safety-related predictive indicators [40]. Building on this idea, this study adopts a combined approach of rough set-based weighting and expert scoring to obtain the weights of influencing factors in the deep foundation pit construction process (see Figure 11).
The weights can be directly computed at the pre-aggregation stage, where they are applied to the weighted aggregation of feature similarities. The qualitative expert scoring was converted into numerical values to obtain quantitative weights, which were then normalized and integrated with the sensor-measured data. The weight settings directly influence the accuracy of similarity calculation and classification results. This study identified that the support deformation risk factor received the highest weight, indicating it is the most critical indicator among the influencing factors during the construction process.
(6)
Data Fusion
Multi-source data fusion methods can be divided into static weight-based fusion [41] and adaptive dynamic fusion [42]. This study adopts a weight-based fusion method, which assigns different weights to different data sources and obtains the fusion result through linear or nonlinear combination. The weights are usually determined based on the relative accuracy, reliability, and correlation of the data. In this study, linear weighting is employed to achieve data fusion.
The linear weighting method is simple and intuitive: each factor is assigned a weight, and the weighted values are summed to obtain the final comprehensive weight. For example, suppose there are three factors, A, B, and C, with weights w1, w2, and w3, respectively. The comprehensive weight can be calculated as follows:
Comprehensive weight = w1 × A + w2 × B + w3 × C

3.3.2. Data Selection

Sample selection utilizes multi-case samples, including historical data and on-site dynamic monitoring data. Training and testing samples are strategically selected to comprehensively cover all risk levels (I, II, III, IV, and V), ensuring model accuracy and generalization capability. The sample database format includes impact factors C1 through Cn with corresponding risk level classifications (see Table 3). The model outputs a continuous risk index in the range of 0–1. This index is then mapped to the five discrete risk levels (I–V) using predefined engineering thresholds. Level I reflects the most severe and time-critical condition, whereas Level V represents normal operation. To construct labels, both cumulative and daily change criteria were applied. We adopted a maximum-severity assignment rule, where the highest risk level triggered by any indicator becomes the final label. In cases of disagreement, structural deformation indicators were given priority. Hazard-source tracing is achieved by comparing single-indicator predictions with the fused prediction to identify the most anomalous factor when Level I–II risks arise.

4. Case Application and Verification

4.1. Case Background

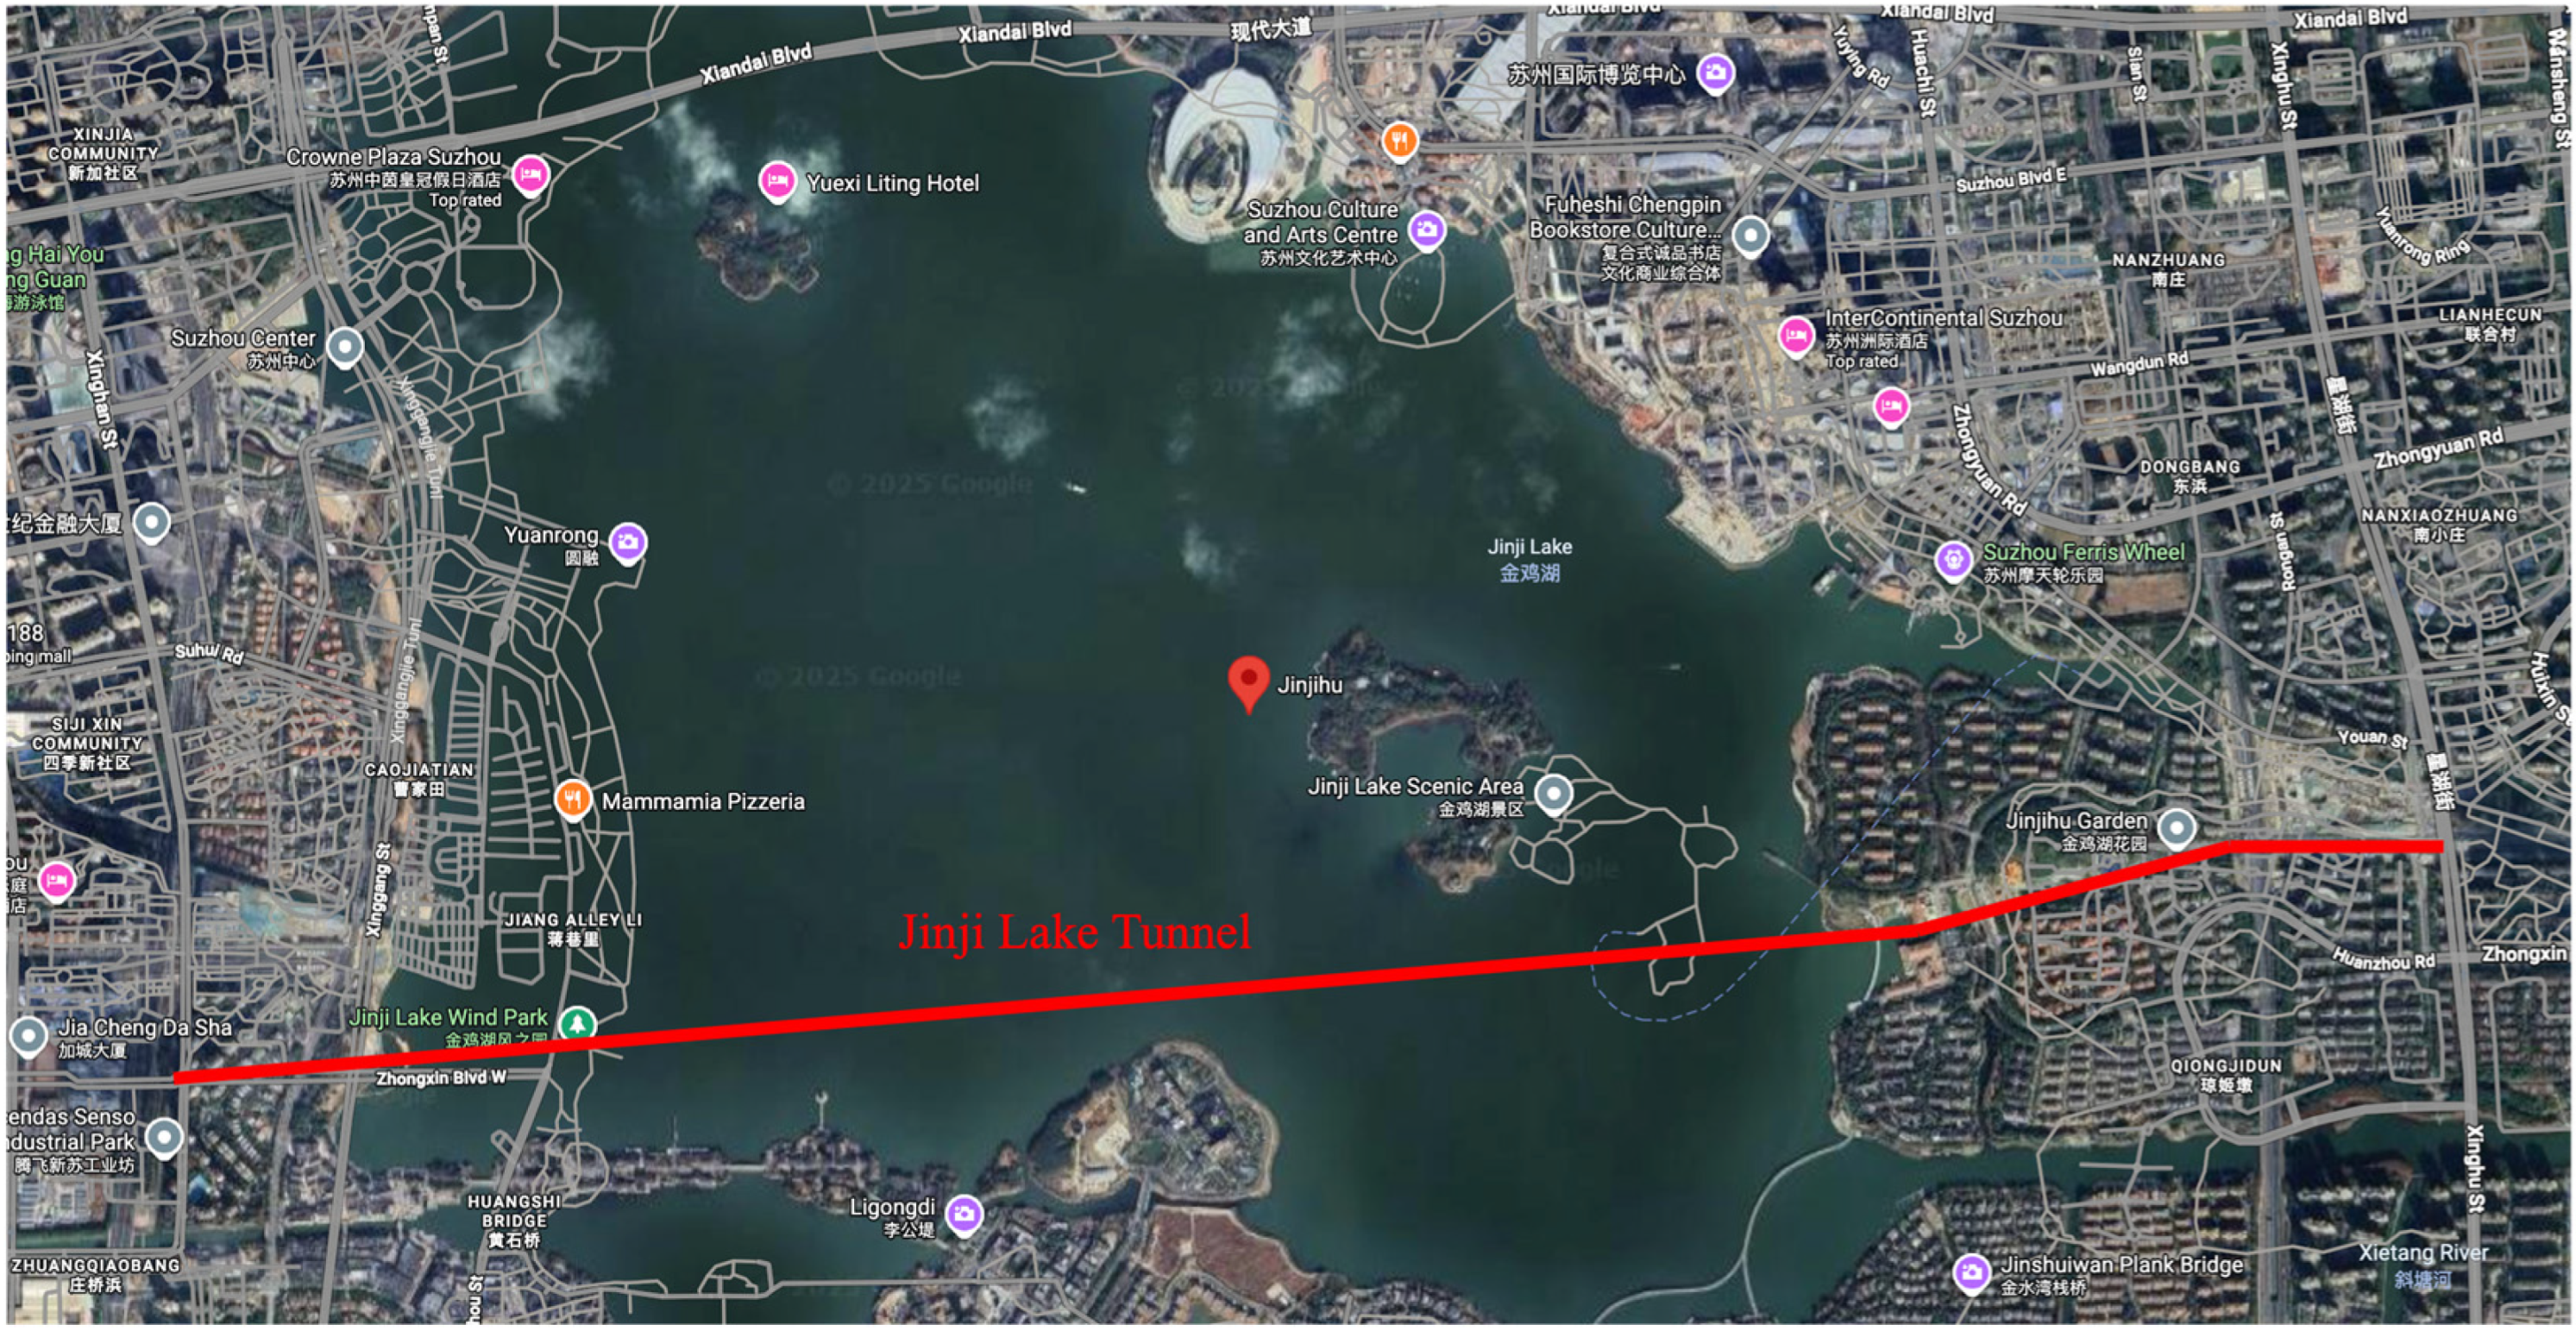
The project is in the Jinji Lake Scenic Area of Suzhou Industrial Park. The specific geographic layout is illustrated in Figure 12. The total length of the Jinji Lake Tunnel is approximately 5.5 km, with the western land section spanning about 1200 m, the lake water section approximately 3000 m, and the eastern land section around 1300 m.
Jinji Lake is currently the largest urban lake park in China. The Jinji Lake Tunnel project, as the country’s longest cut-and-cover urban under-lake tunnel for combined rail and road, covers a total area of 31.9 km2 with a total investment of approximately CNY 6 billion and a total length of about 6.04 km. The tunnel adopts the cofferdam (weir) construction method. The cofferdam is composed of steel sheet piles and steel pipes, requiring waterborne operations. Subsequent procedures include dewatering, excavation, main structure construction, backfilling, and water restoration, with overlapping work between different stages. The average water depth of Jinji Lake is 1.8 m, with the deepest part reaching 5 m. Water, especially during the rainy season, has a significant impact on cofferdam stability and seepage deformation. Moreover, as Jinji Lake is a 5A-level scenic area, construction demands extremely high environmental standards. The diversity and complexity of the surrounding environment make it particularly necessary and important to predict and provide early warning for deep foundation pit construction safety risks in this area.

4.2. Data Overview

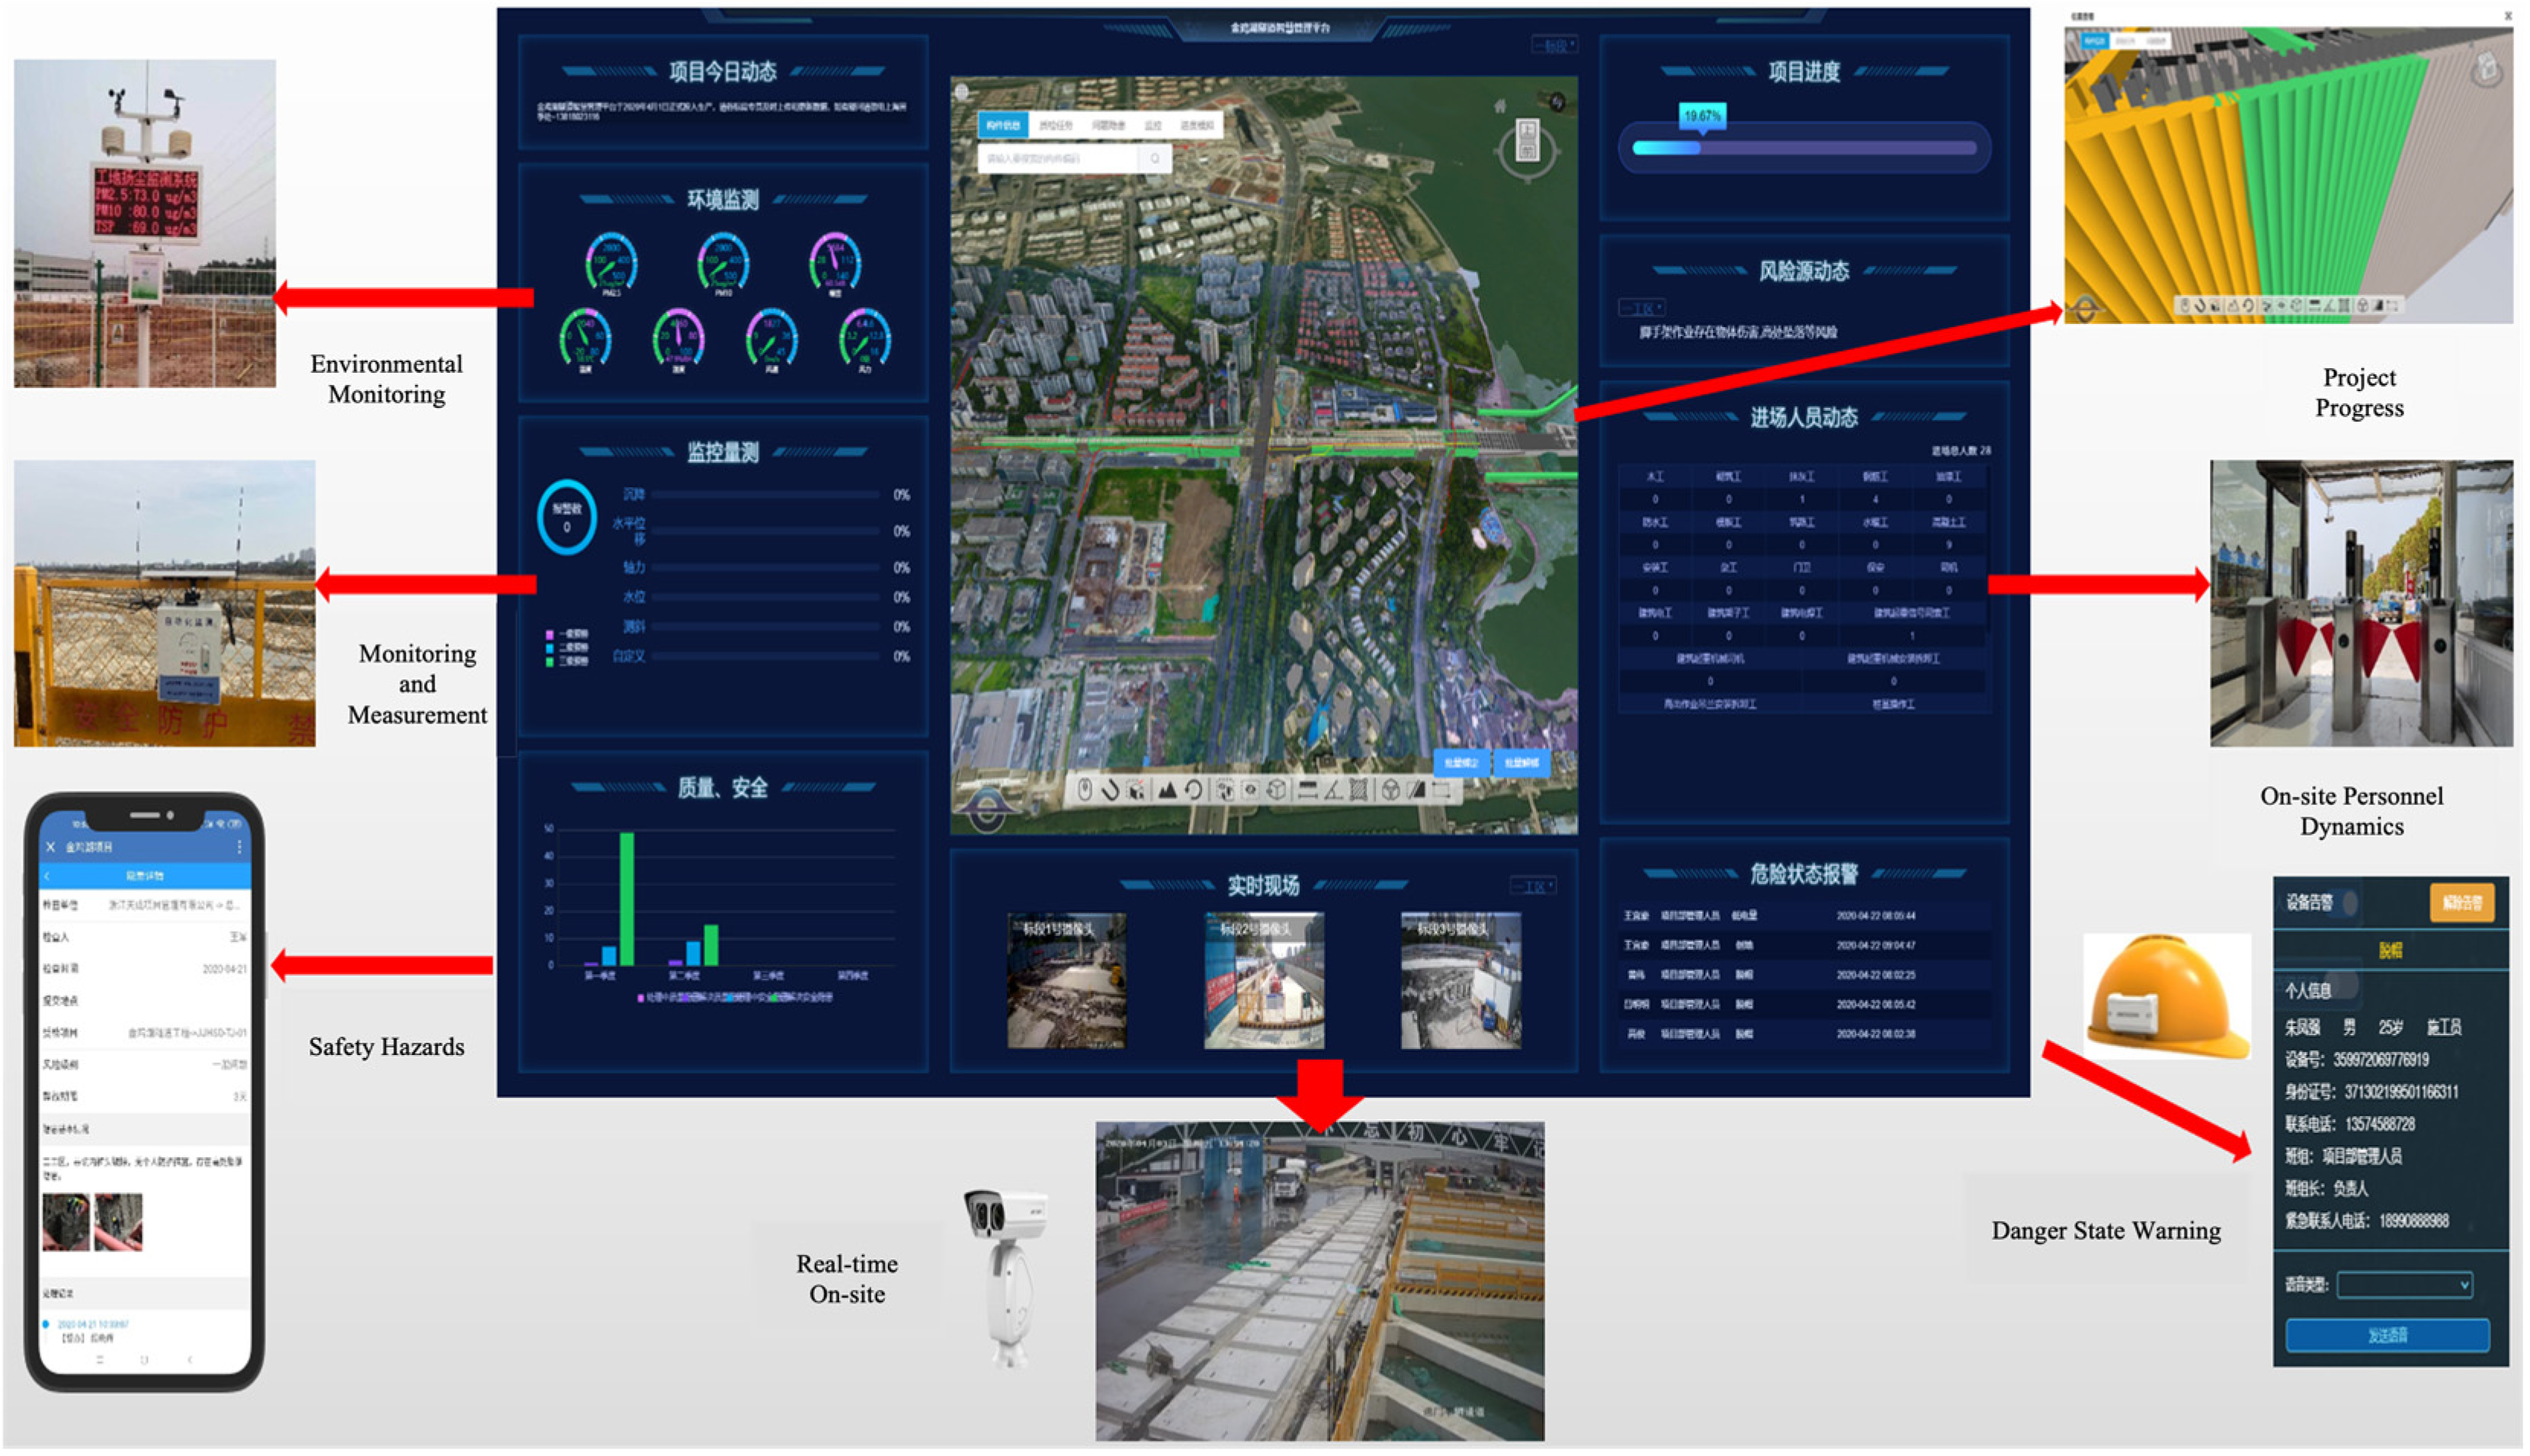
During the deep foundation pit construction, data acquisition was implemented through Internet of Things (IoT) technologies and manual inspections. The on-site layout is shown in Figure 13.

4.2.1. Experimental Data Collection

(1) Arrangement and Collection of Monitoring Points
Based on the design drawings and the actual conditions of the project section, safety monitoring was planned for the strata, pipelines, and buildings affected around the open-cut segment. Displacement monitoring was taken as the primary focus, supplemented by stress and strain measurements. These various monitoring data were cross-validated to ensure the reliability of the monitoring results.
The monitoring targets of the deep foundation pit project included the pit support system, the surrounding environment, and the construction conditions within the pit. For the support system, monitoring information encompassed horizontal displacement and inclinometer measurements of the diaphragm walls, stress in the concrete supports, axial forces in steel supports, and settlement of temporary columns. Monitoring of the surrounding environment included surface settlement of the soil adjacent to the supported pit, settlement of important underground utilities, and settlement of key buildings. Within the pit, monitoring primarily focused on water level variations.
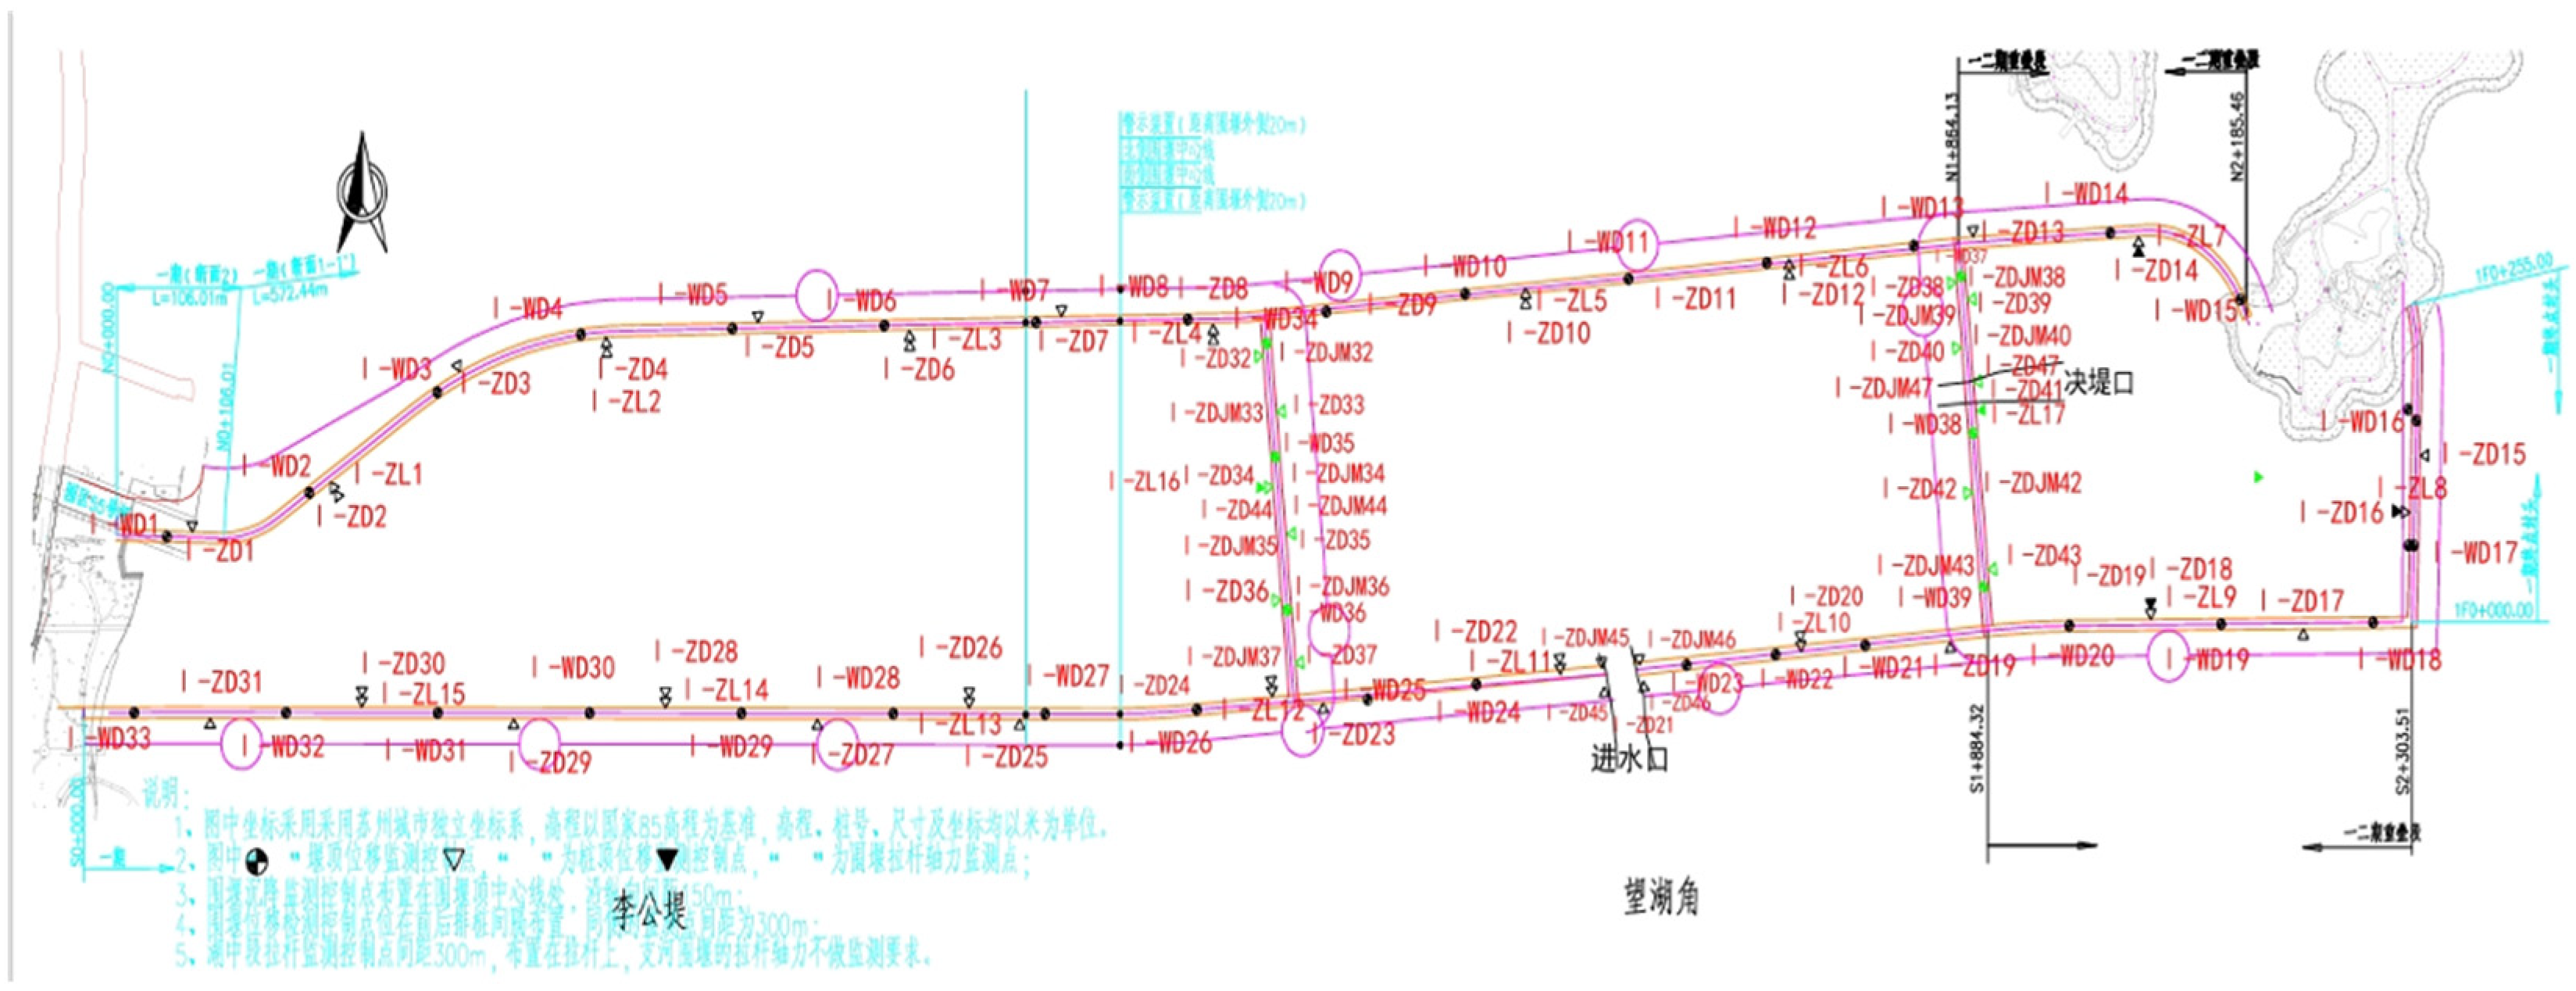
To ensure comprehensive information collection for all required monitoring targets, monitoring points were established at corresponding locations, and the necessary equipment was installed to acquire relevant data. The plan layout of monitoring points for Phase I of the cofferdam is shown in Figure 14. The monitoring frequency of all deformation, groundwater, and support force instruments was one measurement per day. The monitoring period lasted approximately 18 months.
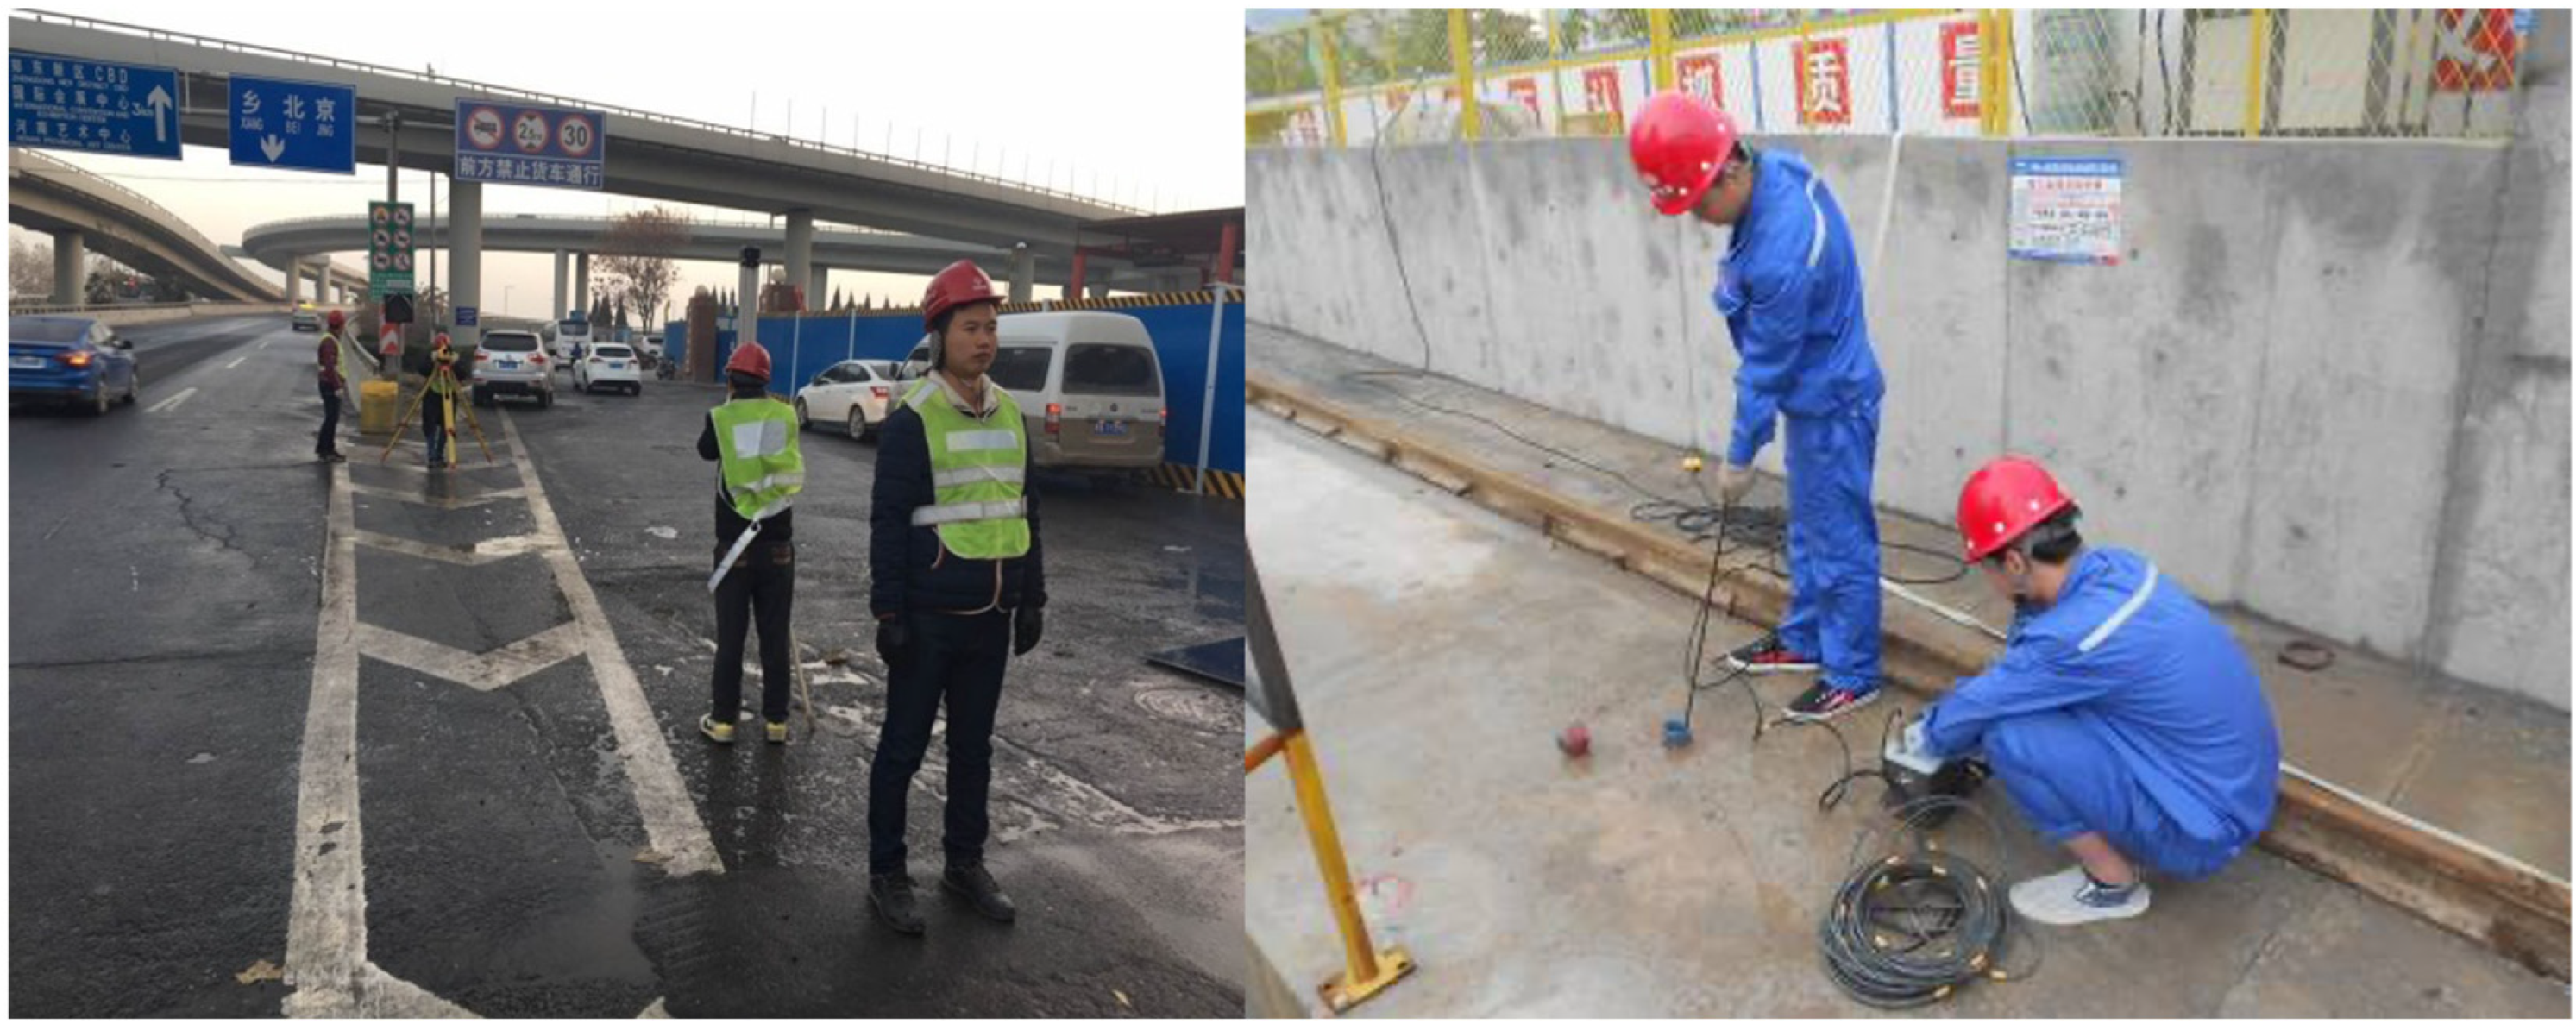
Depending on the specific monitoring targets, appropriate instruments and sensing elements were selected for data collection. Therefore, the first step in acquiring the corresponding monitoring data was to install the relevant sensors or equipment at the designated locations according to the monitoring point layout. The installation of the monitoring instruments and devices is illustrated in Figure 15. After the installation of the monitoring instruments and equipment, as the deep foundation pit construction progressed, professional monitoring personnel conducted daily data acquisition using the relevant specialized instruments, as shown in Figure 16.
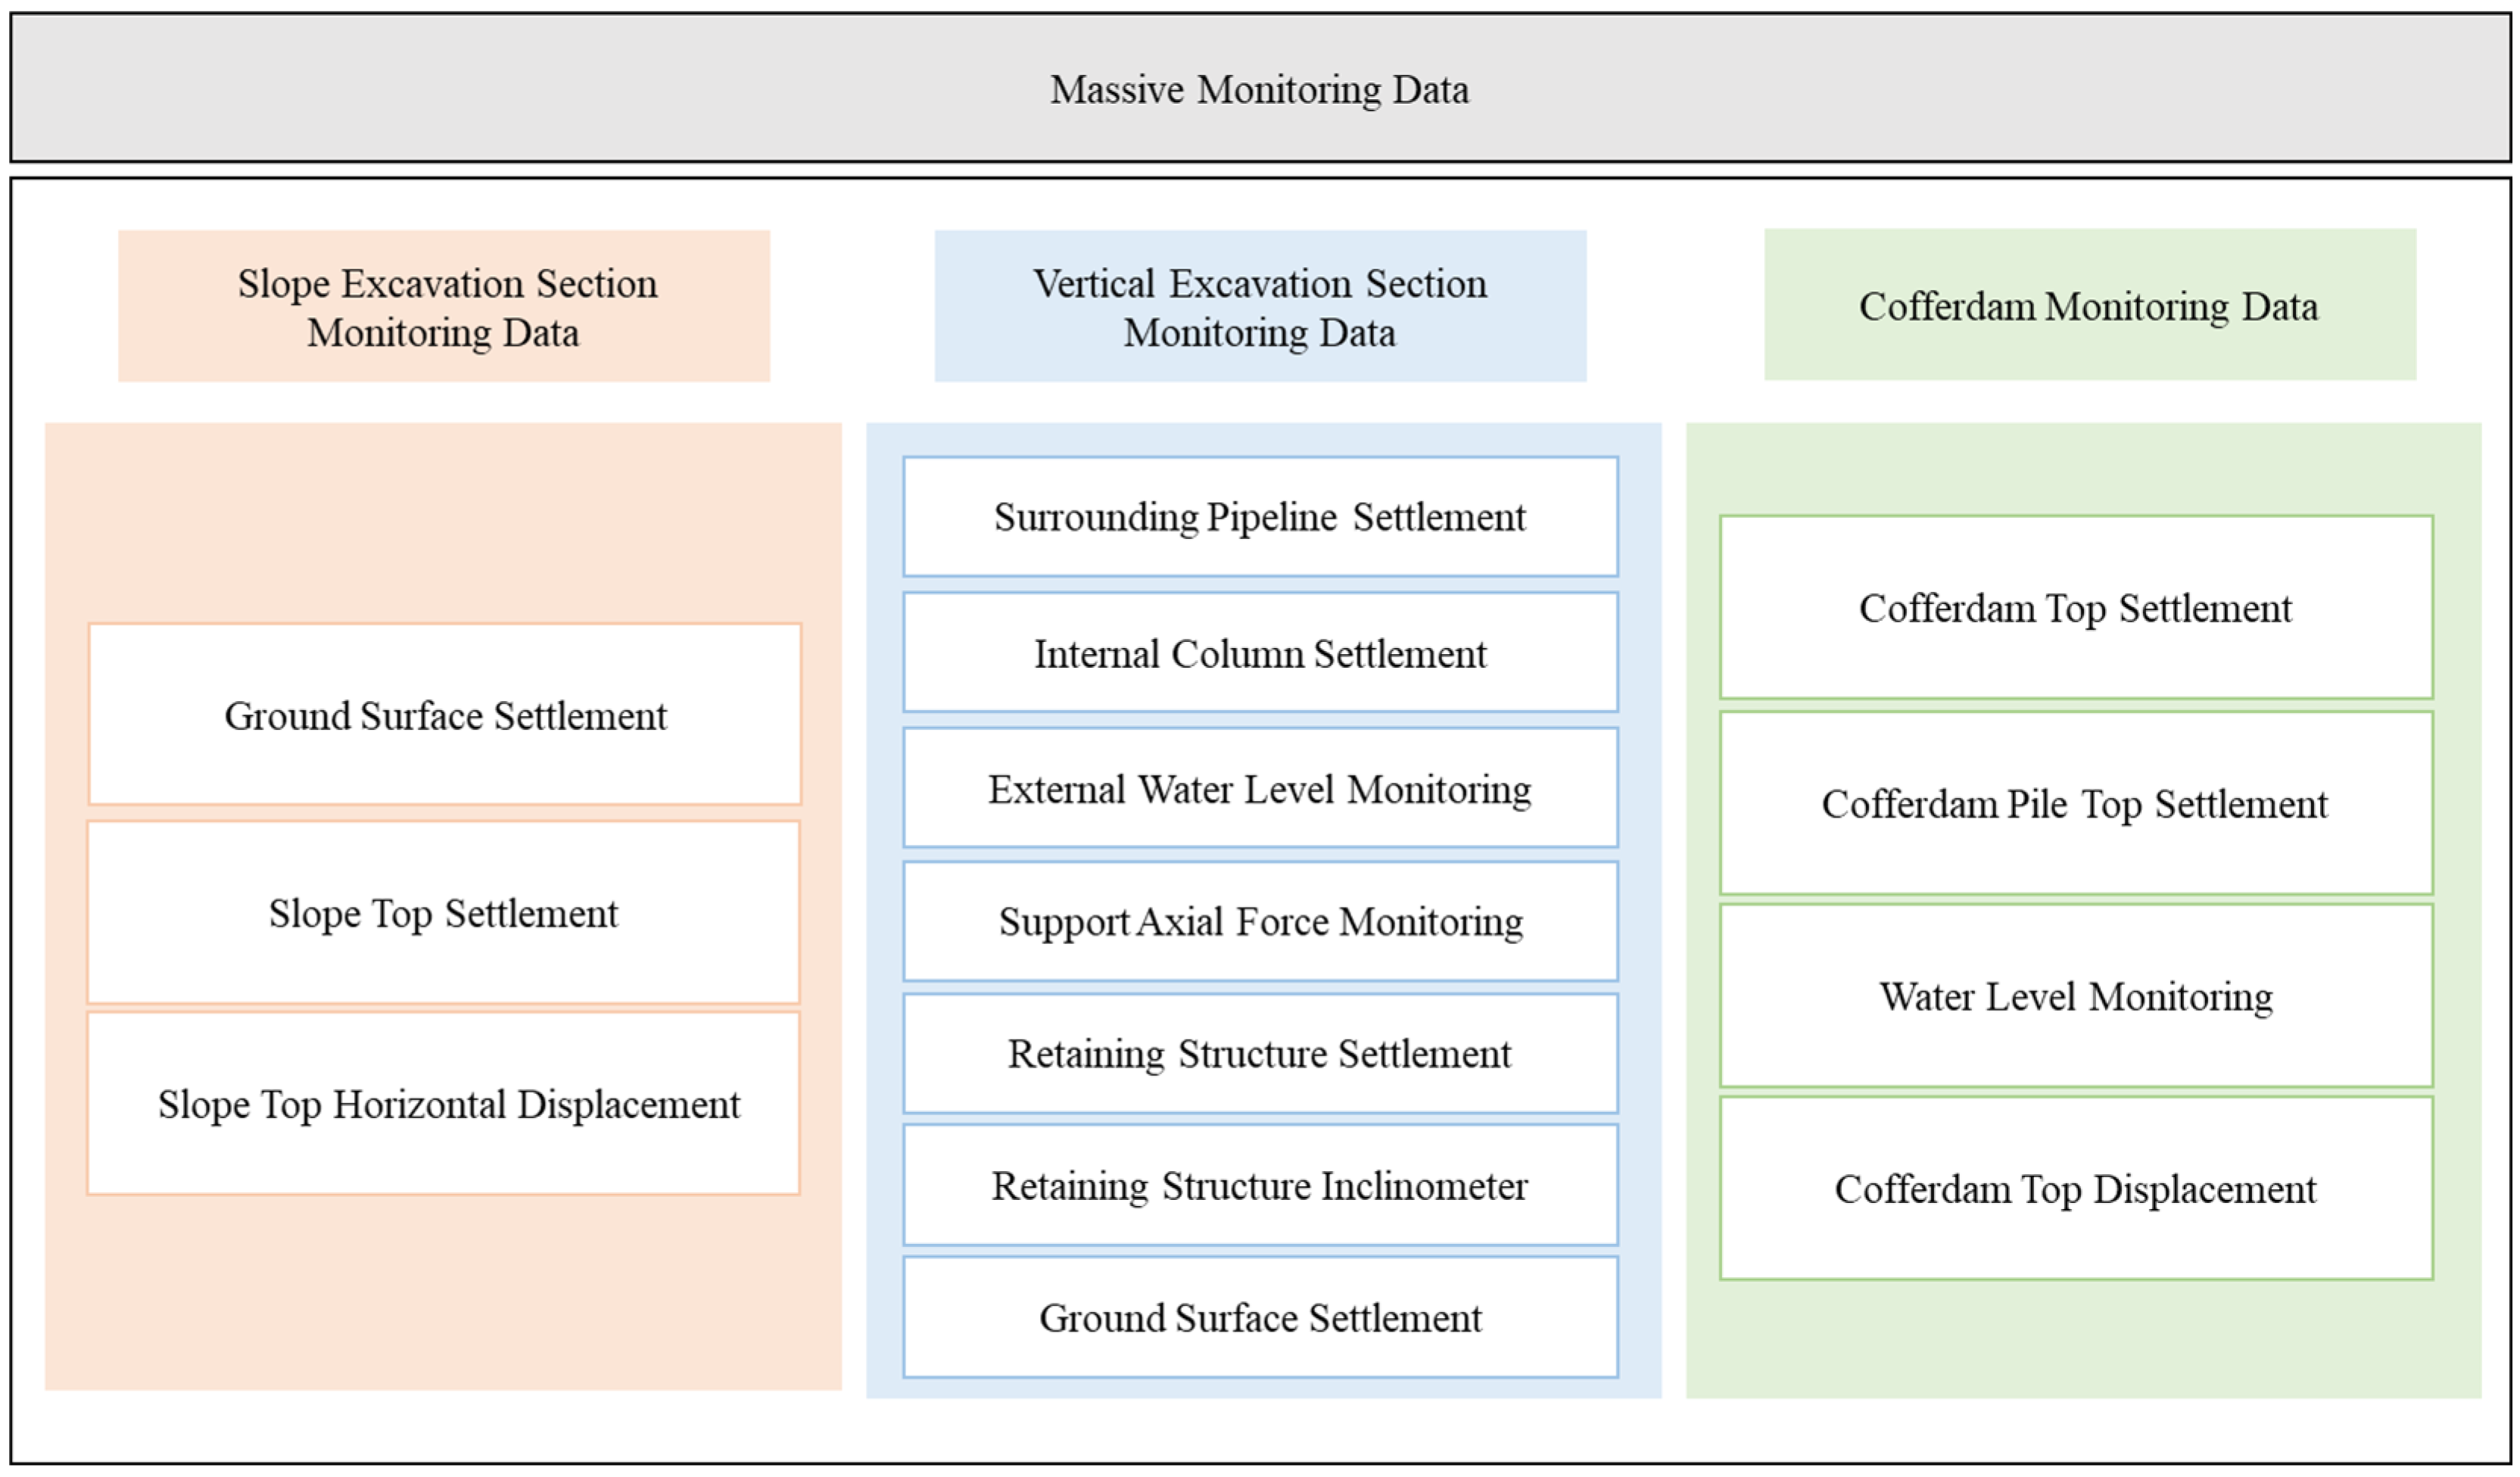
The monitoring projects for the open-cut section are diversified, with different monitoring projects having different monitoring scope definitions. Table 4 clearly shows the detailed information of various monitoring projects, and Figure 17 further elaborates on the monitoring data content in detail. Some examples of early warning and pre-control data are shown in Table 5, Table 6 and Table 7.
(2) Safety Inspection Data Acquisition
Based on the established quantitative scoring table for safety inspections, on-site inspections were conducted item by item. The inspection targets included unsafe trends observed across different spatial locations, specifically whether there were any precursory warning signs and the severity of such signs.
For this project, safety inspections were required for the open-cut main pit, structures, surrounding roads, ground surface, and heavy or pressurized pipelines within the construction impact area (including sewage, stormwater, water supply, and natural gas pipelines). Due to the fine temporal granularity of these inspections, the collected data serves as external input for the early-warning model.
Regarding the information sources related to the spatial locations of the deep foundation pit and warning signals of potential collapses, on-site information can be categorized into two main types: quantitative monitoring data collected via monitoring instruments, and qualitative observational information gathered through the sensory assessment of inspection personnel. Since quantitative monitoring data for deep foundation pit construction can be collected daily by monitoring units, the acquisition process is not elaborated here. On the other hand, safety inspection information belongs to qualitative data and must be converted into quantitative form before it can be integrated with other information for comprehensive data fusion.

4.2.2. Collected Data Processing

The data input for the safety risk early-warning model is organized as a three-dimensional matrix, with the third dimension representing time. Therefore, it is necessary to map the multidimensional spatial data from deep foundation pit construction into a one-dimensional spatial representation, as illustrated in Figure 18. This mapping is achieved according to the strength of spatial correlations among the influencing factors.
In this section, a database is constructed based on the collected data. The spatial dataset contains a total of 6524 samples, formatted as (X, Y), where X represents the state data, and Y denotes the predicted target data. In this study, foundation pit risk factors are used as state feature variables, and the foundation pit warning levels serve as the prediction targets. Since the number of available feature factors is limited and they are largely independent of one another, no feature selection processing is performed. Prior to model training, data preprocessing is required:
(1) Min–Max Normalization of Input Data: The data are mapped into the range [0, 1] to reduce the influence of different data representations on the model results.
(2) Data Clustering and Shuffling: After clustering the dataset, the order of clusters is shuffled to prevent excessively regular patterns that could lead to overfitting or non-convergence.
The construction of the deep foundation pit safety risk prediction model primarily involves two stages: training and testing. First, the data processed in Section 4.2.1 are used as sample data. Partial early warning data for some cofferdams and foundation pits are simulated based on a combination of support vector machine water level prediction models for rainfall or pump-failure conditions [43], support structure deformation models [44], PLAXIS software (version: 24.1.1060) for simulation of wall deformation, soil settlement, and uplift [45], and expert rule-based synthesis reflecting support failure and pit-bottom instability. The total sample size is summarized in Table 1 and Table 2. From the processed samples, the training set and validation set are partitioned. Given the relatively large dataset used in this study, a higher proportion is allocated to the training set, with an 8:1 ratio between training and testing data. Specifically, eight out of nine groups of data are used for training, while one group serves as the test set. The data composition is detailed in Table 8 and Table 9, and partial sample data are presented as shown in Table 10.

4.3. Basic Methods and Evaluation Indicators

To validate the accuracy and near-real-time performance of the early-warning model, three representative prediction algorithms are selected in this section.
(1) T-S Fuzzy Neural Network
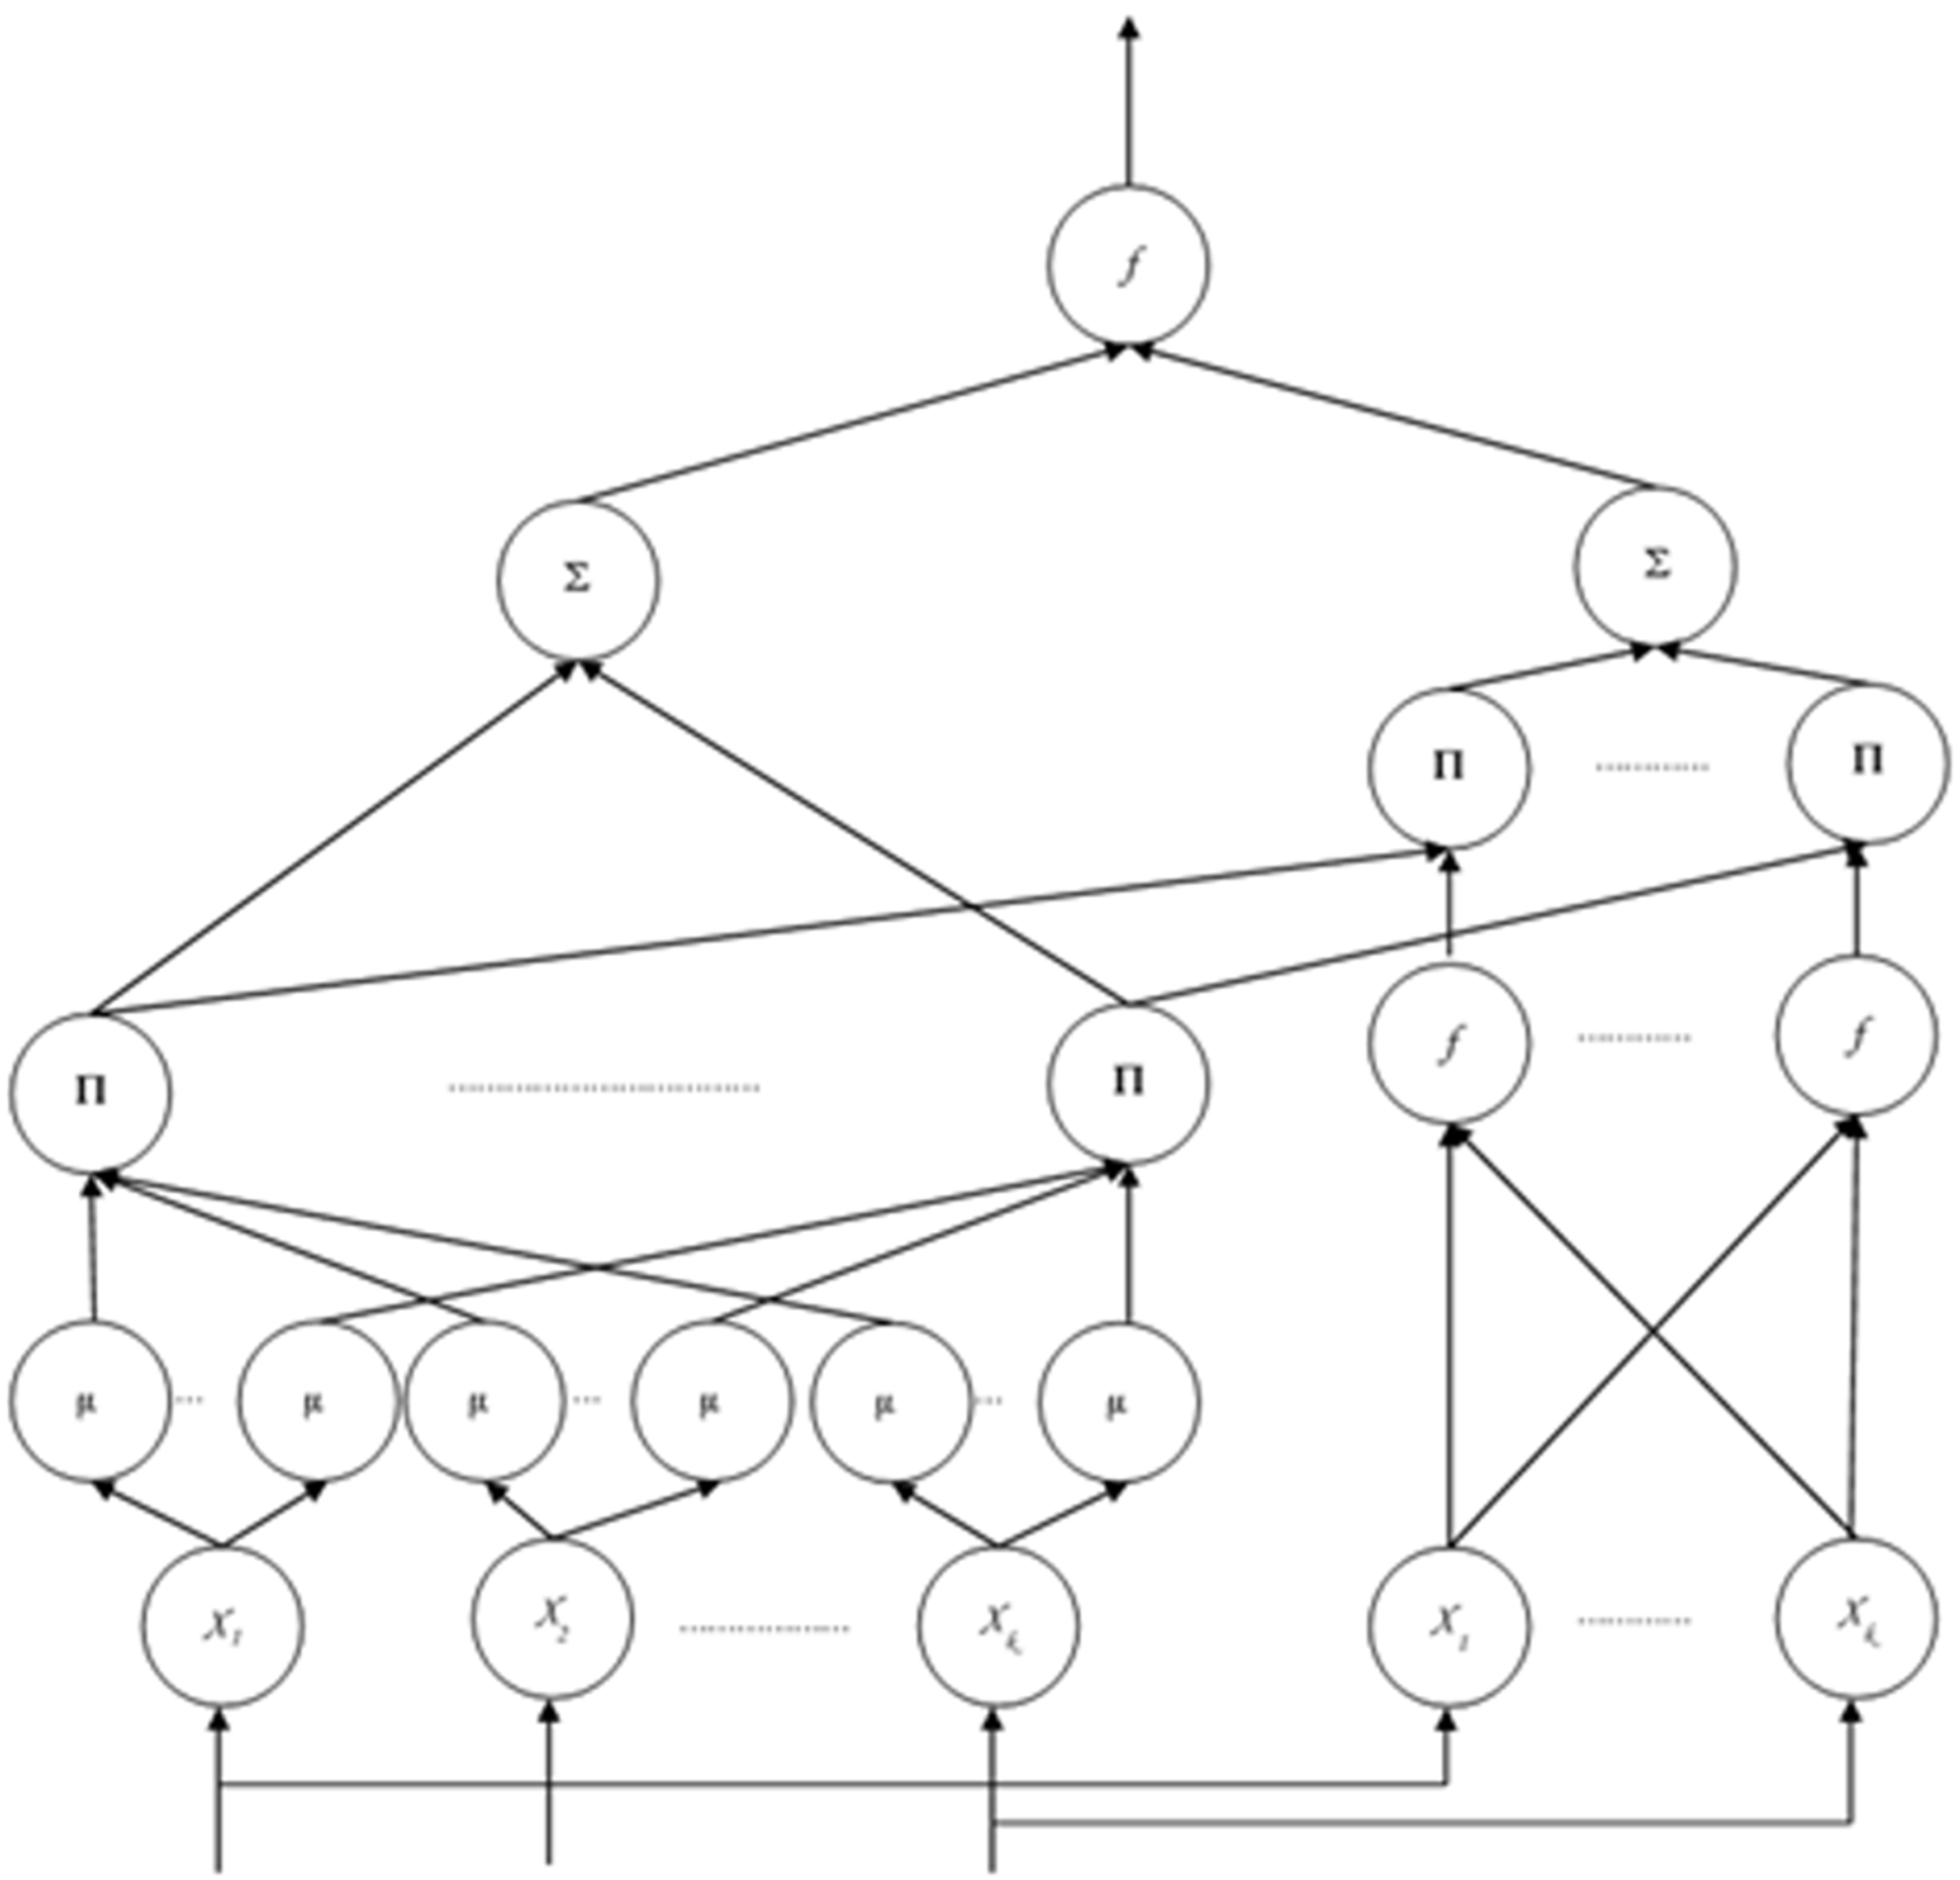
Structurally, the T-S fuzzy neural network can be divided into the antecedent network and the consequent network [46]. The consequent network consists of the following: an A layer with k input nodes, a B layer with k nodes, a C layer with k nodes, and a D layer with a single output node. The antecedent network also has four layers: an A layer with k input nodes, a B layer with k × m nodes, a C layer with k nodes, a D layer with a single output node, and an E layer as the network output node. The detailed T-S fuzzy neural network structure is illustrated in Figure 19. There are five per input membership functions, and the Gaussian membership width is optimized via grid search; the rule base size is 25.
(2) EWT-NARX Model
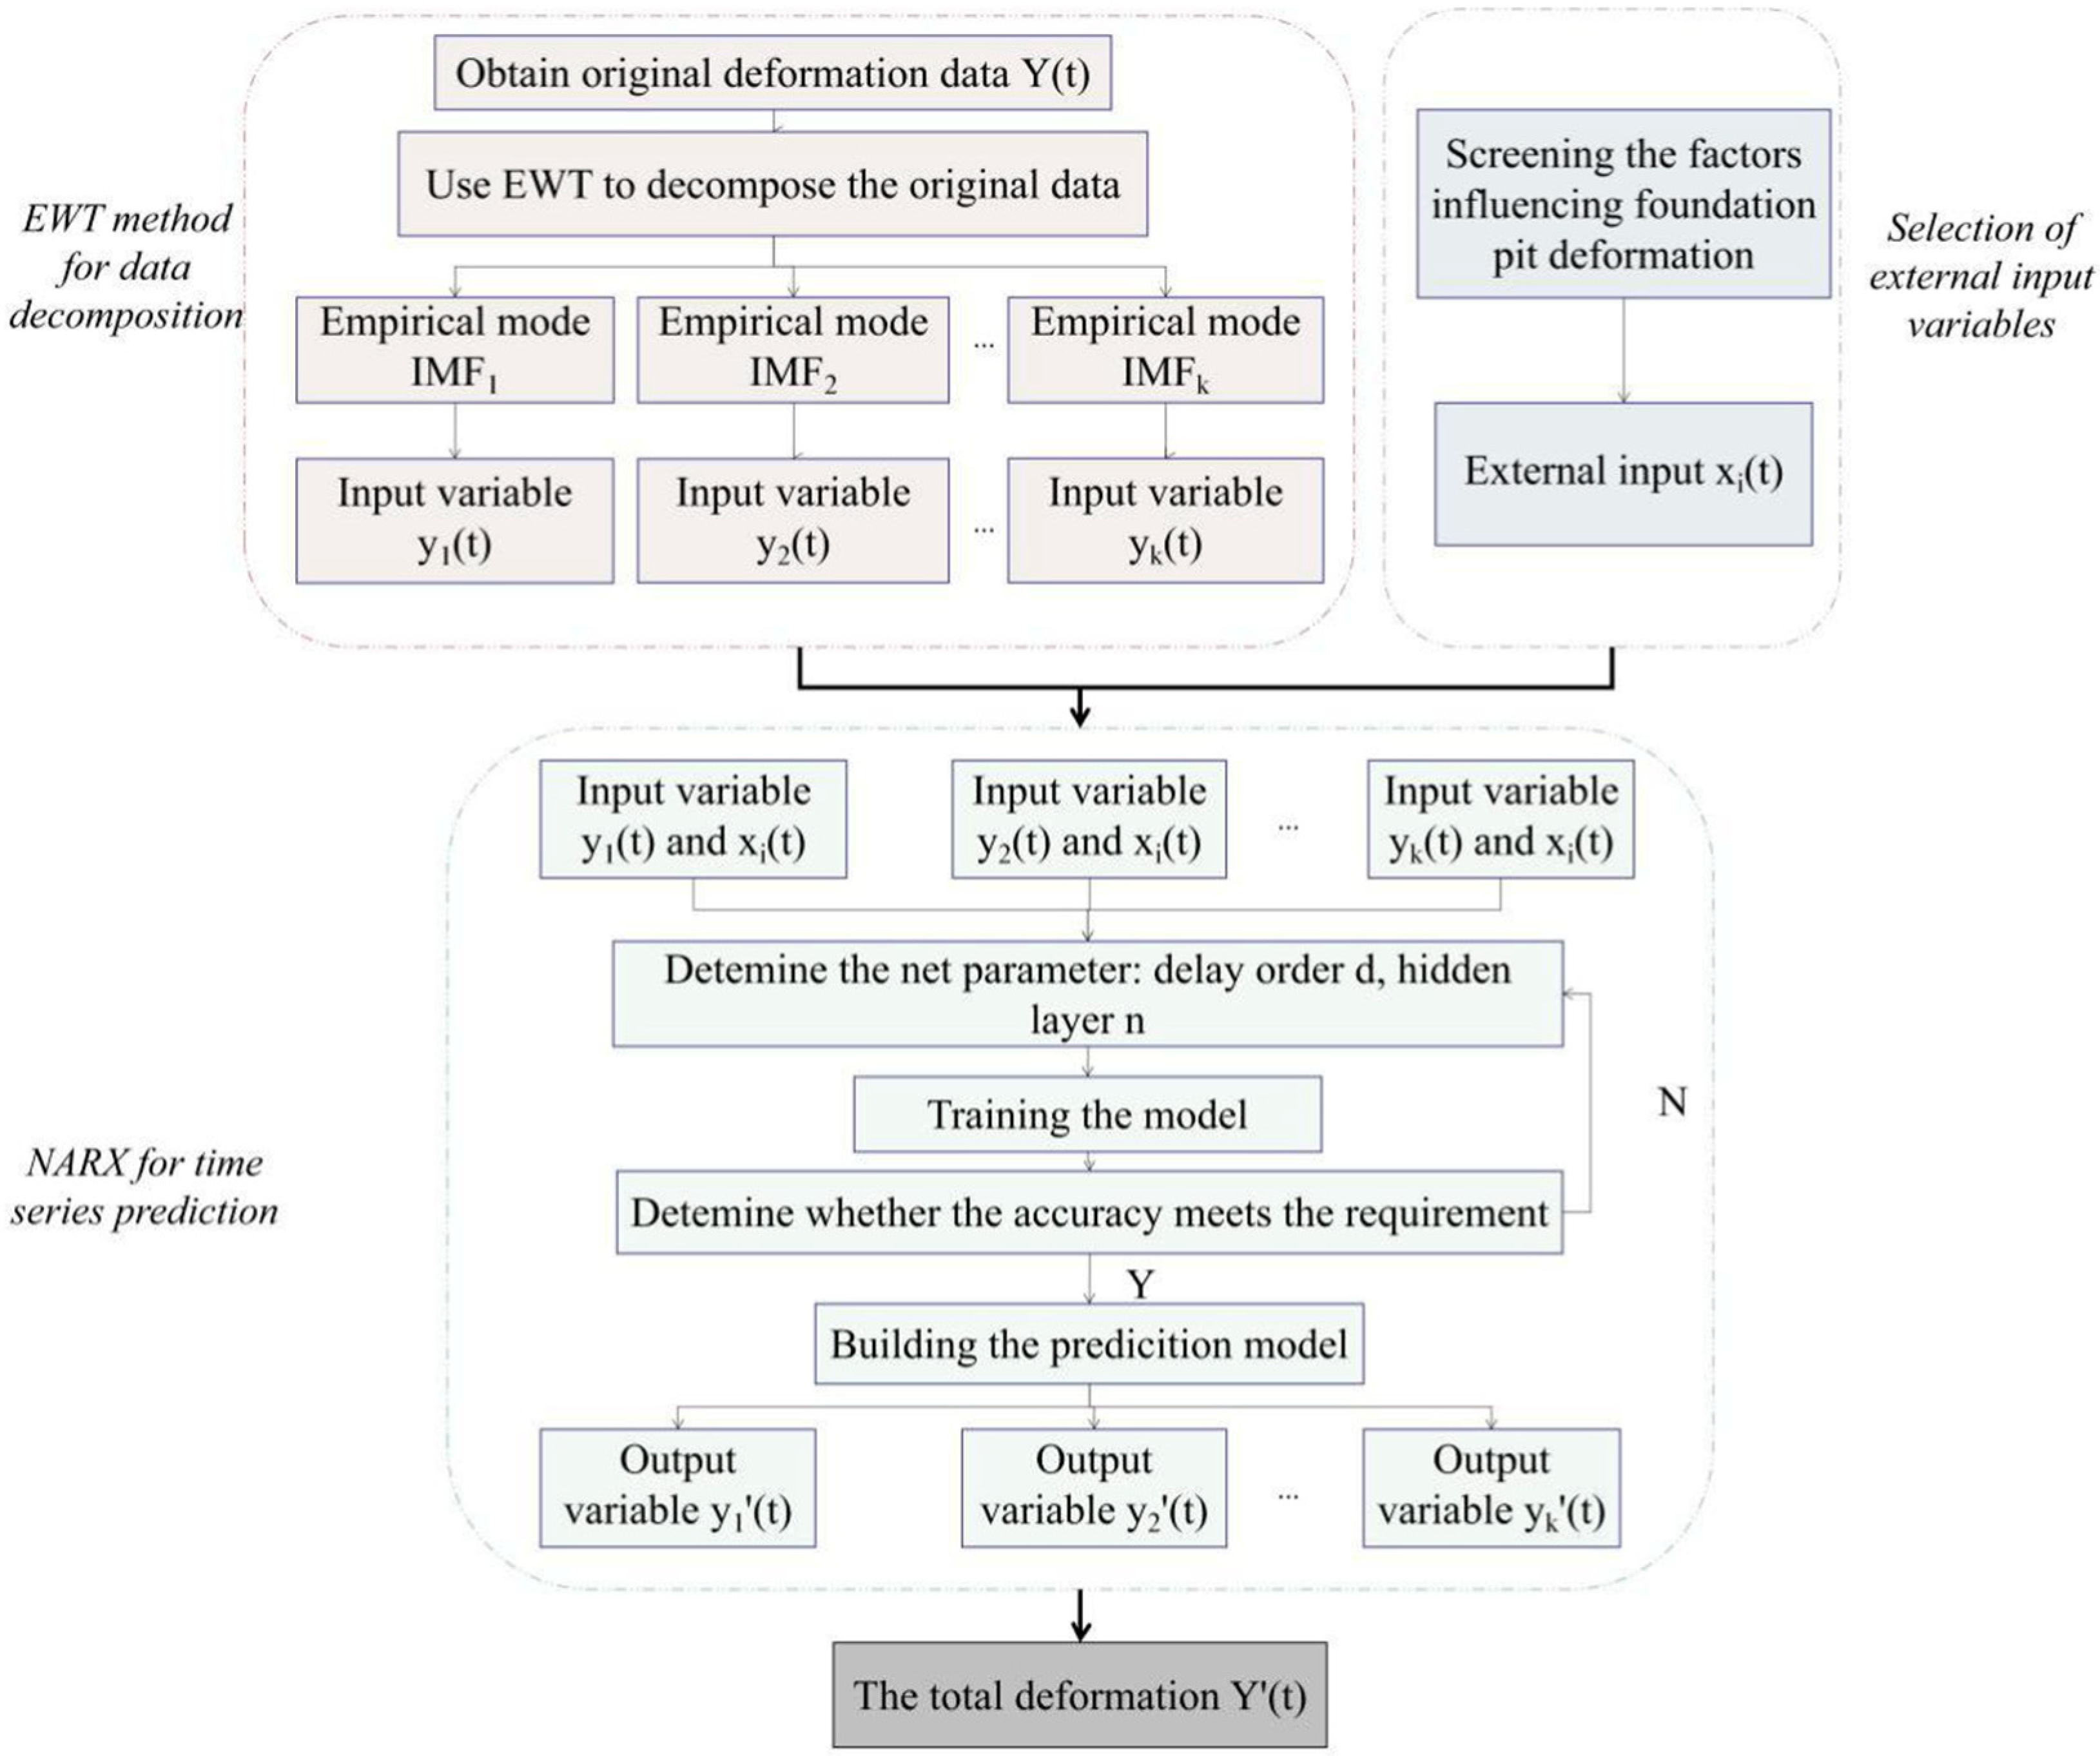
Qingwen, Ma. et al. [47] proposed a nonlinear autoregressive exogenous prediction method based on empirical wavelet transform preprocessing (EWT-NARX, empirical wavelet transform, and nonlinear autoregressive exogenous prediction method).
First, the empirical wavelet transform (EWT) is applied to the measured deformation data for adaptive decomposition, extracting modal signal components with distinct features. Next, the main structural elements influencing the foundation pit deformation are analyzed and incorporated as part of the exogenous inputs. Then, a heterogeneous-component NARX prediction model is established. Finally, all predicted values are superimposed to obtain the total predicted response (Figure 20). The EWT decomposition level is 6, the NARX structure contains 4 input delays and 2 output delays, and the number of hidden neurons is 20.
(3) RF Prediction Model
Ying, Z. et al. [48] developed an intelligent risk prediction model for station deep foundation pits based on Random Forest (RF). In the RF model, different types of monitoring data and risk-level information are incorporated to train the model and estimate the unknown relationships between monitoring variables and foundation pit safety risks.
All three types of algorithms can be transferred to the application scenario of safety early warning for the Jinji Lake project addressed in this study. Moreover, they are relatively like the method proposed in this paper and can be implemented with relative simplicity.
To estimate the accuracy of deep foundation pit safety early warning, this study adopts Root Mean Square Error (RMSE), Mean Absolute Error (MAE), and sample standard deviation (STD.S). The calculation formulas are as follows:
R M S E   =   i = 1 m y i     y i ^ 2 m
M A E   =   i = 1 m | y i     y i ^ | m
S T D . S i   =   j = 1 n x j     y i ^ 2 n     1
where yi represents the predicted warning value at the i-th moment, y i ^ represents the actual warning value at the i-th moment, m denotes the total number of warning cells, S T D . S i represents the sample standard deviation at the i-th moment, and n indicates the number of experiments conducted. The number of trees is 300, the maximum depth is 12, and the minimum sample split is 4.
The software and hardware systems used for development are listed in Table 11. These systems are employed to verify the impact of multi-type data on tunnel safety prediction and to validate the proposed model.
Mainstream deep learning frameworks, including TensorFlow (version: 2.16.1), Keras (version: 2.15.0), and PyTorch (version: 2.4.1), have become increasingly mature, offering a wide range of functionalities that simplify the development and training of deep learning models. In addition to these, researchers have access to other practical toolsets. One notable example is Google Colaboratory, a platform based on Python’s Jupyter Notebook (version: 6.5.2), which provides free access to Tesla K80 GPUs. For researchers whose local machines lack GPU resources, this eliminates the need to rent GPU time from cloud services such as Amazon AWS, at least for smaller-scale experimental tasks or prototype development. This capability significantly broadens the scope for deep learning research beyond basic datasets such as MNIST. More recently, Google has also made Tensor Processing Units (TPUs) freely available within Colaboratory, further enhancing computational efficiency. The ability to access GPUs and TPUs at no cost represents a key advantage of this platform.
Similarly, IBM Watson® Studio (version: 9.1.0) offers data scientists, developers, and analysts the ability to build, deploy, and manage AI models seamlessly on IBM Cloud Pak® (version: 4.8) for Data while optimizing decision-making processes. Leveraging an open multi-cloud architecture, Watson Studio supports collaboration across teams, automates the AI lifecycle, and accelerates the realization of research and practical applications.

4.4. Prediction Process

During the experimental process, this paper adopts 10-fold cross-validation to test algorithm accuracy. The dataset is divided into ten parts, with nine parts alternately used as training data and one part as test data for experiments. Each experiment yields a corresponding accuracy rate. The average accuracy rate of the 10 results serves as an estimate of the algorithm’s precision. This method is a commonly used approach for dataset augmentation in deep learning experiments. We confirm that 10-fold cross-validation was applied, and SMOTE/Tomek operations were restricted to training folds to prevent data leakage. Random splitting was used because samples were drawn from multiple spatial segments rather than a single chronological series.
(1) Learning Matrix
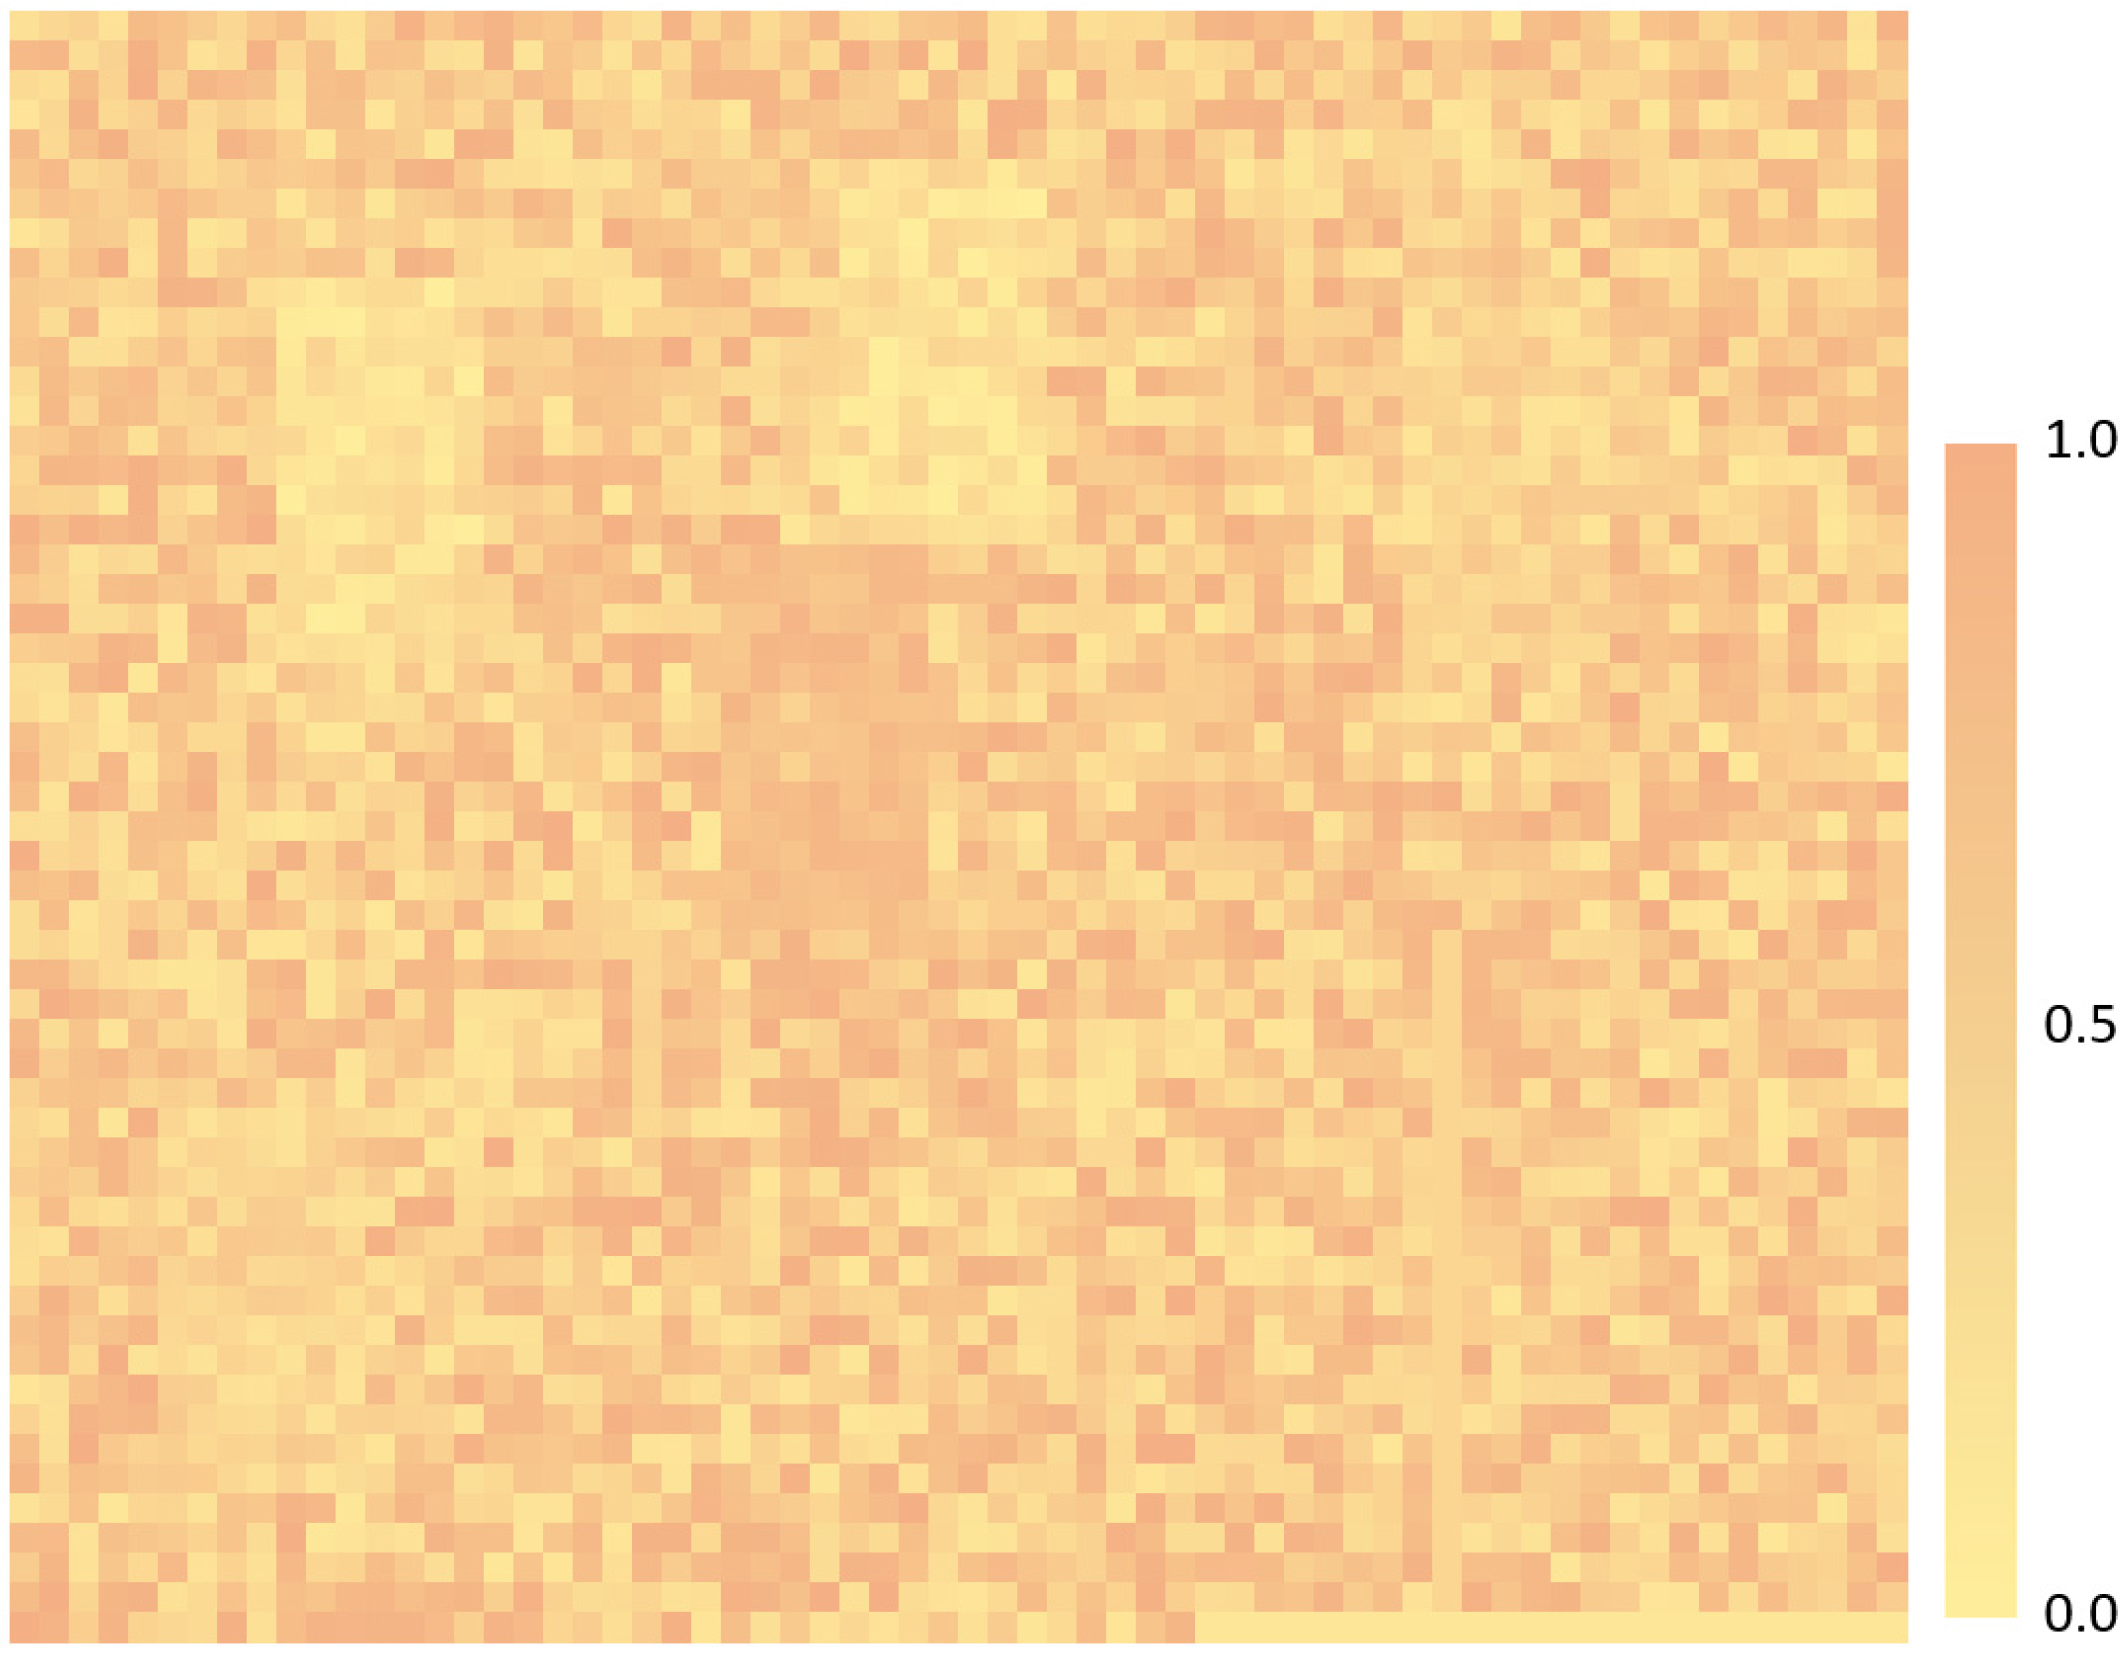
The influence range of foundation pit excavation is generally specified in design documents as 1.5 to 2.0 times the excavation depth. Since the maximum depth of the deep foundation pit is 5 m, the unit influence grid is set to 10 m × 10 m. According to the matrix configuration method, the dimensions of the two-dimensional matrix are 55 × 64. The heatmap of the learning matrix showing correlations between influencing factors is shown in the figure (where yellow striped areas represent missing data). From Figure 21, it can be observed that the correlations of influencing features exhibit clustering characteristics, providing data support for the accuracy of deep learning results. We used a sliding window of 64 days and stride 1. Across all segments, this configuration resulted in 6524 samples. The adoption of a 10 m × 10 m influence grid corresponds to roughly 1.5–2 times the excavation depth and standardizes the spatial scale of different measurement categories. The resulting input is therefore a 55 × 64 matrix representing the state evolution of the excavation within this influence region.
To clarify the complete architecture, we adopt true 3D convolutions to jointly extract spatial–temporal features in the 55 × 64 slice. The first convolution layer uses a 3 × 3 × 3 kernel with stride 1 and padding 1, generating 32 feature maps while maintaining spatial dimensions. Three ResUnit blocks follow, each containing two 3 × 3 × 3 convolution layers with identity skip connections. No pooling is used so that spatial resolution is preserved to match input–output dimensionality. The output of the ResUnit module is reshaped and fed into a single-layer LSTM with hidden size 128 to model long-range temporal dependencies beyond the sliding window. Finally, a fully connected output head generates a vector that is reshaped back to 55 × 64, maintaining structural consistency with the input.
(2) Time and Accuracy
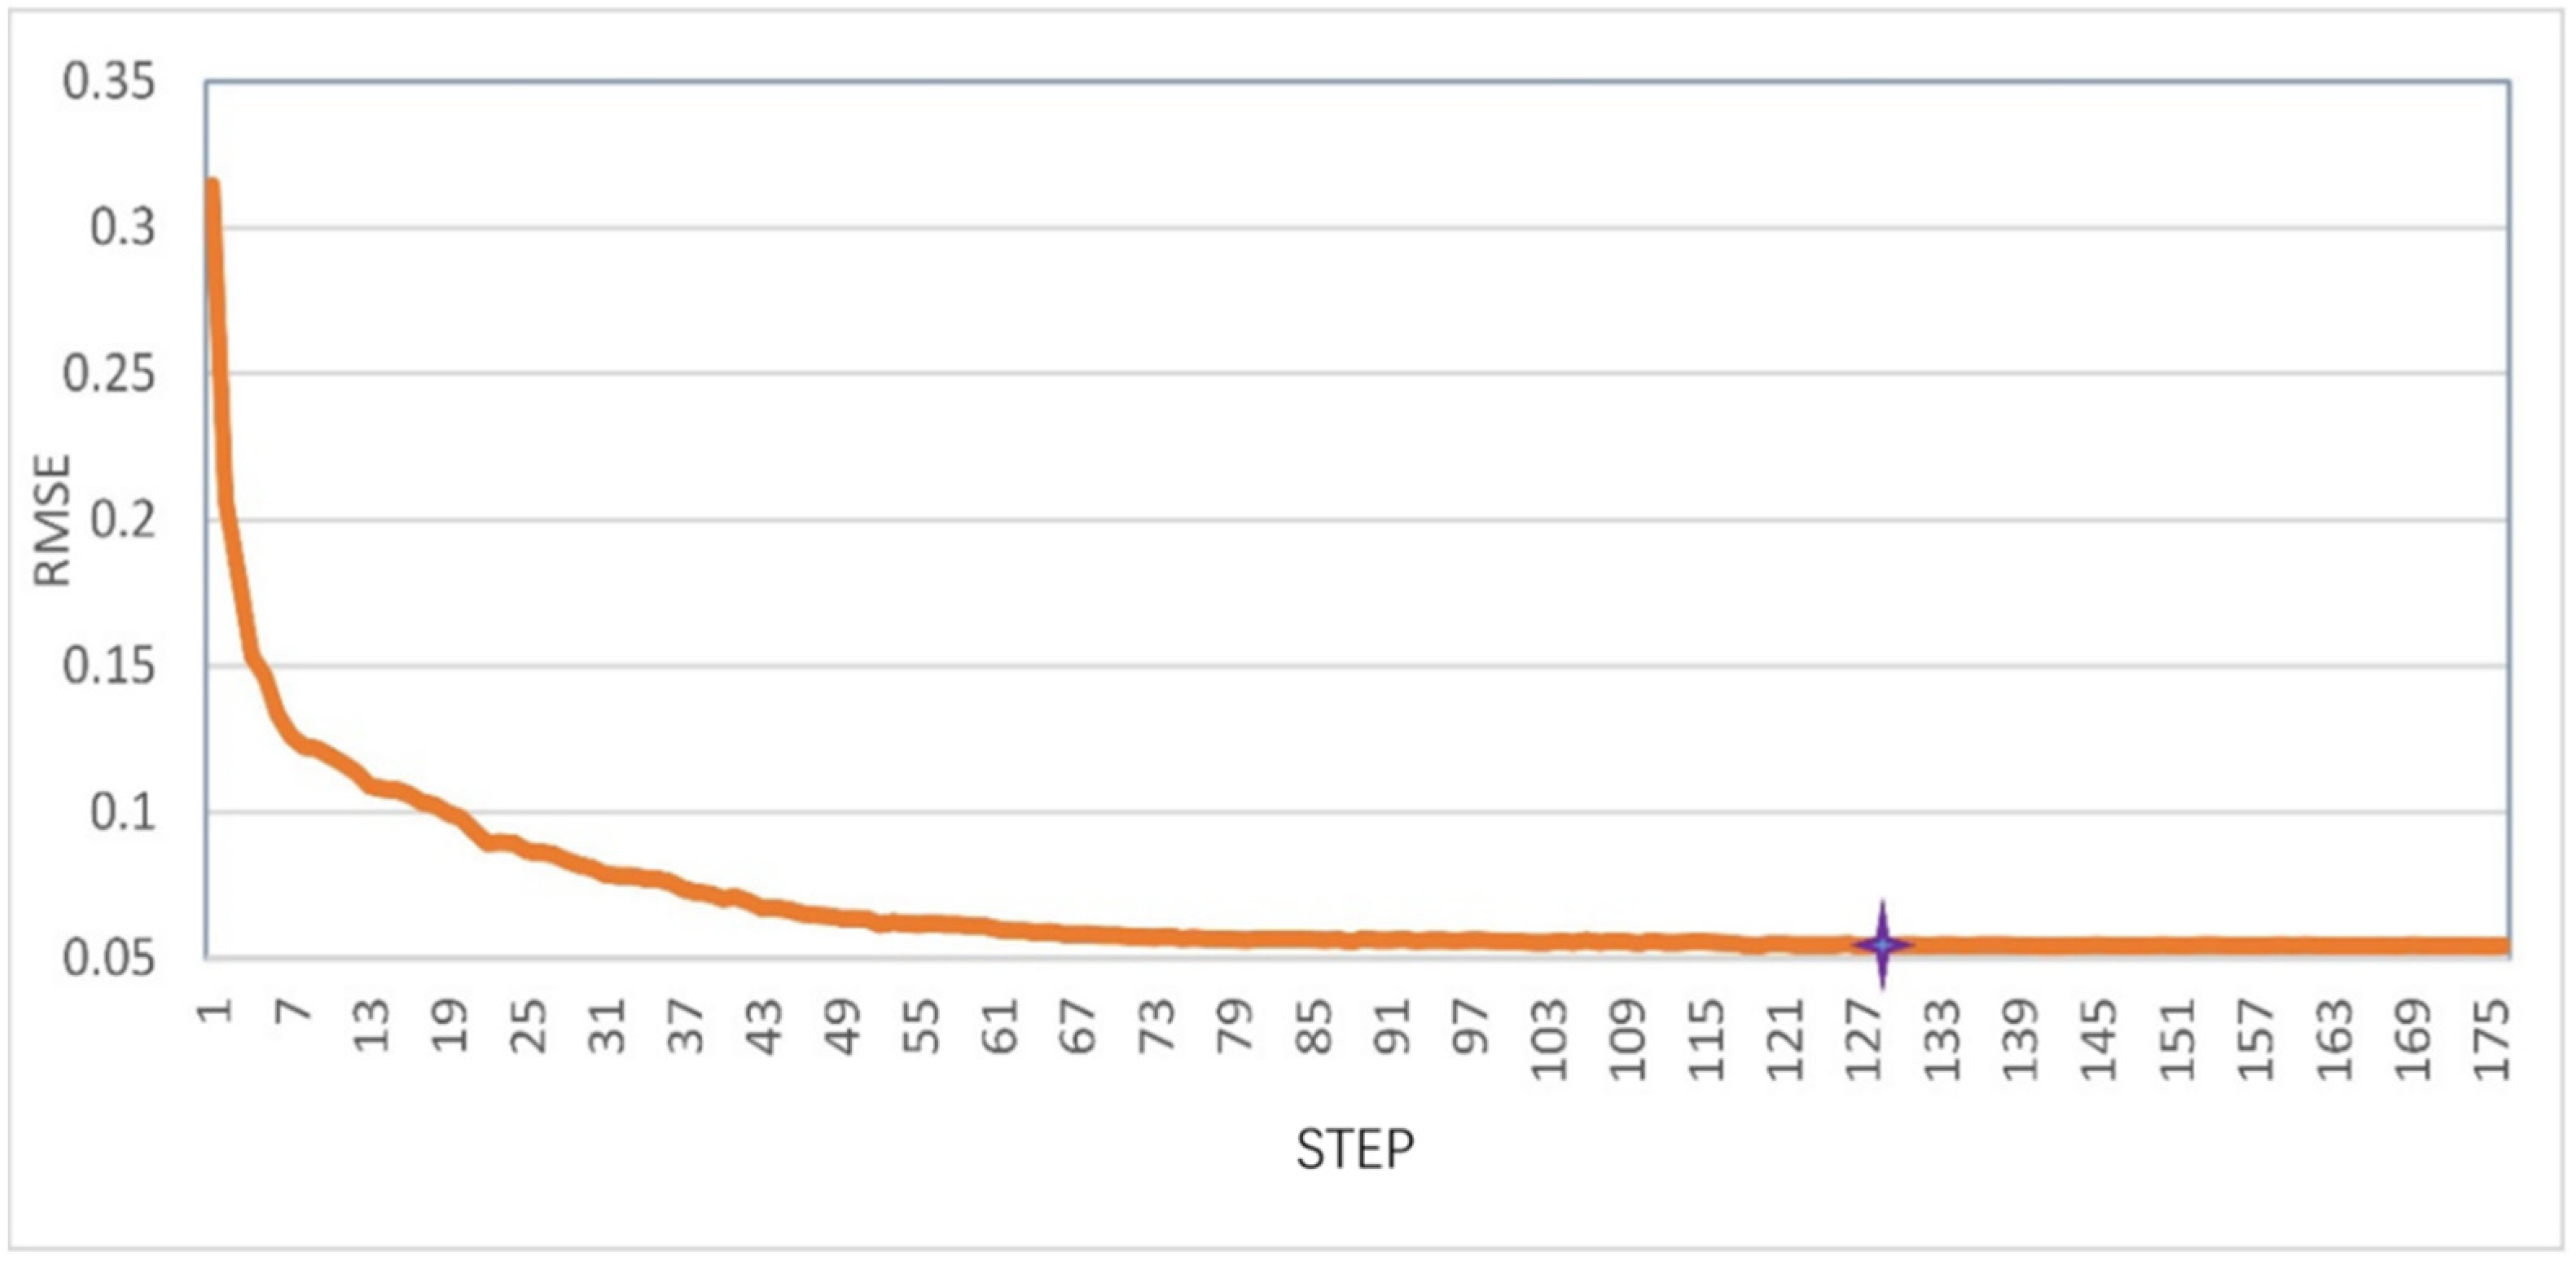
Taking the D11 dataset as an example, as the learning process continues to deepen, the learning process enters a stable state when step = 130, with RMSE = 0.05464. Moreover, for different datasets, this algorithm has relatively small initial RMSE values, and after entering the stable state, both Sep and RMSE are minimal (Figure 22).
Experiments were conducted based on six datasets separately, and the statistical results of average learning time and prediction time are shown in Table 12. When conducting cofferdam deformation prediction (D11), the learning time was 378.37 s, and the prediction time was 31.28 s. For foundation pit deformation (D12), the learning time was 429.23 s, and the prediction time was 33.02 s. Compared to the datasets corresponding to sub-accidents (D21–D25, average learning time: 469.83 s; average prediction time: 35.63 s), it demonstrates better time advantages. The standard deviations for predicting cofferdam and foundation pit deformation are both 0.01, while the average accuracy for predicting datasets corresponding to sub-accidents is 0.024. Therefore, accident-based prediction involves more influencing factors and a more representative sample selection, resulting in high accuracy and time efficiency for construction safety early warning.

4.5. Verification Results

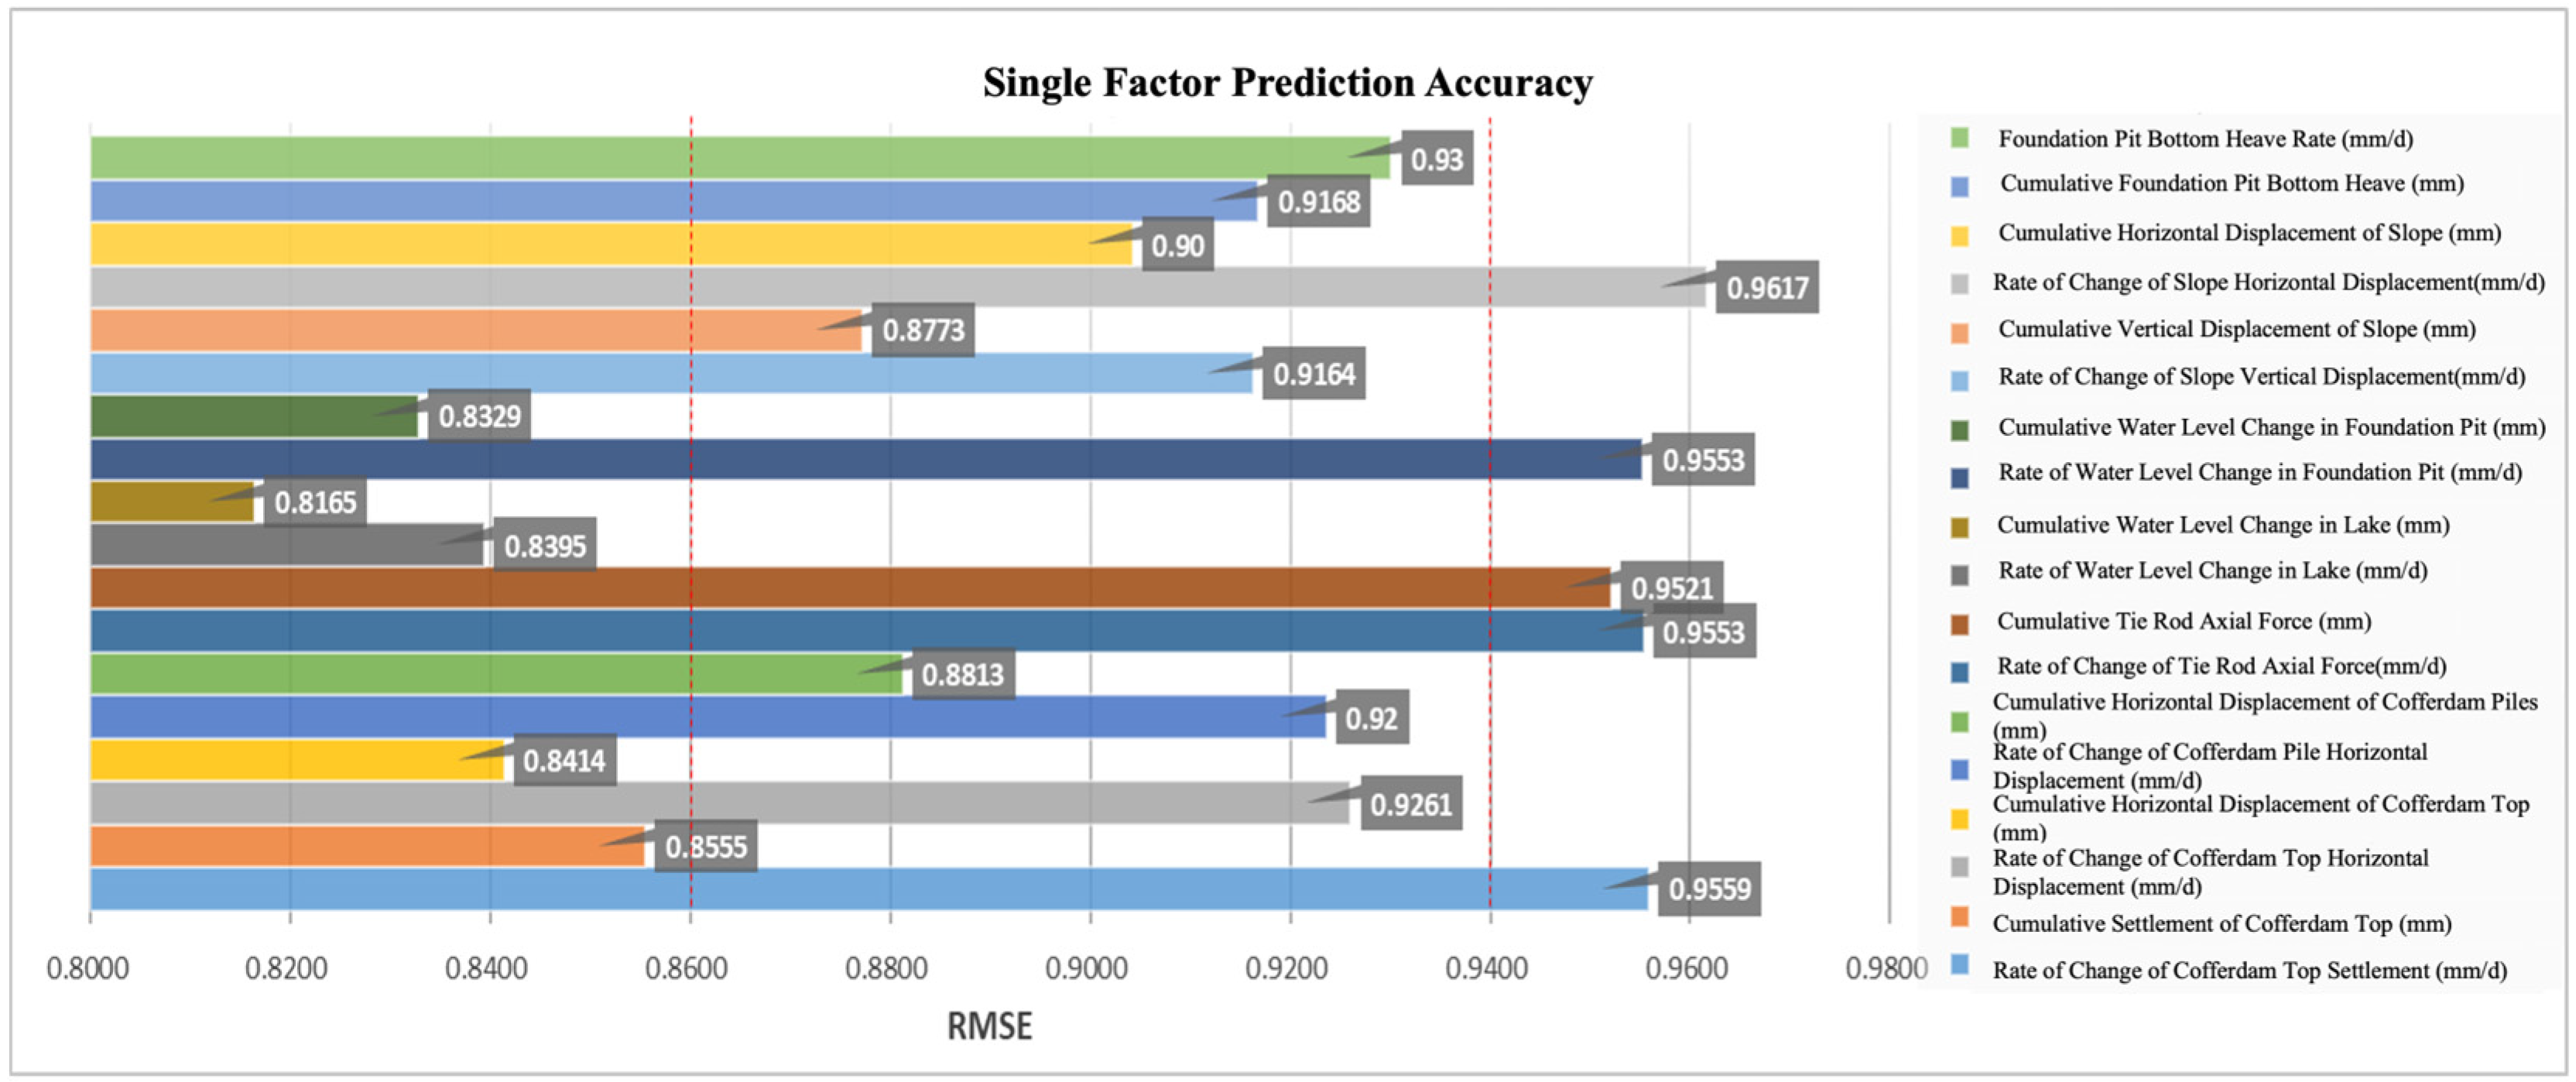
The purpose of single-factor prediction is to provide information for early warning source identification. Figure 23 shows single-factor prediction accuracy. From the figure, it can be seen that for factors that have greater impact on cofferdam and foundation pit risks, such as cumulative lake water level changes, cumulative water level changes inside the foundation pit, cumulative water level changes inside the foundation pit, cumulative horizontal displacement at cofferdam top, and cumulative settlement at cofferdam top [49] (average RMSE: 0.84), there is high prediction accuracy. However, the prediction accuracy is relatively low for factors such as slope horizontal displacement change rate, cofferdam top settlement change rate, and tie rod axial force change rate. This is because, compared to cumulative change rates, change rate values are measurements calculated over shorter time intervals (generally calculating change rates between adjacent two days), which contain more random errors, resulting in significant deviations in prediction accuracy.
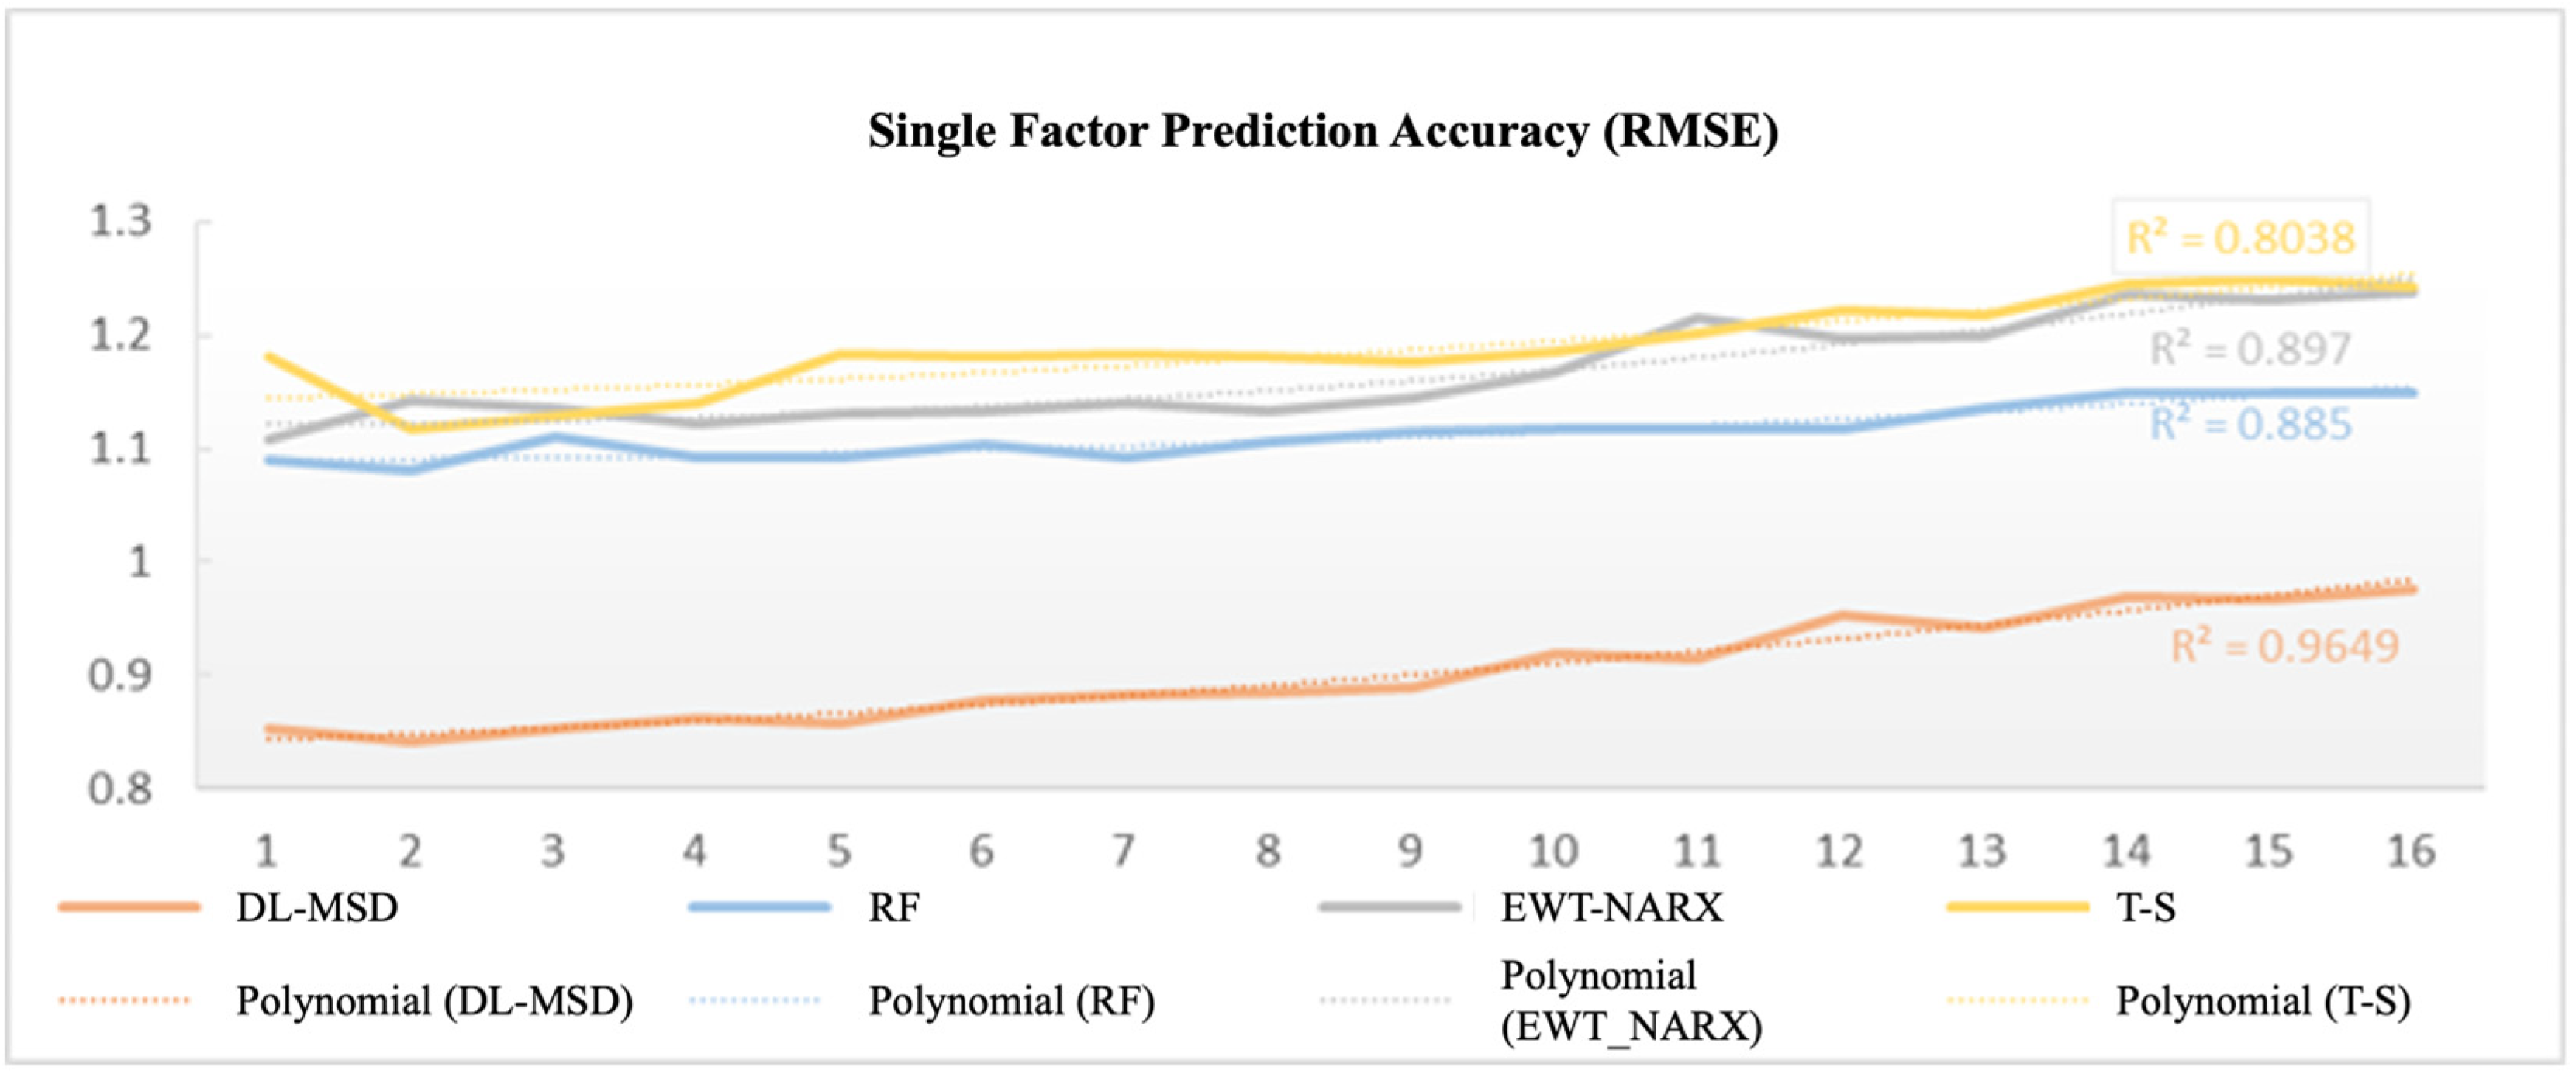
Figure 23 shows the average prediction accuracy (RMSE) of each factor for different prediction methods. The single-factor average prediction accuracy of the DL-MSD method proposed in this paper is 0.902, while the average prediction accuracy of the three methods, RF, EWT-NARX, and T-S, is 1.157, demonstrating better accuracy performance.
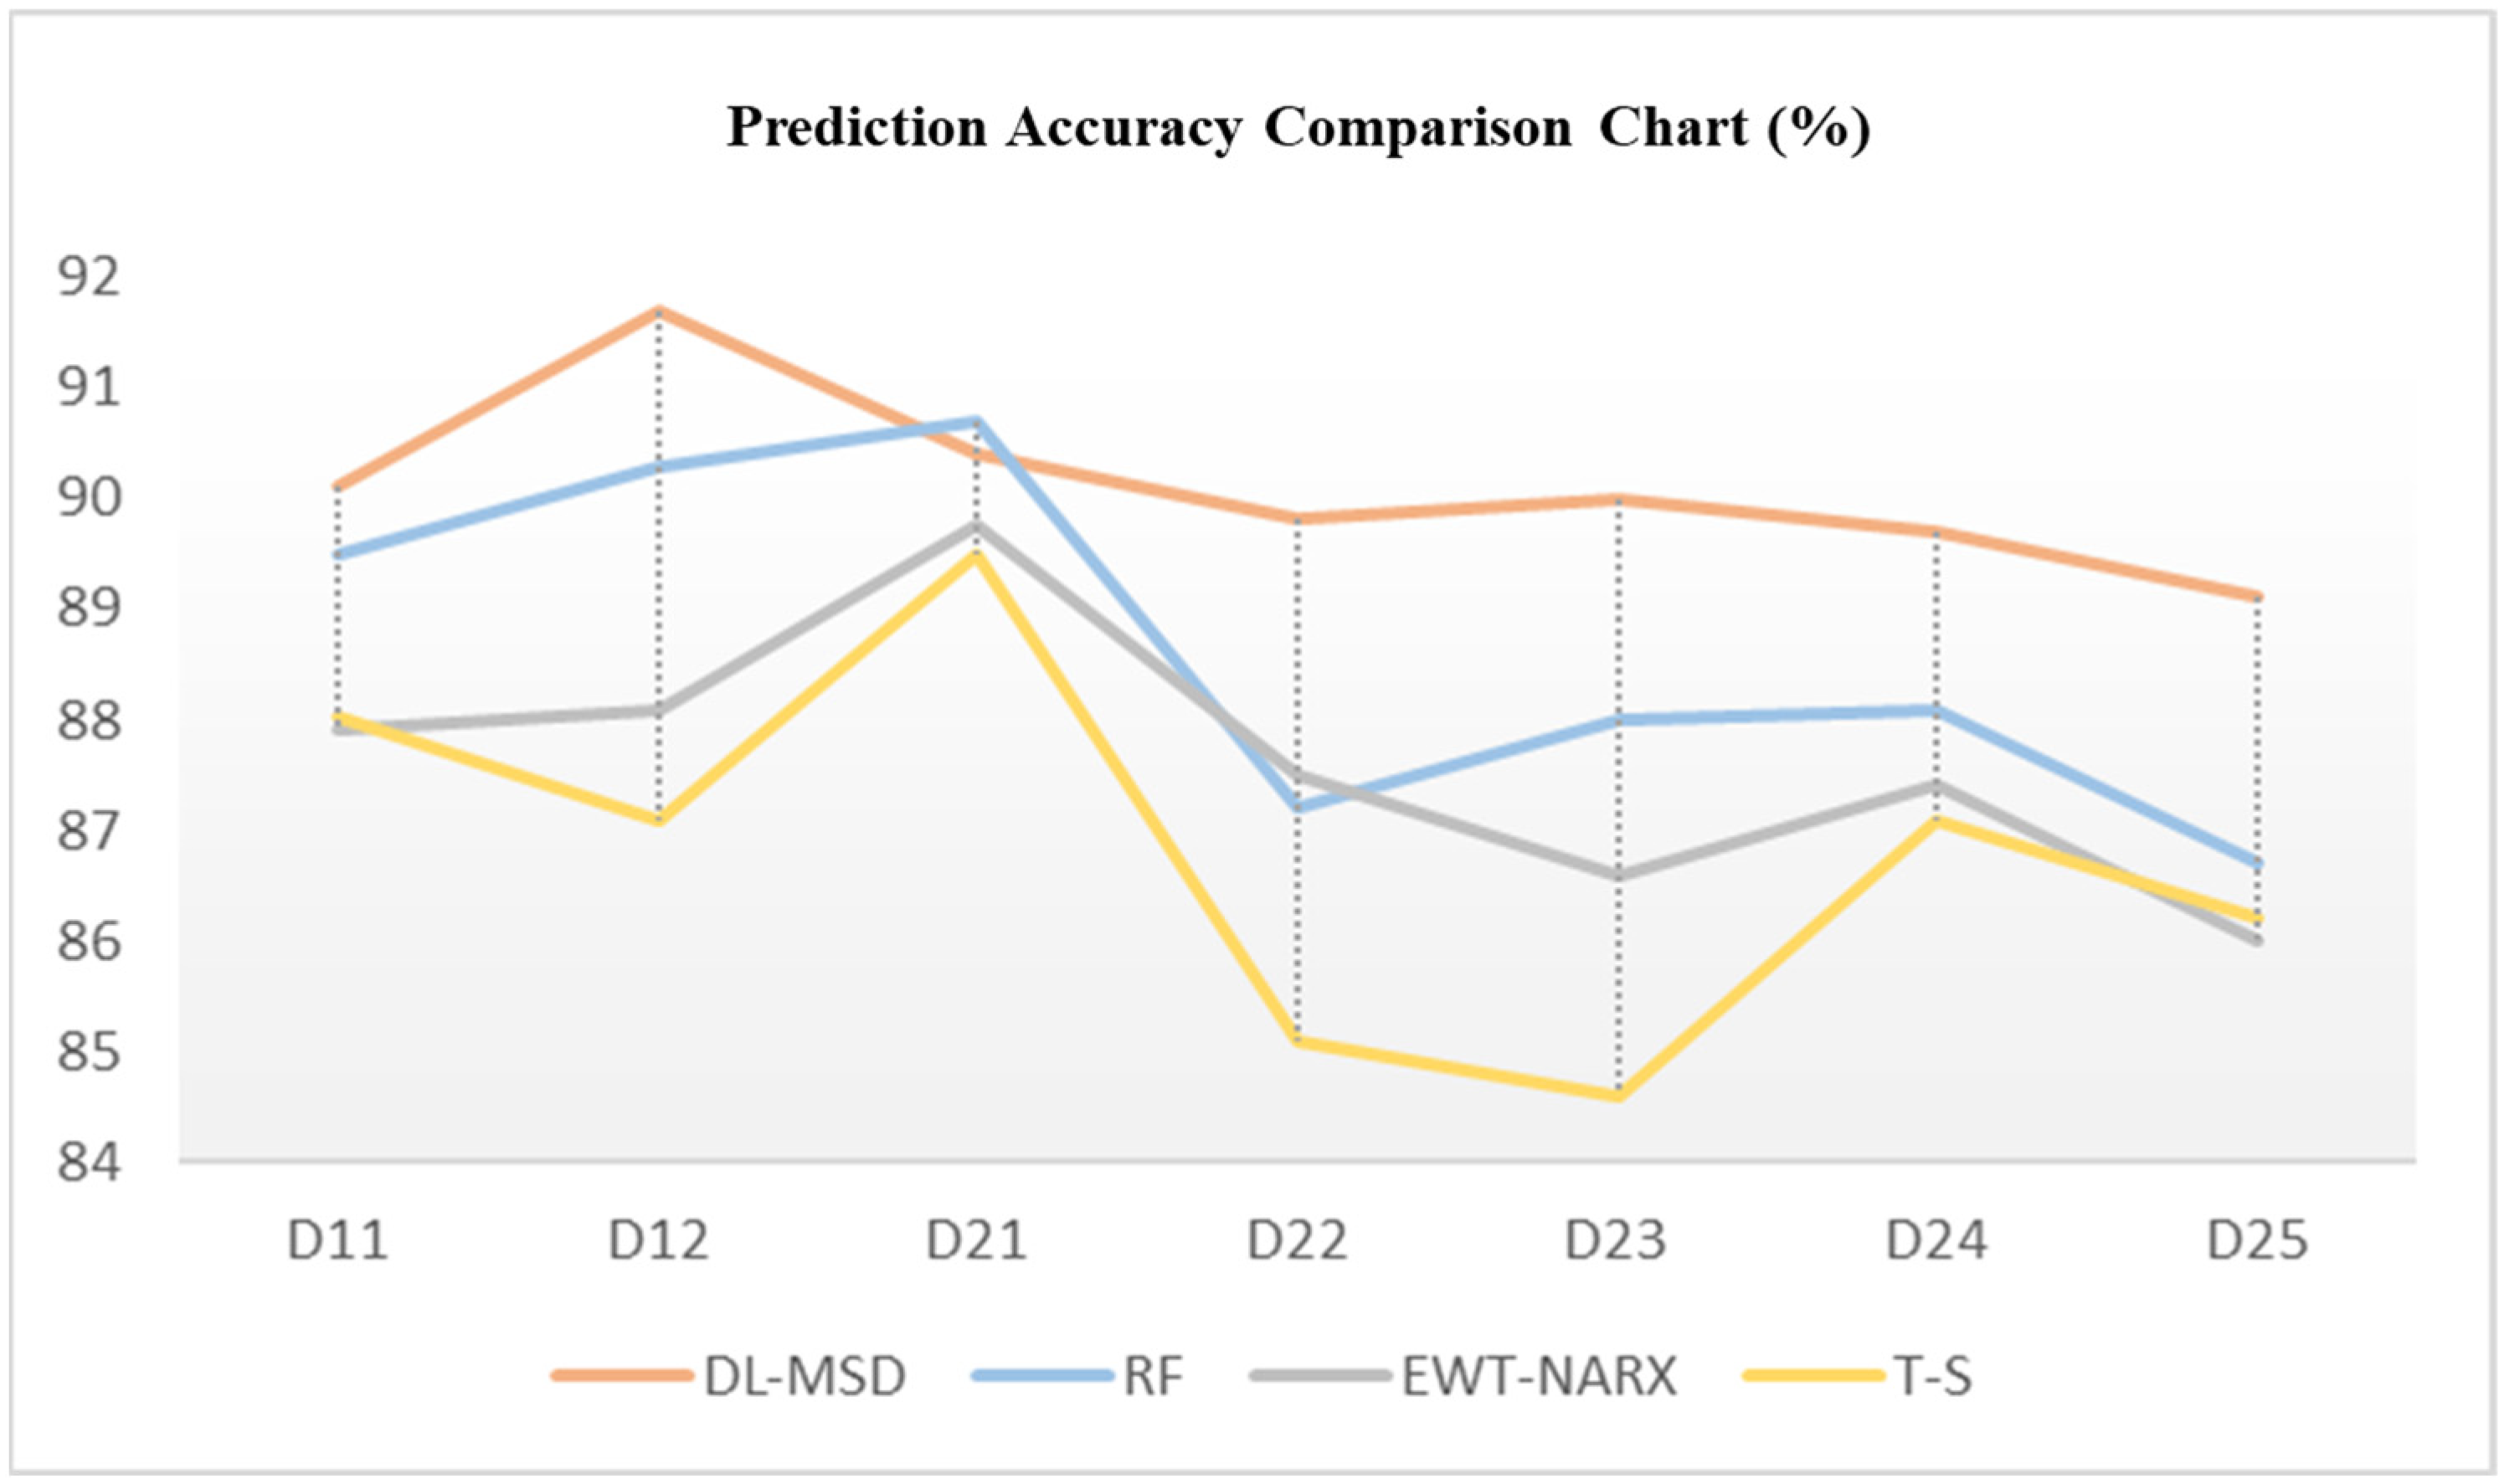
The multi-source data fusion prediction accuracy is 0.771 (RMSE), showing some differences in prediction accuracy compared to multi-source information fusion results. Single-factor and multi-factor prediction accuracy comparison of methods include DL-MSD, RF, EWT-NARX, and T-S, shown in Figure 24, and the prediction accuracy comparison, shown in Figure 25. Since the measured RMSE values (0.771/0.902) are expressed in units of mm and mm/d, the RMSE values are not unified in terms of units. The normalization is performed using the mean-based calculation method.
The purpose of the single-factor prediction is to provide information for identifying the sources of early warning signals. Given its relatively high accuracy, the single-factor prediction is adopted when the fused prediction is insufficient to provide a reliable identification signal. Specifically, when the accuracy of the multi-source fusion prediction falls below the target precision threshold, the system substitutes the fused output with the accuracy value derived from the single-factor prediction.

5. Discussion

This study developed a deep learning-based multi-source early warning framework for deep foundation pit projects that integrated heterogeneous indicators to generate warning signals [50], thereby enhancing the rationality of multi-indicator fusion and machine learning benchmarks, and evaluated its performance through a real-world case involving the Jinji Lake Tunnel. The discussion highlights the engineering applicability, reliability, boundary conditions, and limitations of the proposed model.
(1) Engineering Applicability and Practical Implications: The DL-MSD model demonstrates strong adaptability to complex excavation environments by integrating displacement, stress, groundwater, and qualitative inspection data. Its ability to extract spatiotemporal features enables accurate recognition of nonlinear deformation patterns commonly observed in deep excavations with long weir construction. Quantitative results, including RMSE (0.054–0.09), MAE, and recognition rates (77.1% fusion accuracy; 90.2% single-factor accuracy), confirm that the system can provide stable and timely warning signals. In practice, the model supports early hazard detection, prioritizes key risk indicators (e.g., support deformation, groundwater fluctuations), and strengthens decision-making through continuous monitoring and automated alerting.
(2) Model Generalization and Boundary Conditions: Although the model architecture is generalizable, its performance depends on several boundary conditions. Excavation geometry, soil stiffness, groundwater behavior, and support system configuration significantly influence data distribution. Therefore, transferring the model to other projects requires a calibration phase that includes retraining with site-specific samples, re-establishing warning thresholds, and adjusting weight assignments derived from rough set–expert scoring. Furthermore, construction sites with highly irregular excavation sequences or discontinuous monitoring data may exhibit reduced model robustness unless supplementary interpolation and data balancing strategies are employed.
(3) Reliability, Robustness, and Comparison with Traditional Approaches: Compared with T-S fuzzy neural networks, EWT-NARX, and Random Forest models, DL-MSD achieved lower prediction errors (RMSE reduction of 26–39%) and improved computational efficiency. Its integrated residual units effectively mitigate gradient vanishing, while the LSTM layer enhances long-term temporal prediction. The model maintains stable performance even under sensor noise or partial data loss due to the fallback mechanism that substitutes multi-factor fusion with high-accuracy single-factor predictions. However, sensor malfunction detection remains limited, and future development should incorporate a dedicated data quality assessment module.
(4) Limitations and Future Research: Although this study provides strong evidence for the model’s engineering value, several limitations remain. Simulated extreme events cannot fully replicate real failure progression, restricting the diversity of training samples. Seasonal meteorological factors, especially rainfall–groundwater coupling, are not fully embedded into the current model. Additionally, the adaptive pre-control module is not yet fully implemented.

6. Conclusions

This study proposes a deep learning-based multi-source data fusion early-warning model for deep foundation pit construction using the Extra-Long Weir Construction Method. The major findings and contributions are summarized as follows:
(1) A comprehensive risk evaluation index system was established: Based on FTA and the 4M1E framework, 6 primary and 29 secondary indicators covering personnel, machinery, materials, management, process, and environment were systematically constructed, providing a unified foundation for multi-source data fusion.
(2) A CNN–ResUnit–LSTM hybrid architecture was developed for spatiotemporal hazard recognition: The model combines convolutional feature extraction, residual connections, and recurrent temporal modeling to capture nonlinear deformation evolution. A dual-pathway design enables parallel processing of individual and integrated monitoring streams, ensuring prediction continuity when data sources are compromised.
(3) Field validation with 6524 monitoring records confirmed superior predictive capability: Single-factor classification reached 90.2% accuracy, while multi-factor fusion achieved 77.1%, with all critical Level I warnings correctly identified. Comparative analysis showed consistent improvement over baseline methods across error metrics and response time.
(4) A BIM–IoT–cloud platform was implemented to facilitate construction site deployment: The system integrates sensor networks, visualization interfaces, and alert distribution channels, enabling seamless transition from model output to on-site decision support and demonstrating transferability to other urban excavation projects.
Future advancements should incorporate environmental covariates (meteorological patterns, construction sequencing), implement anomaly detection for sensor reliability, and explore transfer learning frameworks to minimize recalibration requirements across different geological and structural contexts.

Author Contributions

Conceptualization, F.L.; methodology, F.L.; validation, M.Z.; formal analysis, F.L.; investigation, F.L. and M.Z.; resources, F.L., M.Z., and X.X.; data curation, F.L. and M.Z.; writing—original draft, F.L.; writing—review and editing, F.L., X.D., and J.Y.; supervision, X.X. and Q.L.; project administration, Q.L.; funding acquisition, X.X. and Q.L. All authors have read and agreed to the published version of the manuscript.

Funding

This research was funded by the National Natural Science Foundation of China, grant number 52378492/72101054; and the Fundamental Research Funds for the Central Universities, grant number 2242023R40040.

Data Availability Statement

The original contributions presented in this study are included in the article. Further inquiries can be directed to the corresponding author.

Conflicts of Interest

The authors declare no conflicts of interest.

References

  1. Ye, F.; Qin, N.; Liang, X.; Ouyang, A.; Qin, Z.; Su, E. Analyses of the defects in highway tunnels in China. Tunn. Undergr. Space Technol. 2021, 107, 103658. [Google Scholar] [CrossRef]
  2. Chinese Society for Rock Mechanics & Engineering. Sus-Society for Underground Space of CSRME. Available online: http://www.csueus.com (accessed on 13 September 2025).
  3. Xiao, Y.; Liu, X.; He, X.; Zheng, C.; Bai, Q.; Zhang, Y. Case Study on the Mutual Influence of Simultaneous Construction of Adjacent Deep Foundation Pit with Cover-Excavation Reverse Method. Adv. Civ. Eng. 2024, 2024, 5197973. [Google Scholar] [CrossRef]
  4. Yingxia, Y.; Han, J.; Gu, H.; Yang, Y. Dynamic Optimization of Construction Time-Cost for Deep and Large Foundation Pit Based on BIM Technology and Genetic Algorithm. Appl. Sci. 2023, 13, 10716. [Google Scholar] [CrossRef]
  5. Zhang, X.; Wang, X. Early Warning Model Construction for Deformation Monitoring and Management of Deep Foundation Pit Project Combined with Artificial Intelligence. Int. J. Adv. Comput. Sci. Appl. 2025, 16, 621–622. [Google Scholar] [CrossRef]
  6. Gayarre, F.L.; González-Nicieza, C.; Alvarez-Fernández, M.I.; Álvarez-Vigil, A. Forensic analysis of a pile foundation failure. Eng. Fail. Anal. 2010, 17, 486–497. [Google Scholar] [CrossRef]
  7. Hung, M.; Fabian, C. Problems in Deep Foundation Construction in Taiwan. J. Perform. Constr. Facil. 1990, 4, 259–270. [Google Scholar] [CrossRef]
  8. Zhang, G.; Wu, D. Analysis of foundation pit accidents due to expansive soil in Hefei district. In Proceedings of the 3rd International Conference on Civil Engineering and Transportation (ICCET 2013), Kunming, China, 14–15 December 2013. [Google Scholar]
  9. Zhang, X.; Zhang, Q.; Wang, C.; Wang, Y. Monitoring analysis and safety evaluation of deep foundation pit under complex conditions. In Proceedings of the 4th International Conference on Civil Engineering, Architecture and Building Materials (CEABM), Haikou, China, 24–25 May 2014. [Google Scholar]
  10. Qian, Q.; Lin, P. Safety risk management of underground engineering in China: Progress, challenges and strategies. J. Rock. Mech. Geotechical Eng. 2016, 8, 423–442. [Google Scholar] [CrossRef]
  11. Zhou, H.; Zhang, H. Risk assessment methodology for a deep foundation pit construction project in Shanghai, China. J. Constr. Eng. Manag.-ASCE 2011, 137, 1185–1194. [Google Scholar] [CrossRef]
  12. Wang, C.; Lu, Y.; Dai, Y.; Wu, H.; Ma, Z. In-situ 4D CT analysis of microcrack evolution in carbonated fiber-reinforced recycled aggregate concrete. Cem. Concr. Compos. 2025, 163, 106161. [Google Scholar] [CrossRef]
  13. Wang, C.; Du, Z.; Zhang, Y.; Li, L.; Ma, Z. Meso-structural insights into post-peak behaviors of micro steel fiber-reinforced recycled aggregate concrete using in-situ 4D CT and DVC techniques. J. Build. Eng. 2025, 100, 111674. [Google Scholar] [CrossRef]
  14. Wang, C.; Yuan, J.; Zhang, Y.; Wu, H.; Ma, Z. Advanced in-situ 4D CT reconstruction for exploring fiber distribution effects on the mechanical behaviors and interface optimization of carbonated high-toughness recycled aggregate concrete. Constr. Build. Mater. 2025, 473, 140941. [Google Scholar] [CrossRef]
  15. Wang, C.; Guo, J.; Wang, X.; Zhang, Y.; Ma, Z. Dynamic mechanical properties and damage constitutive model of high-toughness recycled aggregate concrete under high strain rate impact loads. J. Build. Eng. 2025, 106, 112589. [Google Scholar] [CrossRef]
  16. Wang, C.; Zhao, W.; Dai, Y.; Wu, H.; Ma, Z. Exploring the energy dissipation mechanism and toughness quantitative model for high-toughness recycled concrete subjected to dynamic impact loading. J. Build. Eng. 2025, 108, 112809. [Google Scholar] [CrossRef]
  17. Tian, W.; Meng, J.; Zhong, X.; Tan, X. Intelligent Early Warning System for Construction Safety of Excavations Adjacent to Existing Metro Tunnels. Adv. Civ. Eng. 2021, 2021, 8833473. [Google Scholar] [CrossRef]
  18. Hu, H.; He, J.; Liu, P.; Zhu, C. Identification and evaluation of deep foundation pit construction risks based on Grey-DEMATEL-Fuzzy comprehensive evaluation method. PLoS ONE 2024, 19, e0304095. [Google Scholar]
  19. Pan, Y.; Zhou, X.; Chen, J.; Hong, Y. Temporal-spatial-fusion-based risk assessment on the adjacent building during deep excavation. Inf. Fusion. 2025, 114, 102653. [Google Scholar] [CrossRef]
  20. Mana, A.; Clough, G. Prediction of Movements for Braced Cuts in Clay. J. Geotechical Eng. Div. 1981, 107, 759–777. [Google Scholar] [CrossRef]
  21. Ou, C.-Y.; Hsieh, P.-G.; Chiou, D.-C. Characteristics of ground surface settlement during excavation. Can. Geotech. J. 1993, 30, 758–767. [Google Scholar] [CrossRef]
  22. Wu, B.; Wei, Y.; Meng, G.; Xu, S.; Wang, Q.; Cao, D.; Zhao, C. Multi-Source Monitoring Data Fusion Comprehensive Evaluation Method for the Safety Status of Deep Foundation Pit. Sustainability 2023, 15, 11809. [Google Scholar] [CrossRef]
  23. Liu, Z.; Liu, F.; Wang, Y.; Zhang, Y.; Sun, Z.; Zhang, M. Prediction of retaining structure deformation of ultra-deep foundation pit by empirical mode decomposition with recurrent neural networks. Environ. Earth Sci. 2023, 82, 553. [Google Scholar] [CrossRef]
  24. Zhang, Y.; Xing, X.; Antwi-Afari, M.F. A hybrid approach for optimizing deep excavation safety measures based on Bayesian network and design structure matrix. Adv. Eng. Inform. 2023, 58, 102223. [Google Scholar] [CrossRef]
  25. Zhou, C.; Ding, L. Safety barrier warning system for underground construction sites using Internet-of-Things technologies. Autom. Constr. 2017, 83, 372–389. [Google Scholar] [CrossRef]
  26. Zhou, C.; Ding, L.; Zhou, Y.; Luo, H. Topological mapping and assessment of multiple settlement time series in deep excavation: A complex network perspective Author links open overlay panel. Adv. Eng. Inform. 2018, 36, 1–19. [Google Scholar] [CrossRef]
  27. Wu, J.; Peng, L.; Li, J.; Zhou, X.; Zhong, J.; Wang, C.; Sun, J. Rapid safety monitoring and analysis of foundation pit construction using unmanned aerial vehicle images. Autom. Consruction 2021, 128, 103706. [Google Scholar] [CrossRef]
  28. Zhou, Y.; Li, C.; Ding, L.; Sekula, P.; Love, P.; Zhou, C. Combining association rules mining with complex networks to monitor coupled risks. Reliab. Eng. Syst. Saf. 2019, 186, 194–208. [Google Scholar] [CrossRef]
  29. Xu, Y.; Zhao, Y.; Jiang, Q.; Sun, J.; Tian, C.; Jiang, W. Machine-Learning-Based Deformation Prediction Method for Deep Foundation-Pit Enclosure Structure. Appl. Sci. 2024, 14, 1273. [Google Scholar] [CrossRef]
  30. Huang, J.; Jian, X.; Ren, H. Research on Safety Risk Evaluation System for Seepage in Ship Lock Foundation Pit Engineering. Buildings 2024, 14, 2972. [Google Scholar] [CrossRef]
  31. Sheikh, M.R.; Nakata, Y.; Shitano, M.; Kaneko, M. Rainfall-induced unstable slope monitoring and early warning through tilt sensors. Soils Found. 2021, 61, 1033–1053. [Google Scholar] [CrossRef]
  32. Jiang, J.; Liu, G.; Ou, X. Risk Assessment of Constructing Deep Foundation Pits for Metro Stations Based on Fuzzy Evidence Reasoning and Two-tuple Linguistic Analytic Network Process. Shock. Vib. 2022, 2022, 2650627. [Google Scholar] [CrossRef]
  33. He, S.; Song, D.; Mitri, H.; He, X.; Chen, J.; Li, Z.; Xue, Y.; Chen, T. Integrated rockburst early warning model based on fuzzy comprehensive evaluation method. Int. J. Rock. Mech. Min. Sci. 2021, 142, 104767. [Google Scholar] [CrossRef]
  34. Guo, Y.; Li, C.; Yan, M.; Ma, R.; Bi, W. Research on Deformation Safety Risk Warning of Super-Large and Ultra-Deep Foundation Pits Based on Long Short-Term Memory. Buildings 2024, 14, 1464. [Google Scholar] [CrossRef]
  35. Wang, X.; Xu, Z.; Sun, Y.; Zheng, J.; Zhang, C.; Duan, Z. Construction of multi-factor identification model for real-time monitoring and early warning of mine water inrush. Int. J. Min. Sci. Technol. 2021, 31, 853–866. [Google Scholar] [CrossRef]
  36. Bahrami, M.; Roghani, B.; Gratl, T.F.; Rokstad, M.M. A deep dive into green infrastructure failures using fault tree analysis. Water Res. 2024, 257, 121676. [Google Scholar] [CrossRef]
  37. Ji, S.; Yang, M.; Yu, K. 3D convolutional neural networks for human action recognition. IEEE Trans. Pattern Anal. Mach. Intell. 2013, 35, 221–231. [Google Scholar] [CrossRef] [PubMed]
  38. Zhang, J.; Zheng, Y.; Qi, D. Deep spatio-temporal residual networks for citywide crowd flows prediction. In Proceedings of the 31st AAAI Conference on Artificial Intelligence, San Franciso, CA, USA, 4–9 February 2017. [Google Scholar]
  39. Rui, F.; Zuo, Z.; Li, F. Using LSTM and GRU neural network methods for traffic flow prediction. In Proceedings of the Youth Academic Conference of Chinese Association of Automation, Hefei, China, 19–21 May 2017. [Google Scholar]
  40. Wang, R.; Zhang, L.; Lu, X. Crop Evaluation System Optimization: Attributte Weights Determination Based on Rough Sets Theory. Math. Probl. Eng. 2017, 2017, 6781671. [Google Scholar] [CrossRef]
  41. Chao, L.; Zhang, K.; Li, Z.; Zhu, Y.; Wang, J.; Yu, Z. Geographically weighted regression based methods for merging satellite and gauge precipitation. J. Hydrol. 2018, 558, 275–289. [Google Scholar] [CrossRef]
  42. Wei, T.; Song, P.; Chen, Y.; Xu, H.; Jin, C.; Choy, L.K.S.K.T. Short-Term Intensity Prediction of Tropical Cyclones Based on Multi-Source Data Fusion with Adaptive Weight Learning. Remote Sens. 2024, 16, 984. [Google Scholar]
  43. Wang, J.; Jiang, Z.; Li, F.; Chen, W. The prediction of water level based on support vector machine under construction condition of steel sheet pile cofferdam. Concurr. Comput. Pract. Exp. 2020, 33, e6003. [Google Scholar] [CrossRef]
  44. Lan, B.; Wang, Y.; Wang, W. Review of the Double-Row Pile Supporting Structure and Its Force and Deformation Characteristics. Appl. Sci. 2023, 13, 7715. [Google Scholar] [CrossRef]
  45. Zhang, J. Finite Element Analysis of Ultra-deep Foundation Pit Covered Top-Down Excavation Based on PLAXIS. Earth Environ. Sci. 2019, 300, 022158. [Google Scholar] [CrossRef]
  46. Xiao, B.; Li, P. Load Regularity Analysis on Spatial Load Forecasting of Urban Power System. Power Syst. Technol. 2009, 33, 113–119. [Google Scholar]
  47. Ma, Q.; Liu, S.; Fan, X. A time series prediction model of foundation pit deformation based on empirical wavelet transform and NARX network. Mathematics 2020, 8, 1535. [Google Scholar] [CrossRef]
  48. Zhou, Y.; Li, S.; Zhou, C.; Luo, H. Intelligent Approach Based on Random Forest for Safety Risk Prediction of Deep Foundation Pit in Subway Stations. J. Comput. Civ. Eng. 2018, 33, 05018004. [Google Scholar] [CrossRef]
  49. Zhu, H.; Yan, J.; Liang, W. Challenges and Development Prospects of Ultra-Long and Ultra-Deep Mountain Tunnels. Engineering 2019, 5, 384–392. [Google Scholar] [CrossRef]
  50. Fathi, F.; Kariminejad, N.; Boali, A.; Shamsi, S.; Shafaie, V.; Rad, M.; Pourghasemi, H. Assessment of soil erosion patterns in Maharloo watershed using remote sensing techniques and early warning signals. J. Arid Environ. 2026, 232, 105496. [Google Scholar] [CrossRef]
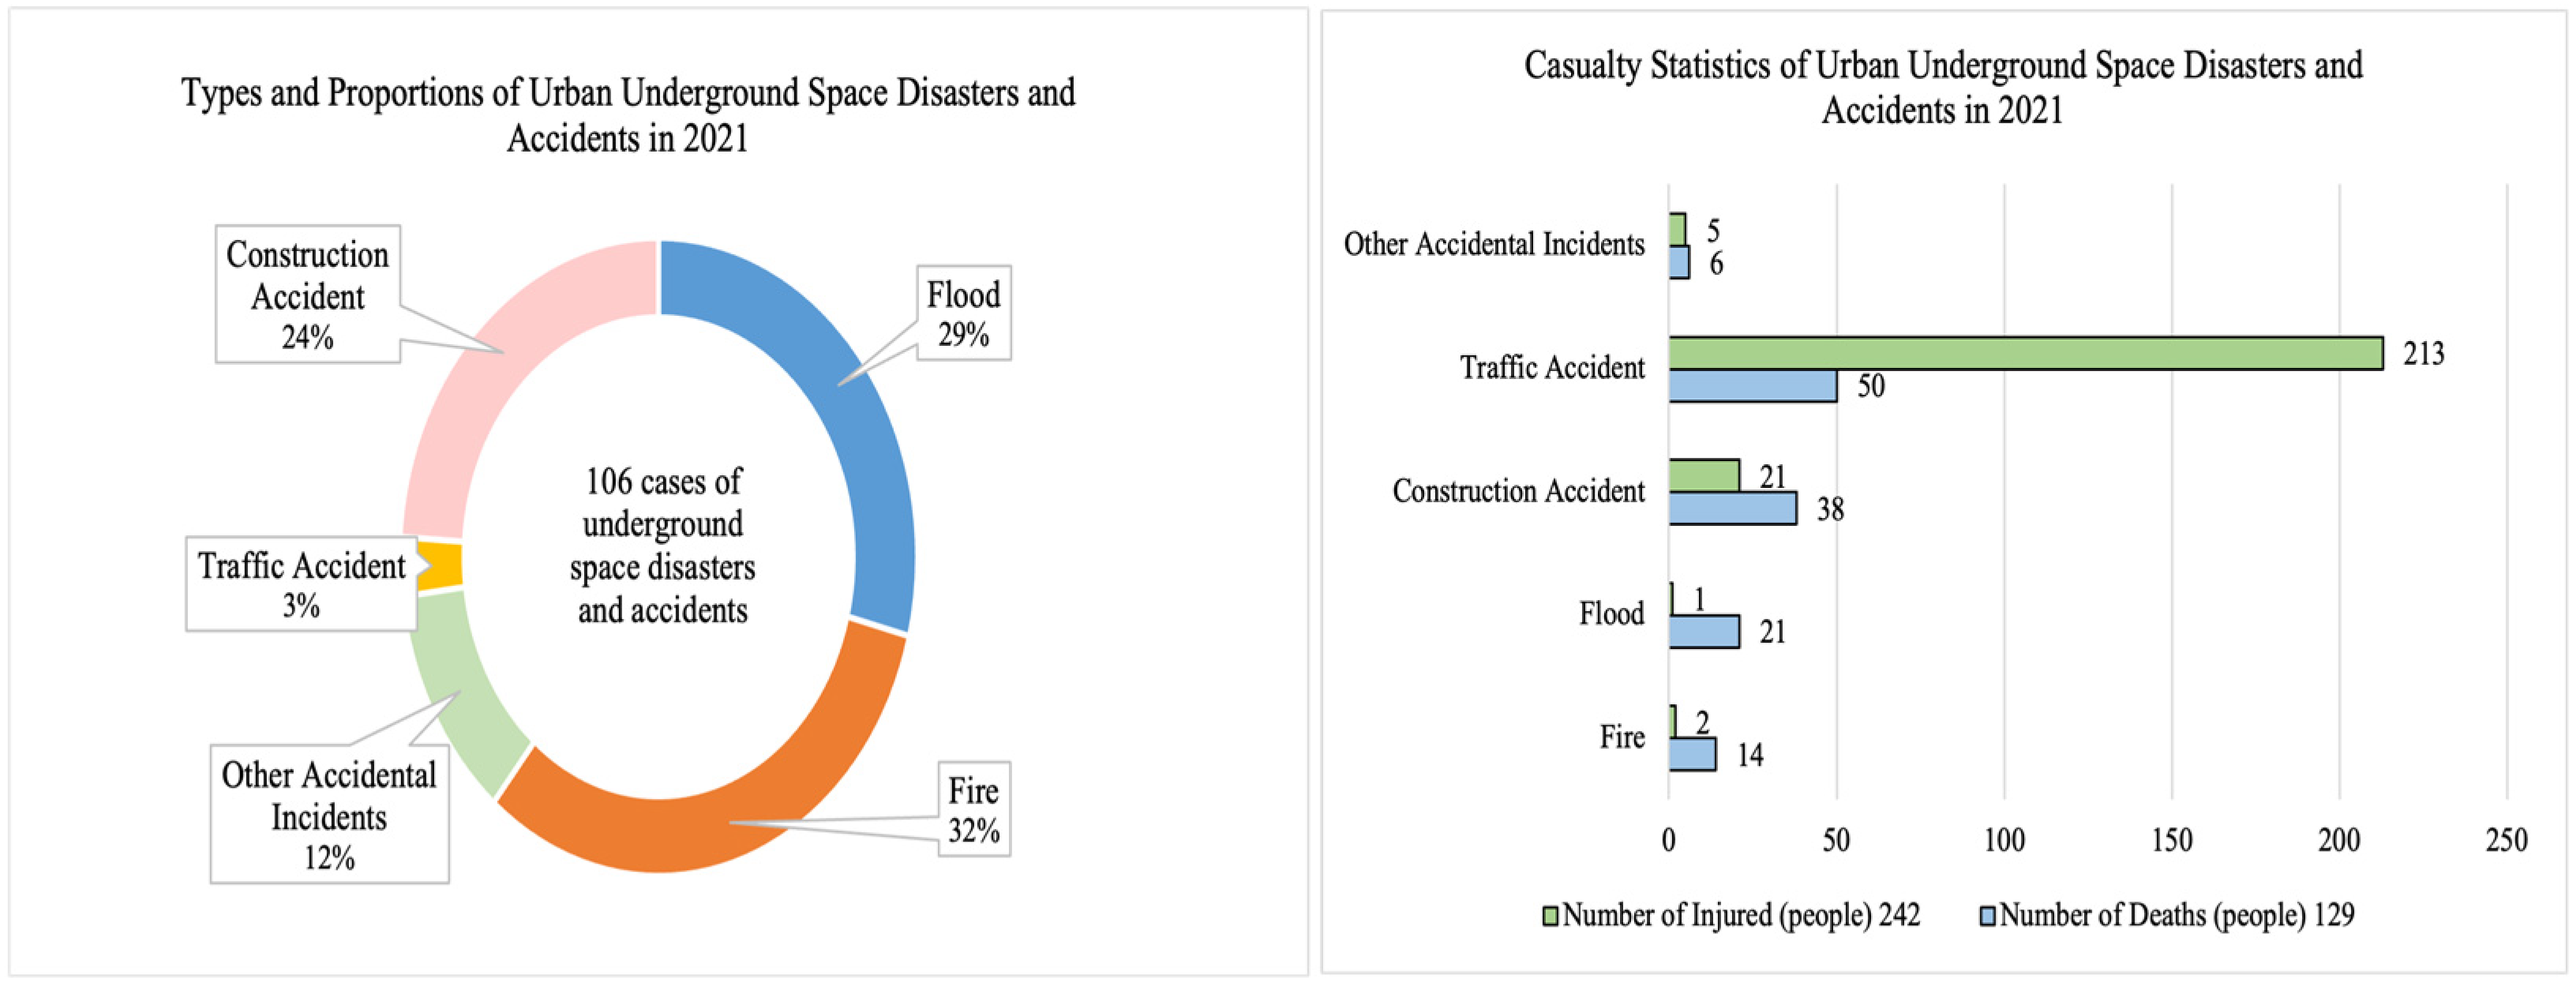
Figure 1. Analysis chart of the frequency and casualties of accidents and disasters in underground space engineering in 2021.
Buildings 15 04270 g001
Figure 2. Statistics of the causes of foundation pit accidents.
Buildings 15 04270 g002
Figure 3. Fault tree of deep foundation pit construction.
Buildings 15 04270 g003
Figure 4. Research methodology.
Buildings 15 04270 g004
Figure 5. Frame diagram of prediction model.
Buildings 15 04270 g005
Figure 6. Time-series-based deep learning model framework.
Buildings 15 04270 g006
Figure 7. CNN + ResUnit deep learning framework.
Buildings 15 04270 g007
Figure 8. CNN + LSTM learning framework.
Buildings 15 04270 g008
Figure 9. The prediction model flow of construction safety risk for deep foundation pit construction.
Buildings 15 04270 g009
Figure 10. Interpolation method and hierarchical clustering method to realize the clustering diagram of related data.
Buildings 15 04270 g010
Figure 11. Risk monitoring index weight statistical chart.
Buildings 15 04270 g011
Figure 12. Geographical location of Jinji Lake Tunnel.
Buildings 15 04270 g012
Figure 13. Data acquisition method for deep foundation pit construction.
Buildings 15 04270 g013
Figure 14. Layout diagram of monitoring points in the first stage of cofferdam (densification of monitoring points of transverse cofferdam).
Buildings 15 04270 g014
Figure 15. Support axial force, settlement observation points layout, and side slope point embedding.
Buildings 15 04270 g015
Figure 16. Collection of field monitoring data.
Buildings 15 04270 g016
Figure 17. Monitoring data content diagram.
Buildings 15 04270 g017
Figure 18. Risk early-warning multidimensional space mapping one-dimensional space diagram.
Buildings 15 04270 g018
Figure 19. T-S fuzzy neural network structure.
Buildings 15 04270 g019
Figure 20. EWT-NARX model.
Buildings 15 04270 g020
Figure 21. Multi-source data fusion normalized heat map.
Buildings 15 04270 g021
Figure 22. Model learning process diagram (Symbol means the stable state).
Buildings 15 04270 g022
Figure 23. Comparison chart of single-factor prediction accuracy.
Buildings 15 04270 g023
Figure 24. Single-factor prediction accuracy (RMSE).
Buildings 15 04270 g024
Figure 25. Prediction accuracy comparison chart.
Buildings 15 04270 g025
Table 1. Risk evaluation index system of deep foundation pit construction.
Target LayerCriteria LayerIndicator Layer
Deep Foundation Pit Construction Risk Assessment Index System TPersonnel Factors T1T11 Personnel safety risk awareness
T12 Personnel professional technical level
T13 Personnel safety emergency response capability
T14 Construction compliance with standards and specifications
Machinery and Equipment Factors T2T21 Machinery and equipment maintenance measures
T22 Machinery and equipment operation arrangement, and command
T23 Machinery and equipment operation compliance
T24 Rationality of machinery and equipment selection
Construction Material Factors T3T31 Concrete strength
T32 Steel support stress
T33 Anchor rod strength and quality
T34 Retaining wall material quality compliance
T35 Material processing quality control
Management FactorsT4T41 Safety and civilized construction education and training
T42 Construction safety risk management measures
T43 Safe construction organization design scheme
T44 Inspection, monitoring, and early-warning control measures
Construction Technology Factors T5T51 Geological and hydrological survey analysis
T52 Foundation pit waterproof curtain design and construction
T53 Foundation pit support installation and dismantling design and construction
T54 Foundation pit retaining structure design and construction
T55 Foundation pit earthwork excavation construction
T56 Drainage and dewatering construction control measures
Environmental Factors T6T61 Soil layer geological conditions
T62 Underground hydrological conditions
T63 Construction climate conditions
T64 Underground pipeline burial situation
T65 Location and size of surrounding buildings
T66 Surrounding road traffic conditions
Table 2. Under-sampling and over-sampling core code.
Tomek LinksSMOTE
From imbleam.under_sampling import TomekLinksFrom imblearn.over_sampling import SMOTE
Tl = TomekLinks(return_indices = Ture, atio = majority)Smote = SMOTE(ratio = minority)
X_tl, y_tl, id_tl = tl.fit_sample(X,y)X_sm, y_sm = smote.fit_sample(X,y)
Table 3. Sample data example.
SampleImpact FactorsLevel of Risk
C1C2C3C4C5C6C7C8……Cn
10.660.940.710.300.670.090.050.31 0.86III
Table 4. List of monitoring items in open-cut section.
NoMonitoring ItemsMonitoring ScopeMeasuring Point Sections and SpacingRemarks
1Foundation pit interior and exterior observationGround outside pit, building strata soil description, support piles, internal supportsConducted at any timeIncluding surrounding ground cracks, collapse, seepage, overloading, etc.
2Surface settlement around foundation pitSurrounding area within twice the excavation depthMidpoints of long and short sides, with spacing within 20–50 m rangeNo less than 3 monitoring points on each side
3Wall top displacementTop ring beam of wallMidpoints of long and short sides, with spacing within 20 m rangeNo less than 3 monitoring points on each side
4GroundwaterAround foundation pitOutside pit: midpoints of long and short sides, with spacing within 20–50 m range; inside pit: preferably arranged at the center and peripheral corners of foundation pit
5Wall deformationFull height of wallMidpoints of long and short sides, with spacing within 20–50 m range; vertical spacing 1 mNo less than 3 monitoring points on each side
6Support axial forceEnd or middle of supportsWithin <15 m range from midpoints of long and short sidesNo less than 3 internal force monitoring points for each support layer
7Pipeline monitoringAround foundation pitPipeline monitoring points should have planar spacing of 15–25 m, extending beyond pit edge by 1 times the excavation rangeNo less than 3 monitoring points for each pipeline
8Important buildings (structures)Both sides of foundation pitCorner points and midpoints of buildings (structures), with peripheral arrangement spacing no greater than 10 mNo less than 3 monitoring points on each side of building
9Intermediate support pile columnsVertical displacementOne measuring point for each intermediate support
Table 5. Example of early warning and pre-control of horizontal displacement at the top of coffer-dam.
Monitoring Time/DayActual ValueLevel III Warning ValueLevel II Warning ValueLevel I Warning Value
Daily VariableCumulative VariableDaily VariableCumulative VariableDaily VariableCumulative VariableDaily VariableCumulative Variable
11−0.2013.202.4 mm/d24 mm2.7 mm/d27 mm3.0 mm/d30 mm
12−0.7012.50
13−2.8011.90
14−2.509.40
15−0.109.30
160.209.50
170.109.60
180.209.80
Table 6. Example of early warning and pre-control of horizontal displacement at the top of slope.
Monitoring Time/DayActual ValueLevel III Warning ValueLevel II Warning ValueLevel I Warning Value
Daily VariableCumulative VariableDaily VariableCumulative VariableDaily VariableCumulative VariableDaily VariableCumulative Variable
69−0.1026.403.2 mm/d36 mm3.6 mm/d40.5 mm4.0 mm/d45 mm
70−0.4026.80
71−0.1026.20
72−0.5026.20
734.0030.20
743.5033.70
753.1036.90
760.2024.40
77−0.2024.20
Table 7. Pre-warning and pre-control examples of cumulative value of foundation pit bottom uplift.
Monitoring Time/DayActual ValueLevel III Warning ValueLevel II Warning ValueLevel I Warning Value
Daily VariableCumulative VariableDaily VariableCumulative VariableDaily VariableCumulative VariableDaily VariableCumulative Variable
236−0.1712.192.4 mm/d28 mm2.7 mm/d31.5 mm3.0 mm/d35 mm
237−0.2711.92
2380.2712.19
2390.3612.55
2401.4313.98
2410.5714.55
2421.4215.97
2432.8818.85
2440.0818.93
Table 8. Location-based multi-factor fusion dataset.
DatasetCofferdam
Deformation
(D11)
Foundation Pit Deformation
(D12)
Data Sample258234
Table 9. Accident-based single-factor dataset.
Type of AccidentGround Deformation
(D21)
Support Deformation
(D22)
Retaining Structure Cracking and Seepage
(D23)
Slope Structure Instability
(D24)
Cofferdam Structure Instability
(D25)
Sample216223258257271
Table 10. Sample data of envelope structure instability risk prediction model.
SampleImpact FactorsRisk Level
C1C2C3C4C5C6
10.850.520.840.950.470.30I
20.690.780.460.030.380.92IV
30.660.380.880.190.600.07II
40.720.730.970.910.140.61III
50.250.850.600.300.730.28V
60.700.600.990.940.940.36II
70.950.970.470.750.000.10V
80.150.760.270.980.380.29IV
90.280.030.800.900.520.33III
100.810.290.700.350.690.69V
110.430.990.040.720.900.47IV
120.140.280.880.180.680.76II
130.130.200.230.710.750.07III
140.680.280.770.140.710.22V
150.610.540.750.700.540.15II
Table 11. Experimental apparatus.
SystemConfiguration
Local ComputerIntel Core i7-8565-U, 64-bit OS, 16.0 GB RAM
Google CollaboratoryPython 3 Google Compute Engine backend (TPU)
IBM Watson Studio4 vCPU and 16 GB RAM, Default Python 3.6 S
Table 12. Learning and prediction schedule (second).
DatasetLearning
Time
Std.Prediction
Time
Std.
D11378.370.0131.280.01
D12429.230.0133.020.01
D21458.330.0234.060.02
D22440.280.0234.730.04
D23466.860.0236.420.01
D24496.360.0238.420.03
D25487.340.0234.500.02
Disclaimer/Publisher’s Note: The statements, opinions and data contained in all publications are solely those of the individual author(s) and contributor(s) and not of MDPI and/or the editor(s). MDPI and/or the editor(s) disclaim responsibility for any injury to people or property resulting from any ideas, methods, instructions or products referred to in the content.