Article

Selection of the Optimal Intensity Measure for Unreinforced Masonry Buildings Using Vulnerability-Based Metrics

Department of Engineering Mechanics, Faculty of Civil Engineering, University of Zagreb, HR-10000 Zagreb, Croatia
*
Author to whom correspondence should be addressed.
Buildings 2025, 15(23), 4261; https://doi.org/10.3390/buildings15234261
Submission received: 14 October 2025 / Revised: 11 November 2025 / Accepted: 17 November 2025 / Published: 25 November 2025
(This article belongs to the Section Building Structures)

Abstract

Selection of the optimal intensity measure is an important contribution to reducing the numerous uncertainties in seismic inputs within the context of performance-based earthquake engineering, especially for unreinforced masonry buildings that exhibit strong nonlinear behaviour. While traditional metrics such as efficiency, sufficiency, and practicality have been successfully used to determine optimal intensity measures for seismic demand models and fragility curves, the impact of different intensity measures on the final vulnerability curves has not been sufficiently investigated. Therefore, a new vulnerability-based metric is proposed, based on the vulnerability curve variance and its first derivative, with the aim of determining the optimal intensity measure for new vulnerability models of mid-rise unreinforced masonry buildings. Both traditional and new metrics were used to evaluate the performance of common intensity measures, using a typical unreinforced masonry building located in Zagreb, Croatia as a case study. The new metric produced intensity measure rankings in line with traditional metrics, but additionally proved effective in quantifying the impact of intensity measure choice on the final vulnerability curve, making it a reliable tool for vulnerability modelling. Average spectral acceleration and peak ground velocity were among the best performing intensity measures, confirming their use for unreinforced masonry buildings.

1. Introduction

When considering vulnerability modelling in the context of seismic risk assessment [1], the final outputs are vulnerability curves, which describe the relationship between the intensity of ground shaking and the resulting losses of interest to the decision makers [2]. Intensity of ground shaking is commonly represented by intensity measures (IMs), physical quantities that allow explicit characterization of seismic loads on buildings [3]. For example, it would be difficult to determine building performance under seismic loads described only in terms of seismotectonic characteristics of earthquake events, such as magnitudes, distances from rupture, and depth [4,5]. Instead, structural analysis prefers physical quantities to solve equations of motion [6]. This is why intensity measures (IMs) are crucial for describing seismic loading on buildings, because they represent ground shaking in a way that is easy to implement in seismic analysis, particularly when real ground motion recordings are used in nonlinear dynamic analyses (NLDAs) as seismic load. Intensity measures act as a bridge between seismotectonic and engineering parameters [7].
Intensity measures are usually kinematic quantities (accelerations, velocities, and displacements), such as the commonly used peak ground acceleration (PGA) or spectral acceleration (Sa), but they may be time-based (e.g., significant duration) or energy-based (e.g., Arias intensity) as well. Furthermore, they may be building-independent, meaning their value does not depend on the characteristics of the building (such as PGA), or building-dependent, where it depends on modal or other building attributes (such as Sa). Some IMs are easily obtained from ground motion records, while others require nontrivial computation (composite IMs such as average spectral acceleration Sa,avg). There have been many IMs proposed in the literature, all with various purposes [3,8,9]. For example, peak ground displacement (PGD) captures the response of spatially distributed structures such as roads and railways, which are sensitive to displacements of the ground, while Sa at the fundamental period of the building drives the response of first mode-dominated structures. Moreover, IMs may be scalar (single value) or vector quantities (multiple scalar IMs combined) to incorporate more ground motion features simultaneously, because different structures are sensitive to different IMs. They may be structure-dependent [10] or independent [11]. For each ground-motion recording, any IM may be computed, and it is up to the user to determine which IM best represents ground shaking for a specific intended purpose. This is the problem of optimal intensity measure selection, where a variety of IM metrics are used to search for an IM that best accounts for the most relevant influences of ground shaking in a specific application.
The problem of selecting ground motion records for use in nonlinear dynamic analyses is based on the results of seismic hazard assessment, which provides target IM distributions for specific sites, where buildings of interest are located. Ground motion records are then selected based on how closely their IM values align with the target [12,13]. Finding ground motion records that comply with the target IM distribution for as many IMs as possible is a difficult task, but it is an important one for some applications. On the other hand, by using an optimal scalar IM, it is possible in many cases to obtain the same accuracy of results as if we considered the distributions of multiple IMs. For example, Kohrangi et al. [14] have developed three sets of fragility curves for identical buildings at three different locations. Each location had different hazard values and, consequently, different IM distributions and different site-specific sets of ground motions selected for NLDAs. Fragility curves developed using Sa showed that at one location, the building should collapse, while at another, only slight damage could occur, for the same value of Sa. However, if Sa,avg was selected as an IM, and the same three site-specific sets of ground motions were used, the fragility curves were almost identical for all sites. This example showed that by selecting an optimal IM, it becomes less important which ground motions are used for NLDAs. Instead, any ground motion with the same value of an optimal IM produces a similar building response. An optimal IM allows for the use of ground motion records that are not necessarily consistent with the hazard on location, but still produce the same accuracy of structural responses, which is particularly important when using highly scaled records (e.g., in incremental dynamic analysis (IDA)).
Multiple IM metrics have been proposed with the goal of selecting the optimal IM for specific purposes [15,16]. Available IM metrics mostly focus on evaluating IMs based on their capability to produce reliable seismic demand models (efficiency) [17] or fragility curves (proficiency) [18]. Some focus on independence from seismotectonic parameters of ground shaking (sufficiency), sensitivity of structural responses to an increase in IM values (practicality), or availability of IM from seismic hazard calculations (hazard computability). There are other IM metrics as well, but they are not considered in the scope of this work [19,20,21]. The most important IM metric is arguably efficiency, which describes the variability of building responses given a particular value of IM. High efficiency means low variability and better predictability of structural response, making it straightforward to understand and use. Other IM metrics considered within this study are described in more detail in Section 2.3. When selecting an optimal IM from a selection of possible IM candidates, numerous NLDAs are typically conducted using real ground-motion recordings, and structural responses are obtained. For each ground motion record, all the considered IMs are calculated, and then the IMs are ranked based on their scores according to different IM metrics. The IM with the best score may be selected as the optimal IM, but always with respect to a particular IM metric. When selecting an IM, the purpose for which it is selected is always important.
Within the performance-based earthquake engineering framework (PBEE) [22], developing vulnerability curves involves a multi-step process. First, seismic hazard is determined, where probabilities of exceeding a given IM value are calculated. Then, seismic demand analysis describes the relationship between IMs acting as seismic load and structural responses, represented by engineering demand parameters (EDPs), such as displacements or forces within elements. Structural responses are then linked to physical damage of the structure through fragility curves, which represent the probability of exceeding a certain damage level given an IM value [23]. Finally, using a consequence model, the achieved damage level is linked to losses of interest to obtain the vulnerability curve. With respect to the intended use of a particular IM, while most studies focus on determining optimal IMs for developing seismic demand models [24,25,26,27] or evaluating the seismic performance of structures, which often stops at the level of fragility curves [23], they rarely extend to losses and risk assessment, which is the final goal within the PBEE framework.
This study is a part of the research project 2BESAFE, aiming to develop new vulnerability models of typical buildings in urban areas, with an emphasis on vulnerable building types commonly found in southeastern Europe [28,29]. The new vulnerability models are intended for application in urban- and regional-scale seismic risk assessment projects in countries with similar building types [30,31]. Therefore, it is of particular interest for the 2BESAFE project to investigate the impact of using different IMs for developing vulnerability curves. Seismic hazard assessment results are commonly given in terms of IM, so it is important to select an optimal IM that minimizes the uncertainty in seismic input, an important goal for improving the reliability of seismic risk assessment results. Investigating the effect of various IMs on the shape of the vulnerability curve and developing vulnerability-based IM metrics to capture this impact is of particular interest. In this way, an optimal IM selection could be performed based on their impact directly on the vulnerability curves, and not on the intermediate results within the PBEE framework, such as seismic demand models. Additionally, one of the goals of the 2BESAFE project is to develop a target retrofitting methodology, where retrofitting solutions would address only the critical structural elements in order to postpone or change the main failure mechanisms [32] to improve the performance and safety of the buildings at minimal cost [33]. Comparing the vulnerability curves of existing and retrofitted buildings is an important part of evaluating the efficiency of applied retrofit solutions for reducing seismic risk. By using an optimal IM that can retain the most information about losses directly in the vulnerability model, the reliability of the developed vulnerability curves could be significantly improved, as well as other seismic risk outputs such as loss curves and, consequently, the risk assessment itself.
In this study, we propose a novel vulnerability-based IM metric to address the issue of optimal IM selection for developing new vulnerability curves. The new IM metric is based on the variance of the vulnerability curve and its first derivative, and it quantifies the extent to which the information about structural damage and associated losses is distinguished on the vulnerability curve when using a particular IM, as well as the impact of different IMs on the shape of the vulnerability curve. Based on previous research on building types considered within the 2BESAFE project [34,35], the unreinforced masonry (URM) building typology has been determined as the most vulnerable [28]. A case study is presented, where a typical URM building from Zagreb, Croatia, is selected. The building type and its numerical model are described. The ground motion records for conducting NLDAs are selected, and both traditional and new IM metrics are defined. NLDAs are performed using the IDA scheme, and 12 IMs are tested and ranked according to traditional and new IM metrics. Fragility and vulnerability curves are developed within the PBEE framework for all IMs. Finally, the new IM metric is assessed in terms of consistency with traditional IM metrics and its potential to select IMs that produce more detailed vulnerability curves, which could improve vulnerability models and the results of seismic risk assessments.

2. Materials and Methods

In this section, the methodology adopted for obtaining the optimal IMs is given. First, the URM building that is selected as a case study is described, and its numerical model is presented. Then, ground motion records for IDA are selected and scaled. Existing IM metrics are outlined, and a seismic demand model is defined. Finally, novel vulnerability-based IM metrics are defined, and a qualitative calculation example is given. A flowchart of the methodology followed in this study is given in Figure 1, and it is described in detail in this section. The calculation of new IM metrics is highlighted in purple.

2.1. Description and Modelling of the Selected Unreinforced Masonry Building

2.1.1. Description and Attributes of the Selected Building

When selecting a URM building from an urban area of southeastern Europe for a case study, it was important to select a typical building representative of highly vulnerable buildings in the area [36], with many near-identical buildings of this type throughout the city, according to the methodology of the 2BESAFE project.
An unreinforced masonry building type with a flexible wooden floor system was selected, for which a more detailed estimation of seismic input in terms of intensity measure (IM) is necessary. Buildings of this type are commonly found in the historical centre of Zagreb, Croatia, and comprise 52% of the building stock in this area [28]. They can also be found in other cities of southeastern Europe in similar configurations. These URM buildings were built at the end of 19th and beginning of 20th centuries in regular rectangular aggregate configurations according to the architectural and engineering practices in the wider continental region at the time, without considering any seismic design principles [37]. Nevertheless, a proper seismic gap between adjacent buildings does not exist. However, the effect of interaction between adjacent buildings with or without a seismic gap is not considered in this study. The issue of out-of-plane failure mechanisms is also important to mention, as these buildings feature flexible wooden diaphragms, and it was documented that the out-of-plane (OOP) failure was one of the dominant failure mechanisms during the recent Zagreb earthquake in 2020 [36,38]. These two issues are considered in detail in separate studies [39,40,41,42], where the considerable negative impact of OOP mechanisms on the fragility and vulnerability of similar URM typologies was discussed at length, along with mitigation measures, while building interaction may have both a positive and a negative effect on vulnerability depending on the configuration of the building aggregate. However, in this study, we are interested only in the relative comparison of different IM choices and not in developing final vulnerability models. Consequently, these considerations have been omitted.
The selected URM buildings are characterized by very similar geometry, construction practice, and material properties, and feature a lateral load-bearing structural system consisting of shear walls made of solid clay brick and lime mortar. Building information was acquired from the historical archives of the City of Zagreb using original designs and architectural drawings. The designs feature geometry typical of historical buildings in the area with only slight variations.
These buildings are rectangular in shape and regular in elevation. The area of shear walls in X (parallel to the street) and Y (perpendicular to the street) directions typically varies between 6 and 13% of the gross floor area, respectively, with a characteristic interior shear wall in X direction only and an inner staircase with shear walls in the Y direction. The structural walls are 45–60 cm thick, decreasing with height. There are two non-structural shear walls in the Y direction in each storey. The buildings typically consist of 4–5 storeys with heights of 3.8 m each and a partially embedded basement level. The timber floors transfer gravity loads only to the longitudinal walls and represent typical flexible floor systems. The basement features shallow brick barrel vaults with steel beams or concrete slabs. The foundations are made of concrete or masonry strips, while the roof comprises timber beams. Masonry material properties have been adapted from Atalić et al. [43] and the properties are shown in Table 1.

2.1.2. Nonlinear Finite Element Model of the Selected Building

A nonlinear model for the selected URM building type is presented here, and it is intended for performing multiple nonlinear dynamic analyses (NLDAs). It was decided that for the purpose of selecting an optimal intensity measure for this building type, a detailed model of a real building was not required. Instead, the available designs were unified in order to develop a simplified model that captures the most important building characteristics in terms of geometry, material properties, and structural and non-structural elements.
A fully spatial finite element (FEM) model was developed in ETABS (v20.3.0, build 2929) [44], shown in Figure 2 in a 3D view. The same figure shows the plan of a characteristic storey with dimensions and wall thickness values. The area of shear walls amounts to 17% and 10.13% of the gross floor area in X and Y directions, respectively. Floor system consisting of timber beams is approximated using homogenous shell elements of equivalent stiffness, assuming an adequate wall-slab connection. Timber roof is considered only as a dead load, and the basement is not considered. Possible out-of-plane behaviour of walls is neglected, as it is not the focus of this study. Modal analysis results shown in Figure 3 indicate regular behaviour in both directions, with the first two perpendicular translational modes and the third torsional mode.
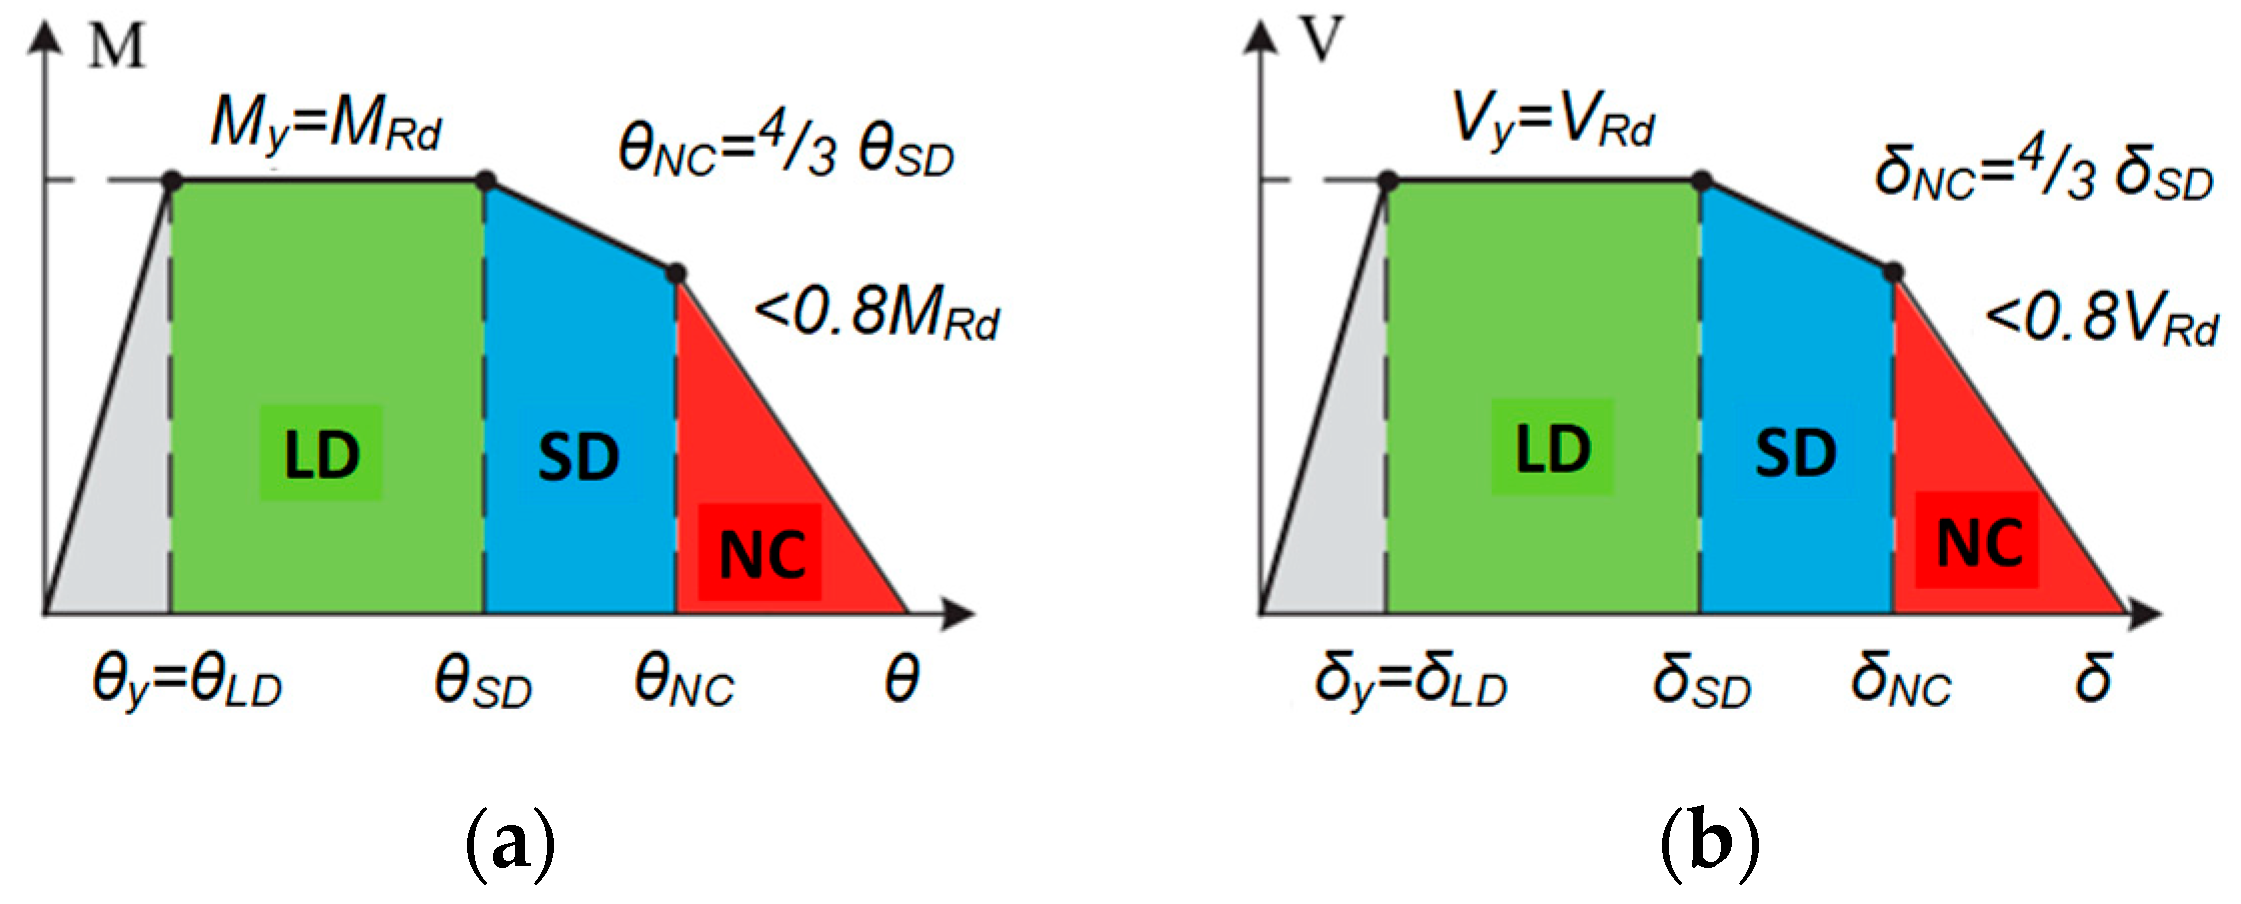
Material nonlinearity was introduced to the model to account for nonlinear behaviour at higher levels of seismic loading. It was decided to define shear plastic hinges lumped in the centre of each wall (pier), and moment hinges lumped at the ends of spandrels [37,43]. The spandrels were modelled as beam elements. Cracking of cross sections to seismic loads was considered by reducing shear stiffness by 50% (note that the modal shapes in Figure 3 are also obtained using cracked sections). Axial stresses in the walls were initially determined for permanent load combination in order to calculate the shear strength of walls according to Eurocode 8 [45]. These values were then used to determine the capacity curves (backbone curves) of shear and moment hinges shown in Figure 4, while acceptance criteria were defined according to Eurocode 8 as LD (limited damage), SD (significant damage), and NC (near collapse). These criteria describe the physical behaviour of plastic hinges. A hinge in the LD state has reached maximum capacity and undergoes plastic deformation, while a hinge in the SD state experiences a decline in capacity following the plastic deformation phase. NC state signifies further deterioration, leading to total loss of capacity.
The nonlinear building model described in this section was then subjected to multiple nonlinear dynamic analyses (NLDAs) using the incremental dynamic analysis (IDA) scheme [46] to obtain the relationship between seismic loads and building responses. Direct integration method (Hilber–Hughes–Taylor) was applied to solve the dynamic equation, with seismic loads acting simultaneously in both horizontal directions, omitting the vertical component, and using ground motion pairs as described in Section 2.2. A Rayleigh damping ratio of 5% was used for all analyses. Significant computational demand of these analyses is one of the main drawbacks of detailed analytical development of vulnerability models. For example, it took 2–3 days on average to complete 60 nonlinear dynamic analyses running simultaneously, using a workstation computer with an AMD Ryzen Threadripper PRO 5995WX 64-cores @ 3.50GHz processor and 256 GB RAM memory. For this reason, equivalent frame models are often used instead of FEM models for numerous time-history analyses because of significantly lower computational demands [47].

2.2. Selection and Scaling of Ground Motions for IDA Analyses

Given that Zagreb is located in an area characterized by compressional tectonics dominated by reverse faults, accelerograms generated from earthquakes on such faults were selected [48]. Ground motion records were selected for sites at a maximum distance of up to 30 km from the seismic source and magnitudes up to 7, as greater magnitudes have never been recorded in the area, and according to the best available seismic source knowledge, such magnitudes cannot be expected in the area. The records were also selected to conform to type 1 spectral shape according to Eurocode 8. A total of 13 pairs of ground motion records (in the X and Y directions) were selected. Among them, 11 were obtained from the Peer NGA-West 2 database [49], and 2 were from recent earthquakes in Zagreb (March 2020) [50] and Petrinja (December 2020) [51], both recorded at the same station in Zagreb. The earthquake in Petrinja occurred on a strike-slip fault and was chosen to account for the presence of such fault types that cannot be neglected. This record is the only one with a source-to-site distance greater than 30 km. The selected ground motions cannot be considered consistent with the seismic hazard at the location, as no hazard analysis was considered. This is one of the main shortcomings of the IDA method, which relies on using only a few records across all intensity levels with no limits to scaling factors and no formal consideration of seismic hazard.
Table 2 displays the seismotectonic parameters and intensity measure values of PGA, PGV, and Sa,avg (0.5 s–0.8 s) for the 13 original unmodified ground motion records in the X direction and the corresponding scaling factors. To describe the structural response uniformly at all levels of seismic loading, the records were uniformly scaled up to collapse based on intensity levels predetermined by a fixed set of PGA values. Firstly, all ground motion records were uniformly scaled to a fixed PGA value in the X direction of 0.1 g. Then, the records were downscaled and upscaled uniformly to PGA values (X direction) in the range of 0 to 0.25 g in equidistant increments of 0.025 g. The same scaling factors were used for both directions, meaning that the PGA values in the Y direction and the values of all other IMs in either direction were not equidistant. The scaling of records was achieved using the SeismoSignal and SeismoSpect software packages (v2024, release 1, build 2) [52]. Records RSN70_SFE, RSN4277_F, and RSN4457_M were additionally scaled up to 0.275 g, while UHS_ZG_22_03 and UHS_Petrinja were scaled up to 0.375 g and 0.4 g PGA in the X direction, respectively, to reach collapse.
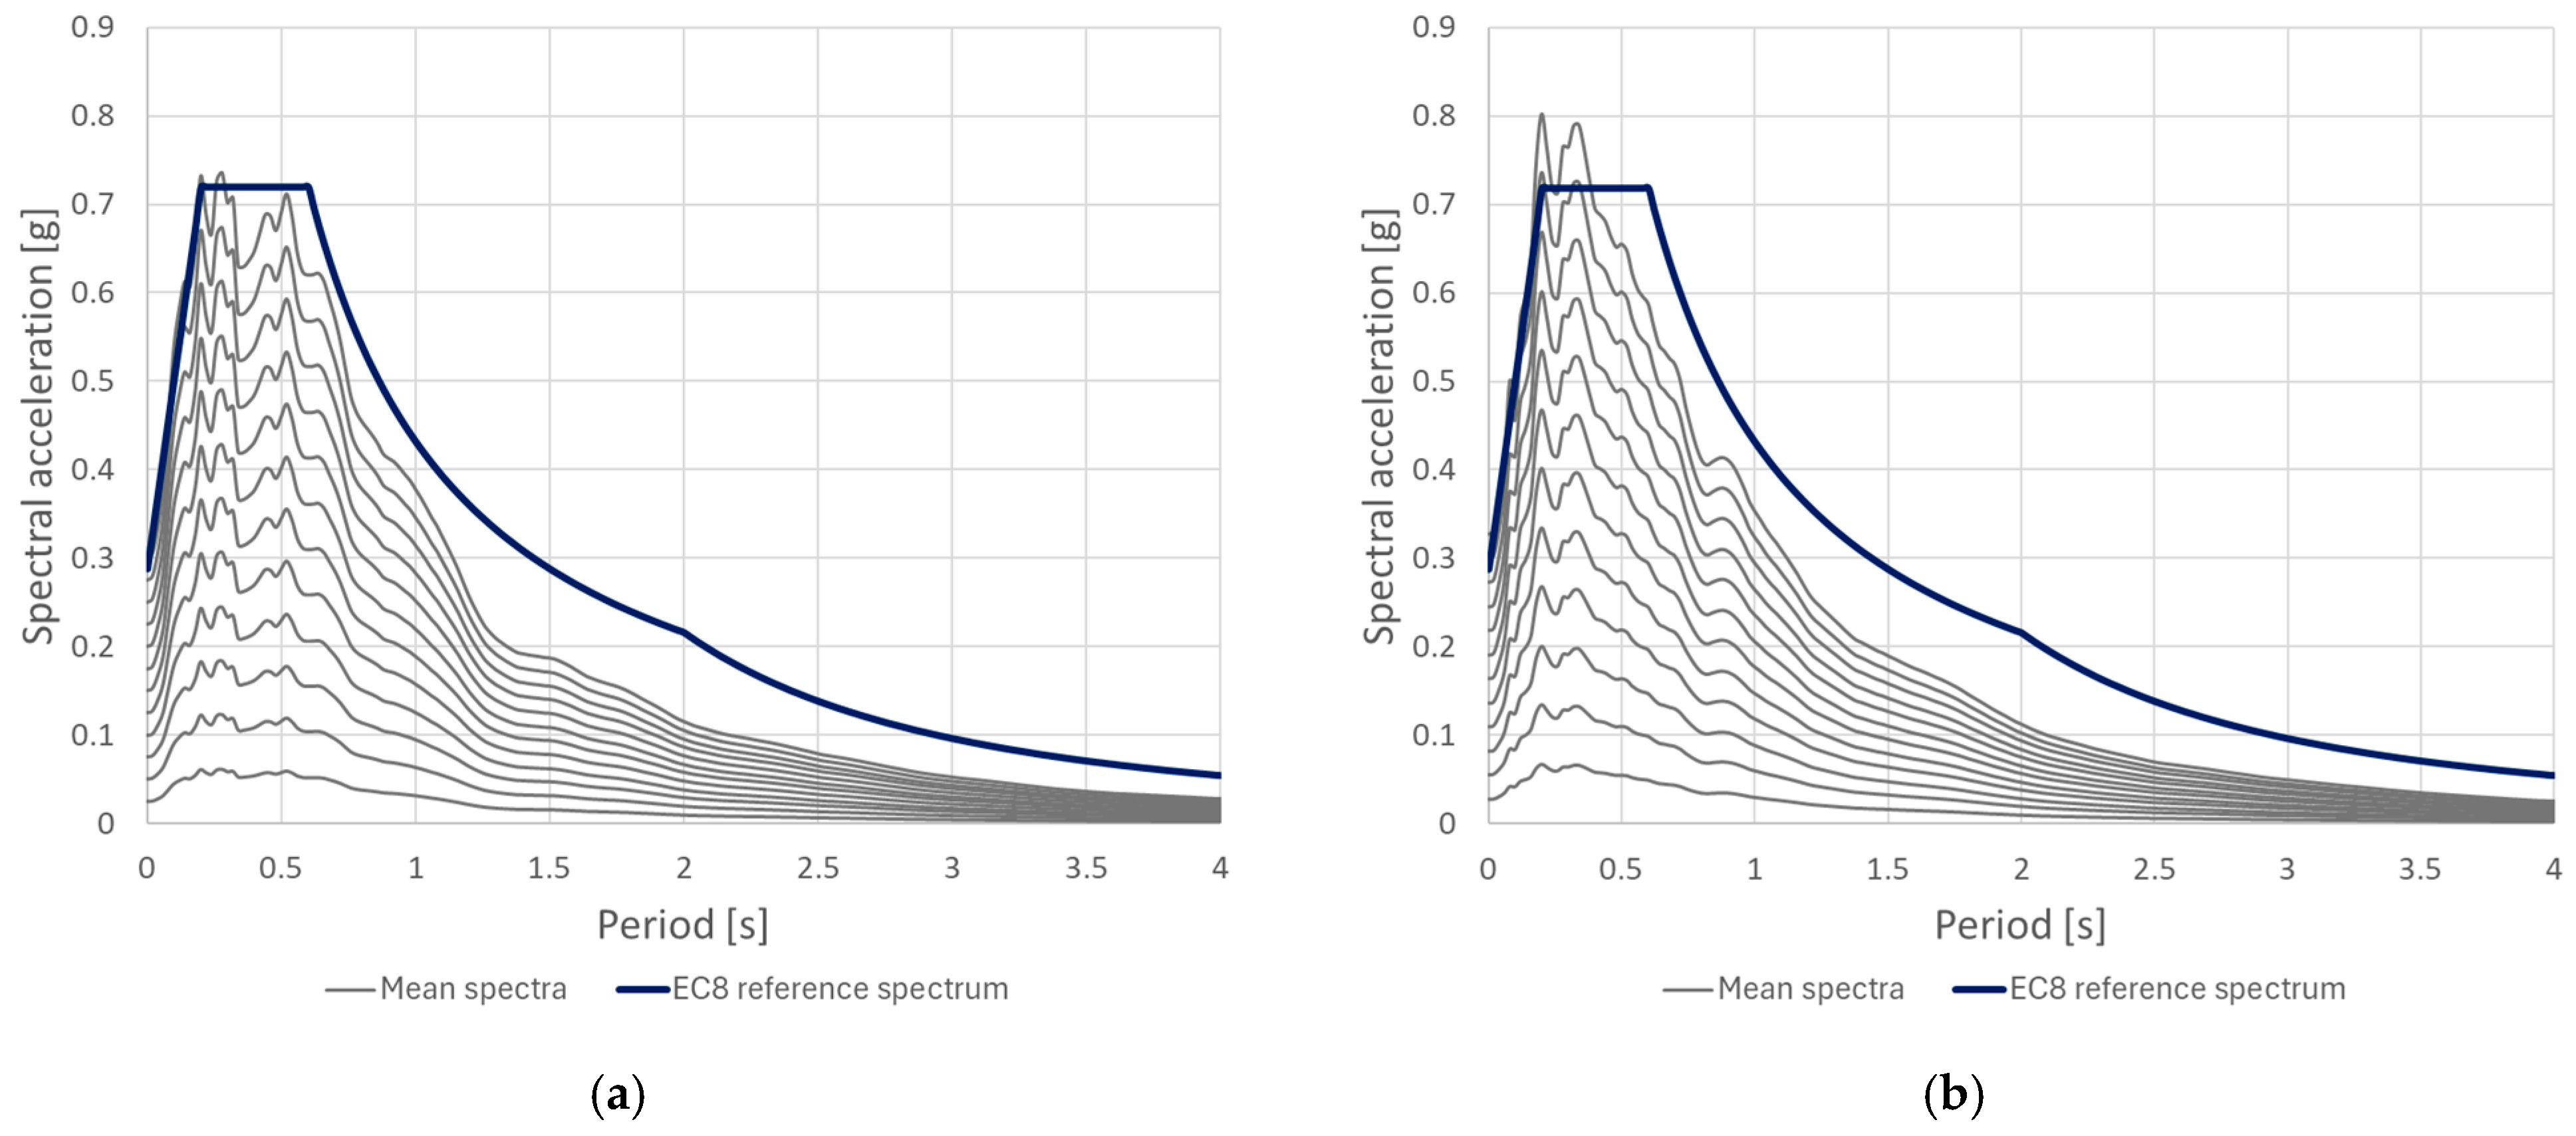
Figure 5 shows the mean elastic 5% damped spectra of all IDA records across all intensity levels separately for both directions, compared to the 5% damped Eurocode 8 prescribed elastic spectrum type 1 for the 475-year return period and soil type C with reference PGA value of 0.25 g that is characteristic for a representative location in Zagreb. A gradual increase in spectral accelerations is observed for each increment of seismic intensity, but the spectral shape of the mean spectrum remains the same. The mean spectrum for intensity level 0.3 g reaches the Eurocode 8 spectrum for the return period of 475 years. It is indicative of the selected building vulnerability that seismic loads just over the 475-year return period are enough for the building to reach collapse at a location with moderate seismicity.
In total, 144 pairs of scaled accelerograms were used as input loads for nonlinear dynamic analyses (NLDAs).

2.3. Optimal Intensity Measure Metrics and Seismic Demand Model

Multiple IM metrics have been proposed to determine the optimal IM, each accounting for the different consequences of using a particular IM in the performance-based earthquake engineering (PBEE) framework. In this section, we review some of the most used traditional IM metrics and explore their potential for guiding optimal IM selection for vulnerability models. We consider efficiency, proficiency, practicality, and hazard computability.
Efficiency describes the variability of the responses with respect to input loads (represented by IMs), while practicality represents the sensitivity of the response to changes in IM. Proficiency is a combined metric consisting of efficiency divided by practicality. Hazard computability ensures that a particular IM can easily be calculated using existing ground motion models (GMMs), as opposed to more complex IMs, for which hazard analysis would be more difficult to achieve. We also consider a recent IM metric, G-precision, which expands upon efficiency by also considering the goodness of fit in the seismic demand model [53]. There are yet other IM metrics of relevance in the literature that have not been considered here, such as sufficiency and scaling robustness [54], which appear to be less relevant when using IDA and scaled records. Sufficiency implies independence of responses from ground motion records’ seismotectonic characteristics (magnitude, distance, etc.), while scaling robustness represents independence of responses from scale factors applied to ground motion records.
In order to describe the IM metrics more explicitly, we consider a seismic demand model that describes the relationship between seismic loads (represented by IMs) and building responses. The building responses are commonly described in terms of engineering demand parameters (EDPs), such as displacements of points or interstorey drift ratios (IDRs) [55], which describe structural responses globally, or various damage indices [56], which describe responses of individual structural elements. We define the IM-EDP relationship as a power law:
E D P ^ = a · I M b ,
where a and b are regression coefficients obtained by fitting the NLDA results to the power law. If we can establish that the EDP responses have a lognormal distribution (which is usually a reasonable assumption), we may take the natural logarithm of Equation (1), obtaining the linear seismic demand model, which is typically used for describing the IM-EDP relationship, and can be written as follows:
l n E D P ^ = l n ( a ) + b · l n ( I M ) .
In this case, coefficients a and b can easily be derived by linear regression, using the least squares method, with standard deviation (dispersion):
σ l n E D P | I M 2 = i = 1 N l n E D P i l n E D P i ^ 2 N 2 ,
where l n E D P i ^ represents the EDP values predicted by Equation (2) and E D P i are individual results of N nonlinear dynamic analyses. The denominator N-2 ensures an unbiased estimation.
Finally, we consider the coefficient of determination R2 as a measure of the goodness of fit between IM and EDP. It describes the proportion of the variance in the responses (EDP) explained by the independent variable (IM), and may be written as follows:
R 2 = 1 i = 1 N l n E D P i l n E D P i ^ 2 i = 1 N l n E D P i l n E D P ¯ 2 ,
where l n E D P ¯ refers to the mean of natural logarithms of all EDP responses.
More complex seismic demand models are not considered in this study. Bilinear and other demand models may yield better fits in the nonlinear response phase [57] but would arguably not contribute to the ranking of IMs themselves in terms of IM metrics.
We may illustrate the considered IM metrics in terms of the defined linear demand model. Efficiency may be described as the dispersion σ l n E D P / I M of the linear regression model fit between IM and EDP. Lower dispersions imply lower uncertainty of EDP prediction given an IM, and, therefore, a more efficient IM.
G-precision is by definition [53] measured by the coefficient of determination R2, which has the same numerator as dispersion, and also a constant denominator for each IM. Therefore, it also represents efficiency. Additionally, it also explains how much of the EDP variance is accounted for by the demand model. As a measure of the goodness of fit, it explains how well the obtained seismic demand model could predict the responses given any (new) set of ground motion records. R2 yields values between 0 and 1, and a higher value means higher efficiency and better goodness of fit.
Practicality is measured by the slope b in the regression model. It represents the sensitivity of EDP responses to changes in IM input values. Low b indicates that the response does not depend much on a given IM, while high b indicates high sensitivity to changes in IM, which makes for a more practical IM.
If we conduct fragility analysis of NLDA results for a damage state with an onset threshold EDPlim, we may obtain its fragility function as a lognormal cumulative distribution function (CDF):
P E D P E D P l i m | I M = Φ l n a + b · l n I M l n E D P l i m σ l n E D P | I M ,
which may also be written as follows:
P E D P E D P l i m | I M = Φ l n I M l n E D P l i m l n a b σ l n E D P | I M b .
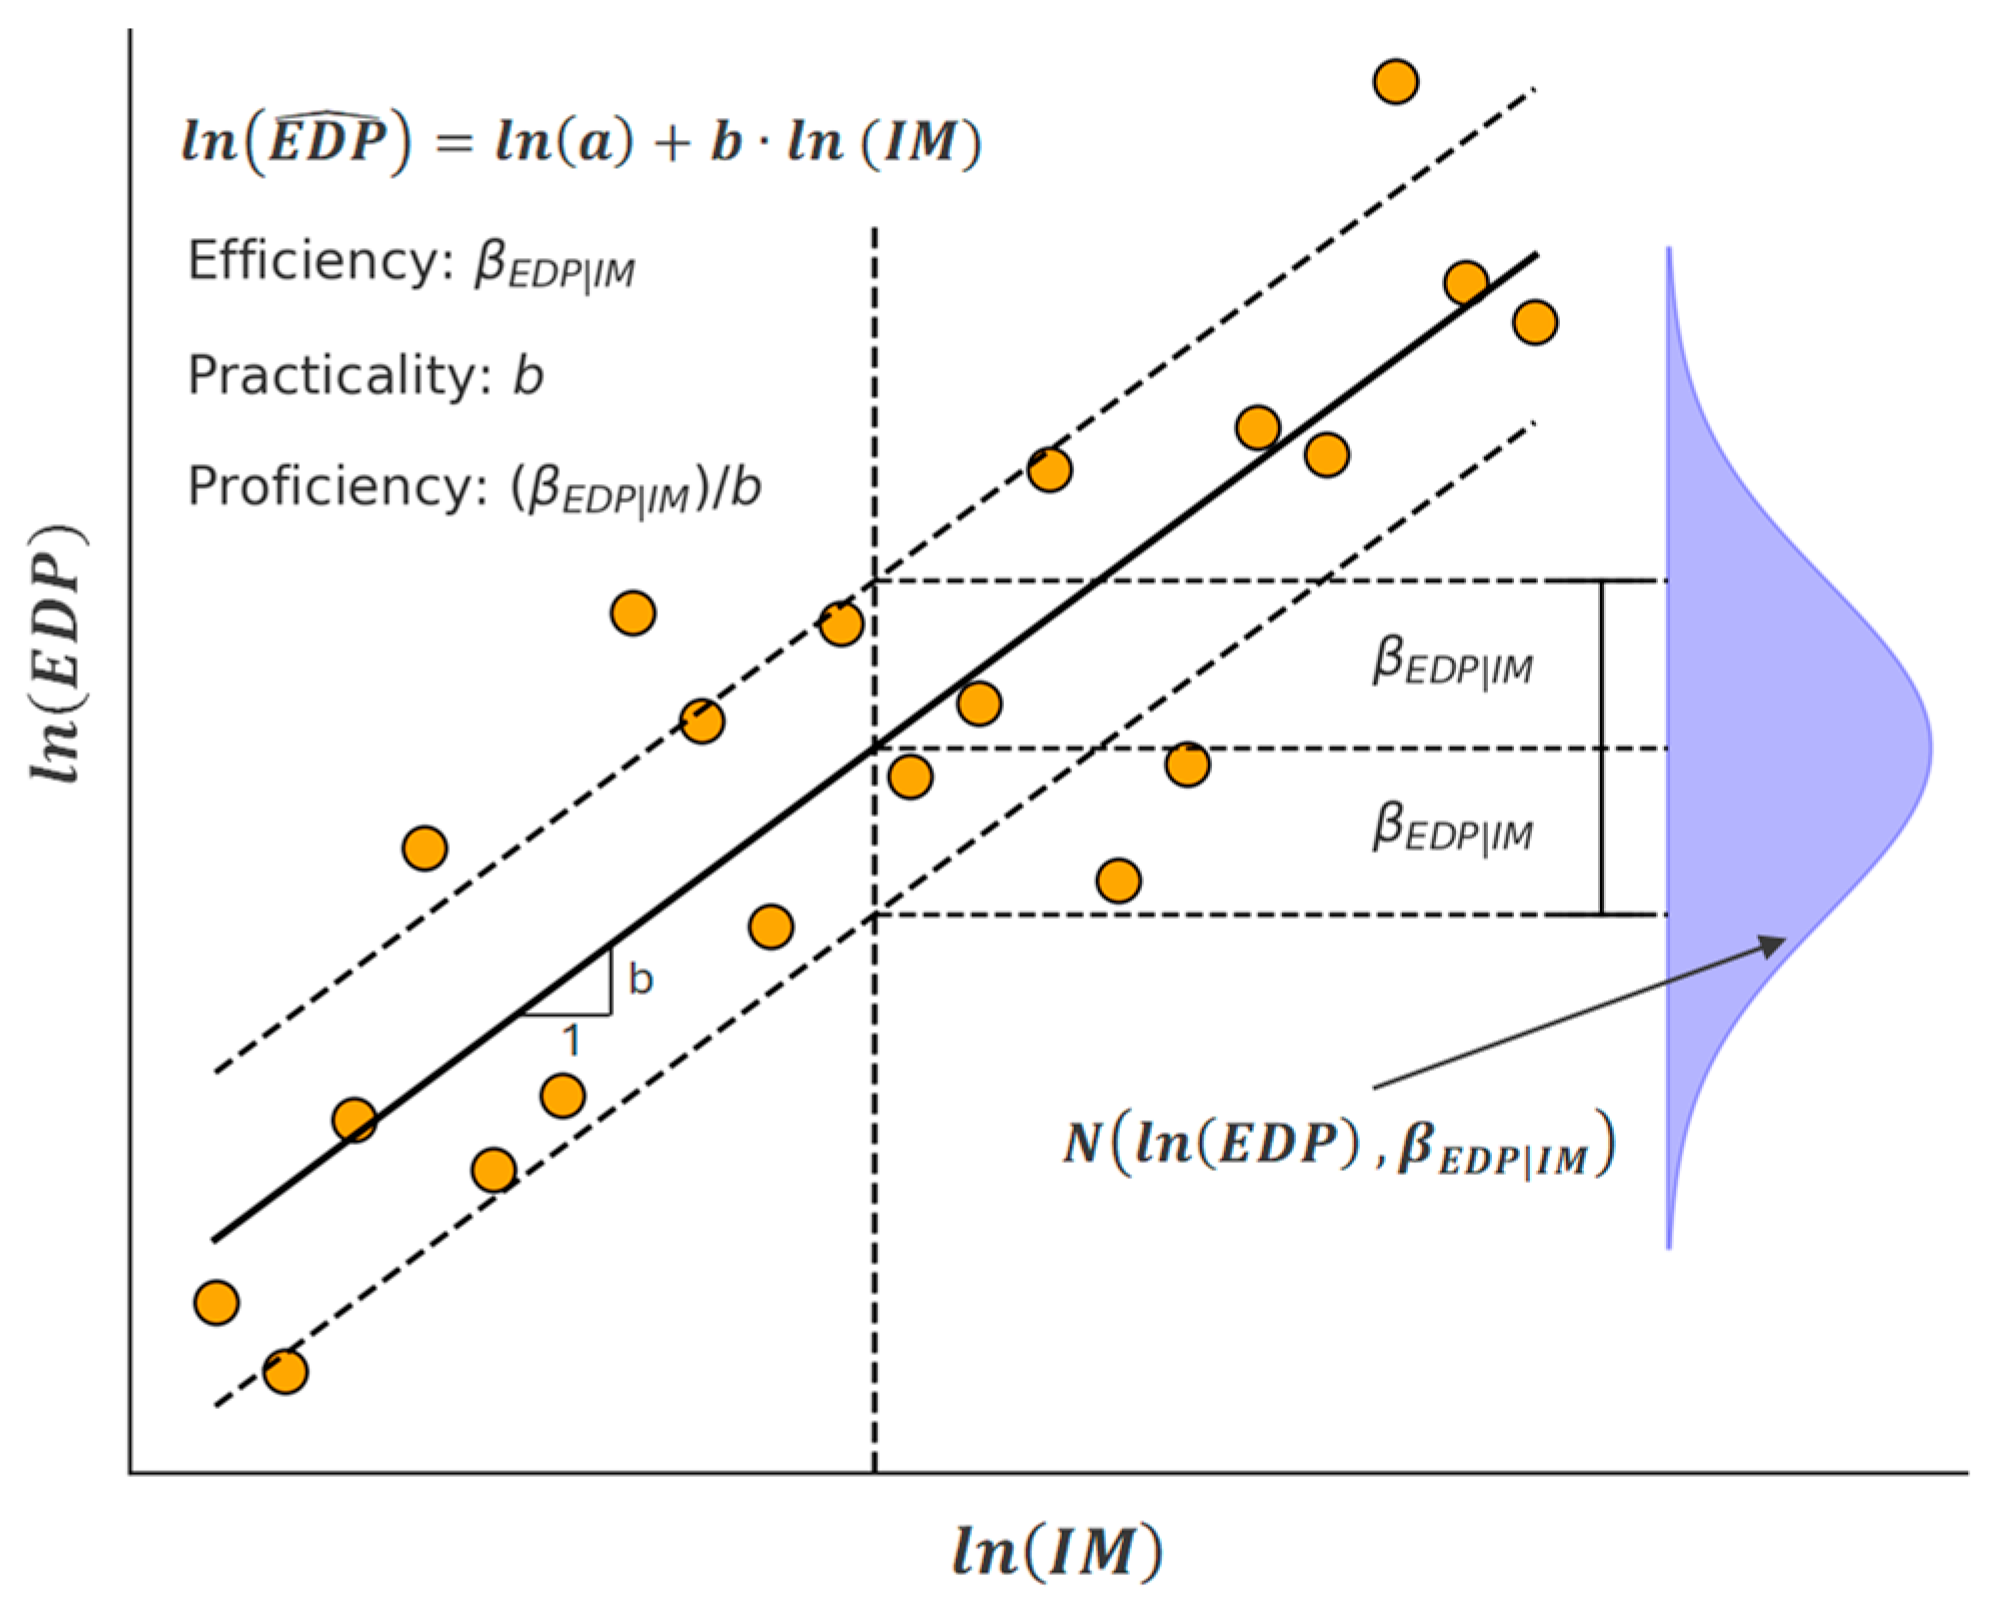
Proficiency is defined as efficiency divided by practicality ( σ l n E D P | I M / b ), which appears in the denominator in Equation (6) as the dispersion of the CDF. We observe that proficiency measures the precision of the fragility function. More proficient IMs produce fragility functions with steeper slopes and better separation between damage states when using multiple fragility functions. The IM metrics described above are qualitatively shown in Figure 6.
Hazard computability is accounted for by considering only the more common IMs, for which GMMs already exist or are easily computed from other simpler IMs. With the goal of developing new vulnerability models in mind, we aim to use the best-performing existing IMs so that the new vulnerability models may more readily be made available for seismic risk assessments. All the considered IMs are listed in Section 3.2.

2.4. New Metrics for Optimal IMs Based on Vulnerability Curve Variance

Keeping in mind the final objective of the 2BESAFE project, the development of new vulnerability models of typical highly vulnerable buildings in urban areas, with a particular focus on unreinforced masonry buildings as one of the most vulnerable building types, we are interested in investigating the impact of different IMs on the vulnerability curves. For developing new vulnerability curves, we are using the conditional multi-step approach, specifically the PEER’s performance-based earthquake engineering (PBEE) framework. It consists of four main steps: hazard analysis, demand analysis, damage analysis, and loss analysis. The details of these steps can be found in Deierlein et al. [22] and FEMA P-58 guidelines [58].
The impact of different IMs on the final vulnerability curves has not been sufficiently investigated, as vulnerability curves represent an output concerning loss analysis, which is the last step within the PBEE approach, while traditional methods of finding the optimal IM typically involve only the demand analysis step, as this is where the structural responses based on IM inputs are directly calculated [59]. After seismic demand analysis, the next step involves deriving fragility curves, which introduce physical damage as an additional metric of building response. Finally, by assigning a consequence model to each damage state (DS) of interest, vulnerability curves may be derived. Building damage may be described by different scales, and the losses of interest connected to damage also vary greatly, both with respect to the damage scale used and the loss metrics themselves. Therefore, the vulnerability curve does not depend only on the seismic inputs, but also on the choice of damage scales and the losses of interest. This is why in investigating the impact of different IMs on the vulnerability curve, we must use the same damage scale, consequence model, and loss metrics consistently throughout the analysis.
Based on IDA curves obtained after performing NLDAs using the ground motion records as described in the preceding subsections, fragility functions for EMS-98 damage states DS2–DS5 [60] using the IM-based approach [61] were developed. IDRavg was selected as the EDP to describe structural responses [62]. IDRavg is a global EDP that aims to capture global building behaviour. It may underestimate responses for high damage states as it can be lower than an individual IDRmax,i. However, it mitigates the high localized damage at a single storey by averaging over all the storeys and thus provides a more stable correlation with global building damage (see Section 3.1.1). Local component-based EDPs, such as various damage indices based on displacements and energy, provide more details on damage to individual elements but introduce additional complexity in terms of criteria for transitioning from local to global damage, which are beyond the scope of this work.
IDRavg thresholds were defined for each of the EMS-98 damage states for the considered URM building type as follows: 0.07%, 0.17%, 0.40%, 0.80%, and 1.18% for DS1–DS5, respectively. These values have been adopted from Inarritu et al. [63], where they have been determined by using an advanced damage index calibrated to experimental data of over 100 experiments on URM wall specimens.
Mean damage ratio (MDR) was adopted as the loss metric, defined as the ratio between the total cost of repair and the total replacement cost of the considered building. Losses due to contents and non-structural elements were neglected, considering only direct economic losses due to structural damage. Furthermore, a discrete deterministic consequence model was adopted by assigning fixed losses (MDR) to each EMS-98 damage state as 0%, 10%, 30%, 60%, and 100% for DS1–DS5, respectively. Similar values have been used in previous seismic risk assessments for the city of Zagreb and are appropriate within the scope of this work [30]. Since MDR for DS1 is 0%, fragility curves for DS1 are not computed.
Finally, (mean) vulnerability curves were developed by combining the fragility curves for all damage states with the consequence model, according to Baker et al. [2]:
E M D R | I M = i = 1 5 E M D R | D S = d s i   P D S = d s i | I M
where we sum, over all the damage states, the product of the probability of observing a particular DS (obtained from the fragility curve) and the expected losses (MDR) given that DS (from the consequence model) for each IM value. The variance (Var) of the vulnerability curve was also considered, defined as the sum of square errors, as follows:
V a r M D R | I M = i = 1 5 E M D R | D S = d s i E M D R | I M 2   P D S = d s i | I M .
The variance measures the dispersion of MDR values at a given IM level. It captures how far the expected losses (MDR) deviate from the deterministic loss ratios assigned to each damage state (DS2–DS5) by the consequence model. If the fragility curve at a certain IM level has probabilities distributed over multiple damage states, the variance will be higher because the MDR could vary significantly. If the probability distribution is concentrated in a single damage state, then the variance will be lower, as there is little uncertainty in the expected MDR. In short, variance reflects how much uncertainty exists in the vulnerability curve at each IM level due to the probabilistic nature of assigning damage states.
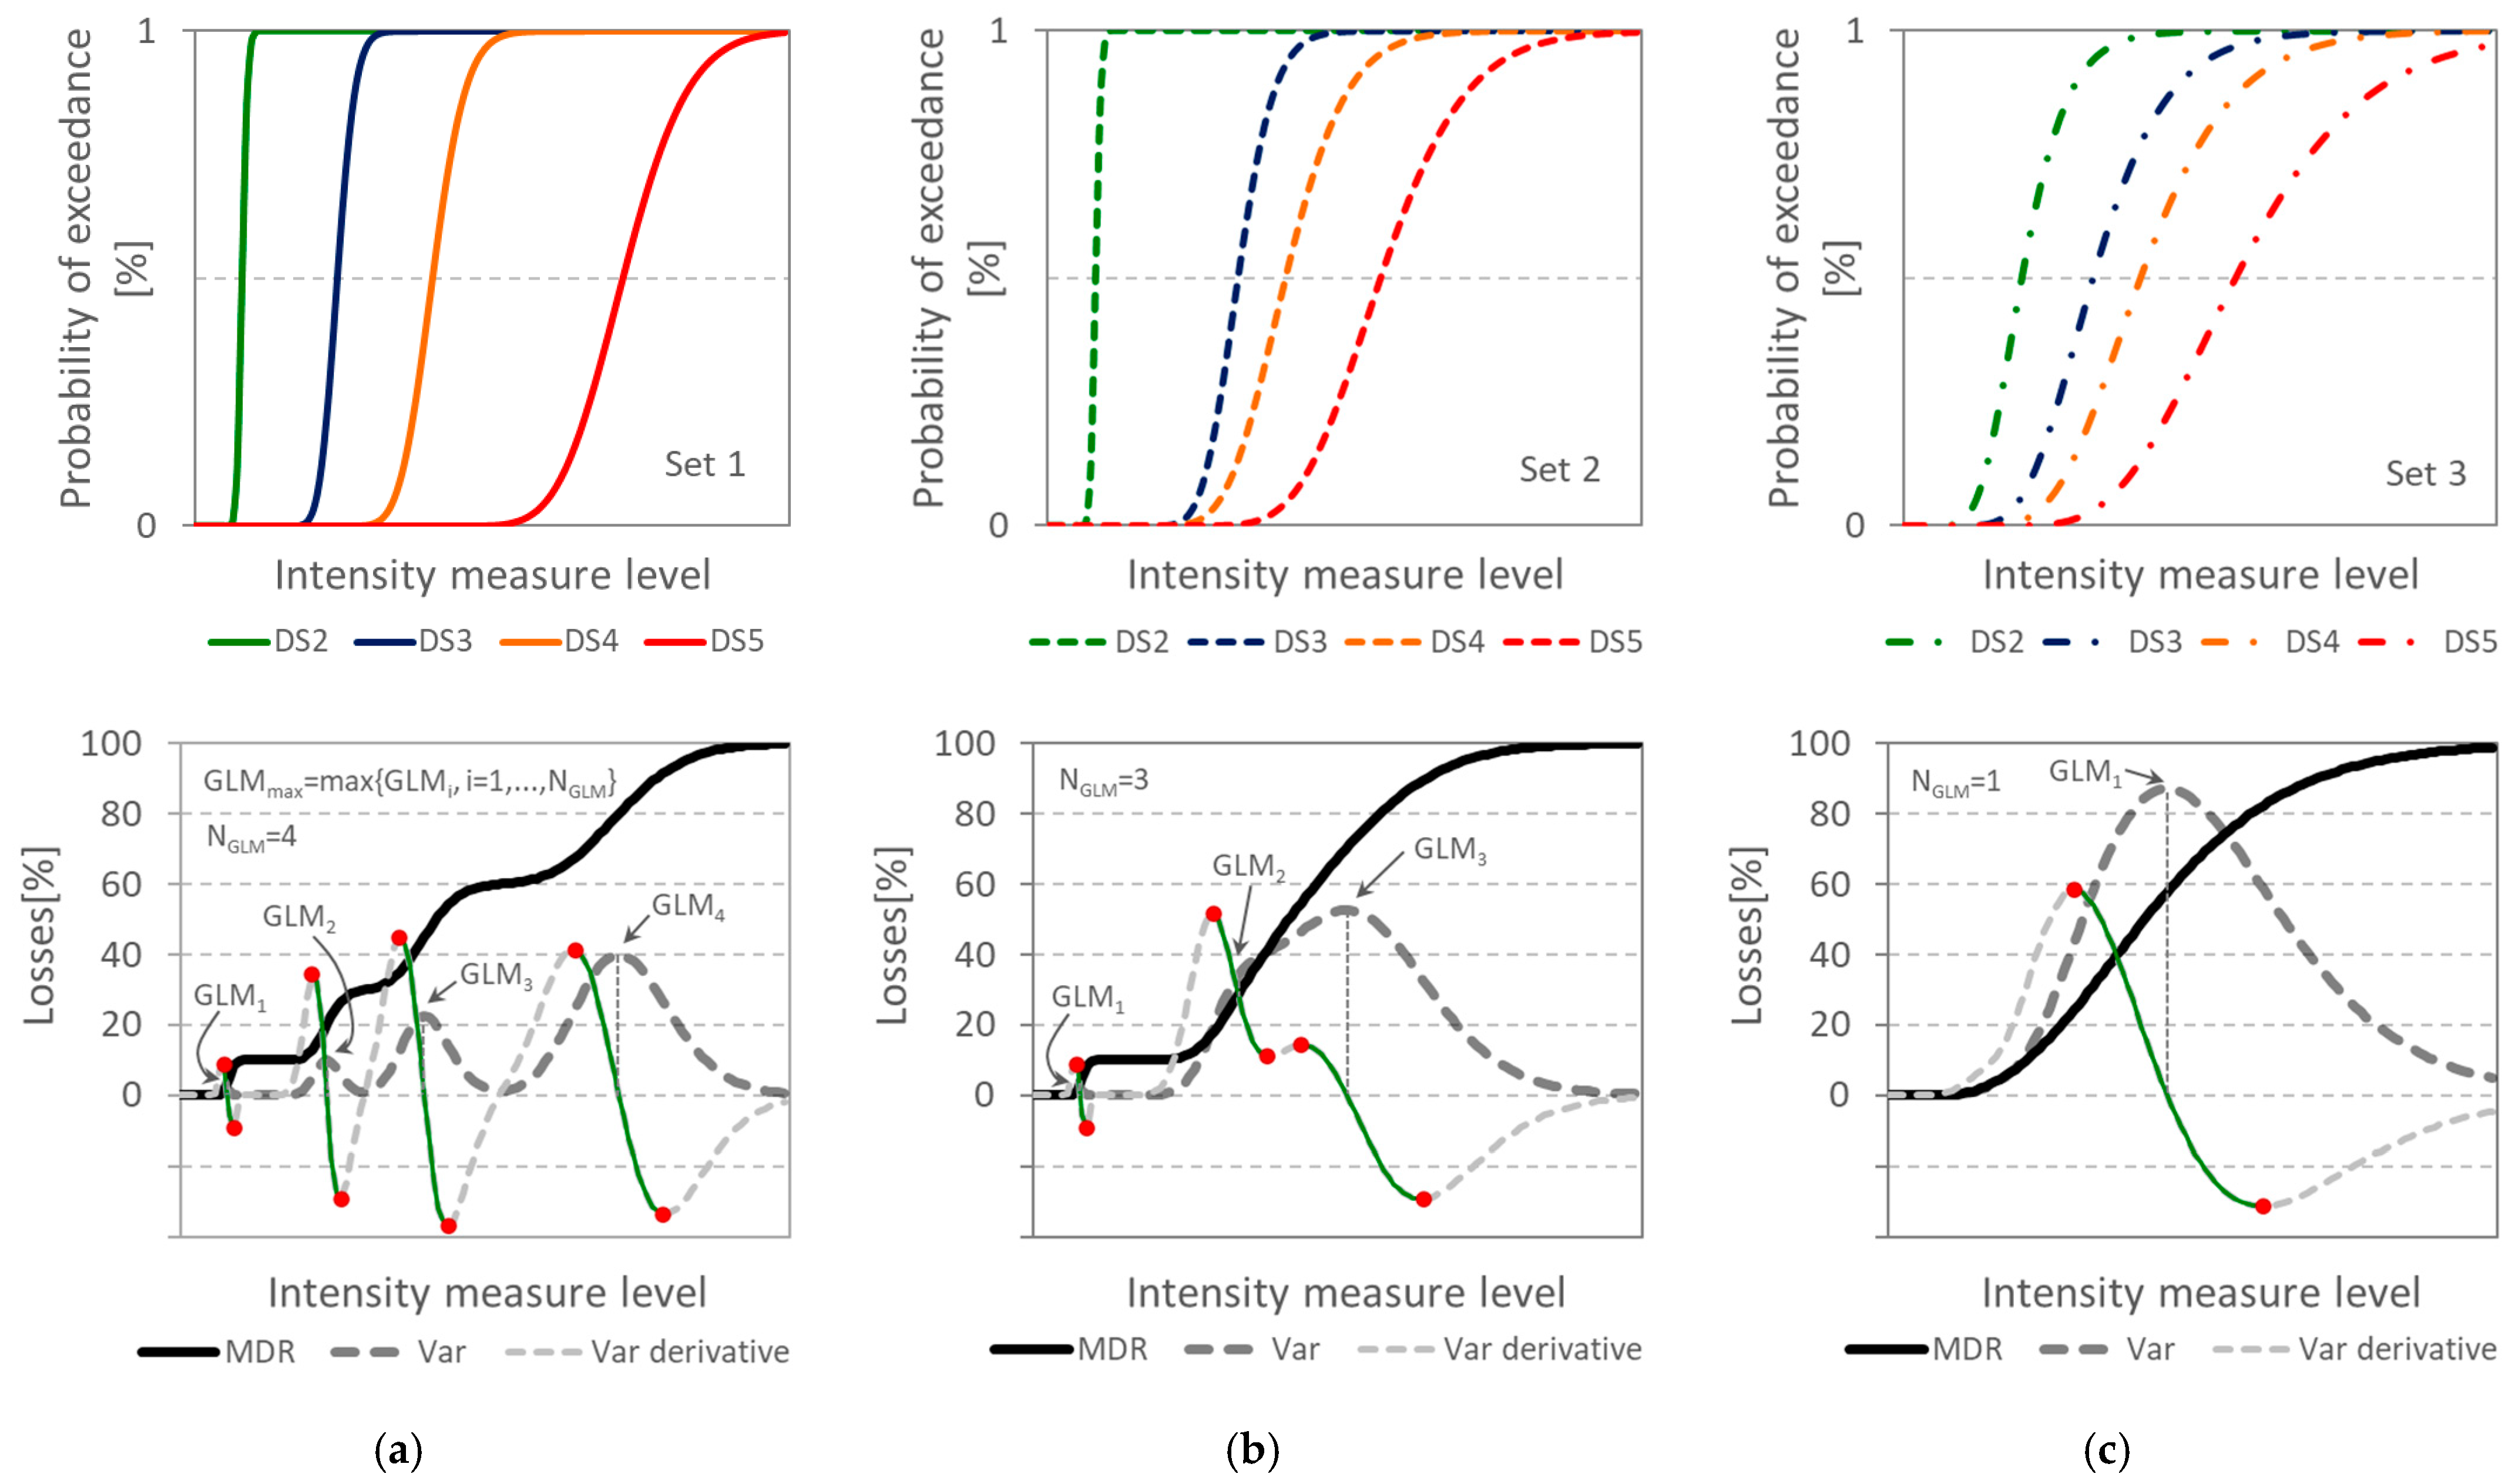
To further illustrate this point, Figure 7 presents three sets of generic fragility functions for DS2–DS5 and the corresponding vulnerability curves with their respective variances. Set 1 (Figure 7a) features small dispersions for all damage states. The distinction between the damage states is visible on the vulnerability curve in this case, as it behaves like a monotonically increasing step function, with constant values equal to the losses according to the consequence model for each DS. The variance in this case has a bell-like shape at each transition between adjacent damage states, and the local maximum of the variance represents the IM value at which the transition to the next DS takes place. We also observe that the variance maxima are higher and wider for higher damage states, reflecting the higher standard deviations of corresponding fragility functions. Finally, we observe four distinct peaks in the variance, each corresponding to one of the damage states, as they are clearly separated on the vulnerability curve, each with its own bell-shaped local maximum. The IM values at which the peaks occur indicate the intensity levels of the highest increase in losses and, therefore, in risk as well.
On the other hand, set 2 (Figure 7b) exhibits higher dispersions at higher damage states, while their median values μ are spaced more closely. This is reflected in the vulnerability curve as a loss of clear distinction between the damage states, as the probability distributions of different damage states overlap for a given IM level. The variance loses the distinct bell shape, the number of peaks is reduced to three, and the maximum variance value is increased. Set 3 (Figure 7c) features even higher dispersions and closer spacing of mean values. In this case, we obtain a vulnerability curve that can no longer differentiate between the damage states. All the damage states are now lumped together in the vulnerability curve with a near-constant slope, and the variance features only one peak with a high value.
Considering these observations, we introduce the first derivative of the variance to examine the observed changes in more detail. In the case of set 1, each of the four variance peaks (associated with damage states DS2–DS5) is accompanied by a characteristic pattern in the derivative: a local maximum followed by a local minimum, with a zero-crossing in between (green line). The zero-crossing marks the IM level at which each variance peak occurs. In case of set 2, a similar pattern persists, but only two variance peaks remain while the other two disappear. The retained peaks correspond to DS2 and DS5, as they occur at approximately the same IM levels as before and exhibit the expected behaviour in the derivative. However, an additional instance appears in the derivative—a local maximum followed by a local minimum, but without a zero-crossing. This corresponds to a slight distortion in the variance curve, indicating a tendency toward, but not the formation of, a true local maximum. This behaviour arises because the fragility functions for DS3 and DS4 have close mean values and significantly overlapping probability distributions, causing the second and third peaks of the original set to merge. In the case of set 3, the variance features a single bell-shaped peak and only one instance of the derivative pattern—a local maximum followed by a local minimum with a zero-crossing.
To capture both realized and emerging peaks, we define the concept of a generalized local maximum (GLM). A GLM represents either a true local maximum or a trend toward it, a near-maximum. When a zero-crossing exists between the local maximum and minimum in the derivative, the GLM corresponds to the actual local maximum of the variance, located at the zero-crossing. When no zero-crossing is present, the GLM corresponds to the variance value at the IM level of the steepest slope between the maximum and minimum of the derivative. Furthermore, we define the total count of GLMs in the variance as NGLM. It measures how many damage states are detectable in the vulnerability curve and cannot exceed the number of defined damage states. Finally, we define GLMmax as the highest value among all GLMs in the variance. Higher values of GLMmax indicate higher uncertainty in losses with respect to the consequence model.
Given that the IM choice has a direct impact on the seismic demand model and, consequently, on the fragility functions, which in turn affect the shape of the vulnerability curve and its variance, we hypothesize that the IM choice also has an effect on the GLM values of the variance and the number of their occurrences NGLM, as illustrated in the above hypothetical example. Let us now assume that each of the three considered sets of fragility curves resulted from three different IM choices (IM1–IM3) for the same building. The GLMmax value is expected to be lower for better-performing IMs as the fragility functions produced by using these IMs should have lower dispersions and, therefore, higher efficiency. NGLM is expected to increase for better-performing IMs as they produce more separated fragility functions, so the vulnerability curve itself is expected to reflect this in more GLMs of its variance. In the above example, IM1 would be designated as the optimal IM, while IM2 would be a mid-performing IM. Finally, IM3 would be best to avoid if possible.
In Section 3.3, we calculated the GLM values and NGLM for each considered IM as additional vulnerability-based metrics for finding the optimal IM. Furthermore, we explored how these novel metrics compare to efficiency and proficiency. Finally, we proposed these novel metrics not only as scalar indicators of optimal IM choice for the purpose of developing new vulnerability models, but also as indicators of the quality of the obtained vulnerability curves, as vulnerability curves with higher NGLM and lower GLMmax better reflect the connection between losses and damage, which may also be reflected as more accurate seismic risk assessment results when such vulnerability curves are implemented.

3. Results

In this section, the results of the nonlinear dynamic analyses are shown in terms of the relationship between intensity measures (IMs) of ground motions acting as seismic loads and engineering demand parameters (EDPs) as the global seismic responses of the building. Local responses in terms of individual storey responses are also indicated. The building responses are statistically analyzed, and the distribution of responses is determined. Traditional IM metrics are calculated for all considered IMs, and the IMs are ranked and compared. Fragility functions and vulnerability curves are derived from IDA curves for all IMs, and new IM metrics GLMmax and NGLM are calculated. All IMs are compared against the new metrics.

3.1. Distribution of Structural Responses

For characterizing structural responses on a global scale, we have selected IDRavg as the EDP, calculated as follows:
I D R a v g = i = 1 n I D R m a x , i N .
where N is the number of storeys and IDRmax,i is the maximum interstorey drift of the ith storey. A total of 144 NLDAs were performed on the 3D model using the IDA scheme as described in Section 2.2, and 144 performance points (IM, EDP) were obtained and statistically processed.
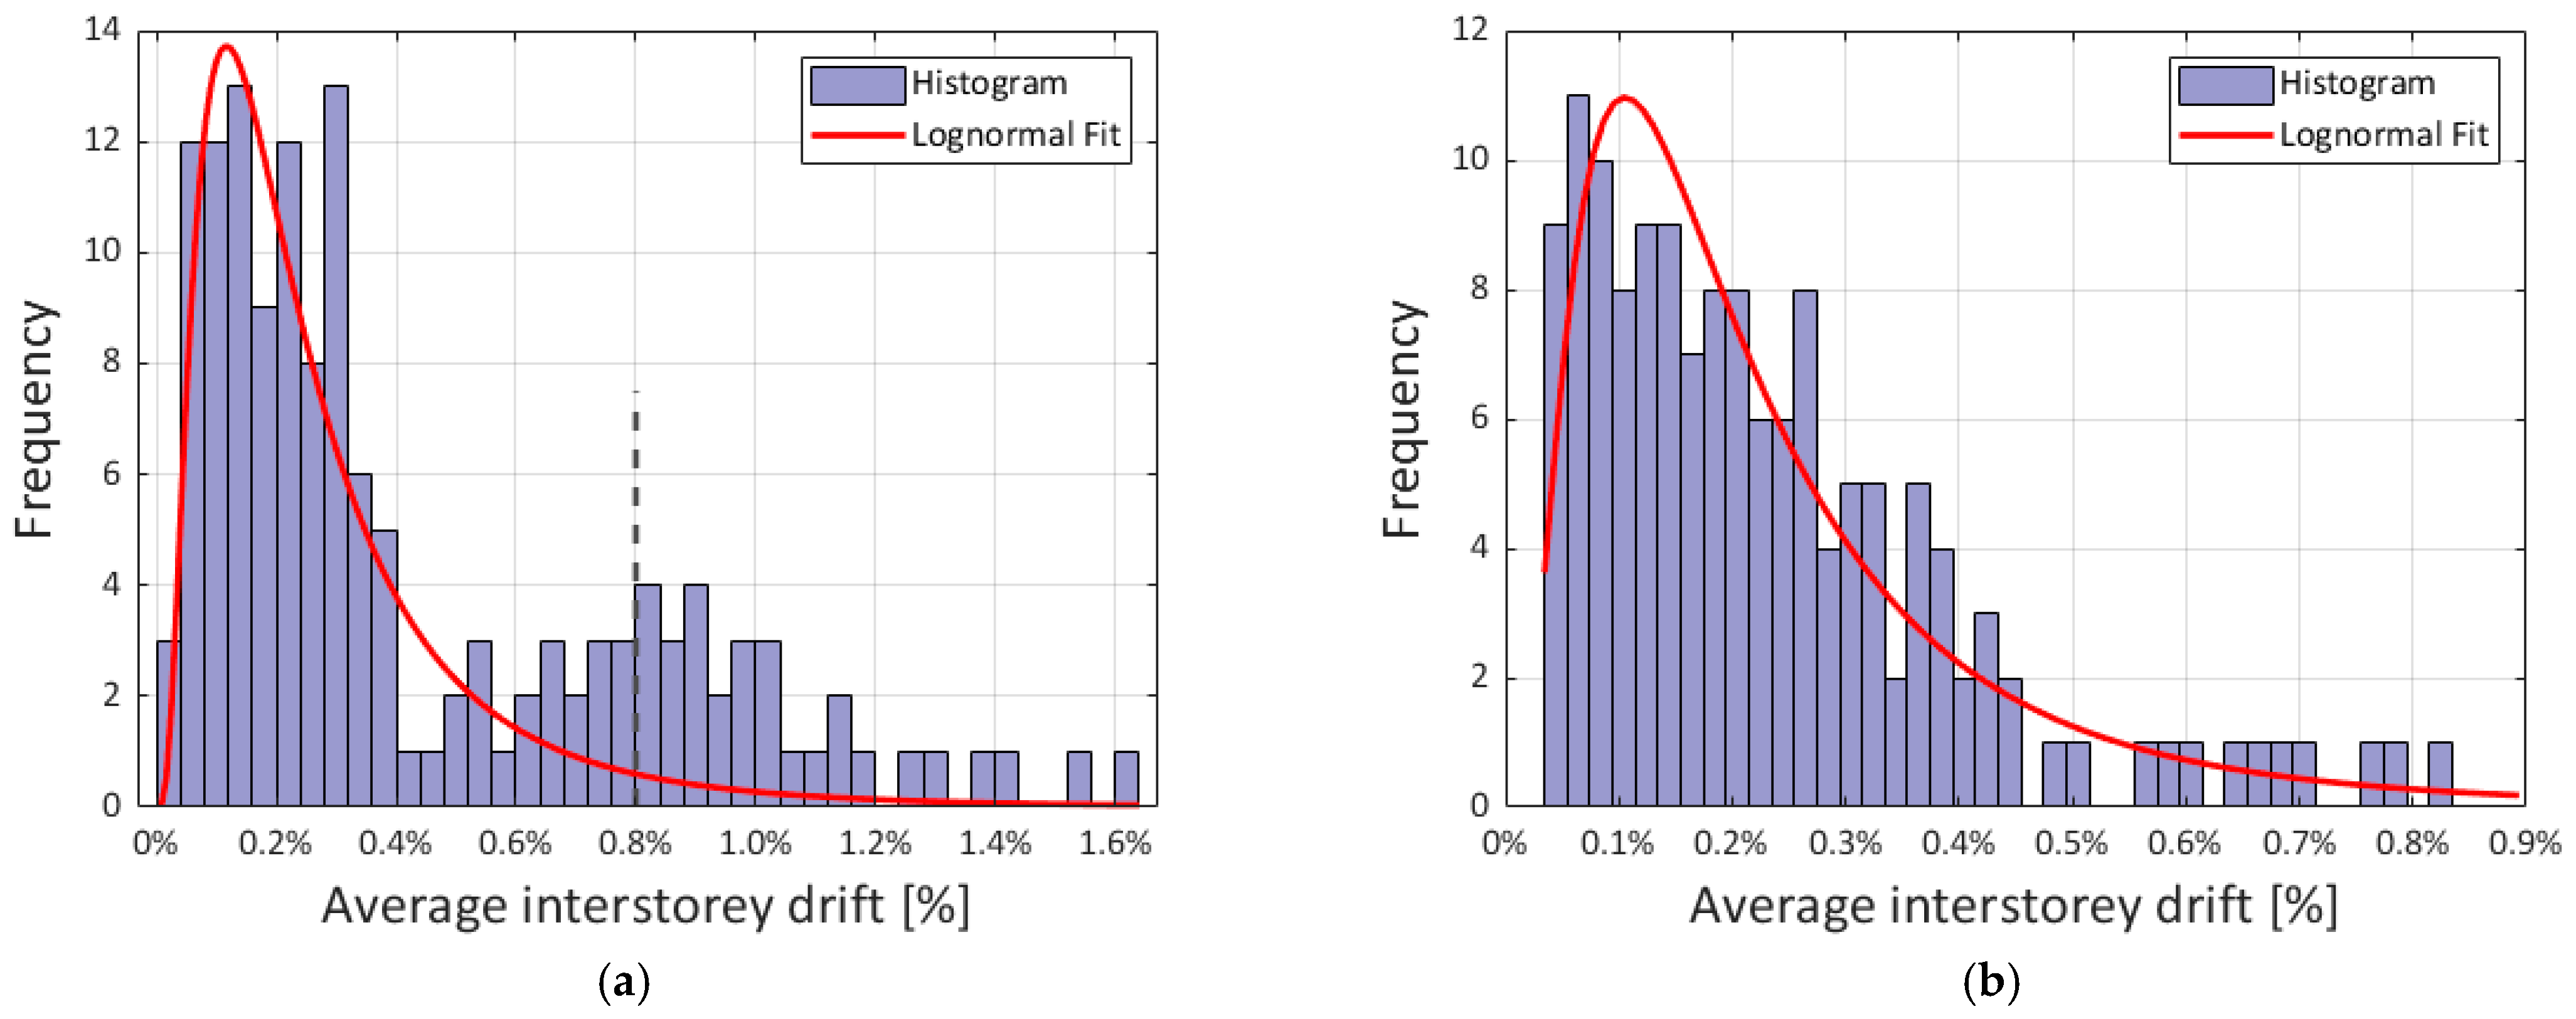
In Figure 8, the distribution of IDRavg for all analyses is shown, separately for the X and Y directions. It was shown by passing the Anderson–Darling test [64] that the obtained distribution in the Y direction may be considered lognormal, which provided justification to use the lognormal distribution assumption as described in Section 2.3. However, for the X direction, the Anderson–Darling test was passed only when considering responses up to around IDRavg = 0.8%. This value has previously been adopted as the DS4 threshold in Section 2.4. The distribution beyond this point may indicate dynamic instability cases in the numerical model, which causes IDRavg values to rapidly increase in the DS4–DS5 range and beyond.
Comparing the maximum IDRavg values in X and Y directions, we observe that some analyses are terminating with IDRavg values even above the 1.18% DS5 threshold in the X direction, while all responses in the Y direction have IDRavg values below 0.9%, with only one instance crossing the DS4 threshold of 0.8%. If we recall from Figure 5 that the seismic loads in both directions are roughly equal, we may designate the X direction as critical and more vulnerable for this building type. Since these building types are commonly built as regular row aggregates in the X direction, building interaction should be considered in more sophisticated analyses in order to better understand their joint seismic behaviour [41,42,65].

3.1.1. Behaviour of Individual Storeys

Through a more detailed analysis of IDA curves by storeys for individual records, we may gain further insights into the response of the structure. In Figure 9, IDA curves are shown for separate storeys for three ground motion records in terms of IDRmax versus PGA for the Y direction. We observe that record RSN4277_F causes gradually increasing drifts with higher slopes for higher storeys, while the other records produce more similar slopes across all storeys, except near collapse. The deformation line of the structure varies and depends on individual records. The structure has the capacity to respond in different ways, even for the same IM level.
Furthermore, we observe that record RSN359_C caused the collapse of the highest storey because it experiences a sudden increase in drift in the last increment, while the other storeys remain unaffected and continue to follow their own trend of gradual drift increase. The capacity is exhausted at the highest storey in this case. On the other hand, record RSN4457_M caused ground floor collapse at the highest intensity level, while the other storeys were unaffected. Both the collapse of the highest storey and of the ground storey occurred at roughly the same PGA value, but they are very different failure mechanisms when considering the building as a whole.
From these considerations, we take note that although our linear seismic demand model captures the relationship between seismic loads represented by IMs and seismic demand represented by a global EDP, failure mechanisms of the building may vary greatly due to different individual ground motion records, which appears to be difficult to capture with a conventional IM alone. However, the issue of identifying correct failure mechanisms is of interest in the scope of the 2BESAFE project, which aims to identify critical elements to be retrofitted and explore the impact of target retrofitting on vulnerability.

3.2. Seismic Demand Model and IM Metrics Results

In this Subsection, IDA is applied to the building model using ground motions from Section 2.2 in order to determine the optimal intensity measure of the selected unreinforced masonry building typology, using the optimal intensity measure criteria shown in Section 2.3.
All the considered intensity measures are presented in Table 3 and are calculated using the SeismoSpect software [52] for the specified set of ground motion records at all intensity levels. These IMs are commonly used in the literature [3]. This is carried out with applications in fragility and vulnerability modelling in mind, as more complex IMs, even if more efficient, tend to be unusable in seismic risk assessment applications.
Within the selected set of IMs there are representatives both in time and frequency domains, as well as measures based on kinematic quantities (acceleration, velocity, and displacement), energy, and ground motion duration. IMs based on acceleration characterize well the response of the building mass in terms of inertial forces, and those based on velocity represent the kinetic energy input and potential for energy dissipation within the structure, while measures based on displacements capture the sensitivity of the structural stiffness to seismic excitation. In this way, an optimal intensity measure also provides an additional insight into the behaviour of the structure.
There are other more efficient intensity measures available in the literature, such as the mean spectral acceleration weighted across specific dominant periods of the structure with weight factors equal to modal participation factors [19,59], but they are not considered due to their lesser hazard computability. In order to keep in line with the applicability of the research in seismic risk assessment calculations, vector-valued IMs are also not included in this study [20,66].
Table 3. All considered intensity measures with corresponding equations. Regression coefficients a and b are shown for the X and Y directions separately, as well as the coefficient of determination R2, standard deviation σ E D P / I M , and coefficient of variation C.O.V.
EDP: IDRavgDirection XDirection Y
Intensity
Measure
EquationabR2σC.O.V.abR2σC.O.V.
PGA [g] m a x u ¨ ( t ) 0.02931.10690.73310.21290.08410.00870.76000.75680.16080.0588
PGV [m/s] m a x u ˙ ( t ) 0.03821.16380.83370.16800.06630.01150.82770.85760.12300.0450
PGD [m] m a x u ( t ) 0.04620.72130.52720.28340.11190.01790.58920.60470.20490.0749
Arms [g] 1 t 0 0 t 0 u ¨ ( t ) 2 d t 1 2 0.20951.06050.71020.22180.08760.03970.76080.70440.17720.0648
Vrms [m/s] 1 t 0 0 t 0 u ˙ ( t ) 2 d t 1 2 0.17951.03130.74850.20670.08160.04400.78690.75550.16120.0589
IA [m/s] [67] c o s 1 ξ g 1 ξ 2 0 t 0 u ¨ ( t ) 2 d t 0.00920.73170.69720.22680.08950.00410.51120.69510.18000.0658
IC [56] A r m s 1.5 · t d 0.5 0.12550.90200.73180.21340.08430.02580.63140.72140.17200.0629
CAV [m/s] [68] 1 t 0 0 t 0 u ¨ ( t ) d t 0.00090.94830.66310.23920.09440.00070.78030.73330.16830.0615
HSI [m] [69] 0.1 2.5 P S V ( T , ξ ) d T 0.00801.07620.81280.17830.07040.00400.78180.81110.14170.0518
Sa,avg (0.5–0.8 s) [g] [70] 1 0.3 0.5 0.8 S a ( T , ξ ) d T 0.01761.21610.88990.13670.05400.00760.90600.90610.09990.0365
Sa(T1) [g] S a ( T 1 , ξ ) 0.01711.18080.90980.12380.04890.00700.84190.81370.14070.0514
Sa(T2) [g] S a ( T 2 , ξ ) 0.01151.08170.72500.21610.08530.00580.82240.86720.11880.0434
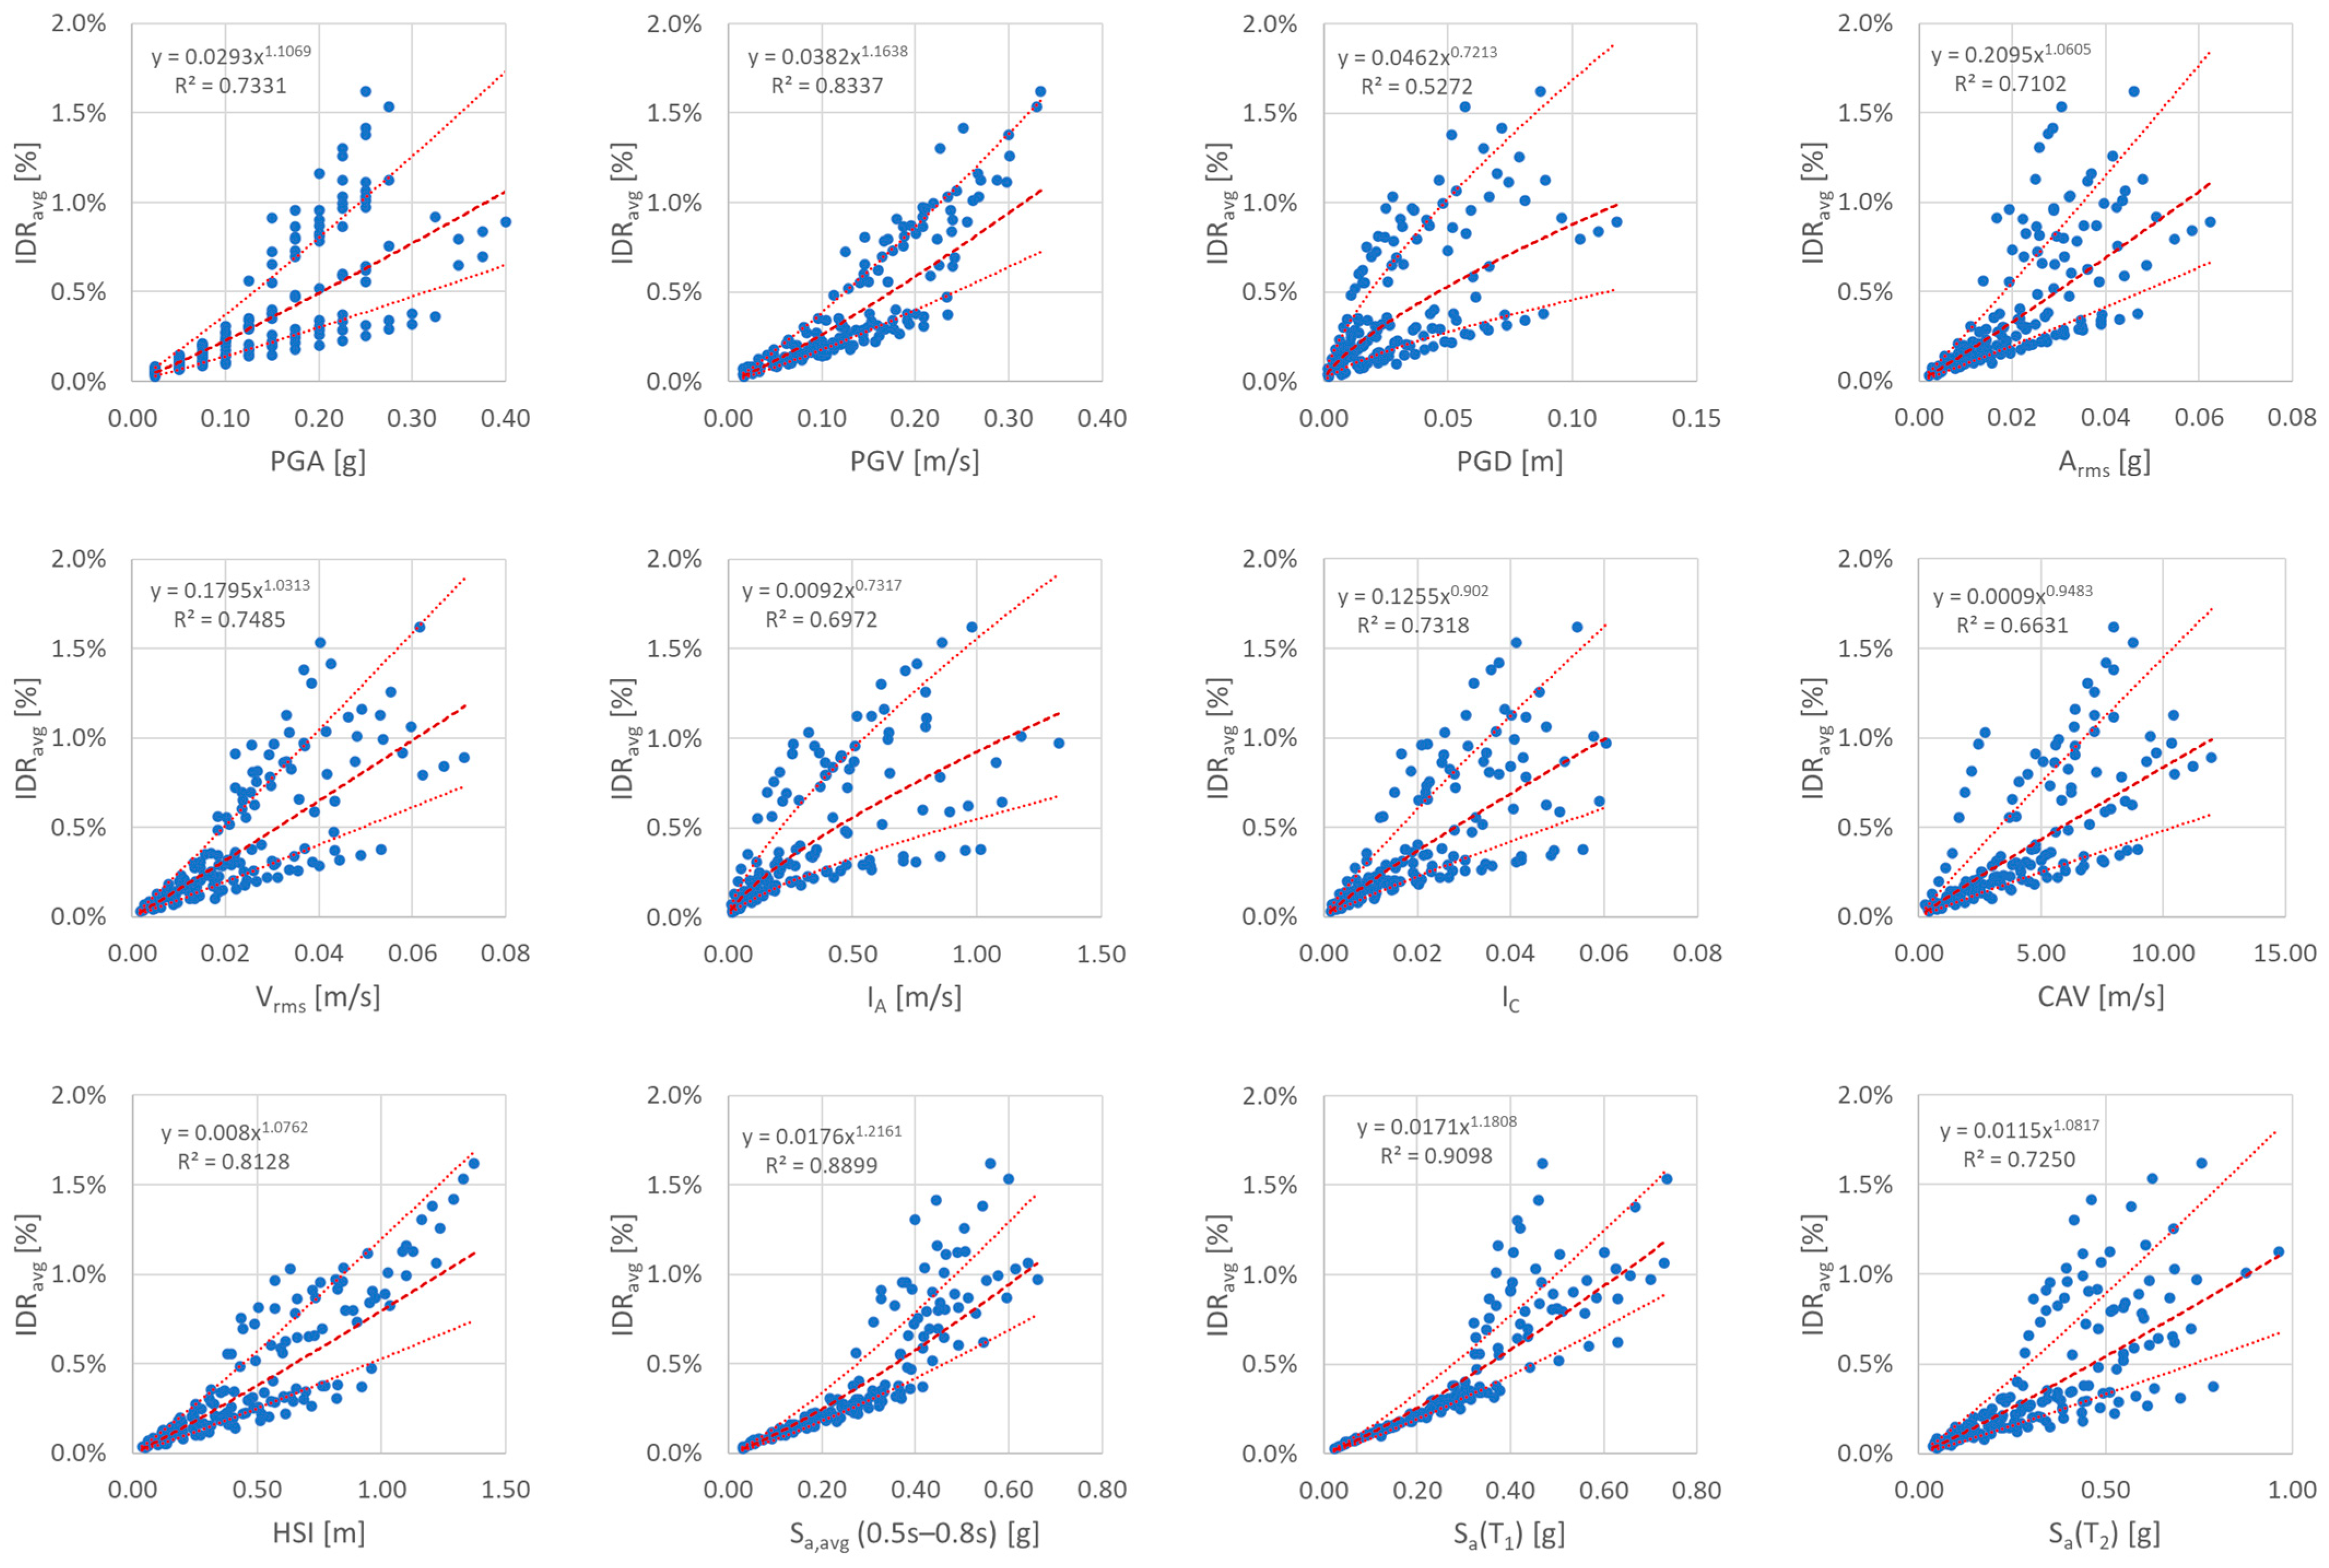
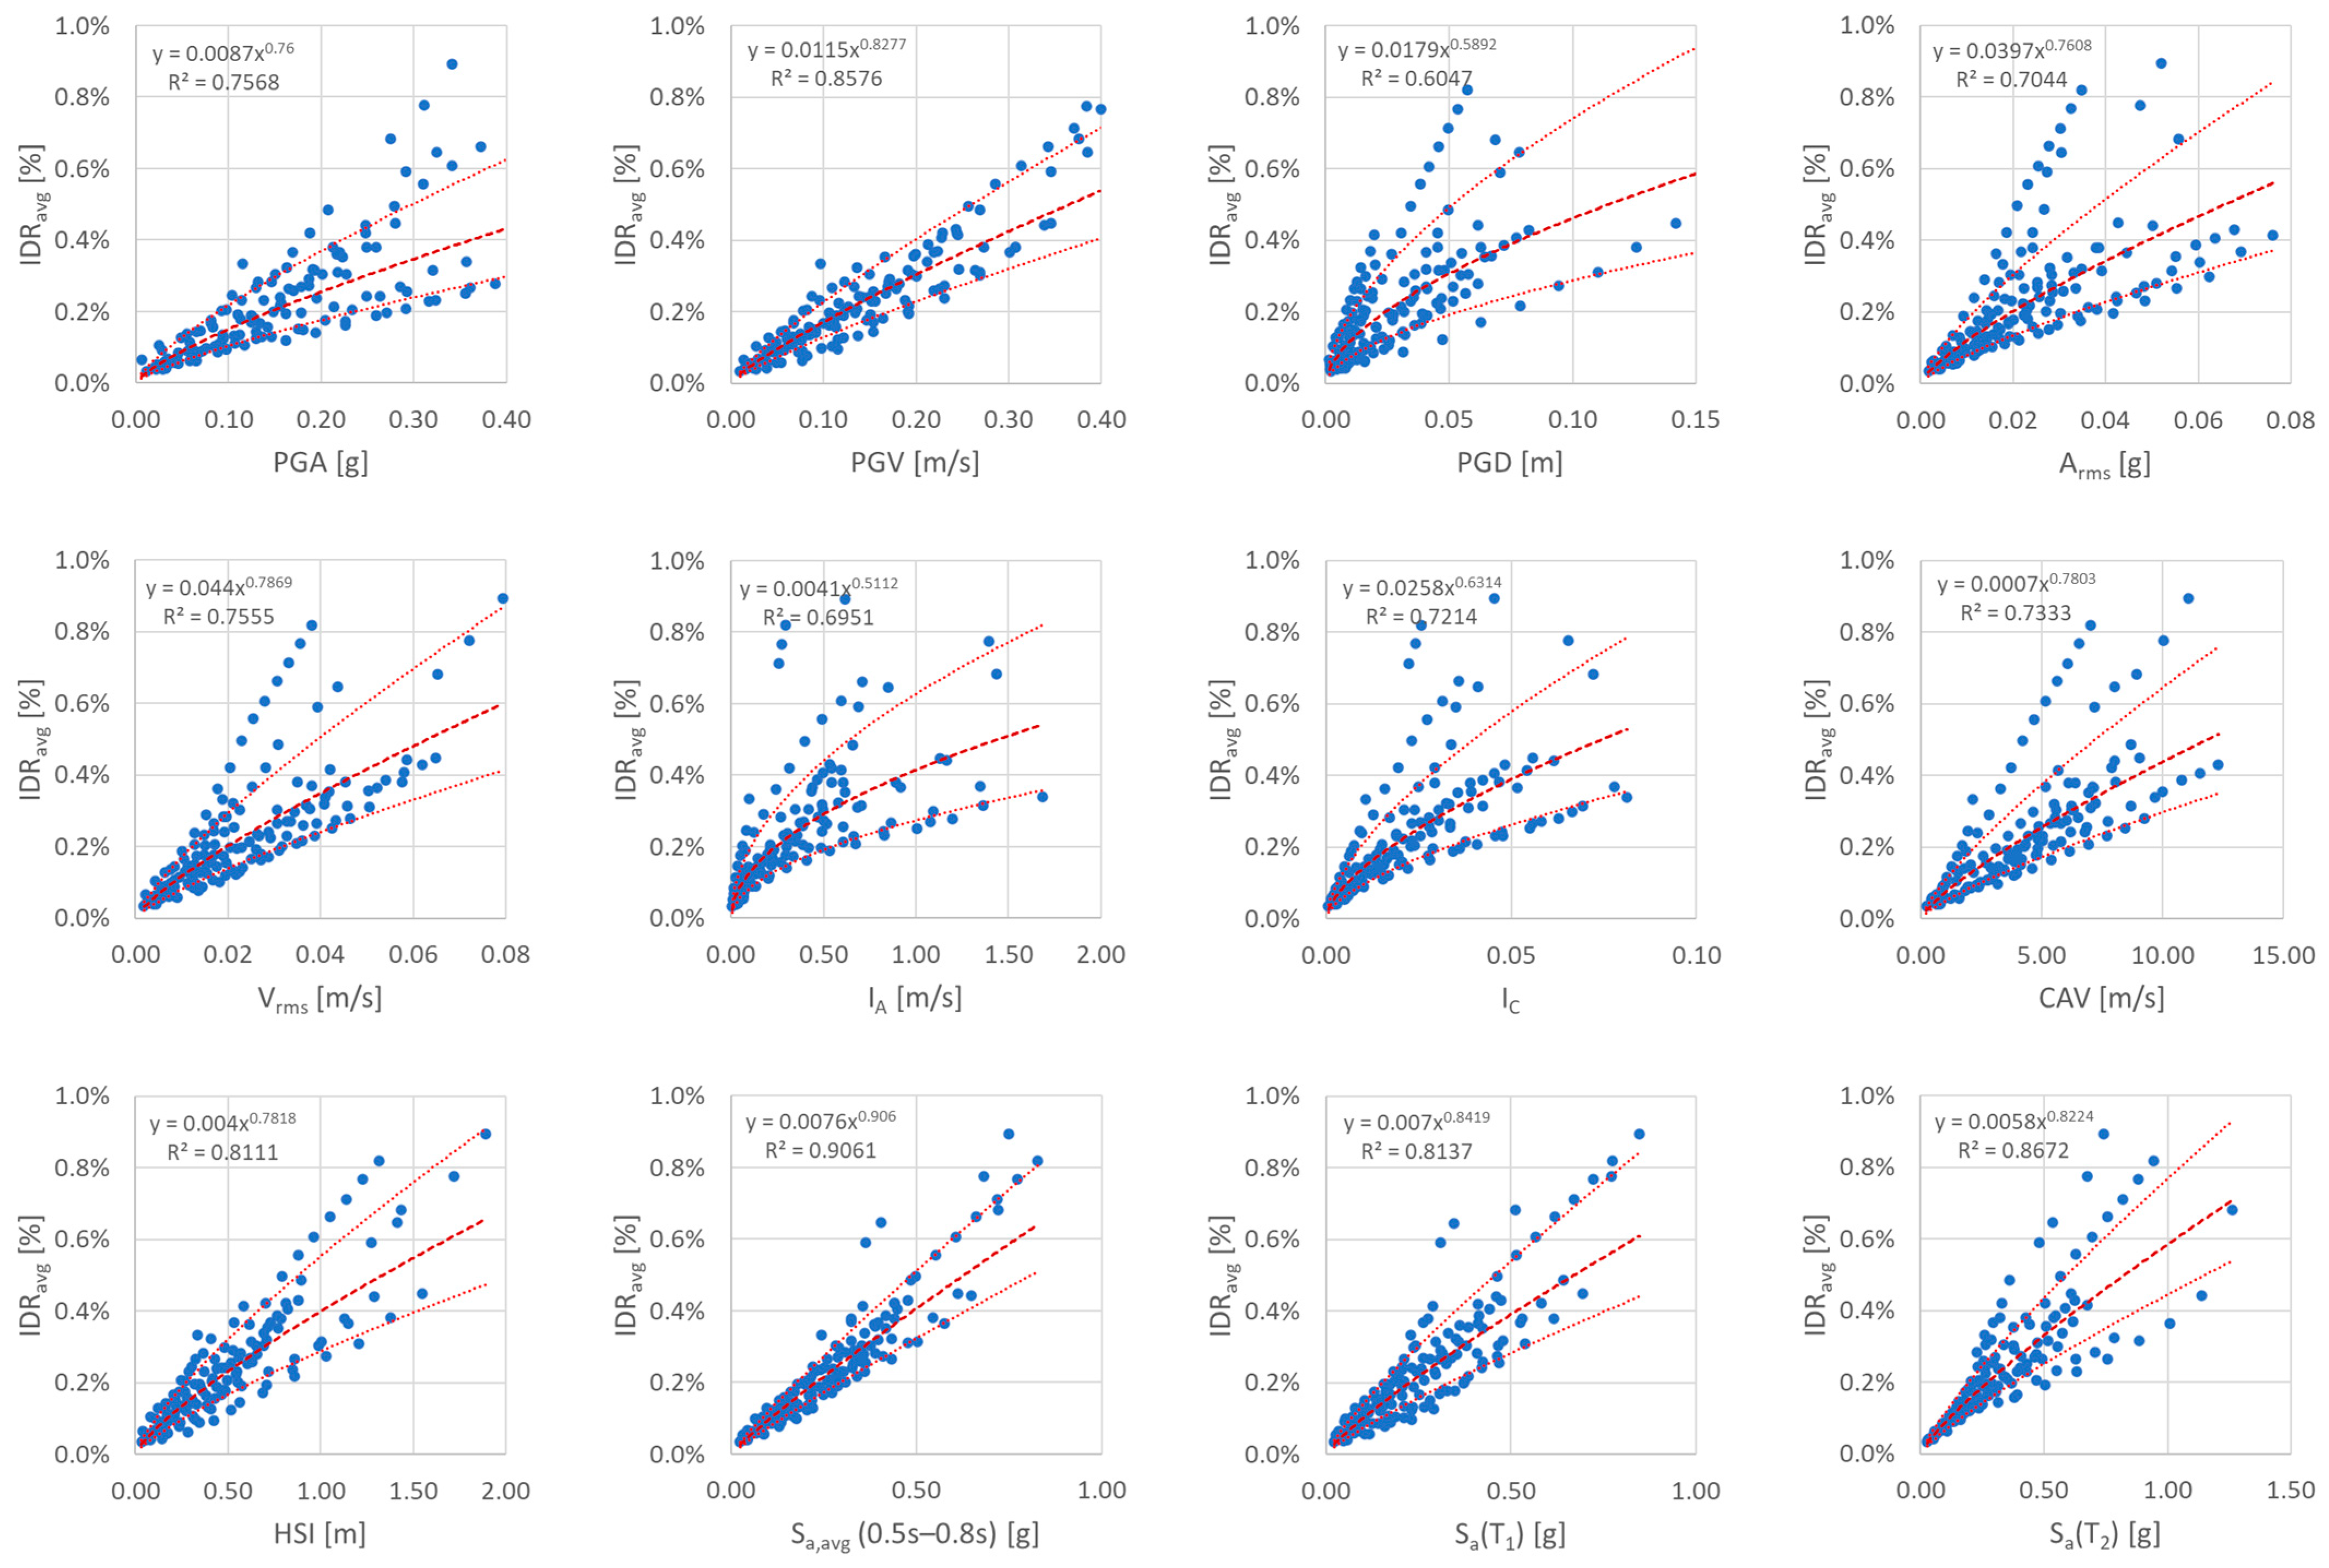
After performing the NLDAs as described in Section 2.3, the statistical analysis of all obtained performance points (IM, EDP) was performed, separately for the X and Y directions. For each different IM, the power law fit was obtained using the same EDP responses. The coefficients a and b of the power law fits are shown in Table 3 for both directions. Coefficients of determination R2, lognormal standard deviations σ E D P / I M , and coefficients of variation C.O.V. are also derived and shown, as they are key parameters for evaluating the efficiency, practicality, and proficiency of IMs.
Furthermore, the IM-EDP relationships in the original linear scale are shown in Figure 10 and Figure 11 for X and Y directions, showing both the obtained performance points using different IMs and the power law fits with coefficients a and b, as well as the power law fits within one standard deviation of the linear regression prediction. The original performance points in different plots correspond to the same set of IDA results. Only the IM is changed on the horizontal axis in post-processing. The linear regression coefficients were calculated using the real statistics plugin of MS Excel, while standard deviations, coefficients of determination, and variation were calculated according to Equations (3) and (4). The power laws of the uncertainty within one standard deviation of the mean were calculated using the same regression coefficients, but with EDP values in the logarithmic scale increased and decreased by one standard deviation, and then those values were brought back to the linear scale and the original power law Equation (1) was used.
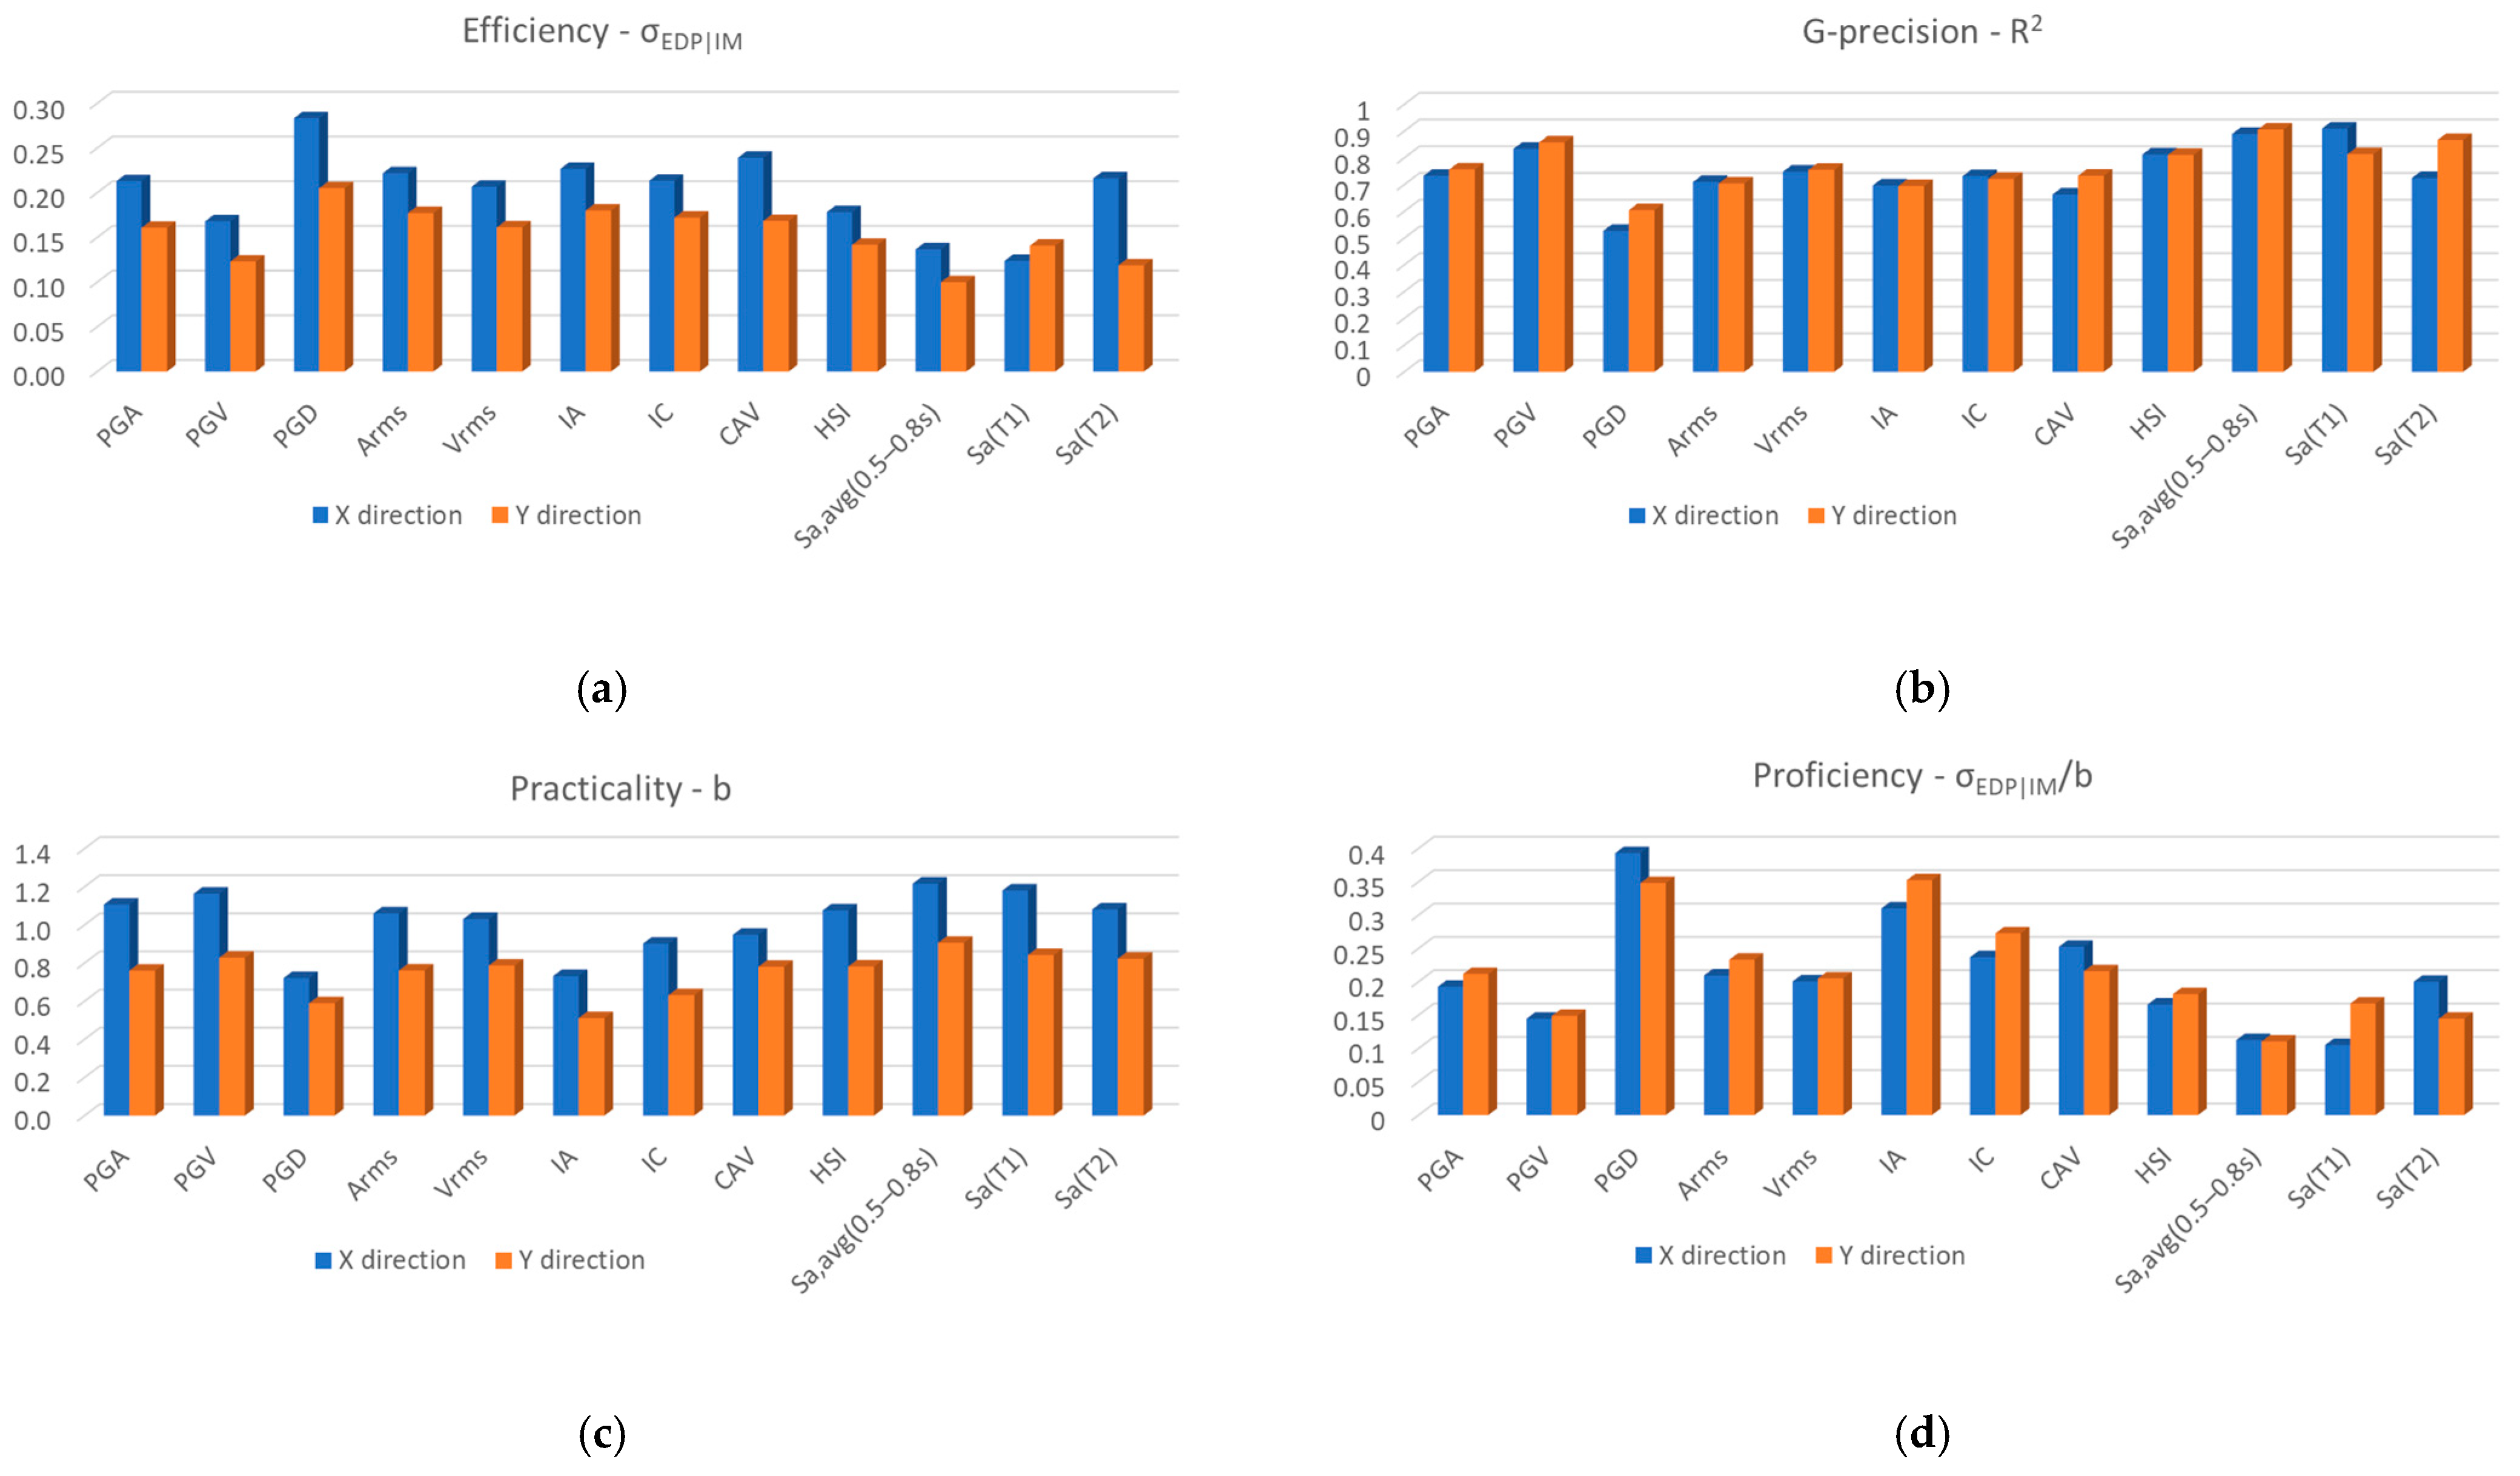
Next, the efficiency, practicality, and proficiency metrics are calculated as defined in Section 2.3, for each IM and for each direction separately. Efficiency can be quantitatively expressed using different statistical parameters. Here, we have decided to show standard deviation σ E D P / I M and coefficient of determination R2 concurrently, as they best represent the efficiency metric (C.O.V. may also represent efficiency in some cases). Practicality is by definition the slope b of the power law fit for the seismic demand model. The proficiency metric is calculated from Equation (6) for all IMs, and it is of particular interest for this research as the optimal IM determined here is intended for the development of analytical fragility and vulnerability models of URM building types. Efficiency, practicality, and proficiency rankings are shown for all IMs and both directions separately in Figure 12.
From the results obtained, it is evident that Sa(T1) and Sa,avg (0.5 s–0.8 s) are the most efficient intensity measures. They scored the lowest in dispersion and the highest in R2. Sa(T2) performed poorly for the Y direction, which indicates that the building response is truly dominated by the X direction. PGV and HSI have the next highest scores across IM metrics, indicating susceptibility of the structure to velocity-based IMs and a more energy-dependent building response. In the case of PGV, which does not depend on structural properties, it suggests that the building is reactive to the energy transferred to it by ground motion. On the other hand, Sa,avg (0.5 s–0.8 s), as an acceleration-based measure, best describes the relationship between the structural response and the seismic action represented as inertia forces, particularly in the period range of the considered building, which increases with reduced stiffness due to damage to individual elements.
It is evident how much variability exists in determining the IM-EDP relationship. Therefore, the selection of the optimal IM is an important contribution to reducing numerous uncertainties in the PBEE chain. A good IM choice also somewhat compensates for shortcomings in the selection of ground motion records, as more efficient IMs produce building responses with less variability regardless of the ground motion records used for NLDAs.
Practicality is consistently higher for the X direction, further confirming the dominant direction. Sa(T2) scores very high in practicality, tailing PGV and HSI. Proficiency results show more consistency between directions for Sa,avg (0.5 s–0.8 s) as opposed to Sa(T1) and Sa(T2), which are more proficient in X and Y directions, respectively. This indicates that Sa,avg should perform better down the PBEE chain when conducting fragility and vulnerability analysis.
The results in the X direction yielded consistently weaker correlations for most IMs. R2 stands out as the most balanced metric between the X and Y directions, having little variability between the directions. Sa(T1) in the X direction scores just slightly above Sa,avg (0.5 s–0.8 s) in efficiency, making it formally optimal for the X direction. Response in the X direction is dominant, but R2 remains relatively high for Sa(T1) in the Y direction as well. Overall, Sa,avg (0.5 s–0.8 s) remains a more robust choice due to consistent efficiency in both directions, followed by Sa(T1), PGV, and HSI.
PGA scores as a mid-tier IM, outperformed by spectral acceleration- and velocity-based IMs. However, displacement-based IMs score even lower, as expected. Such IMs could find more use in cases where large displacements impede building functionality, such as transportation infrastructure.

3.3. Evaluation of IMs According to New Criteria Based on Vulnerability Curve Variance

In this subsection, we show the vulnerability curves and their variances, developed using the methodology described in Section 2.3, for the selected URM building located in the historical centre of Zagreb. We also compare the considered IMs against the new vulnerability-based metrics GLM and NGLM. All the results are shown for X and Y directions separately, in order to retain more detail pertaining to global building behaviour. In the case of vulnerability curves, the direct comparison of X and Y directions is now possible, as the losses are expressed in terms of MDR in both cases, and the same IM is used as seismic load on the curve.
Since IDA results have not yielded enough points to fully capture DS5 for all records and both directions, the IDA curves were extended beyond the last calculated point as a linear extension. If the last known slope of an IDA curve was steeper than the average slope, then the last known slope was used. Otherwise, the average slope was adopted. In this way, all IDA curves crossed the DS5 threshold of 1.18% and fragility functions for all damage states and IMs could be derived. Parameters of fragility functions (mean and dispersion) are not provided here for brevity, as they are used in this work only as an intermediate step. Vulnerability curves are then derived for each IM by combining fragility functions with the discrete consequence model, as described in Section 2.4.
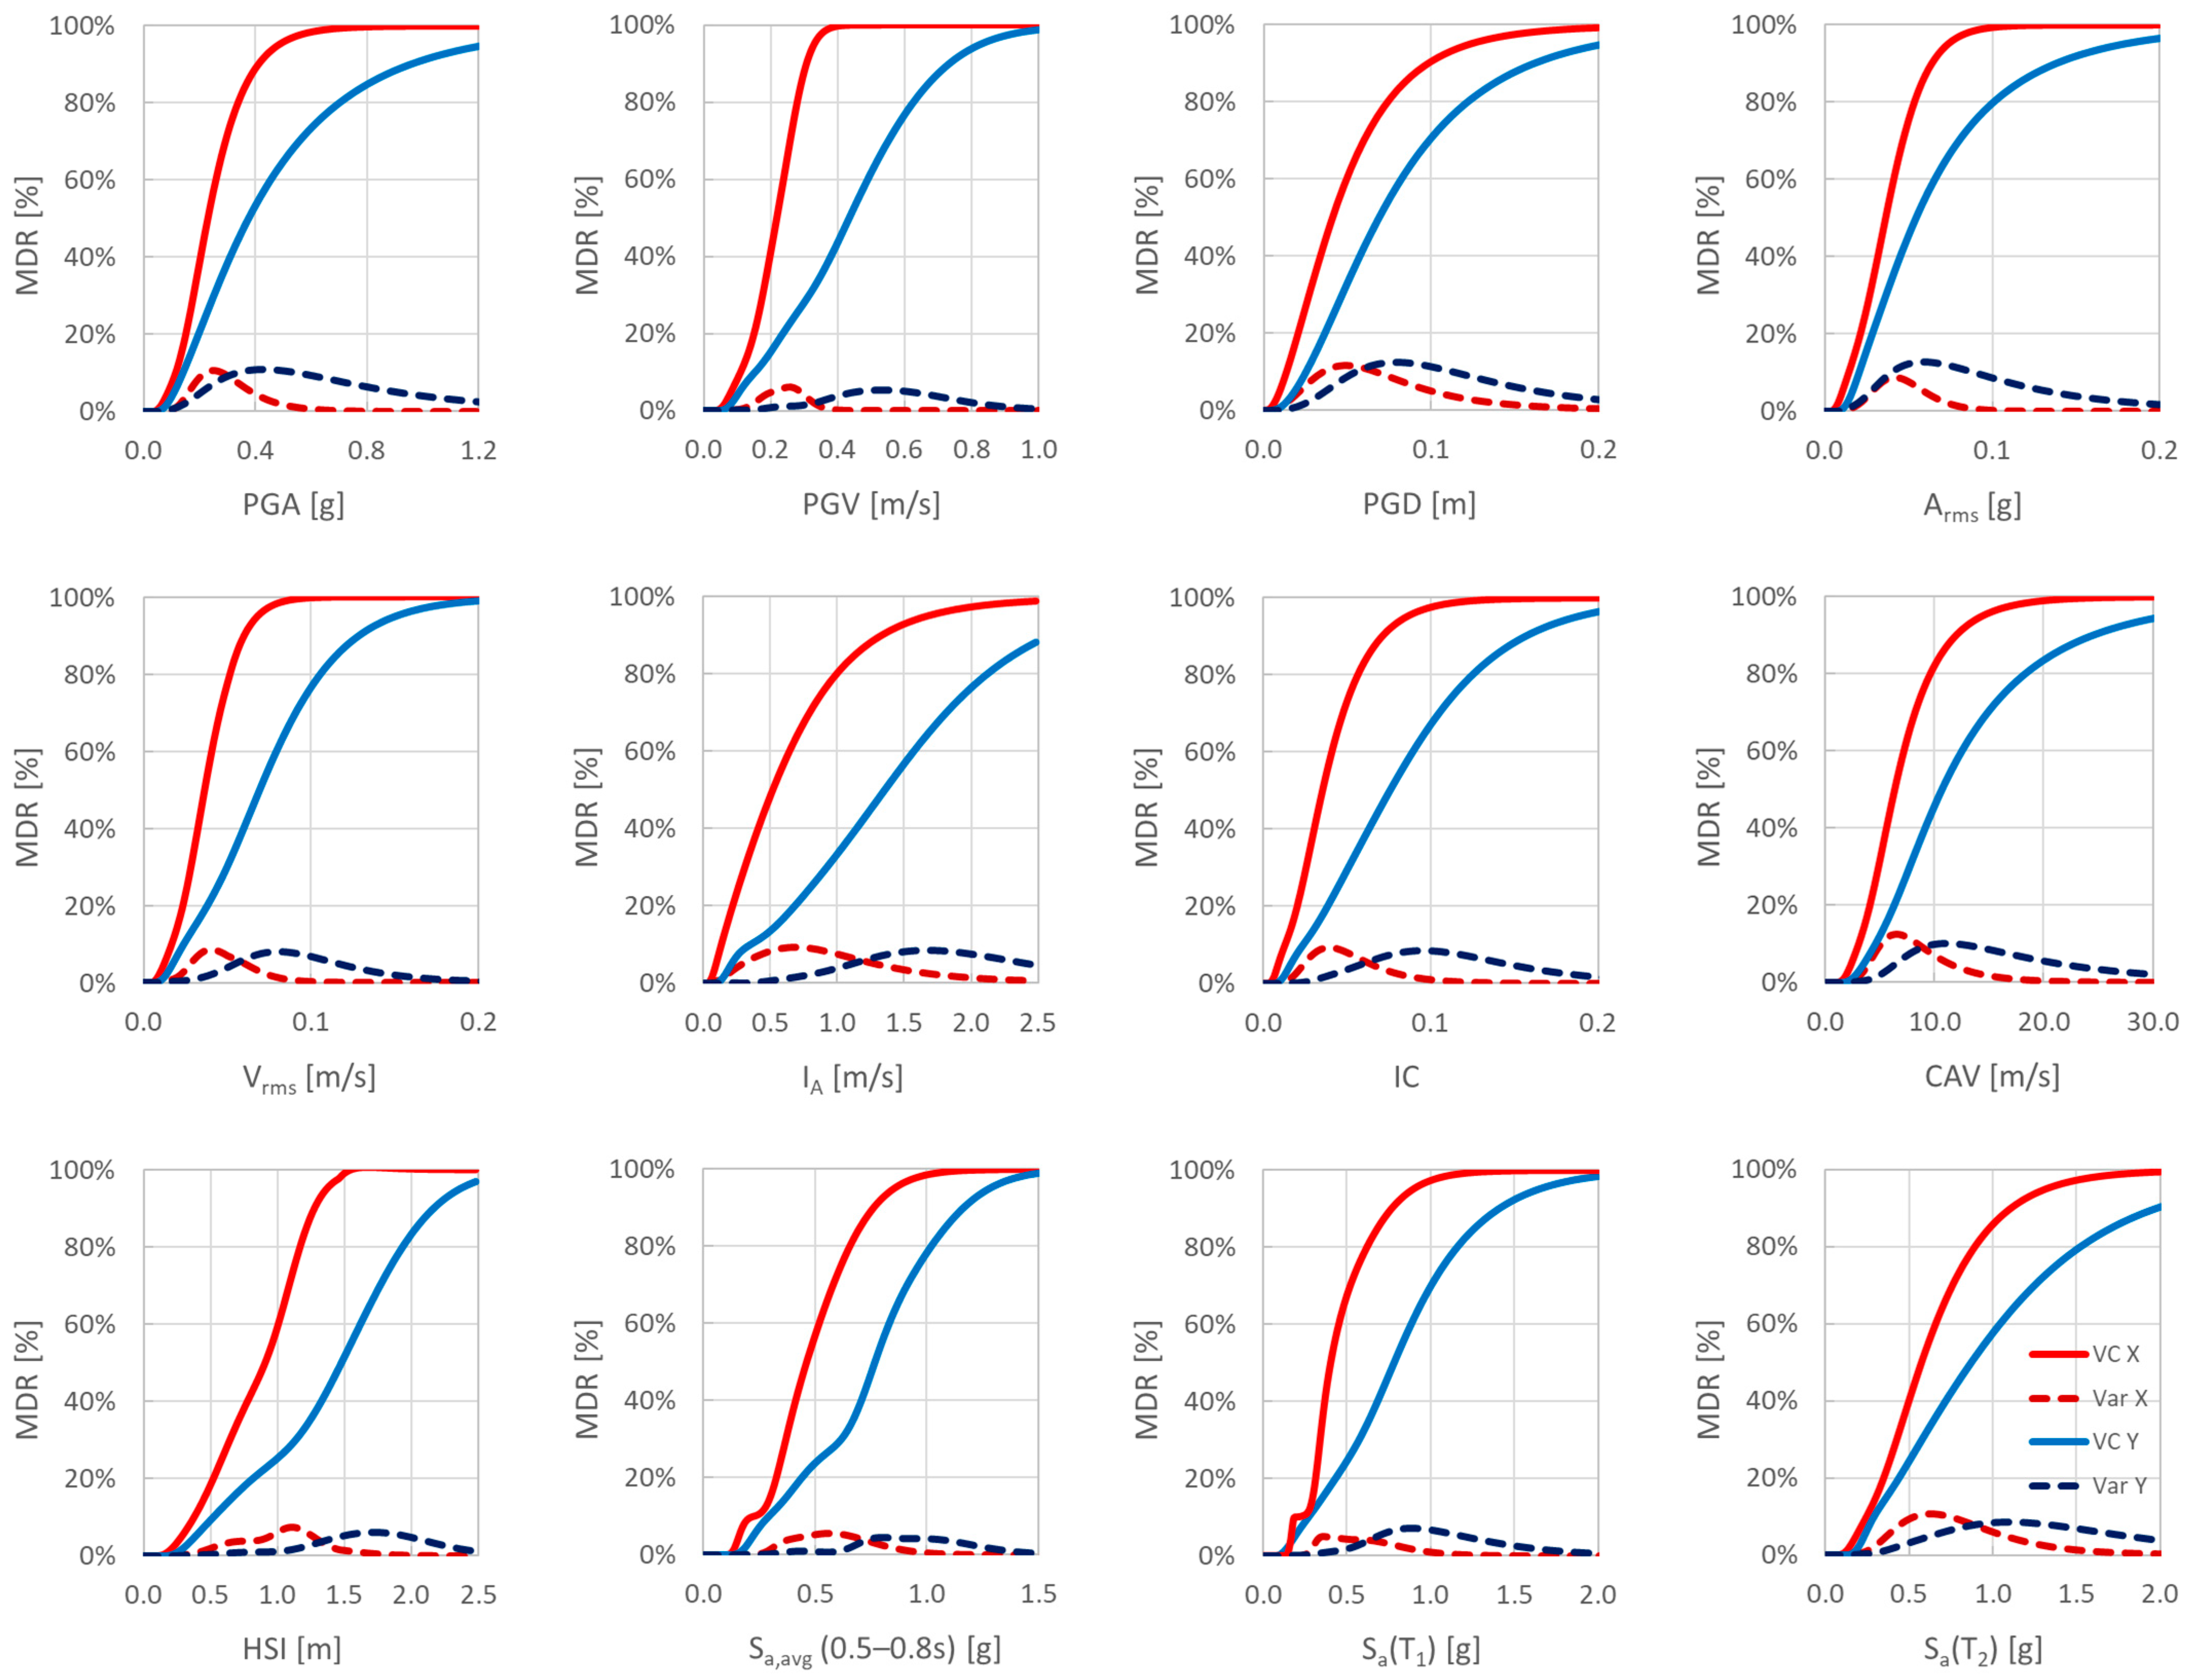
The new vulnerability curves for the reference URM building are shown in Figure 13 together with their variances for both X and Y directions. We observe that the X direction is more vulnerable across all IMs, although more efficient IMs show better overlap in the low IM range, indicating that for low-intensity events, the losses are similar in both directions. Vulnerability curves of more efficient IMs, such as Sa,avg and Sa(T1), show more complex behaviour, as the onset of DS2 is clearly visible in both cases for the X direction, and only for Sa,avg in the Y direction. The variances reflect the curves, and their maximum peaks are consistently in the higher IM range for the Y direction across all IMs. Some variances have multiple GLMs visible, and their values are lower for more efficient IMs. We may associate the IM values beyond the last tail of the GLM of the variance with DS5, as the consequence model does not foresee further damage states, and the losses approach 100%. The last GLM is consistently the highest in value, reflecting the increased uncertainties in evaluating losses for higher damage states with the used numerical building model.
For each IM, the GLM and NGLM of the vulnerability curve variance have been calculated, and the results are shown in Table 4. We observe that Sa,avg and Sa(T1) are the only IMs that reach NGLM = 4, indicating the capability to differentiate all considered damage states on the vulnerability curve, but not in both directions. Sa(T1) is better for the X direction, showing the lowest GLM values, but Sa,avg is more consistent in both directions, and shows lower GLMs for lower damage states. Sa(T2) does not perform as well in the Y direction despite the 2nd mode being translational in the Y direction, confirming the primary response of the building being in the X direction. PGV and HSI stand out among the other IMs with NGLM = 3 for both directions, indicating susceptibility of the structure to velocity-based IMs connected to kinetic energy that is introduced into the structure by ground shaking. However, their GLM values are still higher than those of Sa,avg.
PGD and CAV rank as the lowest performing IMs according to the new criteria, with NGLM = 1, and among the highest GLM values. It can clearly be observed in Figure 13 that their variances have a single bell-shaped peak, where all the damage states overlap. The reference URM building responses poorly correlate to displacements, as well as absolute values and squares of velocities and accelerations. It seems the response is best correlated with internal inertia forces due to seismic loads, as represented by spectral acceleration-based IMs and both the velocity of the building during response (represented by HSI) and the ground velocity (PGV).
It should be noted that for many IMs that are able to differentiate DS2, the GLM is very low in value (below 0.5%), indicating higher accuracy in predicting lower damage states as opposed to greater uncertainties for the higher damage states. This fluctuation in the variance differentiates the IMs that have the lowest performance (which do not feature this fluctuation, such as PGD) from the mid-performance IMs, such as PGA. In order to better illustrate this point, we present vulnerability curves for the Y direction for Sa,avg, PGV, and PGA in Figure 14. We observe that Sa,avg captures all damage states with NGLM = 4. If we consider the vulnerability curve values at IM levels when GLMs occur, we find MDR values that agree closely with the consequence model for the respective damage states. For PGV, we find that DS2 and DS3 are captured well, but DS4 and DS5 now overlap in GLM3. For PGA, we find only one GLM where all damage states overlap. However, PGA in the X direction showed two GLMs, whereas PGD yielded NGLM = 1 in both directions.
We consider here GLMmax and NGLM as the most relevant of the new criteria. GLMmax, as the highest variance value, describes the extent to which the derived vulnerability curve deviates from the deterministic consequence model that describes losses depending on achieved damage state. Relative differences between GLMs indicate that damage states with lower GLMs are more accurately represented on the vulnerability curve. However, since NGLM is less than the number of damage states for most IMs, some GLM values represent a combination of one or more adjacent damage states. The tested IMs are ranked according to GLMmax and NGLM in Figure 15. The ranking shows good agreement with the traditional criteria of efficiency and proficiency, indicating that efficient IMs may produce more accurate vulnerability curves, as measured by the new criteria. Since efficiency implies less dispersion in building responses at a given IM level, the damage analysis also gives less dispersion. Consequently, GLMmax, as a representative of the vulnerability curve variance, is lower for more efficient IMs.

4. Discussion

A variety of common IMs have been tested in this study in order to determine the optimal IM for use in seismic risk assessment of URM buildings and developing new building-specific vulnerability models. A case study URM building was selected in Zagreb, Croatia, as a representative URM building type in southeastern Europe, built at the end of the 19th and beginning of the 20th centuries. The FEM modelling approach using a piecewise-linear constitutive law and lumped plasticity was able to capture the in-plane behaviour of shear walls, while the out-of-plane mechanisms were neglected [71]. The software of choice was ETABS (v20.3.0, build 2929), which provided robust and stable numerical solutions, but at a cost of high computation time. Equivalent frame-modelling approaches have proven to be more cost-effective with respect to computation time when considering a large amount of NLDAs using many ground-motion recordings [47]. These approaches should be adopted for developing new vulnerability models for URM building types as described in Pinasco et al. [42], complemented by using optimal IMs as selected in the present study.
The IMs considered for testing were selected according to the hazard computability criterion, with seismic risk assessment applications in mind. Optimal IMs were selected among IM candidates for which GMPEs already exist, and seismic hazard curves may easily be computed. A range of traditional IM metrics was utilized for comparing and ranking the tested IMs: efficiency, proficiency, and practicality. The results showed that the considered URM building type is susceptible to spectral acceleration and velocity-based IMs. Sa,avg and Sa(T1) ranked the highest in all considered IM metrics, with Sa(T1) outranking Sa,avg for the X direction (the direction of the fundamental mode), but Sa,avg showed more consistent ranking for both directions, making it optimal for the building as a whole. HSI and PGV scored second best as velocity-based IMs, making PGV the highest-ranking building-independent IM [72]. PGA can be considered a mid-tier IM for mid-rise and higher URM buildings and is best avoided when other better-performing IMs are available, but it should not be totally neglected. Displacement-based IMs scored the lowest consistently. These findings are in line with research conducted for other building types [12,70], which showed that Sa,avg performs well across all damage states, including higher damage states, when period elongation occurs, while Sa(T1) is more efficient for 1st mode-dominated responses and for lower damage states. This indicates that URM buildings are primarily sensitive to the total inertial forces that develop within the structure during their oscillatory, multi-modal response to ground shaking. The strong performance of velocity-based IMs reflects the low energy dissipation capacity of URM buildings, which makes them highly sensitive to the total energy input during ground shaking [73,74]. In particular, PGV is directly related to the kinetic energy imparted to the structure by ground motion. Similarly, Housner intensity (HSI), as a measure of cumulative energy input, quantifies the amount of usable shaking energy, associated with the exchange between kinetic and potential energy, that the ground motion can transfer to the structure across a relevant period range.
We emphasize that to obtain structural responses, the IDA procedure has been used, considering a set of incrementally scaled ground motion records that were not explicitly consistent with the seismic hazard on location. Nevertheless, general seismotectonic parameters for the considered region were still accounted for during record selection. Although this choice somewhat reduces the representativeness of the seismic demand with respect to the hazard at the site, it does not directly influence the relative IM rankings, since the IM metrics considered are not directly hazard-dependent, but are instead driven by how strongly and stably an IM predicts the structural response, regardless of the specific record set. Still, using a hazard-consistent ground motion set is recommended even when an optimal IM is used, because it discards the records whose secondary spectral content is inconsistent with the hazard on location. An optimal IM reduces, but does not eliminate, the value of hazard-consistent selection of ground motions.
A novel IM metric named generalized local maximum (GLM) was introduced to directly capture the effects of utilizing different IMs on the final vulnerability curve. The concept of vulnerability curve variance and its first derivative were introduced to define GLM as a functional shape resulting from a local maximum followed by a local minimum in the first derivative of the variance. The results are somewhat dependent on the consequence model used to derive the vulnerability curve, which presents a cautionary limit to its use, but many advantages appear. It was shown that maximum variance values GLMmax correlate well with traditional efficiency and proficiency metrics and give the same IM ranking for the considered IMs. The number of GLMs in the variance NGLM was also shown to correlate well with traditional IM metrics. Furthermore, it was established that occurrences of GLMs are connected to damage states used in the consequence model to predict losses. The vulnerability curve loss predictions at IM levels when GLMs occur coincide with losses assigned to a particular damage state by the consequence model. However, damage states are clearly separated on the vulnerability curve only for the best-performing IMs. For most IMs, two or more damage states are coupled and form one joint GLM because the dispersions in the responses are too high. For this reason, NGLM is always less than or equal to the number of damage states in the discrete consequence model. NGLM may be used as a criterion of sufficient efficiency, facilitating the use of any IM that is able to produce a desired NGLM on the vulnerability curve. Future research may be directed towards investigating the relationship between different GLM values on the same vulnerability curve, since by combining all obtained GLMs, IM performance could potentially be described better than just by considering GLMmax. The impact of utilizing different consequence models, including probabilistic models and different damage scales, is also a topic for future investigation. Since the proposed procedure for calculating GLMs and NGLM does not in any way depend on the choice of the building, but solely on the established PBEE procedure for developing vulnerability curves, the procedure may be applied in the same way to other building typologies, including other masonry typologies, reinforced concrete frames, or steel structures. Furthermore, the proposed new IM metrics can also be calculated for already existing vulnerability curves, provided they have been developed by combining fragility curves with a consequence model. In this way, existing vulnerability curves and their IMs could be tested by using the GLMmax and NGLM metrics.
It was also demonstrated that even when using an optimal IM, the same damage level of the building might still result from completely different failure mechanisms, such as ground floor, highest floor, or global collapse. The building might be capable of multiple failure mechanisms. Using global EDPs such as IDRavg or IDRmax provides a simplified way to characterize structural responses, but using more sophisticated damage indices for URM buildings at the structural element level seems crucial for identification of critical elements and a more accurate assessment of seismic performance.
Finally, it should be noted that the IM levels at which GLM peaks appear represent seismic intensity levels of the highest increase in losses, and, therefore, seismic risk. These IM levels may be used as reference points for designing target retrofit solutions, where a sufficient target retrofit solution would be determined by its capacity to displace the GLM peaks to higher intensity levels. In this way, the critical point of the highest increase in losses would correspond to higher seismic hazard levels, and the risk would be reduced. Similarly, different target retrofit options could be compared in efficiency by how much they shift the GLM peak to higher intensity levels.

5. Conclusions

A vulnerability-based metric named generalized local maximum (GLM) was introduced as a novel criterion for selecting the optimal intensity measure for mid-rise unreinforced masonry buildings. It is based on a generalized definition of the local maxima of the vulnerability curve variance. While it was shown that it produces IM rankings in line with traditional IM metrics such as efficiency and proficiency, GLM proved effective in evaluating the effect of the IM choice on the final vulnerability curve of the building when considering deterministic and discrete consequence models, both in terms of the quantitative values of GLM and the number of GLMs produced by each IM.
The new GLM metric was applied to a case study of a URM building in Zagreb, Croatia, where average spectral acceleration Sa,avg was determined to be the optimal IM, followed by velocity-based IMs PGV and Housner intensity. GLM also allows for the identification of intensity levels of the highest increase in losses and risk, with potential use for the evaluation of target retrofitting effectiveness. The GLM represents an objective standard that informs the choice of IM from a seismic risk assessment perspective, making it a valuable tool for vulnerability modelling.

Author Contributions

Conceptualization, A.P.; methodology, A.P., M.U. and M.Š.N.; software, A.P.; validation, A.P. and M.U.; formal analysis, A.P.; investigation, A.P.; resources, A.P., M.U. and M.Š.N.; data curation, A.P. and M.Š.N.; writing—original draft preparation, A.P.; writing—review and editing, A.P., M.U. and M.Š.N.; visualization, A.P.; supervision, M.U. and M.Š.N.; project administration, M.U.; funding acquisition, M.U. All authors have read and agreed to the published version of the manuscript.

Funding

This research and APC were funded by the Croatian Science Foundation, grant number UIP-2020-02-1128.

Data Availability Statement

The data that supports the findings of this study is available from the corresponding author upon reasonable request.

Conflicts of Interest

The authors declare no conflicts of interest. The funders had no role in the design of the study; in the collection, analyses, or interpretation of data; in the writing of the manuscript; or in the decision to publish the results.

References

  1. Atalić, J.; Novak, M.Š.; Uroš, M. Seismic Risk for Croatia: Overview of Research Activities and Present Assessments with Guidelines for the Future. Gradjevinar 2019, 71, 923–947. [Google Scholar]
  2. Baker, J.; Bradley, B.; Stafford, P. Seismic Hazard and Risk Analysis; Cambridge University Press: Cambridge, UK, 2021; ISBN 9781108348157. [Google Scholar]
  3. Aquib, T.A.; Sivasubramonian, J.; Mai, P.M. Analysis of Ground Motion Intensity Measures and Selection Techniques for Estimating Building Response. Appl. Sci. 2022, 12, 12089. [Google Scholar] [CrossRef]
  4. Lin, J.; Smerzini, C. Validated Physics-Based Numerical Simulations of Earthquake Ground Motion in the Thessaloniki Area. In Proceedings of the 3rd European Conference on Earthquake Engineering and Seismology, Bucharest, Romania, 4–9 September 2022. [Google Scholar]
  5. Smerzini, C.; Vanini, M.; Paolucci, R.; Renault, P.; Traversa, P. Regional Physics-Based Simulation of Ground Motion within the Rhȏne Valley, France, during the MW 4.9 2019 Le Teil Earthquake. Bull. Earthq. Eng. 2023, 21, 1747–1774. [Google Scholar] [CrossRef]
  6. Chopra, A.K. Dynamics of Structures: Theory and Applications to Earthquake Engineering, 1st ed.; Hall, W.J., Ed.; Prentice Hall: Hoboken, NJ, USA, 1995. [Google Scholar]
  7. Lachanas, C.G.; Vamvatsikos, D.; Dimitrakopoulos, E.G. Intensity Measures as Interfacing Variables versus Response Proxies: The Case of Rigid Rocking Blocks. Earthq. Eng. Struct. Dyn. 2023, 52, 1722–1739. [Google Scholar] [CrossRef]
  8. Giannouli, V.D.; Athanatopoulou, A.M.; Manoukas, G.E.; Athanatopoulou, A.M. Earthquake Intensity Measures and Structural Damage Indices: A Review since 2015. In Proceedings of the 18th World Conference on Earthquake Engineering (WCEE2024), Milan, Italy, 30 June–5 July 2024. [Google Scholar]
  9. Zhen, W.; Qiu, Y.; Zhang, Y.; Li, W. Ground-Motion Intensity Measures for the Seismic Response of the Roof-Isolated Large-Span Structure. Buildings 2024, 14, 411. [Google Scholar] [CrossRef]
  10. Kostinakis, K.; Fontara, I.K.; Athanatopoulou, A.M. Scalar Structure-Specific Ground Motion Intensity Measures for Assessing the Seismic Performance of Structures: A Review. J. Earthq. Eng. 2018, 22, 630–665. [Google Scholar] [CrossRef]
  11. Yang, D.; Pan, J.; Li, G. Non-Structure-Specific Intensity Measure Parameters and Characteristic Period of near-Fault Ground Motions. Earthq. Eng. Struct. Dyn. 2009, 38, 1257–1280. [Google Scholar] [CrossRef]
  12. Kohrangi, M.; Bazzurro, P.; Vamvatsikos, D.; Spillatura, A. Conditional Spectrum-Based Ground Motion Record Selection Using Average Spectral Acceleration. Earthq. Eng. Struct. Dyn. 2017, 46, 1667–1685. [Google Scholar] [CrossRef]
  13. Baker, J.W. Conditional Mean Spectrum: Tool for Ground-Motion Selection. J. Struct. Eng. 2011, 137, 322–331. [Google Scholar] [CrossRef]
  14. Kohrangi, M.; Vamvatsikos, D.; Bazzurro, P. Site Dependence and Record Selection Schemes for Building Fragility and Regional Loss Assessment. Earthq. Eng. Struct. Dyn. 2017, 46, 1625–1643. [Google Scholar] [CrossRef]
  15. Giovenale, P.; Cornell, C.A.; Esteva, L. Comparing the Adequacy of Alternative Ground Motion Intensity Measures for the Estimation of Structural Responses. Earthq. Eng. Struct. Dyn. 2004, 33, 951–979. [Google Scholar] [CrossRef]
  16. Luco, N.; Cornell, C.A. Structure-Specific Scalar Intensity Measures for near-Source and Ordinary Earthquake Ground Motions. Earthq. Spectra 2007, 23, 357–392. [Google Scholar] [CrossRef]
  17. Kazantzi, A.K.; Vamvatsikos, D. Intensity Measure Selection for Vulnerability Studies of Building Classes. Earthq. Eng. Struct. Dyn. 2015, 44, 2677–2694. [Google Scholar] [CrossRef]
  18. Padgett, J.E.; Nielson, B.G.; DesRoches, R. Selection of Optimal Intensity Measures in Probabilistic Seismic Demand Models of Highway Bridge Portfolios. Earthq. Eng. Struct. Dyn. 2008, 37, 711–725. [Google Scholar] [CrossRef]
  19. Vamvatsikos, D.; Cornell, C.A. Developing Efficient Scalar and Vector Intensity Measures for IDA Capacity Estimation by Incorporating Elastic Spectral Shape Information. Earthq. Eng. Struct. Dyn. 2005, 34, 1573–1600. [Google Scholar] [CrossRef]
  20. Zavala, N.; Bojórquez, E.; Barraza, M.; Bojórquez, J.; Villela, A.; Campos, J.; Torres, J.; Sánchez, R.; Carvajal, J. Vector-Valued Intensity Measures Based on Spectral Shape to Predict Seismic Fragility Surfaces in Reinforced Concrete Buildings. Buildings 2023, 13, 137. [Google Scholar] [CrossRef]
  21. Vargas-Alzate, Y.F.; Hurtado, J.E.; Pujades, L.G. New Insights into the Relationship between Seismic Intensity Measures and Nonlinear Structural Response. Bull. Earthq. Eng. 2022, 20, 2329–2365. [Google Scholar] [CrossRef]
  22. Deierlein, G.G.; Krawinkler, H.; Cornell, C.A.; Blume, J.A. A Framework for Performance-Based Earthquake Engineering. In Proceedings of the 2003 Pacific Conference on Earthquake Engineering, Christchurch, New Zealand, 13–15 February 2003. [Google Scholar]
  23. Lagomarsino, S.; Cattari, S. Fragility Functions of Masonry Buildings. In SYNER-G: Typology Definition and Fragility Functions for Physical Elements at Seismic Risk: Buildings, Lifelines, Transportation Networks and Critical Facilities; Pitilakis, K., Crowley, H., Kaynia, A.M., Eds.; Springer: Dordrecht, The Netherlands, 2014; pp. 111–156. ISBN 978-94-007-7872-6. [Google Scholar]
  24. Tothong, P.; Luco, N. Probabilistic Seismic Demand Analysis Using Advanced Ground Motion Intensity Measures. Earthq. Eng. Struct. Dyn. 2007, 36, 1837–1860. [Google Scholar] [CrossRef]
  25. Hariri-Ardebili, M.A.; Saouma, V.E. Probabilistic Seismic Demand Model and Optimal Intensity Measure for Concrete Dams. Struct. Saf. 2016, 59, 67–85. [Google Scholar] [CrossRef]
  26. Jalayer, F.; Cornell, C.A. Alternative Non-Linear Demand Estimation Methods for Probability-Based Seismic Assessments. Earthq. Eng. Struct. Dyn. 2009, 38, 951–972. [Google Scholar] [CrossRef]
  27. Khosravikia, F.; Clayton, P. Updated Evaluation Metrics for Optimal Intensity Measure Selection in Probabilistic Seismic Demand Models. Eng. Struct. 2020, 202, 109899. [Google Scholar] [CrossRef]
  28. Šavor Novak, M.; Uroš, M.; Demšić, M.; Jevtić Rundek, R.; Pilipović, A.; Atalić, J. Detailed Structural Typology of Existing Substandard Masonry and Reinforced Concrete Buildings in the City of Zagreb, Croatia. Buildings 2024, 14, 3644. [Google Scholar] [CrossRef]
  29. Pilipović, A.; Rundek, R.J.; Uroš, M.; Novak, M.Š.; Demšić, M.; Prevolnik, S. New Vulnerability Model of an Unreinforced Masonry Building in the Urban Area of Zagreb. In Proceedings of the 18th World Conference on Earthquake Engineering, Milan, Italy, 30 June–5 July 2024. [Google Scholar]
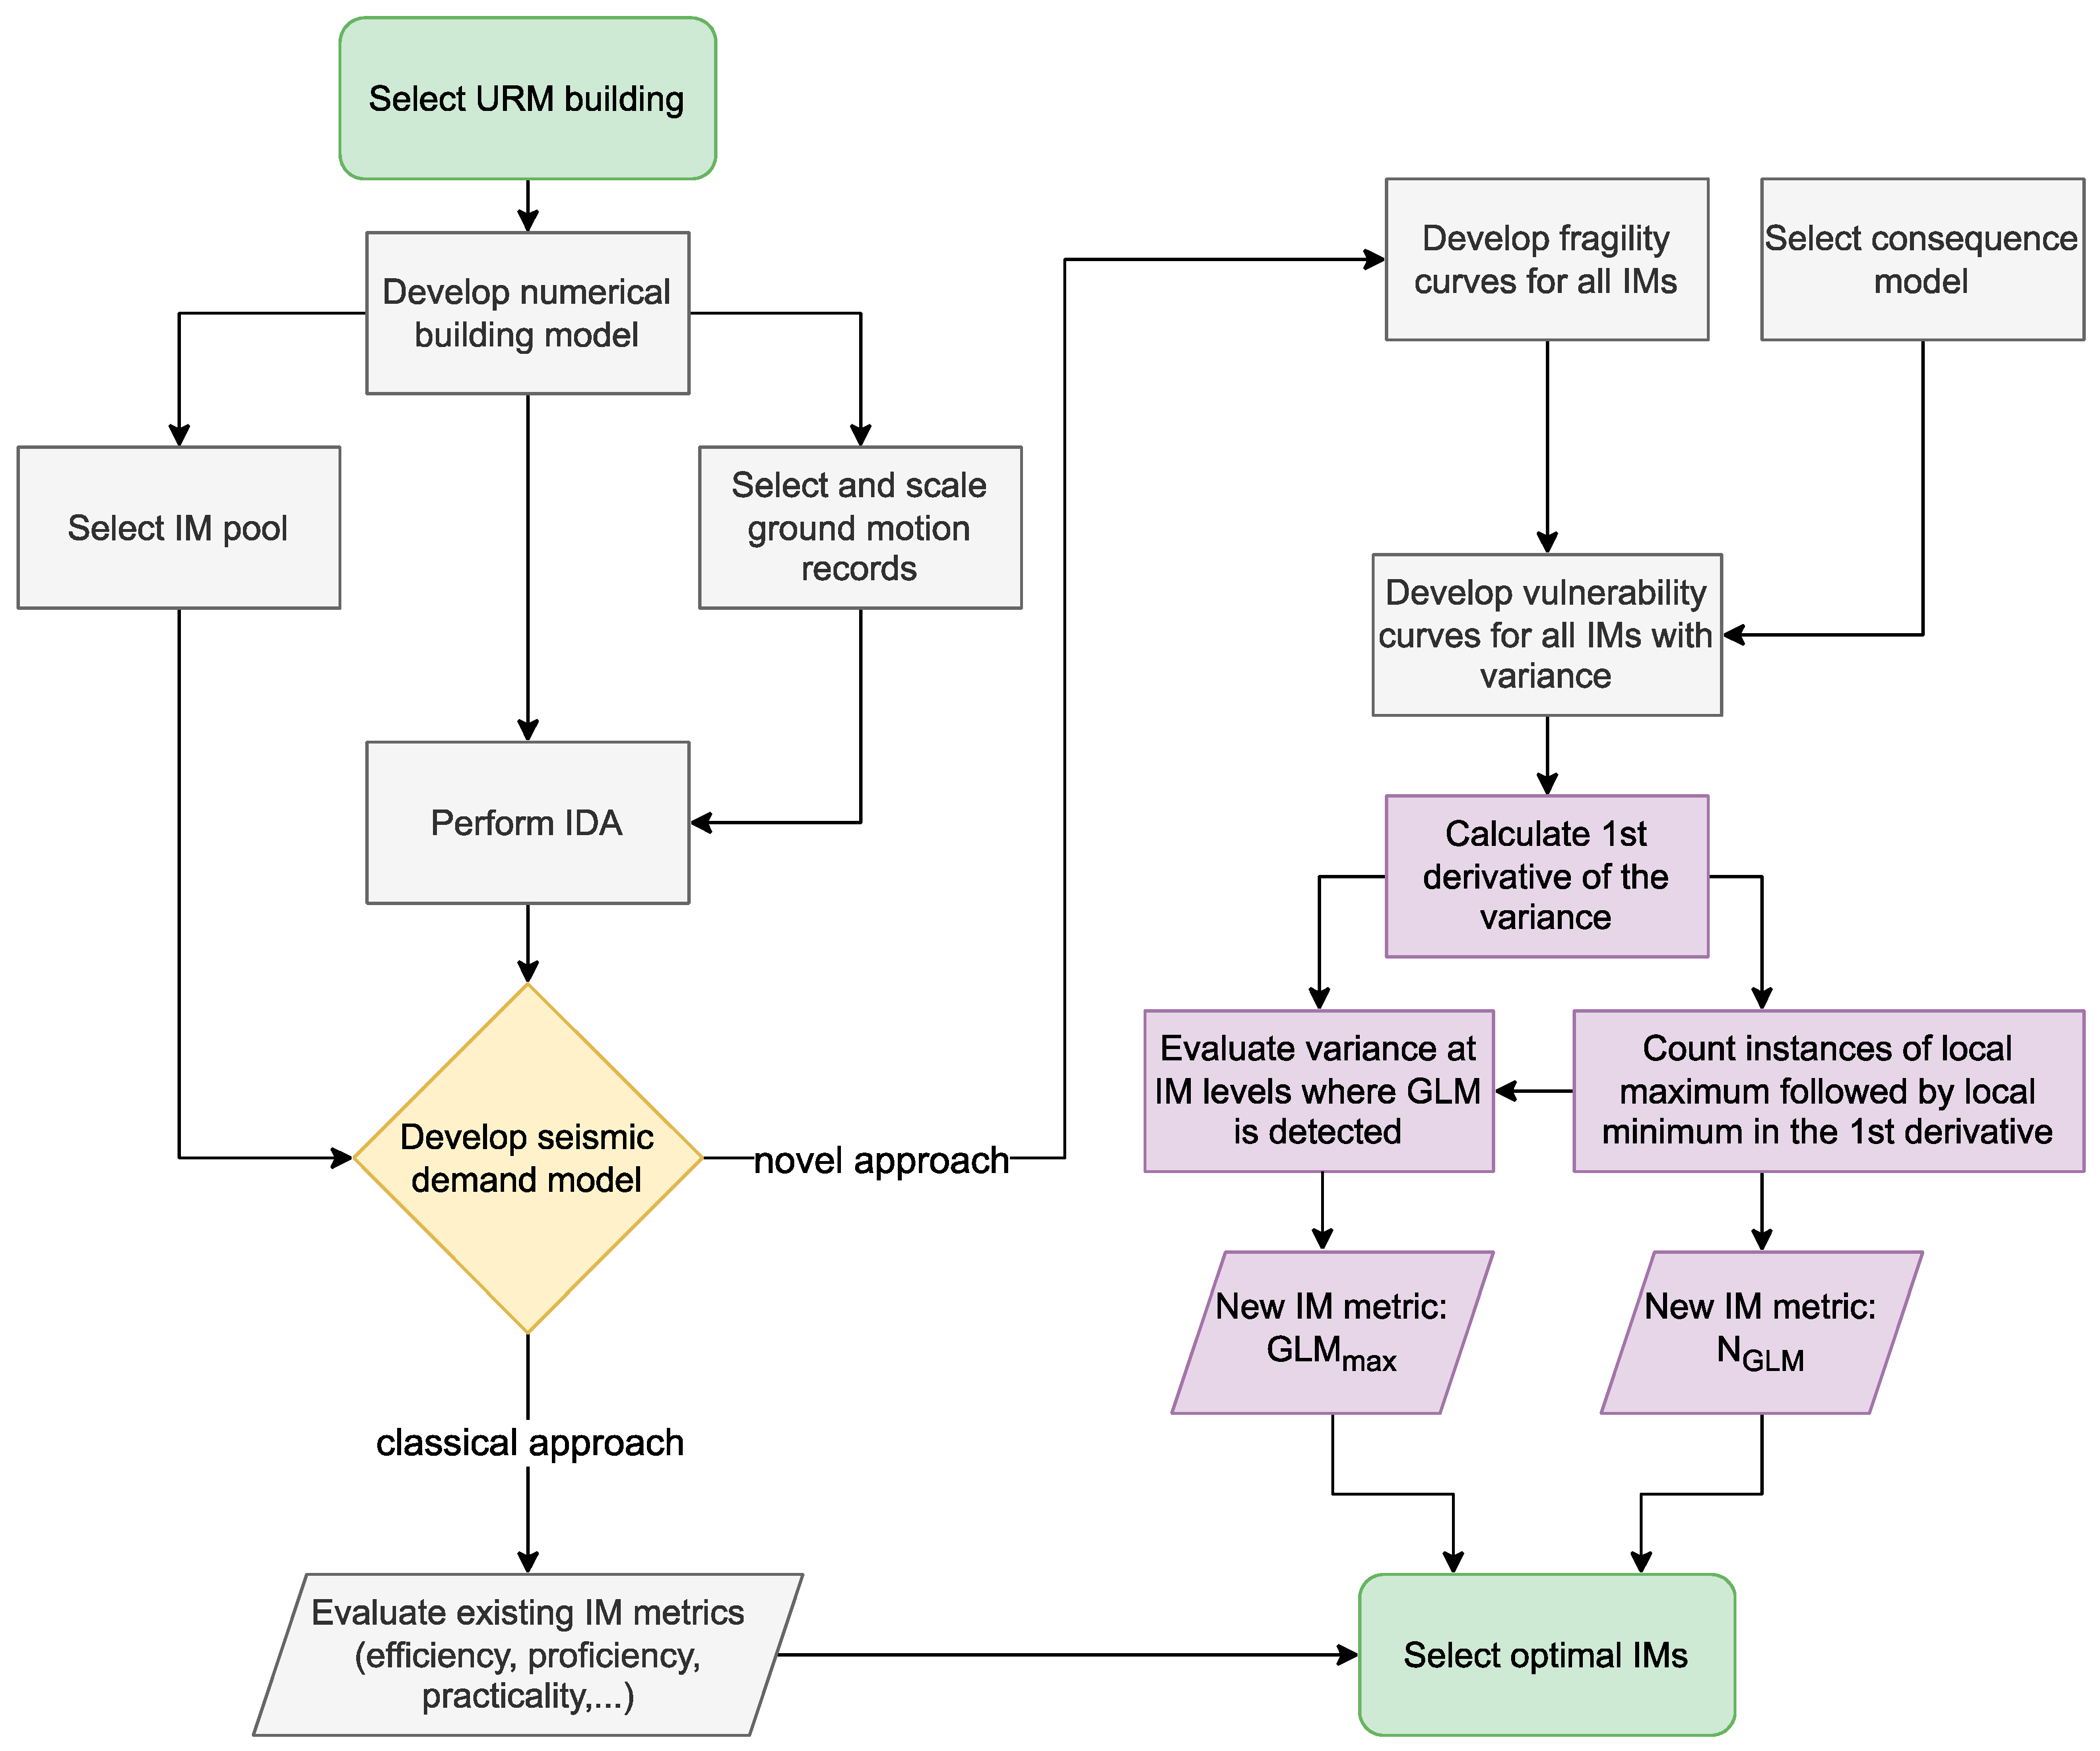
  30. Uroš, M.; Šavor Novak, M.; Atalić, J.; Baniček, M. Procjena Potresnog Rizika Za Grad Zagreb; University of Zagreb: Zagreb, Croatia, 2023. (In Croatian) [Google Scholar]
  31. Serdar, N.; Pejović, J. National Seismic Risk Assessment for Montenegro. J. Appl. Eng. Sci. 2024, 22, 291–296. [Google Scholar] [CrossRef]
  32. Yön, B. Identification of Failure Mechanisms in Existing Unreinforced Masonry Buildings in Rural Areas after April 4, 2019 Earthquake in Turkey. J. Build. Eng. 2021, 43, 102586. [Google Scholar] [CrossRef]
  33. Pilipović, A.; Uroš, M.; Demšić, M. Identification of Critical Elements of Unreinforced Masonry Buildings for Selection of Optimal Retrofit Solutions. In Proceedings of the 14th International Conference on Structural Analysis of Historical Constructions, Lausanne, Switzerland, 15–17 September 2025; EPFL: Lausanne, Switzerland, 2025. [Google Scholar]
  34. Žagar, T.; Uroš, M.; Atalić, J. Exposure of standardised buildings in Zagreb built in the second half of the 20th century. In Proceedings of the 7th Doctoral Symposium in Civil Engineering, Stuttgart, Germany, 11–13 September 2021; Štirmer, N., Ed.; University of Zagreb Faculty of Civil Engineering: Zagreb, Croatia, 2021; pp. 135–150. [Google Scholar]
  35. Pilipović, A.; Uroš, M. Selection of Optimal Intensity Measure for a Typical Masonry Building in the Urban Area of Zagreb. In Proceedings of the 8th Doctoral Symposium in Civil Engineering, Zagreb, Croatia, 5–6 September 2022; Štirmer, N., Ed.; University of Zagreb: Zagre, Croatia, 2022; pp. 111–124. [Google Scholar]
  36. Atalić, J.; Uroš, M.; Šavor Novak, M.; Demšić, M.; Nastev, M. The Mw5.4 Zagreb (Croatia) Earthquake of March 22, 2020: Impacts and Response. Bull. Earthq. Eng. 2021, 19, 3461–3489. [Google Scholar] [CrossRef] [PubMed]
  37. Uroš, M.; Demšić, M.; Šavor Novak, M.; Atalić, J.; Baniček, M.; Jevtić Rundek, R.; Duvnjak, I.; Košćak, J.; Pilipović, A.; Prevolnik, S. Damage Evaluation and Seismic Assessment of a Typical Historical Unreinforced Masonry Building in the Zagreb 2020 Earthquake: A Case Study—Part I. Buildings 2024, 14, 474. [Google Scholar] [CrossRef]
  38. Novak, M.Š.; Uroš, M.; Atalić, J.; Herak, M.; Demšić, M.; Baniček, M.; Lazarević, D.; Bijelić, N.; Crnogorac, M.; Todorić, M. Zagreb Earthquake of 22 March 2020—Preliminary Report on Seismologic Aspects and Damage to Buildings. Gradjevinar 2020, 72, 843–867. [Google Scholar] [CrossRef]
  39. Angiolilli, M.; Brunelli, A.; Cattari, S. Fragility Curves of Masonry Buildings in Aggregate Accounting for Local Mechanisms and Site Effects. Bull. Earthq. Eng. 2023, 21, 2877–2919. [Google Scholar] [CrossRef]
  40. Angiolilli, M.; Lagomarsino, S.; Cattari, S.; Degli Abbati, S. Seismic Fragility Assessment of Existing Masonry Buildings in Aggregate. Eng. Struct. 2021, 247, 113218. [Google Scholar] [CrossRef]
  41. Demšić, M.; Pinasco, S.; Pilipović, A.; Cattari, S.; Lagomarsino, S.; Novak, M.Š.; Uroš, M. Development of Fragility Curves of Masonry Buildings Build in a Regular Row Aggregate. In Proceedings of the 18th World Conference on Earthquake Engineering, Milan, Italy, 30 June–5 July 2024. [Google Scholar]
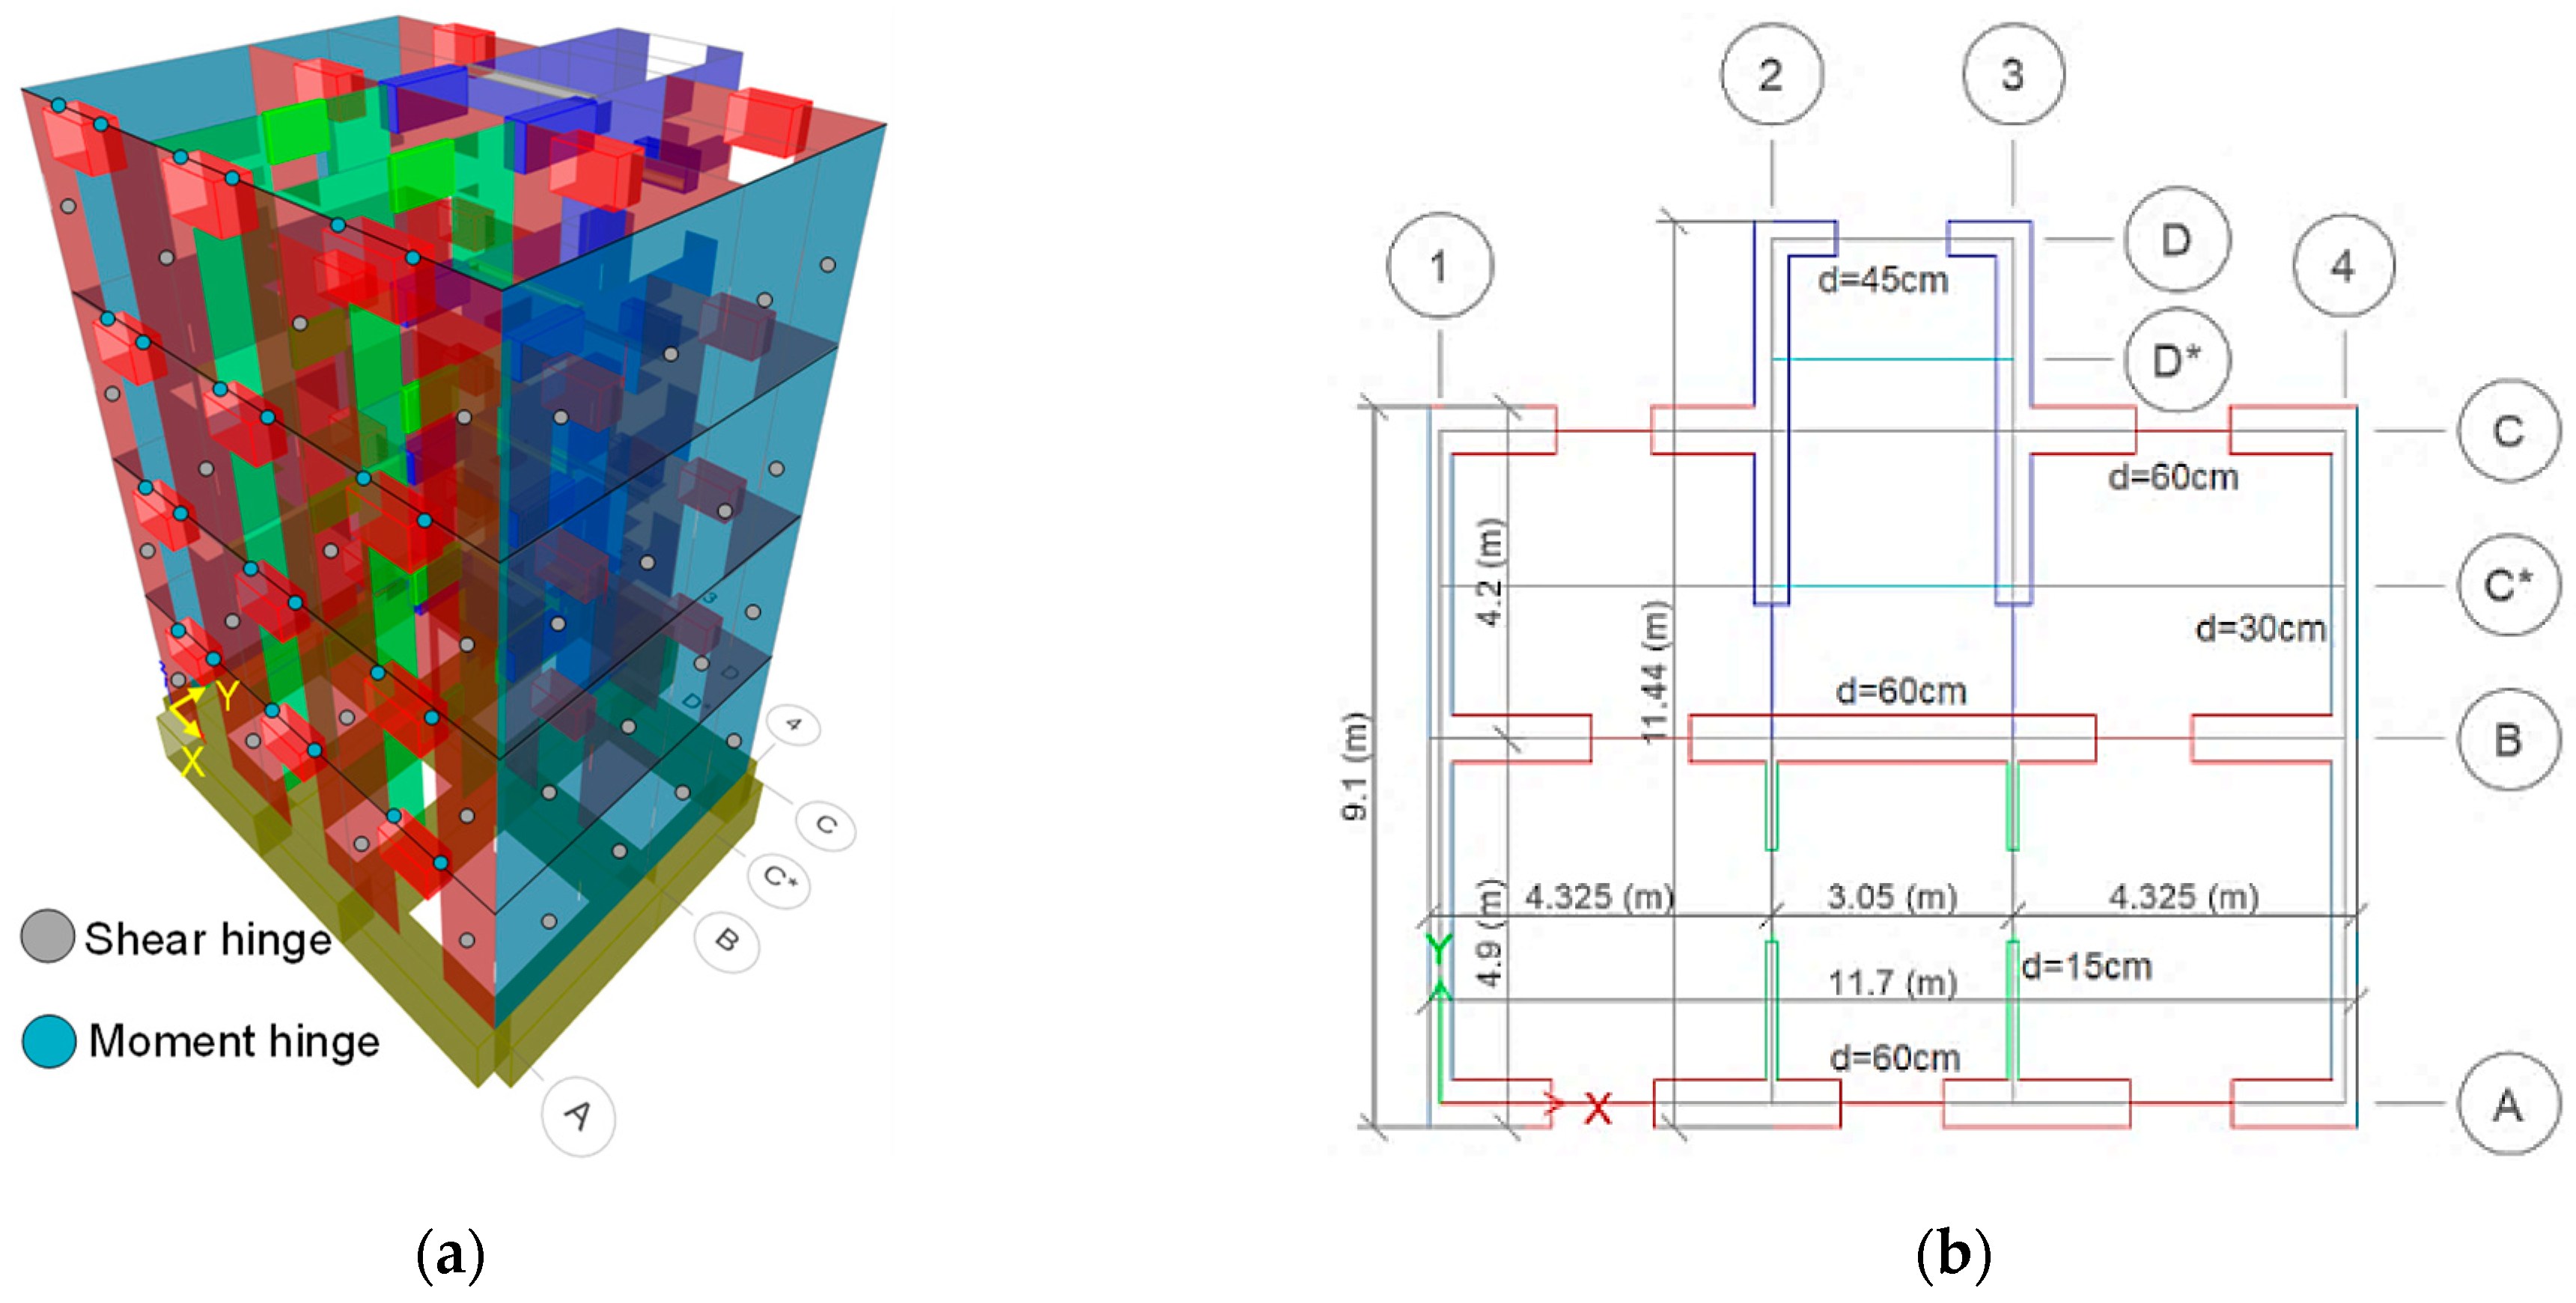
  42. Pinasco, S.; Demšić, M.; Pilipović, A.; Novak, M.Š.; Uroš, M.; Lagomarsino, S.; Cattari, S. Seismic Fragility Assessment of Existing Masonry Buildings in Aggregate Located in Zagreb. Bull. Earthq. Eng. 2025, 23, 2715–2741. [Google Scholar] [CrossRef]
  43. Atalić, J.; Todorić, M.; Uroš, M.; Novak, M.Š.; Crnogorac, M.; Lakušić, S. Potresno Inženjerstvo: Obnova Zidanih Zgrada; University of Zagreb: Zagreb, Croatia, 2021; ISBN 9789538168437. (In Croatian) [Google Scholar]
  44. Computers & Structures, Inc. ETABS: Integrated Building Design Software; Computers & Structures, Inc.: Walnut Creek, CA, USA, 2018. [Google Scholar]
  45. EN 1998-1:2004; CEN Eurocode 8: Design of Structures for Earthquake Resistance. Part 1: General Rules, Seismic Actions and Rules for Buildings, European Standard; Comité Européen de Normalisation: Brussels, Belgium, 2004.
  46. Vamvatsikos, D.; Allin Cornell, C. Incremental Dynamic Analysis. Earthq. Eng. Struct. Dyn. 2002, 31, 491–514. [Google Scholar] [CrossRef]
  47. Lagomarsino, S.; Penna, A.; Galasco, A.; Cattari, S. TREMURI Program: An Equivalent Frame Model for the Nonlinear Seismic Analysis of Masonry Buildings. Eng. Struct. 2013, 56, 1787–1799. [Google Scholar] [CrossRef]
  48. Herak, D.; Herak, M.; Tomljenović, B. Seismicity and Earthquake Focal Mechanisms in North-Western Croatia. Tectonophysics 2009, 465, 212–220. [Google Scholar] [CrossRef]
  49. Ancheta, T.D.; Bozorgnia, Y.; Darragh, R.; Silva, W.J.; Chiou, B.; Stewart, J.P.; Boore, D.M.; Graves, R.; Abrahamson, N.A.; Campbell, K.W.; et al. PEER NGA-West2 Database: A Database of Ground Motions Recorded in Shallow Crustal Earthquakes in Active Tectonic Regions. In Proceedings of the 15th World Conference on Earthquake Engineering, Vancouver, BC, Canada, 1–6 August 2004. [Google Scholar]
  50. Herak, M.; Herak, D.; Orlić, N. Properties of the Zagreb 22 March 2020 Earthquake Sequence—Analyses of the Full Year of Aftershock Recording. Geofizika 2021, 38, 93–116. [Google Scholar] [CrossRef]
  51. Herak, M.; Herak, D. Properties of the Petrinja (Croatia) Earthquake Sequence of 2020–2021—Results of Seismological Research for the First Six Months of Activity. Tectonophysics 2023, 858, 229885. [Google Scholar] [CrossRef]
  52. Seismosoft SeismoSignal—A Computer Program for Signal Processing of Time-Histories. Available online: https://seismosoft.com/ (accessed on 16 November 2025).
  53. Yan, Y.; Xia, Y.; Yang, J.; Sun, L. Optimal Selection of Scalar and Vector-Valued Seismic Intensity Measures Based on Gaussian Process Regression. Soil Dyn. Earthq. Eng. 2022, 152, 106961. [Google Scholar] [CrossRef]
  54. Jafari, A.; Rajabi, E.; Ghodrati Amiri, G. Investigating the Reliability of Ground Motion Intensity Measures. Adv. Civ. Eng. 2024, 2024, 2542967. [Google Scholar] [CrossRef]
  55. Bakalis, K.; Vamvatsikos, D. Seismic Fragility Functions via Nonlinear Response History Analysis. J. Struct. Eng. 2018, 144, 04018181. [Google Scholar] [CrossRef]
  56. Park, Y.J.; Ang, A.H.; Wen, Y.K. Seismic damage analysis of reinforced goncrete buildings. J. Struct. Eng. 1985, 111, 740–757. [Google Scholar] [CrossRef]
  57. Rudman, A.; Tubaldi, E.; Douglas, J.; Scozzese, F. The Impact of the Choice of Intensity Measure and Seismic Demand Model on Seismic Risk Estimates with Respect to an Unconditional Benchmark. Earthq. Eng. Struct. Dyn. 2024, 53, 4183–4202. [Google Scholar] [CrossRef]
  58. Hamburger, R.O.; Rojahn, C.; Heintz, J.A.; Mahoney, M.G. FEMA P58: Next-Generation Building Seismic Performance Assessment Methodology. In Proceedings of the 15th World Conference on Earthquake Engineering, Lisbon, Portugal, 24–28 September 2012. [Google Scholar]
  59. Pejovic, J.; Jankovic, S. Seismic Fragility Assessment for Reinforced Concrete High-Rise Buildings in Southern Euro-Mediterranean Zone. Bull. Earthq. Eng. 2016, 14, 185–212. [Google Scholar] [CrossRef]
  60. Grünthal, G. European Seismological Commission. Working Group “Macroseismic Scales”. In European Macroseismic Scale 1998: EMS-98; European Seismological Commission, Subcommission on Engineering Seismology, Working Group Macroseismic scales: Istanbul, Turkey, 1998; ISBN 2879770084. [Google Scholar]
  61. Iervolino, I. Assessing Uncertainty in Estimation of Seismic Response for PBEE. Earthq. Eng. Struct. Dyn. 2017, 46, 1711–1723. [Google Scholar] [CrossRef]
  62. Whittaker, A.; Deierlein, G.G.; Hooper, J.; Merovich, A. Engineering Demand Parameters for Structural Framing Systems; Federal Energency Management Agency: Washington, DC, USA, 2004. [Google Scholar]
  63. Inarritu, P.G.d.Q.; Kohrangi, M.; Bazzurro, P. Damage Assessment of Unreinforced Masonry Buildings Incorporating Damage Accumulation. Earthq. Eng. Struct. Dyn. 2024, 53, 2122–2140. [Google Scholar] [CrossRef]
  64. Anderson, T.W.; Darling, D.A. A Test of Goodness of Fit. J. Am. Stat. Assoc. 1954, 49, 765–769. [Google Scholar] [CrossRef]
  65. Pinasco, S.; Demšić, M.; Šavor Novak, M.; Uroš, M.; Cattari, S.; Lagomarsino, S. Numerical Investigation of the Seismic Response of an Unreinforced Masonryresidential Building Hit by Zagreb Earthquake in 2020. In Proceedings of the 2nd Croatian Conference on Earthquake Engineering, Zagreb, Croatia, 22–24 March 2023; pp. 638–648. [Google Scholar]
  66. Bradley, B.A. A Generalized Conditional Intensity Measure Approach and Holistic Ground-Motion Selection. Earthq. Eng. Struct. Dyn. 2010, 39, 1321–1342. [Google Scholar] [CrossRef]
  67. Arias, A. A Measure of Earthquake Intensity. In Seismic Design for Nuclear Power Plants; Hansen, R., Ed.; MIT Press: Cambridge, UK, 1970; pp. 438–483. [Google Scholar]
  68. Reed, J.W.; Kassawara, R.P. A Criterion for Determining Exceedance of the Operating Basis Earthquake. Nucl. Eng. Des. 1990, 123, 387–396. [Google Scholar] [CrossRef]
  69. Housner, G. Measures of Severity of Earthquake Ground Shaking. In Proceedings of the US National Conference on Earthquake Engineering, Ann Arbor, MI, USA, 18–20 June 1975; EERI: Ann Arbor, Michigan, 1975. [Google Scholar]
  70. Eads, L.; Miranda, E.; Lignos, D.G. Average Spectral Acceleration as an Intensity Measure for Collapse Risk Assessment. Earthq. Eng. Struct. Dyn. 2015, 44, 2057–2073. [Google Scholar] [CrossRef]
  71. Caicedo, D.; Lourenço, P.B.; Bernardo, V.; Karimzadeh, S. Optimal Intensity Measures for Probabilistic Seismic Demand Models of Historical Masonry Buildings Considering In-Plane and out-of-Plane Response. In Proceedings of the Atas do 13 Congresso Nacional de Sismologia e Engenharia Sismica, Guimaraes, Portugal, 17–19 April 2024; Oliviera, D.V., Lourenco, P.B., Guerreiro, L., Silva, R.A., Eds.; University of Minho: Guimanaraes, Portugal, 2024. [Google Scholar]
  72. Makris, N.; Black, C.J. Evaluation of Peak Ground Velocity as a “Good” Intensity Measure for Near-Source Ground Motions. J. Eng. Mech. 2004, 130, 1032–1044. [Google Scholar] [CrossRef]
  73. Rajabi, R.; Barghi, M.; Rajabi, R. Investigation of Park-Ang Damage Index Model for Flexural Behavior of Reinforced Concrete Columns. Struct. Des. Tall Spec. Build. 2013, 22, 1350–1358. [Google Scholar] [CrossRef]
  74. Garcia De Quevedo Inarritu, P.; Bazzurro, P.; Lagomarsino, S.; Cattari, S. Validation of an Energy and Drift Based EDP for Cumulative Damage on URM Buildings. In Proceedings of the 18th World Conference on Earthquake Engineering, Milan, Italy, 30 June–5 July 2024. [Google Scholar]
Figure 1. Flowchart of the optimal intensity measure selection procedure adopted in this study.
Buildings 15 04261 g001
Figure 2. (a) Representation of the 3D nonlinear model of the analyzed unreinforced masonry building; (b) Characteristic storey plan with highlighted main dimensions and wall thickness.
Buildings 15 04261 g002
Figure 3. Modal shapes for the first 3 modes of the building (periods T1 = 0.693 s, T2 = 0.505 s, T3 = 0.396 s).
Buildings 15 04261 g003
Figure 4. Capacity curves of: (a) moment hinges (moment vs. rotation) for spandrels; (b) shear in-plane hinges (shear force vs. drift) for walls. Acceptance criteria are considered according to Eurocode 8 (0.4% drift ratio for the SD limit state and 4/3 of 0.4% drift ratio for the NC limit state in case of shear displacement). This Figure was adapted from [43].
Buildings 15 04261 g004
Figure 5. Elastic 5% damped mean spectra of all selected IDA records for 12 intensity levels as measured by PGA in the X direction up to 0.3 g in increments of 0.025 g. An Eurocode 8 spectrum type I for a characteristic location in Zagreb with agR = 0.25 g, soil class C, and importance class II is provided for reference. Spectra are shown separately for records in (a) X direction and (b) Y direction.
Buildings 15 04261 g005
Figure 6. Traditional IM metrics based on linear regression of the seismic demand model for finding the optimal IM: efficiency, practicality, and proficiency.
Buildings 15 04261 g006
Figure 7. Qualitative impact of 3 different sets of fragility functions for DS2–DS5 on the vulnerability curve and its variance: (a) Set 1: Fragility curves with well separated mean values and low dispersion; (b) Set 2: Fragility curves with moderate dispersion and closely spaced mean values at higher damage states; and (c) Set 3: Fragility curves with high dispersion and closely spaced mean values at all damage states. Vulnerability curves are obtained from Equation (7). Variances and their first derivatives are shown as dashed lines. Instances of local maxima followed by local minima of the first derivative are shown in green, bounded by red points, and are added to the total NGLM count. GLM values are obtained from Equation (8) at IM levels where GLMs are located. The variance and its first derivative are not in scale.
Buildings 15 04261 g007
Figure 8. Histogram plots for all structural responses in terms of IDRavg, with fitted lognormal distributions. (a) X direction, bin width 0.04%, and dashed vertical line delineates IDRavg = 0.8%. Responses beyond this point were not included in the lognormal fit; (b) Y direction, bin width 0.02%.
Buildings 15 04261 g008
Figure 9. IDA curves in terms of IDRmax versus PGA for 3 indicated ground motion records, separated by storeys (SG—ground floor, Sn—nth storey) for the Y direction. IDRavg is also indicated.
Buildings 15 04261 g009
Figure 10. Derived EDP-IM relationships for all analyzed IMs in the X direction. Both the original data points and the fitted power laws are shown, including uncertainty within one standard deviation.
Buildings 15 04261 g010
Figure 11. Derived EDP-IM relationships for all analyzed IMs in the Y direction. Both the original data points and the fitted power laws are shown, including uncertainty within one standard deviation.
Buildings 15 04261 g011
Figure 12. Considered IM metrics for all the tested IMs and for both directions: (a) Efficiency—σEDP|IM; (b) G-precision—R2 (alternative to efficiency); (c) Practicality—b; and (d) Proficiency—σEDP|IM/b.
Buildings 15 04261 g012
Figure 13. Vulnerability curves for all considered IMs for the reference URM building and their variances (dashed), developed separately for X (red) and Y (blue) directions, with MDR as the loss metric.
Buildings 15 04261 g013
Figure 14. Vulnerability curves for (a) Sa,avg, (b) PGV, and (c) PGA for the Y direction. The variance and its first derivative are shown as dashed lines, not in scale. GLMs are marked by arrows. Instances of variance derivative when GLMs occur are shown in green with red points marking the extrema.
Buildings 15 04261 g014
Figure 15. New criteria for all the tested IMs and for both directions: (a) Maximum GLM; (b) number of GLMs.
Buildings 15 04261 g015
Table 1. Solid brick material properties used in the nonlinear model.
Volumetric weightγ [kN/m3]18
Modulus of elasticityEM [N/mm2]1500
Shear modulusGM [N/mm2]500
Masonry compression strengthfm [N/mm2]3.400
Initial shear strength of masonryfv0 [N/mm2]0.160
Diagonal tensile strength of masonryft [N/mm2]0.114
Friction coefficientμ0.400
Brick compression strengthfb [N/mm2]10.00
Table 2. Seismotectonic parameters of original unmodified ground motion records selected for IDA analyses—X direction.
IDStationMagnitude MwDistance to Source Rrup [km]Shear Wave Velocity Vs,30 [m/s]PGA [g]PGV [m/s]Sa,avg
[g]
Scale
Factor (Min)
Scale
Factor (Max)
RSN70_SFESan Fernando6.6127.4425.340.1510.1820.2870.1651.816
RSN130_FFriuli 02–Buia5.9111.03310.680.1100.1080.2420.2272.267
RSN359_CCoalinga–016.3626.38381.270.1790.1800.2930.1401.400
RSN949_NNorthridge–01–Arleta6.698.66297.710.3450.4110.5780.0720.724
RSN953_NNorthridge–01–Beverly Hills6.6917.15355.810.4430.5930.8930.0560.564
RSN957_NNorthridge–01–Burbank6.6916.88581.930.1120.1070.2400.2242.240
RSN4276_FFriuli Aftershock–Buia5.512.39310.680.2310.2170.5360.1081.083
RSN4277_FFriuli Aftershock–Forgaria Cornino5.516.52412.370.1290.0880.2220.1932.124
RSN4455_MMontenegro–Herceg Novi7.125.55585.040.2180.1400.4700.1141.145
RSN4456_MMontenegro–Petrovac7.18.01543.260.4630.3870.9510.0540.539
RSN4457_MMontenegro–Ulcinj7.14.35410.350.1830.1920.3630.1361.500
UHS ZG_22_03Zagreb UHS 22.3.2020.5.38<380.000.1790.1150.2420.1402.095
UHS_PetrinjaPetrinja UHS December 2020.6.447<380.000.0980.0630.1540.2564.098
Table 4. All considered IMs with corresponding GLM and NGLM values for X and Y directions.
IMGLM X DirectionGLMmaxGLM Y DirectionGLMmaxNGLM XNGLM Y
PGA0.15%10.55% 10.55%10.76% 10.76%21
PGV0.15%4.34%6.06% 6.06%0.15%0.98%5.31% 5.31%33
PGD11.59% 11.59%12.46% 12.46%11
Arms0.26%8.56% 8.56%12.81% 12.81%21
Vrms8.55%5.90% 8.55%0.23%8.10% 8.10%22
IA9.23% 9.23%0.15%8.58% 8.58%12
IC0.17%9.14% 9.14%0.16%8.41% 8.41%22
CAV12.41% 12.41%10.06% 10.06%11
HSI0.16%3.61%7.46% 7.46%0.17%0.92%6.09% 6.09%33
Sa,avg0.11%3.62%5.63% 5.63%0.15%1.00%4.51%4.01%4.51%34
Sa(T1)0.15%5.06%4.68%4.04%5.06%0.16%0.87%7.13% 7.13%43
Sa(T2)10.81% 10.81%0.27%8.58% 8.58%12
Disclaimer/Publisher’s Note: The statements, opinions and data contained in all publications are solely those of the individual author(s) and contributor(s) and not of MDPI and/or the editor(s). MDPI and/or the editor(s) disclaim responsibility for any injury to people or property resulting from any ideas, methods, instructions or products referred to in the content.