Article

Causal Discovery and Validation in Summer Weather Data with a Conceptual Extension to Cooling Energy Use

Korea Institute of Civil Engineering and Building Technology, 283, Goyang-daero, Ilsanseo-gu, Goyang-si 10223, Gyeonggi-do, Republic of Korea
*
Author to whom correspondence should be addressed.
Buildings 2025, 15(23), 4248; https://doi.org/10.3390/buildings15234248
Submission received: 9 October 2025 / Revised: 13 November 2025 / Accepted: 20 November 2025 / Published: 25 November 2025

Abstract

Traditional data-driven approaches emphasize input–output correlations and neglect dependencies among inputs, risking missed insights into key drivers of energy performance. Consequently, approaches that transcend correlation-centric analysis are warranted. Within this context, causal inference, which accounts for both statistical associations and temporal cause–effect relations, constitutes a promising direction. However, researchers cannot feasibly specify all causal relations relying solely on domain knowledge. Causal discovery is a data-driven methodology for analyzing causal relationships among variables, providing not only measures of association but also information on causal directionality. The authors employ two causal discovery algorithms—PC (Peter-Clark) and FCI (Fast Causal Inference)—on weather data. The discovered causal structures are compared, and two validation approaches are introduced to evaluate their statistical reliability; the authors also build on the identified causal structure to analyze the resulting causal pathways. The results show that both algorithms provide insights into causal relationships among variables, and the proposed validation approaches help establish the statistical reliability of the discovered structures. Moreover, the analysis of causal pathways indicates that causal effects can be identified and estimated with reliability.

1. Introduction

Buildings constitute a substantial share of global carbon emissions, rendering climate change and decarbonization urgent environmental imperatives. In response, research has focused on constructing and forecasting building energy consumption models that explicitly incorporate building design attributes and climatic drivers. Given its capacity to enable rapid model development with few input variables, the data-driven paradigm has become predominant in building energy consumption modeling [1]. Within this broader effort, South Korea has undertaken systematic collection of building and energy datasets for benchmarking and is examining how climatic and building-related factors influence Energy Use Intensity (EUI) [2].
However, conventional data-driven modeling predominantly characterizes associations between input and output variations—i.e., statistical correlations—while omitting explicit representation of causal mechanisms. This omission renders analyses vulnerable to bias when unpredictable factors (e.g., occupant behavior) or intricate interdependencies are present [3]. These methods also tend to misinterpret coincidental events as substantive associations and offer limited interpretability of the prediction process. Consequently, approaches that transcend correlation-centric analysis are warranted. Within this context, causal inference, which account for both statistical associations and temporal cause–effect relations, constitute a promising direction [4].
Accordingly, studies have been conducted to enhance explanatory power for the relationships among building and climatic factors by applying causal inference methods that explicitly account for cause–effect relationships. Zhou et al. [5] demonstrated, using causal inference, that the effects of energy policies on Chinese cities can be statistically analyzed; Sun et al. [6] showed that, in thermal comfort analysis, the interpretation of causal relationships can change entirely depending on the specified causal direction; and Mun and Park [7] explained that interpretable control strategies can be developed through causal relationship analysis.
Although the usefulness of causal inference has been demonstrated in the building energy domain, systematic efforts to understand and design causal structures remain scarce. Owing to the lack of foundational research on the substantive causal mechanisms linking building and climatic factors, there are inherent limits to identifying causal relationships solely through empirical knowledge as the number of variables requiring inference increases (i.e., as the causal structure becomes more complex). This can lead to mistaking spurious correlations for genuine relationships or to distorting true causal effects. Therefore, approaches that infer causal relationships directly from observational data are needed [8]. Causal discovery is an approach for identifying and interpreting causal relationships among variables based on a given dataset [9]. By uncovering such causal structures, it moves beyond simple correlations to reveal dependencies inherent in the data and thereby improves the accuracy of predictive models and the reliability of decision-making processes [10].
Table 1 summarizes the findings from the literature cited above. Prior research has focused primarily on causal inference or conceptual foundations, whereas the present study advances causal discovery through data-driven structure learning and reliability validation applied to building energy datasets. Causal discovery not only captures statistical correlations but also provides information on causal directionality, thereby enhancing model interpretability. Moreover, by excluding confounding factors during causal inference, it improves the accuracy of impact estimation.
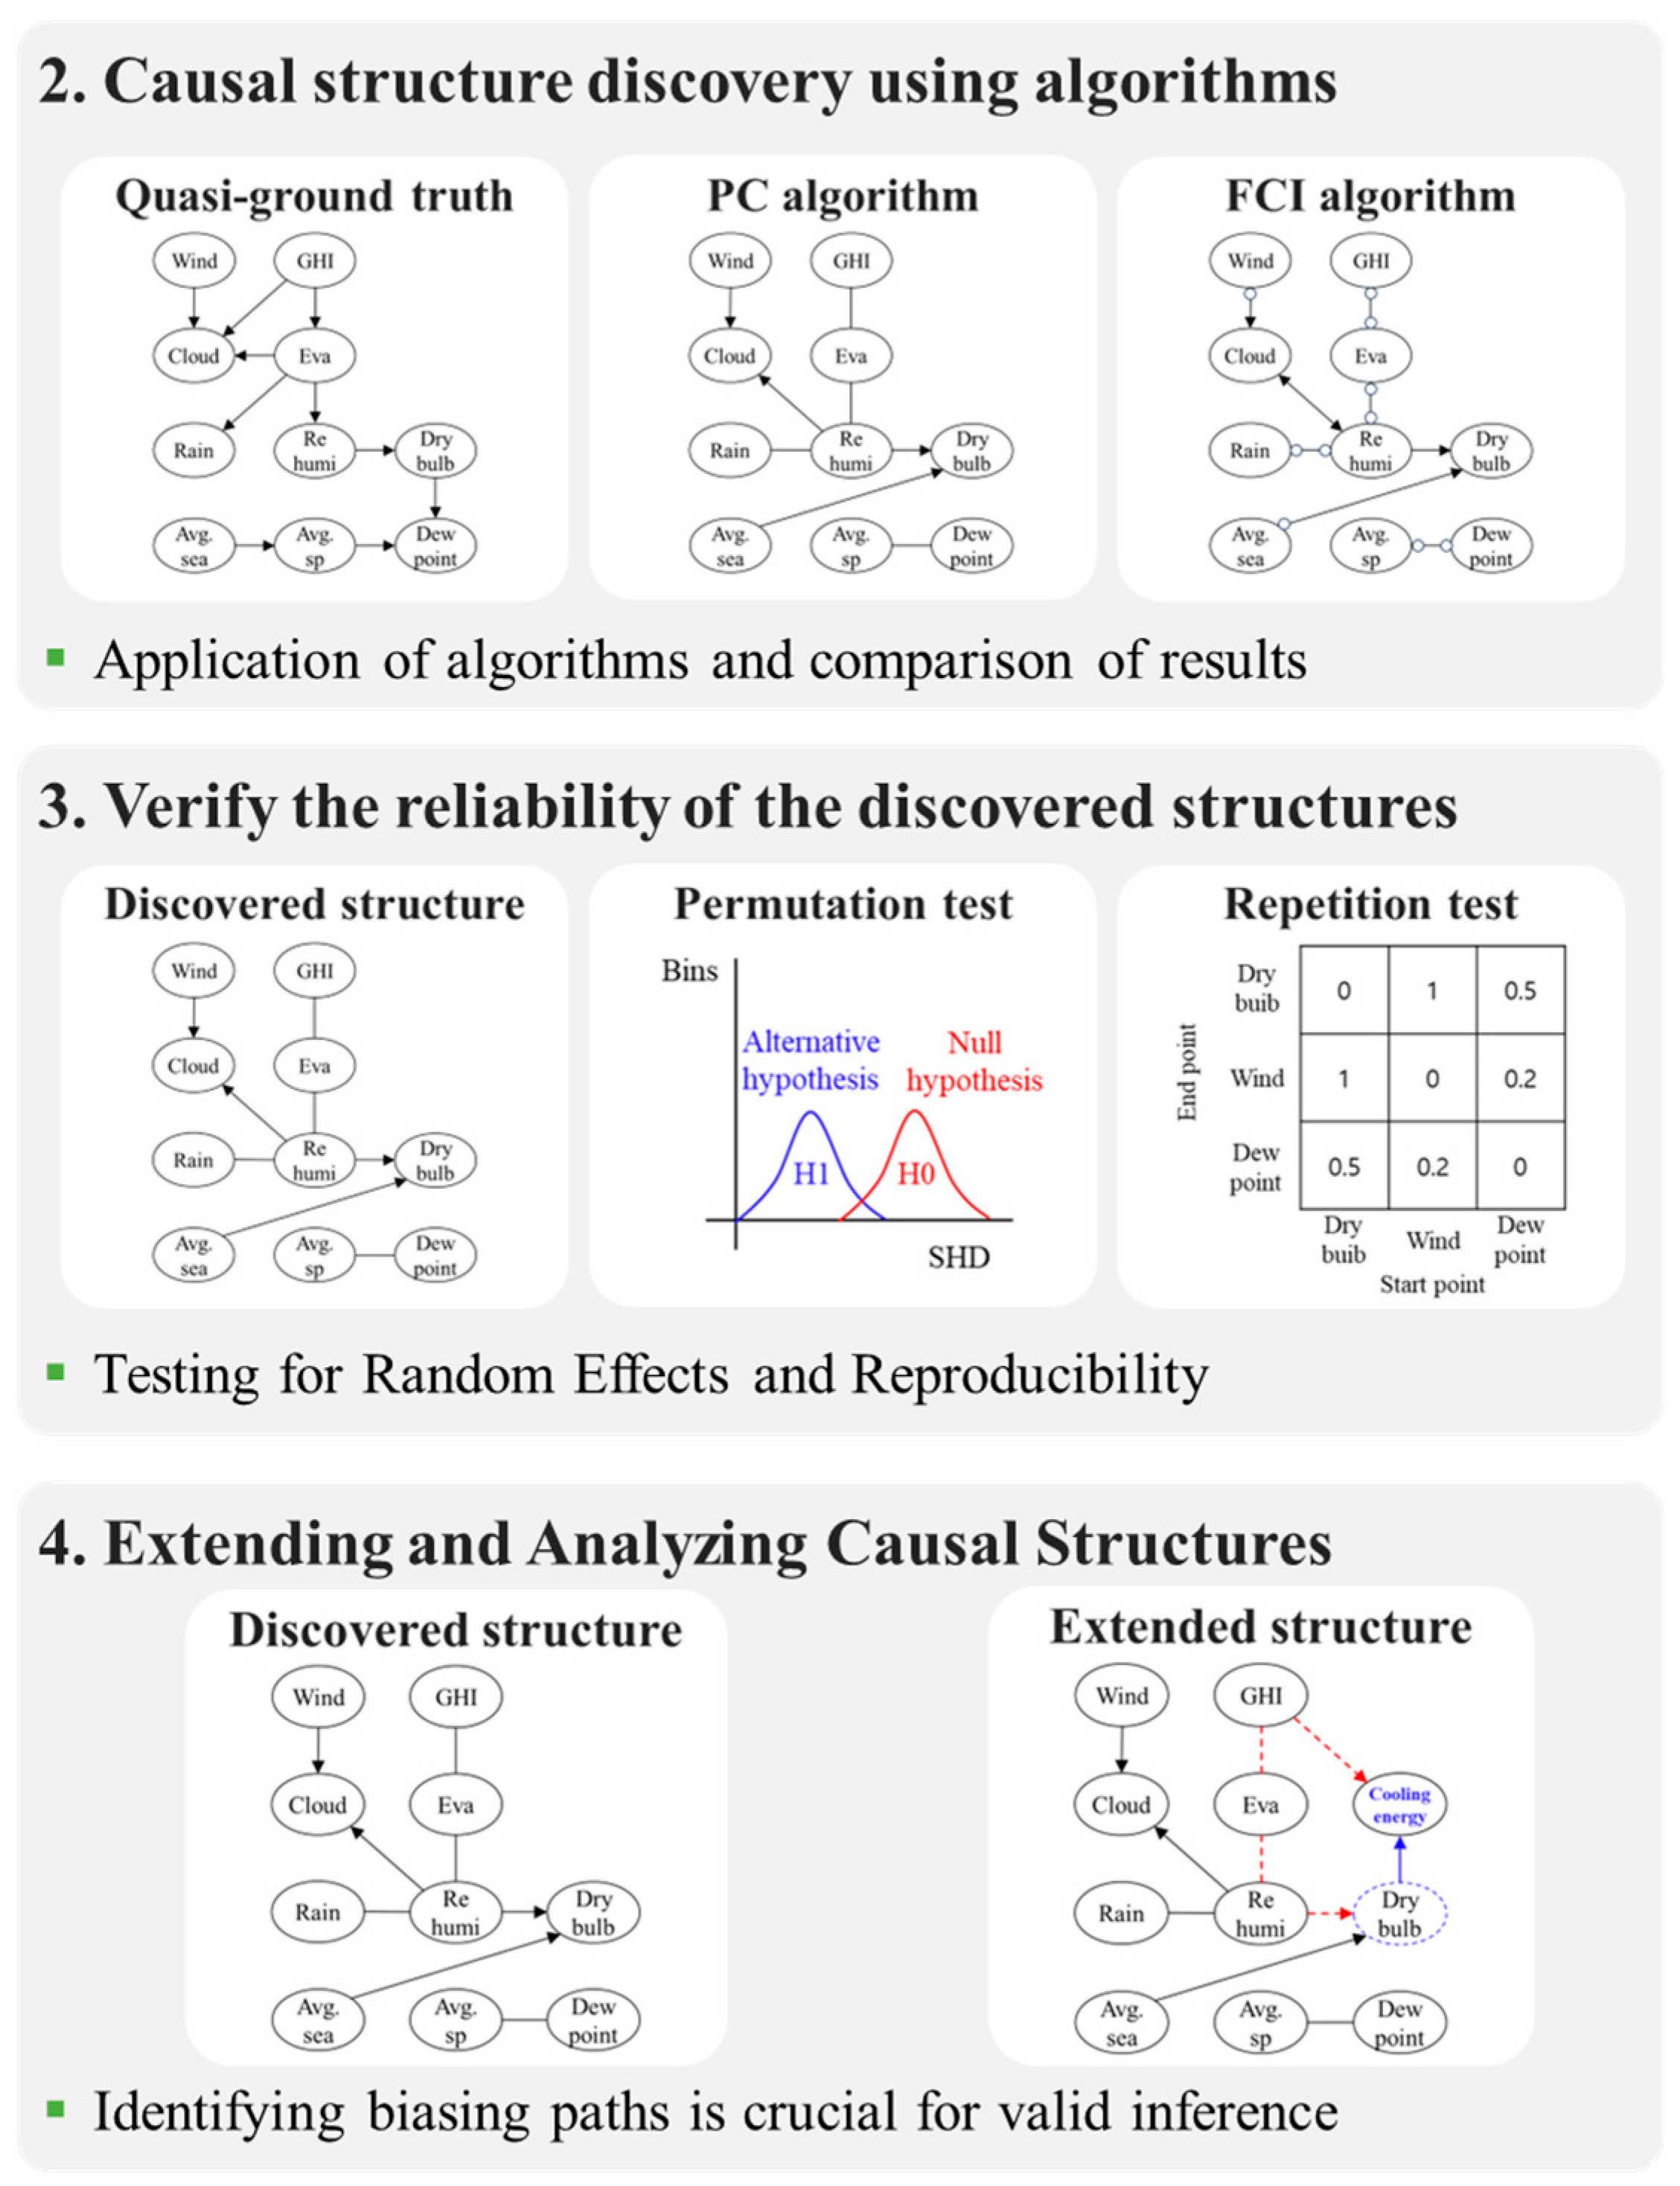
Therefore, as a pilot investigation into causal analysis, this study applies two widely used causal discovery algorithms—Peter–Clark (PC) and Fast Causal Inference (FCI)—to summer weather data from South Korea in order to analyze causal pathways through which weather factors affect cooling energy use, and then comparatively evaluates the causal structures each algorithm yields. To assess the reliability of the discovered structures, the authors further propose two validation procedures: a permutation test and a repetition test. Building on the causal structure identified from the weather data, the authors subsequently extend the framework to include a cooling energy variable and discuss procedures for detecting biasing paths during causal impact analysis. As illustrated in Figure 1, the experiment proceeds in four stages:
  • Preprocessing of weather data and specification of a researcher-defined (hypothesized) causal structure.
  • Causal structure discovery using the PC and FCI algorithms.
  • Application of the permutation test and the repetition test, followed by comparative analysis of the results.
  • Extension of the discovered causal structure to incorporate a cooling energy variable and analysis of biasing paths.

2. Method

2.1. Causal Discovery Algorithm

Causal discovery is a data-driven methodology for analyzing causal relationships among variables, providing not only measures of association but also information on causal directionality. For datasets containing a small number of variables, empirical knowledge or conventional equation-based approaches are often sufficient for causal structure analysis. However, as the number of variables increases, the limitations of relying solely on empirical knowledge become evident, underscoring the need for a foundational framework and guidelines for identifying causal relationships using causal discovery techniques. In this study, the authors adopt constraint-based methods—which explore causal structures by testing conditional independence among variables—and employ two widely used algorithms in this class: The Peter–Clark (PC) algorithm and the Fast-Causal Inference (FCI) algorithm.
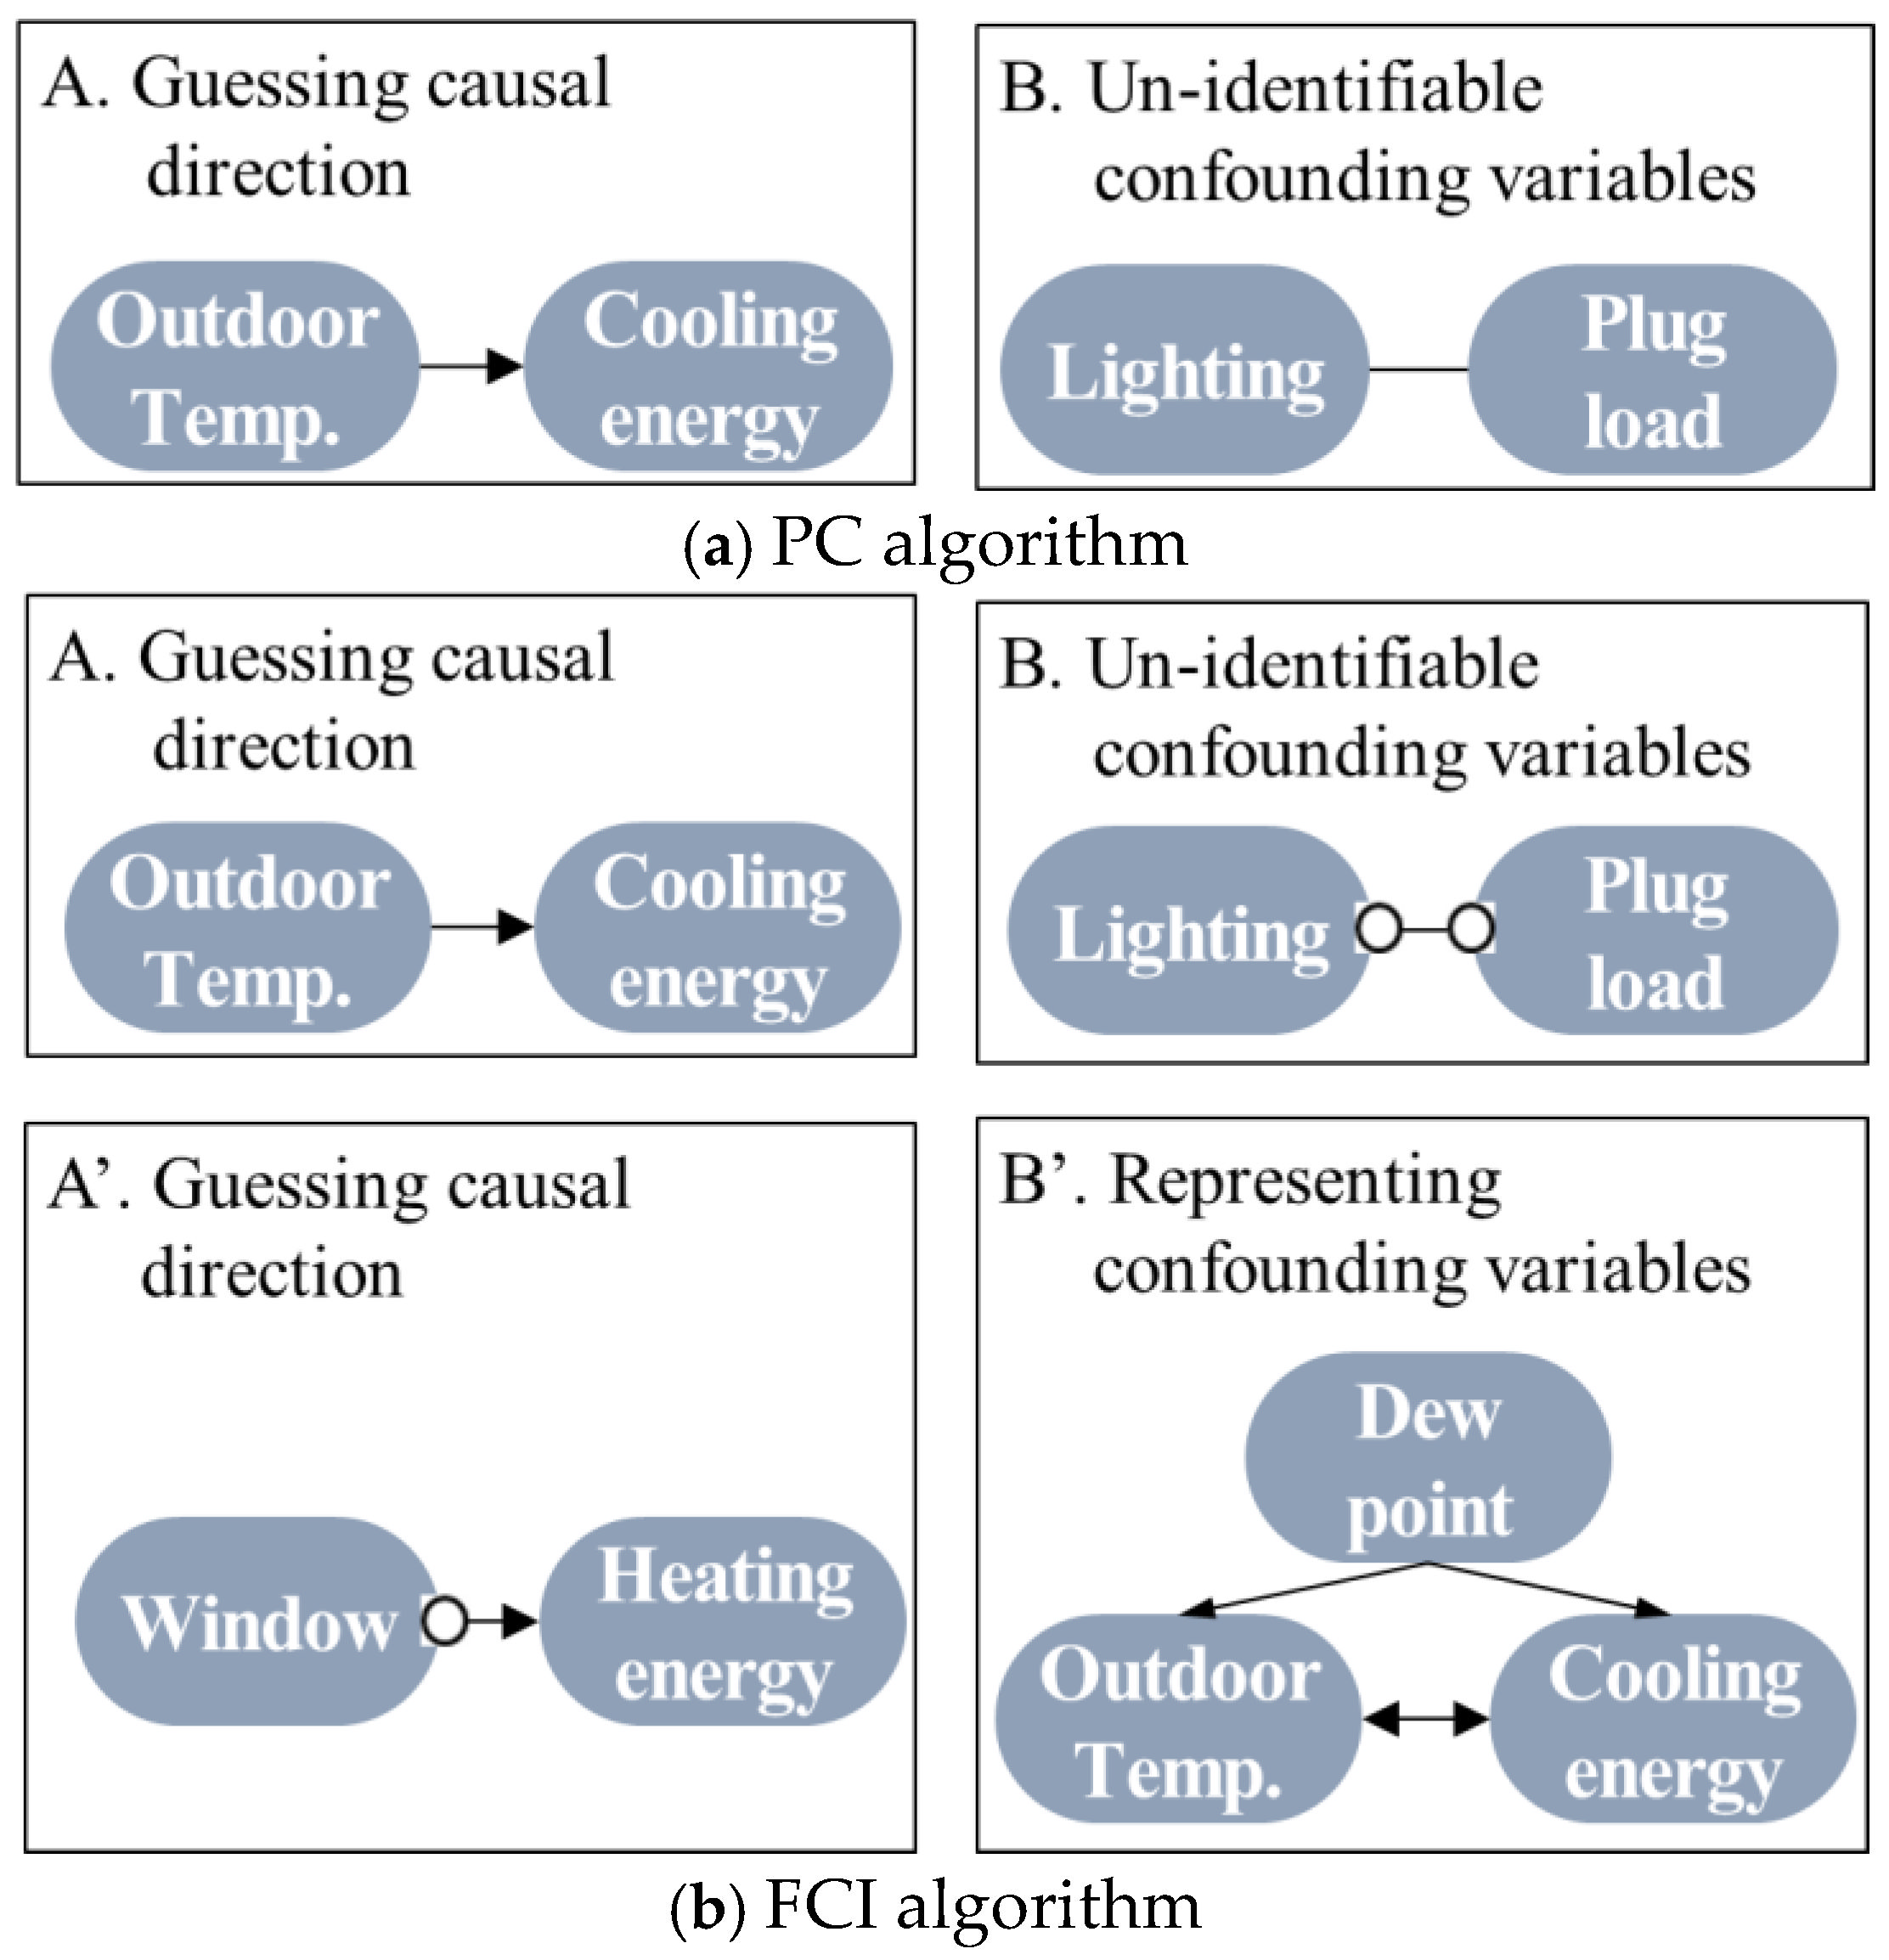
Both the PC algorithm and the FCI algorithm represent information flow between nodes using Directed Acyclic Graphs (DAGs). The PC algorithm [11] discovers a causal structure under the assumption that no unobserved confounders are present: it conducts conditional independence tests for each pair of variables, removes an edge when independence is established, and then orients the remaining edges to complete the causal graph. In the PC algorithm, edge information is conveyed using only two marks, “→” and “—“ (Figure 2a). For example, Outdoor tempCooling energy indicates a definite flow of influence from outdoor temperature to cooling energy, whereas LightingPlug load indicates that the causal direction cannot be identified at the specified significance level (p-value) [12]. However, because the PC algorithm operates under the assumption of no hidden confounders, it may face difficulties in accurately identifying causal relationships when such confounders do exist.
In contrast, the FCI algorithm [11] builds on the PC algorithm but is distinguished by permitting the presence of latent (unobserved) confounders. It is designed to operate even when some or all confounding variables are unobserved. While its initial edge-removal phase resembles that of the PC algorithm, FCI explicitly accounts for latent variables when orienting edges, thereby yielding information that is often more applicable to real-world settings (Figure 2b).
FCI represents edges using four marks: “→”, “↔”, “∘→”, and “∘─∘”. Circle endpoints (“∘”) denote uncertainty about the endpoint’s orientation, and the bidirected mark (“↔”) encodes the possibility of a latent confounder between two nodes. For example, “A∘→B” indicates that a confounder may exist between A and B, yet there is a definite orientation from A to B and no flow from B to A. “A∘─∘B” signifies that A and B are associated but the causal direction is indeterminate (analogous to the “—“ mark in the PC algorithm). “A↔B” denotes the presence of a latent confounder between A and B [12].
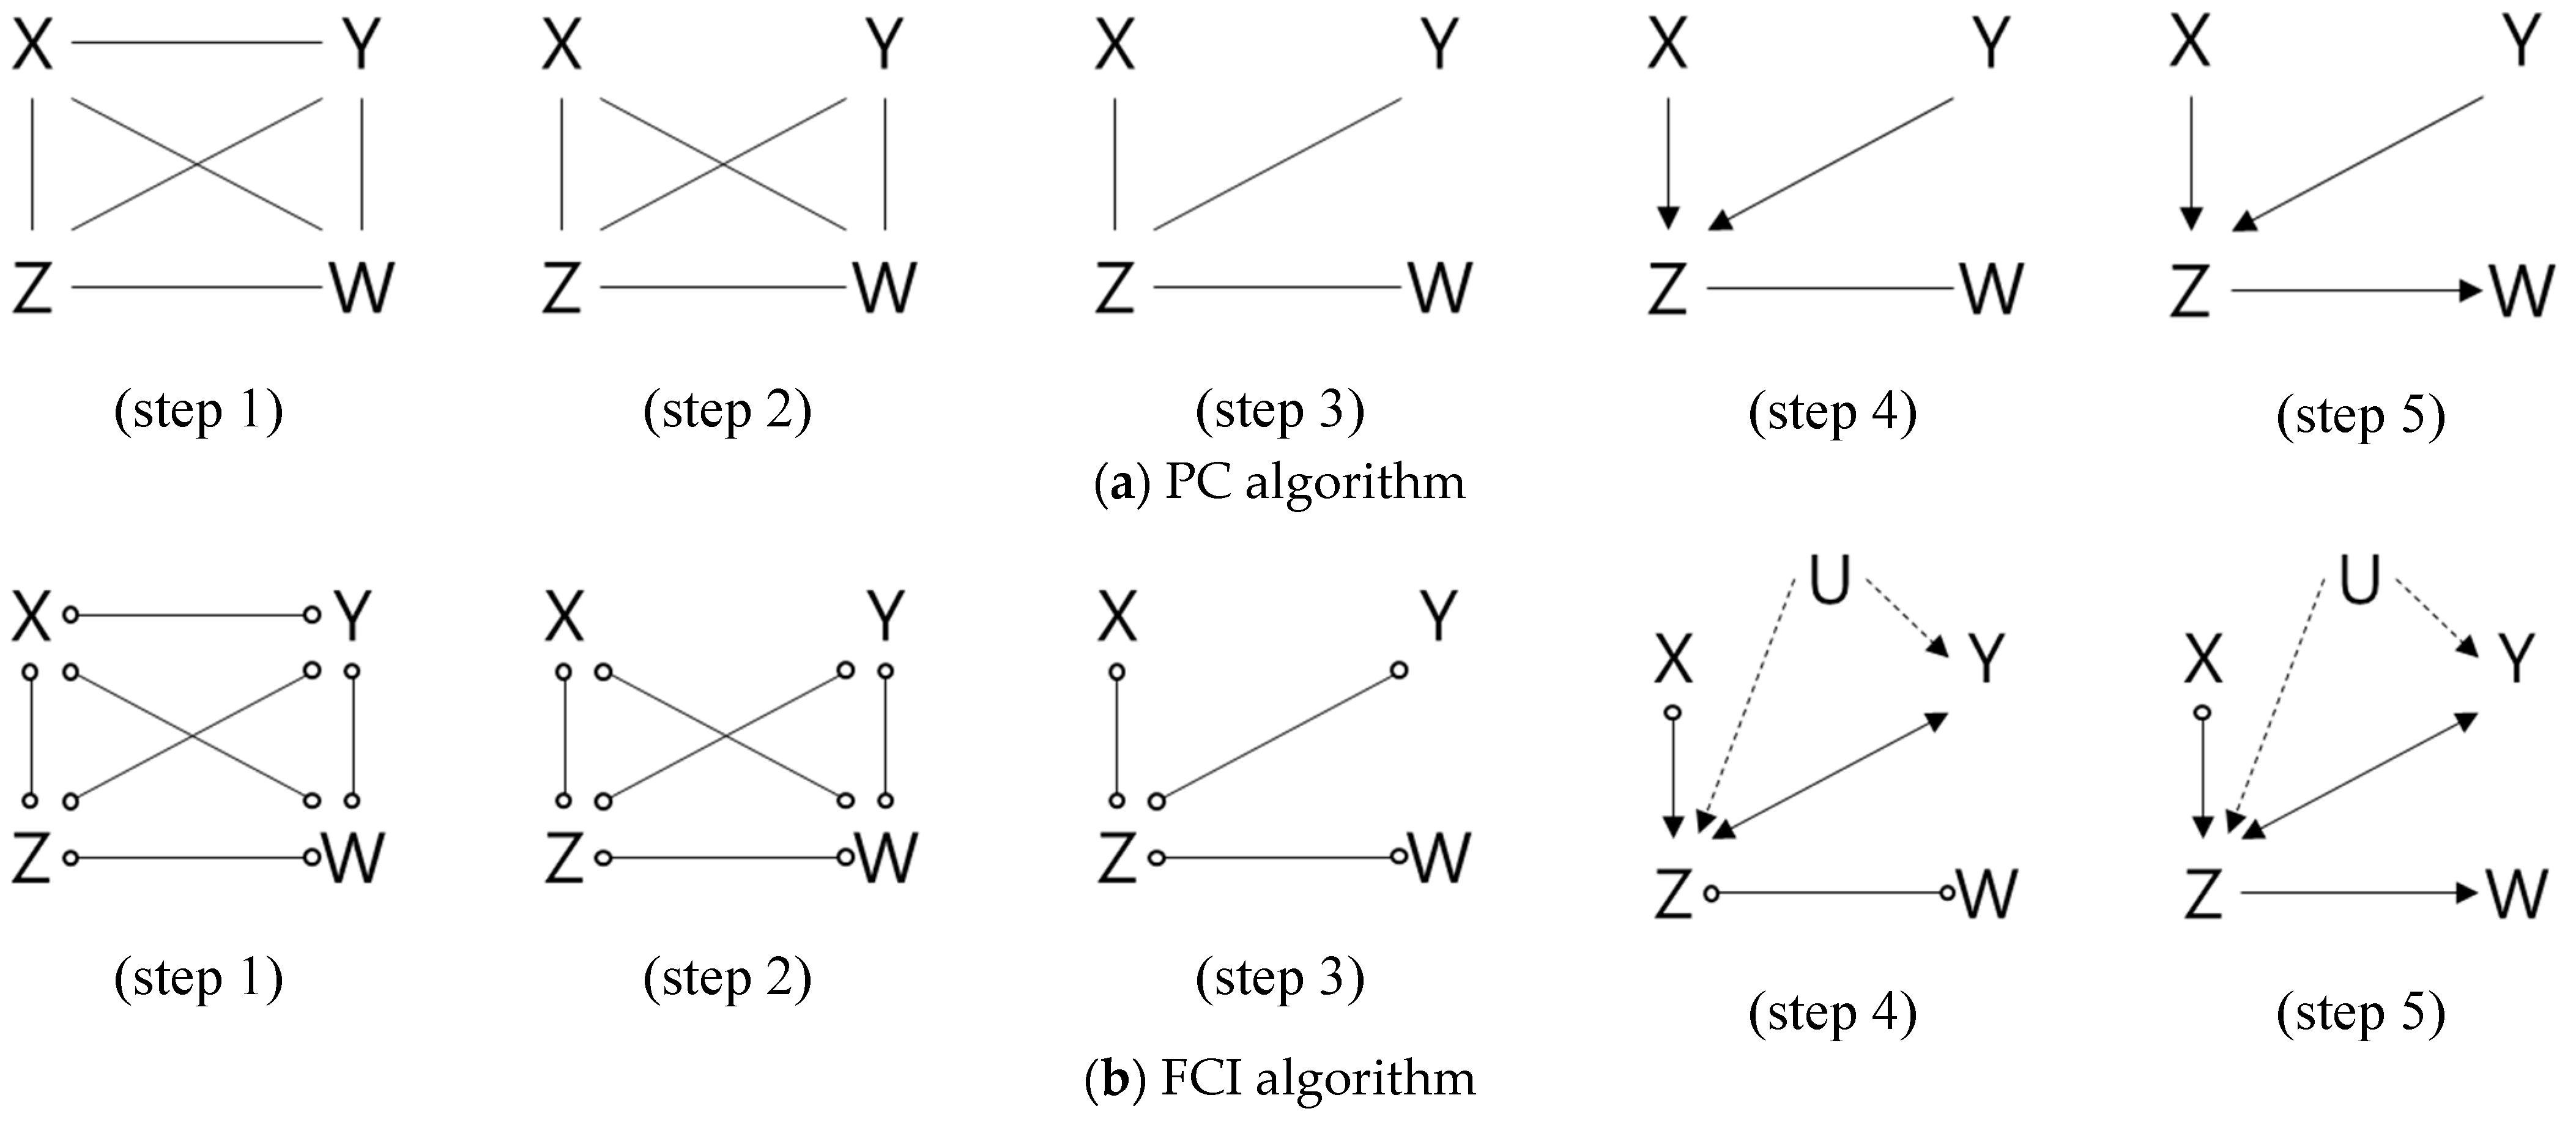
The operation of the PC algorithm consists of five steps (Figure 3; [11]).
  • Step 1. Construct the initial graph by drawing undirected edges between all variables.
  • Step 2. Test marginal (unconditional) independence for every pair of variables and remove the corresponding edge if independence holds.
    -
    Example: if X⊥Y, remove X−Y (e.g., chi-square test, G-test, or correlation-based test).
  • Step 3. For every pair (X, Y), perform conditional independence tests given a conditioning set Z.
    -
    Example: if X⊥Y∣Z holds, remove the edge X−Y. Repeat this procedure while increasing the size of the conditioning set.
  • Step 4. For any triple X−Z−Y that is connected, if X and Y are not independent given Z (X not⊥Y∣Z), orient it as a collider: X→Z←Y.
  • Step 5. Determine the remaining edge orientations using orientation propagation (e.g., Meek’s rules), ensuring acyclicity, preserving non-colliders, and enforcing additional orientation constraints [13].
The operation of the FCI algorithm is similar to that of PC, but it differs in the component that detects latent variables. For example, while Step 3 (skeleton construction) proceeds analogously, in Step 4, if a collider structure is identified such that X→Z and Y→Z, the algorithm explores all possible directional configurations among X, Y, and Z. If the bidirectional configuration best explains the observed dependencies, this is interpreted as evidence of an unobserved common cause (latent variable) between Y and Z, which is then represented as Y↔Z. In Step 5, the orientation Z→W is selected by considering the overall pattern—such as whether W remains independent when conditioning on Z together with all other variables (e.g., X, Y) and whether Z functions as an information bottleneck [11,13]. To demonstrate the core mechanism underlying the differences between the PC and FCI algorithms, a simplified three-variable example (outdoor temperature, irradiation, and cooling energy) was included (Figure 4). In a relationship where outdoor temperature influences cooling energy, and irradiation affects both outdoor temperature and cooling energy, authors assumed a case in which irradiation is unobserved.
In this situation, the PC algorithm focuses on identifying causal directionality, whereas the FCI algorithm additionally explores the presence of latent confounders among variables beyond directional information.
Both the PC and FCI algorithms were implemented using the Python package causal-learn version 0.1.4.3 [14]. For conditional independence testing, Fisher’s Z test was applied with a default significance level (alpha) of 0.05 for individual partial correlation tests. For the significance level of 0.05, classical statistical texts [15] originally provided tables of critical values for the 0.1, 0.05, 0.02, and 0.01 levels. However, subsequent research has come to regard the 0.05 level as the sole standard for assessing “statistical significance.” Following this convention, the independence tests in this study were conducted using a significance level of 0.05.

2.2. Permutation and Repetition Tests for Validating Discovered Causal Structure

Assaad et al. [16] proposed an evaluation approach for causal discovery models that computes the F1-score by comparing the learned graph against a consensus ground truth structure (i.e., a gold standard). However, the building energy domain remains at an early stage of observational research (especially in South Korea [17,18,19,20,21]), and no broadly accepted benchmark of intervariable causal structure has not yet been established. Accordingly, an alternative evaluation strategy, distinct from the conventional paradigm, is warranted.
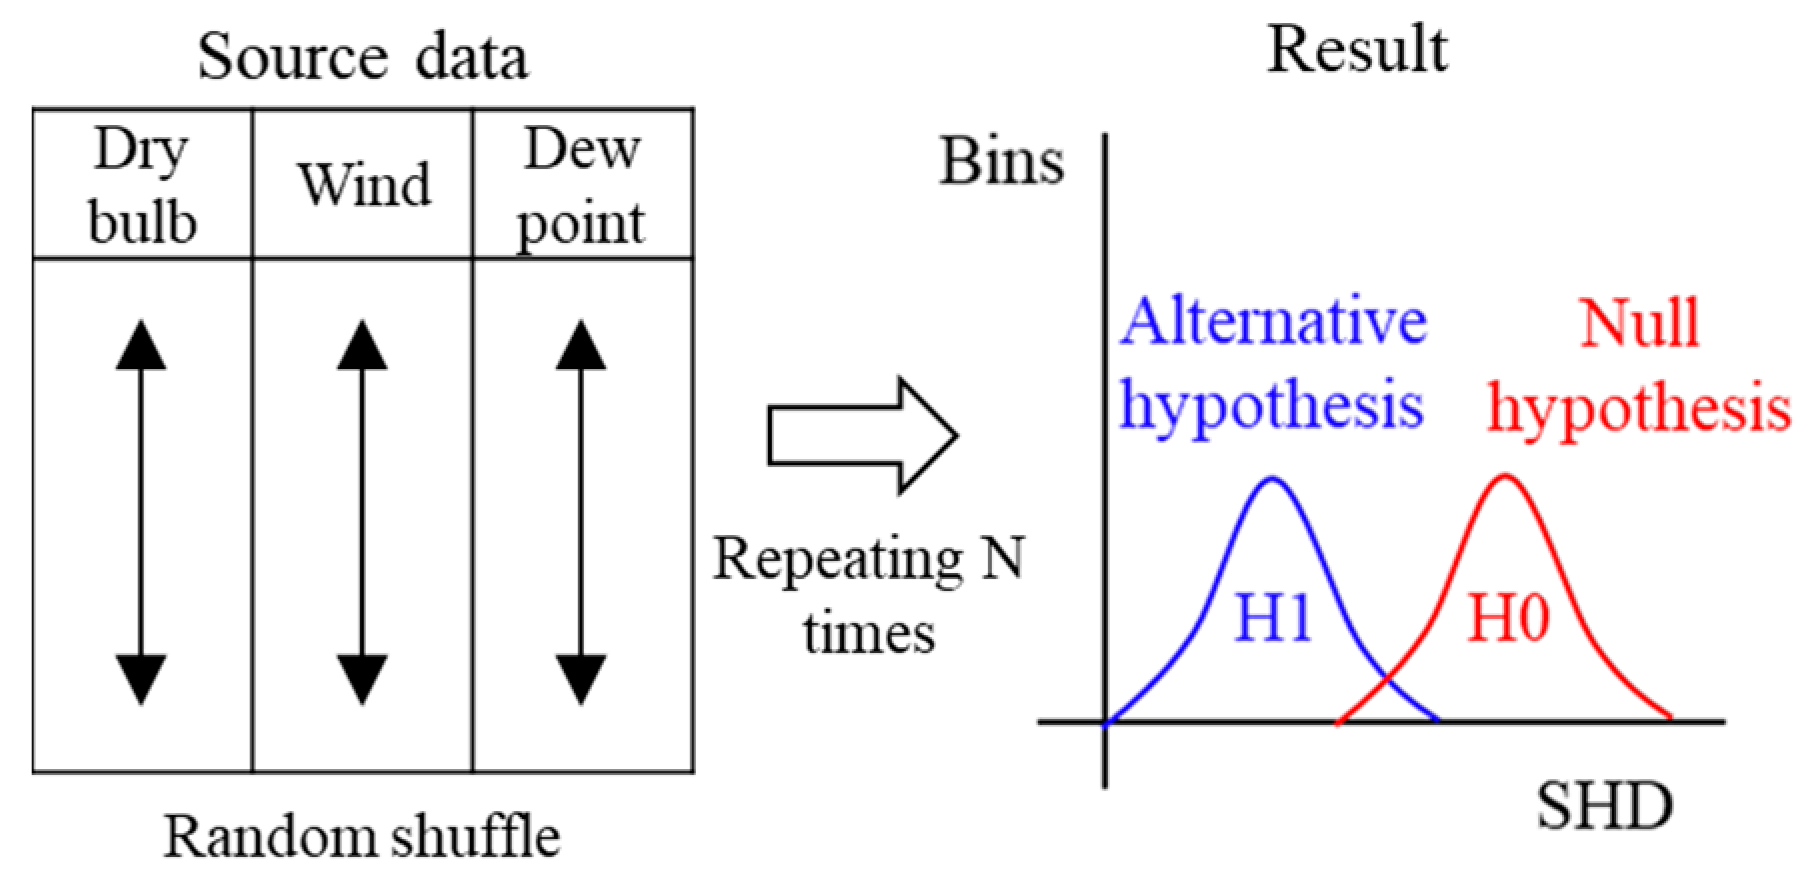
Accordingly, this study assumes a setting in which no previously established ground truth structure exists for the weather data and proposes two procedures—the permutation test and the repetition test—to evaluate the reliability of the discovered causal structure under such conditions. The permutation test statistically examines the null hypothesis that “the discovered structure arose by chance.” As illustrated in Figure 5, the authors repeatedly generate datasets by randomly permuting the values within each variable column, derive structures from these permuted datasets, and then assess their similarity to the originally discovered structure to test the hypothesis; similarity is quantified using the Structure Hamming Distance (SHD). In this study, the null hypothesis (H0) is defined as: “The discovered causal structure is an incidental artifact that can be reproduced to a comparable degree in column-wise permuted data,” whereas the alternative hypothesis (H1) is: “The discovered causal structure reflects genuine intervariable dependence (causal constraints), and column-wise permutation disrupts this structure, yielding a statistically significant decrease in similarity.”
The repetition test is an approach for evaluating the stability of the discovered structure. As illustrated in Figure 6, datasets are generated via sampling with replacement, and the frequencies with which individual causal edges recur across datasets are accumulated and analyzed. Unlike the permutation test, the values within each variable column are not randomly permuted; consequently, specific causal relationships can be rediscovered repeatedly.

2.3. Analysis of Causal Path

A biasing path is a pathway in a causal structure that induces spurious associations between putative causes and effects or jointly influences both, thereby introducing bias into study results. By identifying such paths within a DAG obtained via causal discovery, researchers can anticipate which variables are likely to be problematic in downstream analyses. Through appropriate adjustment for confounders and related factors, these biasing paths can be blocked—preventing spurious associations—and the interpretive accuracy of causal inference can be improved.

3. Case Study

3.1. Weather Data and Quasi-Ground Truth

To interrogate causal relationships among meteorological drivers of summer building energy use, the authors compiled a causal-discovery dataset from daily observations collected in Seoul, South Korea, during July–August 2024. The dataset comprises ten variables: wind speed (Wind), global horizontal irradiation (GHI), cloud cover (Cloud), evaporation (Eva), average sea-level pressure (Avg.sea), relative humidity (Re humi), daily precipitation (Rain), average vapor pressure (Avg.sp), dew-point temperature (Dew point), and dry-bulb temperature (Dry bulb). Missing precipitation values were imputed as 0 mm /day, whereas missing entries in the remaining variables were replaced with the mean of the preceding and following days.
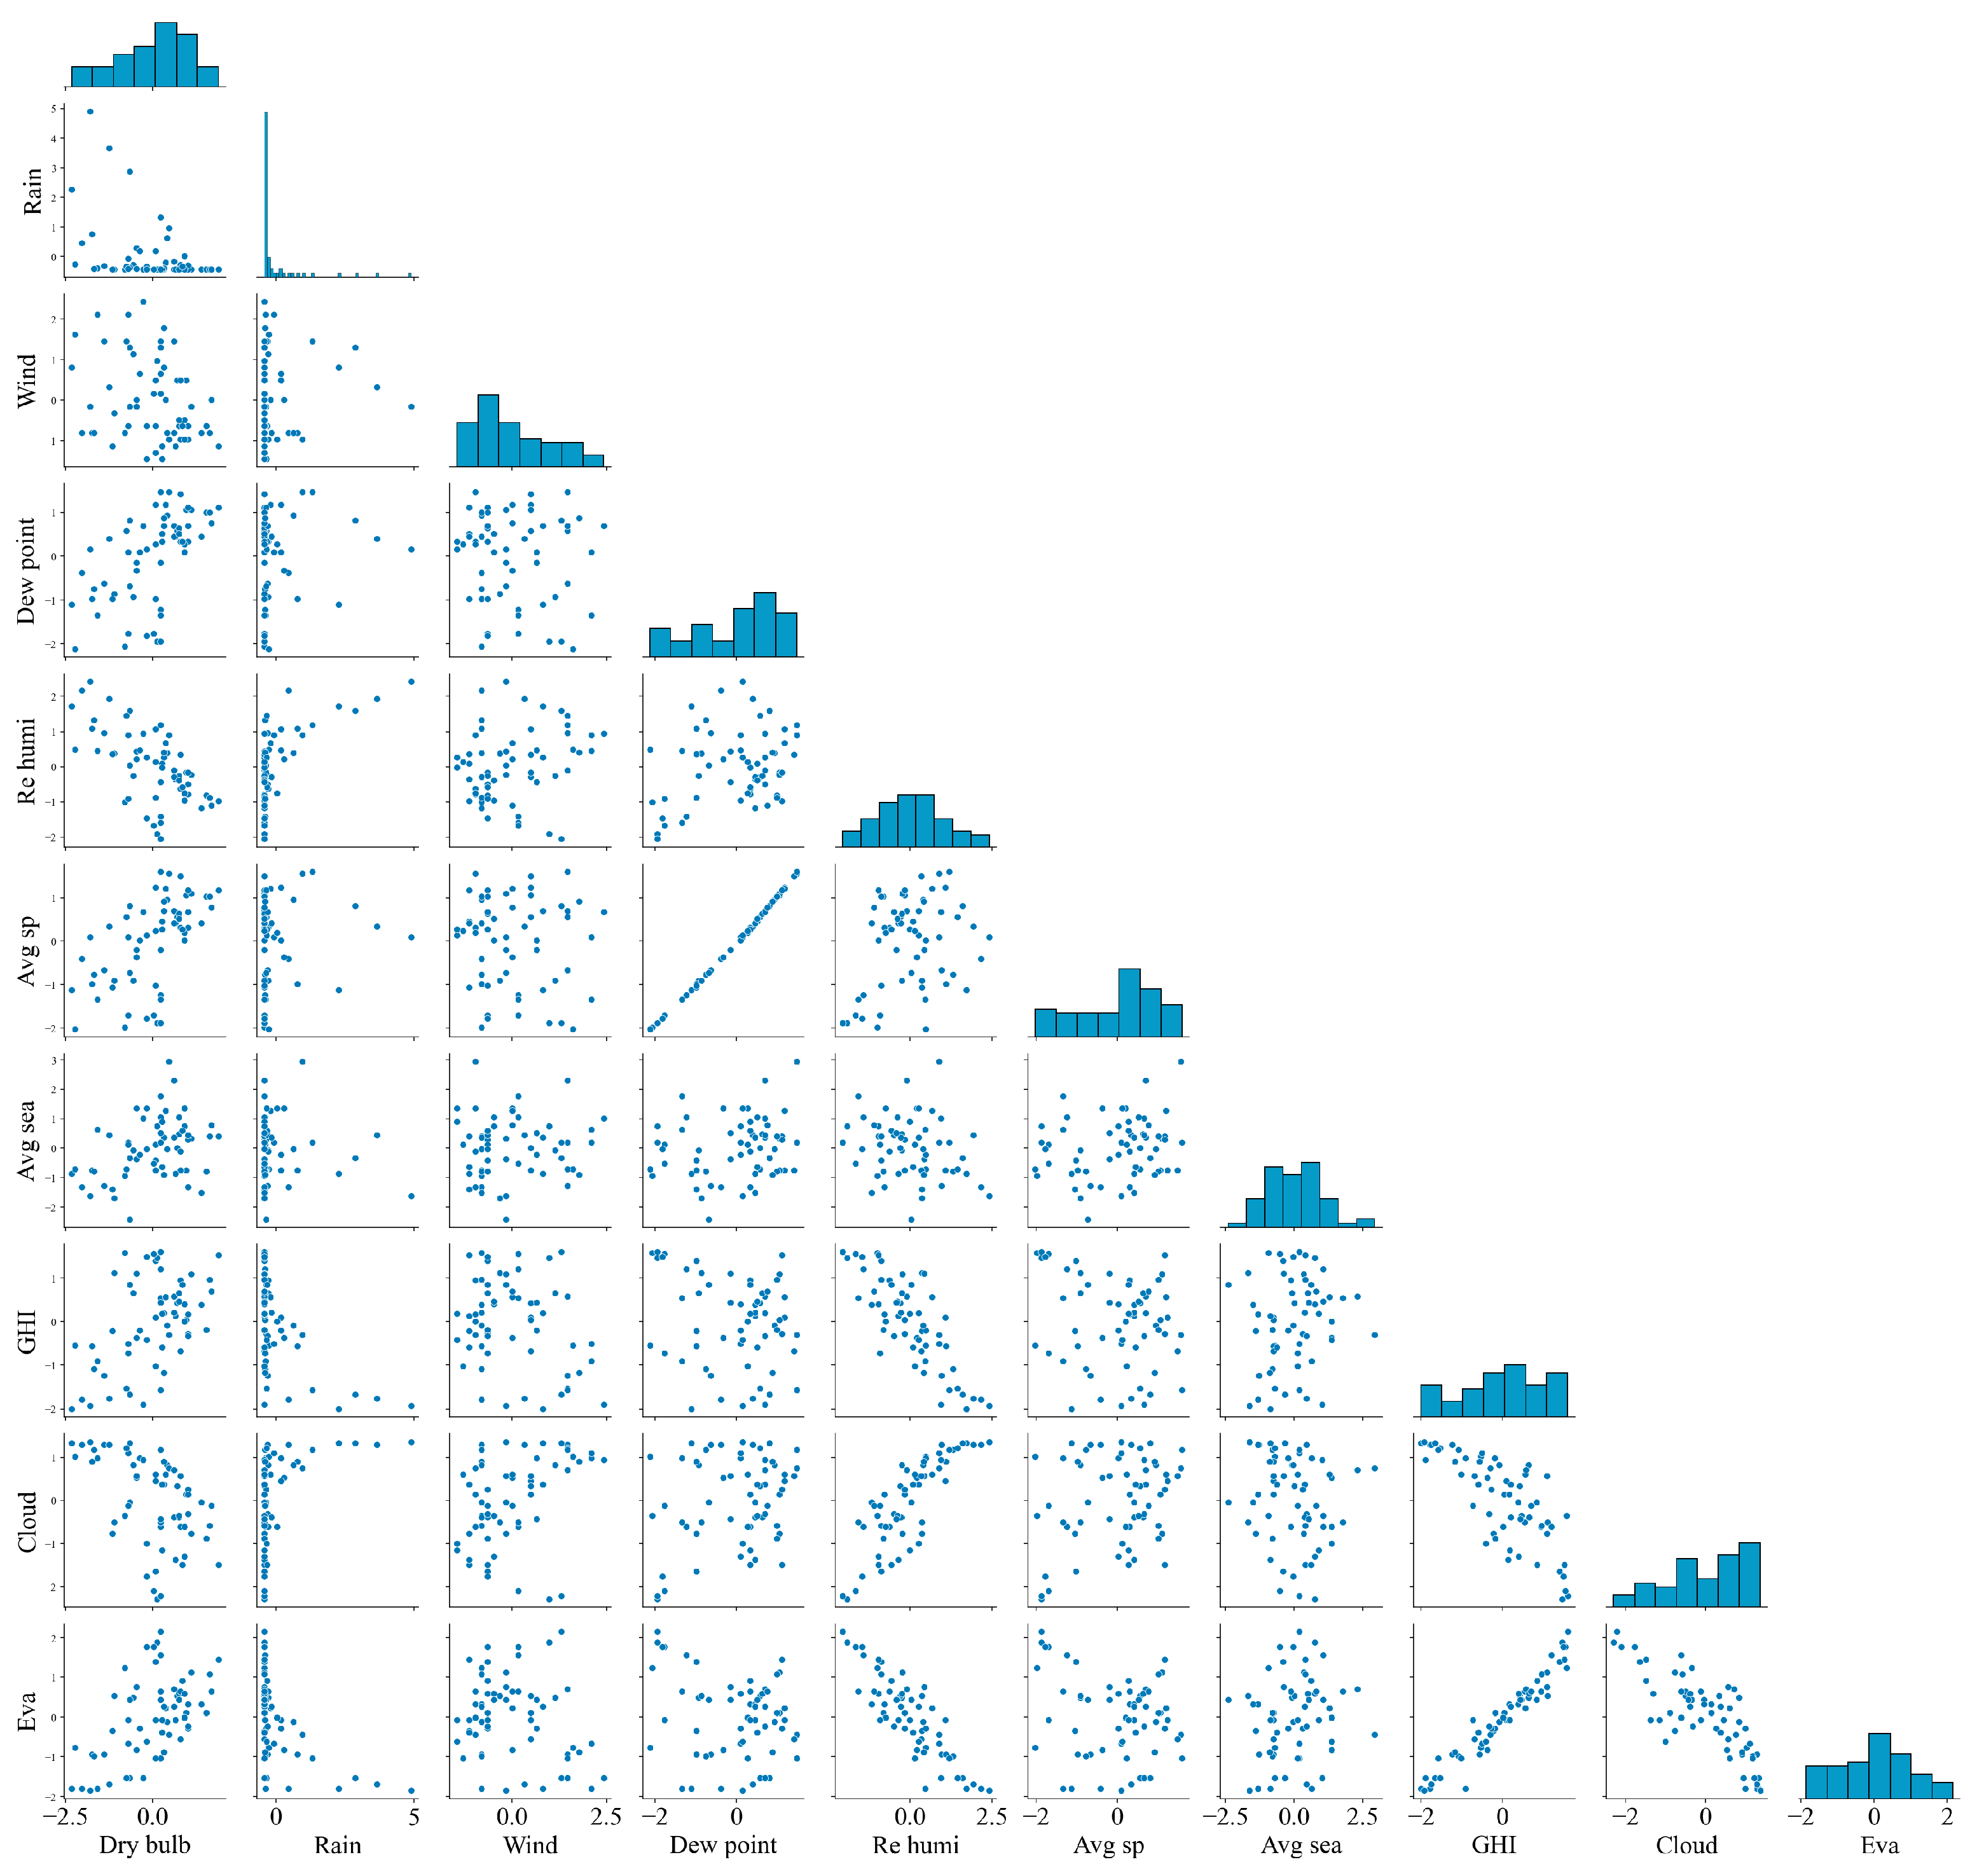
Missing precipitation values, which accounted for approximately 24% of daily records, were imputed as 0 mm/day under the assumption of non-rainfall conditions. Among the remaining variables, only evaporation exhibited missing entries (approximately 4%), which were replaced with the mean of the preceding and following days. In addition, a scatter plot matrix (Figure 7) was added to present the overall distribution and interrelationships among the weather variables. No statistically significant outliers were detected, and all variables were retained for analysis.
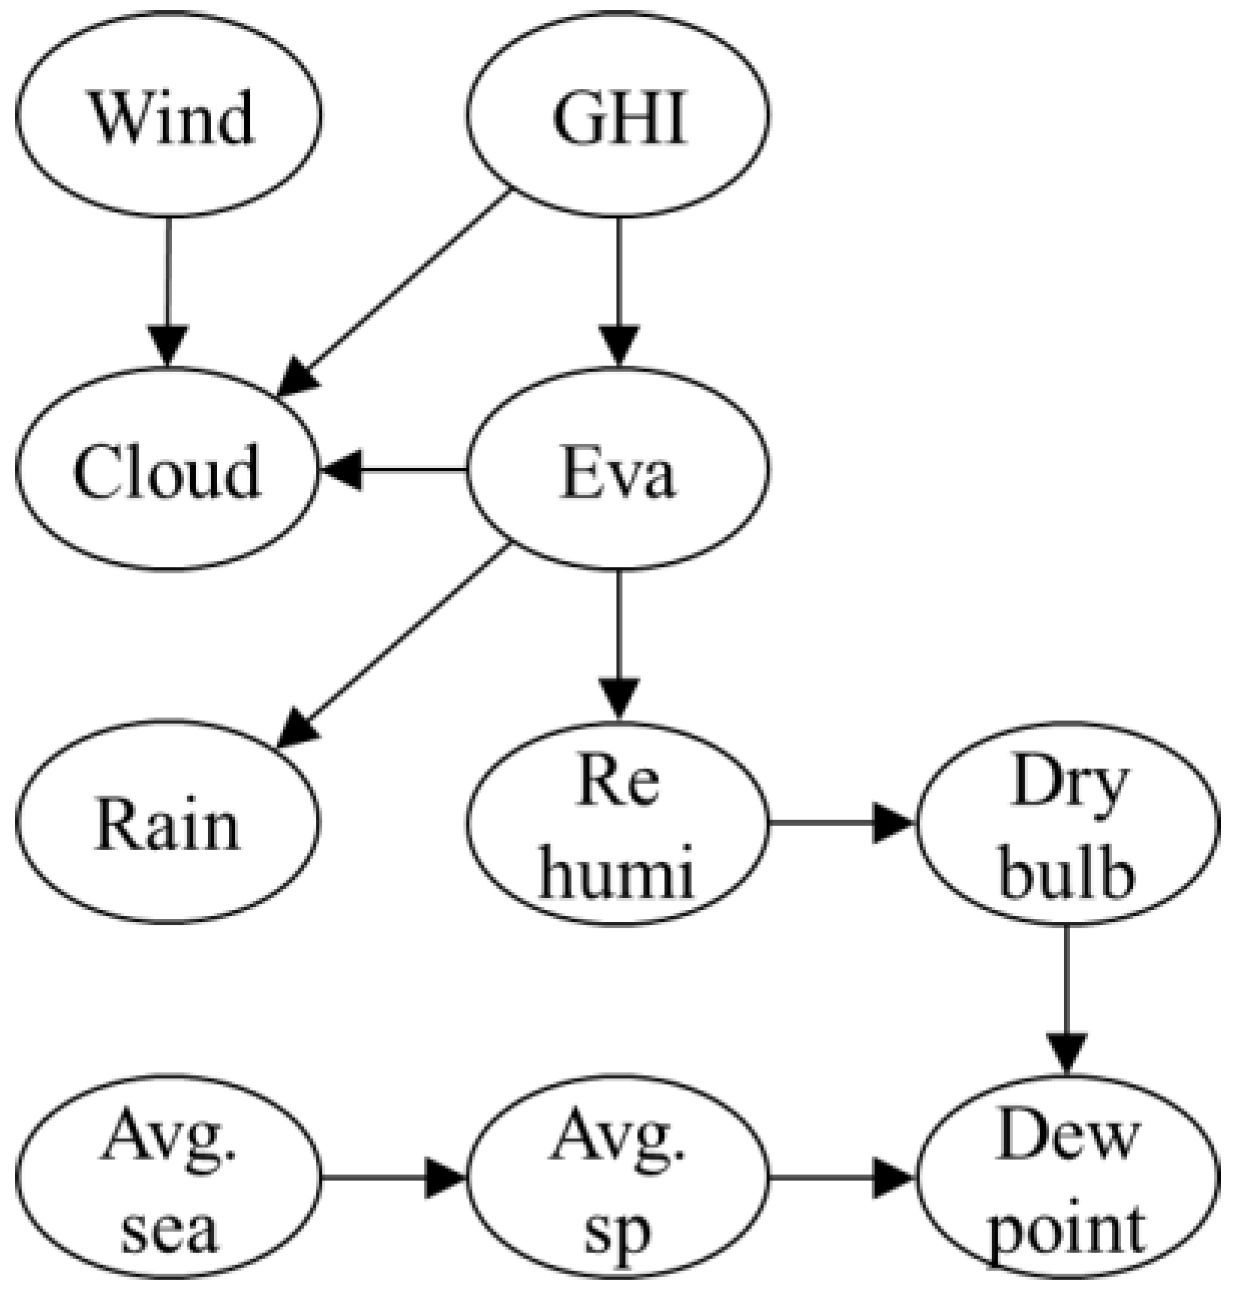
Beyond the established psychrometric relations among relative humidity, dew-point temperature, and dry-bulb temperature, the study assumes no consensus ground truth causal structure for the remaining variables. Accordingly, a quasi-ground truth structure for the ten variables was constructed (Figure 8). Since the psychrometric chart provides information on the interrelations among relative humidity, dry-bulb temperature, and dew-point temperature but does not indicate causal directionality, the causal directions among these three variables were assumed based on the authors’ empirical knowledge. The relationships among the remaining seven variables were similarly specified according to this empirical understanding.

3.2. Comparison of Causal Structures

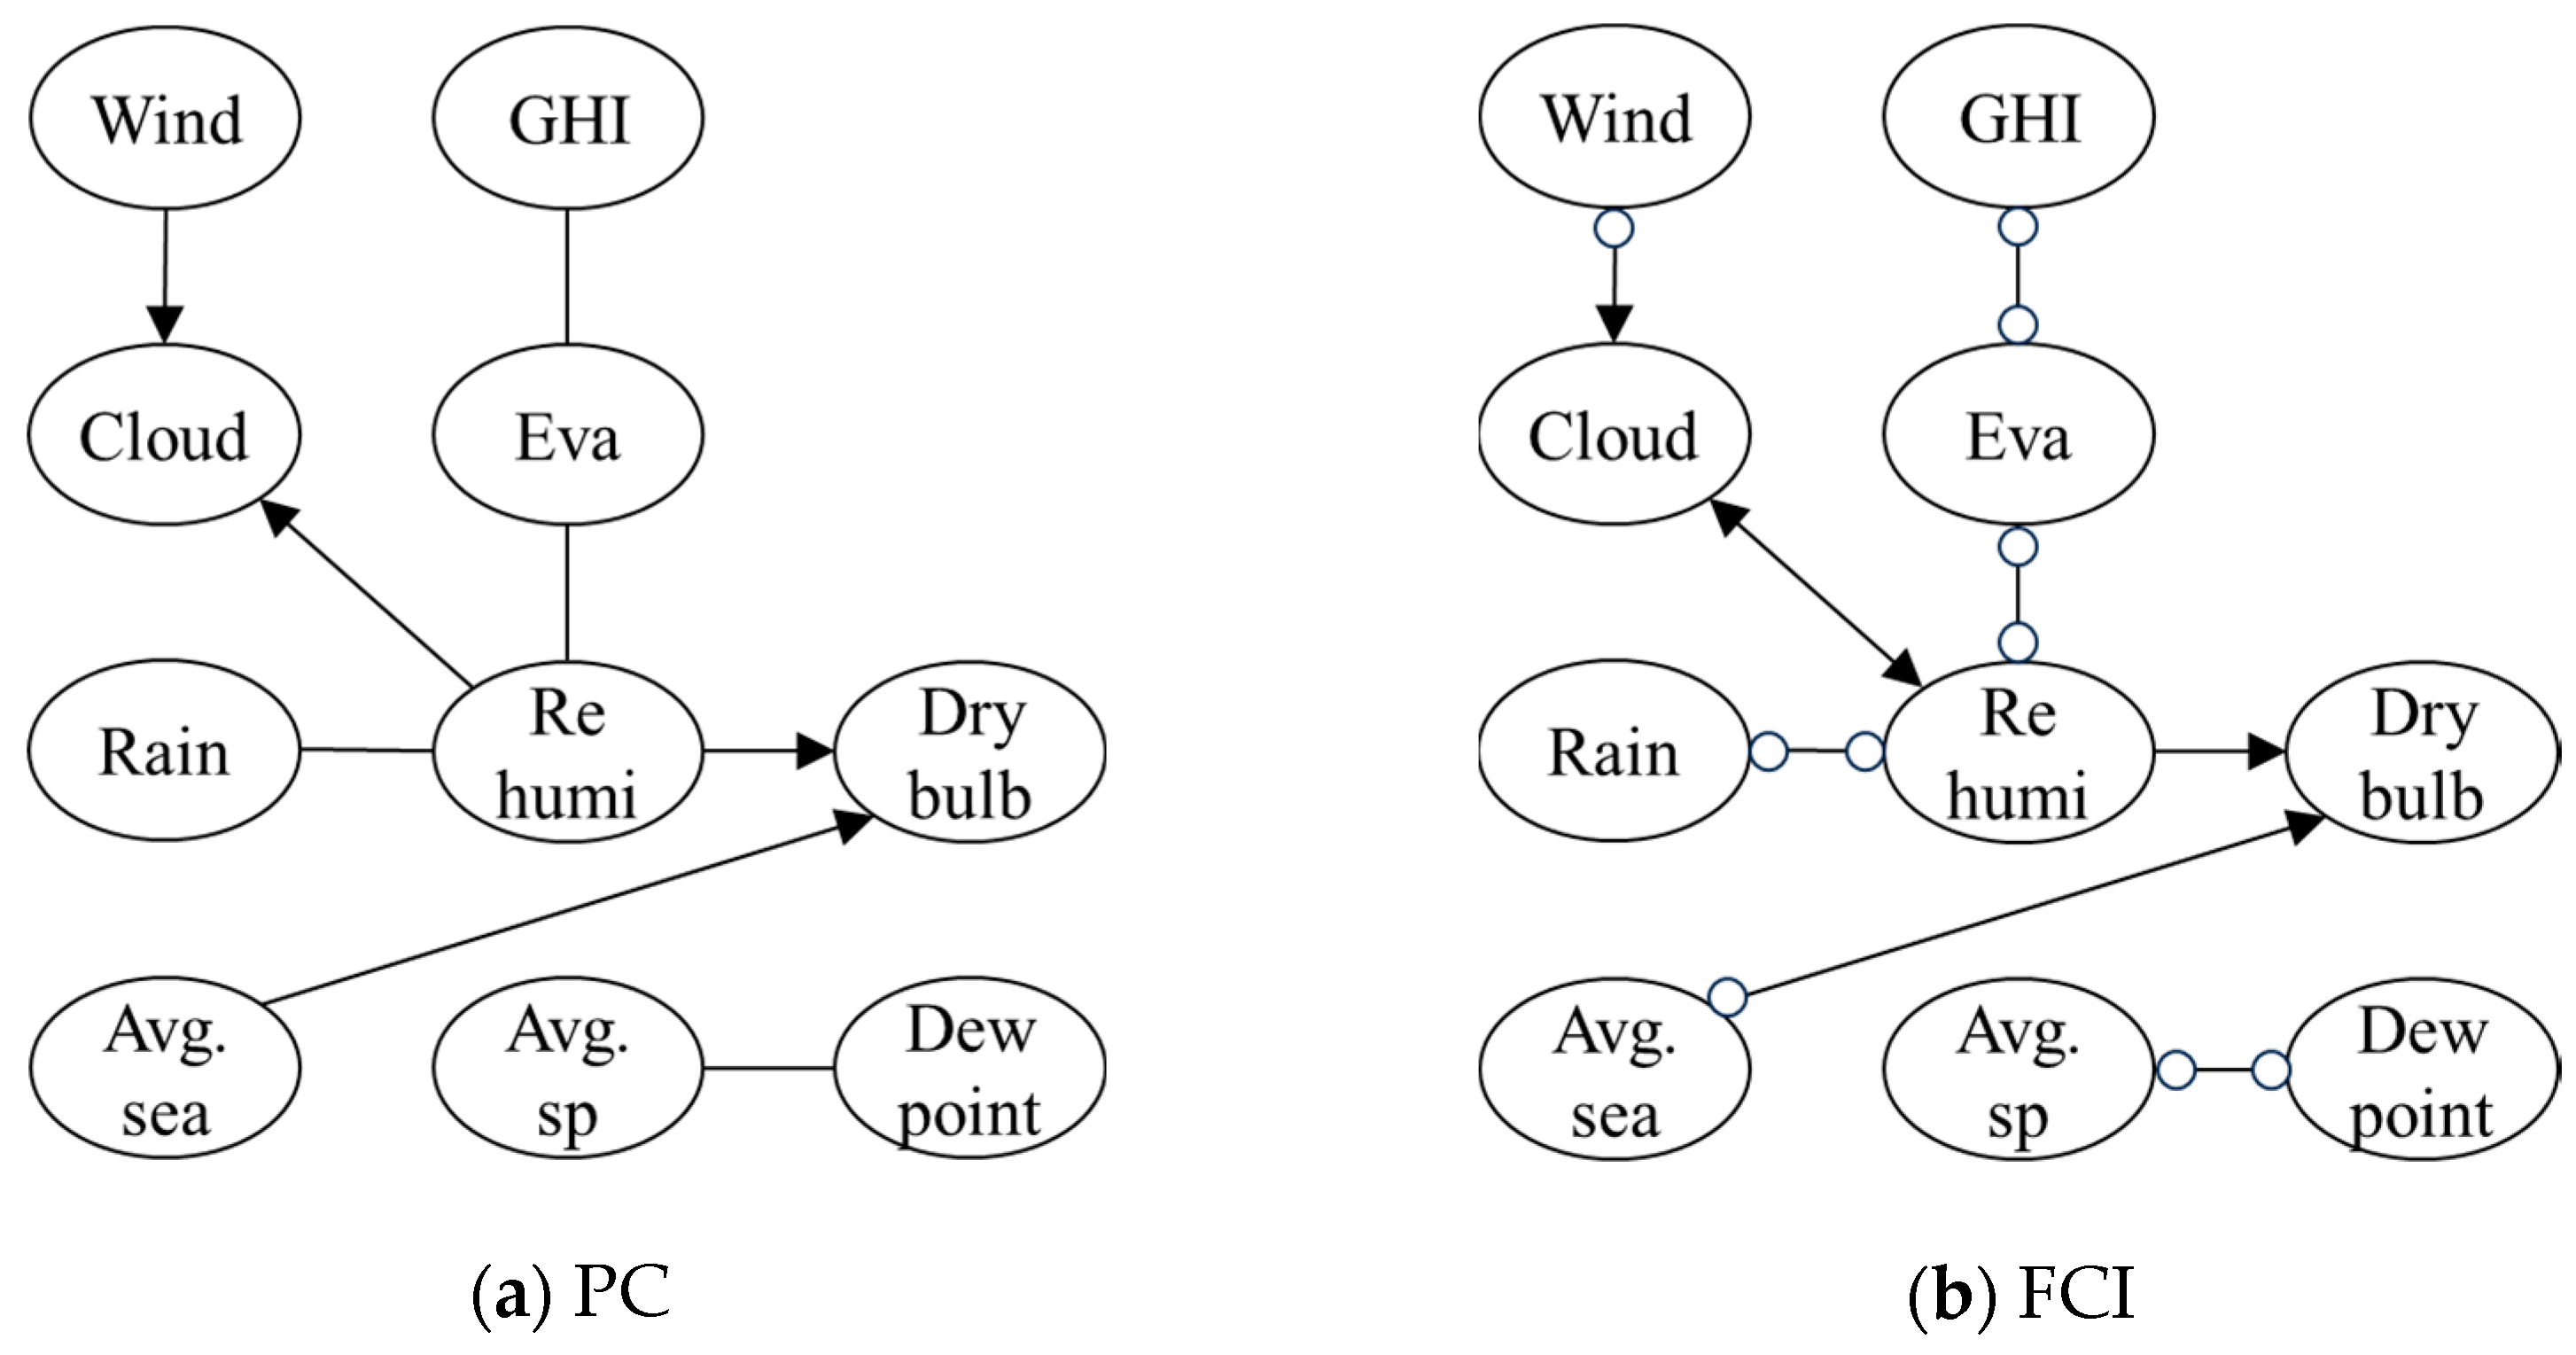
Figure 9 presents the causal discovery outcomes obtained by applying the PC and FCI algorithms to the weather dataset. Contrary to the authors’ expectations shown in Figure 9, the July–August weather data indicate that Dew point and Avg.sp do not interact with other variables and instead appear isolated. In addition, GHI tends to function as an exogenous, independent driver rather than being causally linked to Cloud or Eva. Although the authors initially posited a direct effect of evaporation on Rain, the discovered structure suggests that Re humi may act as a mediating variable between them. Moreover, the FCI algorithm implies the presence of an unobserved confounder between Cloud and Re humi, indicating the need for further analysis (Figure 9b).

3.3. Reliability of the Discovered Structures

Figure 10a,b apply causal discovery algorithms to 200 null-hypothesis (H0) permutation samples and 200 alternative-hypothesis (H1) samples, respectively, and compare the discovered structures with those identified in Section 3.2 (Figure 9a,b) in terms of similarity. On the x-axis, larger values (farther from 0) indicate greater dissimilarity from the reference model, because SHD decreases as similarity increases.
A one-sided alternative that focuses on the left tail (smaller SHD) is pre-specified, i.e., H1 is hypothesized to yield smaller SHD than H0. Accordingly, a one-sided p-value is computed as the proportion of H0 samples whose SHD is less than or equal to a pre-specified cutoff; for simplicity, the median SHD of the H1 samples (5.2 for the PC algorithm and 5.6 for the FCI algorithm) is used as this cutoff. When the SHD of a structure obtained from a randomly drawn sample is less than or equal to the median SHD of the H1 samples generated via sampling with replacement, the p-values for the null hypothesis—“the discovered structure occurred by random chance”—are 0.01 for both algorithms, well below the 0.05 significance threshold. This indicates that the probability of the discovered structures arising purely by chance is extremely low.
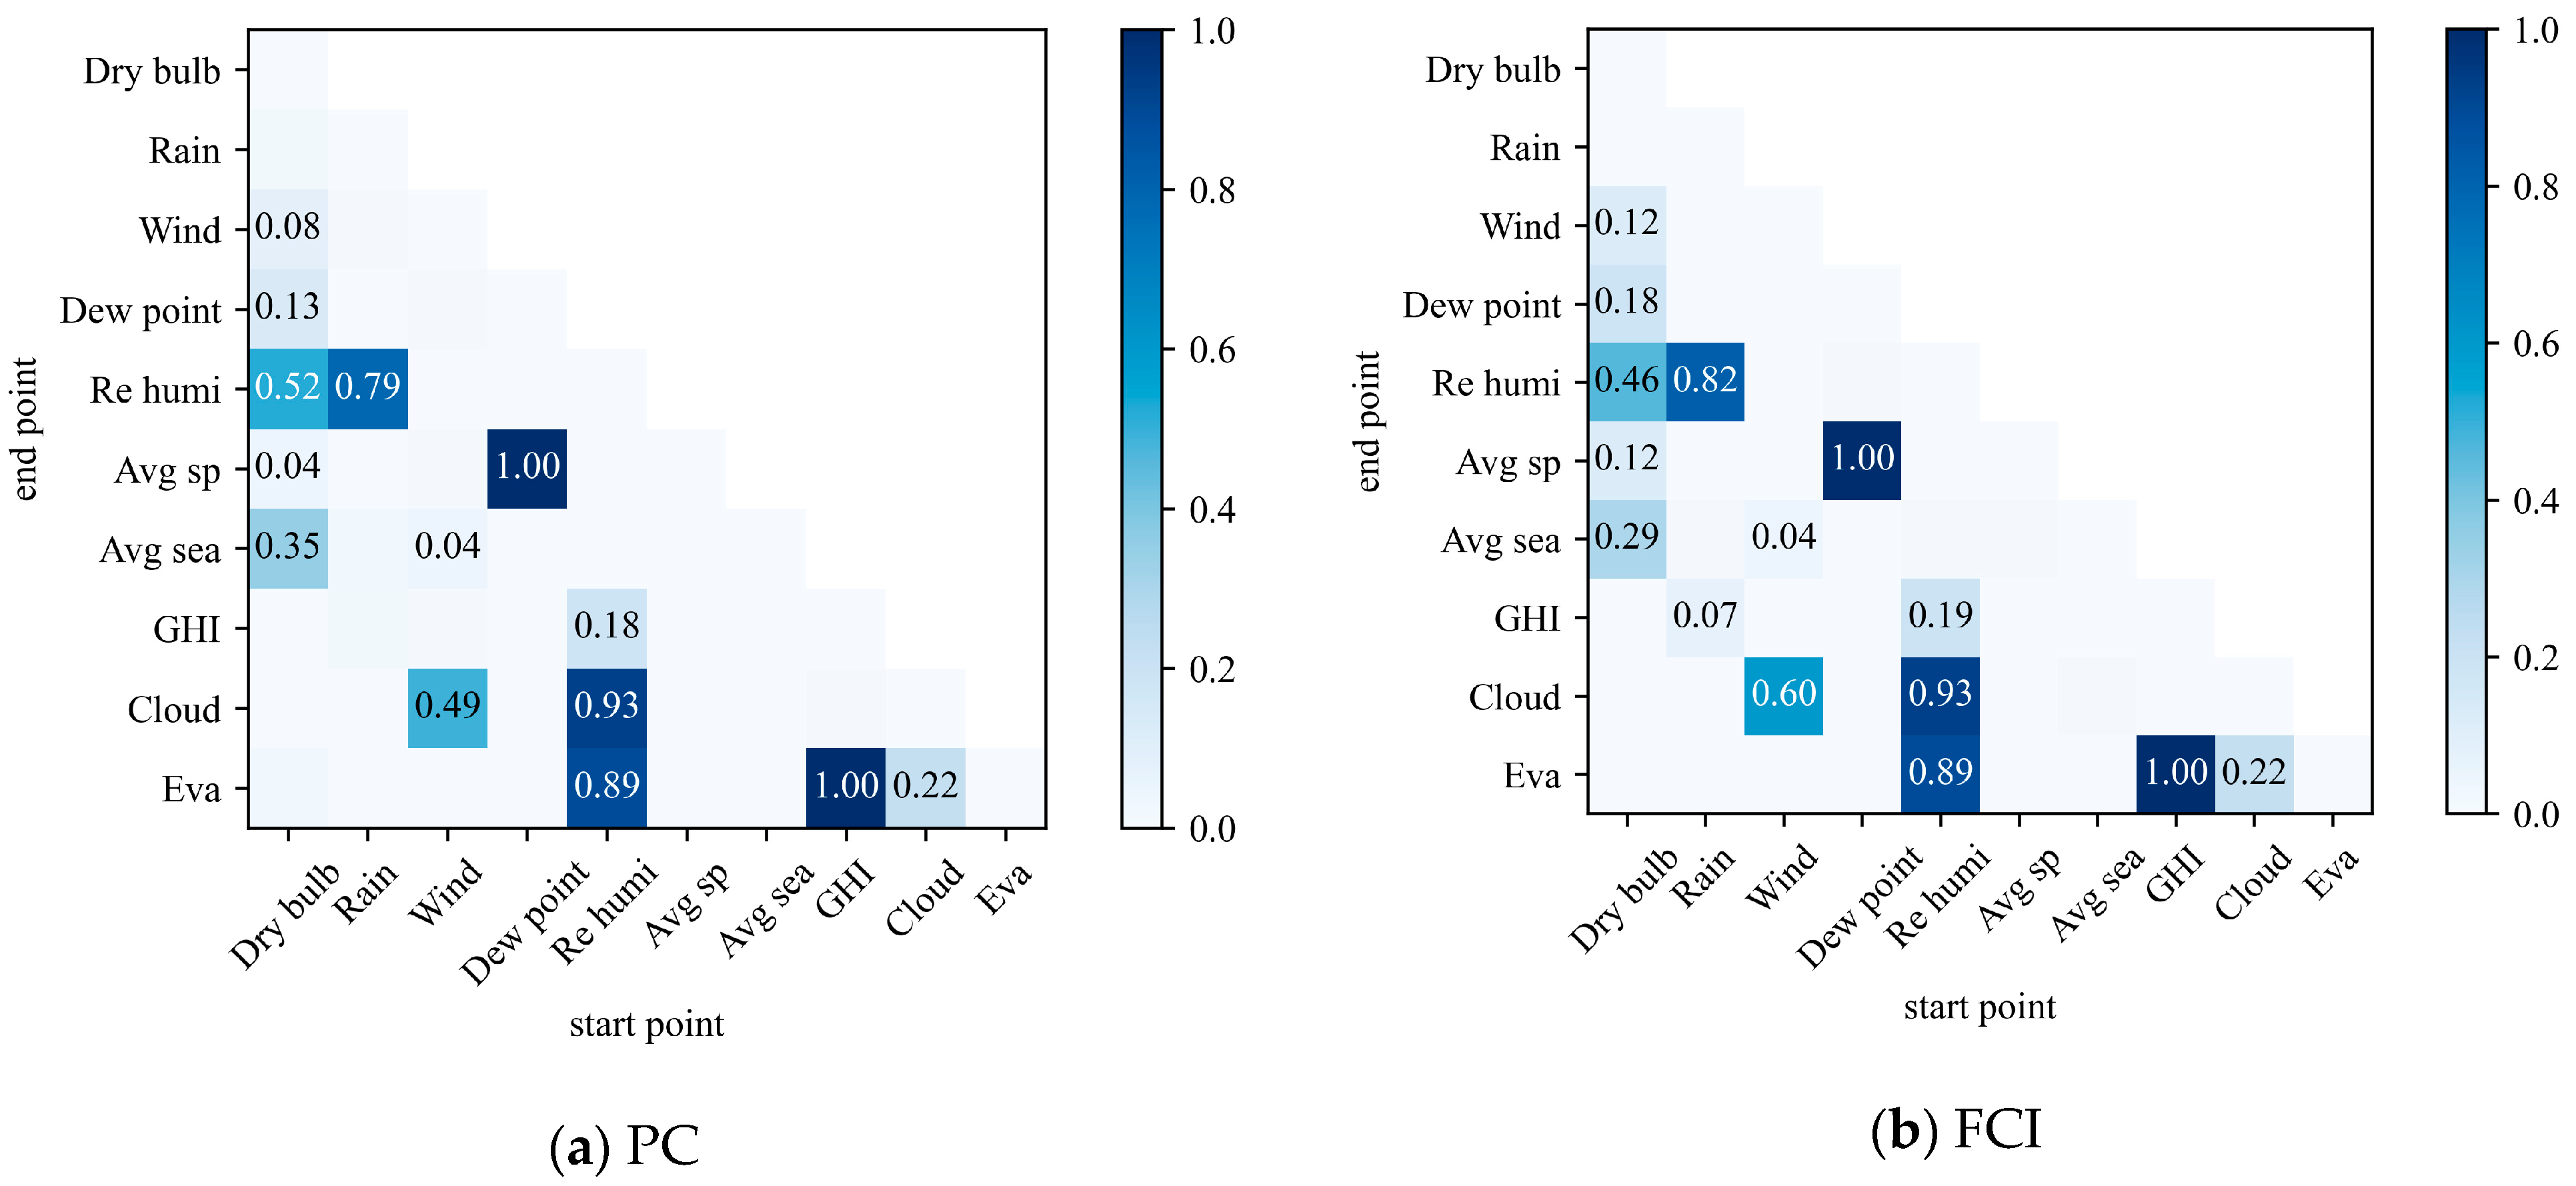
Figure 11a,b display, for 100 bootstrap samples used in the repetition test, the proportion with which each causal edge reappears after applying the causal discovery algorithms. This enables assessment of how reliably the associations identified in the original structure are recovered. For example, under the PC algorithm, the relationships among Dry bulb, Avg.sea, and Re humi recur in more than 40% of the samples.
Overall, both algorithms tend to infer consistent structures for relationships that recur in at least 40% of the resampled datasets. In particular, the strong causal links Dew point → Avg.sp and GHI → Eva are persistently observed in nearly all resampled datasets. However, for structures with definite causal direction (e.g., Avg.sea → Dry bulb, Re humi → Cloud, Wind → Cloud, Re humi → Dry bulb), recurrence rates are approximately 40–80%, whereas for structures with ambiguous orientation (e.g., Rain—Re humi, GHI—Eva, Eva—Re humi, Dew point—Avg.sp), recurrence ranges from about 50% to 100%. This indicates that the frequency with which a structure recurs is not proportional to the certainty of its causal direction. Put differently, a replication (repeatability) test does not establish causality; rather, it quantifies the repeatability of the observed phenomenon, regardless of whether a causal relationship exists.
Overall, both tests demonstrated the reliability of the discovered causal structures under randomized and repeated conditions. The detailed quantitative results, including p-values and stability metrics, are summarized in Table 2.

3.4. Extending the Causal Structure and Identifying Back-Door Paths

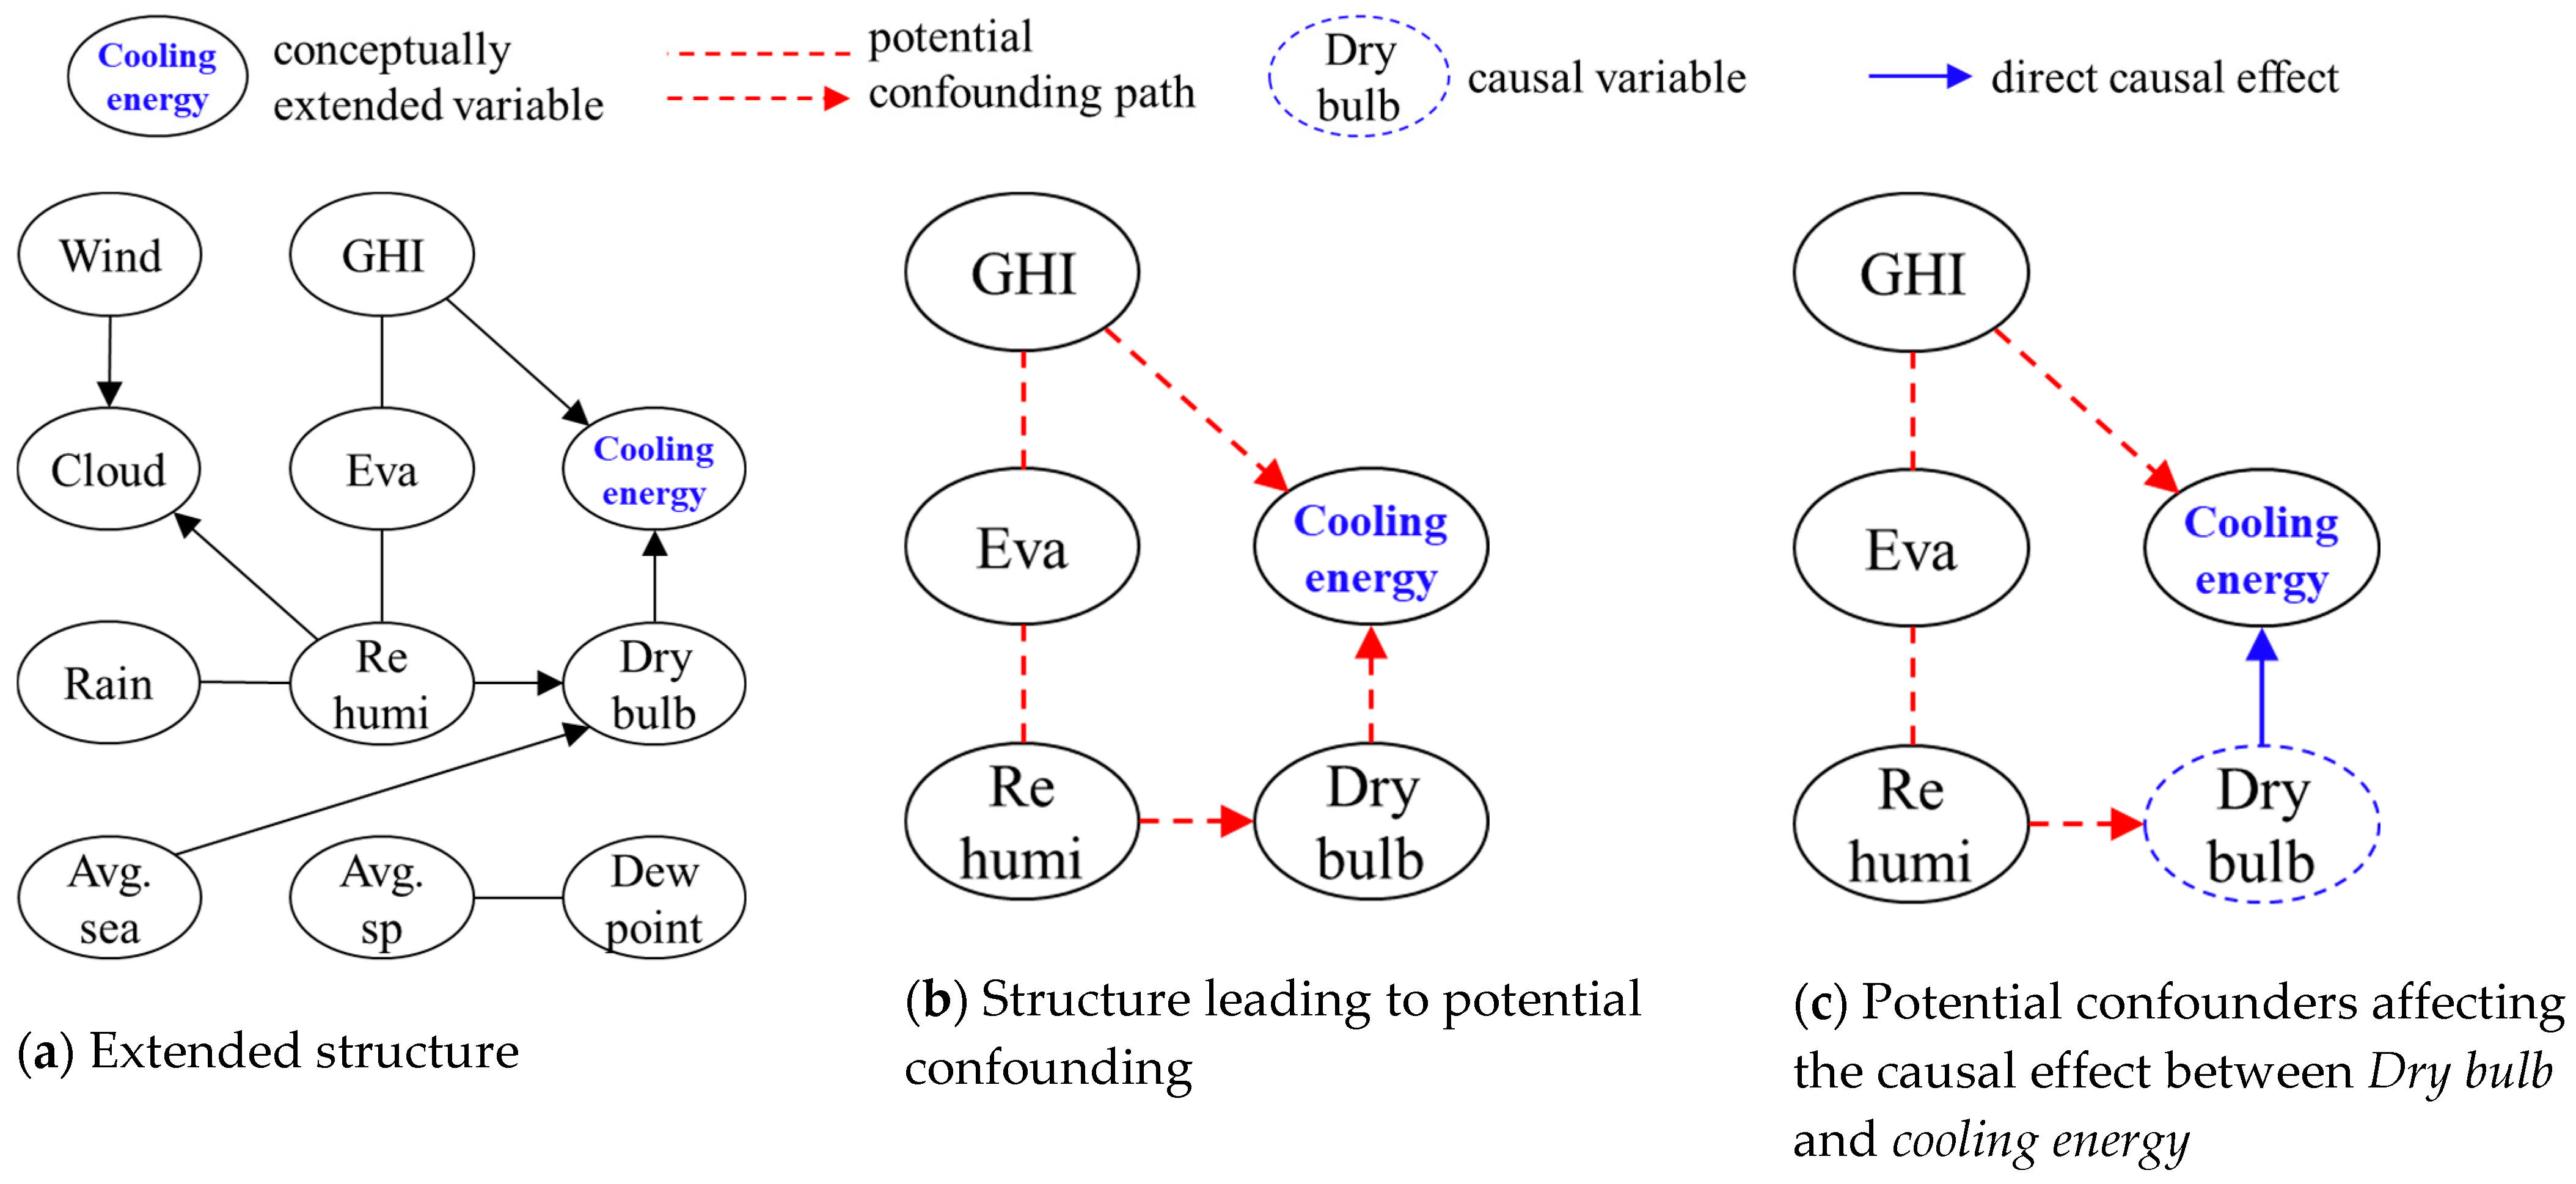
As an illustrative case of causal-structure extension, the present study conceptually introduces a cooling energy variable, rather than employing measured data, to demonstrate how causal discovery can be expanded toward building energy applications. This extension is grounded in the PC-discovered structure (Figure 12b), in which Dry bulb temperature is assumed to exert a direct causal influence on Cooling energy, representing one of the most fundamental and widely recognized relationships in building energy analysis. Such conceptual extension highlights how causal discovery can inform practical applications, for instance by identifying the most influential weather variables for energy modeling and benchmarking study or by guiding control-oriented analysis of cooling systems.
Assuming that Dry bulb and GHI exert direct effects on cooling energy, the causal graph is extended as shown in Figure 12a. Under this configuration—given unresolved causal orientations—one can anticipate the emergence of confounders among GHI, Eva, Re humi, Dry bulb, which influence on cooling energy, as depicted in Figure 12b.
In particular, when estimating direct causal effect of Dry bulb on cooling energy (Figure 12c), under the assumption that GHI → Eva → Re humi, then these variables act as confounders, opening back-door paths. Consequently, conditioning on some or all of GHI, Eva, and Re humi blocks these paths, allowing the direct causal effect of Dry bulb on cooling energy to be identified and estimated more reliably.

4. Discussion

The results of the case study in Section 3 demonstrate the utility of the authors’ proposed procedures for identifying, validating, and extending causal structures in weather data and for exploring causal pathways. Nevertheless, several issues remain for data-driven causal analysis methods:
  • Algorithmic assumptions. Constraint-based methods such as the PC and FCI algorithms are suitable for identifying causal relations under assumptions of linearity and Gaussianity. However, with nonlinear or non-Gaussian data, weakened conditional-independence tests can distort causal identification, indicating the need for data preprocessing or complementary algorithmic approaches. Moreover, because the PC algorithm operates under the no-hidden-confounders (causal sufficiency) assumption, accurate identification can be difficult when such confounding factors are present.
  • Data scope and generalizability. This study used two months of summer weather data collected from the Seoul area, which limits both the temporal and spatial generalizability of the findings. While the dataset reflects typical urban climatic characteristics of central South Korea, it may not fully represent broader regional or seasonal variability. Future work should therefore extend the causal discovery analysis to multiple regions with diverse climatic conditions—such as coastal and southern zones—and to multi-year and interseasonal datasets to enhance the robustness and general applicability of the identified causal relationships.
  • A conceptually extended causal structure. Rather than providing a quantitative validation using actual cooling energy data, this study presents only a conceptual demonstration of how the causal framework may be extended to include a cooling energy variable. In future work, we plan to explore causal structures using datasets that incorporate actual building energy use and to examine the biasing paths that may arise in such expanded structures.

5. Conclusions

Prior to analyzing the causal impact of weather factors on cooling energy, the authors applied two causal discovery algorithms to summer weather data for South Korea and compared the results with a quasi-ground truth structure. The analysis revealed potential discrepancies between empirically assumed causal knowledge and data-driven causal knowledge. In particular, the FCI algorithm provided insight into the presence of latent factors that mediate intervariable influences. Because real-world datasets cannot measure all relevant variables—and because macro-level variables may already subsume the effects of unobserved factors—there is a need to examine causal relations through exploratory analyses employing multiple algorithms. In addition, the authors presented statistical evidence to evaluate the reliability of the discovered structures, demonstrating that reliability can be assessed even in the absence of a benchmark ground truth graph.
Subsequently, among the discovered structures, the authors posited pathways by which global horizontal irradiation (GHI) and outdoor air temperature (Dry bulb) affect cooling energy and examined the potential for biasing paths. The results indicate that discrepancies may arise between empirically assumed causal knowledge and data-driven causal knowledge, and that biasing paths can emerge within the extended causal structure. Given that real-world datasets cannot fully observe all variables related to building energy use—and that unobserved influences may affect causal effects—exploratory analysis using causal discovery and careful consideration of causal pathways are warranted. The identified causal structures provide a foundation for analyzing how climatic factors influence energy use patterns across different building types and regions. Such insights can support data-driven decision-making for urban energy design, and can also be applied to quantify the impact of retrofitting/remodeling by distinguishing causal confounders. Therefore, the proposed approach offers both methodological and practical value in advancing sustainable building energy management.
In future work, the authors will propose procedures to analyze and compare causal relations across additional seasons (e.g., interseasonal and winter periods) and regions beyond Seoul, and will expand the database to include actual building energy consumption, thereby enabling analysis of causal pathways from weather and building factors to energy use. In addition, the authors plan to demonstrate that providing expert knowledge about causal relations prior to causal discovery can help identify relationships among variables that would otherwise remain unidentifiable. Furthermore, nonlinear or hybrid causal discovery algorithms will be explored to address the linearity assumptions of the current framework.

Author Contributions

Conceptualization and formal analysis, H.-G.C.; validation, H.-G.K. and D.-W.K.; data curation, H.-G.K.; writing—original draft preparation, H.-G.C.; writing—review and editing, D.-W.K. All authors have read and agreed to the published version of the manuscript.

Funding

This work is supported by the Korea Agency for Infrastructure Technology Advancement (KAIA) grant funded by the Ministry of Land, Infrastructure and Transport (Grant RS-2024-00407770, Development of AI-based RC module Platform and Nudge-type Energy Saving Service for Optimizing Apartment Energy Management).

Data Availability Statement

The data presented in this study are available on request from the corresponding author.

Conflicts of Interest

The authors declare no conflicts of interest.

References

  1. Ko, Y.-D.; Park, C.-S. Parameter Estimation of Unknown Properties Using Transfer Learning from Virtual to Existing Buildings. J. Build. Perform. Simul. 2021, 14, 503–514. [Google Scholar] [CrossRef]
  2. Kim, D.W.; Kim, Y.M.; Lee, S.E. Development of an Energy Benchmarking Database Based on Cost-Effective Energy Performance Indicators: Case Study on Public Buildings in South Korea. Energy Build. 2019, 191, 104–116. [Google Scholar] [CrossRef]
  3. Chen, X.; Abualdenien, J.; Singh, M.M.; Borrmann, A.; Geyer, P. Introducing Causal Inference in the Energy-Efficient Building Design Process. Energy Build. 2022, 277, 112583. [Google Scholar] [CrossRef]
  4. Bareinboim, E.; Correa, J.D.; Ibeling, D.; Icard, T. On Pearl’s Hierarchy and the Foundations of Causal Inference. In Probabilistic and Causal Inference: The Works of Judea Pearl; Association for Computing Machinery: New York, NY, USA, 2022; Volume 36, pp. 507–556. ISBN 978-1-4503-9586-1. [Google Scholar]
  5. Zhou, A.; Wang, S.; Chen, B. Impact of New Energy Demonstration City Policy on Energy Efficiency: Evidence from China. J. Clean. Prod. 2023, 422, 138560. [Google Scholar] [CrossRef]
  6. Sun, R.; Schiavon, S.; Brager, G.; Arens, E.; Zhang, H.; Parkinson, T.; Zhang, C. Causal Thinking: Uncovering Hidden Assumptions and Interpretations of Statistical Analysis in Building Science. Build. Environ. 2024, 259, 111530. [Google Scholar] [CrossRef]
  7. Mun, J.; Park, C.S. Beyond Correlation: A Causality-Driven Model for Indoor Temperature Control. Energy Build. 2025, 338, 115739. [Google Scholar] [CrossRef]
  8. Nogueira, A.R.; Pugnana, A.; Ruggieri, S.; Pedreschi, D.; Gama, J. Methods and Tools for Causal Discovery and Causal Inference. WIREs Data Min. Knowl. Discov. 2022, 12, e1449. [Google Scholar] [CrossRef]
  9. Spirtes, P.; Glymour, C.; Scheines, R.; Kauffman, S.; Aimale, V.; Wimberly, F. Constructing Bayesian Network Models of Gene Expression Networks from Microarray Data. J. Contrib. Carnegie Mellon Univ. 2000. [Google Scholar] [CrossRef]
  10. Eberhardt, F. Introduction to the Foundations of Causal Discovery. Int. J. Data Sci. Anal. 2017, 3, 81–91. [Google Scholar] [CrossRef]
  11. Spirtes, P.; Glymour, C.; Scheines, R. Causation, Prediction, and Search; MIT Press: Cambridge, MA, USA, 2000. [Google Scholar]
  12. Spirtes, P.L.; Meek, C.; Richardson, T.S. Causal Inference in the Presence of Latent Variables and Selection Bias. arXiv 2013. [Google Scholar] [CrossRef]
  13. Meek, C. Causal Inference and Causal Explanation with Background Knowledge. arXiv 2013. [Google Scholar] [CrossRef]
  14. Zheng, Y.; Huang, B.; Chen, W.; Ramsey, J.; Gong, M.; Cai, R.; Shimizu, S.; Spirtes, P.; Zhang, K. Causal-Learn: Causal Discovery in Python. arXiv 2023. [Google Scholar] [CrossRef]
  15. Fisher, R.A. Statistical Methods for Research Workers. In Breakthroughs in Statistics: Methodology and Distribution; Kotz, S., Johnson, N.L., Eds.; Springer: New York, NY, USA, 1992; pp. 66–70. ISBN 978-1-4612-4380-9. [Google Scholar]
  16. Assaad, C.K.; Devijver, E.; Gaussier, E. Survey and Evaluation of Causal Discovery Methods for Time Series. J. Artif. Intell. Res. 2022, 73, 767–819. [Google Scholar] [CrossRef]
  17. Choi, K.; Park, J.; Kim, D.-W.; Joe, J. Development of a Regression Model for Evaluating Energy Consumption Performance of Daycare Centers Using Open Public Data. J. Korean Sol. Energy Soc. 2024, 44, 35–48. [Google Scholar] [CrossRef]
  18. Kim, H.-J.; Joo, H.-B.; Kim, D.-W.; Heo, Y.-S. Examining the Influencing Factors of Base and Heating Energy Use Intensities for the Energy Benchmarking of School Buildings. J. Korean Inst. Archit. Sustain. Environ. Build. Syst. 2024, 18, 491–501. [Google Scholar] [CrossRef]
  19. Kim, J.-H.; Seonin, K.; Park, Y.-J.; Kim, D.-W.; Euijong, K. Correlation Analysis Between Non-Energy Public Data of Residential Buildings and Annual Energy Consumption by Usage. Korea J. Air-Cond. Refrig. Eng. 2024, 36, 606–618. [Google Scholar] [CrossRef]
  20. Kim Gi, H.; Shin Ry, H.; Kim Woo, D. DataNet Project: A Framework for Linking Multi-Faceted Building Energy Datasets for Effective Performance Analysis. In Proceedings of the ASim Conference 2024: 5th Asia Conference of IBPSA, Osaka, Japan, 8–10 December 2024; Volume 5, pp. 483–490. [Google Scholar]
  21. Shin, H.-R.; Kim, H.-G.; Kim, D.-W. DataNet: A Framework for Linking Nationwide Building Energy Datasets to Support Effective Performance Analysis. J. Korean Inst. Archit. Sustain. Environ. Build. Syst. 2024, 18, 564–575. [Google Scholar] [CrossRef]
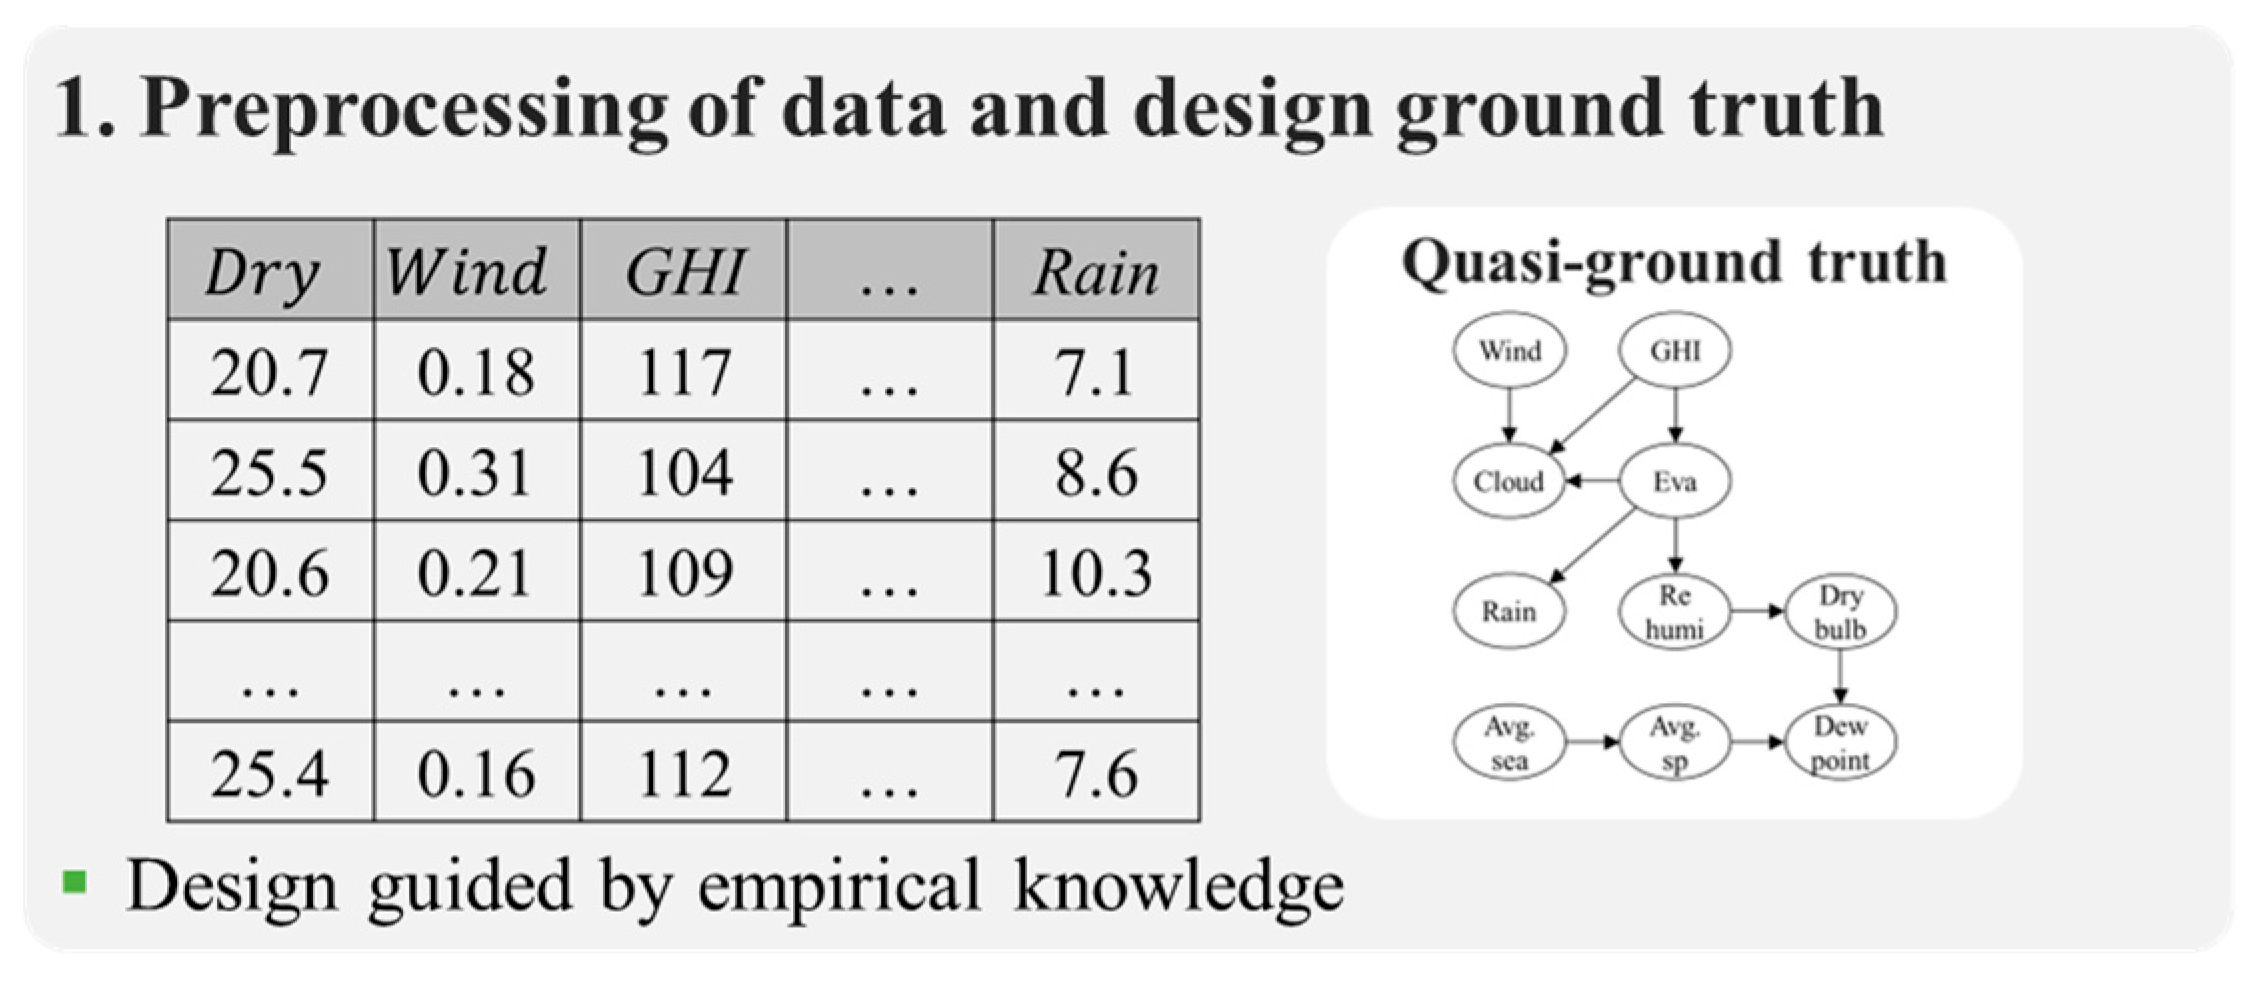
Figure 1. Process of causal discovery and validation.
Buildings 15 04248 g001aBuildings 15 04248 g001b
Figure 2. Compare of information provided by the causal algorithms.
Buildings 15 04248 g002
Figure 3. 5-step operational procedure for the algorithms.
Buildings 15 04248 g003
Figure 4. PC vs. FCI: A three-variable example of directionality and latent confounding.
Buildings 15 04248 g004
Figure 5. Permutation test.
Buildings 15 04248 g005
Figure 6. Repetition test.
Buildings 15 04248 g006
Figure 7. Overall distribution and interrelationships among data.
Buildings 15 04248 g007
Figure 8. Quasi-ground truth of weather data.
Buildings 15 04248 g008
Figure 9. Comparison of causal structures.
Buildings 15 04248 g009
Figure 10. Result of permutation test.
Buildings 15 04248 g010
Figure 11. Result of repetition test.
Buildings 15 04248 g011
Figure 12. Extension of discovered structure and analysis of causal path.
Buildings 15 04248 g012
Table 1. Summary of related work on causal inference and causal discovery.
ReferenceMethodDomainSummary
[3]Causal inferenceBuilding energy designThis study introduces causal inference into energy-efficient building design to identify cause–effect links between design parameters and performance outcomes. It further demonstrates that causal reasoning improves the quality design decision-making.
[4]Causal inference and discoveryGeneral causal theoryIt explains Judea Pearl’s three-level hierarchy (association, intervention, counterfactual) and formalizes the mathematical foundations of causal inference. It also highlights conceptual distinction between correlation and causation.
[5]Causal inferenceEnergy policyThis study applies causal inference to evaluate the policy’s impact on energy efficiency. The analysis shows that the policy increased energy efficiency in demonstration cities by approximately 4.8% relative to non-demonstration cities.
[6]Causal inferenceBuilding scienceIt emphasizes that reversing the causal direction between variables leads to different interpretations. Using two regression approaches in thermal comfort research, it shows that causal reasoning—unlike mere correlation—reveals distinct comfort zones with actionable implications for energy efficiency.
[7]Causal inferenceHVAC controlThis work introduces a causality-driven modeling framework for building cooling control using double machine learning (DML). The causality-driven DML model outperformed the ANN (MSE = 0.19 °C), revealed true causal effects, and produced physically consistent predictions across varied control conditions.
[8]Causal inference and discovery Data scienceThis review surveys algorithms, assumptions, and applications of causal inference and discovery. It also identifies practical challenges and emerging trends in applying these methods to real-world data.
[9]Causal discoveryBioinformaticsIt constructs Bayesian network models from gene expression data using the PC algorithm, illustrating large-scale causal discovery from purely observational data in early work.
[10]Causal discoveryData scienceThis work outlines the foundational assumptions required for causal discovery and reviews several prominent approaches used in practice.
Table 2. Results of reliability checks.
AlgorithmTestMetricValueInterpretation
PCPermutationp-value0.01The discovered structure is non-random
RepetitionEdge recurrence rate>0.4Stable structure across runs
FCIPermutationp-value0.01The discovered structure is non-random
RepetitionEdge recurrence rate>0.3Stable structure across runs
Disclaimer/Publisher’s Note: The statements, opinions and data contained in all publications are solely those of the individual author(s) and contributor(s) and not of MDPI and/or the editor(s). MDPI and/or the editor(s) disclaim responsibility for any injury to people or property resulting from any ideas, methods, instructions or products referred to in the content.