Article

Study on the Governance of Opportunistic Behavior by Contractors in Subway Construction Based on SEM-SD

1
School of Architecture and Civil Engineering, Xi’an University of Science and Technology, Xi’an 710054, China
2
School of Urban and Construction Engineering, Xi’an University of Science and Technology High-Tech College, Xi’an 710109, China
*
Author to whom correspondence should be addressed.
Buildings 2025, 15(23), 4249; https://doi.org/10.3390/buildings15234249
Submission received: 28 October 2025 / Revised: 21 November 2025 / Accepted: 24 November 2025 / Published: 25 November 2025
(This article belongs to the Section Construction Management, and Computers & Digitization)

Abstract

As a vital component of urban transportation systems, subways play a crucial role in the development of a city. However, opportunistic behaviors by subway construction contractors frequently occur, adversely affecting project objectives. This study employs literature review methods to identify six key dimensions that influence the governance of opportunistic behaviors by subway project contractors, thereby constructing a theoretical model of governance factors. Based on this theoretical framework, hypothesis testing and questionnaire design were conducted. Structural Equation Modeling (SEM) path analysis identified construction process management as the direct cause influencing the governance of opportunistic behavior by subway project contractors, exerting a direct effect on such governance. Meanwhile, industry standardization, external oversight mechanisms, project governance quality, contractor credit evaluation, and internal organizational controls within the construction firm were identified as indirect governance factors. A system dynamics model was employed for dynamic simulation analysis of the governance system, revealing the dynamic evolution of opportunistic behavior governance levels under various influencing factors. Scenario simulations identified the pathway, industry standardization → internal controls within the construction organization → project governance quality → construction process management → opportunistic behavior governance, as yielding the lowest frequency of opportunistic behavior occurrence and optimal governance levels. The findings provide a governance basis for addressing the frequent occurrence of opportunistic behavior in subway construction projects.

1. Introduction

Underground space and subway projects, as vital components of urban infrastructure development, play a significant role in improving traffic conditions and enhancing the quality of urban life. As of 31 December 2024, a total of 325 subway lines have been successfully launched across 31 provinces nationwide, with a combined operational mileage of 10,945.6 km, greatly facilitating daily commutes for citizens [1]. However, the rapid expansion of subway systems carries substantial risks and hidden dangers, such as non-compliant construction practices, inconsistent quality standards, and unpredictable project timelines. These risks can halt subway construction or lead to quality defects, directly causing urban traffic congestion, reduced economic efficiency, and substantial societal costs. As the primary actors in the construction process, contractors form the core of this complex metro engineering system. Practices such as cutting corners, non-compliant construction, and exploiting regulatory loopholes create safety hazards in metro projects, jeopardizing project objectives and causing economic losses. Therefore, addressing non-compliant behaviors among metro contractors is of paramount importance for the success of metro construction projects [2].
The key to addressing non-compliant practices by subway construction contractors lies in accurately analyzing and defining these behaviors. In economics, opportunistic behavior refers to deceptive strategies adopted for personal gain, encompassing actions such as lying, cheating, stealing, making false promises, threatening, and withholding truthful information [3]. The core of opportunistic behavior lies in the deceptive pursuit of personal gain, primarily encompassing strategic deception, exploiting information asymmetry, and exploiting regulatory loopholes. This aligns closely with the non-compliant practices of subway construction contractors, revealing both the essence of such misconduct and the conditions under which it arises. Therefore, defining non-compliant behavior by subway contractors through the lens of opportunistic behavior unifies the theoretical framework, facilitates analysis of the root causes of non-compliance, and enables more effective governance research [4].
In the construction sector, opportunistic behavior by contractors frequently occurs—cunningly speculative actions taken to maximize their own profits at the expense of other partners’ interests [5]. The industry’s technical complexity and highly chaotic environment create significant information uncertainty, prompting contractors to adopt opportunistic strategies for personal gain. Such deviations from project objectives pose potential threats to overall construction goals [6]. Such profit-driven misconduct not only severely impedes steady improvements in project performance and infringes upon the legitimate rights of owners but also poses a threat to the overall healthy development of the construction industry [7,8]. Addressing these issues, some scholars have researched methods for identifying opportunistic behavior and proposed targeted governance strategies. Dai et al. [9] identified through case studies that construction firms engage in non-compliant practices throughout the project lifecycle to pursue personal gains, adversely affecting projects. This manifests as opportunistic behaviors such as bid rigging, project delays, and cutting corners. Li and Ning [10] argued that opportunistic behavior by consultants is common in construction processes, with demand risks and information asymmetry serving as auxiliary variables to examine the impact of consultant opportunism on construction projects. Ling et al. [11] argued that contract flexibility reduces opportunistic behavior by contractors in one aspect, yet simultaneously increases such behavior due to payment conflicts. They validate hypotheses using structural equation modeling (SEM) and control the impact of contract flexibility on opportunistic behavior by moderating the application level of BIM. Most existing studies remain static, failing to account for the frequency of opportunistic behavior throughout a construction project’s lifecycle. They also lack predictive models for governance levels, rendering them ineffective in addressing opportunistic behavior within real-world engineering cases.
In summary, opportunistic behavior exerts a significant impact on project objectives, yet static studies based on structural equation modeling prove insufficient for addressing the complex and dynamic nature of construction projects. This study focuses on subway construction projects, advancing the static analysis of construction contractors’ opportunistic behavior toward a dynamic framework. Based on empirical analysis, it simulates the frequency and level of governance for such behavior, examines its evolution trends and governance effectiveness, and identifies deficiencies in governance outcomes through real-world engineering cases. Corresponding adjustment measures are proposed. This research aims to provide subway project managers with a comprehensive governance system for contractor opportunistic behavior, thereby reducing construction safety hazards and enabling targeted risk control and preventive management of human-induced accidents and disasters.

2. Literature Review

2.1. Opportunistic Behavior

2.1.1. Opportunistic Behavior by Contractors

Numerous scholars have examined the causes of opportunistic behavior among contractors from multiple perspectives. Shang et al. [12] studied construction firms in highway projects, investigating why they adopt unsustainable practices. They ultimately found that contractors sought to avoid environmental liabilities and evade government oversight, leading to opportunistic actions. During the PPP project implementation, BU et al. [13] observed that inadequate supervision and information asymmetry foster speculative tendencies. Yang [14] applied stakeholder network theory, identified dependency relationships, authority–responsibility dynamics, and capital specificity as primary drivers of contractor opportunism. Eisenberg [15] contended that construction projects characterized by extended timelines, multiple stakeholders, and challenges in effective oversight are highly susceptible to opportunistic behavior, thereby introducing quality and safety risks during implementation.

2.1.2. Client Opportunistic Behaviour

Omar et al. [16] argued that the client opportunistic behavior primarily manifests as miscommunication with contractors. When clients convey unclear design concepts, contractors may interpret them incorrectly and perform inefficient work, thereby undermining project objectives. Kibremoges [17] studied construction projects and found that clients frequently alter requirements due to opportunistic behaviors driven by personal interests. This forces contractors to revise their schedules, significantly jeopardizing project success. Such opportunistic behavior is attributed to inadequate client demand management.
Existing research indicates that opportunistic behavior in construction projects is not only prevalent among contractors but also occurs among clients. However, the adverse effects of client opportunism, such as inefficient communication and changing requirements, are often borne by contractors, thereby compromising project quality. Client opportunism primarily manifests in planning and decision-making, typically harming only the economic interests of contractors. In contrast, contractor opportunism not only causes financial losses but also jeopardizes project quality and safety, posing greater societal risks. Therefore, addressing contractor opportunism is more urgent. Effectively managing it can also mitigate the opportunistic behavior transferred from clients to contractors, thereby more efficiently resolving speculative practices within construction projects.

2.2. Study on Opportunistic Governance in Subway Construction

Based on the aforementioned existing research, opportunistic behavior by construction contractors can exert significant negative impacts on project objectives and may potentially cause social hazards. This is particularly critical for construction projects with stringent safety requirements, such as subway engineering. Therefore, research on addressing opportunistic behavior among subway construction contractors represents a key area requiring focused attention in contemporary project engineering management. To govern opportunistic behavior among subway construction contractors, it is essential to identify relevant influencing factors. Yu et al. [18] studied subway tunnel construction safety by establishing an indicator evaluation system to analyze governance factors. They developed a risk factor coupling model incorporating issues such as construction personnel violations, inadequate external supervision, and chaotic construction schedules. Using a system dynamics (SD) model, they simulated how these factors influence risk levels, offering new insights for ensuring subway tunnel construction safety. LUO et al. [19] combined literature review and entropy weight analysis to construct a hybrid evaluation model for assessing safety risks in prefabricated subway station construction. Based on actual engineering cases, they identified human-related risks, mechanical risks, and technical risks associated with contractors as key factors influencing the overall risk of subway projects.
Factors identified through literature review and indicator system evaluation methods often carry a degree of subjectivity and may not fully reflect objective realities. Some scholars have conducted empirical research on these influencing factors, extracting key determinants and identifying governance pathways.
Liu [20] employed a questionnaire survey method based on three key dimensions—mobility, safety, and comfort—using structural equation modeling (SEM) to demonstrate their impact levels. Combining this with OLS theory, the study further examined the relationship between walkability and subway ridership, proposing spatial improvement measures for subway systems. Abdullah [21] employed structural equation modeling (SEM) to investigate how six key project management levels influence BIM adoption. The study validated positive correlations between each management level and BIM adoption, demonstrating BIM’s potential to enhance sustainable design excellence in small-scale projects.

2.3. Dynamic Governance

Construction projects exhibit complex and dynamic characteristics, with the behaviors of various stakeholders constantly evolving. Static studies focusing solely on opportunistic behaviors of subway contractors are insufficient to address the complex and ever-changing construction environment. Unstructured factors in complex scenarios have received limited in-depth examination. Employing integrated research methodologies to design scenarios and predict project complexity is particularly crucial for managing opportunistic behavior among construction firms. Zheng [22] combined SEM and SD models within a composite theoretical framework to construct an integrated system dynamics response model. This model examined how carbon costs vary under different influencing factors through green policy investments across diverse scenarios. Gao [23] examined green building development in Shandong Province against the backdrop of dual-carbon policies. Integrating structural equation modeling, growth association rules, and system dynamics modeling, the study analyzed residents’ cognitive differences regarding green buildings, factors influencing acceptance willingness, and corporate promotion pathways, offering new insights for Shandong’s green building transformation. Shi [24] identified key factors influencing energy-saving retrofits in prefabricated buildings through sensitivity analysis. By introducing a system dynamics model for scenario simulation, this approach significantly enhances understanding of how various factors dynamically impact energy-saving and emission-reduction design solutions for building envelopes throughout their lifecycle.

3. Theoretical Background

3.1. Accident Case Statistics

This study compiled a total of 3159 accident cases published by authoritative departments such as the Ministry of Emergency Management and the Ministry of Housing and Urban-Rural Development from 2003 to 2024, including 477 cases involving subway project contractors. These resources provide a rich case foundation for research, enabling an in-depth understanding of potential safety risks and accident patterns during subway construction. Based on accident causes, the study explores the underlying factors and potential reasons for accidents resulting from opportunistic behavior. Due to the sheer volume of accident data, it is impossible to present all cases. Here, three accidents causing significant damage to subway construction are highlighted, revealing the manifestations of opportunistic behavior involved.
(1)
Due to inadequate pre-construction surveys and lax construction management, identified cable risks were not incorporated into effective control measures. Under schedule pressure, field operations ultimately resulted in damage to four cables. Specific opportunistic behaviors manifested as risky operations and reckless rushing to meet deadlines.
(2)
A fire broke out during the construction of a subway project. The investigation revealed that the cause of the fire was the use of substandard insulation materials in the cooling tower. The construction company procured materials of unknown quality without undergoing national standard testing, demonstrating opportunistic behavior involving cutting corners.
(3)
A secondary collapse occurred at a subway construction site, primarily due to management personnel lacking technical competence. Following the initial incident, they failed to implement immediate remedial measures, leading to the subsequent accident. The specific opportunistic behavior manifested as inadequate enforcement of technical management protocols.
Through organizing and summarizing collected accident cases, 61 primary manifestations of opportunistic behavior were ultimately identified, including cutting corners, disregarding discipline, rushing work blindly, violating operational protocols, overloading equipment, and inadequate technical briefing procedures. Accident case statistics are shown in Figure 1.

3.2. Identification of Factors Influencing the Governance of Opportunistic Behavior by Contractors

In exploring the essence of opportunistic fraud, Professor W. Steve Albrecht offered a profound perspective. He contended that fraudulent acts do not occur by chance but emerge as a complex phenomenon shaped by the interaction and mutual reinforcement of three key factors: pressure, opportunity, and self-justification. These elements form a chain reaction that ultimately leads to fraudulent behavior [25]. This theory transcends specific domains; its universality enables any organization or institution to comprehend and address fraud from diverse perspectives and levels. Similarly, this framework can be applied to identify the root causes of opportunistic behavior, specifically stemming from behavioral pressure, behavioral opportunity, and behavioral rationalization.
(1)
Behavioral pressure refers to external or internal pressures faced by individuals or organizations that drive them to engage in opportunistic behavior as a means of coping with or alleviating these pressures.
(2)
Opportunity for opportunistic behavior refers to the chance for an individual or organization to engage in opportunistic actions within a specific context without being easily detected or deterred.
(3)
Behavioral rationalization refers to the process by which individuals or organizations provide justifications or excuses for opportunistic behavior, making their actions appear reasonable and justified.
When individuals or organizations face pressure, encounter behavioral opportunities, and can justify their actions through rationalization, the likelihood of engaging in opportunistic behavior increases. Consequently, the causes of opportunism primarily stem from subject factors, institutional factors, regulatory factors, and environmental factors [26].
In delving into the governance of opportunistic behavior among contractors, it becomes evident that numerous complex and diverse influencing factors are involved. The sheer variety of these factors undoubtedly poses challenges and inconveniences for research. This study begins by examining the root causes of opportunism, synthesizing collected literature to preliminarily organize the influencing factors of governance. The specific identification methodology is illustrated in Figure 2.
Through an in-depth exploration of Judith’s governance theory proposed in 1998, governance activities are refined into multiple dimensions, including authoritative governance, third-party governance, collaborative governance, and self-governance [27]. Considering the unique attributes of subway projects, such as large scale, substantial investment, extended construction periods, high technical requirements, complex construction processes, and challenging geological conditions, these factors determine that subway engineering construction is a high-risk construction project [28]. Integrating these governance dimensions, this study categorizes identified factors influencing opportunistic behavior governance based on literature review and Chinese case investigations, as summarized in Table 1.
Based on the analysis of opportunistic behavior causes and literature review, combined with the three-factor theory of fraud, this study examines the root causes of opportunistic behavior. By identifying internal and external factors, including subject factors, institutional factors, supervisory factors, and environmental factors that influence the governance of opportunistic behavior, the identified factors are categorized and summarized in Table 2.
As shown in Table 2, the factors governing opportunistic behavior can be broadly categorized into three major types: industry, market regulation, and social oversight; project governance quality; and construction project implementation management.
(1) Industry, Market Regulation, and Public Opinion Oversight: Establish sound laws, regulations, and institutional frameworks to penalize violations and curb opportunistic behavior. These factors are summarized as S1, S2 and S3. This level pertains to the macro-environmental layer, where factors primarily encompass external business and social environments that exert influence from outside the project, thereby generating opportunistic behavior [45].
(2) Project Governance: Sound subway project design and rigorous contract management serve as crucial means to prevent opportunistic behavior. Concurrently, project oversight and quality control effectively deter opportunistic conduct. These factors are summarized as: S4, S5 and S6. This level pertains to the meso-level contractual layer, directly corresponding to the governance structure of specific projects. Positioned between the macro environment and micro implementation, it serves as a bridge within the governance hierarchy, primarily encompassing contract integrity and information exchange [46].
(3) Construction Project Implementation Management: Through rigorous construction process management, opportunistic behavior can be effectively prevented and addressed, ensuring subway projects are completed on time and to quality standards. Factors in this area are summarized as follows: S7: Integrity Culture and Ethical Standards; S8, S9, S10. This level pertains to the micro-implementation layer, focusing on construction management and serving as the executor of macro-level guidance and governance structures [47].
The governance influence factors framework in this study adheres to the logical principles of external environment, internal governance structure, and executive management. This ensures the framework’s completeness and accuracy, encompassing not only institutional designs addressing opportunistic governance behaviors but also shaping environmental pressures. Ultimately, it translates into operational practices, establishing a clear theoretical foundation for subsequent structural equation modeling and the identification of critical pathways.
Through a combined analysis of theory and case studies, it is deduced that the causes of opportunistic behavior encompass both individual motivational factors and external environmental influences. Building upon this causal analysis, governance influencing factors should be categorized into more granular dimensions, while simultaneously refining the classification of these factors, as summarized in Table 3.
Table 3 preliminarily categorizes governance influence factors into four major types: industry and market standardization, social public opinion oversight, project governance, and construction project implementation management. Based on the literature review findings, these are further subdivided into six dimensions. Summarizing case collection and literature review results, F1 is subdivided into S1 and S2, F2 into S3, and F3 into S4, S6, and S8. F4 is subdivided into S5 and S10, F5 into S7, and S6 into S9.
This section analyzes the factors contributing to opportunistic behavior in current construction practices based on the Fraud Triangle theory, clarifying that such behavior arises from the cumulative effects of multiple factors. By examining the root causes of opportunistic behavior, we identify and categorize the influencing factors for its governance. This process yields six common factors for managing opportunistic behavior among subway construction contractors: F1, F2, F3, F4, F5, and F6.

4. Constructing SEM Model

Empirical research and Table 3 reveal the multi-level factors influencing the governance of opportunistic behavior among subway project contractors. Based on these findings, this study proposes specific hypotheses. These hypotheses were integrated into the questionnaire design principles to create the survey instrument, which was subsequently used for data collection.

4.1. Research Hypothesis

Based on the interrelationships among factors influencing the governance of opportunistic behavior by subway project contractors, and grounded in the principle that these factors “positively promote and negatively suppress” opportunistic behavior, the following research hypotheses are proposed.
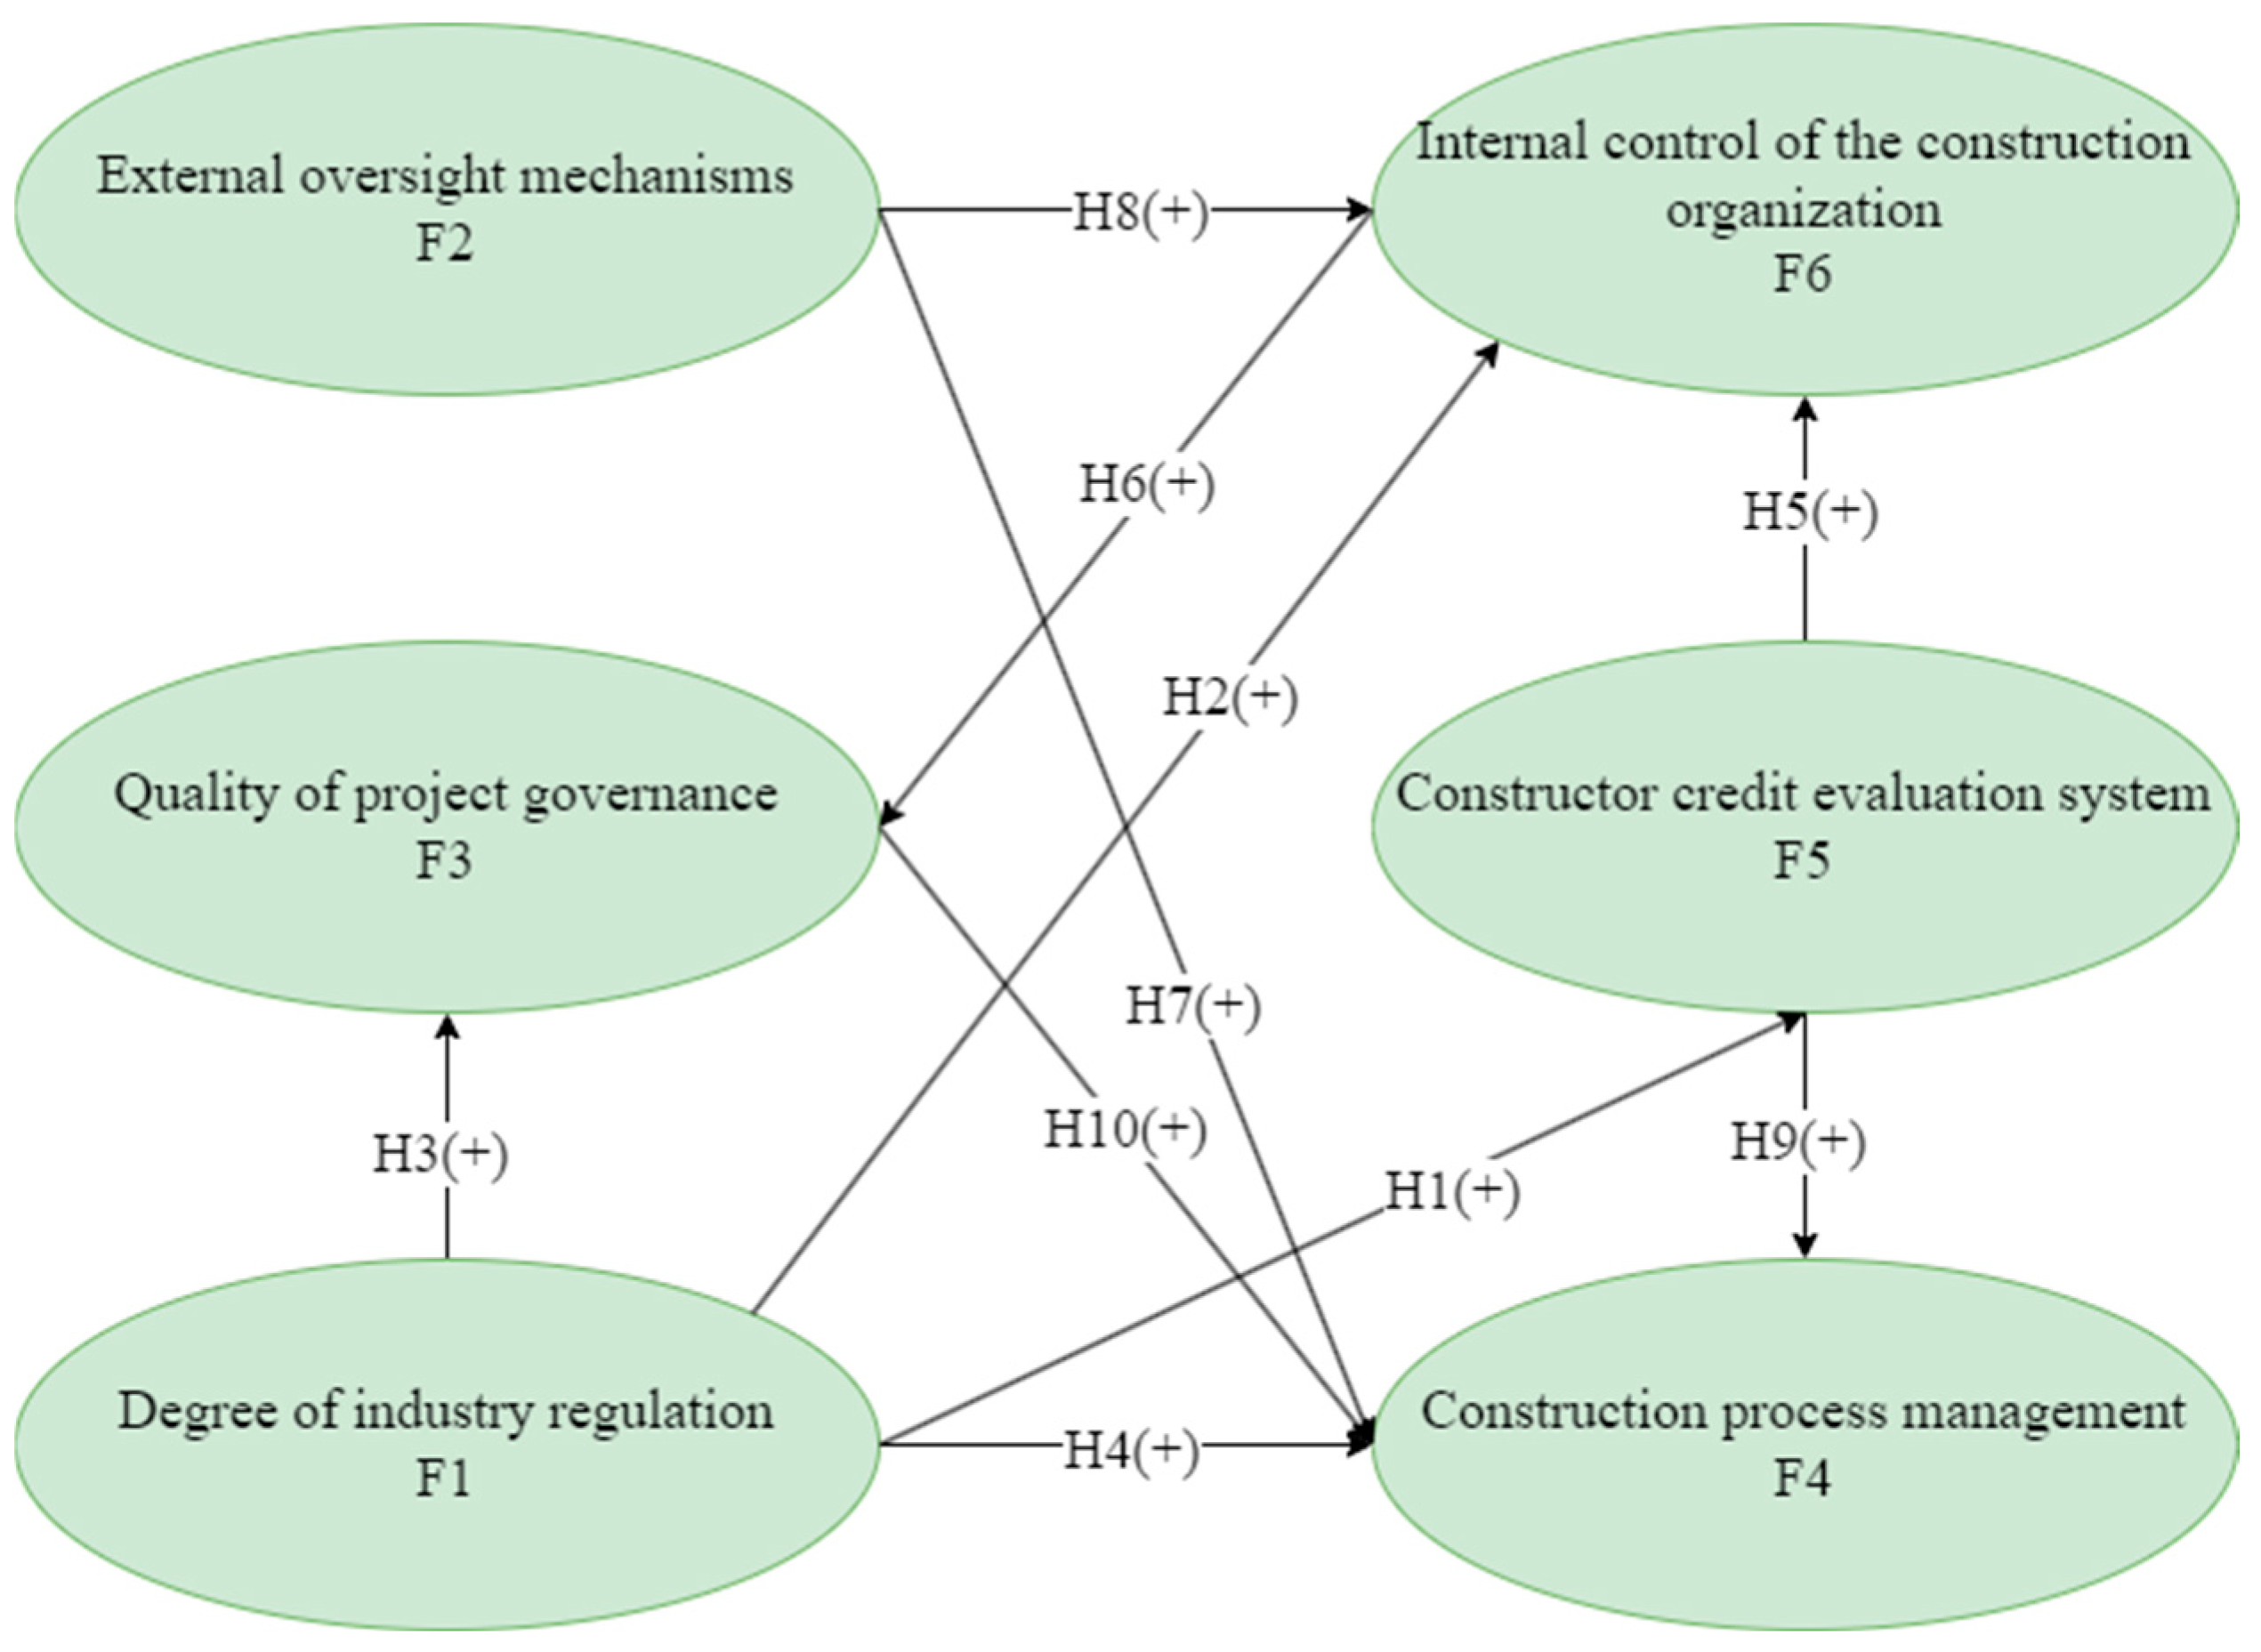
Based on the literature review above, the establishment and improvement of relevant legal systems aims to foster norm-compliant behavior within organizations through authoritative governance activities [27,29], thereby enhancing industry standardization. Within the construction industry, the formulation and enforcement of industry standards are crucial, with the creation of an economic environment and institutional development playing pivotal roles. Establishing robust accountability mechanisms can significantly enhance governance quality, strengthen internal controls, elevate the overall professional standards of the industry, and consequently reduce opportunities for opportunistic behavior [34]. Therefore, it can be hypothesized that:
H1: 
The degree of industry regulation can have a significant positive effect on the credit evaluation system of construction organizations.
H2: 
The degree of industry regulation has a significant positive effect on the internal control of construction organizations.
H3: 
The degree of industry standardization has a significant positive effect on the quality of project governance.
H4: 
The degree of industry standardization can have a significant positive effect on construction process management.
Based on reputation mechanisms, even without external oversight, a transparent credit evaluation system will prompt contractors to proactively regulate their own conduct to enhance their credibility ratings, thereby serving a supervisory function [31,42]. Project governance quality depends on the personal capabilities of project managers. Standardized and efficient contractors can successfully fulfill contracts and meet owner requirements [2]. External oversight by owners and supervisors can effectively detect opportunistic behavior during construction. Under supervisory pressure, contractors proactively improve construction quality and reduce non-compliant practices [13,35]. Therefore, it can be hypothesized that:
H5: 
The constructor credit evaluation system can have a significant positive effect on the internal control of construction organizations.
H6: 
Construction organizations’ internal controls can have a significant positive effect on project governance quality.
H7: 
External monitoring mechanism can have a significant positive effect on construction process management.
H8: 
External supervision mechanisms can have a significant positive effect on the internal control of construction organizations.
H9: 
Construction organization credit evaluation system can have a significant positive effect on construction process management.
Project governance quality is the most direct factor influencing opportunistic behavior among construction personnel, encompassing elements such as information transparency [44], ethical value development, and psychological complexity [39]. These aspects are integral to both project governance quality and construction process management. Enhancing project governance quality effectively promotes the effectiveness and efficiency of construction process management. This positive impact manifests in improved decision-making capabilities and execution power of the project management team, enhanced coordination and information flow among various aspects during construction, thereby elevating the overall quality level of construction process management [43]. Therefore, it can be hypothesized that:
H10: 
The quality of project governance can have a significant positive effect on construction process management.
Based on the relationship assumptions among six key influencing factors—external oversight mechanisms, industry standardization levels, contractor credit evaluation systems, internal construction organization controls, project governance quality, and construction process management, a hypothetical model of the influence relationships governing opportunistic behavior in subway project contractors has been constructed, as shown in Figure 3.

4.2. Questionnaire Design

In this study, questionnaires were distributed to collect the information from the respondents and the factors influencing the opportunistic behavior governance of the construction party of the subway project. Combined with the analysis of the relevant literature and the maturity scales of existing studies, 27 measurement variable scales composed of six key influencing factors were compiled. To ensure accurate answers, the Likert 5-point scale method was used to unify the direction, and each item was set at five degrees, one representing a weak degree and five representing a strong degree.
This survey employed a hybrid approach combining online and offline questionnaire distribution. Online questionnaires were created electronically and uploaded to an online platform, accessible via web links for completion. Offline, printed paper questionnaires were distributed at subway construction sites, inviting construction personnel to complete them. The total number of respondents reached 460. After excluding questionnaires with abnormally short completion times and those showing concentrated responses to a single option, 361 valid questionnaires remained. The questionnaire recovery rate was 78.47%, meeting the relevant requirements for valid recovery rates in questionnaire survey methodology.
After collecting the questionnaire data, a statistical analysis was conducted, focusing on the descriptive analysis of the participants’ gender, age, level of education, years of experience in the field, and job positions. Detailed descriptive statistical information on the sample is listed in Table 4, from which we can clearly understand the basic characteristics of the participating samples of the survey.
(1)
Gender characteristics. Among the returned survey samples, the proportion of males was significantly higher than that of females. Specific data shows that males accounted for 92.521% of the total sample, while females constituted only 7.479%. The primary reason lies in the challenging conditions typical of subway construction sites. These include high noise levels, significant dust and particulate matter, and underground tunnel environments that are generally warmer and more humid than surface areas. Furthermore, subway construction involves physically demanding work with elevated risks, requiring substantial physical strength and stamina—areas where men are generally considered to have a comparative advantage.
(2)
Age Distribution. Overall, the age distribution of subway construction workers exhibits distinct characteristics. Over 60% of respondents fall within the 25 to 45 age bracket, while conversely, those under 25 account for only 10.803% of the total sample. This reflects the industry’s specific employment patterns, where younger workers are relatively scarce and the age distribution skews toward middle age.
(3)
Educational Background Distribution. Among the survey participants, those with vocational high school, senior high school, or junior college degrees constituted the largest group, accounting for over 67% of respondents. Bachelor’s degree holders represented 27.701%, while postgraduate degree holders and above comprised 4.709%. All respondents possessed a certain level of education, ensuring the reliability of the questionnaire survey results.
(4)
Years of Experience Distribution. The vast majority of respondents had over five years of experience, with the highest proportion (34.626%) having 10 to 14 years of experience, while those with over 15 years of experience accounted for 25.208%. The survey findings indicate that personnel from the surveyed subway project contractors generally possess extensive work experience. This discovery provides valuable reference information for this study. It implies that they have considerable understanding and accumulated experience in subway project construction, thereby lending credibility and representativeness to their views and attitudes regarding the governance of opportunistic behavior.
(5)
Job Position Distribution. 54.294% of respondents were managers, while 45.706% were frontline workers. The survey results demonstrate a balanced distribution of job positions, making them more likely to reflect the opinions and perspectives of the entire construction contractor, thereby enhancing their representativeness.
Before analyzing the data, the reliability and validity of the questionnaire must first be tested to determine its authenticity and accuracy of the questionnaire.

4.2.1. Reliability Test and Validity Tests

This study employed Cronbach’s alpha coefficient method to assess the internal consistency of measurement results, determining the correlation and consistency among questionnaire indicators. Reliability analysis was conducted on 27 variables using SPSS 24, with the overall results presented in Table 5.
If the Cronbach’s α coefficient is lower than 0.7, the design of the questionnaire needs to be revisited and modified to improve the reliability, while higher than 0.9 indicates that the questionnaire overall reliability is very high. Table 5 shows that the overall Cronbach’s α coefficient of the questionnaire is 0.942, indicating that the overall reliability of the questionnaire is high.
Validity, also known as validity, was used to assess the degree of agreement between the results measured by the questionnaire and objective reality. SPSS was used to obtain the appropriate test indicators for the KMO and Bartlett tests on the acquired data, and the KMO test was used to assess the applicability of the sample data. Bartlett’s test was used to test the correlation of the data, which was used to provide important information about the suitability of the data for factor analysis, as shown in Table 6.
The KMO test results show the degree of correlation between the question items; when the value is greater than 0.6, the data are usually considered suitable for factor analysis. When passing Bartlett’s test (p < 0.05), this indicates that there is a significant correlation between the sample data, and the results of the KMO test and Bartlett’s test of the sample data of this study satisfied the conditions for factor analysis.

4.2.2. Exploratory Factor Analysis

Exploratory factor analysis is a method used to reveal the internal structure of a scale. Its purpose is to integrate highly correlated measurement items into a common factor, thereby better understanding the characteristics of the research subjects. In this study, eigenvalues greater than 1 were used as factors to extract common factors. The Varimax orthogonal rotation method was applied to rotate the factor axes, minimizing correlations between extracted factors. This maximized each factor’s proportion of variance explained in the variables. Minimizing correlations between factors enhances their independence and explanatory power. This analytical approach yields a set of interpretable factors. Detailed results are presented in Table 7 (Total Variance Explained) and Table 8 (Rotated Factor Matrix).
A total of six common factors were extracted, with their respective explanatory powers being 14.298%, 12.236%, 12.049%, 10.449%, 9.963%, and 7.76%. The total explanatory power reached 66.755%, exceeding the commonly accepted standard of 60%. This indicates that these factors represent distinct dimensions or constructs within the scale. This indicates that the six common factors extracted in this study possess good representativeness, further demonstrating the scale’s sound internal structure.
According to the analysis results presented in Table 8, the factor loadings for each item in the scale were found to exceed 0.5. This indicates that each item exhibits a significant correlation with the corresponding common factor among the six extracted factors. Cross-loadings were all below 0.4, further demonstrating that the significant correlations between each item and its corresponding common factor were not influenced by other factors. This confirms that the designed scale possesses good construct validity.

4.2.3. Confirmatory Factor Analysis

A validation factor analysis was used to validate hypotheses about the relationship between observed variables and their latent variables, allowing the researcher to construct a model of the relationship between latent variables based on assumptions from theories or previous studies and to assess the fit of these hypotheses through statistical methods. Thus, validating the appropriateness of the measurement model and furthering the understanding of the relationship between the observed and latent variables, the data results help to assess the accuracy and validity of the questionnaire design, which in turn improves the reliability and validity of the study. The results of the validation factor analysis are listed in Table 9.
According to the results in Table 9, the factor loadings of each latent variable exceeded 0.7 and were significant at the 0.001 level, indicating that the existence of this relationship is not only significant, but highly significant, effectively capturing the concept or dimension represented by the latent variable. The AVE (Average Variance Extracted) of each latent variable exceeds the criterion of 0.5, indicating that the latent variables explain their measurement items to a high degree, which further strengthens the validity and trustworthiness of the measurement tool, and the CR exceeds 0.7; the individual measurement items reflect the latent variables to which they belong well, which enhances the overall reliability and validity of the measurement tool. Taken together, all of the above indicators meet the standard requirements for validated factor analysis, confirming the appropriateness of the measurement model.

4.2.4. Discrimination Validity Analysis

A deeper understanding of the correlations between latent variables and their relationship with discriminant validity was achieved by comparing the relationship between the absolute values of the correlation coefficients and the square root average variance explained (AVE) of each latent variable. The results are shown in Table 10, where the governance impact factors distinguish validity.
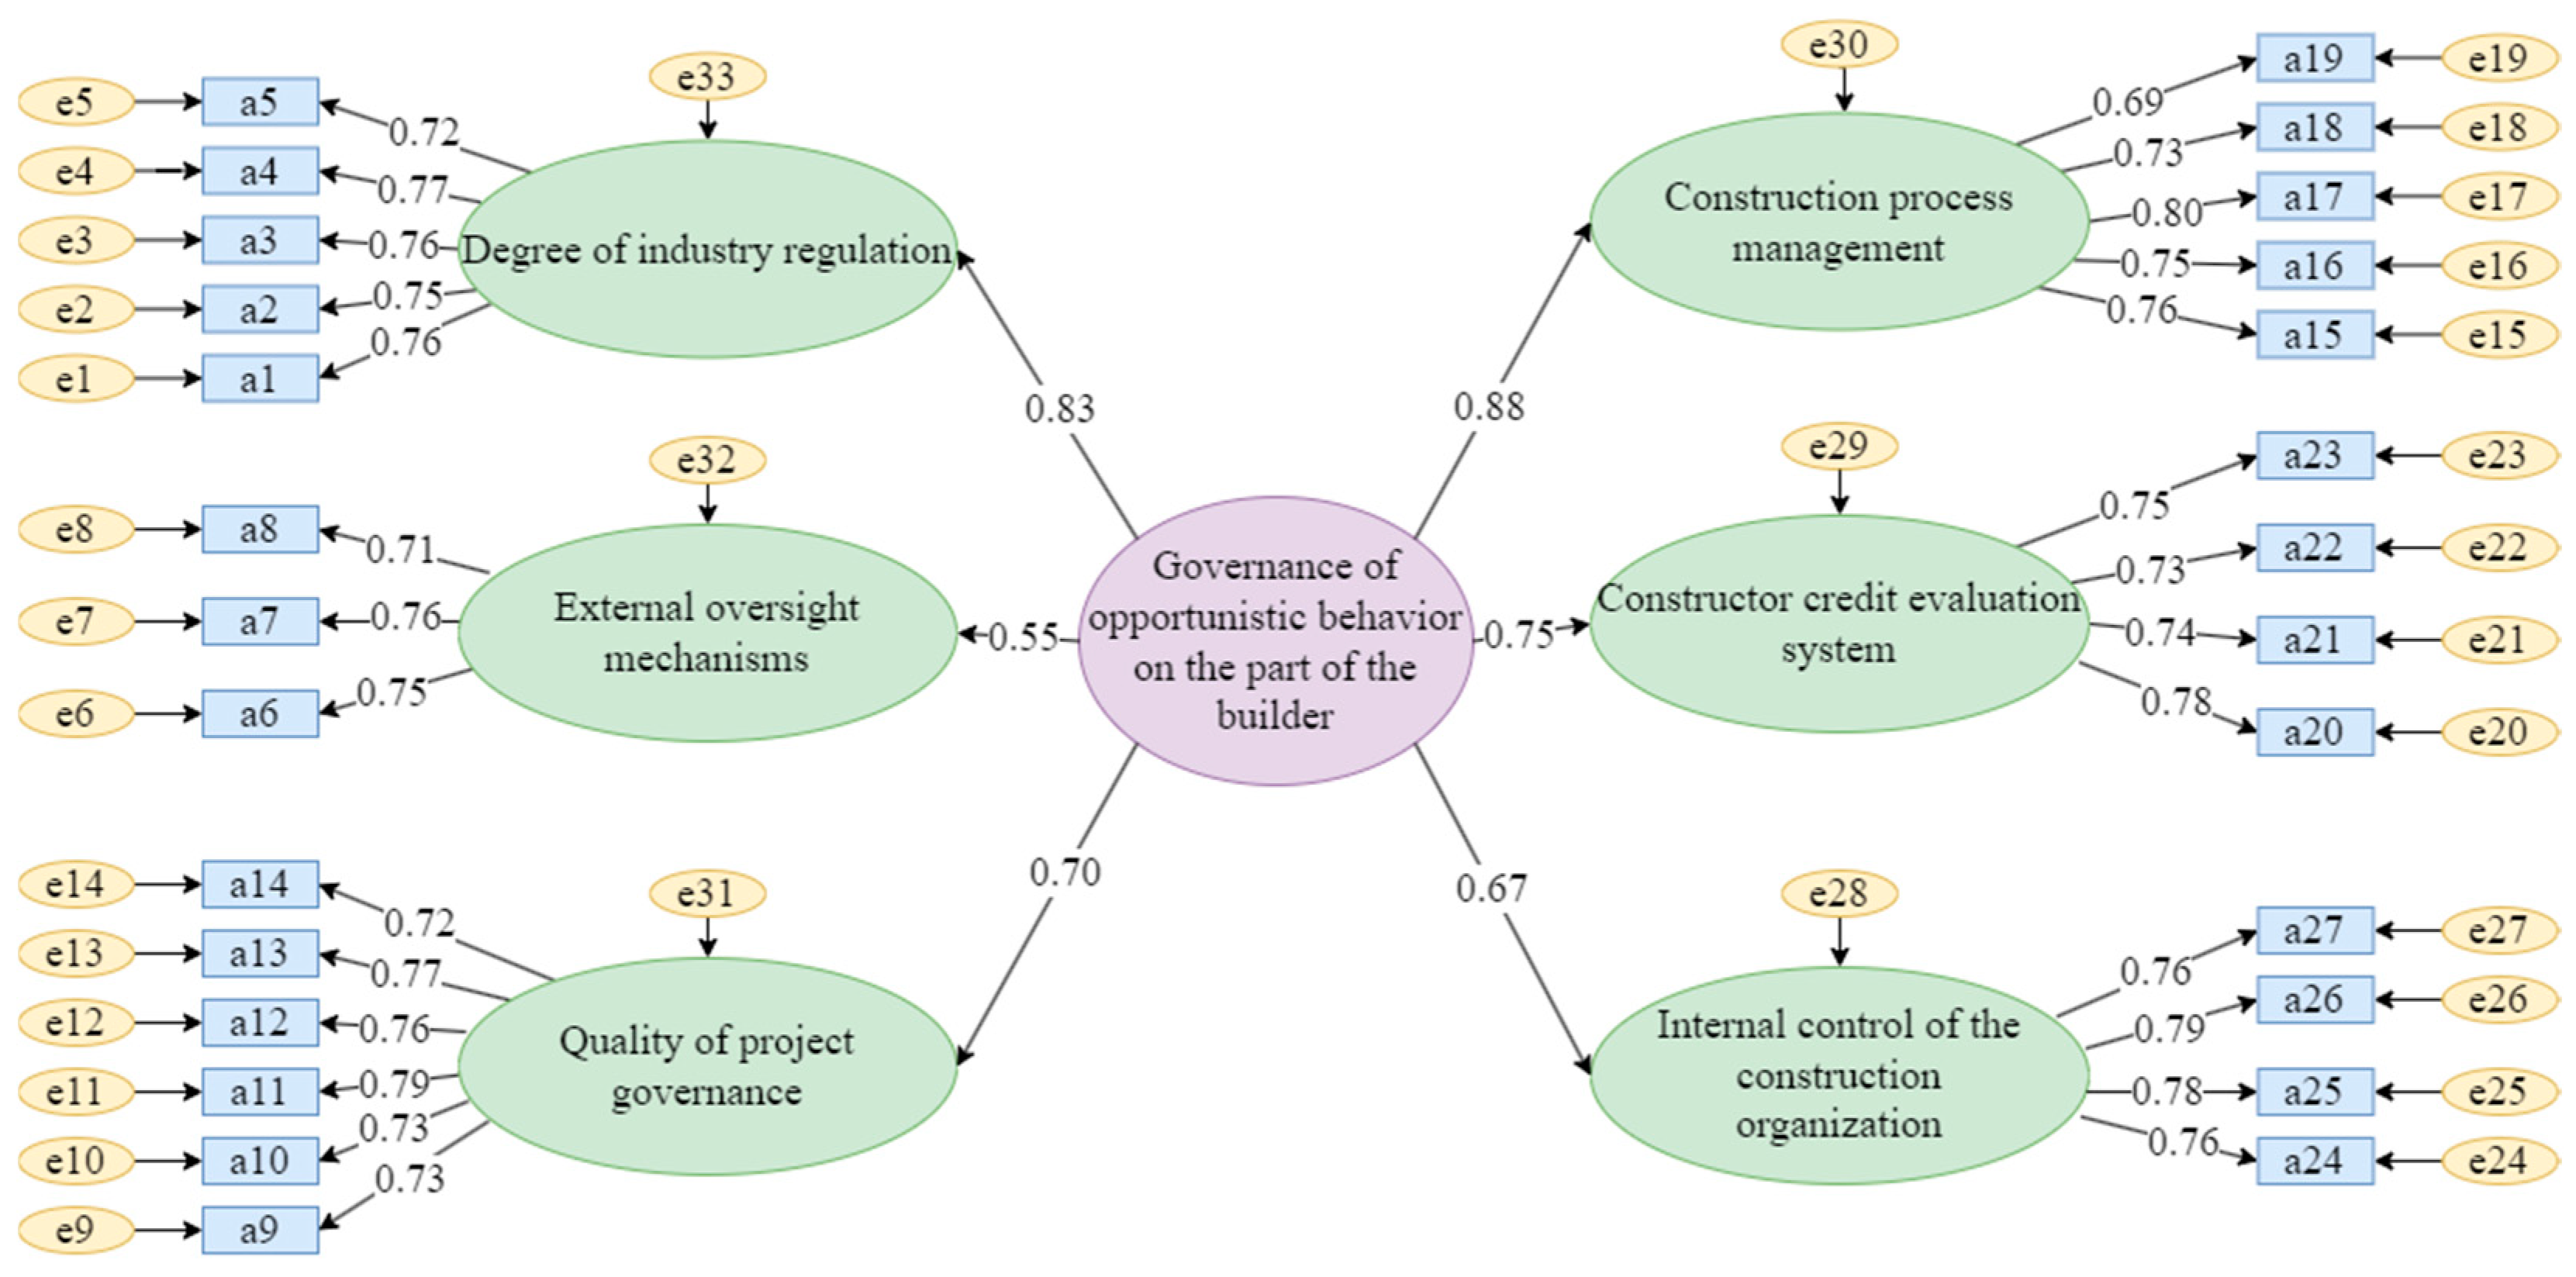
Despite the presence of some correlation between the latent variables, the correlation between the latent variables did not reach a level that weakened the discriminant validity, implying that the scale data performed well in distinguishing between the different concepts and had high discriminant validity. The correlation coefficient is used to measure the strength of the relationship between two variables; a correlation coefficient of less than 0.3 is considered a weak correlation, a correlation between 0.3 and 0.6 is considered a moderately strong correlation, and a correlation greater than 0.6 is considered a strong correlation. Most of the correlation coefficients between the Six factors fall within the range of medium-strength correlations, indicating that some higher concepts or structures explain the relationships between these factors. Therefore, a second-order validity analysis was conducted to further validate the pattern of relationships among these factors Figure 4. Second-order validation factor model normalization results were obtained.
This model contains six common factors as first-order factors, focusing on intrinsic quality (parameter significance) and extrinsic quality (goodness-of-fit indicators). “Governance of opportunistic behavior on the part of the builder” was used as a second-order factor, and the standardized regression coefficients on the arrows pointing from the second to the first order reflect the significance of the first-order factor as representing the governance of opportunistic behavior factor. The p-values of the estimated parameters of the error terms are all greater than 0.05, which is outside the level of significance, indicating that the model is of good intrinsic quality.

4.3. Structural Equation Modeling Analysis

4.3.1. Modeling and Goodness-of-Fit Tests

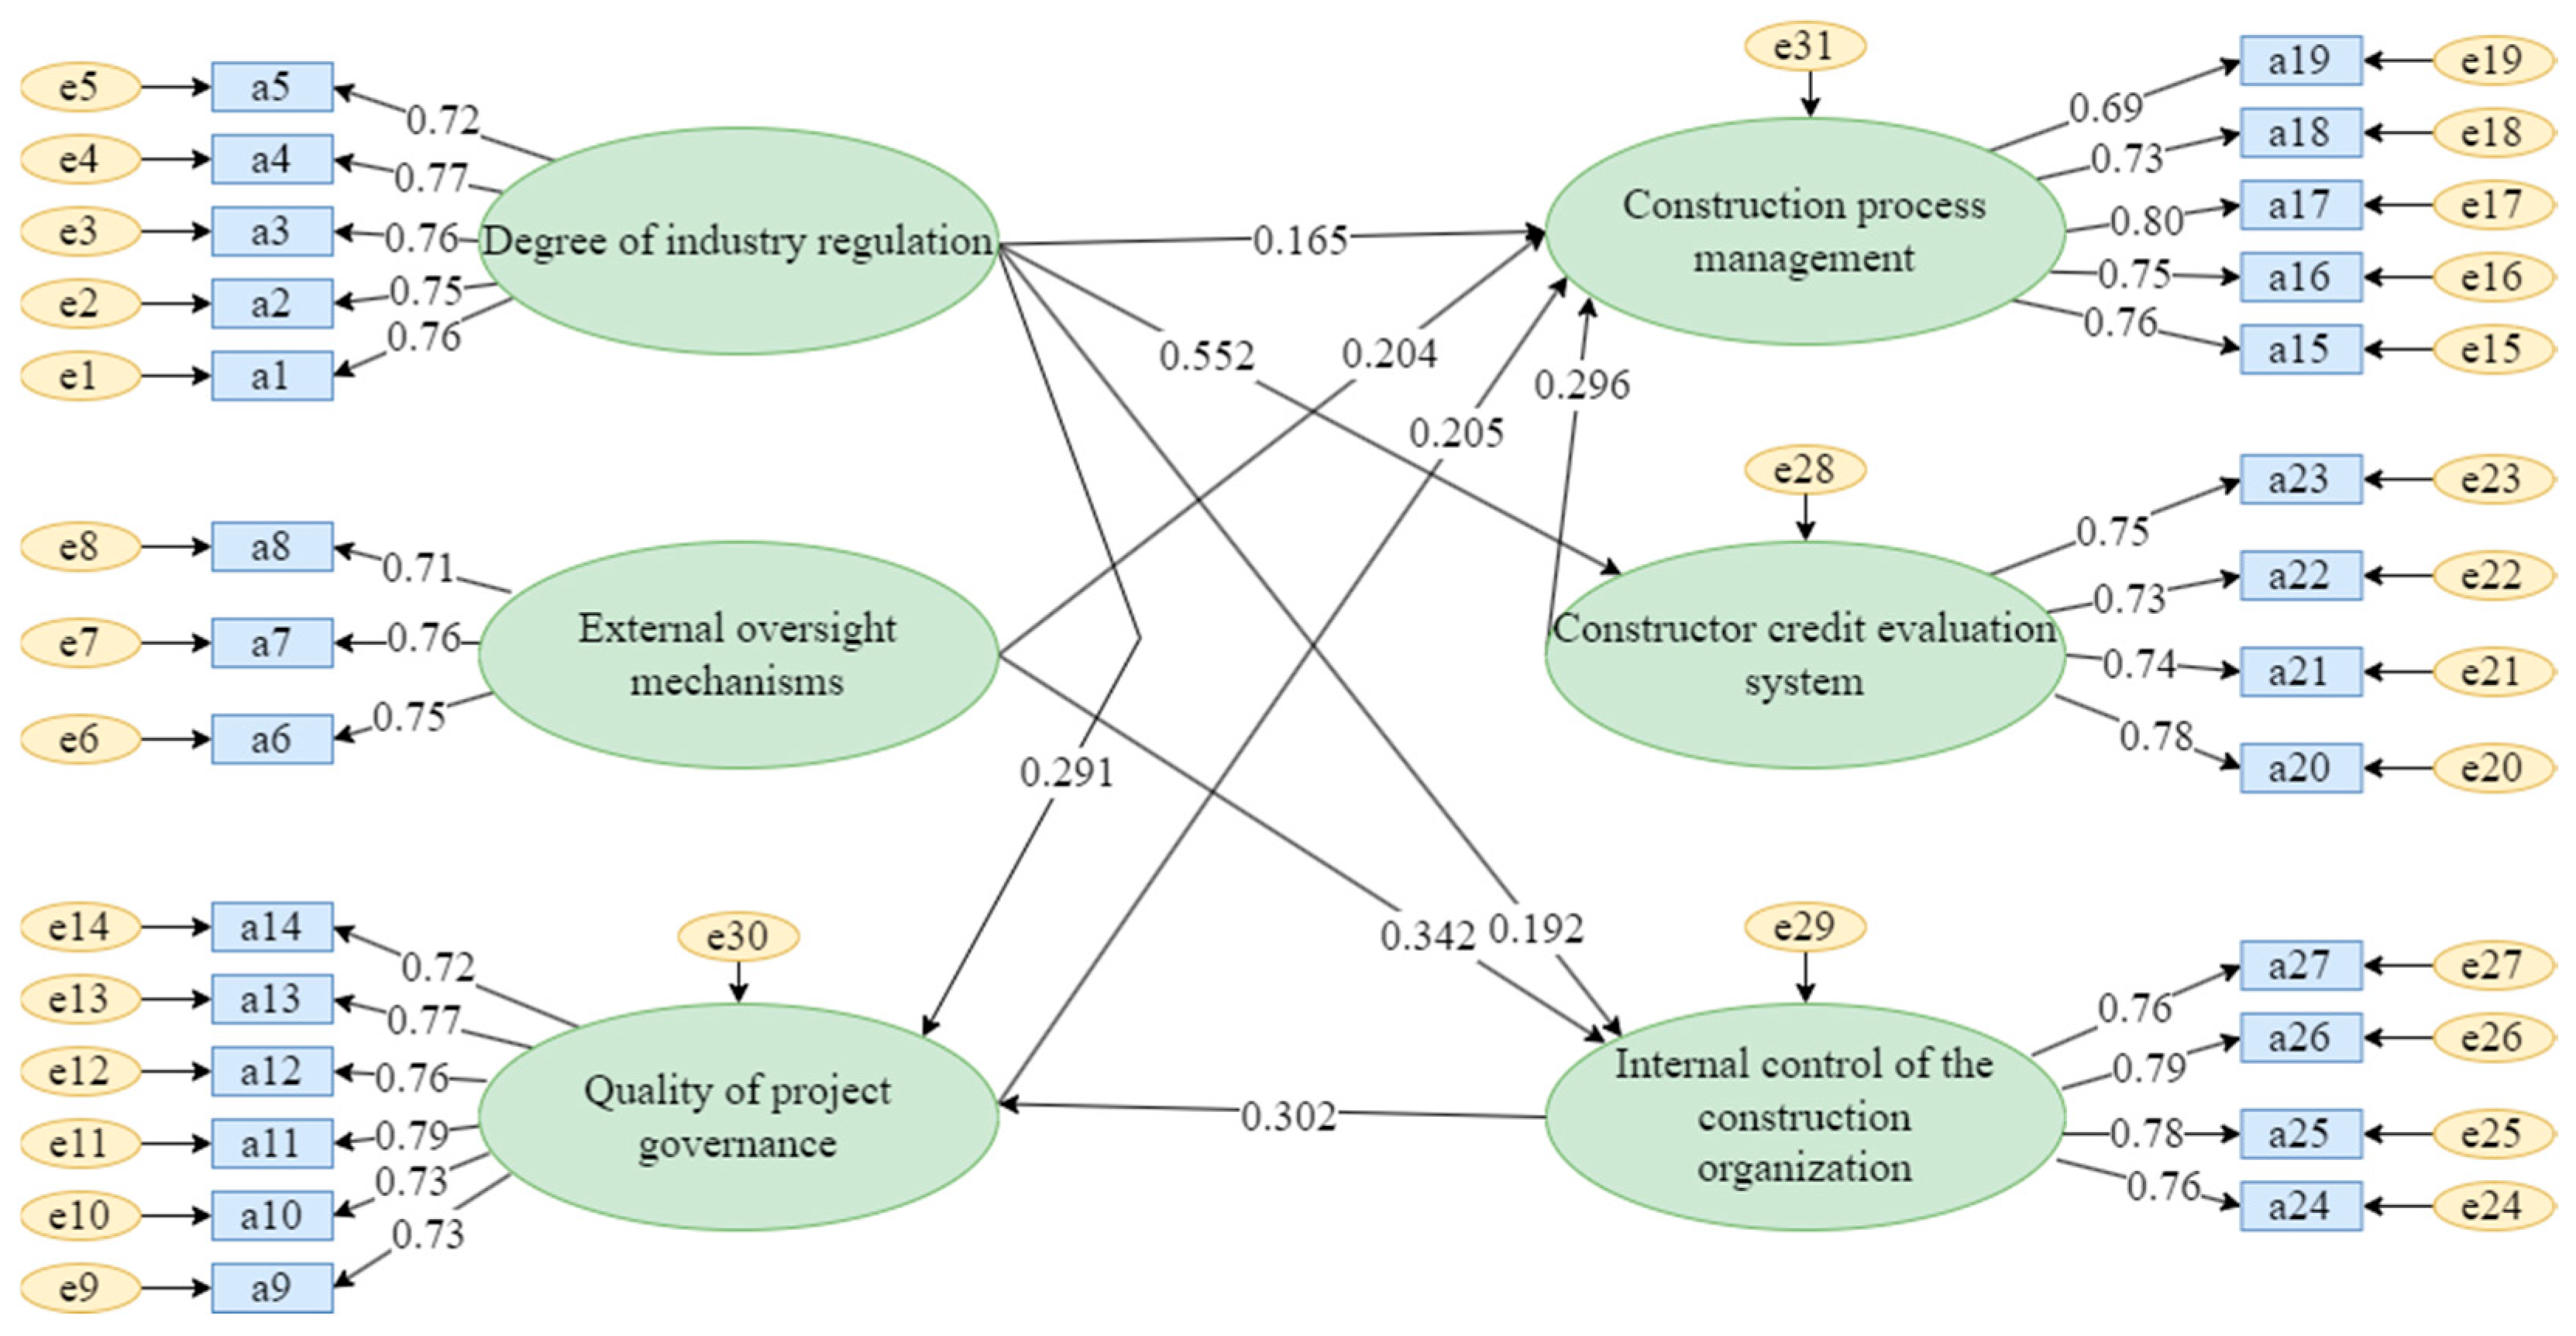
The path diagram of the structural equation model of the governance of opportunistic behavior on the construction side of the metro project was established based on the above data processing. The model can provide a detailed understanding of the relationship and mechanism of action between each variable, ensure the fitting effect of the model, help understand the internal mechanism of opportunistic behavior governance, and provide a more intuitive understanding of the degree of influence and the path of action of each factor on the governance of opportunistic behavior, which provides an important basis for further data analysis and interpretation, as shown in Figure 5.
According to the results presented in Table 11, all the fitting indicators of the model are within reasonable limits. It shows that the model performs well in terms of external quality and can effectively describe the relationship between the observed variables, as well as verify the reliability and validity of the model, which further proves the applicability and credibility of the model in explaining the governance of opportunistic behaviors of the constructors of metro projects.
Structural model fit assessment metrics include chi-square and degrees of freedom (DF), which were used to compare the complexity of the models. The GFI reflects how well the model fits the observations, with values closer to 1 indicating a better fit. CFI ≥ 0.9 indicates a better fit. RMSEA (root mean square of the error of approximation) below 0.08 indicates a good fit. CFI was used to compare the models, with values closer to 1 indicating a better fit. The NNFI and CFI have larger values, indicating that the model performs well. Larger values of NNFI and CFI indicate good model performance. The model fits well by combining the criteria for each index.

4.3.2. SEM Model-Based Governance Pathway Identification

Through SEM model and data relationship testing, the validity of the model was verified by comprehensively considering theoretical assumptions and sample recovery data. Following in-depth data analysis, the standardized parameter estimation model illustrating the influence relationships of opportunistic behavior among subway project contractors, as shown in Figure 5, was derived. This model effectively describes the relationships among various variables. Amos was employed to integrate relevant data, standardize path coefficients in the structural equation model, and validate hypotheses. Regarding Hypothesis H5, the p-value of 0.168 fails to meet the significance threshold, indicating that this relationship is not statistically significant. Therefore, the original hypothesis H5 is rejected. All other hypotheses satisfy the testing requirements. Specific standardized path coefficients are presented in Table 12.
The SEM structural model reveals relationships among latent variables through path coefficients, which are crucial for understanding the governance of opportunistic behavior among subway project contractors. The six common factors derived from exploratory factor analysis construct an interrelationship structural model among influencing factors, providing a clear framework for in-depth examination of each factor’s impact on opportunistic behavior governance. Analysis of the SEM structural model categorizes these factors’ effects on opportunistic behavior governance into two types: direct effects and indirect effects. Direct effect values represent the standardized path coefficients of each common factor within the measurement model, indicating their direct relationship with opportunistic behavior governance. Indirect effect values reflect the product of corresponding direct effect values, signifying indirect paths that influence opportunistic behavior governance through other mediating variables. The final total effect value comprehensively considers both direct and indirect influences, representing the sum of these effect values.
Analyzing the impact of F1, F2, F3, F4, F5, and F6 on opportunistic behavior governance G: F1 has 9 impact paths on G, including 1 direct path and 8 indirect paths; F2 has 5 impact paths on G, including 1 direct path and 4 indirect paths; F3 has 2 impact paths on G, including 1 direct path and 1 indirect path; F4 has only one direct influence path on G; F5 has two influence paths, comprising one direct and one indirect path; F6 has three influence paths, comprising one direct and two indirect paths. The direct and indirect influence effect values for each path were calculated, statistically analyzed, and ranked, with results presented in Table 13.
Table 13 reveals that construction process management (F4) is the most significant factor directly influencing the governance of opportunistic behavior. It acts directly on opportunistic behavior governance without any indirect pathways, serving as the primary cause affecting the governance of opportunistic behavior among subway project contractors. The indirect influence relationships among the influencing factors reveal the governance pathways for opportunistic behavior: F1 → G, F2 → G, F6 → G, F5 → G, and F3 → G. The respective impact effects of these five primary governance pathways are 1.140, 0.501, 0.265, 0.260, and 0.180.

5. Case Studies Based on System Dynamics Models

5.1. Case Background

Metro Line 8 in a certain city is positioned as a horizontal route within the metropolitan rapid transit network’s triangular backbone system. Running parallel to the east–west development axis of the main urban area, it connects the central city, the Western New City, and the Eastern New City. This refers to the Phase 1 project of Metro Line 8 in the city (hereinafter referred to as Line 8). The Phase 1 project of Line 8 spans a total length of 50.33 km, entirely underground, with 27 stations, including 3 semi-underground stations and 24 fully underground stations. It includes a newly constructed 401.22 m connecting line to Line 6. The Phase 1 project of Line 8 involves substantial investment, complex engineering conditions, and diverse construction techniques and methods, with many tunnel sections constructed using the shield method. Construction on Metro Line 8 commenced in May 2020. As of the end of 2023, Phase 1 of Line 8 remains unfinished. The line is projected to open for service by the end of 2024. During the research phase of this study, the main construction activities for Line 8 were still underway, with the main structures of some stations and shield-tunnel sections fully completed.

5.2. Predicting Governance Levels Based on the SEM-SD Model

The SEM model is an analysis method based on covariance structures, essentially a static model. For dynamic, evolving systems like engineering project management, its analytical results prove overly simplistic. To overcome the limitations of static models, this study introduces System Dynamics (SD) modeling. The core strengths of SD models lie in their feedback loops, time delays, and nonlinearity, enabling them to perfectly simulate evolutionary processes under governance measures.
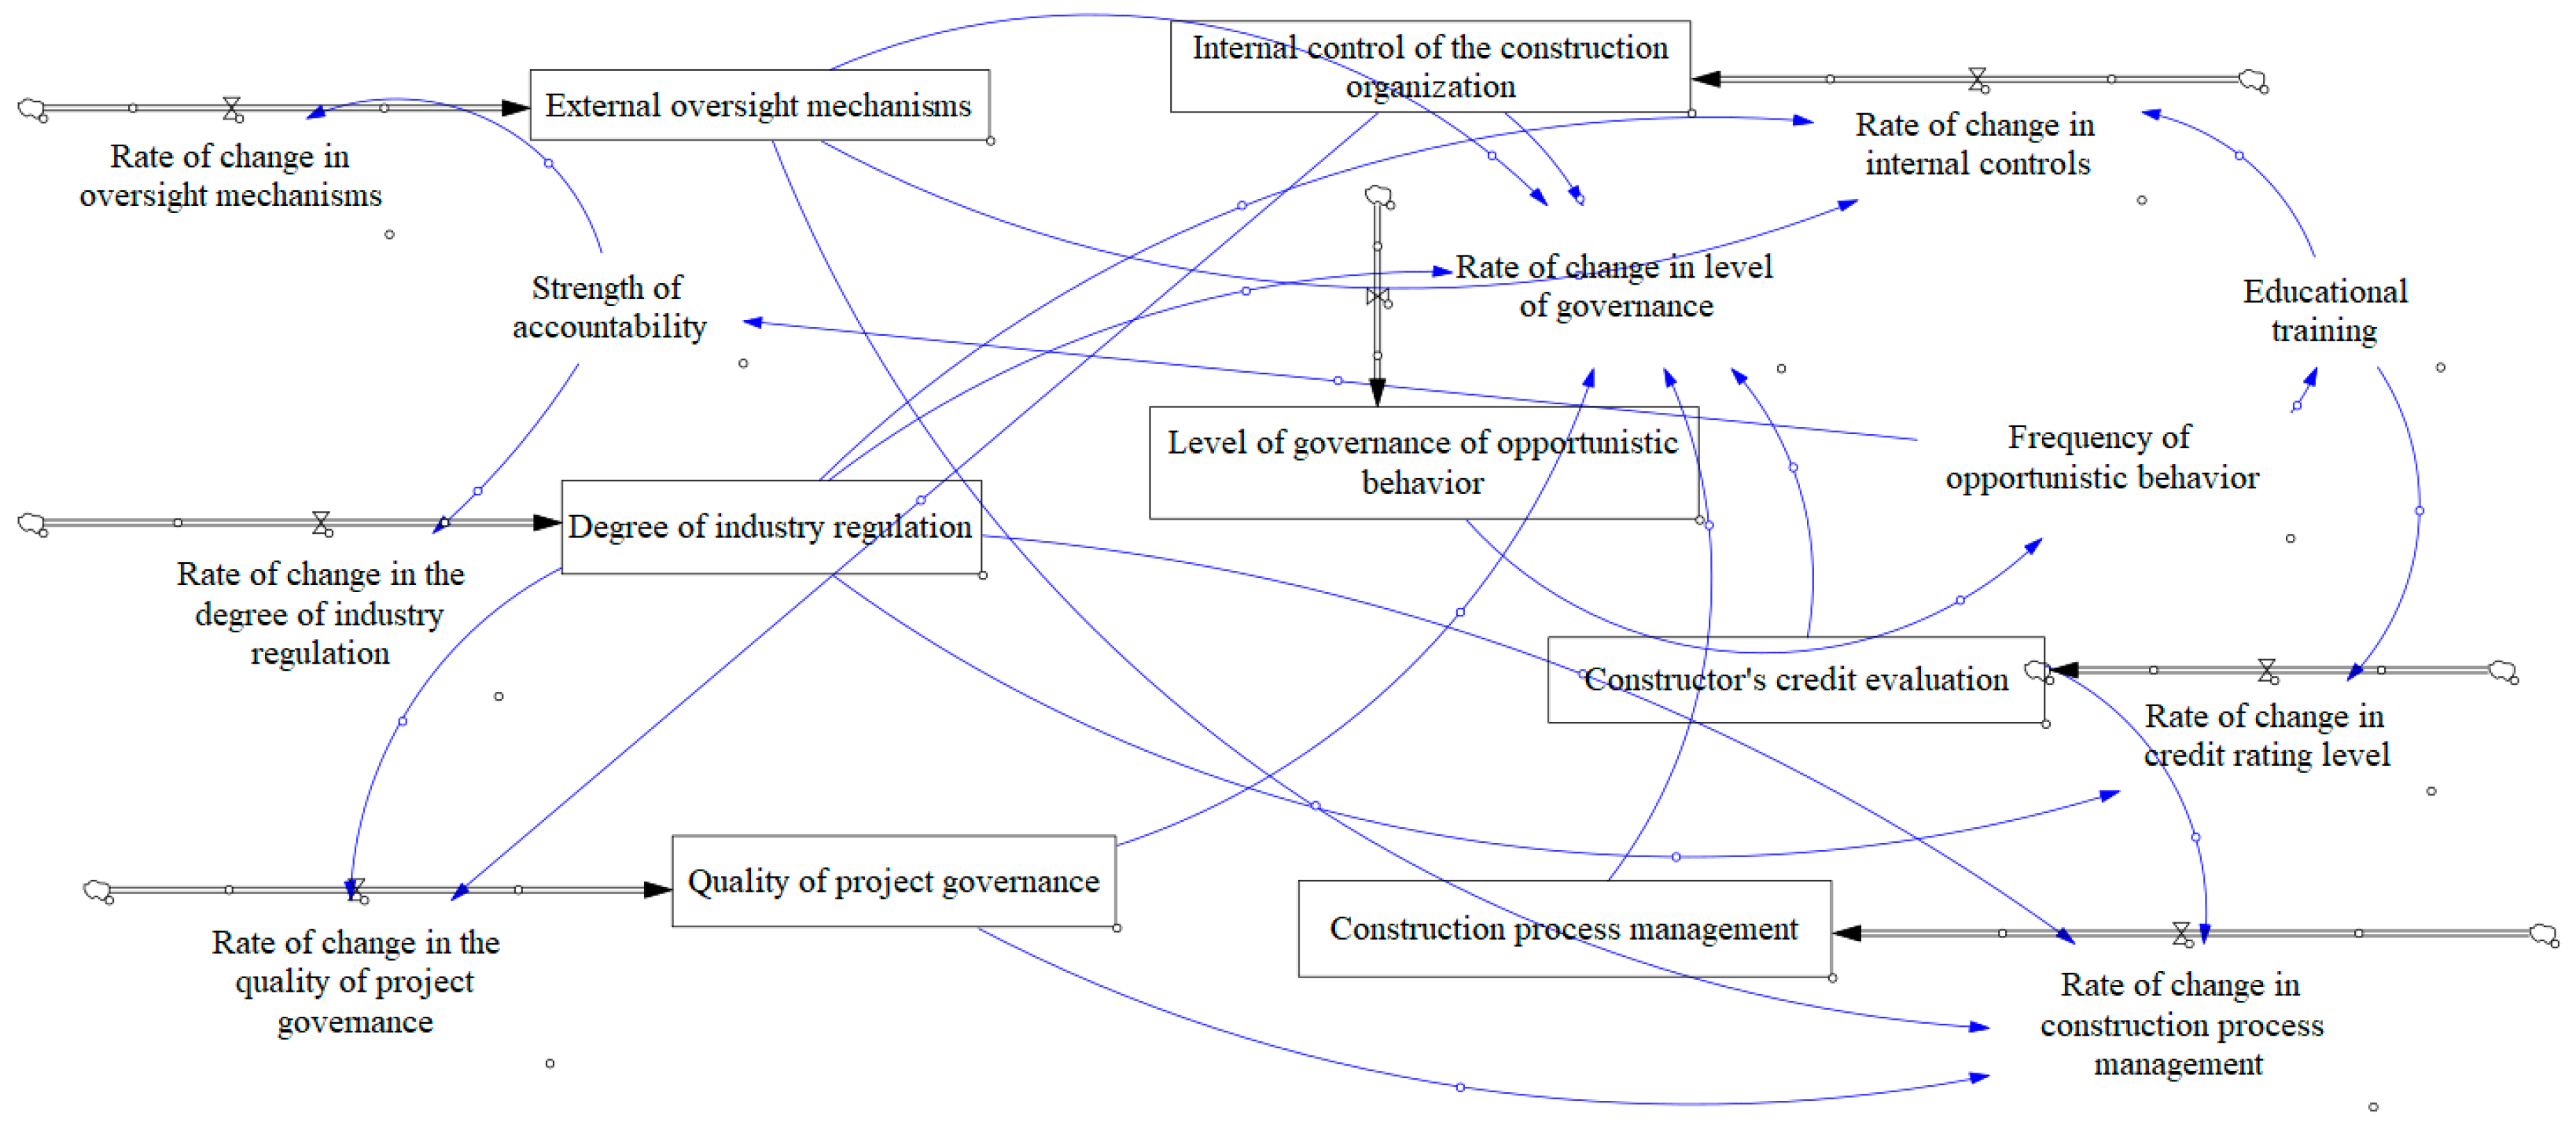
A dynamic simulation analysis of the opportunistic behavior governance system for subway project contractors was conducted using the SD model, revealing the dynamic evolution of governance levels under various influencing factors. The survey targeted a construction site on a section of Line 8 under construction, where the contractor was a large state-owned enterprise. A total of 480 questionnaires were distributed through a combination of online and offline methods. The actual number of questionnaires recovered was 430. After excluding questionnaires with incomplete responses, short response times, or concentrated or entirely identical scores, 351 valid questionnaires remained, yielding a recovery rate of 73.13%. Based on the data validity and reliability verification of the preceding SEM model, along with confirmatory factor analysis meeting requirements, an SEM-SD model was constructed integrating system dynamics research. Initial values for the SD model parameters were first determined and summarized in Table 14. Next, a system causal loop diagram was constructed. The system variables governing the causal relationships of opportunistic behavior in subway project construction include the following core components: six governance mechanisms: industry standardization level, external oversight mechanisms, project governance quality, construction process management, contractor credit evaluation, internal organizational controls, and two auxiliary feedback variables: training intensity and accountability rigor. The positive and negative causal relationships and feedback loops between any two system variables are illustrated in Figure 6.
The equations for the SD model addressing opportunistic behavior by subway project contractors are presented in Table 15. The parameter values for these equations are derived from path simulation data generated using Amos 23 software during the identification of critical governance pathways. Beyond the baseline model, this study incorporates two auxiliary feedback variables: educational training and accountability intensity, which enhance the system model’s alignment with real-world operational conditions, thereby improving its accuracy and predictive capability.
Based on the actual project duration, the simulation model cycle for managing opportunistic behavior among subway project contractors is set at 44 months, with a uniform step size of 0.25 months (approximately one week).
Regarding the indirect effects on opportunistic behavior governance, the ranking is as follows: industry standardization (indirect effect value 1.140) > external oversight mechanisms (indirect effect value 0.501) > internal controls within construction organizations (indirect effect value 0.265) > contractor credit rating systems (indirect effect value 0.260) > project governance quality (indirect effect value 0.180). Since the factor of construction process management is influenced by all other factors without itself affecting any factor, it serves as the direct cause influencing the governance of opportunistic behavior among subway project contractors. It directly impacts the governance of opportunistic behavior. Therefore, governance pathways are simulated based on the indirect influence paths of the influencing factors. Empirical analysis of indirect influence effects reveals five governance pathways: F1 → G, F2 → G, F6 → G, F5 → G, and F3 → G.
Based on the empirical analysis results of the structural equation model described earlier, five governance pathways can be derived. Scenario simulations are set up for these five pathways to analyze their governance outcomes.
  • Case1: F1; F6; F3; F4; Interaction Governance.
  • Case2: F2; F6; F3; F4 Interaction Governance.
  • Case3: F6; F3; F4 Interaction Governance.
  • Case4: F5; F4 Interaction Governance.
  • Case5: F3; F4 Interaction Governance.
Based on the above settings, the SD model was input with data, and Vensim PLE was used for simulation analysis to predict the overall governance level effect and the path governance effect. First, the level and frequency of opportunistic behavior governance in the current stage of the metro project were simulated, as shown in Figure 7.
Analysis of the charts indicates that the current level of opportunistic behavior management is increasing, while the frequency of opportunistic behavior is decreasing. The project is currently in its 33rd month. Figure 7a shows that the current level of opportunistic behavior management for a certain section of Phase I of Line 8 is 60.19. Figure 7b shows that the current frequency of opportunistic behavior for a certain section of Phase I of Line 8 is 55.12. Simulation results indicate that at the current stage, the occurrence frequency of opportunistic behavior among the project’s construction parties remains relatively high, necessitating an improvement in the management level of such behavior.
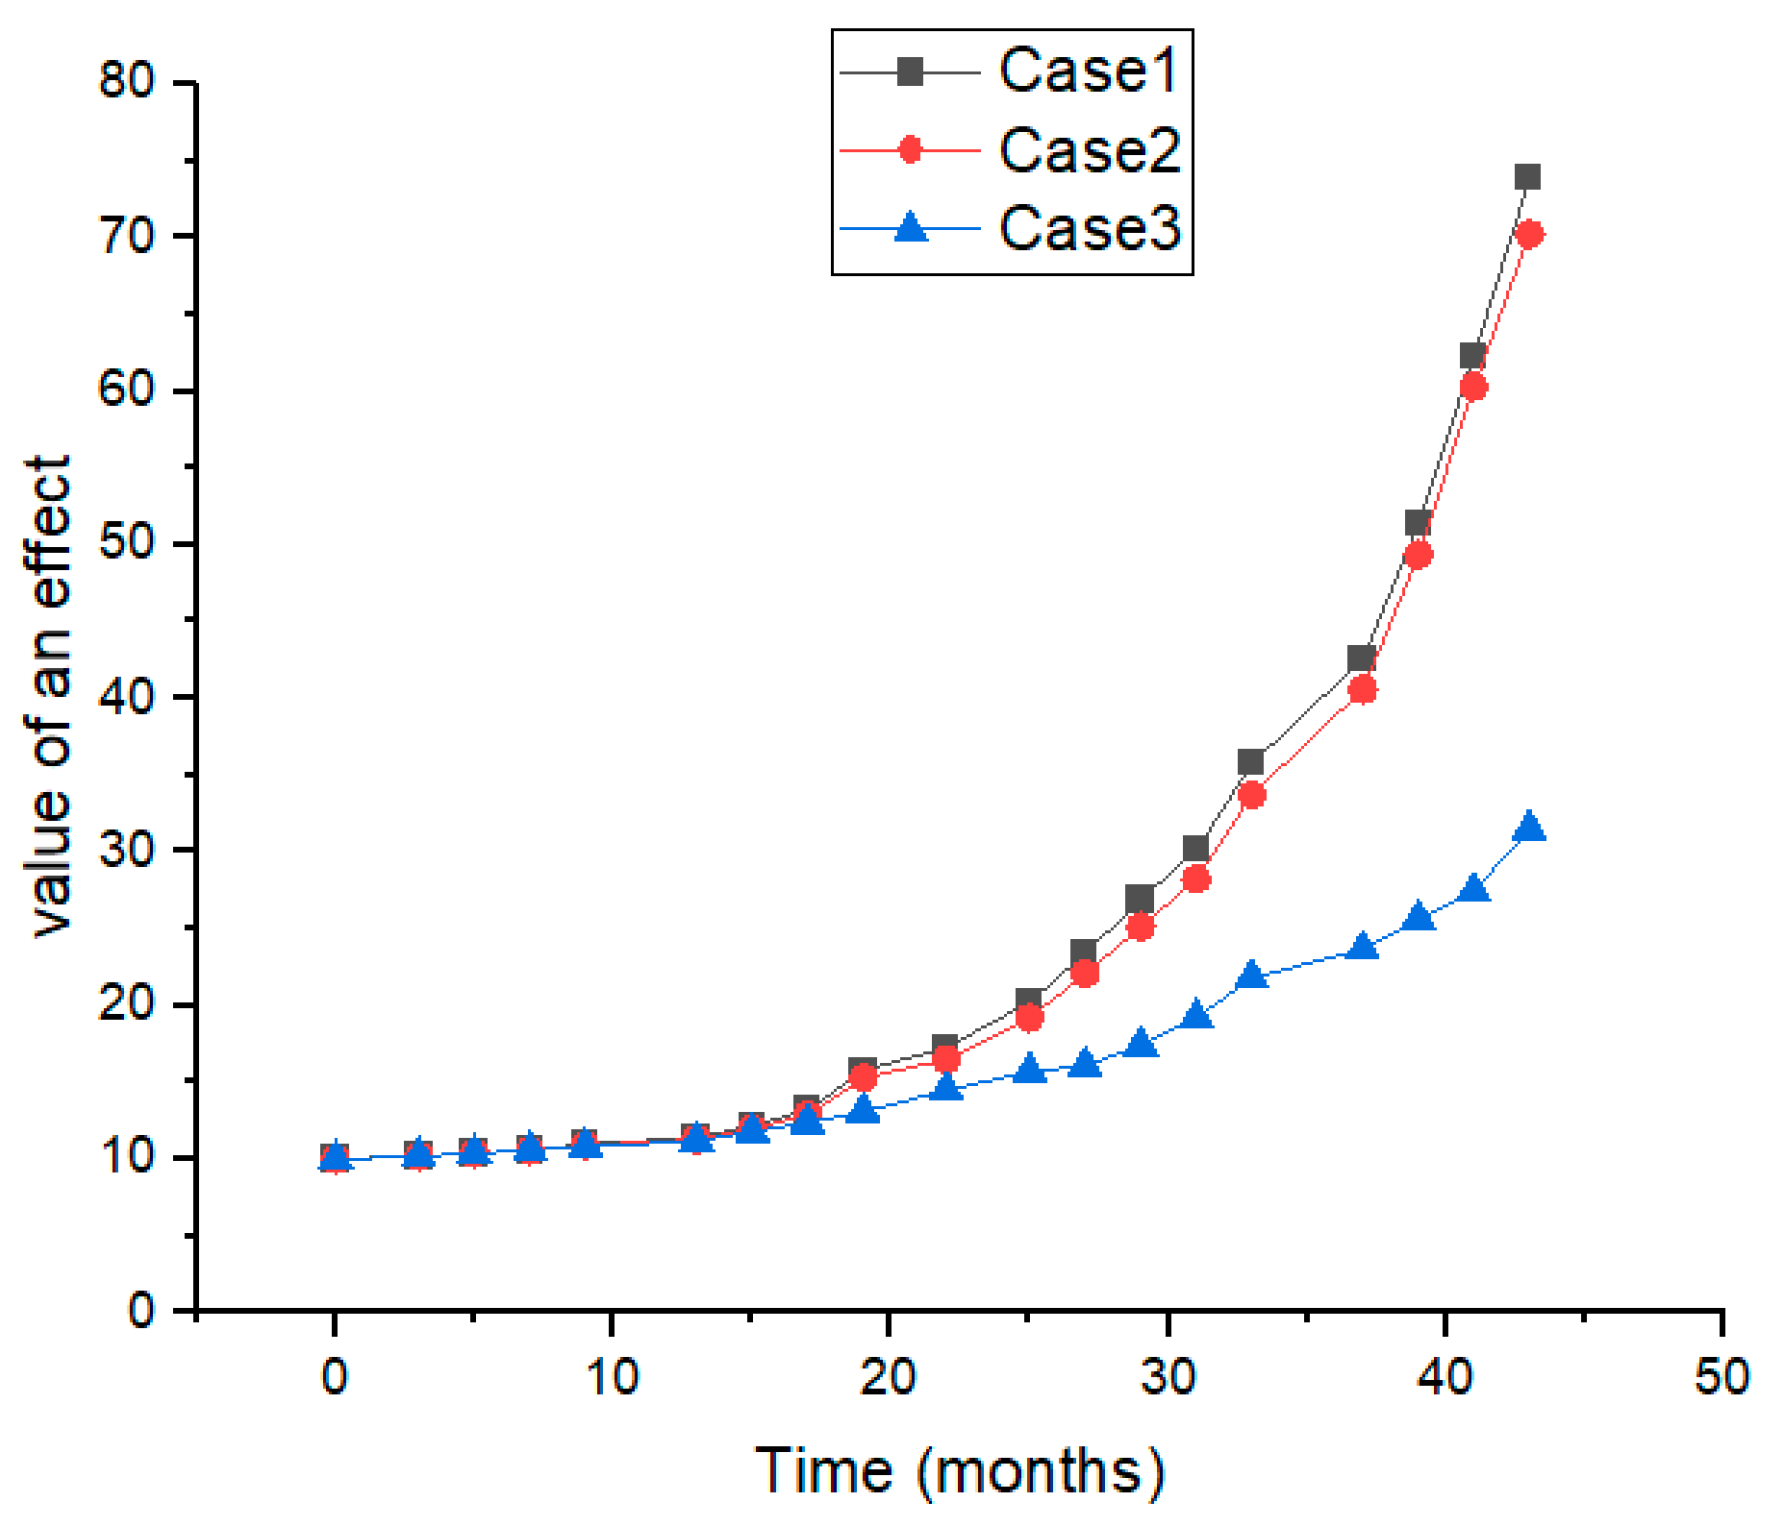
According to the simulation results, it can be seen that cases 1, 2 and 3 have better governance effects, so only these three scenarios are analyzed and compared. As shown in Figure 8, the governance effect of the project on the main governance path is observed.
As shown in the simulation study of Figure 8, at the 33-month mark of the project, the governance level values for case 1, case 2, and case 3 were 35.77, 33.72, and 21.82, respectively. This indicates that the governance level of the governance path for this project at the current stage requires improvement, showing a significant gap compared to the overall governance level (60.19) influenced by the combined effect of all factors. This indicates that disruptions or lack of coordination exist among the links along the key governance pathway—“F1/F2 → F6 → F3 → F4 → G”—impeding the pathway’s overall fluidity. Alternatively, certain links may play insignificant or absent roles within the pathway. These obstacles hinder the effective implementation of governance measures for this project, preventing the efficient containment and management of opportunistic behavior. Efforts should focus on the critical governance pathway to identify existing issues. This will enable the development of a targeted set of practical strategies and the implementation of comprehensive, multi-level governance measures to reduce the incidence of opportunistic behavior by contractors. Such actions are essential to ensure the project’s engineering quality and safe production.

5.3. Critical Path Governance

Based on the SD model prediction results and field inspections of a specific section of Line 8, this study comprehensively analyzes the root causes of opportunistic behavior on the project. Drawing upon the preceding research on key governance pathways for opportunistic behavior and integrating simulation outcomes of the metro project’s governance pathways, it identifies existing issues within the project’s critical governance pathways at the current stage.
(1)
External oversight mechanisms have failed to effectively constrain internal controls within the construction organization.
In this case, the construction contractor engaged in opportunistic practices such as using substandard building materials to cut corners. This indicates that the primary issue with the governance pathway lies in the failure of oversight mechanisms to effectively permeate the core operations of the construction organization. This has resulted in a significant disconnect between supervision and execution, highlighting the poor effectiveness of the governance pathway segment “external oversight mechanisms → internal controls within the construction organization.” It demonstrates that public and media oversight channels have not fulfilled their intended roles. The intensity of public opinion oversight remains insufficient, resulting in weak risk prevention awareness within construction organizations regarding opportunistic practices like cutting corners.
(2)
Internal control over the construction organization failed to effectively enhance project governance quality.
The case reveals opportunistic behaviors among contractors, including risky operations, complacency, and reckless rushing to meet deadlines. This indicates that the primary issues in the governance pathway stem from weak risk prevention awareness within the construction organization and the lack of effective, robust risk prevention and control measures within the established risk management department. Consequently, the governance level in the “internal control within the construction organization → project governance quality” segment of the corresponding governance pathway requires improvement. Inadequate early-stage risk prevention led to deficiencies in the contractor’s performance evaluation system, pressure to meet project design schedule and cost targets, and obstructed communication of construction review information. These factors collectively exerted a detrimental impact on enhancing project governance quality.
(3)
The quality of project governance has failed to bring about a substantial improvement in the level of construction process management.
In this case, the contractor exhibited opportunistic behaviors such as deviating from design specifications and inadequate technical briefing. This indicates that the primary issue in the governance approach lies in the contractor’s insufficient emphasis on enhancing information transparency and sharing. Due to inherent differences among individuals, interpretations of information also vary. Information delays can lead to misunderstandings. When information is not communicated promptly or clearly, members of the construction team may misinterpret project requirements, plans, and objectives, directly impacting the quality of on-site management. Furthermore, the contractor’s assessment system is inadequate, failing to properly evaluate personnel technical skills. This indicates that the governance level for the “Project Governance Quality → Construction Process Management” segment within the corresponding governance pathway needs improvement. It demonstrates that the contractor’s information exchange mechanisms and personnel assessment systems are not functioning as intended.
(4)
The effectiveness of construction process management in addressing opportunistic behavior has not been optimized.
In this case, the contractor exhibited opportunistic behaviors such as lax quality control, unsafe practices, and improper work procedures. This indicates that the primary issues in the governance pathway lie in the contractor’s inadequate implementation of technical management and low frequency of on-site inspections. These factors directly undermine the effectiveness of addressing opportunistic behaviors, thereby creating opportunities for their occurrence. On-site management is paramount in construction process oversight, as it directly impacts both construction quality and safety. The governance level within the “Construction Process Management → Opportunistic Behavior Governance” segment requires improvement. This indicates that issues and hidden dangers at the construction site were not promptly identified during the construction process management phase, ultimately leading to the emergence of opportunistic behaviors.

5.4. Governance Strategy

Based on the causes of opportunistic behavior identified in this project’s research and an analysis of issues along key governance pathways, this section proposes targeted governance strategies to enhance the management of opportunistic behavior among contractors in this subway project.
(1)
Enhance public oversight.
The root cause of the poor governance effectiveness in the “external oversight mechanism → internal control within the construction organization” pathway lies in the failure of public and media oversight channels to fulfill their intended roles.
By leveraging media exposure, social media platforms, and the participation of governmental and non-governmental organizations, establishing effective public engagement and feedback mechanisms can enhance the pressure exerted by public opinion oversight on opportunistic behaviors by subway project contractors. This approach positively influences the governance of such opportunistic actions. This pressure typically stems from public scrutiny and media exposure of contractors’ actions. When the public expresses dissatisfaction and concern over misconduct by subway project contractors, this public pressure compels contractors to act more cautiously, avoiding opportunistic behavior to prevent damage to the project’s reputation and execution.
(2)
Enhance the risk management and prevention system.
The root cause of the poor governance effectiveness in the “internal control within the construction organization → project governance quality” pathway lies in the construction organization’s weak awareness of potential risks and the lack of effective, robust risk prevention and control measures within the established risk management department.
Regarding internal control within the construction organization, effective measures must be taken to prevent opportunistic behavior, particularly in situations where construction site management is chaotic and work areas are confined. These measures should focus on enhancing the risk prevention and control system from the perspective of internal risk management and governance. Construction entities should establish dedicated safety management departments or positions to provide systematic safety education and training for all employees. This training should cover construction site safety regulations, operational procedures, and emergency response protocols. The risk management department should also regularly organize safety drills to make employees aware of the consequences of opportunistic behavior and enhance their risk prevention awareness.
(3)
Strengthen communication mechanisms and improve the assessment system.
The root cause of the poor governance effectiveness in the “project governance quality → construction process management” pathway lies in the contractor’s insufficient emphasis on enhancing information transparency and sharing, coupled with inadequate personnel technical assessments.
A smooth and effective communication mechanism within the construction team is a key factor influencing project governance quality. Construction documentation management involves the organization, storage, retrieval, and updating of various project files and information. Sound documentation management positively impacts information exchange among construction personnel, ensuring they receive accurate and complete information. This enables workers to clearly understand work requirements and specifications during communication, avoiding misunderstandings or confusion in information transmission. It contributes to enhancing project transparency, compliance, and quality. Additionally, documentation management helps reduce information asymmetry, preventing certain team members from exploiting personal or team interests under conditions of insufficient or inaccurate information. This approach diminishes the occurrence of opportunistic behavior and the potential for abuse of opportunities.
(4)
Increase the frequency of on-site inspection rounds.
The root cause of the poor effectiveness of the governance pathway “Construction Process Management → Governance of Opportunistic Behavior” lies in the contractor’s insufficient implementation of technical management and low frequency of on-site inspections, which directly impacts the effectiveness of addressing opportunistic behavior.
To enhance the technical and managerial capabilities of construction teams and strictly control project quality, the frequency of on-site inspections should be increased. This enables the timely identification of issues and potential hazards at the construction site, allowing for the discovery and resolution of problems before they escalate. It also encourages construction personnel and managers to strictly adhere to construction specifications and operational procedures, facilitating the prompt detection and correction of non-compliant construction practices. The increased inspection frequency should be aligned with project progress and risk levels, rather than being implemented solely for the sake of increasing the number of inspections. Develop an inspection plan specifying the timing, locations, scope, and responsible personnel for each inspection. The plan should be reasonably structured to ensure comprehensive coverage of all project aspects while avoiding frequent, redundant inspections.

6. Results and Discussion

6.1. Theoretical Contributions

This study integrates opportunistic behavior theory from economics to define non-compliant actions by subway construction contractors as opportunistic behavior within the construction sector. Existing research attributes the causes of fraudulent behavior to pressure, opportunity, and self-justification [25]. This study further evolves the causes of opportunistic behavior by subway contractors into behavioral pressure, behavioral opportunity, and behavioral justification. It conducts a comprehensive analysis of the causes of opportunistic behavior from multiple perspectives, including subject factors, institutional factors, regulatory factors, and environmental factors [26]. This more granular hierarchical distribution enables a more comprehensive categorization of influencing factors, enhancing the precision of the literature review methodology [9]. This study categorizes the factors influencing opportunistic governance by subway construction contractors into six dimensions: industry standardization, external oversight mechanisms, project governance quality, construction process management, contractor credit evaluation systems, and internal organizational controls. These dimensions encompass ten specific influencing factors, providing a comprehensive multi-level framework for addressing non-compliant behaviors among subway construction contractors.

6.2. Comparison of Research Findings with Existing Studies

First, building upon Luo’s [19] model of influencing factors, structural equation modeling (SEM) was employed to further investigate the effects of these factors and identify the pathways yielding the most effective governance outcomes. Second, we deepen Abdullah’s [21] research on questionnaire structural stability by employing a combined approach of confirmatory and exploratory factor analysis to validate the questionnaire design. Zheng [23] integrated SEM and SD models for dynamic analysis. This study incorporates education/training and accountability intensity into the SD model, making its logic more practical and providing clear guidance for real-world engineering cases. Finally, under interactive governance simulation scenarios, this study identified deficiencies in optimal governance pathways. By integrating opportunistic behaviors observed in actual engineering cases, corrective measures were proposed for flawed links. This established a proactive control system for opportunistic behaviors among subway construction contractors, structured as: analysis of opportunistic behavior causes → classification of governance influencing factors → identification of governance pathways → formulation of governance measures.

7. Conclusions

Based on case studies and literature review, this research identifies factors influencing the governance of opportunistic behavior within the framework of the Fraud Triangle theory. These factors are categorized into three types: industry and market regulation, project governance quality, and construction process management. By analyzing the interrelationships among these factors, the study selects 10 influencing factors across six dimensions and establishes a theoretical model for governing opportunistic behavior by subway project contractors. Empirical analysis identifies the optimal governance pathway as: Industry Regulation Internal Construction Organization Control Project Governance Quality Construction Process Management Opportunistic Behavior. This pathway minimizes the frequency of opportunistic behavior and achieves the highest governance effectiveness, confirming that “Construction Process Management” serves as the most potent direct governance lever. System dynamics simulations show that the “Scenario One” governance strategy based on this pathway attains optimal resource allocation. The study proposes a full-cycle governance strategy incorporating public oversight, risk prevention systems, and on-site inspections, offering both theoretical foundations and practical solutions for curbing opportunistic behavior. It establishes a proactive pre-control system to address governance gaps related to non-compliant practices in subway construction. The research provides project owners and regulatory authorities with a clear governance framework, enabling direct identification of opportunistic behaviors during construction and facilitating effective countermeasures. This approach helps reduce frequent safety hazards in subway construction, enhances social stability, and provides safety assurance for subway projects in China.
Despite these findings, the study has several limitations. First, the categorization of governance factors into industry oversight, project governance quality, and construction management does not account for the impact of PPP or EPC project models. Future research could incorporate the contractor’s corporate culture and external policy environment to improve the comprehensiveness of the governance framework. Second, the dynamic governance simulation examined only the unidirectional impact of governance pathways on contractors’ opportunistic behavior, without considering how behavioral adaptations of contractors may influence governance outcomes. Subsequent studies could introduce auxiliary variables such as risk perception and resource allocation capacity to develop more complex dynamic game models. Finally, as the survey data mainly come from Chinese subway projects, the conclusions may not be directly applicable to international subway projects or other construction sectors. Future work should broaden the scope to include the global construction industry to enhance the universality of the findings.

Author Contributions

Conceptualization, Y.W. (Yanfang Wen); methodology, C.Z.; software, C.Z.; validation, C.Z.; formal analysis, P.C.; investigation, P.C.; resources, Y.W. (Yanfang Wen); data curation, C.Z.; writing—original draft preparation, Y.W. (Yanfang Wen); writing—review and editing, C.Z.; visualization, Y.W. (Yunhe Wang); supervision, Y.W. (Yunhe Wang); project administration, P.C.; funding acquisition, P.C. All authors have read and agreed to the published version of the manuscript.

Funding

This research was funded by Shaanxi Provincial Key R&D Project for Tackling Core Technologies, grant number (2024SF2-GJHX-10).

Institutional Review Board Statement

This study employed an empirical analysis method using questionnaires, inviting only relevant personnel to complete the surveys without involving human subjects. The research was approved by the Ethics Committee of the School of Architecture and Civil Engineering at Xi’an University of Science and Technology.

Informed Consent Statement

All participants in the study gave informed consent. Their information was secured with permission, and they were informed of the study’s outcome, including the publication of the findings.

Data Availability Statement

The data presented in this study are available upon request from the corresponding author. The data are not publicly available due to privacy.

Conflicts of Interest

The authors declare no conflicts of interest.

References

  1. Xu, W.; Lin, L.; Zhu, N.; Zhao, Y.; Yang, H.; Mei, Y.; Zhou, D. Three-Dimensional Numerical Analyses of a Monitored Deep Excavation Pit: A Case Study in the Guangzhou Metro. Buildings 2025, 15, 4018. [Google Scholar] [CrossRef]
  2. Huo, X.; Du, S.; Jiao, L. Critical Causal Path Analysis of Subway Construction Safety Accidents Based on Text Mining. ASCE-ASME J. Risk Uncertain. Eng. Syst. Part A Civ. Eng. 2025, 11, 04024075. [Google Scholar] [CrossRef]
  3. Williamson, O.E. Transaction cost economics. J. Econ. Behav. Organ. 1987, 8, 617–625. [Google Scholar] [CrossRef]
  4. Wen, Y.; Huang, D.; Cao, Z. Study on the Identification of Opportunistic Behavior of Subway Project Construction Enterprises. Buildings 2024, 14, 2297. [Google Scholar] [CrossRef]
  5. Yung, K.; Askarzadeh, A. International evidence on the relationship between fraud tolerance and stock price crash risk. Int. Rev. Financ. Anal. 2025, 97, 103853. [Google Scholar] [CrossRef]
  6. Ibrahim, C.K.I.C.; Manu, P.; Belayutham, S.; Cheung, C.; Mohammad, M.Z.; Yunusa-Kaltungo, A.; Ismail, S.; Samsudin, N.S.; Prabhakaran, A.; Perez, P.; et al. Tripartite collaboration for design for safety in construction: A co-creation framework integrating academia, industry, and government. Saf. Sci. 2026, 194, 107040. [Google Scholar] [CrossRef]
  7. Han, W.; Yin, Y. Influence of Project Governance on Opportunistic Behavior: Taking a Dynamic Perspective. Buildings 2022, 12, 1659. [Google Scholar] [CrossRef]
  8. Liu, D.; Xu, W.; Li, H.; Zhang, W.; Wang, W. Moral hazard and adverse selection in Chinese construction tender market: A case of Wenchuan earthquake. Disaster Prev. Manag. Int. J. 2011, 20, 363–377. [Google Scholar] [CrossRef]
  9. Dai, D.; Gui, J.; Xue, L.; Zhang, H. A case study on the identification of opportunistic behaviors in a substitute construction unit. Manag. Case Stud. Rev. 2019, 12, 548–559. [Google Scholar]
  10. Li, Y.; Ning, Y. Mitigating Opportunistic Behaviors in Consulting Projects: Evidence from the Outsourced Architectural and Engineering Design. J. Constr. Eng. Manag. 2022, 148, 04022044. [Google Scholar] [CrossRef]
  11. Yan, L.; Pan, Y.; Chen, Y. Understanding the Double-Edged Sword Effect of Contract Flexibility on Contractor’s Opportunistic Behavior in Construction Project: Moderating Role of BIM Application Degree. J. Constr. Eng. Manag. 2024, 150, 04024124. [Google Scholar] [CrossRef]
  12. Shang, T.; Ye, K.; Wu, L.; Shang, J. Opportunism or symbiosis? A case study on contractors’ unsustainable highway construction in China. Resour. Conserv. Recycl. Adv. 2022, 14, 200082. [Google Scholar] [CrossRef]
  13. Bu, Z.; Liu, J.; Liu, J. The double-edged effect of social media in the collaborative governance of PPP projects from a value perception perspective. Sustain. Cities Soc. 2025, 128, 106468. [Google Scholar] [CrossRef]
  14. Yang, R.J.; Zou, P.X.W. Stakeholder-associated risks and their interactions in complex green building projects: A social network model. Build. Environ. 2014, 73, 208–222. [Google Scholar] [CrossRef]
  15. Eisenberg, M.A. The Structure of Corporation Law. Columbia Law Rev. 1989, 89, 1461. [Google Scholar] [CrossRef]
  16. Bagasi, O.; Nawari, N.O.; Alsaffar, A. BIM and AI in Early Design Stage: Advancing Architect–Client Communication. Buildings 2025, 15, 1977. [Google Scholar] [CrossRef]
  17. Alemayehu, K.T. Assessing Current Practices of Client Requirement Change Management in Building Construction Projects in Ethiopia. Adv. Civ. Eng. 2025, 2025, 6248206. [Google Scholar] [CrossRef]
  18. Yu, H.; Peng, Z.; Wu, Z.; He, Z.; Huang, C. Coupled analysis and simulation of safety risk in subway tunnel construction by shallow-buried excavation method based on system dynamics. J. Intell. Fuzzy Syst. Appl. Eng. Technol. 2025, 49, 495–511. [Google Scholar] [CrossRef]
  19. Luo, Z.; Guo, J.; Han, J.; Wang, Y. Research on the construction safety risk assessment of prefabricated subway stations in China. Eng. Constr. Archit. Manag. 2024, 31, 1751–1787. [Google Scholar] [CrossRef]
  20. Liu, R.; Neisch, P.M. Micro-level walkability and station-level transit use: Integrating perceptual and spatial measures in Guiyang, China. Sustain. Cities Soc. 2025, 131, 106775. [Google Scholar] [CrossRef]
  21. Alsehaimi, A.; Baarimah, A.O.; Ramu, M.B.; Alajmi, M.; Ahmed, W. Integration of BIM in project management phases for achieving sustainable success in small construction projects: A SEM-based approach. Ain Shams Eng. J. 2025, 16, 103649. [Google Scholar] [CrossRef]
  22. Zhan, Z.; Wu, J.; Xia, P.; Hu, Y. Toward Low-Carbon and Cost-Efficient Prefabrication: Integrating Structural Equation Modeling and System Dynamics. Sustainability 2025, 17, 8307. [Google Scholar] [CrossRef]
  23. Gao, Y.; Gao, P.; Yu, N.; Sun, J.; Gao, Z.; Li, T.; Wang, J. Research on the Development Path of Green Buildings based on the Integrated Model of Structural Equation and System Dynamics. Sci. J. Econ. Manag. Res. 2025, 7, 144–151. [Google Scholar] [CrossRef]
  24. Shi, X.; Gu, Z.; Opoku, A.; Yuan, Z.; Qiao, Y. System dynamics modeling of life cycle energy-saving and CO2 emissions-reducing design scheme for prefabricated building envelope. Energy Build. 2025, 342, 115911. [Google Scholar] [CrossRef]
  25. Albrecht, W.S.; Albrecht, C.; Albrecht, C.C. Current Trends in Fraud and its Detection. Inf. Secur. J. A Glob. Perspect. 2008, 17, 2–12. [Google Scholar] [CrossRef]
  26. Dai, G. Research on Identifying and Addressing Opportunistic Behavior in Construction Project Transactions. Master’s Thesis, Nanjing Southeast University, Nanjing, China, 2022. (In Chinese). [Google Scholar]
  27. Innes, J.E. Information in Communicative Planning. J. Am. Plan. Assoc. 1998, 64, 52–63. [Google Scholar] [CrossRef]
  28. Zhou, Z.; Zhuo, W.; Cui, J.; Luan, H.; Chen, Y.; Lin, D. Developing a deep reinforcement learning model for safety risk prediction at subway construction sites. Reliab. Eng. Syst. Saf. 2025, 257, 110885. [Google Scholar] [CrossRef]
  29. Tam, N.T.; Hadikusumo, B.H. Modelling of trust and working relationship in construction project management: A case study of Vietnam. Int. J. Proj. Organ. Manag. 2016, 8, 366. [Google Scholar] [CrossRef]
  30. Pyle, W. Contractual Disputes and the Channels for Interfirm Communication. J. Law Econ. Organ. 2005, 21, 547–575. [Google Scholar] [CrossRef]
  31. Bekkers, V.; Edwards, A.; de Kool, D. Social media monitoring: Responsive governance in the shadow of surveillance? Gov. Inf. Q. 2013, 30, 335–342. [Google Scholar] [CrossRef]
  32. Sharafat, A.; Latif, K.; Seo, J. Risk analysis of TBM tunneling projects based on generic bow-tie risk analysis approach in difficult ground conditions. Tunn. Undergr. Space Technol. 2021, 111, 103860. [Google Scholar] [CrossRef]
  33. Zhu, Y.T. A Study on Bid Rigging Issues and Their Legal Regulation in the Bidding Process. Master’s Thesis, Lanzhou University, Lanzhou, China, 2016. (In Chinese). [Google Scholar]
  34. Fu, C. An Analysis of the Contract of the Owners and the Contractor in Engineering Project. Soft Sci. 2009, 23, 51–53. [Google Scholar]
  35. Jezzini, Y.; Assaad, R.H.; El-Adaway, I.H. Risk Allocation Model for Price Escalations in Construction Projects: Integrating Bargaining Game Theory and Probabilistic Bayesian Modeling. J. Constr. Eng. Manag. 2025, 151, 04025134. [Google Scholar] [CrossRef]
  36. Co, M.F.J.; Saeb, A.; Danuri, M.S.M.; Mohamed, O.; Zakaria, N. A Mechanism for Dispute Resolution in the Iranian Construction Industry. J. Constr. Dev. Ctries. 2021, 26, 205–226. [Google Scholar] [CrossRef]
  37. Jang, Y.; Son, J.; Yi, J.-S. Classifying the Level of Bid Price Volatility Based on Machine Learning with Parameters from Bid Documents as Risk Factors. Sustainability 2021, 13, 3886. [Google Scholar] [CrossRef]
  38. Luo, J. An evolutionary game analysis of the prefabricated building supply side under dynamic government reward and punishment mechanisms. J. Comput. Methods Sci. Eng. 2024, 24, 4004–4018. [Google Scholar] [CrossRef]
  39. Zhang, P. A Study on the Mechanism of the Impact of Project Manager’s Moral Risk on Project Success. Ph.D. Thesis, Dalian University of Technology, Dalian, China, 2016. (In Chinese). [Google Scholar]
  40. Han, Y.; Fang, X.; Zhao, X.; Wang, L. Exploring the impact of incentive policy on the development of prefabricated buildings: A scenario-based system dynamics model. Eng. Constr. Archit. Manag. 2024, 31, 4697–4725. [Google Scholar] [CrossRef]
  41. Cherkos, F.D.; Asfaw, F.A. Exploring the Interplay between Risk Management and Construction Risks: Implications for Project Performance through Structural Equation Modeling. J. Leg. Aff. Disput. Resolut. Eng. Constr. 2025, 17, 04525012. [Google Scholar] [CrossRef]
  42. Graafland, J.J. Collusion, reputation damage and interest in codes of conduct: The case of a Dutch construction company. Bus. Ethics A Eur. Rev. 2010, 13, 127–142. [Google Scholar] [CrossRef]
  43. Hwang, J.; Kim, J.; Yoon, S. DT-BEMS: Digital twin-enabled building energy management system for information fusion and energy efficiency. Energy 2025, 326, 136162. [Google Scholar] [CrossRef]
  44. Zou, P.X.; Lun, P.; Cipolla, D.; Mohamed, S. Cloud-based safety information and communication system in infrastructure construction. Saf. Sci. 2017, 98, 50–69. [Google Scholar] [CrossRef]
  45. Mavi, R.K.; Standing, C. Critical success factors of sustainable project management in construction: A fuzzy DEMATEL-ANP approach. J. Clean. Prod. 2018, 194, 751–765. [Google Scholar] [CrossRef]
  46. Luo, Y.; Chen, Y. How does contractual governance affect construction project performance? The mediating role of the contractor’s behavior. J. Asian Archit. Build. Eng. 2025, 24, 3879–3897. [Google Scholar] [CrossRef]
  47. Arvikar, S.; Aung, P.P.W.; Cha, G.; Park, S. Augmented Reality-based construction site management using optimized BIM and project schedule integration. Autom. Constr. 2025, 175, 106204. [Google Scholar] [CrossRef]
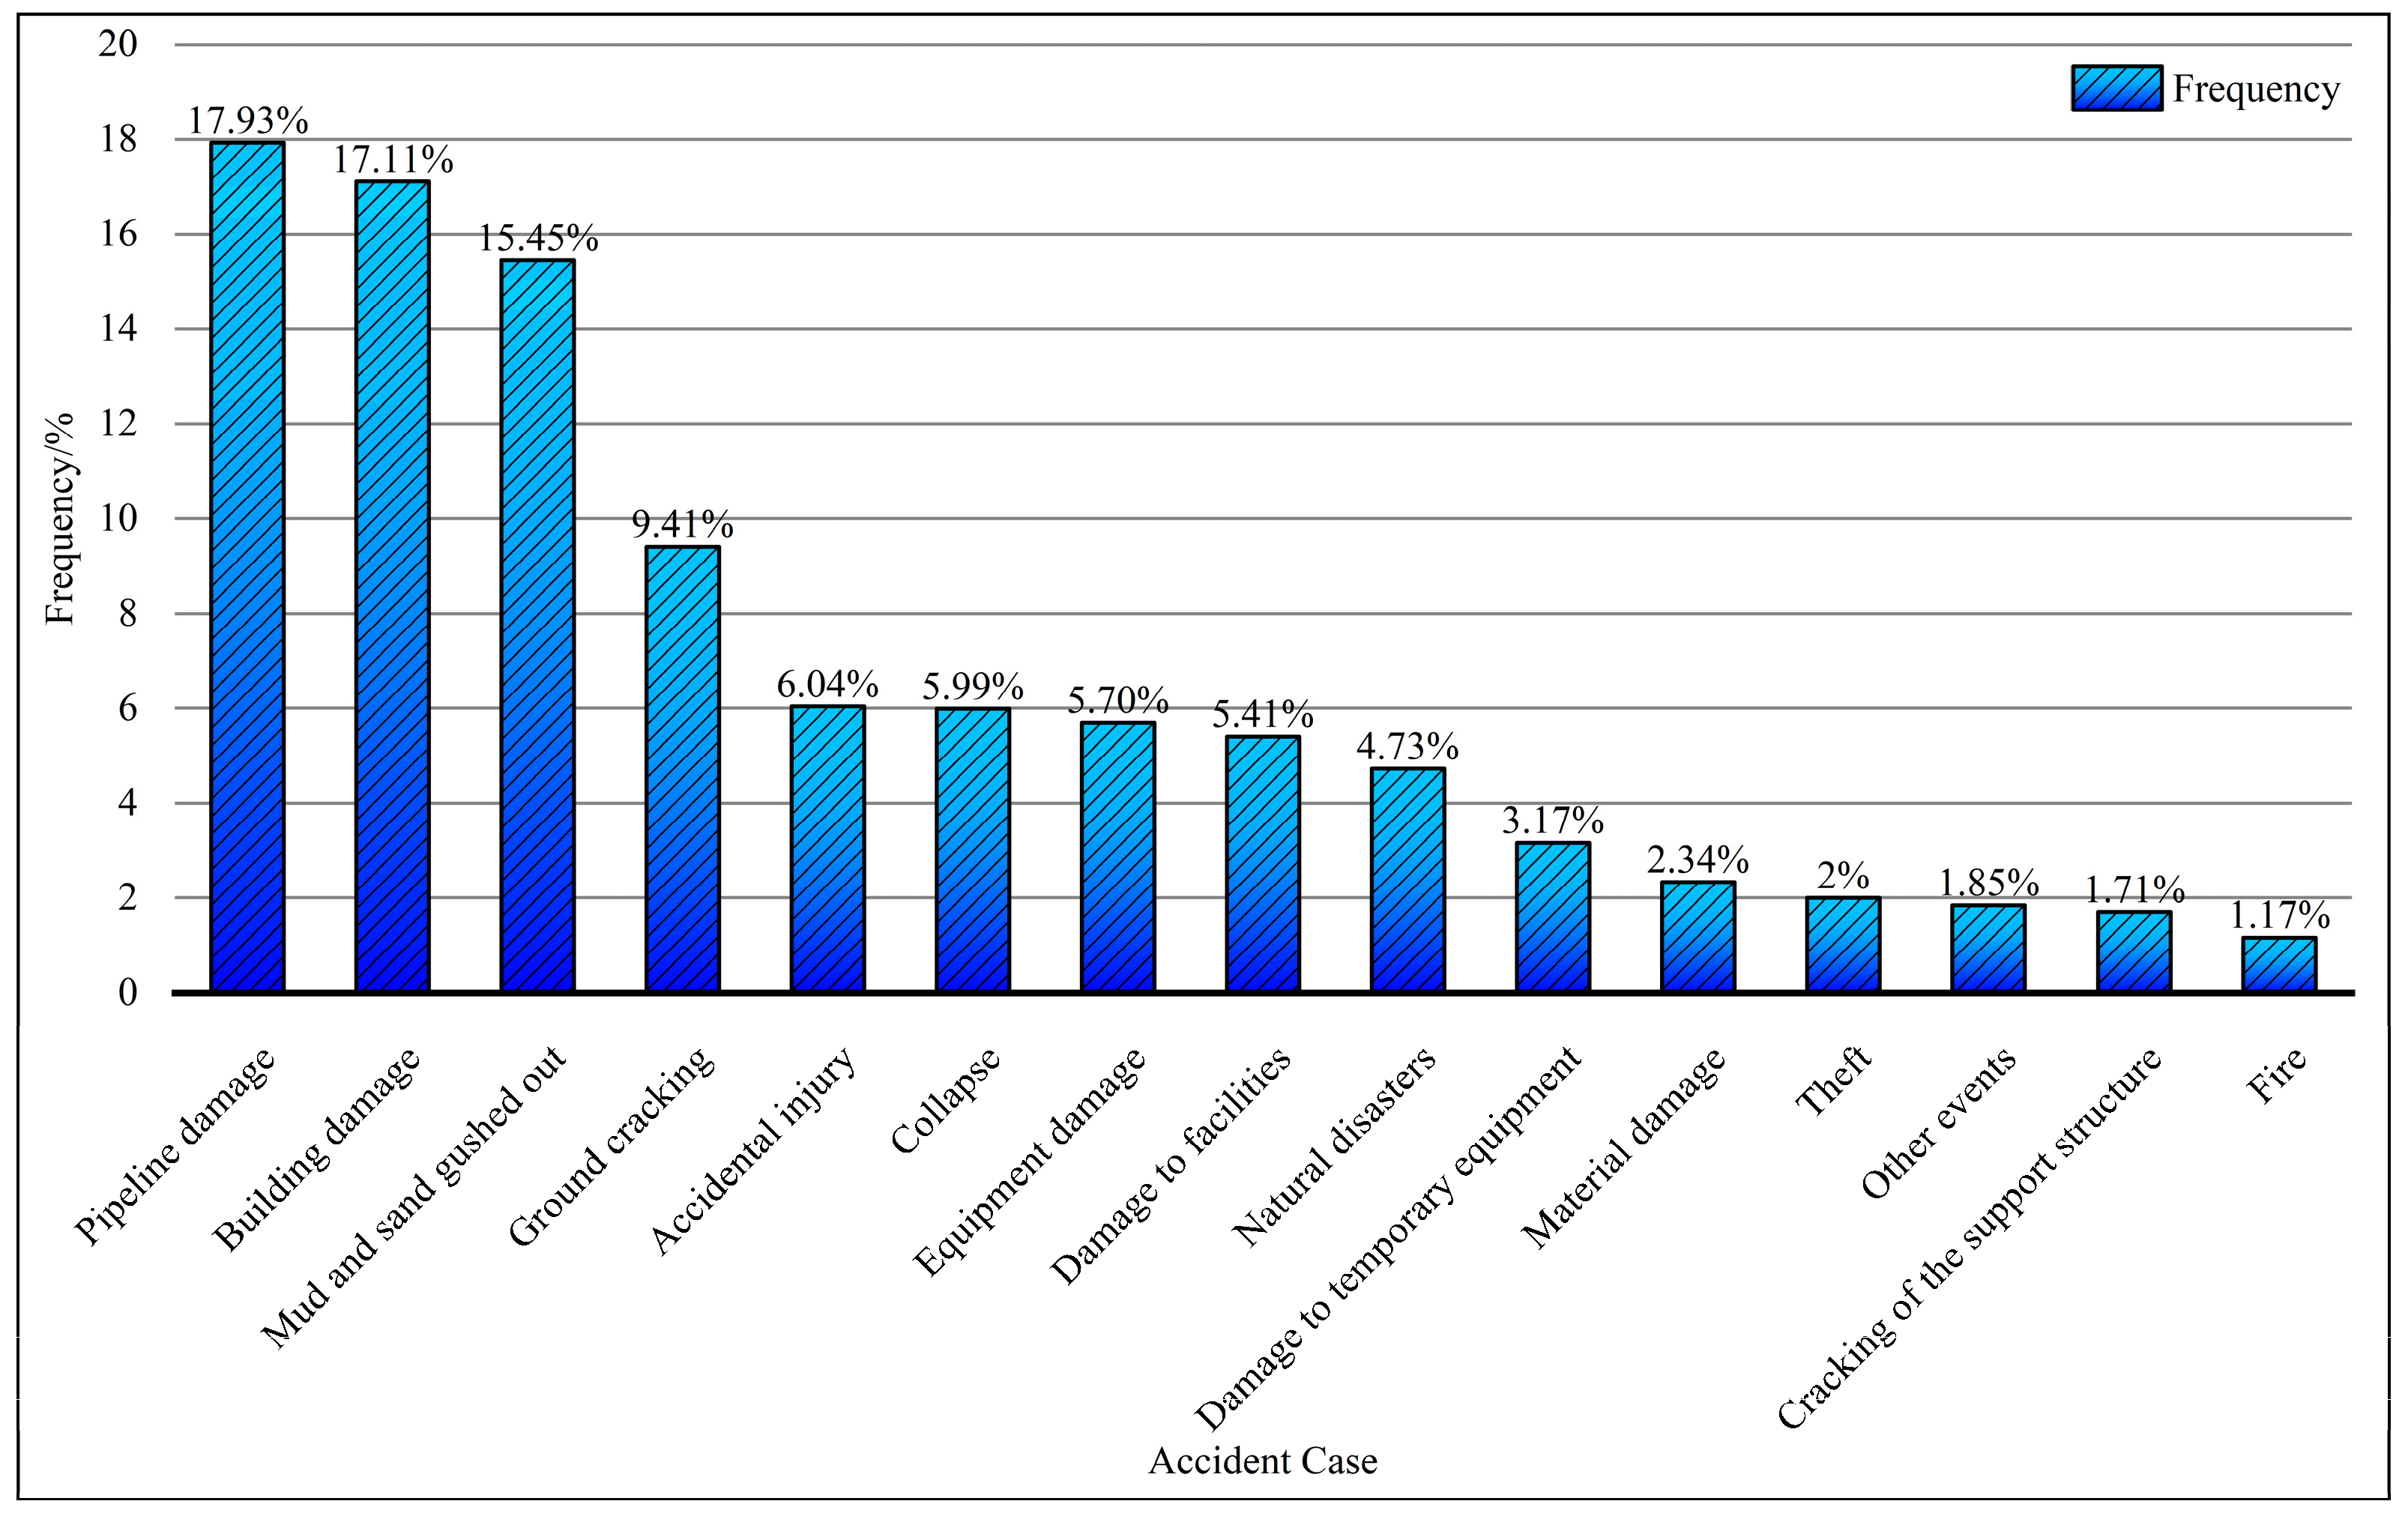
Figure 1. Accident Case Statistics.
Buildings 15 04249 g001
Figure 2. Methodology for identifying governance influences.
Buildings 15 04249 g002
Figure 3. Hypothetical model of the relationship between the role of factors influencing the governance of opportunistic behavior of the construction side of the metro project.
Buildings 15 04249 g003
Figure 4. Normalized results of the second-order validity factor model.
Buildings 15 04249 g004
Figure 5. Path diagram of the structural equation model of the governance structure of opportunistic behavior of the construction side of the metro project.
Buildings 15 04249 g005
Figure 6. Governance system stock flow chart.
Buildings 15 04249 g006
Figure 7. Curve of change in level of governance and frequency of occurrence for case simulation.
Buildings 15 04249 g007
Figure 8. Curve of change in governance level of the case simulation governance pathway.
Buildings 15 04249 g008
Table 1. Initial Identification of Factors Influencing Governance of Opportunistic Behavior Based on Literature Research.
CausesLiterature Support
Environmental (industry, social) factorsSoundness of the legal system [29]
Trade associations play a regulatory role [30]
Public and Media Monitoring [31]
Insufficient construction experience [32]
Institutional factorsProject reporting relief system [33]
Accountability mechanisms [34]
Risk-sharing mechanisms [35]
Dispute resolution mechanism [36]
Reasonable tender prices [37]
Regulatory factorsPunishment mechanism [38]
Reasonableness of appraisal frequency [39]
Construction site inspection [19]
Reasonable incentive system [40]
Risk Management [41]
Subject factorsProfessional ethics training system [39]
Mental behavior [42]
Integrated management [43]
Adoption of the Project Information Communication System (PICS) [44]
Table 2. Factors Influencing the Governance of Opportunistic Behavior on the Construction Side of Metro Projects.
Factors Factors
S1Industry system and laws, and regulationsS6Transparency in information sharing
S2Economic environment and competitive situationS7Culture of integrity: code of ethics
S3Public opinion survey and public opinion monitoringS8Incentive and assessment mechanisms
S4Project design and contract managementS9Risk management
S5Project quality controlS10Technical and managerial level
Table 3. Dimensional classification of factors influencing the governance of the opportunistic behavior of constructors in metro projects.
Preliminary ClassificationDimensionFactors
Industry, degree of market regulationF1 Degree of industry regulationS1
S2
Public opinion monitoringF2 External oversight mechanismsS3
Project governanceF3 Quality of project governanceS4
S6
S8
Construction project implementation managementF4 Construction process managementS5
S10
F5 Constructor credit evaluation systemS7
F6 Internal control of the construction organizationS9
Table 4. Sample descriptive statistics (N = 361).
VariantCategoriesNumberPercentage (%)
GenderMale33492.521
Female277.479
Age1–253910.803
26–3612033.241
37–4512233.795
>468022.161
Educational levelSecondary or high school10529.086
Three-year college13938.504
Undergraduate10027.701
Graduate students and above174.709
Years in current position1–47921.884
5–96618.283
10–1412534.626
>159125.208
PositionManagerial staff19654.294
Elementary worker16545.706
Table 5. Reliability statistics.
Cronbach’s αStandardized Cronbach’s αItemSample
0.9240.92427361
Table 6. KMO and Bartlett test.
KMO0.906
Bartlett’s test of sphericityapproximate chi-square5408.299
df496
p0.000 ***
Note: *** represent 1% level of significance.
Table 7. Total Variance Explained.
TitleRotational Forward Difference ResolutionRotation Variance Interpretation Rate
EigenrootVariance Explained (%)Cumulative Variance Explained (%)EigenrootVariance Explained (%)Cumulative Variance Explained (%)
19.07133.59633.596386.04314.29814.298
22.3258.61342.209330.36912.23626.534
31.8997.03249.241325.3312.04938.583
41.8286.7756.011282.11810.44949.032
51.5325.67461.684269.0149.96358.995
61.3695.07166.755209.5217.7666.755
70.6342.34969.105
80.6112.26371.368
90.5892.18373.551
100.5371.9975.541
110.531.96177.502
120.521.92579.427
130.5141.90381.33
140.4861.79983.129
150.4611.70784.836
160.4251.57586.411
170.4181.54987.96
180.3851.42589.385
190.3711.37390.758
200.3591.32892.086
210.3491.29493.381
220.3351.23994.62
230.3091.14495.764
240.3041.12796.891
250.3021.11898.009
260.2781.02999.038
270.260.962100
Table 8. Rotated Component Matrix.
VariableTitleVariable
Factor 1Factor 1Factor 1Factor 1Factor 1Factor 1
F1a10.1420.7590.0980.1170.1690.094
a20.1020.7450.1410.1210.2100.047
a30.1140.7600.1430.0860.1210.179
a40.0970.7730.1580.2110.0740.056
a50.1540.7340.1410.1180.1140.089
F2a60.1540.1370.1850.1930.1120.747
a70.1160.1020.1470.1840.1030.791
a80.1490.1460.1060.1050.1160.782
F3a90.7310.1330.1610.1750.0750.038
a100.7200.0500.1490.0750.2080.138
a110.7670.1310.0980.0800.1920.168
a120.7590.0430.1420.1370.2220.026
a130.7860.1530.1210.0990.0390.139
a140.7650.1500.1210.0720.0240.047
F4a150.1350.1900.7510.1180.0920.136
a160.1760.1150.7600.2040.1080.041
a170.1940.1870.7550.0550.2230.081
a180.1550.1170.7400.1070.1590.088
a190.1000.0990.7250.0830.1420.175
F5a200.1980.1720.1650.1560.7440.109
a210.170.1860.1840.0510.7510.073
a220.1240.1290.2230.1620.7360.085
a230.1520.1820.1130.1700.7500.121
F6a240.1540.1550.0770.7750.1230.129
a250.1710.1890.1130.7790.1120.102
a260.1040.0980.1470.7920.1880.158
a270.1190.1730.1850.7580.0960.137
Table 9. Results of validation factor analysis.
Latent VariableItemsUnstdStandardized Factor LoadingspAVECR
F1a110.756-0.5610.865
a20.9980.747***
a31.0630.757***
a41.0450.765***
a50.980.719***
F2a610.755-0.5470.783
a71.0190.758***
a80.9670.706***
F3a910.726-0.5650.886
a100.9640.727***
a111.1390.793***
a121.070.763***
a131.0670.773***
a140.990.718***
F4a1510.759-0.5580.863
a160.9910.754***
a171.0670.803***
a180.9790.725***
a190.9250.700***
F5a2010.783-0.5630.837
a210.8950.736***
a220.910.728***
a230.9020.75***
F6a2410.756-0.5990.857
a251.0320.781***
a261.0460.795***
a271.0030.764***
Note: *** represent 1% level of significance.
Table 10. Distinguishing Validity of Governance Influence Factors.
VariantF1F2F3F4F5F6
F10.749
F20.360.740
F30.3640.3620.752
F40.4190.3910.4190.747
F50.4490.3620.4280.4690.750
F60.4180.4250.3730.3880.4140.774
Table 11. Model fitting output metrics.
Fitness Indexχ2DFpχ2/DFGFIRMSEACFINFINNFI
Actual-->0.05<3>0.9<0.10>0.9>0.9>0.9
Scope382.760313.0000.004 ***1.2230.9220.0250.9850.9220.983
Note: *** represent 1% level of significance.
Table 12. Standardized Path Coefficients.
Path RelationshipNon-Standardization CoefficientStandardized CoefficientS.E.C.R.pAssumption
F1F50.6270.5520.0738.5710.000 ***Support
F1F60.2020.1920.0792.5560.011 **Support
F5F60.1350.0920.0981.3800.168Not supported
F2F60.3570.3420.0715.0220.000 ***Support
F1F30.2870.2910.0664.3220.000 ***Support
F6F30.2830.3020.0644.4360.000 ***Support
F1F40.1660.1650.0772.1590.031 **Support
F2F40.2040.2040.0643.1940.001 ***Support
F5F40.2620.2960.0604.3580.000 ***Support
F3F40.2090.2050.0603.4750.001 ***Support
Note: ***, ** represent 1%, 5% level of significance.
Table 13. Ranking of the governance effects on opportunistic behavior by the component paths of each influence factor.
Impact PathwaysDirect EffectSequencesIndirect EffectSequencesCombined EffectSequences
F1 → G0.8321.14011.9701
F2 → G0.5560.50121.0512
F6 → G0.6750.26530.9354
F5 → G0.7530.26041.0103
F3 → G0.7040.18050.8805
F4 → G0.881 0.8805
Table 14. Initial values of project model parameters.
VariantRWeightsR2SD Initial Value
Degree of industry regulation 0.554
a10.7500.2020.5630.563
a20.7410.1990.5490.549
a30.7530.2020.5670.567
a40.7610.2040.5790.579
a50.7150.1920.5110.511
External oversight mechanisms 0.548
a60.7530.3390.5670.567
a70.7640.3440.5840.584
a80.7020.3160.4930.493
Quality of project governance 0.565
a90.7270.1610.5290.529
a100.7290.1620.5310.531
a110.7890.1750.6230.623
a120.7610.1700.5790.579
a130.7810.1730.6100.610
a140.7190.1600.5170.517
Construction process management 0.548
a150.7520.2030.5660.566
a160.7450.2020.5550.555
a170.7980.2160.6370.637
a180.7150.1930.5110.511
a190.6870.1860.4720.472
Constructor credit evaluation system 0.566
a200.7810.2600.6100.610
a210.7420.2470.5510.551
a220.7290.2420.5310.531
a230.7560.2510.5720.572
Internal control of the construction organization 0.598
a240.7560.2450.5720.572
a250.7830.2530.6130.613
a260.7920.2560.6270.627
a270.7610.2460.5790.579
Table 15. Governance Model Equations.
VariantVariational Equation
State variable
GINTEG(rate of change; 10)
F1INTEG(rate of change; 0.561)
F2INTEG(rate of change; 0.548)
F3INTEG(rate of change; 0.563)
F4INTEG(rate of change; 0.559)
F5INTEG(rate of change; 0.562)
F6INTEG(rate of change; 0.599)
Fate variable
Rate of change of G(F1 × 0.830 + F2 × 0.550 + F3 × 0.700 + F4 × 0.880 + F5 × 0.750 + F6 × 0.670) × 0.010
Rate of change of F1Strength of accountability × 0.340
Rate of change of F2Strength of accountability × 0.204
Rate of change of F3F6 × 0.302 + F1 × 0.291
Rate of change of F4(F5 × 0.296 + F2 × 0.204 + F3 × 0.205F1 × 0.165) × 0.400
Rate of change of F5F1 × 0.552 + Education and training × 0.730
Rate of change of F6F2 × 0.342 + F1 × 0.192 + Education and training × 0.756
Auxiliary variable
Education and trainingFrequency of opportunistic behavior × 0.003
Strength of accountabilityFrequency of opportunistic behavior × 0.003
Frequency of opportunistic behavior100 − G × 0.730
Disclaimer/Publisher’s Note: The statements, opinions and data contained in all publications are solely those of the individual author(s) and contributor(s) and not of MDPI and/or the editor(s). MDPI and/or the editor(s) disclaim responsibility for any injury to people or property resulting from any ideas, methods, instructions or products referred to in the content.