Article

Comprehensive Energy Retrofit of a 1950s Office Building in Algeria: Toward 2030 Efficiency Goals in Mediterranean Climates

1
National Center for Integrated Building Studies and Research (CNERIB), El-Mokrani, Souidania, Algiers 16097, Algeria
2
Laboratory Built in the Environment, University of Sciences and Technology Houari Boumediene (USTHB), Algiers 16111, Algeria
3
Laboratory Energy Efficiency in Buildings and Urban Development, Energy Efficiency Technical Unit Department (DUEE-SPS-ESU), National Agency for New Technologies, Energy and Sustainable Economic Development (ENEA), Via Anguillarese, 00123 Roma, Italy
4
École de Technologie Supérieure (ÉTS), University of Québec, 1100 Rue Notre-Dame Ouest, Montreal, QC H3C 1K3, Canada
*
Author to whom correspondence should be addressed.
Buildings 2025, 15(23), 4247; https://doi.org/10.3390/buildings15234247
Submission received: 10 October 2025 / Revised: 14 November 2025 / Accepted: 17 November 2025 / Published: 25 November 2025
(This article belongs to the Section Building Energy, Physics, Environment, and Systems)

Abstract

Retrofitting conventional buildings is a key strategy for climate change mitigation, as it enhances indoor comfort while reducing energy consumption in countries where old building stocks are a major contributor to energy use and associated emissions. In North African and Mediterranean contexts, deep energy retrofits for mid-century office buildings remain limited, particularly regarding the practical implementation of solutions adapted to local climatic and economic conditions. This study investigates a deep retrofit of a mid-20th-century office building in Algeria, aiming to assess its alignment with Algeria’s 2030 climate and energy efficiency objectives. A holistic methodology combining an energy audit and dynamic simulation with EnergyPlus has been undertaken to evaluate envelope upgrading, HVAC replacement, and renewable energy supplementation. Retrofit strategies selected were defined as representative of technically feasible and cost-effective solutions for Algerian mid-century office buildings, balancing energy performance improvement and economic viability under local climatic constraints. This study analyzed two retrofit scenarios: one with a combination of envelope improvements, heat pump replacement, and supplementation by photovoltaic solar panels, reaching 41% in terms of electricity savings (≈23 t CO2/year avoided), and the other with the VRF system, reaching 54% in savings (≈30 t CO2/year). Consequently, energy intensity is reduced from the base case by around 41–54%. The study contributes to data-driven retrofitting studies and explores innovative, low-cost strategies that respond to regional climatic challenges.

1. Introduction

Climate change and the increasing demand for sustainability have made energy efficiency in buildings into a global concern. Buildings are one of the most energy-intensive sectors and one of the largest sources of greenhouse gas emissions worldwide, and their performance must be urgently improved to reduce their environmental impact [1]. Energy efficiency in buildings has been addressed under a wide variety of climatic contexts, building typologies, and retrofitting strategies. The terms retrofit, retrofitting, and refurbishment refer to upgrading existing buildings to modern standards with the aim of extending their service life and improving performance [2,3,4]. Compared to demolition and new construction, retrofitting has several economic, social, and environmental advantages [5]. It avoids waste generation, reduces natural resource usage, and significantly decreases operational energy consumption and related emissions. Many studies confirmed that the overall retrofitting cost was lower compared to the cost of constructing new buildings or demolishing and rebuilding existing ones [5,6,7,8]. Moreover, upgrading old buildings has contributed to sustainability by reducing energy consumption and decreasing related greenhouse gas emissions. This is particularly relevant today because large portions of the existing building stock have reached the end of their typical 50–70-year service life. Therefore, an increasingly large share of the research work has focused on reducing energy consumption while maintaining indoor comfort and economic feasibility.
In recent decades, a large number of studies have examined retrofit strategies across international contexts, with special emphasis on Mediterranean climates, tertiary and industrial buildings, predictive modeling, post-occupancy evaluations, and hybrid renewable systems. When it comes to Mediterranean climates, several studies have highlighted the importance of passive design and climate-responsive refurbishments, where the retrofit is adapted to local conditions such as solar exposure, wind, humidity, and temperature. Bekele and Atakara [9] compared traditional and modern houses in Turkey and concluded that energy demand can be significantly reduced by using thick walls to increase thermal mass, combined with shaded openings and natural ventilation. They found that, compared to a baseline case, these measures reduced energy use by up to 34.7%. Resende and Corvacho [10] showed that optimizing nZEB building envelopes in Mediterranean climates—through insulation, glazing, and shading improvements—can enhance passive thermal comfort and significantly reduce cooling energy demand. Chantzis et al. [11] examined the coupling of thermal mass and variable-speed heat pumps, achieving enhanced demand-side flexibility but noting possible rebound effects in consumption. In Portugal, Gouveia et al. [12] used the Priorit EE decision-support tool in 22 public buildings, identifying significant potential for energy and financial savings and CO2 emission reductions. Brunoro et al. [13] focused on passive retrofitting interventions in Italian suburban neighborhoods built between the 1960s and 1980s, demonstrating that the building envelope accounts for nearly 50% of total thermal exchanges. Niveditha and Singaravel [14] showed that appropriately sized hybrid PV–wind systems with battery storage can significantly improve the economic performance and reduce the grid dependence of Net Zero Energy office buildings.
Besides the residential sector, tertiary buildings, such as offices, schools, and universities, represent another target for energy retrofitting. The work of Asif et al. [15] demonstrated that the integration of PV panels with five energy efficiency measures reduced the EUI of a Saudi office building from 458.9 to 361.4 kWh/m2·year, while the payback period was only six years. Oliveira et al. [16] confirm the dominant role of envelope insulation, HVAC and lighting system optimization, and renewable integration. Along this line, Taheri et al. [17] established that the combination of low-cost measures (increased insulation, replacement of lighting systems with LED, and installation of double-glazed windows) with the use of new technologies (smart building controls, occupancy sensors, rooftop PV systems) was able to reduce energy consumption by 53.8%, emissions by 21.8%, and annual costs by 12.9% compared to the pre-renovation case. Building on the demonstration, Danial et al. [18] used BIM to show how retrofitting, supported by digital simulation, can achieve a 68% reduction in energy consumption and obtain LEED certification.
Industrial buildings also present a great potential for energy efficiency improvement. Bosu et al. [19] calculated that the integration of PV in an Egyptian industrial complex could cover 51% of the annual demand of electricity, thus avoiding 232 tons of CO2 emissions annually. Thomsen et al. [20] mentioned that the expansion of existing PV systems in the Borg El-Arab industrial complex would cover half of the complex’s needs with only a three-year payback time. Variable-speed drives, improved thermal insulation, and equipment control optimization further increase the efficiency. Selim et al. [21] analyzed 20 industrial sites and reported savings of 98 million kWh; 561 million BTU of natural gas; 44 million gallons of water; and 100,000 tons of CO2 emissions avoided. Kluczek and Olszewski [22] reviewed reports on industrial energy audits and confirmed that energy savings from 5% to 70% are achievable and very often with a payback period of less than two years.
Predictive models and climate-resilient measures have similarly been increasingly applied. Roaf et al. [23] highlighted the significance of natural ventilation, passive cooling, and urban sustainability in enhancing resilience to climate change. Chan et al. [24] analyzed a university campus in the Philippines and found that 63% of total energy consumption was due to air-conditioning; they recommended inverter-based systems and LED retrofitting as the most effective measures. Ghadi et al. [25], in Queensland, Australia, applied occupant surveys to correlate climatic variations with heating and cooling loads. Merabtine et al. [26] audited French schools and reported an average energy consumption of 142 kWh/m2·year, dominated by heating demand at 97 kWh/m2·year. Sedati et al. [27] showed that optimizing façade materials can reduce heating and cooling requirements by up to 26.4%, depending on the climate. Zhang et al. [28] applied a hybrid machine learning method, GW-LGBM, to predict energy consumption and emissions, with R2 above 0.9 and achieved potential savings of 37.8%. Rahmane et al. [29], simulating HVAC and lighting energy-saving measures in a school building, found that even zero or low-cost strategies, such as adjusting thermostat setpoints, lighting control by occupancy schedules, and turning off unused equipment, can reduce electricity use by about 41.9% compared to the baseline conditions. Lawal et al. [30], in a Nigerian office building, demonstrated that PV integration, LED retrofitting, and efficient pumping systems reduced electricity consumption by 48%, avoided 4.4 tons of CO2 annually, and yielded a return on investment of 126%. In a similar way, Harkous et al. [31] identified window-to-wall ratio optimization, insulation improvement, and glazing enhancement as effective renovation measures in tropical climates, achieving energy savings between 35% and 60%. Another important retrofitting dimension concerns post-occupancy studies and indoor environmental quality. Kim et al. [32] detected that 99% of measured temperatures in a retrofitted university building in the UAE exceeded comfort recommendations, finding that most complaints were related to poor ventilation. Mengual Torres et al. [33] noted that replacing inefficient equipment in Mexican hotels led to energy savings of 9–12% per room on a yearly basis, demonstrating the value of identifying specific retrofit opportunities. Mohd Ali et al. [34] analyzed LED lighting upgrades in Malaysian public buildings; this resulted in annual energy savings of 72–144 MWh with a one-year payback period. In the Mediterranean region and Algeria, studies by Haddad et al. [35] and Errebai et al. [36] addressed passive optimization strategies and thermal performance through various heating systems, adding valuable regional contributions to the broader literature.
In Algeria, the building stock consumes more than 47% of the country’s final energy consumption, including 21% from the tertiary sector, with an estimated savings potential of 30 million toe [37,38]. Administrative buildings from the 1950s are mainly made of concrete and brick, without insulation, and with single-glazed windows, whose deteriorated components now have a shortened lifespan and result in serious thermal discontinuity and high demand for heating and cooling [39,40,41]. Several international studies have investigated retrofit measures for a wide range of building types [9,10,11,12,13,14,15,16,17,18,19,20,21,22,23,24,25,26,27,28,29,30,31,32,33,34,35,36], but very few have focused on the tertiary sector in North Africa and particularly in Algeria, leaving a large knowledge gap on the energy performance of mid-20th-century administrative buildings in the Mediterranean climate. Based on the European Standard EN 16247-2:2022 [42], this paper presents an extended energy audit of a representative office building and investigates opportunities and challenges for energy requalification in the national context, supported by the Taka Nadifa program [43] co-funded by the European Union and Algeria. The paper represents a twofold contribution: first, by addressing a scarcely explored but socially relevant building type within the Algerian public sector, and secondly by adopting an integrated retrofit approach combining envelope improvement, mechanical system, renewable integration, and occupants’ feedback. This holistic methodology allows prioritizing energy, environmental, comfort, and policy issues and provides a replicable model for sustainable retrofit strategies in comparable Mediterranean contexts.
This study is innovative with regard to two aspects: first, it presents a decision-making tool for energy retrofit for the Algerian tertiary sector according to the goals of the Taka Nadifa program; second, it is a contribution toward global sustainability objectives, i.e., Sustainable Development Goals (SDGs) 7, 11, 12, and 13. Apart from those, this study presents a new contribution in analyzing a mid-20th century office building—a typology comparatively poorly studied in North African and Mediterranean settings. In contrast to most of the current research targeting residential or newly built nearly zero energy buildings, this study addresses the pressing necessity of retrofitting existing aging tertiary buildings that still make up most of the Algerian stock. By combining dynamic simulation, validation using real energy bills, and user comfort surveys, an integrated approach is proposed that integrates technical, environmental, and social inputs. This makes the findings applicable to other Algerian buildings and other similar Mediterranean regions. For clarity and comparison, Table 1 summarizes the main studies discussed above, detailing their location, building type, key retrofit measures, and principal findings.

2. Methodology

This study provides aims to evaluate the actual energy performance of an office building from the 1950s in Algiers and investigates a package of retrofitting measures including roof replacement, window refurbishment, external wall insulation, HVAC replacement including variable Refrigerant Flow (VRF) systems, and integration of photovoltaic (PV) panels. We will also discuss the energy savings, potential reduction in CO2 emissions, and economic feasibility estimated in order to provide practical recommendations for decision-makers, engineers, and policymakers.
A five-step approach was adopted, as indicated in Figure 1. Preliminary data collection involved obtaining reported technical information, conducing site visit, and analyzing the building’s energy consumption through energy bills. Simulation modeling involved developing and validating an EnergyPlus-based building energy model in the second step. Thirdly, identification of intervention comprised an evaluation of relative benefits of diverse possible energy retrofit measures, including improvements to the building envelope and technical systems as well as integration of renewable energy sources. Fourthly, performance evaluation comprised the assessment of expected energy and CO2 savings, and the estimation of payback periods for each individual intervention. Finally, combined interventions evaluated integrated scenarios that encompass multiple measures intended to achieve maximum energy savings while ensuring cost-effectiveness.

3. Building Overview

3.1. Building Description

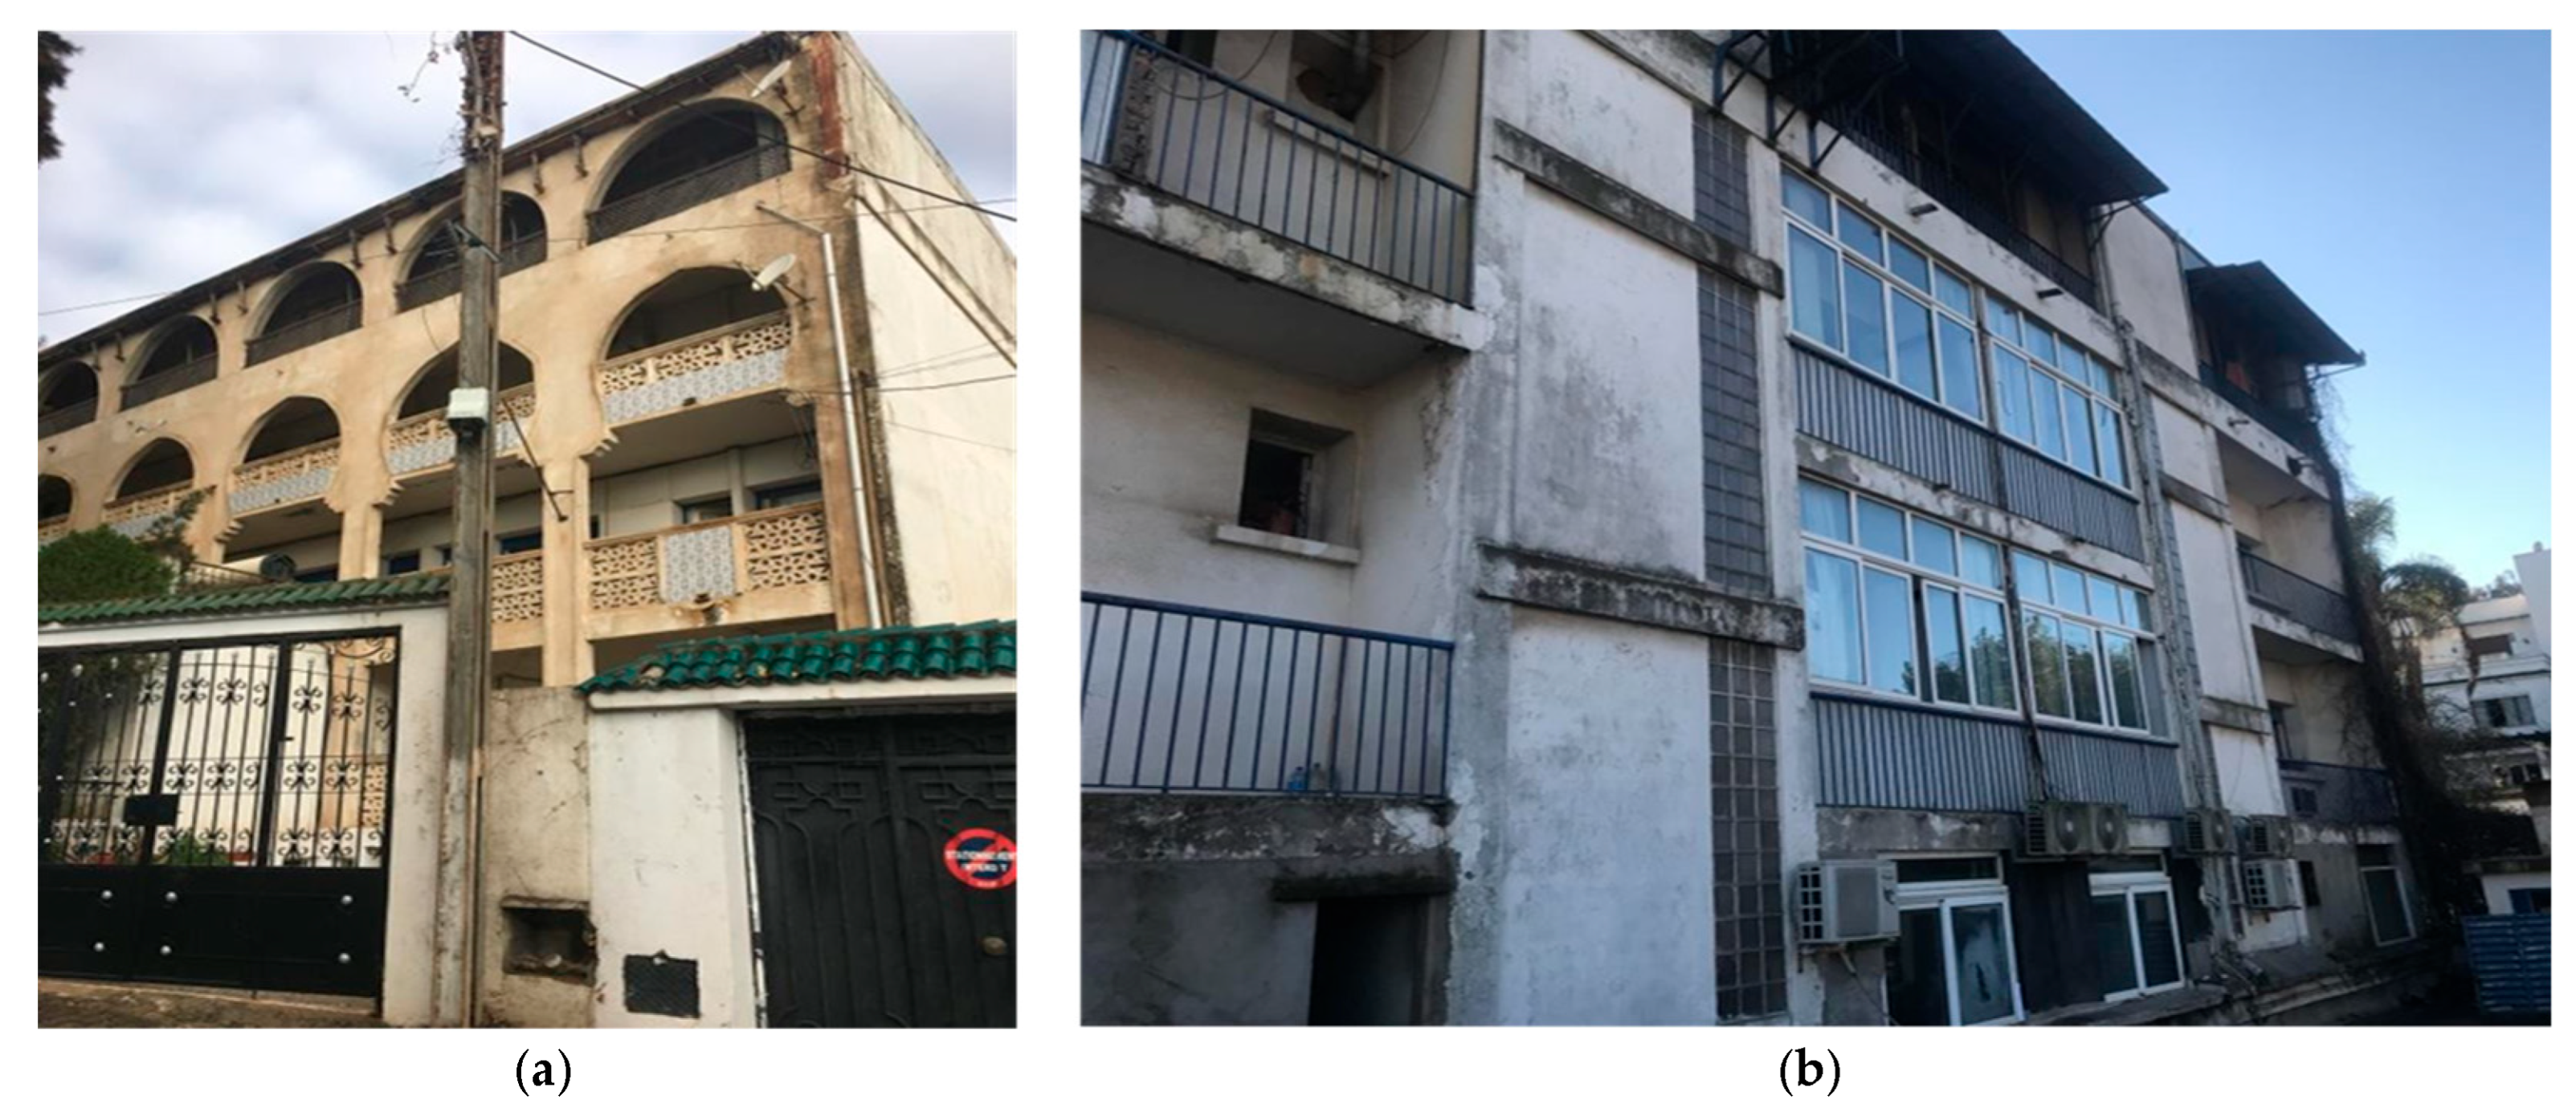
The building under analysis features a reinforced concrete structural frame with brick infill walls. Its main façade, oriented to the south (Figure 2a), is characterized by large balconies shaded by arch structures that serve as shading devices for the office windows. The north façade (Figure 2b) includes extensive glazed surfaces corresponding to office spaces, interspersed with smaller balconies and stairwells that alternate between opaque walls and translucent glass brick elements. The east and west façades are blind and uniformly rendered façades. Overall, the building exhibits significant signs of deterioration, with notably widespread detachment of plaster layers across most surfaces. The structure is topped with a pitched roof covered by a highly dispersive metal sheet, which contributes to substantial heat gains and results in pronounced thermal discomfort throughout the summer season.
Despite the lack of insulation of both opaque and transparent surfaces, the original design from the 1950s displayed good passive strategies. It originally featured a south façade with sloping balconies for winter sun penetration and summer shading and a north façade with more restrained balconies, as it receives minimum sunshine. Cross-ventilation was achieved through a central corridor. Light-colored façades limited summer heat gains. However, later changes nullified these qualities by enclosing balcony areas as indoor space on both facades.
There are two general types of windows: wood frames with single glazing; and aluminum frames with single and/or double glazing. Double-hung windows with fixed transoms take up a majority of openings on the lower floors. The upper floor features fully glazed curtain walls composed of aluminum frames and double glazing, with opaque or transparent sections that are either fixed or operable.
The building has four stories above ground and a partially heated ground floor containing reception, archives, storage, and technical rooms. Offices and meeting rooms are on the upper floors. Toilets, corridors, stairwells, and half of the basement are neither heated in winter nor cooled in summer.
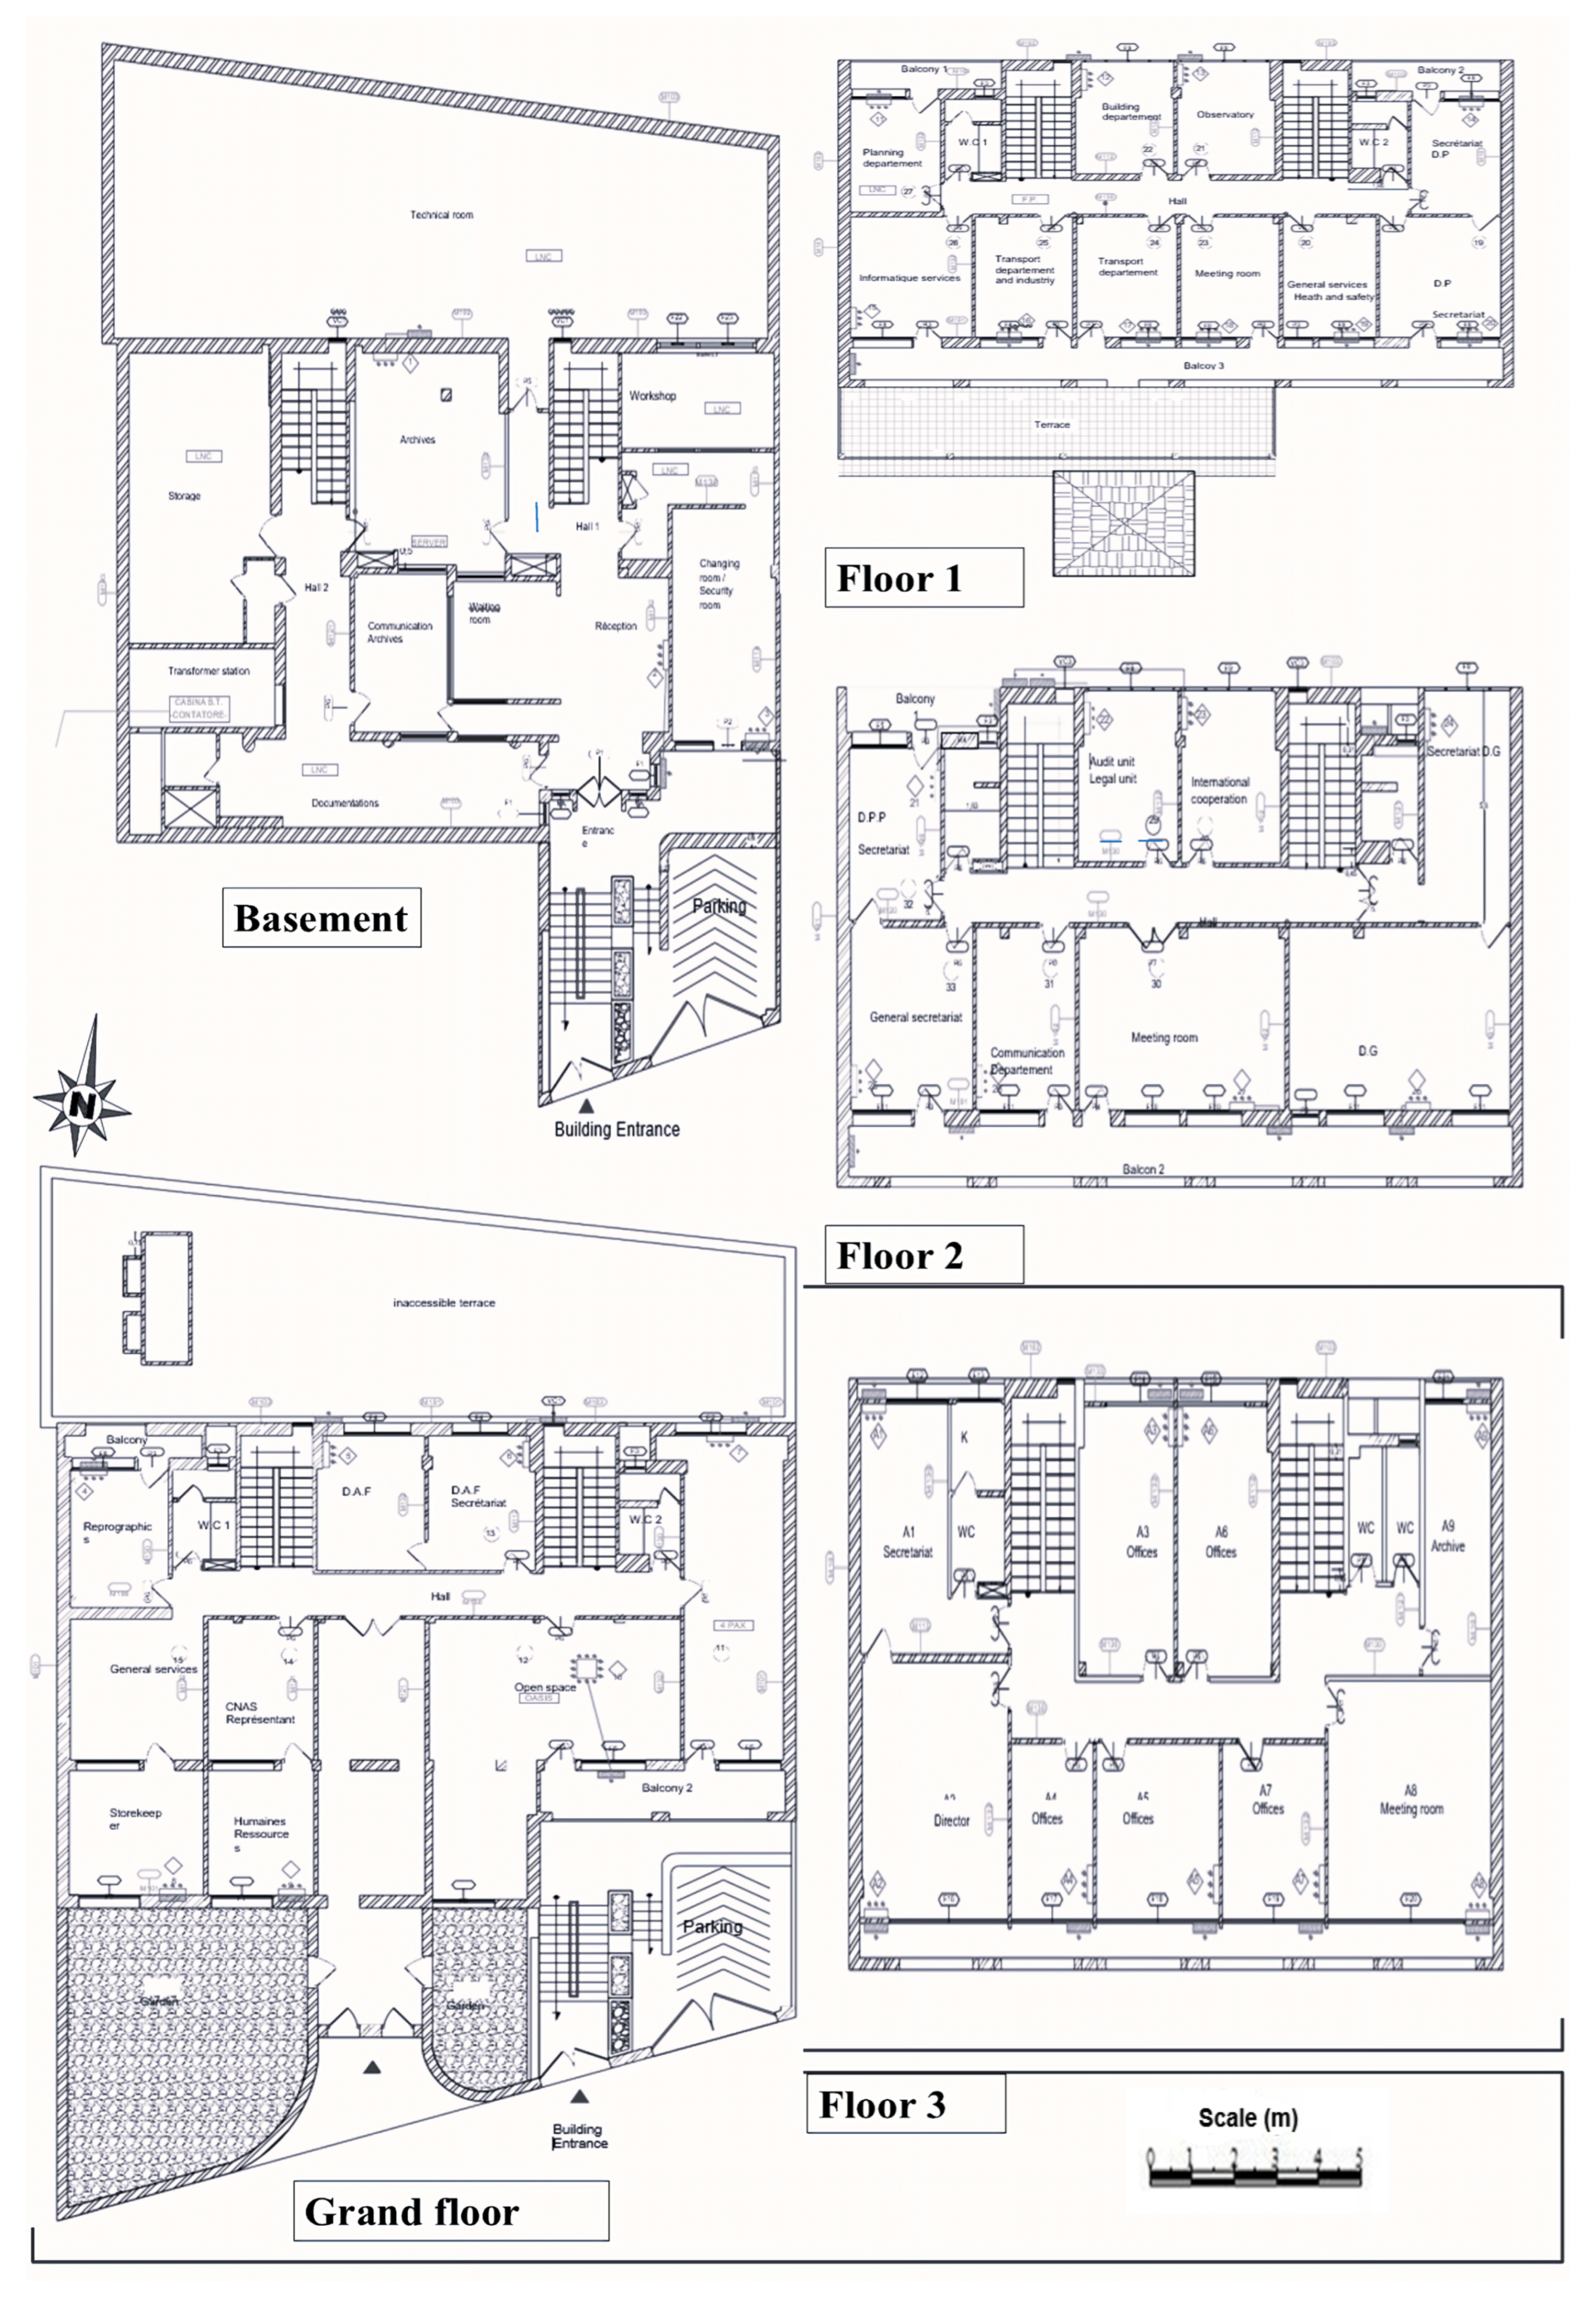
Heating and cooling are provided by air-to-air heat pump systems, i.e., mono-split types with outdoor and indoor units and monobloc types installed under windows, which are manual in operation and provide either heating or cooling. The diagnostic survey ascertained that the building envelope performance is poor and that there is widespread façade degradation. Figure 3 depicts the building’s floor plans and Table 2 presents the building’s physical characteristics. The energy performance calculation only considers the heated volume; therefore, only surfaces adjoining neighboring unheated spaces are potential heat-loss areas. The main dimensional characteristics of the building are presented in the table below.

3.2. Occupants’ Experience and Feedback

To gain deeper insights into the building’s usage patterns and identify its strengths and weaknesses from the occupants’ perspective, a user survey was conducted. Staff members of the organization were invited to complete a questionnaire regarding their experience in the occupied spaces, resulting in 23 complete responses. These responses provided valuable qualitative data on user perceptions. The feedback enabled a detailed analysis of occupant experiences across different zones of the building, with key findings for each thematic area summarized in Table 3.

4. Climate Analysis and Energy Demand

The analysis of energy bills of three years includes the total energy consumption of electrical and heating systems. For analysis purposes, weather conditions must be considered to understand their impact on energy use. Four main weather parameters were considered particularly important in this regard: outdoor temperature, global solar radiation, Heating Degree Days (HDDs), and Cooling Degree Days (CDDs).

4.1. Weather Analysis

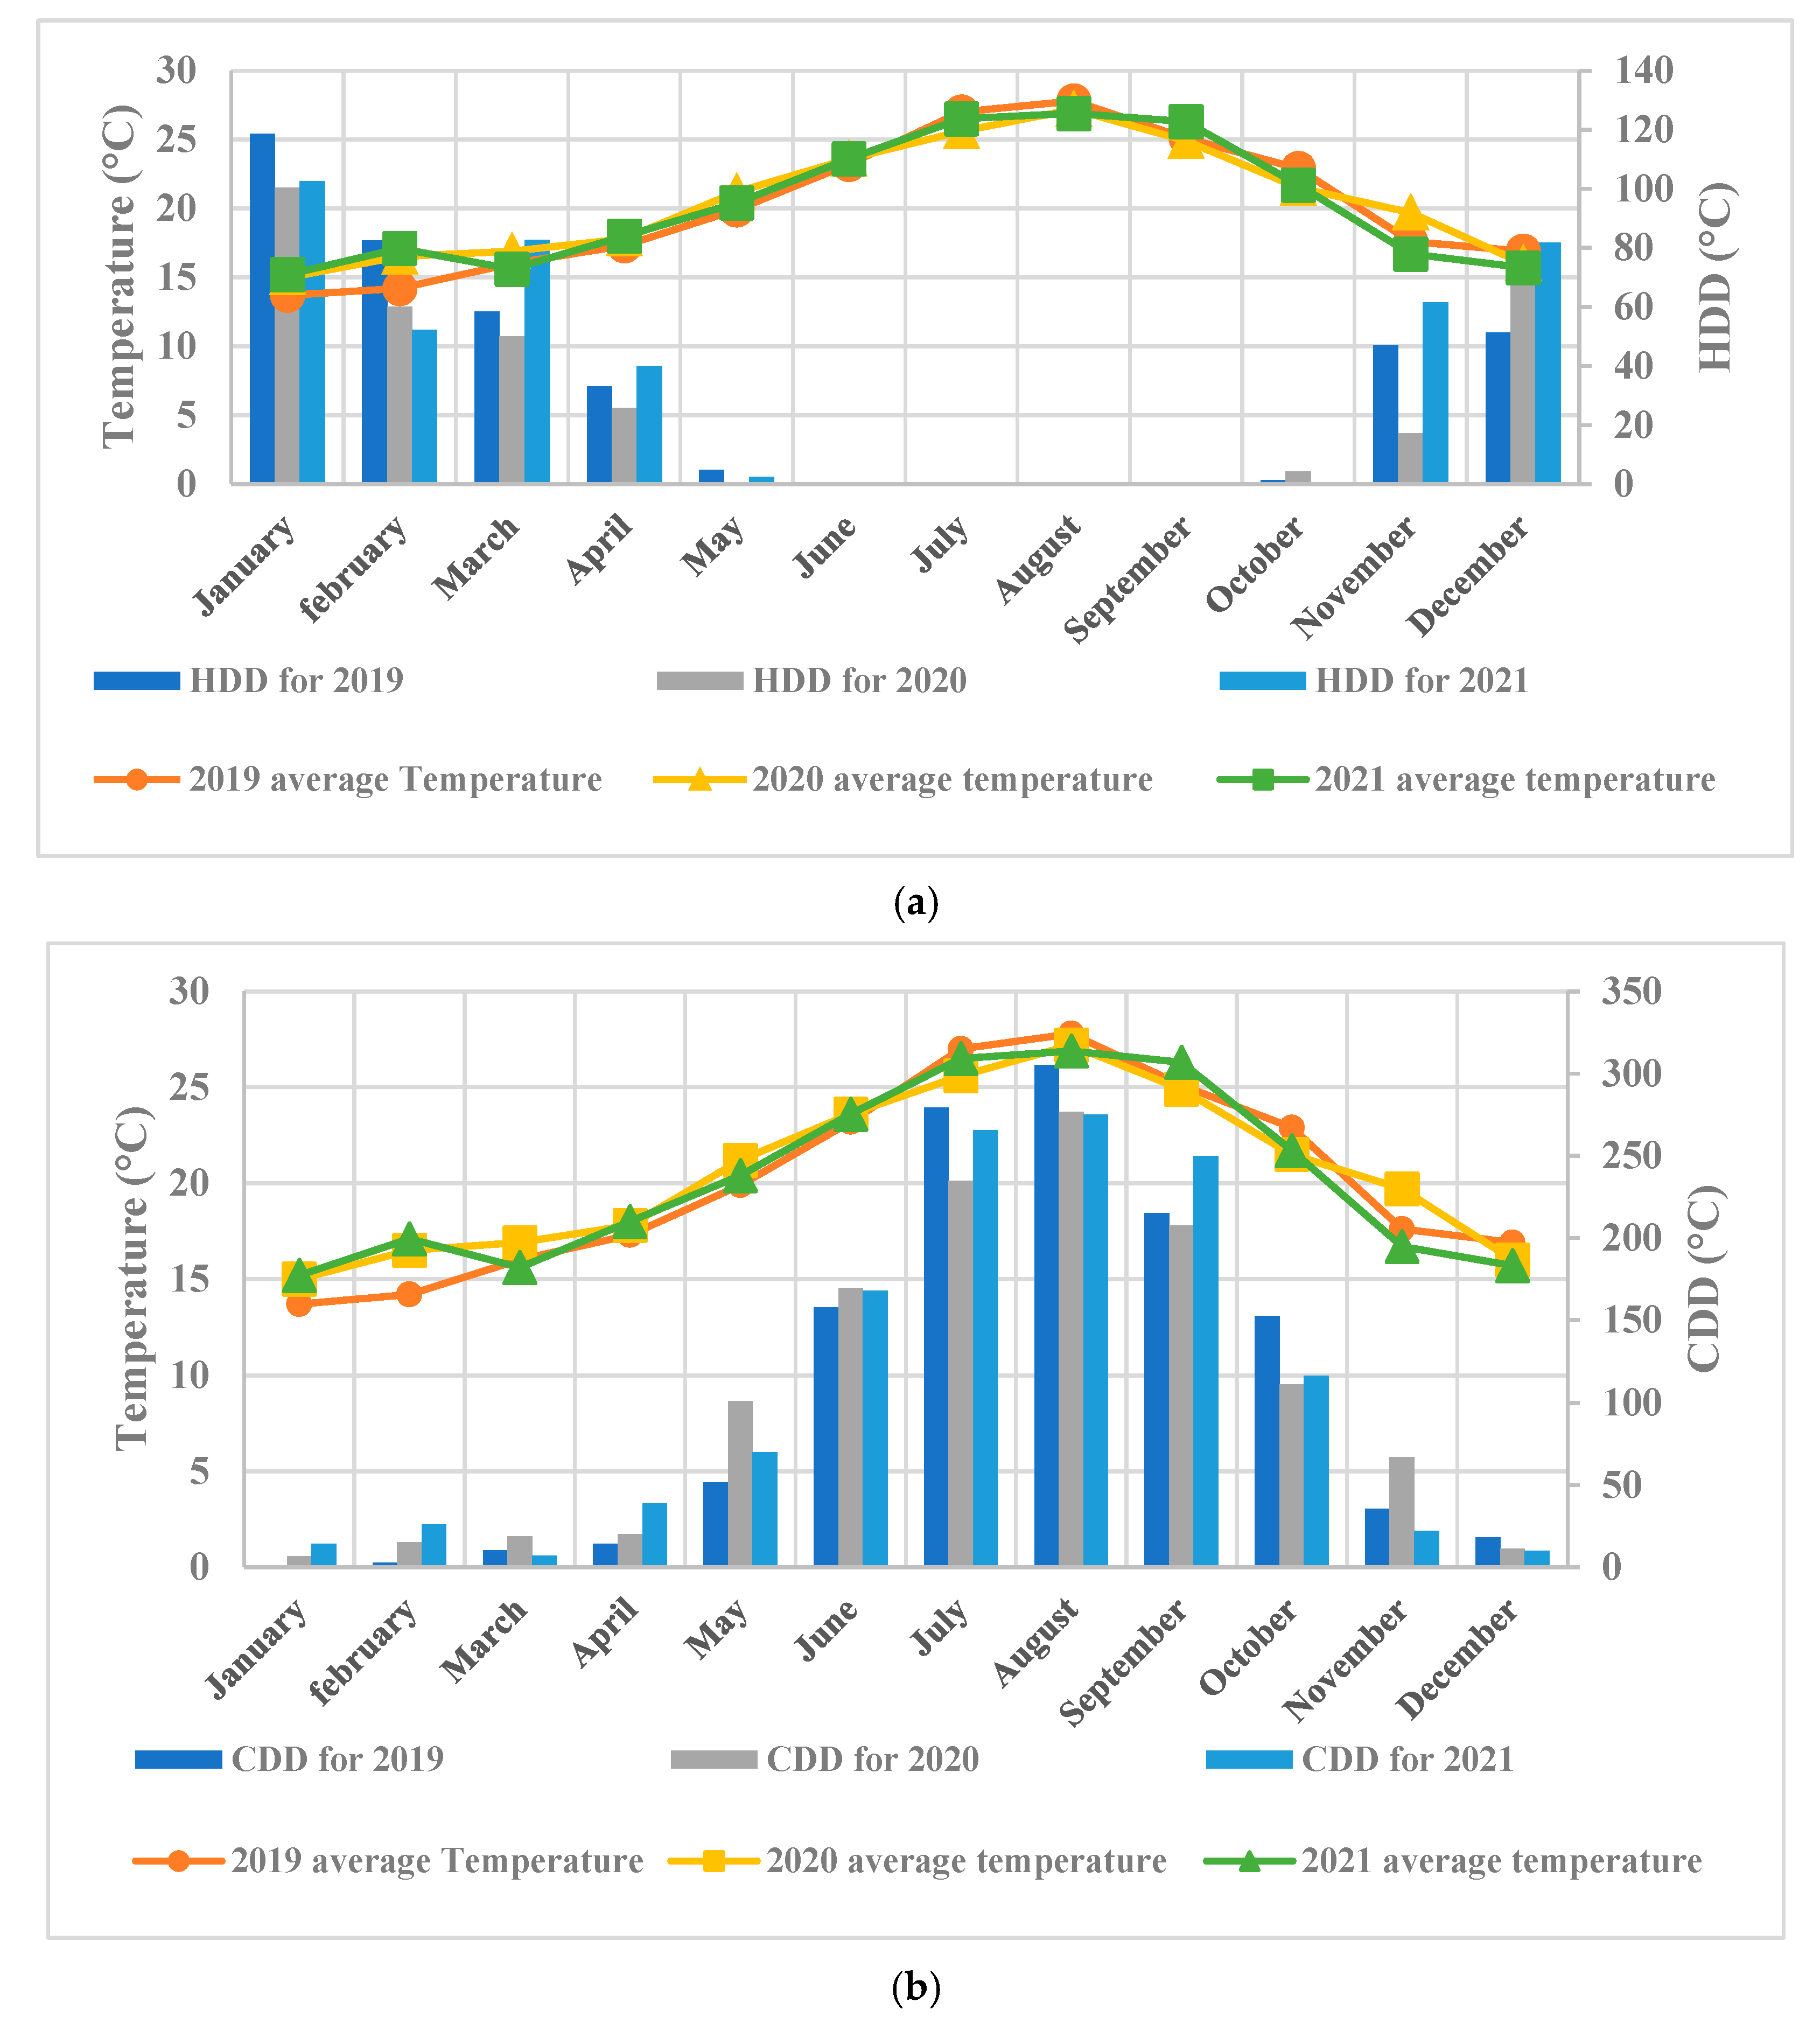
HDDs are the sum of daily average differences between the outdoor temperature and a base temperature of 18 °C (no heating is needed above this point) over the heating season. CDDs are the sum of the daily difference between the outdoor temperature and a reference base temperature of 18 °C, indicating cooling demand over the summer season.
Weather data were collected from the Algiers Port meteorological station, available online [44]. These data were used in the model to assess space heating, cooling, and electricity demand throughout the three-year analysis period.
Figure 4a presents the monthly average outdoor temperatures and HDD values, while Figure 4b illustrates the corresponding CDD profile. Table 4 provides the total HDDs, CDDs, and accumulated sunshine duration over the three-year monitoring period.
Table 4 shows Algiers’ Heating Degree Days (HDD), Cooling Degree Days (CDD), and solar radiation between 2019 and 2021. The results signifies the Mediterranean climate with warm winters, warm summers, and plentiful solar resources. HDD values are low between 331 and 423, indicating moderate heating demand. The maximum HDD in 2021 (423) indicates a slightly colder winter. CDD values are high and relatively stable, around 1240–1260, indicating a consistently strong annual cooling demand. Solar radiation varies from year to year: the maximum occurred in 2020 (2938 h), then in 2019 (2811 h), and the minimum in 2021 (2701 h). This suggests that 2020 had the clearest skies and highest solar potential, while 2021 had a cold winter and reduced solar availability. In general, cooling loads are much higher than heating loads, and solar energy is abundant, although it demonstrates moderate annual fluctuation. Since the climatic data for these three years are very similar, the energy audit results will neither be highly influenced nor skewed by climatic condition fluctuations. This allows the analysis to isolate weather variability from the overall evaluation of energy use, ensuring that the performance metrics and observed trends can be attributed primarily to the building’s attributes and operational variables rather than to climatic fluctuations.

4.2. Actual Energy Consumption Analysis

The energy consumption of the building is analyzed with the goal of creating a reference baseline to be used while assessing future improvement measures. To that end, historical three-year electricity bills were reviewed since they are the most reliable source of actual consumption information. Simultaneously, an inventory of the installed equipment was drafted and the approximated energy requirement of each department was matched with billing records in order to verify assumptions made.
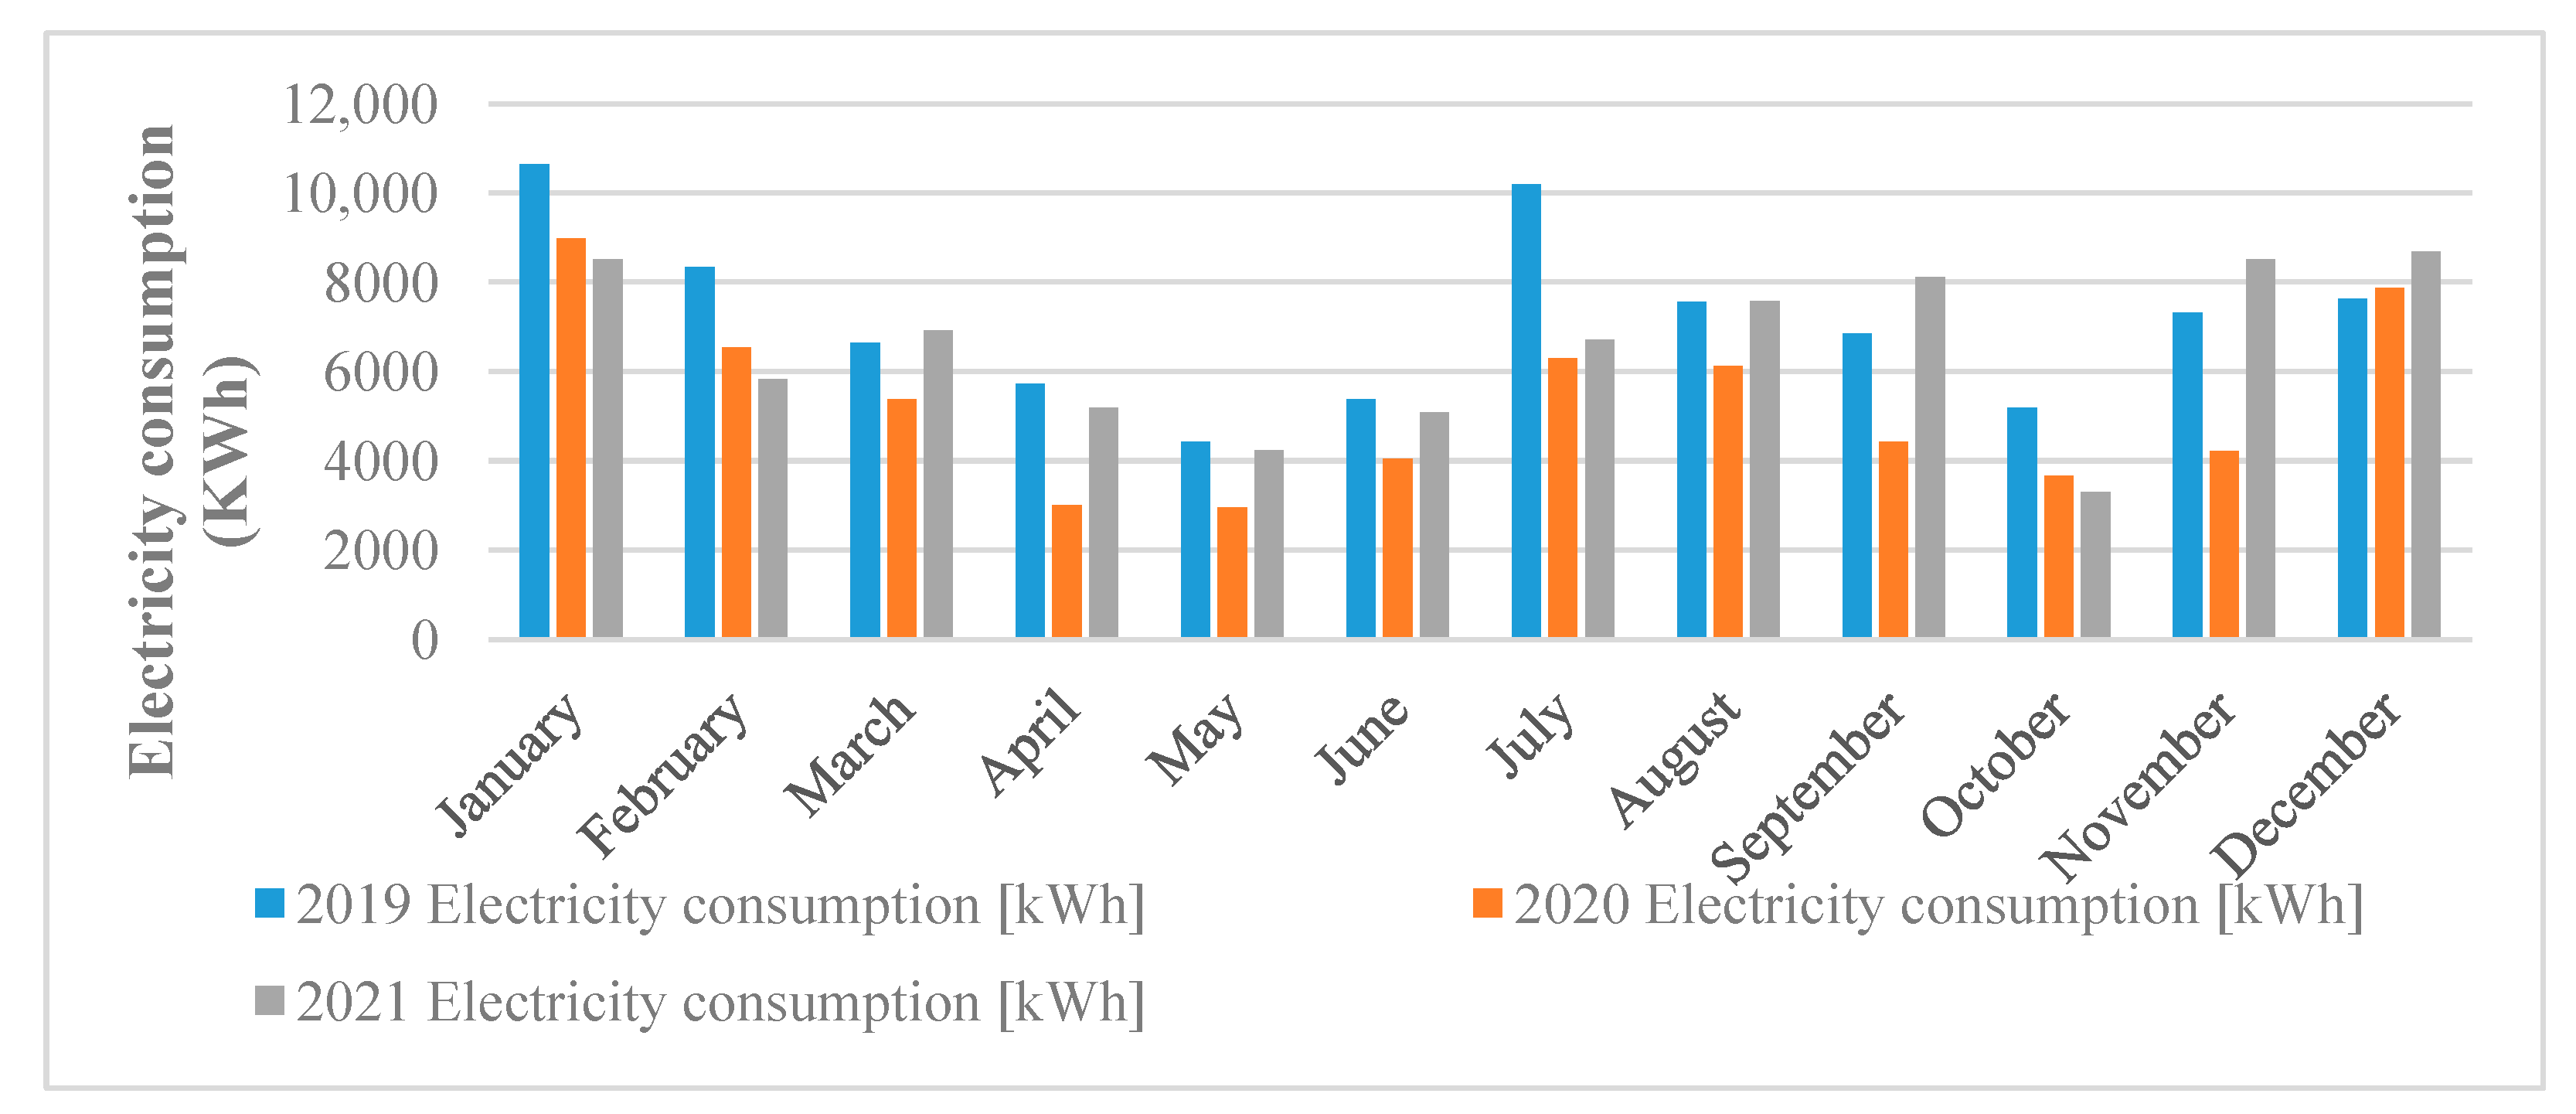
The study included electricity usage over 2019, 2021, and 2020, as shown in Figure 5. The baseline was chosen as the average of the two nearest years (2021 and 2019). The year 2020 was excluded due to uncharacteristic patterns of usage in response to the COVID-19 pandemic.
Air-to-air heat pump systems (indoor and outdoor modules mono-split units and monobloc units under windows) provide heating and cooling. In winter, offices are heated to an average temperature of 22 °C and, in summer, they are cooled to 23 °C, with the exception of the server room at basement level, which remains at a constant 18 °C throughout the year.
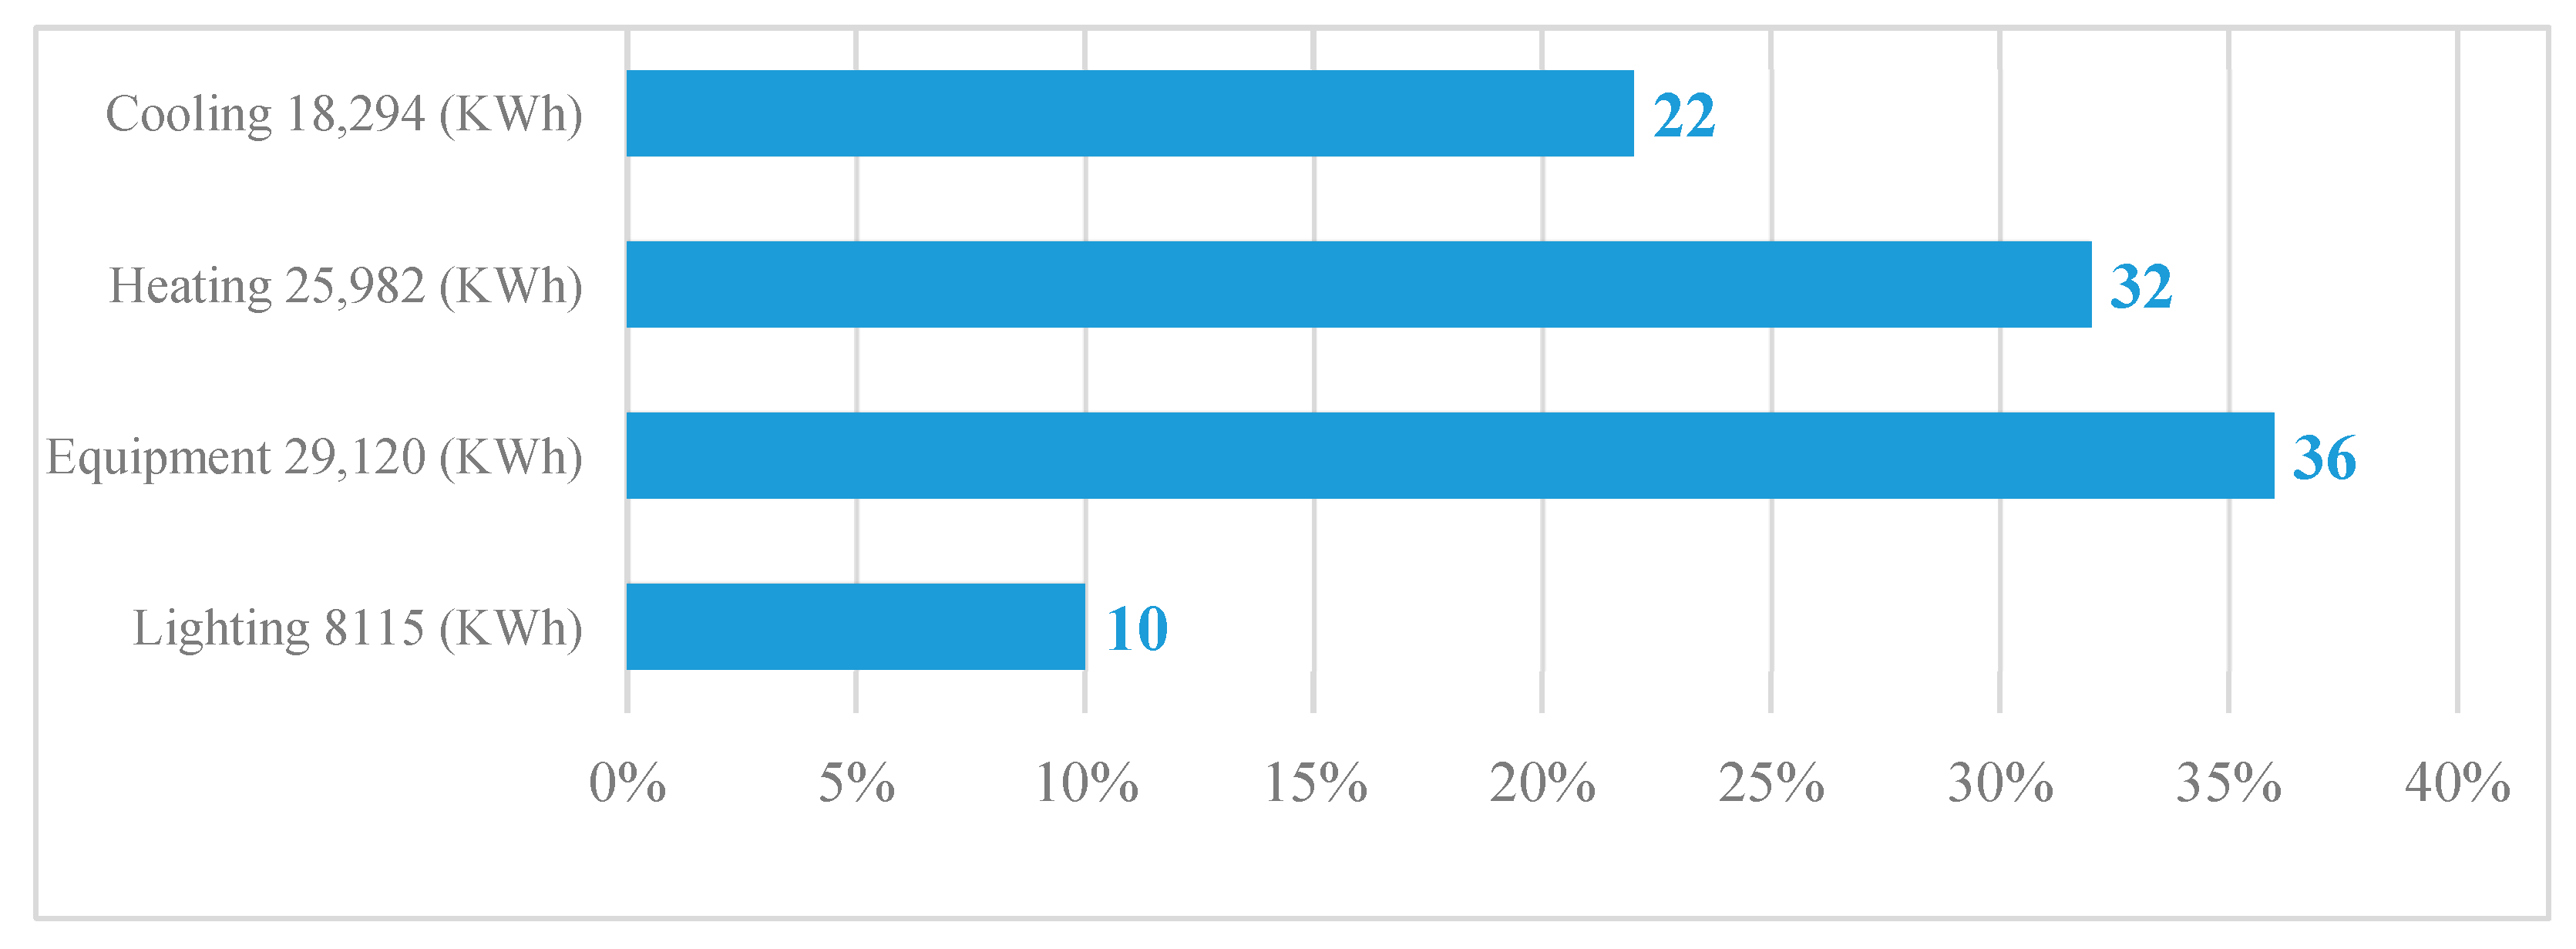
In addition to HVAC equipment, office workstations and lighting also induce electricity usage. Lighting consumption was estimated using lamp power rating and number of operating hours and, similarly, office equipment consumption was determined. The electricity consumption breakdown by end-use is provided in Figure 6.

4.3. Main Energy Performance Indicators, Primary Energy Demand, CO2 Emissions and Energy Supply Costs

The total electricity demand for each energy end-use as well as lighting are calculated, and office equipment use indices are calculated with respect to total net floor area, while heating and cooling service indices are calculated with respect to only the air-conditioned floor area.
Table 5 summarizes the electricity consumption in terms of final energy (as shown in Figure 6). To study the global consumption of the building irrespective of the energy vector used, it has to be expressed in primary energy (kWh or toe). Moreover, it is essential to quantify the annual CO2 emissions associated with the building’s consumption to ascertain the effect of the building on the environment.
The conversion coefficients employed in this study are as follows:
  • CO2 emission factor of Algerian electricity grid: 680 gCO2/kWhe;
  • Electricity to tons of oil equivalent (toe) conversion: 1 kWhe = 0.0002386 toe [2];
  • Electricity to primary energy conversion factor: 2.5 [45].
The expenses indicated in this paragraph do not correspond to the actual annual expenses incurred for the supply of electricity, but have been recalculated on the basis of the reference consumption obtained from the invoices (82,224 kWh/year) (Table 6), using an average price of electricity of 4.19 DA/kWh = 0.029 USD/kWh [45].

5. Model Development

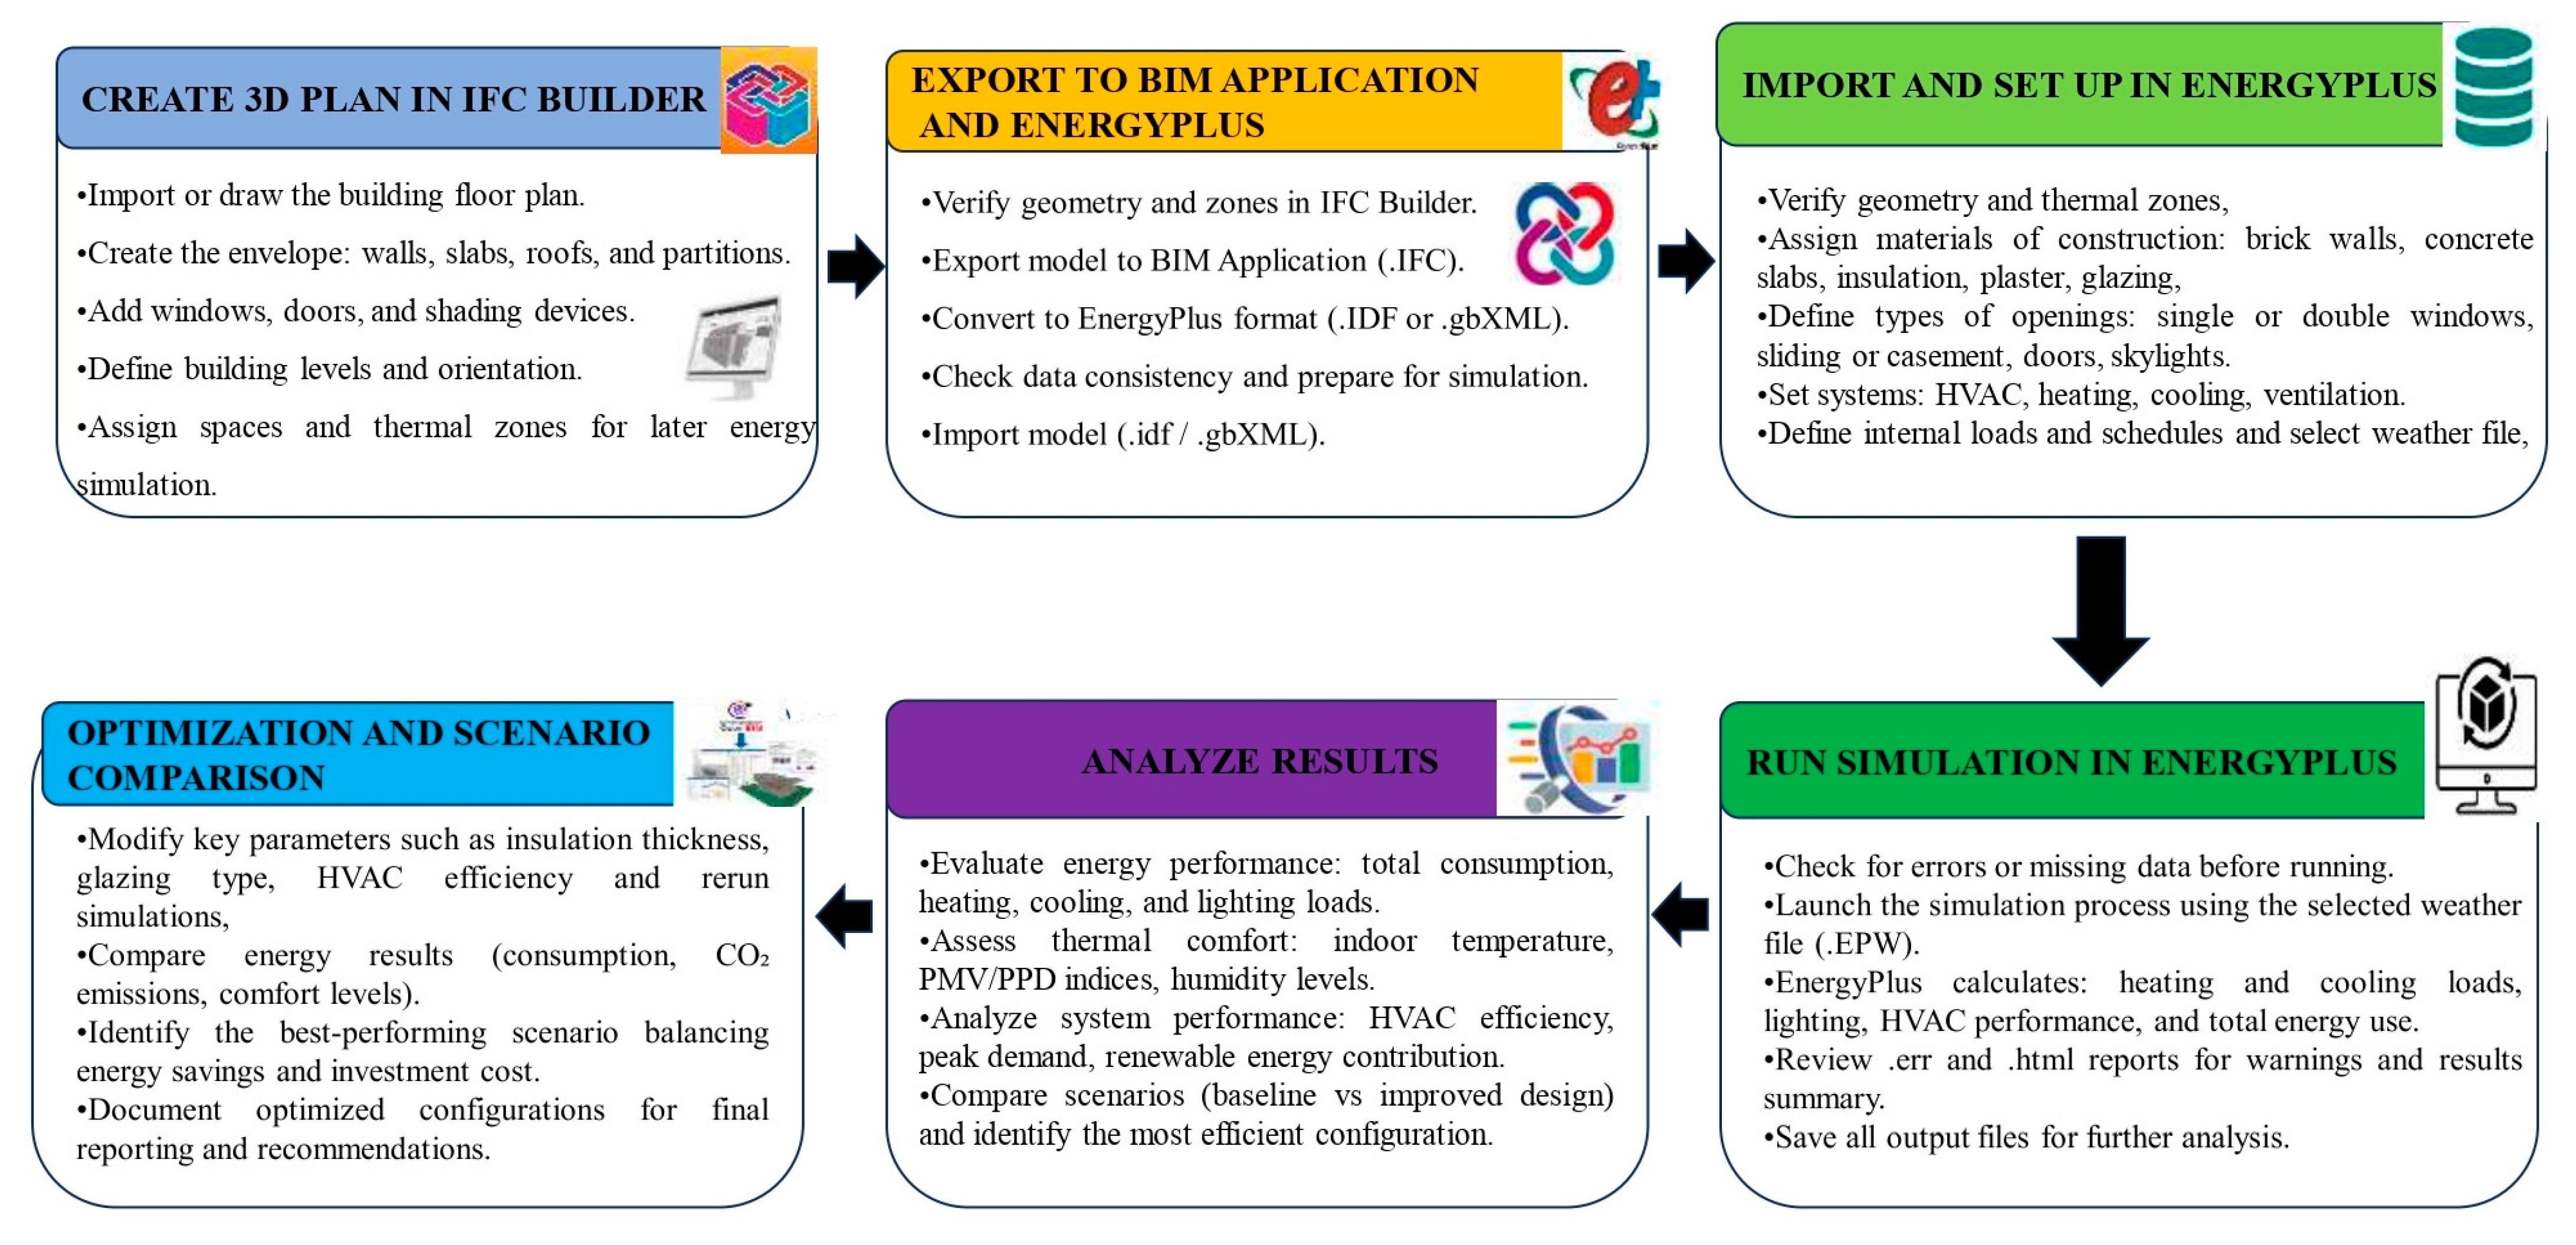
The developed model within the framework of this study is presented in Figure 7. It illustrates the followed methodological workflow for the dynamic simulation procedure, from the development of the 3D architectural model up to the optimization of the results using EnergyPlus 22.2. The procedure integrates building envelope modeling, HVAC system specifications, and analysis of their interactions with various climatic conditions, providing a realistic picture of the overall energy performance of the building.

5.1. Building Performance Simulation

For the assessment of the energy-saving potential for the heating service, a dynamic simulation model of the building was established using EnergyPlus 22.2 software. The model was tailored to replicate the actual performance of the building by considering interactions among the technical systems and the building envelope. The EnergyPlus simulation process involved specifying building geometry and thermal zones, defining materials and thermal properties of opaque and glazed components, inputting internal loads and operating schedules, inputting local weather data, and modeling HVAC systems based on actual patterns of operation. The model was also calibrated against observed energy use to ensure accuracy. Several studies have used EnergyPlus effectively for building retrofit analysis. For instance, Ascione et al. (2016) [46] applied EnergyPlus to identify cost-optimal retrofitting interventions for schools in the South of Italy by means of envelope refurbishment and replacement of HVAC systems. Similarly, Ma et al. (2012) [47] performed comparative simulations of various energy renovation strategies in office buildings and demonstrated the advantages of combining a number of interventions.

5.2. Simulation Results

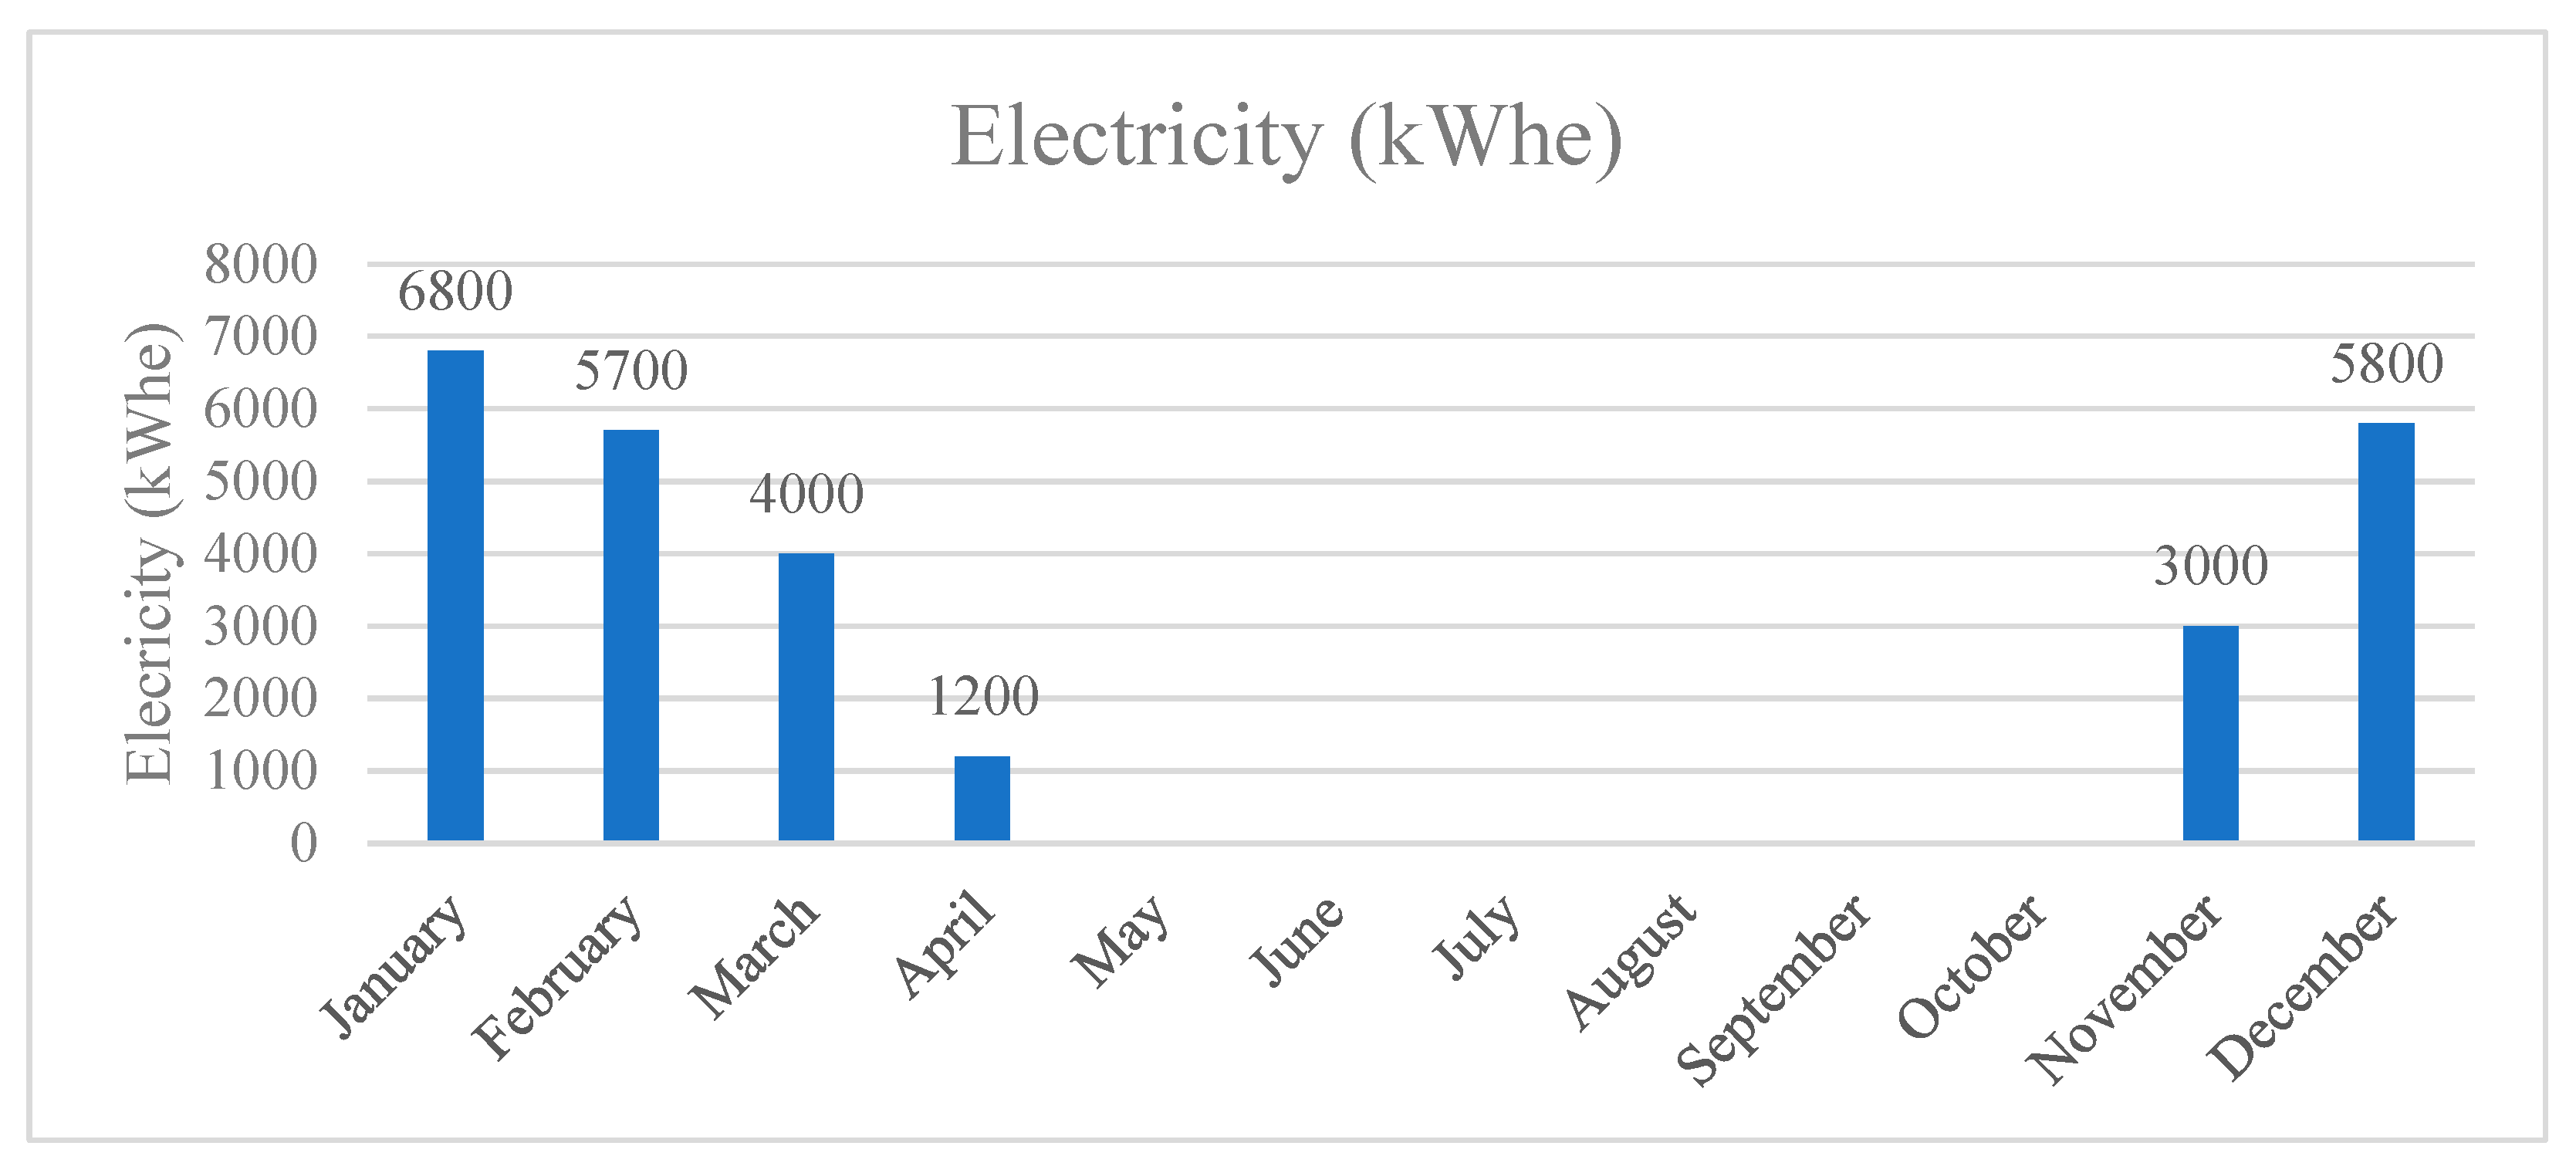
The simulation considered the operation performance of the heating system to predicts the annual electrical consumption considering building’s heating requirements based on the set operating schedules, setpoint temperatures, and system details. Figure 8 shows the predicted monthly energy consumption. The estimated total annual energy consumption is 26,534 kWh.
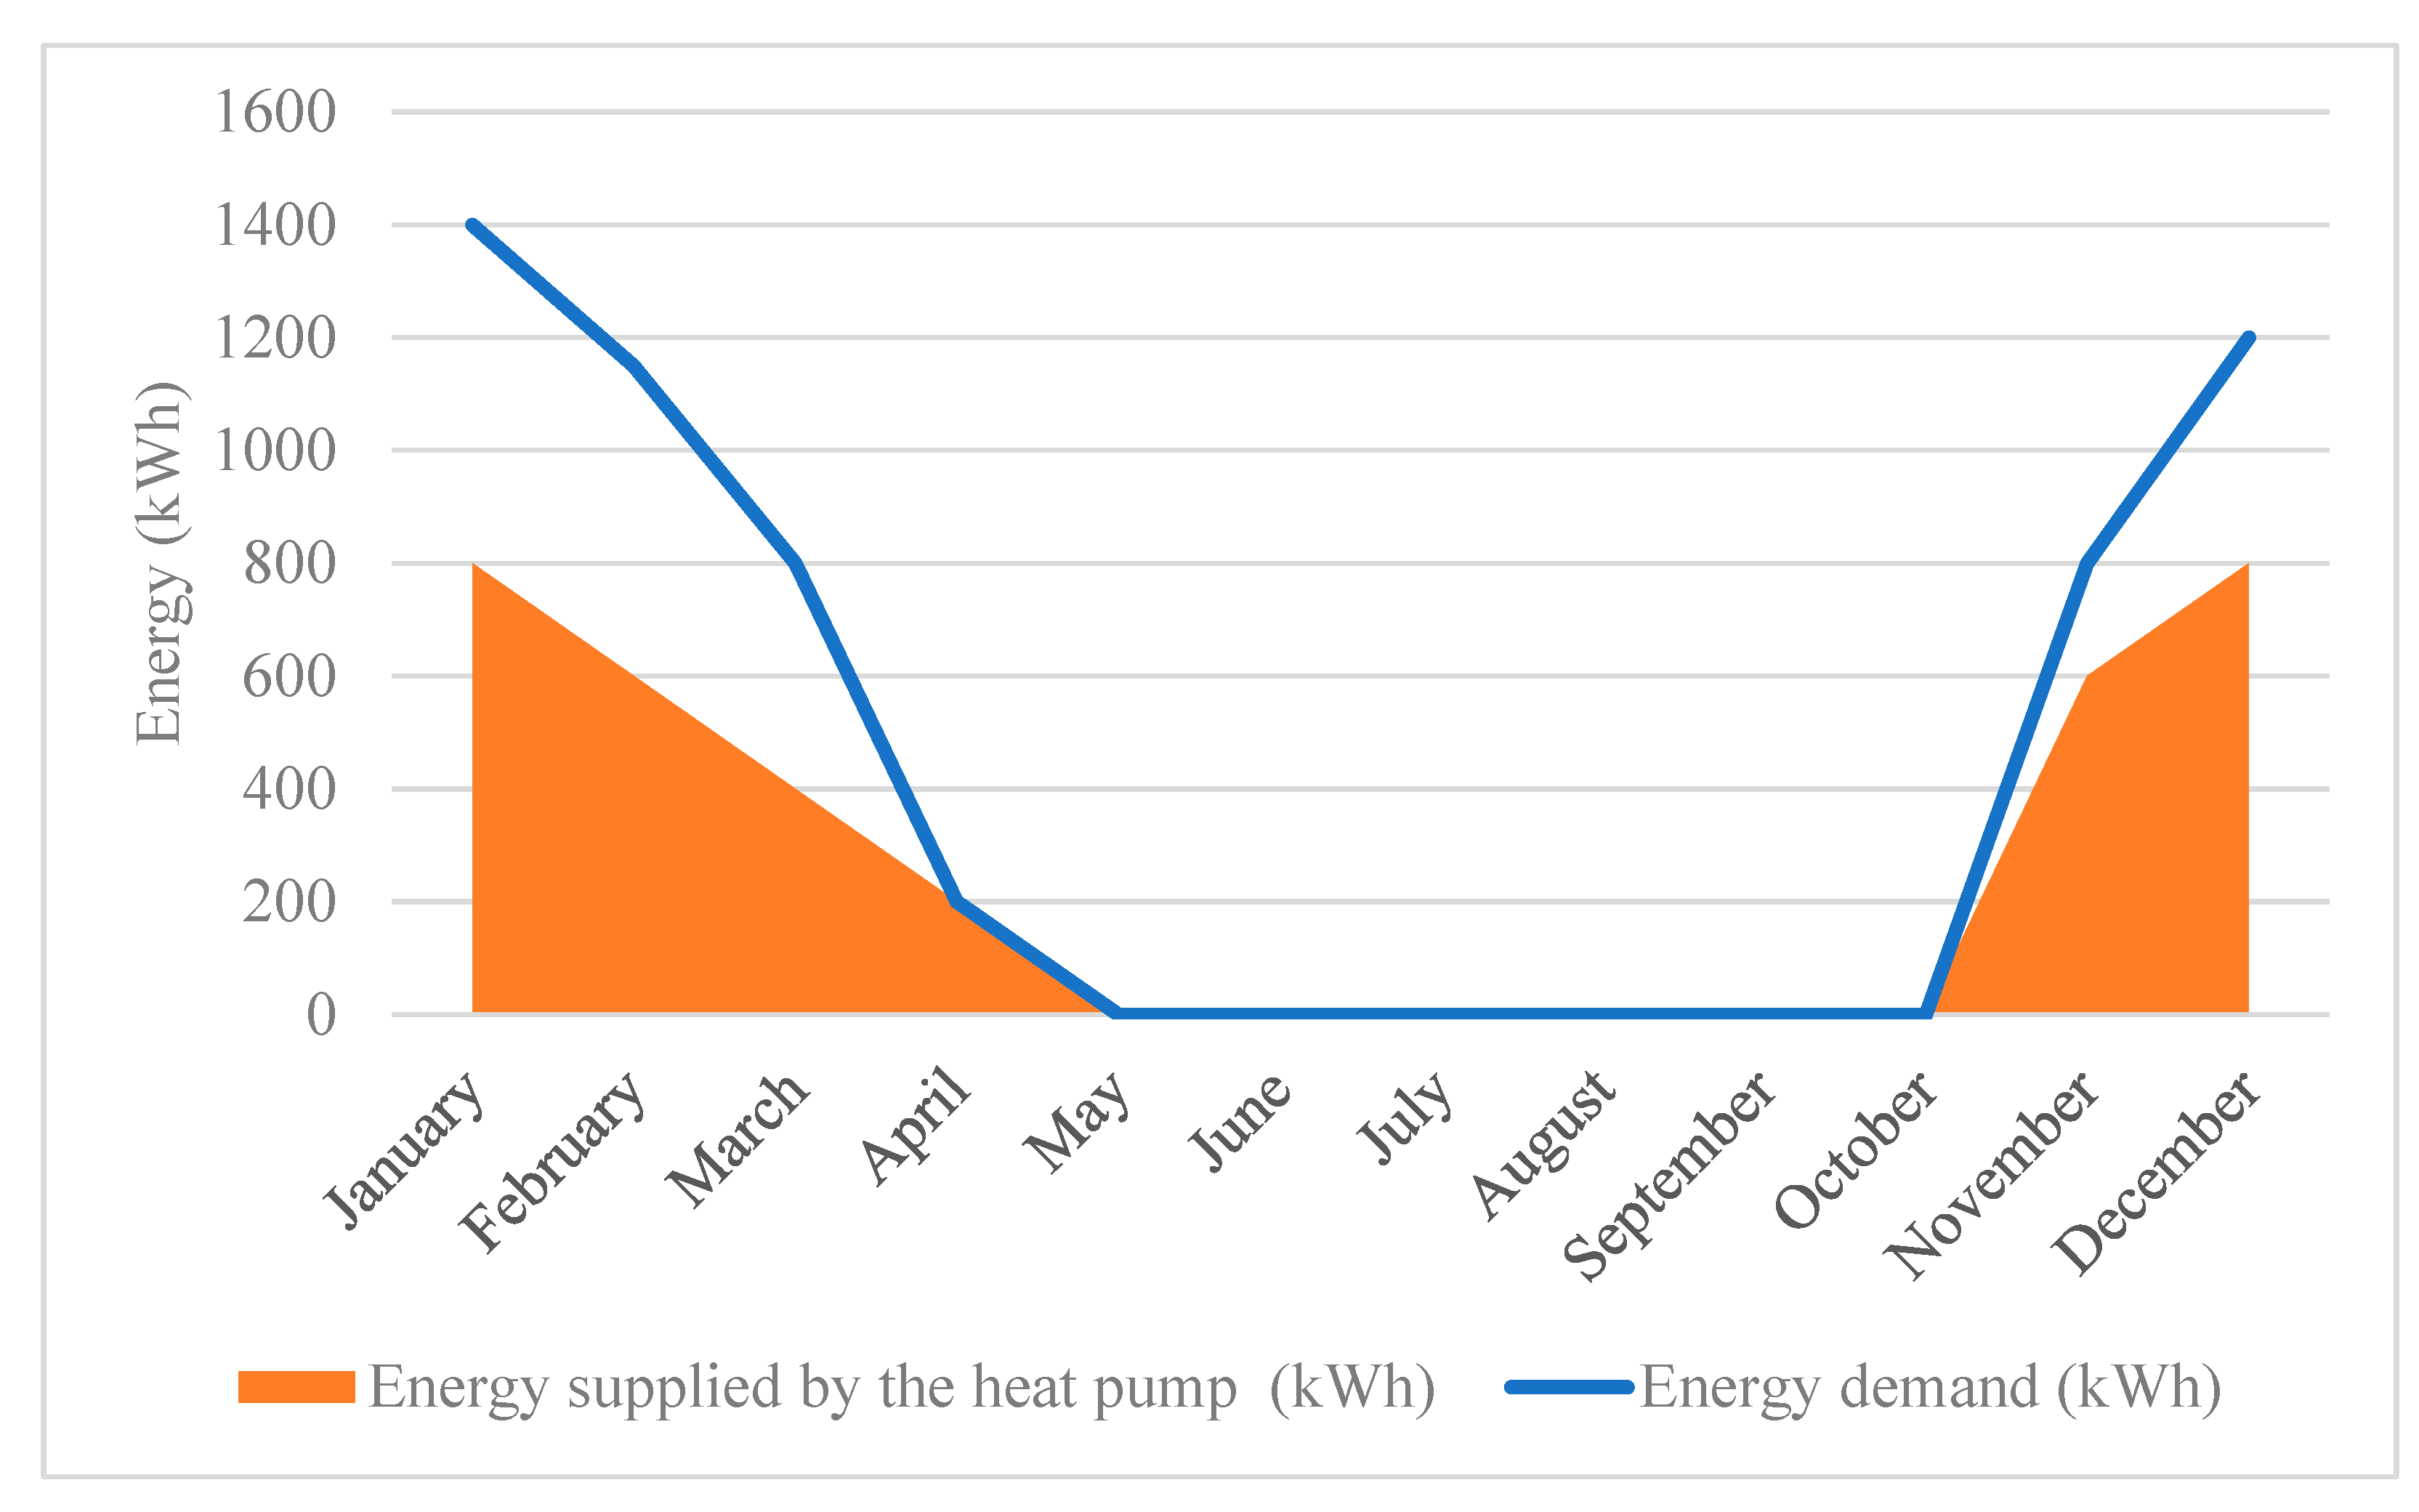
Simulation results reveal that energy loads within the building are unevenly distributed across zones, significantly affecting thermal comfort uniformity. Notably, offices on the third floor—located directly beneath an uninsulated and highly dispersive roof—experience substantial heat losses. As a result, the heat pumps are unable to meet the required thermal loads, and indoor temperatures fail to reach the target of 20 °C, as illustrated in Figure 9.
The simulation data also highlight a pronounced seasonal variation in heating energy consumption. During winter months (January, February, November, and December), peak demands exceed 1200 kWh in some top-floor offices, while the heat pump delivers only 600–800 kWh, leading to a persistent energy deficit. This shortfall is most severe in third-floor rooms due to their elevated thermal losses, resulting in significant thermal discomfort.
Conversely, in autumn and spring, the required and supplied energy align more closely, and both drop to near zero in summer, indicating minimal heating needs. From a scientific standpoint, these findings underscore the necessity of enhancing thermal insulation—particularly at roof level—and re-evaluating the capacity and operational strategy of the heat pump. Additionally, integrating auxiliary heating systems could help maintain thermal comfort throughout the year.

5.3. Model Validation

The model developed under the above assumptions was compared with the actual energy consumption data estimated from the energy inventory, which had previously been verified using available billing records. The inventory data-simulation result difference was found to be less than 5%, which is within desirable levels. The model can thus be claimed to be validated. The comparison of inventory-based and simulated consumption is presented in Table 7.
Based on ASHRAE Guideline 14 (2014) [48], the calibration quality was also verified by the Normalized Mean Bias Error (NMBE) and Coefficient of Variation of the Root Mean Square Error (CV(RMSE)) measures, as derived from the simulation and compared monthly energy consumption. The derived values (|NMBE| = 1.7% and CV(RMSE) = 4.6%) are completely within the limits established by ASHRAE (|NMBE| ≤ 5% and CV(RMSE) ≤ 15% for monthly data), confirming the reliability and accuracy of the EnergyPlus model for the following retrofit simulations.

6. Retrofitting Towards Building Energy Requalification

Starting from the observation of the strengths and weaknesses of the building, possible retrofitting for energy requalification of the building were identified. These concern both building envelope and HVAC systems, as well as the integration of renewable energy sources. With regard to the envelope, retrofitting includes the installation of insulated sandwich panels for the roof, replacing old external windows and doors, and applying external thermal insulation on the walls. When it comes to HVAC systems, interventions concern the replacement of old air-conditioning systems with more efficient equipment and the addition of a centralized VRF system that provides more performance and flexibility. Moreover, the integration of renewable energy is included in the form of photovoltaic solar panels so that the grid electricity dependence as well as CO2 emissions can be minimized. The potential energy savings was then assessed, first by looking at each intervention on its own, and subsequently by looking at an overall intervention scenario. The measures’ cost was estimated using the CYPE Price Generator [49].

6.1. Roof Insulation

Retrofitting the existing metal roof was prioritized to enhance thermal comfort on the top floor and to reduce both heating and cooling energy demands. The measure involved the removal of the existing metal sheets, the mounting of insulated sandwich panels (galvanized steel–polyurethane–galvanized steel), available in markets, with a minimum 10 cm thick polyurethane (PUR) core, and the mounting of finishing tiles. The galvanized steel facings are weatherproof and structural, and the PUR insulation is of high thermal performance. A ventilated air gap was left between the insulation layer and the tiles to prevent overheating. Shaped metal tiles were proposed as a substitute for traditional clay tiles, being lighter in weight, easier to install, and less maintenance. Simulation results indicated that the new roof assembly has a thermal transmittance of 0.265 W/m2·K, which significantly improves the envelope thermal performance. The parameters and results of this measure are summarized in Table 8.
Table 8 determines the energy efficiency and monetary indicators of a roof insulation action considering global average electricity price. While the energy saved annually is the same at 10,032 kWh/year and CO2 emissions saved is the same at 6.8 tCO2/year, the cost saved annually and payback period vary considerably due to the differences in electricity prices. For the global average cost of electricity utilized of 0.19 USD/kWh, cost savings every year are substantially higher at ≈1906 USD/year, resulting in the payback period of just 7.5 years. This indicates that economic justification for energy efficiency measures greatly depends upon electricity costs, whereas the environmental benefits remain identical.

6.2. Openings Replacement

The second envelope intervention was to substitute the original single-glazed wooden doors and windows, in poor state, with aluminum frames that incorporate thermal breaks and double-glazed, low-emissivity, argon gas-filled glass. With this intervention, there was a significant improvement in thermal performance. U-values were lowered from over 6.3 W/m2K to around 1.7 W/m2K, depending on the frame type. The global performance impacts and associated costs of this retrofit measure are given in Table 9.
Table 9 presents the energy performance and monetary indicators of an intervention on a building envelope with a total area of approximately 130 m2. The U-value decreases from 4.1–6.3 W/m2K to 1.5–1.75 W/m2K after the intervention. The electricity savings per year is still 3627 kWh/year, corresponding to savings of CO2 emissions of 2467 kgCO2/year and primary energy savings of 9068 kWhp/year (≈0.87 toe). With an assumed global average cost of electricity as 0.19 USD/kWh, the savings in cost per year increases to ≈688 USD/year, with the payback period being 111 years. While slightly longer, this illustrates how the economic returns on energy efficiency are highly sensitive to the cost of electricity, while the environmental benefits are always the same.

6.3. Exterior Thermal Insulation of the Building Envelope

The outside wall’s thermal insulation targets the building’s north-, east-, and west-facing façades and is undertaken in conjunction with door and window replacement in order to prevent thermal bridges and loss of continuity of insulation. As an example, the current wall is a double brick wall with a total thickness of 480 mm and made up of an inner plaster coat (10 mm, λ = 0.7 W/m·K), a first brick coat (190 mm, λ = 0.72 W/m·K), an air cavity (50 mm, λ = 0.18 W/m·K), and a second brick coat (220 mm, λ = 0.72 W/m·K), finished off with an outer plaster coat (10 mm, λ = 0.7 W/m·K). The intervention provides 80 mm thick EPS insulation panels (λ = 0.036 W/m·K, R = 2.22 m2·K/W) above the outer wall and includes thermal bridge corrections with EPS at window frame and balcony points to prevent condensation and mold. Opaque panels on the north façade are replaced with brick units to ensure wall continuity. Together, the layers reduce the mean wall transmittance from 1.38 W/m2Kto 0.33 W/m2K. To supplement this technical assessment, a full cost analysis of the levels of insulation was carried out, specifying the surface area of all of the wall types and the associated investment. These are presented in Table 10.
Table 11 shows that the wall insulation retrofit significantly improves the thermal performance of the building by reducing annual electricity demand by 7920 kWh. While the savings in energy are considerable, the financial returns are very sensitive to electricity prices: with international prices (0.19 USD/kWh), it is about 12.2 years. Regardless of costs, the retrofit ensures certain environmental advantages of saving about 5.39 tons CO2 emissions and 19,800 kWh primary energy per year. Overall, the intervention is highly energy-efficient and environmentally valuable, but economic feasibility is greatly contingent on electricity price.

6.4. Replacement of Conventional Air-Conditioning Units Integrating High-Efficiency Heat Pumps

The replacement of conventional split-type air conditioners with high-efficiency heat pumps was selected as the initial energy efficiency upgrade intervention in the building. The previous equipment had relatively lower performance ratings, whereas the new equipment offers higher Energy Efficiency Ratio (EER) and Coefficient of Performance (COP), ensuring better performance for the cooling and heating seasons.
The intervention involved the substitution of 10 units, each having a cooling capacity of 3.6 kW and a heating capacity of 4.1 kW. A more detailed breakdown of the units that were substituted appears in Table 12.
The intervention generates quantifiable but moderate energy savings of 3855 kWh/year that translates to 5% of the building’s total electricity use. The savings are greater in the heating season (11%) due to the higher COP of the new units, while cooling accounts for about 5%. Table 13 summarizes the energy, environmental, and economic performance of the intervention in terms of both local and international electricity prices (Table 13).
The results show that the economic payback time varies substantially according to the energy price scenario. Using the international average price of electricity (0.19 USD/kWh), the annual savings are about 3855 kWh/year, the payback is around 19 years, which compares better with the lifetime of the equipment. Apart from its economic advantage, the intervention additionally presents clear environmental benefits, with savings of ≈2.62 tCO2/year and 0.92 toe/year of primary energy, depicting its relevance from the aspect of sustainability and energy transition.

6.5. Installation of a VRF System

The second intervention scenario is the replacement of installed decentralized heat pump units with a Variable Refrigerant Flow, or VRF, system. This system provides high-end zonal control that can only offer the amount of refrigerant needed in every zone. This makes the system more efficient since the energy use of heating and cooling is maximized compared to traditional split units. The technical characteristics of the VRF system are presented in Table 14.
The VRF system allows substantial energy saving. During the heating mode, electricity usage is reduced by 5220 kWh/year, i.e., by 20%, and during the cooling mode, there are savings of 3870 kWh/year, i.e., 21% less. As a whole, the intervention achieves total annual savings of 9090 kWh, which corresponds to some 11% of the whole annual electricity use in the building (82,636 kWh).
The investment cost of the VRF system is estimated at USD 124,171. The economic and environmental effectiveness of the intervention was measured using the global average price of electricity (0.19 USD/kWh [50]). The results are given in Table 15.
The results show that the VRF system realizes gigantic energy and environmental advantages, saving around 6.18 tCO2/year and 2.17 toe/year (≈22,725 kWhp/year) of primary energy. The economic payback time remains exceedingly long for global electricity price scenarios—it is about 106 years.
This implies that while the VRF system has evident technical and environmental advantages, it remains economically unsustainable within the current Algerian economic context, in which energy prices remain highly subsidized.

6.6. Installation of a PV System

The last intervention is related to the implementation of a solar photovoltaic (PV) system to partially offset the building’s reliance on grid power, which is solely non-renewable in the area. The system proposed comprises 60 silicon monocrystalline modules, with an installed capacity of 10.8 kWp, installed on the roof facing south, which is completely unobstructed to maximize year-round exposure to the sun.
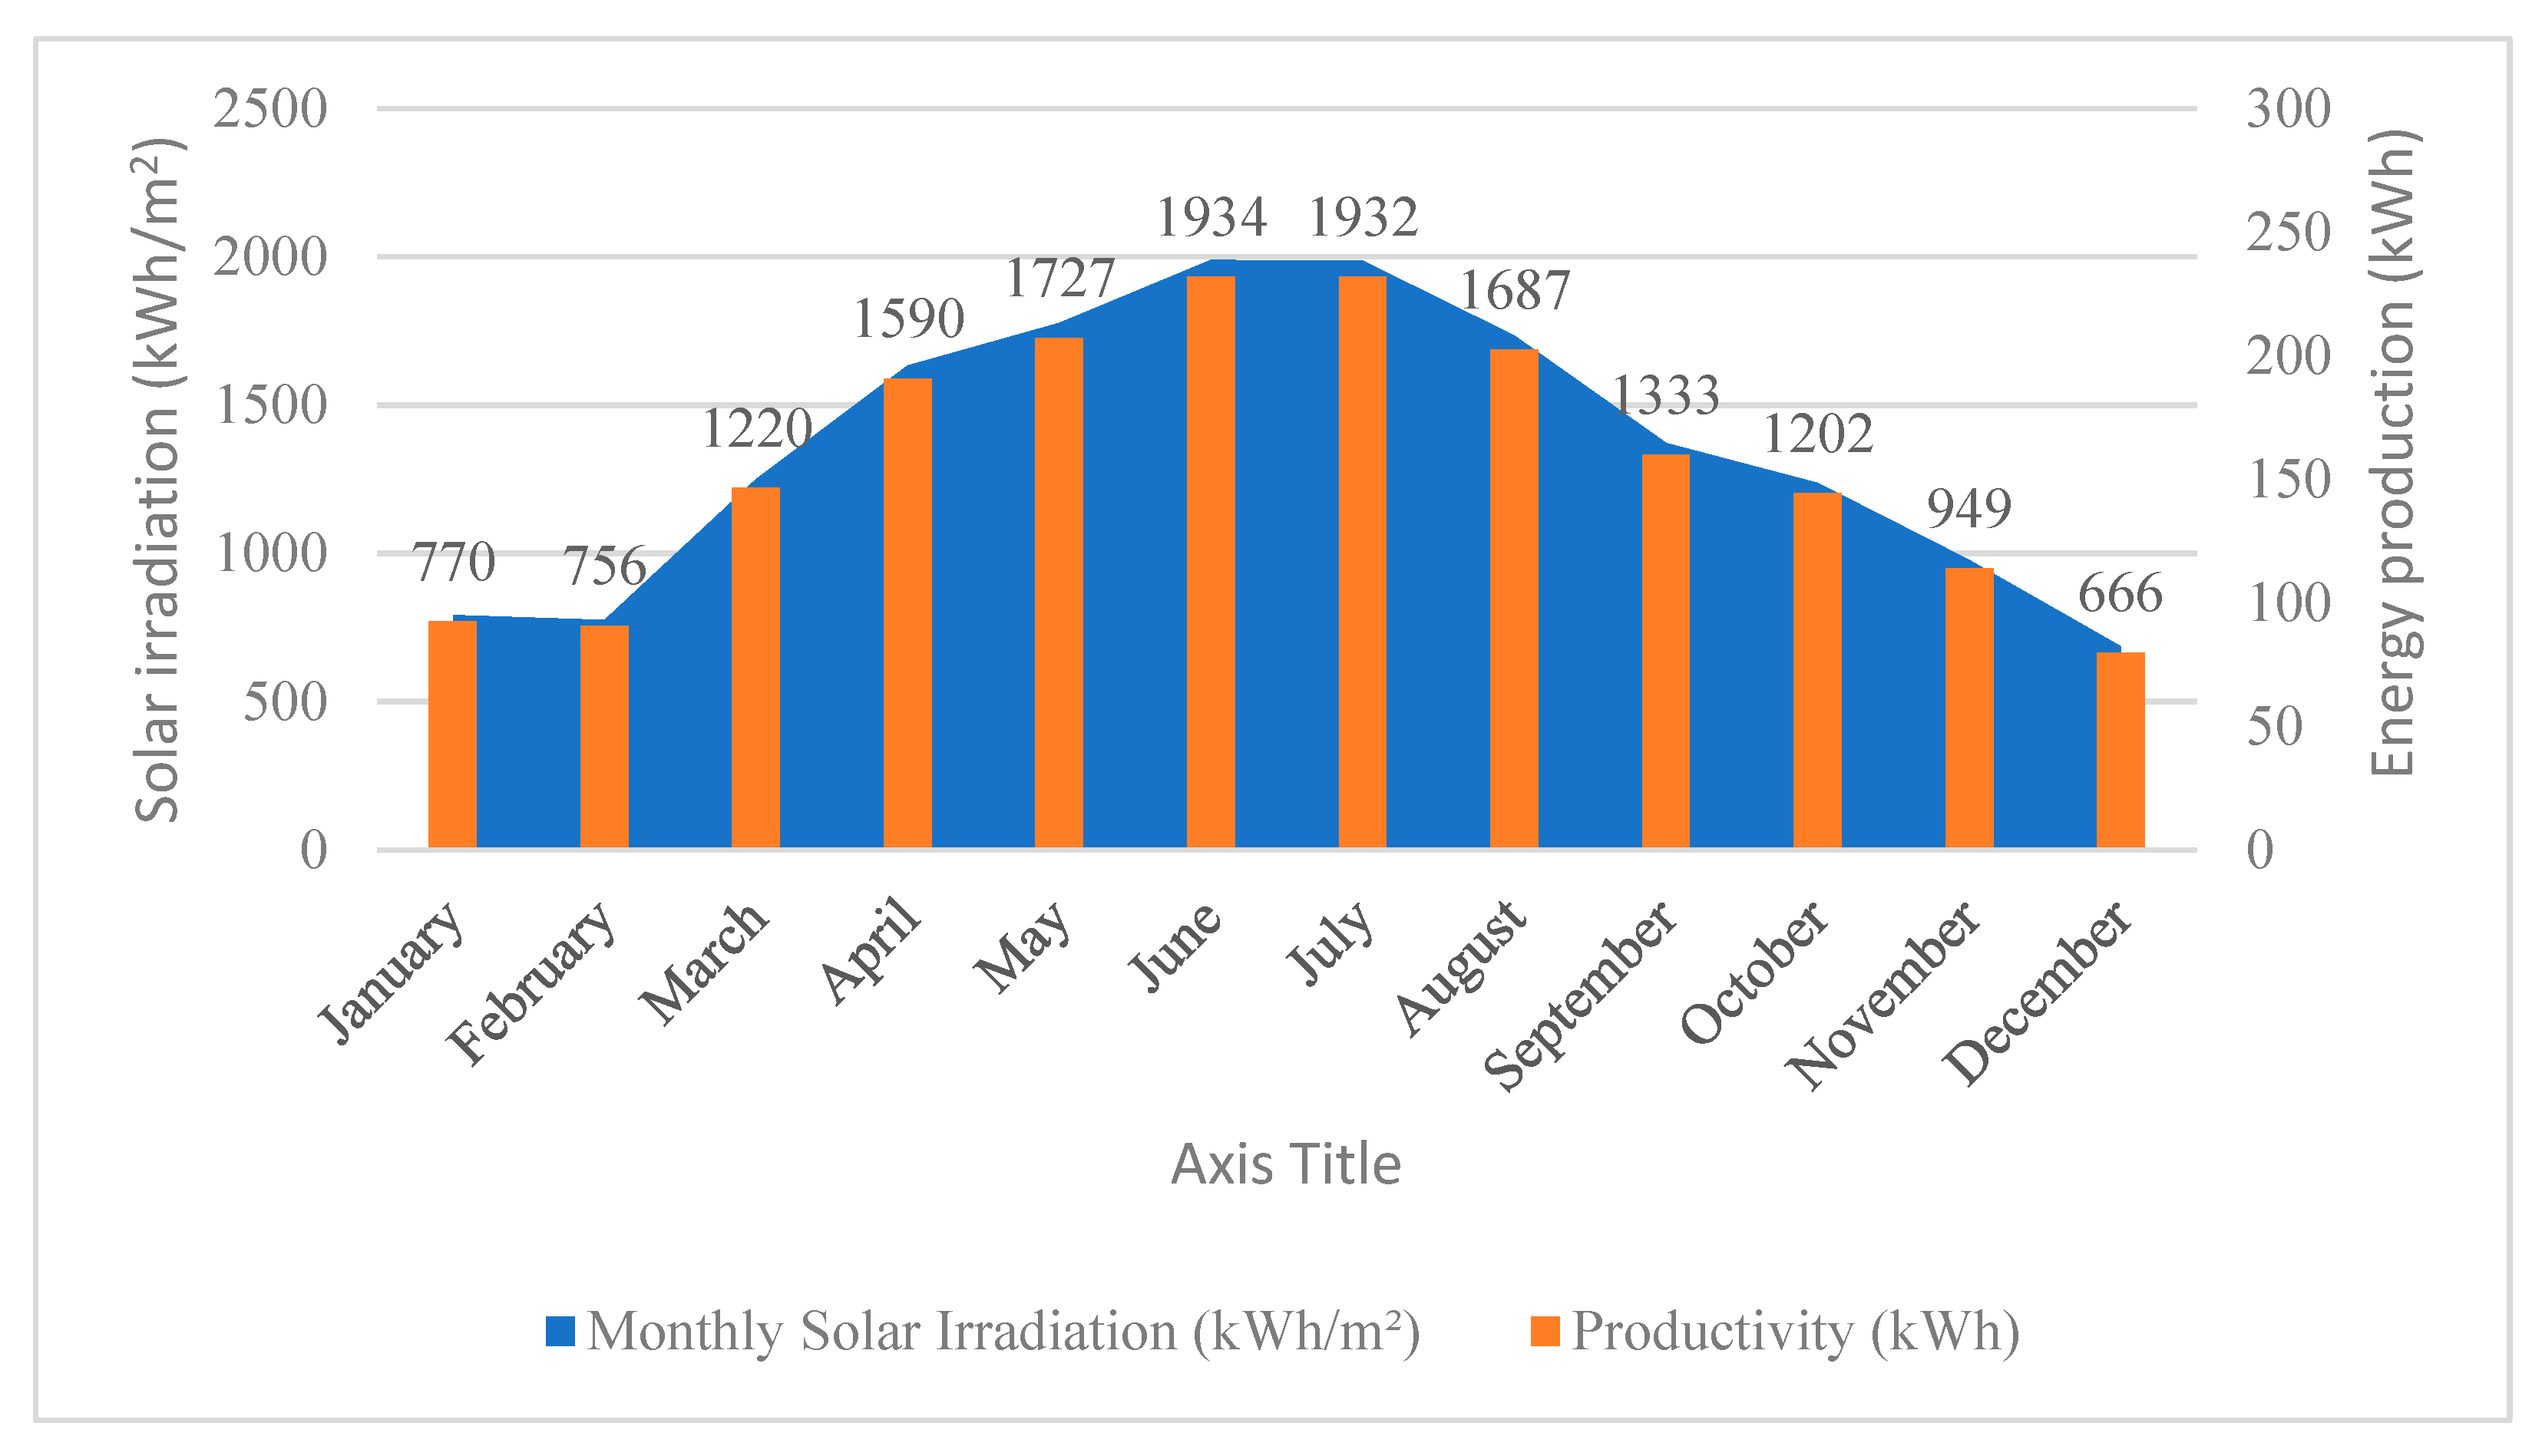
Based on solar irradiation conditions of the region, simulation indicates that the system can produce approximately 15,766 kWh/year, which represents 19% of the building’s total annual electricity load (Figure 10). This significantly reduces the building’s dependence on the national grid as well as maximizes the share of renewables in its energy mix.
The total investment cost of the system is around USD 19,070. An overview of energy savings, cost savings, and payback period in relation to the international average electricity price (0.19 USD/kWh) is presented in Table 16.
The results show that the PV system pays a significant contribution to generating renewable electricity, providing nearly one-fifth of the building’s total annual energy requirement. The monetary aspect shows that for the annual savings estimated under internationally prevailing prices of electricity, the annual savings remain nearly as high as USD 3000 and the payback time is around 6 years.
Environmentally, the system has substantial gains, avoiding around 10.72 tCO2/year and saving 0.76 toe/year (≈39,415 kWhp/year) of primary energy. This highlights its important contribution to decarbonization, although its economic benefits are limited under subsidized domestic energy prices.

7. Combined Retrofitting Scenarios

The succeeding tables depict an overview of the above measures with a focus on energy savings depicted in Table 17 and cost savings reported in Table 18 that could be obtained through the different energy efficiency measures, each estimated independently. Subsequently, the potential savings through joint adoption of the energy efficiency measures are determined. Under conditions of interference among the measures, joint adoption refers to the situation where overall savings are not the sum of the independent savings.
Table 17 and Table 18 illustrate the anticipated impact of each energy efficiency measure on electricity use, primary energy savings, and CO2 reductions, in addition to their respective economic performance. The assessment was carried out for each measure separately in order to analyze its potential contribution to overall energy efficiency in the building. These were then combined in order to analyze possible interactions among interventions, as concurrent implementation does not result in an arithmetic sum of individual savings because their impacts overlap (e.g., between HVAC upgrades and insulation). Among the envelope interventions, roof replacement (INV.1) is linked with important electricity savings (12%) at a moderate investment and a fairly short payback period (7.5 years globally). Window replacement (INV.2) is otherwise not effective at all in terms of energy savings (4%) and remains the least cost-effective one due to its high investment. Wall insulation (INV.3) is better with energy savings of around 10% and an equally well-balanced payback period (12.2 years), justifying the efficacy of combined envelope upgrades. Among the mechanical systems, replacement of a heat pump (INM.1) and VRF system installation (INM.2) also saves energy but with the price of longer payback times because they are more expensive to install. The photovoltaic system (INF.1) is optimal, offering the greatest energy and environmental payback (19% less primary energy and over 10 tons of CO2 avoided annually) and shortest payback time (6.4 years based on the international electricity price). Overall, the evaluation identifies that thoughtful coordination of chosen retrofitting options—focusing on high-return and cost-saving solutions—is the key to optimum energy efficiency, improved indoor comfort, and improved environmental sustainability for existing buildings.

7.1. Scenario 1

Now, it is considered appropriate to implement all the proposed measures simultaneously, except for the VRF system installation (INM.2), which cannot be implemented in parallel with the heat pump replacement (INM.1). The energy and cost savings resulting from Scenario 1 are presented in Table 19 and Table 20. The calculated energy and cost savings for Scenario 1 are shown in the following tables.
Scenario 1, incorporating roof replacement, opening replacement, wall insulation, heat pump replacement, and photovoltaic installation (excluding the VRF system), exhibits satisfactory energy and environmental performance but unfavorable financial attractiveness under local conditions. The retrofit achieves 34,122 kWh of electricity savings per year, equal to 41% of the baseline consumption, 8.14 toe of primary energy savings, and around 23.2 tons of CO2 avoided per year. Specific electricity consumption after the retrofit is 41.6 kWh/m2·year (18.8 for heating and 16.7 for cooling), testifying for significant efficiency gains throughout end-uses. Economically, however, despite the significant energy and emission savings, the scenario’s high up-front investment results in a long payback period at the current local electricity tariffs. At global energy prices (0.19 USD/kWh), the annual savings rise to approximately USD 6483 and the payback period shortens to 20.3 years, which greatly improves the economic attractiveness.
Scenario 1 (roof replacement, window replacement, wall insulation, heat pump replacement, and PV; no VRF) (Table 21) delivers strong energy and environmental benefits but weak financial benefit under local tariffs. Annual electricity savings reach 34,122 kWh (41%), equivalent to 8.14 toe (85,304 kWhp) and about 23.2 tCO2/year avoided. The post-retrofit specific consumption drops to 41.6 kWh/m2·year (heating 18.8, cooling 16.7), confirming effective demand reduction across end-uses.
Economically, however, the scenario saves only 984 USD/year against an investment of USD 131,579, yielding a local payback of ~134 years. When assessed at the international electricity price of $0.19/kWh, the same energy savings would produce about 6483 USD/year, shortening payback to ~20.3 years. Overall, Scenario 1 is energetically and environmentally high-impact, but financially unattractive at current local prices; its viability markedly improves under higher (international) energy prices.

7.2. Scenario 2

A second solution is considered in which a VRF system replaces the heat pumps. As per this configuration, it is feasible to install a smaller machine (50 kW power) at lower cost because the building energy needs are reduced by the retrofits on the envelope. Table 22 and Table 23 show the calculated energy and cost savings for scenario 2.
Scenario 2, which includes roof replacement, opening replacement, wall insulation, installation of VRF system, and photovoltaic panels, is more energy and environmentally efficient compared to Scenario 1. The annual total electricity savings are 44,172 kWh, which is 54% less than the baseline, 10.54 toe of primary energy savings, and 30 tons of avoided CO2 emissions annually. Economically, Scenario 2 is more enriched with energy-saving potential but involves a high investment cost (≈USD 213,500). Based on the international electricity price assumption (0.19 USD/kWh), the annual monetary savings would be approximately USD 8393, and the payback period would be approximately 25.5 years, a reasonable rate in long-term building retrofits.
In Scenario 2, the building has a total specific electricity use of 32.9 kWhe/m2, well down from the baseline. The heating load is down to 11.6 kWhe/m2, and for cooling it drops to 9.9 kWhe/m2 (Table 24). These results confirm that Scenario 2 not only reduces the overall energy consumption of the building but also optimizes energy efficiency in both heating and cooling services, demonstrating the pivotal role of envelope improvements, installation of the VRF system, and incorporation of photovoltaics.

8. Conclusions

This research explored deep energy retrofit potential of a mid-20th-century office building in Algiers with the aim of aligning building performance with Algeria’s 2030 energy efficiency and climate goals. The investigation combined an in-depth energy audit, occupant survey, and dynamic simulation using EnergyPlus to evaluate a range of envelope, HVAC system, and renewable energy measures. The approach and results taken provide a replicable decision-making aid for the energy requalification of administrative buildings built in the 1950s and 1960s that still represent a high percentage of the Algerian tertiary building stock.
The analysis reveals that the building suffers from significant thermal losses, primarily due to inadequate insulation, deteriorated façades, and outdated HVAC systems. Its baseline electricity consumption exceeds 82 MWh per year, corresponding to approximately 70 kWh/m2 annually. To address these inefficiencies, a series of targeted interventions were implemented, including roof insulation, window replacement, external wall insulation, installation of high-efficiency HVAC equipment, and the integration of PV systems. These measures led to a substantial enhancement in the building’s energy performance. Two comprehensive retrofit scenarios were evaluated at a global scale to assess both the technical feasibility and cost-effectiveness of integrated solutions.
Scenario 1, involving envelope improvement, heat pump replacement, and PV addition, resulted in a reduction in total consumption of electricity by approximately 41%, representing 34 MWh/year, equivalent to 8.14 toe of primary energy and the avoidance of over 23 tons of CO2 emissions annually. Scenario 2, in which a Variable Refrigerant Flow (VRF) system replaced the conventional heat pumps, achieved higher savings of about 54%, or 44 MWh/year, corresponding to 10.54 toe and nearly 30 tons of CO2 avoided per year. Overall, specific energy consumption after retrofit was reduced to 33–42 kWh/m2·year, indicating a significant improvement in the energy efficiency of the building and indoor comfort conditions.
From an economic perspective, while both scenarios registered significant energy and environmental benefits, financial calculation based on the current local electricity tariffs (≈0.03 USD/kWh) led to very long payback times of 134 years for Scenario 1 and 170 years for Scenario 2, making them economically unviable under present market conditions. However, when priced at global electricity rates (≈0.19 USD/kWh), the same retrofits fare much better, and payback times shorten to a little over 20–25 years. The most economical individual measures were rooftop insulation and photovoltaic systems, with global paybacks of approximately 7.5 and 6.4 years, respectively. These findings point to the sensitive reliance of retrofit viability on energy pricing policy and to the promise of tariff reform and incentive policies in achieving impact.
Aside from the quantitative findings, the research has general relevance to national climate strategy. By demonstrating that retrofitting a typical public office building from the 1950s can cut electricity use and CO2 emissions by nearly half, this research provides tangible evidence of how the building sector can contribute to Algeria’s Nationally Determined Contribution (NDC) to the Paris Agreement. The proposed retrofits are of direct applicability to the country’s commitment to reduce greenhouse gas emissions by 7% unconditionally and up to 22% with international support by 2030. Scaling up similar retrofits across the public and tertiary building stock would not only constitute a significant contribution to these national targets but also enhance energy security, comfort, and resilience in the built environment. Here, the research demonstrates how scientific research can directly support policy implementation and climate action.
Furthermore, this study demonstrates the benefit of an integrated approach incorporating envelope improvements, efficient systems, and renewable energy. The results confirm that this integrated approach provides better energy and environmental performance than any single measure. Practically, a staged implementation roadmap is recommended: prioritize PV and roof insulation first to gain prompt energy and emission advantages; proceed with selective façade insulation and high-performance glazing; and retrofit mechanical systems last as part of a broader modernization effort. Such staging would be in accordance with principles of cost optimization, resource availability, and long-term maintenance planning.

Author Contributions

Conceptualization, A.L., N.C. and A.M.; Methodology, A.L., C.M., N.C. and M.M.; Validation, A.L., M.M. and A.M.; Formal analysis, A.L., C.M. and N.C.; Investigation, A.L., C.M., N.C., M.M. and F.C.; Resources, M.M.; Data curation, C.M. and A.M.; Writing—original draft, A.L., C.M., M.M. and A.M.; Writing—review & editing, A.M.; Supervision, L.D., M.M., A.M. and F.C.; Project administration, L.D.; Funding acquisition, L.D. All authors have read and agreed to the published version of the manuscript.

Funding

This research received no external funding.

Data Availability Statement

The original contributions presented in this study are included in the article material. Further inquiries can be directed to the corresponding author.

Conflicts of Interest

The authors declare no conflicts of interest.

Nomenclature

For clarity and consistency, the main symbols and acronyms used throughout the paper are summarized in Nomenclature. These terms are adopted in the following sections, particularly within the methodology, simulation model, and discussion.
Symbol/AcronymDefinitionUnit/Description
ASurface aream2
CDDCooling Degree Days°C·day
CO2Carbon dioxide emissions
COPCoefficient of Performance
CV(RMSE)Coefficient of Variation of the Root Mean Square Error%
EUIEnergy Use IntensitykWh/m2·year
INVEnvelope retrofitsINV.1: Roof replacement;
INV.2: Openings replacement;
INV.3: Wall insulation
INMMechanical installationsINM.1: Replacement of heat pumps;
INM.2: Installation of VRF system
INF
N/A
Renewable energy measures
Not Available
INF.1: Installing photovoltaics
NMBENormalized Mean Bias Error%
PVPhotovoltaic system
SHGCSolar Heat Gain Coefficient
U-valueThermal transmittanceW/m2K
VRFVariable Refrigerant Flow System

References

  1. International Energy Agency (IEA). Global Status Report for Buildings and Construction 2023; IEA Publications: Paris, France, 2023; Available online: https://globalabc.org/sites/default/files/2024-11/global_status_report_buildings_construction_2023.pdf (accessed on 15 December 2024).
  2. García-Martín, E.; Pérez-Lombard, L. Advanced Retrofit Strategies for Improving Energy Efficiency in Non-Residential Buildings. Appl. Energy 2023, 335, 119976. [Google Scholar] [CrossRef]
  3. Fernandes, J.; Santos, M.C.; Castro, R. Introductory Review of Energy Efficiency in Buildings Retrofits. Energies 2021, 14, 8100. [Google Scholar] [CrossRef]
  4. Pérez-Lombard, L.; Ortiz, J.; Maestre, I.R. The Map of Energy Flow in HVAC Systems. Appl. Energy 2011, 88, 5020–5031. [Google Scholar] [CrossRef]
  5. Trencher, G.; van der Heijden, J. Instrument Interactions and Relationships in Policy Mixes: Achieving Complementarity in Building Energy Efficiency Policies in New York, Sydney and Tokyo. Energy Res. Soc. Sci. 2019, 54, 34–45. [Google Scholar] [CrossRef]
  6. Rezazadeh, A.A.; Alizadeh, S.; Avami, A.; Kianbakhsh, A. Integrated analysis of energy-pollution-health nexus for sustainable energy planning. J. Clean. Prod. 2022, 356, 131824. [Google Scholar] [CrossRef]
  7. Brambilla, A.; Salvalai, G.; Imperadori, M.; Sesana, M.M. Almost Zero Energy Building Refurbishment: From Energy Efficiency to Environmental Efficiency, a Pilot Case Study. Energy Build. 2018, 166, 258–269. [Google Scholar] [CrossRef]
  8. D’Agostino, D.; Parker, D.; Zangheri, P.; Castellazzi, L. Criteria and Structure of a Harmonised Data Collection for NZEBs Retrofit Buildings in Europe. Energy Procedia 2017, 140, 170–181. [Google Scholar] [CrossRef]
  9. Bekele, A.; Atakara, Y. Residential Building Energy Conservation in Mediterranean Climate Zone by Integrating Passive Sol ar and Energy Efficiency Design Strategies. Renew. Energy 2023, 13, 1073. [Google Scholar]
  10. Resende, J.; Corvacho, H. Optimisation of Nearly Zero Energy Building Envelope for Passive Thermal Comfort in Southern Europe. Buildings 2024, 14, 2757. [Google Scholar] [CrossRef]
  11. Chantzis, G.; Giama, E.; Papadopoulos, A.M. Building Energy Flexibility Assessment in Mediterranean Climatic Conditions: The Case of a Greek Office Building. Appl. Sci. 2023, 13, 7246. [Google Scholar] [CrossRef]
  12. Gouveia, J.P.; Aelenei, L.; Aelenei, D.; Ourives, R.; Bessa, S. Maximizing the Energy Performance of Public Buildings in the Mediterranean Climate using a Decision Support Tool. Energies 2024, 17, 1105. [Google Scholar] [CrossRef]
  13. Brunoro, S. Passive Envelope Strategies for Improving Energy Efficiency in the Energy Retrofit of Italian Buildings. Buildings 2024, 14, 2128. [Google Scholar] [CrossRef]
  14. Niveditha, N.; Singaravel, M.M.R. Optimal Sizing of Hybrid PV–Wind–Battery Storage System for Net Zero Energy Buildings to Reduce Grid Burden. Appl. Energy 2022, 324, 119713. [Google Scholar] [CrossRef]
  15. Asif, M.; Ahmed, W.; Alazazmeh, A. Energy Performance Assessment of a Post-Retrofit Office Building Using Measurement and Verification Protocol: A Case Study from KSA. Energy Rep. 2023, 9, 1366–1379. [Google Scholar] [CrossRef]
  16. Oliveira, C.C.; Vaz, I.C.M.; Ghisi, E. Retrofit strategies to improve energy efficiency in buildings: An integrative review. Energy Build. 2024, 321, 114624. [Google Scholar] [CrossRef]
  17. Taheri, S.; Norouzjajarm, E.; Amiri Athar, A. Technical, Economic, and Environmental Study of Energy Audit and Optimization in the Mechanical Room of an Office Building. Energy Sustain. Dev. 2025, 87, 101717. [Google Scholar] [CrossRef]
  18. Danial, C.E.; Mahmoud, A.H.A.; Tawfik, M.Y. Methodology for Retrofitting Energy in Existing Office Buildings Using Building Information Modelling Programs. Ain Shams Eng. J. 2023, 14, 102175. [Google Scholar] [CrossRef]
  19. Bosu, I.; Mahmoud, H.A.; Hassan, H.H. Energy Audit and Management of an Industrial Site Based on Energy Efficiency, Economic, and Environmental Analysis. Appl. Energy 2023, 333, 120619. [Google Scholar] [CrossRef]
  20. Thomsen, K.E.; Rose, J.; Mørck, O.; Jensen, S.Ø.; Østergaard, I. Energy Consumption in an Old Residential Building Before and After Deep Energy Renovation. Energy Procedia 2015, 78, 2358–2365. [Google Scholar] [CrossRef]
  21. Selim, O.M.; Abousabae, M.; Hasan, A.; Amano, R.S. Analysis of Energy Savings and CO2 Emission Reduction Contribution for Industrial Facilities in USA. J. Energy Resour. Technol. 2021, 143, 082303. [Google Scholar] [CrossRef]
  22. Kluczek, A.; Olszewski, P. Energy Audits in Industrial Processes. J. Clean. Prod. 2017, 142, 3437–3453. [Google Scholar] [CrossRef]
  23. Roaf, S.; Nicol, F. Running Buildings on Natural Energy: Design Thinking for a Different Future. Archit. Sci. Rev. 2017, 60, 145–149. [Google Scholar] [CrossRef]
  24. Chan, M.; Arriola, E.; Cuevas, R., III; Reyes, J.G. Development of an Energy Audit Working Procedure for an Academic University Office Building in the Philippines. ASEAN Eng. J. 2021, 11, 88–95. [Google Scholar] [CrossRef]
  25. Ghadi, Y.Y.; Baniyounes, A.M. Energy Audit and Analysis of an Institutional Building under Subtropical Climate. Int. J. Electr. Comput. Eng. 2018, 8, 845–852. [Google Scholar] [CrossRef]
  26. Merabtine, A.; Maalouf, C.; Hawila, A.A.W.; Martaj, N.; Polidori, G. Building Energy Audit, Thermal Comfort, and IAQ Assessment of a School Building: A Case Study. Build. Environ. 2018, 145, 62–76. [Google Scholar] [CrossRef]
  27. Sadati, S.E.; Rahbar, N.; Kargarsharifabad, H. Energy Assessment, Economic Analysis, and Environmental Study of an Iranian Building: The Effect of Wall Materials and Climatic Conditions. Sustain. Energy Technol. Assess. 2023, 56, 103093. [Google Scholar] [CrossRef]
  28. Zhang, Y.; Teoh, B.K.; Zhang, L. Data-Driven Optimization for Mitigating Energy Consumption and GHG Emissions in Buildings. Environ. Impact Assess. Rev. 2024, 107, 107571. [Google Scholar] [CrossRef]
  29. Rahman, M.M.; Rasul, M.G.; Khan, M.M.K. Energy Conservation Measures in an Institutional Building in Sub-Tropical Climate in Australia. Appl. Energy 2010, 87, 2994–3004. [Google Scholar] [CrossRef]
  30. Lawal, O.A.; Jimoh, A.A.; Abdullah, K.A.; Bello, B.A.; Awoyemi, E.D. Economic and Environmental Impact of Energy Audit and Efficiency: A Report from a Nigeria Household. Energy Sustain. Dev. 2024, 79, 101387. [Google Scholar] [CrossRef]
  31. Harkouss, F.; Fardoun, F.; Biwole, P.H. Passive Design Optimization of Low Energy Buildings in Different Climates. Energy Build. 2018, 174, 309–322. [Google Scholar] [CrossRef]
  32. Kim, Y.K.; Abdou, Y.; Abdou, A.; Altan, H. Indoor Environmental Quality Assessment and Occupant Satisfaction: A Post-Occupancy Evaluation of a UAE University Office Building. Buildings 2022, 12, 986. [Google Scholar] [CrossRef]
  33. Mengual Torres, S.G.; May Tzuc, O.; Aguilar-Castro, K.M.; Castillo Téllez, M.; Ovando Sierra, J.; Cruz-y Cruz, A.R.; Barrera-Lao, F.J. Analysis of Energy and Environmental Indicators for Sustainable Operation of Mexican Hotels in Tropical Climate Aided by Artificial Intelligence. Buildings 2022, 12, 1155. [Google Scholar] [CrossRef]
  34. Mohd Ali, S.B.; Hasanuzzaman, M.; Rahim, N.A.; Mamun, M.A.A.; Obaidellah, U.H. Analysis of Energy Consumption and Potential Energy Savings of an Institutional Building in Malaysia. Alex. Eng. J. 2021, 60, 805–820. [Google Scholar] [CrossRef]
  35. Haddad, M.A.N.; Semmari, H.; Lekhal, M.C.; Imessad, K.; Amara, M.; Derradji, L. Optimization of Building Energy Performance through Passive Design Measures in the Mediterranean Climate. Int. J. Ambient. Energy 2023, 44, 789–810. [Google Scholar] [CrossRef]
  36. Errebai, F.B.; Derradji, L.; Amara, M. Thermal Behaviour of a Dwelling Heated by Different Heating Systems. Energy Procedia 2017, 107, 144–149. [Google Scholar] [CrossRef]
  37. Ministry of Energy and Mines. National Energy Balance 2022; Ministry of Energy and Mines: Algiers, Algeria, 2022. Available online: https://www.energy.gov.dz/?article=bilan-energetique-national-du-secteur (accessed on 15 December 2024).
  38. Magraoui, C.; Derradji, L.; Hamid, A.; Oukaci, S.; Limam, A.; Merabtine, A. A Smart Roller Shutters Control for Improved Thermal Comfort and Sustainable Energy Efficiency in Office Buildings. Sustainability 2025, 17, 2116. [Google Scholar] [CrossRef]
  39. Konstantinou, T.; Knaack, U. Refurbishment of Residential Buildings: A Design Approach to Energy-Efficiency Upgrades. Procedia Eng. 2011, 21, 666–675. [Google Scholar] [CrossRef]
  40. Medeiros, M.H.F.; Andrade, J.J.O.; Helene, P. Durabilidade e vida útil das estruturas de concreto. In Concrete: Science and Technology; IBRACON: São Paulo, Brazil, 2011; pp. 154–196. [Google Scholar]
  41. Chabane, N.; Mokhtari, A.M.; Kacemi, M.; Zouaoui, R. A Sustainable Multi-Criteria Optimization Approach for the Energy Retrofit of Collective Housing in Algeria Using the ELECTRE III Tool. Sustainability 2025, 17, 4273. [Google Scholar] [CrossRef]
  42. EN 16247-2:2022; Energy Audits—Part 2: Buildings. CEN: Brussels, Belgium, 2022.
  43. Taka Nadifa Program. Renewable Energy and Energy Efficiency in Algeria: EU–Algeria Partnership Document: Algiers, Algeria. 2023. Available online: https://www.lnr-dz.com/2023/05/04/taka-nadifa-un-modele-de-reussite-avec-lue/#:~:text=Le%20programme%20%C2%ABTaka%20Nadifa%C2%BB%2C%20dont%20la%20grande%20partie,est%20possible%20d%E2%80%99int%C3%A9grer%20dans%20le%20syst%C3%A8me%20%C3%A9lectrique%20alg%C3%A9rien (accessed on 15 December 2024).
  44. Infoclimat. Weather Data Portal. Available online: https://www.infoclimat.fr (accessed on 15 December 2024).
  45. APRUE; GIZ. Guide pour une Construction Éco-Énergétique en Algérie; APRUE: Algiers, Algeria; GIZ: Eschborn, Germany, 2020; Available online: https://www.academia.edu/34739223/Guide_Construction_Eco_%C3%A9nerg%C3%A9tique_APRUE_GIZ (accessed on 18 February 2025).
  46. Ascione, F.; Bianco, N.; De Masi, R.F.; de’ Rossi, F.; Vanoli, G.P. Energy retrofit of an educational building in the ancient center of Benevento: Feasibility study of energy savings and respect of the historical value. Energy Build. 2015, 95, 172–183. [Google Scholar] [CrossRef]
  47. Ma, Z.; Cooper, P.; Daly, D.; Ledo, L. Existing Building Retrofits: Methodology and State-of-the-Art. Energy Build. 2012, 55, 445–457. [Google Scholar] [CrossRef]
  48. ASHRAE Guideline 14-2014: Measurement of Energy, Demand, and Water Savings. Available online: https://webstore.ansi.org/preview-pages/ASHRAE/preview_ASHRAE%2BGuideline%2B14-2014.pdf (accessed on 15 December 2024).
  49. CYPE Ingenieros S.A. Price Generator. Available online: https://www.generadordeprecios.info (accessed on 15 December 2024).
  50. Global Average Residential Electricity Price, 2025, in 2013-Adjusted USD. Available online: https://www.in2013dollars.com (accessed on 15 December 2024).
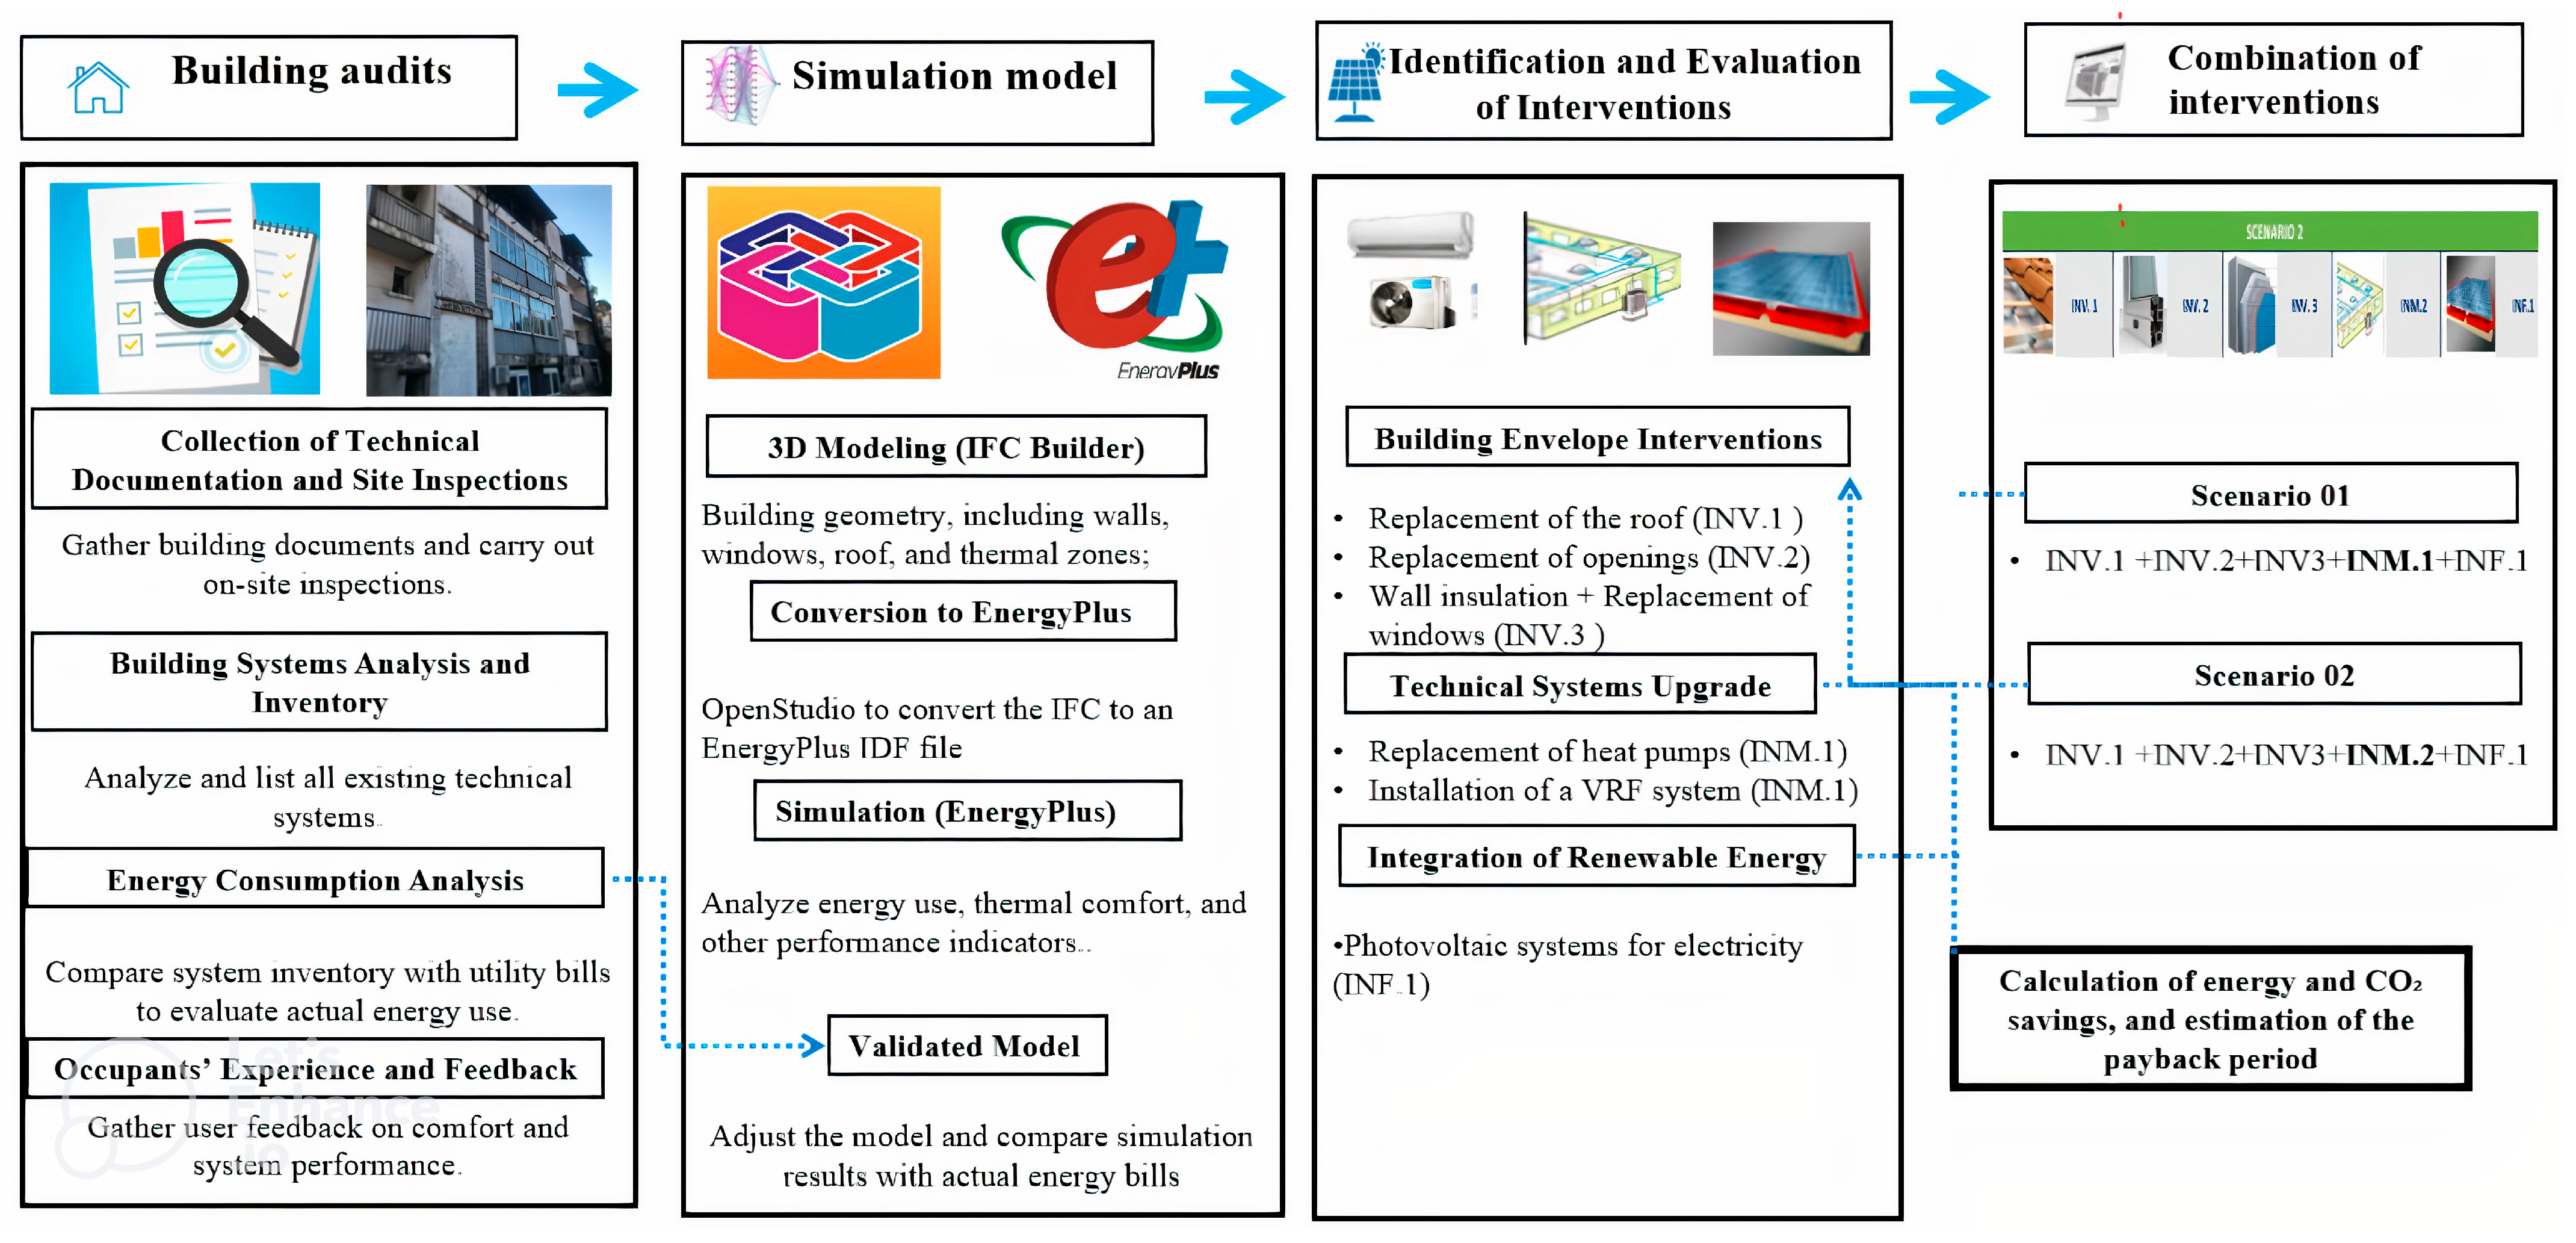
Figure 1. Schematic diagram of the adopted methodology.
Buildings 15 04247 g001
Figure 2. View of the building: (a) south-oriented main facade, (b) north façade.
Buildings 15 04247 g002
Figure 3. Building plans.
Buildings 15 04247 g003
Figure 4. Three-year averaged weather data: (a) averaged outdoor temperature and HDD; (b) averaged outdoor temperature and CDD [44].
Buildings 15 04247 g004
Figure 5. Three-year monthly electricity consumption.
Buildings 15 04247 g005
Figure 6. Average share of the three-year monthly electricity consumption by energy end-use.
Buildings 15 04247 g006
Figure 7. The adopted workflow.
Buildings 15 04247 g007
Figure 8. Predicted electricity consumption for heating.
Buildings 15 04247 g008
Figure 9. Energy demand and energy supplied by the heat pump serving one of the offices on the top floor.
Buildings 15 04247 g009
Figure 10. Electricity production by the PV System during the year.
Buildings 15 04247 g010
Table 1. Summary of previous studies on building retrofitting.
StudyCountry/ClimateBuilding TypeRetrofit MeasuresKey Findings
Bekele & Atakara [9]Turkey/MediterraneanResidentialThick walls, shading, natural ventilation−34.7% energy demand
Resende & Corvacho [10]Southern Europe/nZEBResidentialEnvelope optimisation for passive thermal comfort (insulation, glazing, shading strategies)Improved passive thermal comfort and reduced cooling energy needs through optimised nZEB envelope design
Chantzis et al. [11]GreeceResidentialThermal mass + variable-speed heat pumpsEnhanced flexibility
Gouveia et al. [12]PortugalPublicDecision-support tool (PrioritEE)CO2 and cost savings
Brunoro et al. [13]ItalySuburbanPassive envelope retrofitsEnvelope = 50% of losses
Niveditha and Singaravel [14]GlobalOfficePV–wind hybridUp to 60% CO2 reduction
Asif et al. [15]Saudi ArabiaOfficePV + efficiency package−21% EUI, 6-year payback
Oliveira et al. [16]PortugalOfficeEnvelope + HVAC + lightingEnergy and cost savings
Taheri et al. [17]IranOfficeLow-cost + smart measures53.8% energy savings
Danial et al. [18]GlobalOfficeBIM-based simulation−68% energy, LEED certified
Bosu et al. [19]EgyptIndustrialPV integration51% demand covered
Thomsen et al. [20]EgyptIndustrialPV + control optimization3-year payback
Selim et al. [21]EgyptIndustrialEnergy audits98 M kWh savings
Kluczek & Olszewski [22]PolandIndustrialAudits and retrofits5–70% savings
Roaf et al. [23]GlobalUrbanPassive cooling and ventilationImproved resilience
Chan et al. [24]PhilippinesUniversityLED and inverter systems63% cooling reduction
Ghadi et al. [25]AustraliaMixedClimate-sensitive loadsDemand-weather link
Merabtine et al. [26]FranceSchoolsEnergy audits142 kWh/m2·year
Sedati et al. [27]Multi-climateFaçadeMaterial optimization−26.4% loads
Zhang et al. [28]GlobalMulti-typeML model (GW-LGBM)R2 > 0.9, −37.8% energy
Rahmane et al. [29]AlgeriaSchoolHVAC + lighting−41.9% electricity
Lawal et al. [30]NigeriaOfficePV + LED + efficient pumps−48% energy, 126% ROI
Harkous et al. [31]TropicalOfficeWWR, glazing, insulation35–60% savings
Kim et al. [32]UAEUniversityPost-occupancy comfort99% > comfort range
Mengual Torres et al. [33]MexicoHotelEquipment replacement9–12% savings
Mohd Ali et al. [34]MalaysiaPublicLED retrofit72–144 MWh/year
Haddad et al. [35]AlgeriaResidentialPassive optimizationImproved performance
Errebai et al. [36]AlgeriaResidentialHeating optimizationEnhanced efficiency
Table 2. Brief description of the building.
CharacteristicsDescription
LocationAlgiers, Algeria (latitude 36°44 N, longitude 03°02 E)
AreaTotal gross area (including balconies): 1.613 m2
Net usable area: 1.155 m2
Net heated area: 743 m2
Construction elementsWalls (internal and external)
Double brick wall (e = 400 mm); U-value= 1.09 (W/m2K)
Double brick wall (e = 300 mm); U-value= 1.38 (W/m2K)
Hollow brick wall (e = 200 mm); U-value= 2.08 (W/m2K)
Hollow brick wall (e = 140 mm); U-value= 2.38 (W/m2K)
Hollow brick wall (e = 100 mm); U-value= 2.94 (W/m2K)
Roof
Sloped sheet metal roof (e = 80 mm); U-value= 8.02 (W/m2K)
Floor
Lower floor (e = 370 mm); U-value= 2.17 (W/m2K)
Intermediate floors (e = 300 mm); U-value= 1.38 (W/m2K)
Windows (17.61% of the total area of the envelope)
9 Aluminum double glazing; U-value= 3.34–4.70 (W/m2K) and SHGC = 0.45–0.60; 5.43% of the total area of the envelope.
15 Aluminum simple glazing; U-value= 6.23–6.74 (W/m2K) and SHGC = 0.75–0.85; 7.44%
5 Wood simple glazing; U-value= 4.99–5.93 (W/m2K) and SHGC = 0.70–0.80, 4.73%
Lighting systemMainly linear fluorescent lamps housed in ceiling fittings, compact fluorescent lamps, and spotlights. The lighting power installed in the building is 5053 W.
Building energy systemsHeating and cooling of the building are provided by air-to-air heat pump systems, some of mono-split type with indoor and outdoor units, others of monobloc type mounted under the windows, manually operated by occupants.
Based on the opening hours of the building and on the insights coming from the building model (validated with the actual energy bills of the last three years), these systems are assumed to operate from Sunday to Thursday, 6 h a day for the ground floor and the two floors above, and 9 h a day for the top floor due to the very poor quality metal roof’s excess energy demand.
Table 3. Main outcomes of the user questionnaire.
OccupancyAlmost all employees occupy the building between 8:00 and 16:00, with few working between 7:00–8:00 and 16:00–18:00.
Energy sobrietyAlmost all occupants use the heating setpoint at 22 °C in winter, and over one-third of them lower their offices to 23 °C or colder during summer.
Winter thermal comfort72% of occupants are dissatisfied with indoor temperature. Two-thirds complain of cold-wall effect (mainly on north offices), and 78% experience draughts. In addition, 28% use electric convectors as supplement heating. Complaints mainly refer to temperature non-uniformity, insufficient insulation, and old windows causing air leakage.
Summer thermal comfortNatural ventilation suffices in May and October, and can be extended to June and September as the building possesses good cross-ventilation potential (if two-thirds of offices with open doors) and relatively low external noise.
Acoustic comfortLess than 38% of occupants are disturbed by environmental noise and 35% by air-conditioning noise.
Visual comfort56% of the offices are artificially lit up during the day in spite of the huge potential of natural light. In addition, 26% have sunlight glare and more than half of the offices lack blinds and curtains. Still, there are some offices that have blinds or curtains already, indicating that some of the efforts are already being made. Internal shading has therefore been identified as a correct remedial measure.
Indoor air quality40% of users observed mold, 75% high humidity, and two-thirds unpleasant odors. Notably, 90% of the windows have no air intakes to limit poor ventilation. In the absence of mechanical ventilation, occupants must rely primarily on window airing.
Table 4. Total HDD, CDD and total sunshine duration (h) over the three-year study period.
201920202021
Total HDD396331423
Total CDD124212391261
Total sunshine duration (h)281129382701
Table 5. Specific annual electricity consumption by service.
Average Electricity Consumption per Year (kWh)Total Net Area
(m2)
Specific Electricity
Consumption per Year
(kWh/m2)
Overall81,511115570.5
Lighting811511557
Equipment29,120115525.2
Heating25,98274335
Cooling18,29474324.6
Table 6. Main results of calculations.
Electricity consumption (kWh/year)81,511
Primary energy (toe/year)1945
Primary energy (kWh/year)203,778
CO2 emissions (kgCO2/year)55,449
Electricity expenses2330 USD/year
Table 7. Comparison between model and inventory consumption.
Energy UsageActual Energy Consumption (kWh)Predicted Energy Consumption (kWh)
Cooling18,29417,531
Heating25,98226,534
Equipment29,12029,815
Lighting81158201
Overall81,51182,224
Table 8. Roof intervention summary.
ParameterValue/global Electricity Price
Roof area300 m2
U-value before intervention8.022 W/m2K
U-value after intervention0.265 W/m2K
Total cost *USD 14,269
Annual electricity savings10,032 kWh/year
Annual cost savings≈1906 USD/year
CO2 emissions avoided≈6.8 tCO2/year
Primary energy savings≈25,081 kWhp/year (≈2.16 toe)
Payback period≈7.5 years
* The global average electricity price is USD 0.19 for 2025 [50].
Table 9. Window and door replacement summary.
ParameterValue (Global Average Electricity Price)
Total surface replaced~130 m2
U-value before intervention3.34 to 6.74 W/m2K
U-value after intervention1.5–1.75 W/m2K
Total cost *USD 76,445
Annual electricity savings3627 kWh/year
Annual cost savings≈688 USD/year
CO2 emissions avoided2467 kgCO2/year
Primary energy savings9068 kWhp/year (0.87 toe)
Payback period111 years
* The global average electricity price is USD 0.19 for 2025 [50].
Table 10. Cost analysis of external wall insulation.
Wall Type
Thickness
Area [m2]U_Before [W/m2K]U_After [W/m2K]Total Cost [USD]
40 cm461.001.0990.31014,611.88
20 cm45.682.0840.3791447.88
14 cm32.162.380.3901019.34
10 cm41.862.9450.3701326.80
Total Walls18,405.90
Table 11. External wall insulation summary.
ParameterValue (International/Global Electricity Price)
Wall area580.7 m2
Total cost *USD 18,406
Annual electricity savings7920 kWh/year
Annual cost savings≈1504 USD/year
CO2 emissions avoided≈5.39 tCO2/year
Primary energy savings≈19,800 kWh/year (≈1.89 toe)
Payback period≈12.2 years
* The global average electricity price is USD 0.19 for 2025 [50].
Table 12. Comparison between old and new heat pump units.
ParameterOld UnitNew Unit
Cooling Capacity (kW)3.53.6
Power Input—Cooling (kW)1.71.12
EER2.063.21
Heating Capacity (kW)3.54.1
Power Input—Heating (kW)1.81.05
COP1.953.90
Quantity to Replace (units)1010
Unit Cost *N/AUSD 1404
Total Cost *N/AUSD 14,043
* The global average electricity price is USD 0.19 for 2025 [50].
Table 13. Energy and Environmental Performance of the Intervention of replacement of conventional air-conditioning units.
IndicatorValue (International/Global Electricity Price)
Annual Electricity Savings3855 kWh/year
% of Total Building Consumption5%
Heating Savings11%
Cooling Savings5%
Energy Cost Savings *≈732 USD/year
CO2 Emissions Reduction≈2.62 tCO2/year
Primary Energy Savings≈0.92 toe/year (≈9638 kWh/year)
Payback Period≈19 years
* The global average electricity price is USD 0.19 for 2025 [50].
Table 14. VRF Characteristics.
COPPch (W)Pr (W)EER
3.38–5.3885–103963.93
Table 15. Energy and Environmental Performance of the intervention of installation of a VRF system.
IndicatorInternational Electricity Price *
Annual Electricity Savings9090 kWh/year
% of Total Building Consumption11%
Heating Savings20%
Cooling Savings21%
Energy Cost Savings≈1727 USD/year
CO2 Emissions Reduction≈6.18 tCO2/year
Primary Energy Savings≈2.17 toe/year (≈22,725 kWhp/year)
Payback Period≈106 years
* The global average electricity price is USD 0.19 for 2025 [50].
Table 16. Energy and environmental performance of the intervention of installation of solar photovoltaic system.
IndicatorInternational Electricity Price *
Investment CostUSD 19,070
Annual Electricity Generation15,766 kWh/year
% of Total Building Consumption19%
Energy Cost Savings≈2995 USD/year
CO2 Emissions Reduction≈10.72 tCO2/year
Primary Energy Savings≈0.76 toe/year (≈39,415 kWhp/year)
Payback Period≈6.4 years
* The global average electricity price is USD 0.19 for 2025 [49].
Table 17. Summary of energy savings for individual retrofits.
CategoryRetrofitCodeAnnual Energy
Savings—Electricity (kWh)
Energy Saving Rate (%)Primary Energy Savings (kWhp)CO2 Emissions Avoided (Tonnes)
EnvelopeReplacement of the roofINV.110,03212%25,0816.8
Replacement of openingsINV.236274%90682.46
Wall insulationINV.3792010%19,8005.38
Mechanical installationsReplacement of heat pumpsINM.138555%96382.62
Installation of a VRF systemINM.2909011%22,7256.18
Renewable energyPhotovoltaic installationINF.115,76619%39,4110.72
Table 18. Summary of Cost Savings for Individual Retrofits.
CategoryCodeAnnual Savings (USD Local)Annual Savings (USD International)Investment (USD)Payback (Years)
International *
EnvelopeINV.1284190614,2697.5
INV.211768876,445111
INV.3238150418,40612.2
SystemsINM.111873214,04319
INM.22761727114,974106
RenewablesINF.1413299519,0706.4
* The global average electricity price is USD 0.19 [50].
Table 19. Energy Savings—Scenario 1.
REF.RetrofitAnnual Energy
Savings—Electricity (kWh/year)
Energy Saving Rate (%)Primary Energy (Toe/Year)Primary Energy (kWhp/Year)CO2 Emissions Avoided (kg/Year)
Scenario 1INV.1 + INV.2 + INV.3 + INM.1 + INF.134,12241%8.1485,30423,203
Table 20. Cost Savings—Scenario 1.
REF.RetrofitCost Savings (USD/Year)Investment Costs (USD)Payback Time (Local Cost) (Years)
Scenario 1INV.1 + INV.2 + INV.3 + INM.1 + INF.1984131,57920.3
Table 21. Specific electricity consumption—Scenario 1.
End-UseElectricity Consumed—After [kWh/Year]Net Area [m2]Specific Electricity Consumption [kWh/m2·Year]
Heating13,98774318.8
Cooling12,40574316.7
Total building48,102115541.6
Table 22. Energy Savings—Scenario 2.
REF.Retrofit (Scenario 2)Electricity Savings (kWh/Year)% SavingsPrimary Energy Savings (toe/Year)Primary Energy Savings (kWhp)CO2 Emissions Avoided (kg/Year)
Scenario 2INV.1 + INV.2 + INV.3 + INM.2 + INF.144,17254%10.54110,43130,037
Table 23. Cost Savings—Scenario 2.
Retrofit (Scenario 2)Cost Savings (USD/Year)Investment Costs (USD)Payback Time
(International Cost) (Years)
INV.1 + INV.2 + INV.3 + INM.2 + INF.11251213,50025.5
Table 24. Specific electricity consumption—Scenario 2.
End-Use CategoryElectricity Consumed (kWhe)Net Area (m2)Specific Electricity Consumption (kWhe/m2)
Heating859974311.6
Cooling73817439.9
Total building38,052115532.9
Disclaimer/Publisher’s Note: The statements, opinions and data contained in all publications are solely those of the individual author(s) and contributor(s) and not of MDPI and/or the editor(s). MDPI and/or the editor(s) disclaim responsibility for any injury to people or property resulting from any ideas, methods, instructions or products referred to in the content.