Article

Research on Technical Strategies for Indoor Acoustic Renovation of Multi-Purpose Gymnasiums: Scheme Demonstration and Engineering Practice Based on Existing Sound-Absorbing Ceilings

1
Department of Architectural Engineering, Dongshin University, Naju 58245, Republic of Korea
2
Architectural Acoustics Laboratory, Tsinghua University, Beijing 100084, China
3
Shenzhen International Graduate School, Tsinghua University, Shenzhen 518000, China
4
School of Urban Construction, Beijing City University, Beijing 101309, China
*
Authors to whom correspondence should be addressed.
Buildings 2025, 15(23), 4241; https://doi.org/10.3390/buildings15234241
Submission received: 27 September 2025 / Revised: 18 November 2025 / Accepted: 20 November 2025 / Published: 24 November 2025

Abstract

Multi-purpose gymnasiums are typically designed for sport events and large-scale gatherings. However, the gymnasium investigated in this study lacked sufficient consideration of acoustic performance during its design phase, resulting in severe echo problems, long reverberation time and poor speech intelligibility. These acoustic deficiencies limit its ability to host major events, reduce utilization efficiency and cannot be resolved by simply adjusting the sound reinforcement system. Conventional renovation strategies usually involve sound-absorbing materials on walls or ceilings, which are costly, labor-intensive and time-consuming. The case gymnasium discussed in this study has the particular advantage that its ceiling structure already provides partial sound absorption. To lower renovation costs and minimize construction workload, this research builds upon the existing ceiling structure and evaluates five renovation schemes through comparative analysis, proposing a renovation approach that remains economical while providing substantial performance benefits. The study calibrates the acoustic model through comparison between measurement and simulation in ODEON V16.0 software, and the validated model was further used to predict acoustic parameters under full occupancy across different schemes. Post-renovation field measurements confirm the reliability and accuracy of the proposed approach, offering a valuable reference for similar gymnasium acoustic retrofitting projects.

1. Introduction

1.1. Research Background

The university gymnasium in Korea represents a typical multi-functional venue. The first floor serves as a multipurpose activity area, while the second and third floors together provide 1272 fixed seats. During assemblies, approximately 870 additional chairs can be arranged on the first floor, increasing the total seating capacity to about 2142. Before the acoustic renovation, the gymnasium suffered from long reverberation time, pronounced echo effects, with insufficient speech clarity and intelligibility [1,2]. These acoustic deficiencies masked signals and verbal instructions, resulting in distraction and communication barriers. Moreover, a noisy indoor environment with elevated sound levels poses potential risks to the hearing and psychological well-being of long-term users [3].
In the original design, sound-absorbing treatment was applied only to the ceiling; however, due to inappropriate construction, its absorption coefficient was relatively low, resulting in minimal overall contribution to sound absorption. Conventional acoustic renovation of gymnasiums generally follows the sequence of “on-site measurement and analysis → determination of target acoustic parameters → large-scale installation of sound-absorbing materials → construction and installation → post-construction evaluation.” However, these methods are often coarse, involving high costs and extensive construction workloads.
This study proposes an economical and efficient renovation strategy that builds upon the existing absorptive ceiling by introducing additional sound-absorbing materials in strategically optimized layouts. The case study demonstrates that this method can significantly improve the acoustic environment while simultaneously reducing costs and shortening the construction period. The findings provide valuable references for the acoustic renovation of other multifunctional gymnasiums.

1.2. Literature Review

A considerable body of literature has investigated the acoustics of multipurpose gymnasiums, with research primarily focusing on the following aspects: (1) the suitability of acoustic criteria and parameters [4,5,6,7]; (2) comparative analyses between simulations and measurements [8,9,10,11,12]; (3) overall acoustic design for gymnasiums [13,14,15]; and (4) case studies and the development of acoustic design guidelines [16,17,18,19,20]. In addition, some scholars have examined absorption scheme design, acoustic parameter analysis, and comparisons between measurements and simulations in specific case studies. Representative pieces of work include the following.
Lüthi and Desarnaulds [21] measured reverberation times under 17 conditions in six gymnasiums: 14 cases with both ceilings and walls absorption, 2 cases with ceiling absorption only, and 1 case with no absorption. The results were compared with reverberation time standards from nine countries and with data from 46 publications, revealing considerable variation among national standards. The study further indicated that compliance with these standards was more readily achieved when sound-absorbing materials were applied to ceilings and the lower portions of walls. However, it did not explore the design strategies that combine existing absorption with additional materials.
Alibaba and Ozdeniz [22] studied a 38,000 m3 multifunctional hall, comparable in scale and function to the one discussed in this study. They analyzed four scenarios: Simulation 1, based on unoccupied conditions and measured absorption coefficients, showed good agreement with measurements, particularly within the 500–2000 Hz range; Simulation 2 assumed full occupancy with curtains added around the seating area, but the acoustic effect was unsatisfactory; Simulation 3 applied 50 mm pyramid-shaped melamine foam to both ceiling and wall surfaces, resulting in over-absorption and excessively short reverberation times; Simulation 4 retained only ceiling absorption panels, yielding satisfactory acoustic performance.
Kandemir and Kavraz [23] evaluated acoustic performance in a multifunctional tennis hall under unoccupied and 50% occupancy conditions for different functional uses. To mitigate excessive reverberation time, prism-shaped devices with adjustable covers were installed between the steel ceiling structures, enabling variable absorption through different configurations (90° open, 45° open, fully closed, or without covers). The simulations considered acoustic parameters such as T30, EDT, D50, C80, LF80, and STI, which were compared with target values, demonstrating the adaptability and acoustic benefits of the adjustable structures for various functional uses.
In summary, while previous research has addressed acoustic renovation in gymnasiums, case studies focusing on the optimization of design strategies that build upon existing absorptive surfaces remain limited. This study aims to fill this research gap.

2. Current Conditions of the Gymnasium and Acoustic Measurements

2.1. Existing Architectural Finishes

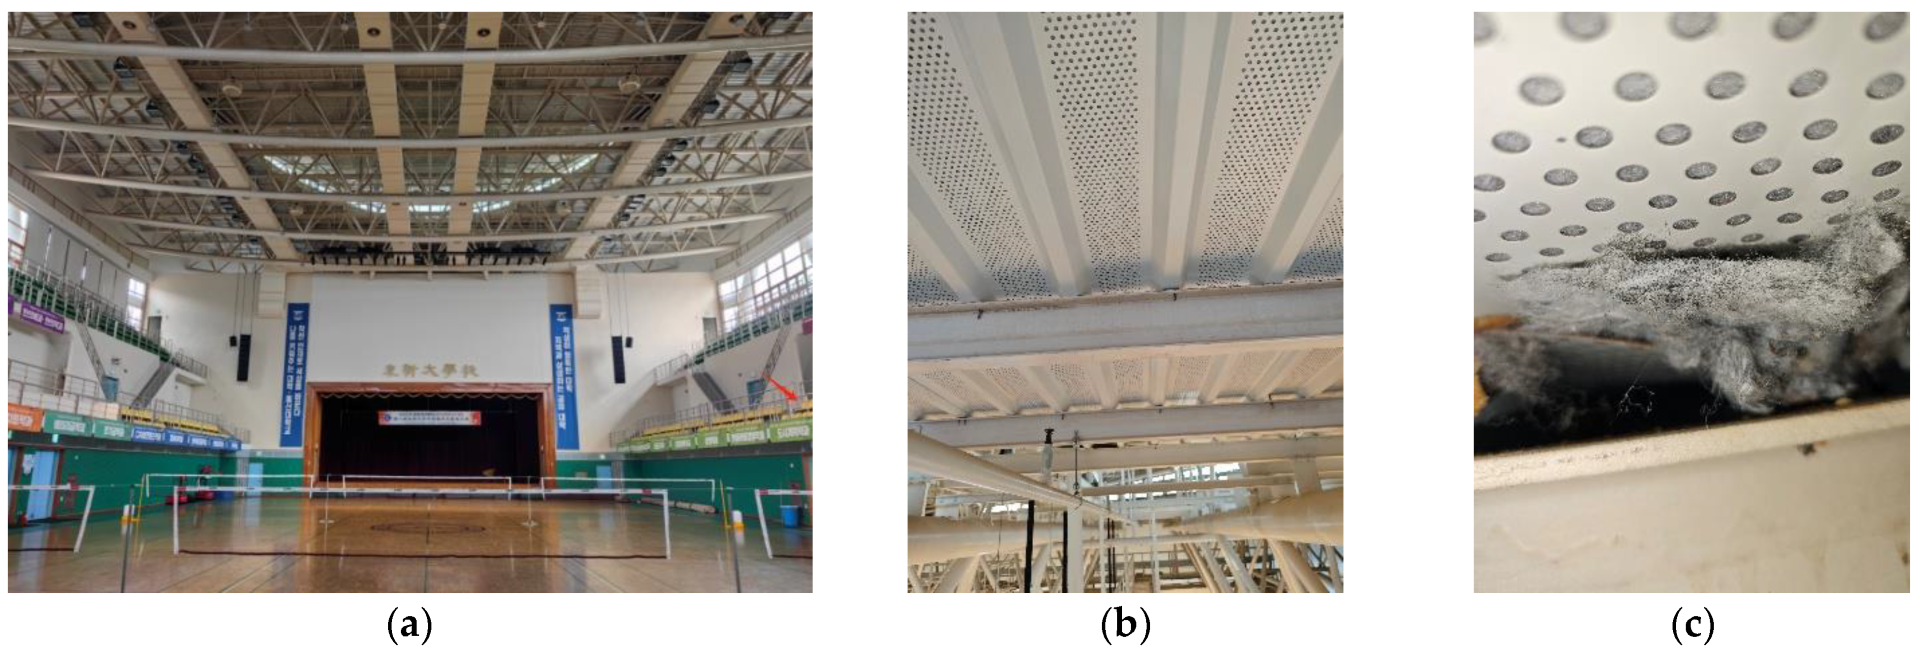
Walls: The walls of the first-floor activity area are clad with green soft PVC panels featuring concave–convex patterns. On the second and third floors, the walls of the spectator stands are primarily coated with standard white emulsion paint, except for the large glass windows on the third floor and the wall behind the rostrum. The on-site photograph is shown in Figure 1a.
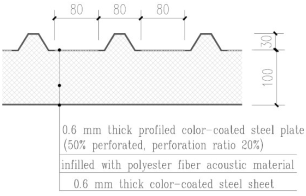
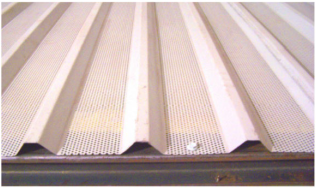
Ceiling: The ceiling consists of perforated metal panels with certain sound-absorbing capability (perforation ratio approximately 20%). A 20 mm layer of polyester fiber sound-absorbing cotton is attached behind the perforated panels. The perforated sections cover roughly half of the total ceiling area. The on-site photographs are shown in Figure 1b,c.

2.2. Acoustic Measurements of the Existing Conditions

2.2.1. Measurement Method

The gymnasium is equipped with a proscenium stage; however, the stage is relatively small. During assemblies or ceremonies, the primary sound source is located at the center of the stage. According to the measurement procedures specified in GB/T 50076-2013, Code for measurement of the reverberation time in rooms [24], and ISO 3382-1:2009, Acoustics—Measurement of room acoustic parameters—Part 1: Performance spaces [25], the impulse response integration method was employed in this study. The sound source was positioned on the central axis of the stage, 3 m behind the curtain line and 1.5 m above the floor. Due to the limited stage size, a single source was sufficient for measurement.
With the HVAC system operating, the background noise level (BNL) of the gymnasium remained below NR 25, indicating a low ambient noise condition. To ensure a sufficient impulse-to-noise ratio (INR ≥ 35 dB), large and extra-large balloons were used to generate impulse sounds through bursting, thereby achieving high sound pressure levels, especially in the low frequency range. As a result, the measured sound pressure levels at both near and far receiver positions exceeded the background noise by more than 35 dB across the 125 Hz–4000 Hz octave bands. The use of T20 for calculating the reverberation time under the above conditions is considered appropriate, since T20 is widely adopted as an evaluation parameter for reverberation time in comparable acoustic studies [12,26,27].
A Sennheiser MKH800 microphone was used for measurement, and the impulse responses were processed with DIRAC 6.0 software (Brüel & Kjær). Following the procedures specified in ISO 3382-1: 2009, several room-acoustic parameters were evaluated. Among the parameters influencing subjective perception, this study focuses on the use condition of the gymnasium for large assemblies, such as entrance or graduation ceremonies where speech intelligibility is the dominant concern. Therefore, the analysis mainly considers reverberation time (RT), definition (D50) [28], and speech transmission index (STI) [29]. Among these, RT is the most critical parameter in practical engineering, RT is closely related to D50 and STI [30]; thus, this study primarily evaluates RT, with D50 and STI serving as supplementary indicators for technical assessment and validation.

2.2.2. Measurement Point Arrangement

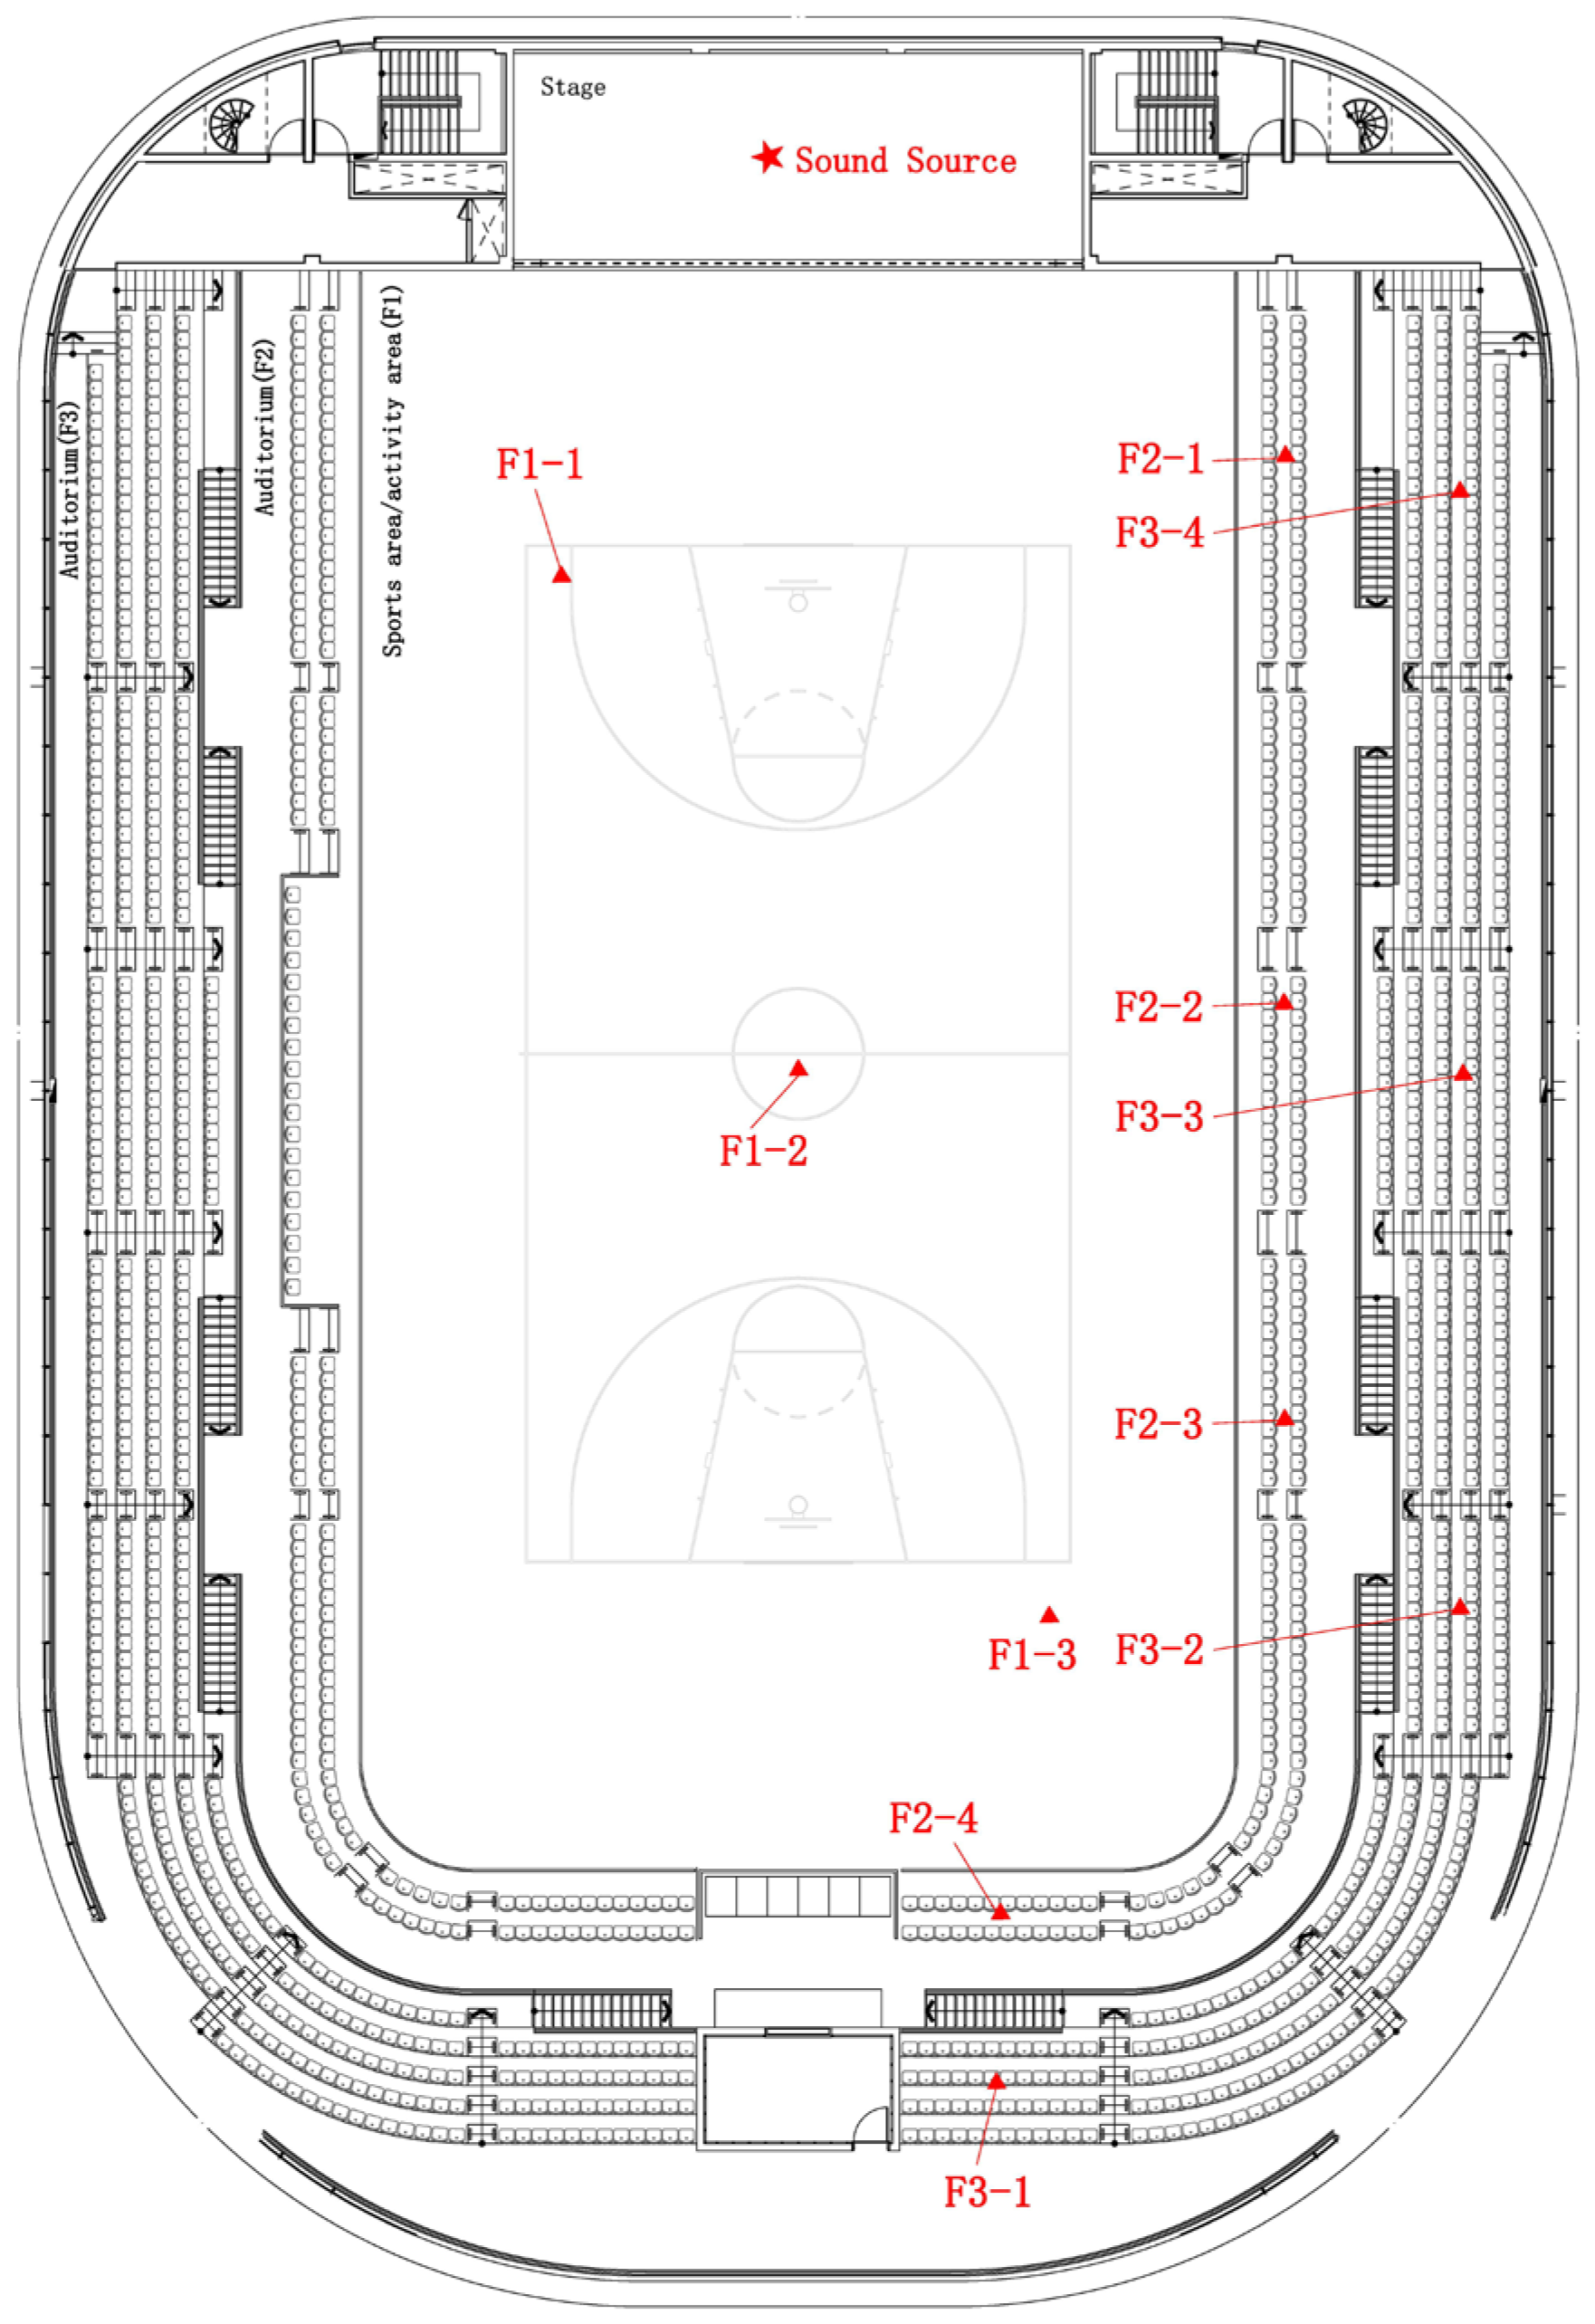
The measurement points were distributed across the ground floor activity area, and the spectator stands on the second and third floors. Due to the symmetrical layout of the gymnasium, measurement points on the second and third floors were only required in half of the seating areas. A total of 11 measurement points were arranged, the arrangement of the measurement points is shown in Figure 2.

2.2.3. Measurement Results

Before acoustic renovation, the acoustic parameters, spatial standard deviation (σs) in the unoccupied gymnasium is presented in Table 1. σs is widely adopted in large space acoustic studies as an indicator of the spatial uniformity of the measured parameter.

3. Calibration of the Acoustic Simulation Model Based on In Situ Measurements

Based on the current architectural and acoustic conditions of the gymnasium, an acoustic model was established using ODEON V16.0 software (Denmark). Appropriate absorption and scattering coefficients were assigned to different surfaces in the model for simulation. The simulation results were compared with the measurement data for calibration. After calibration, the validated acoustic model was applied for further simulations and performance analyses under different usage scenarios [31].

3.1. Estimation of Absorption Coefficients of Major Sound-Absorbing Elements

To ensure accurate acoustic simulation, it is necessary to estimate the absorption coefficients of the primary sound-absorbing elements in the gymnasium, which mainly include the ceiling and seating.

3.1.1. Ceiling Absorption Coefficient

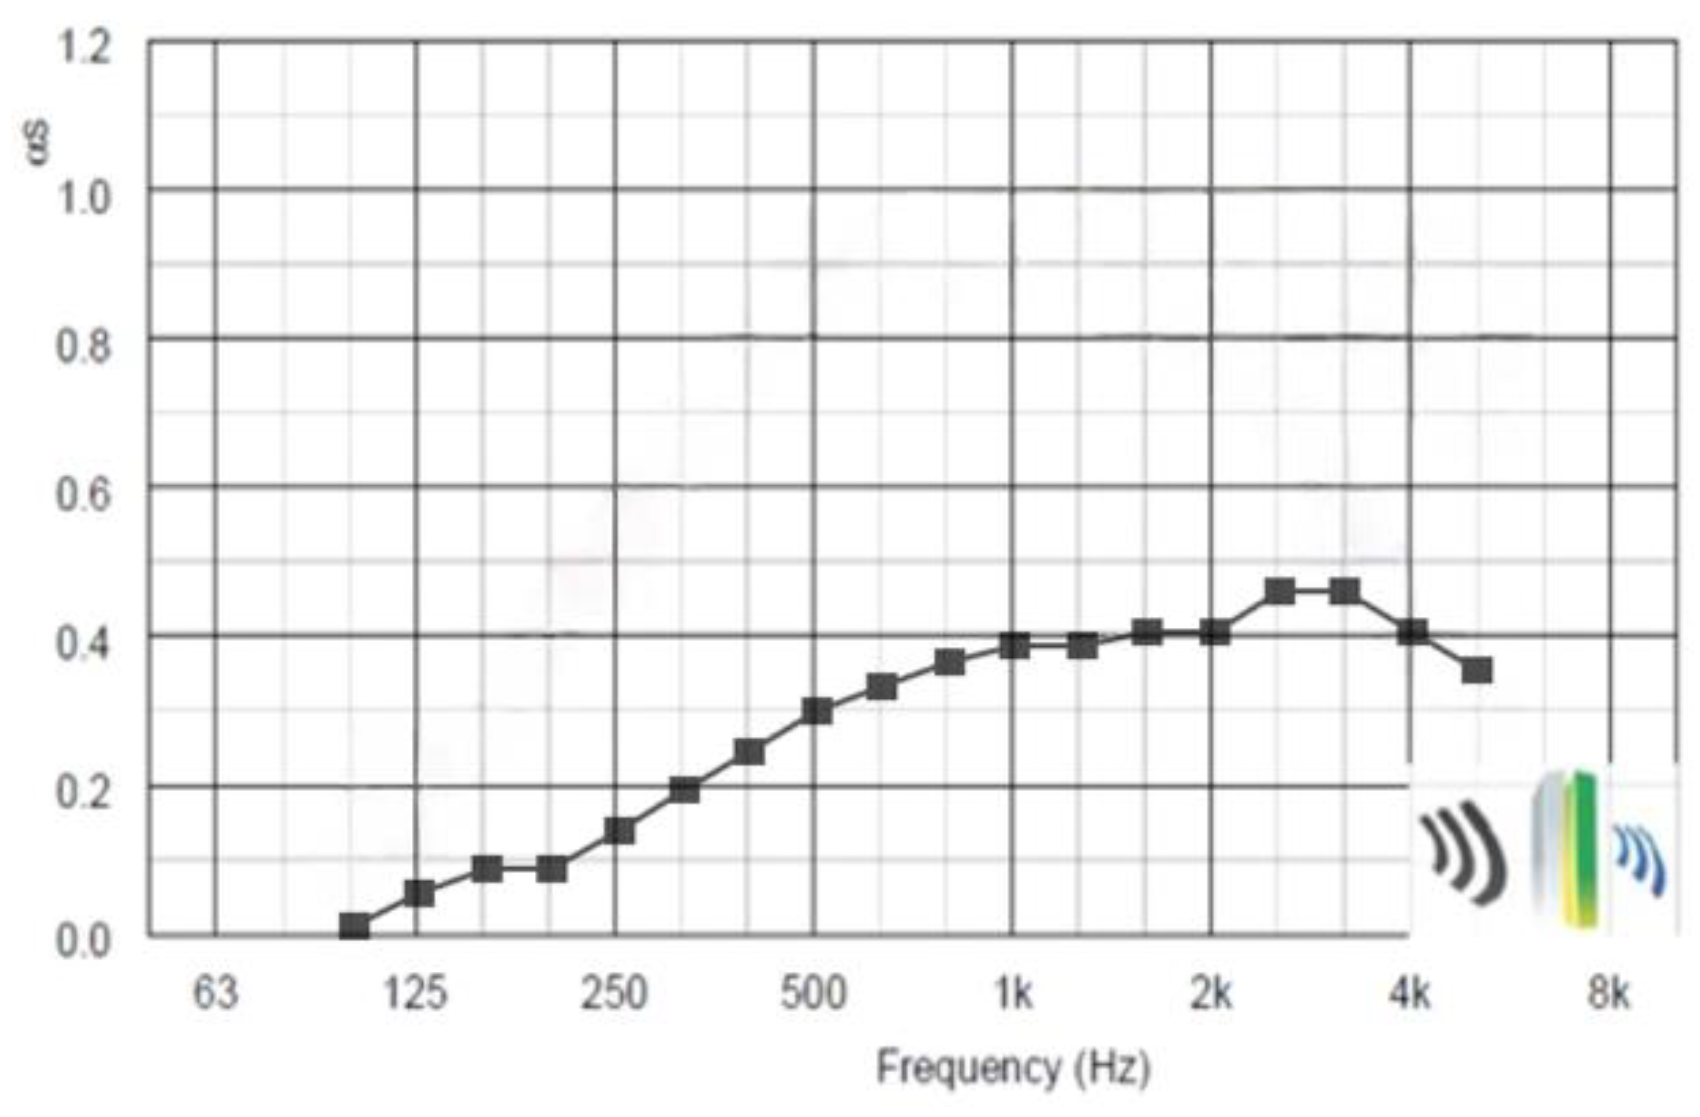
The ceiling consists of perforated metal panels with a perforation ratio of approximately 20%, backed by a 20 mm of polyester fiber sound-absorbing cotton. The perforated regions account for about 50% of the total ceiling area. With a total area of 2394 m2, the ceiling is the dominant contributor to the overall sound absorption in the space. The absorption coefficient of the ceiling was predicted using the AcouSYS V4 software (France), and the results are presented in Figure 3. The predicted values of the ceiling sound absorption coefficient are shown in Table 2.

3.1.2. Seat Absorption Coefficients

Based on experimental results, the absorption of plastic seats was measured using the reverberation chamber method [33]. The single seat absorption was then used to estimate the absorption coefficients, as summarized in Table 3.

3.2. Acoustic Model Calibration

3.2.1. Basic Overview of the Acoustic Model

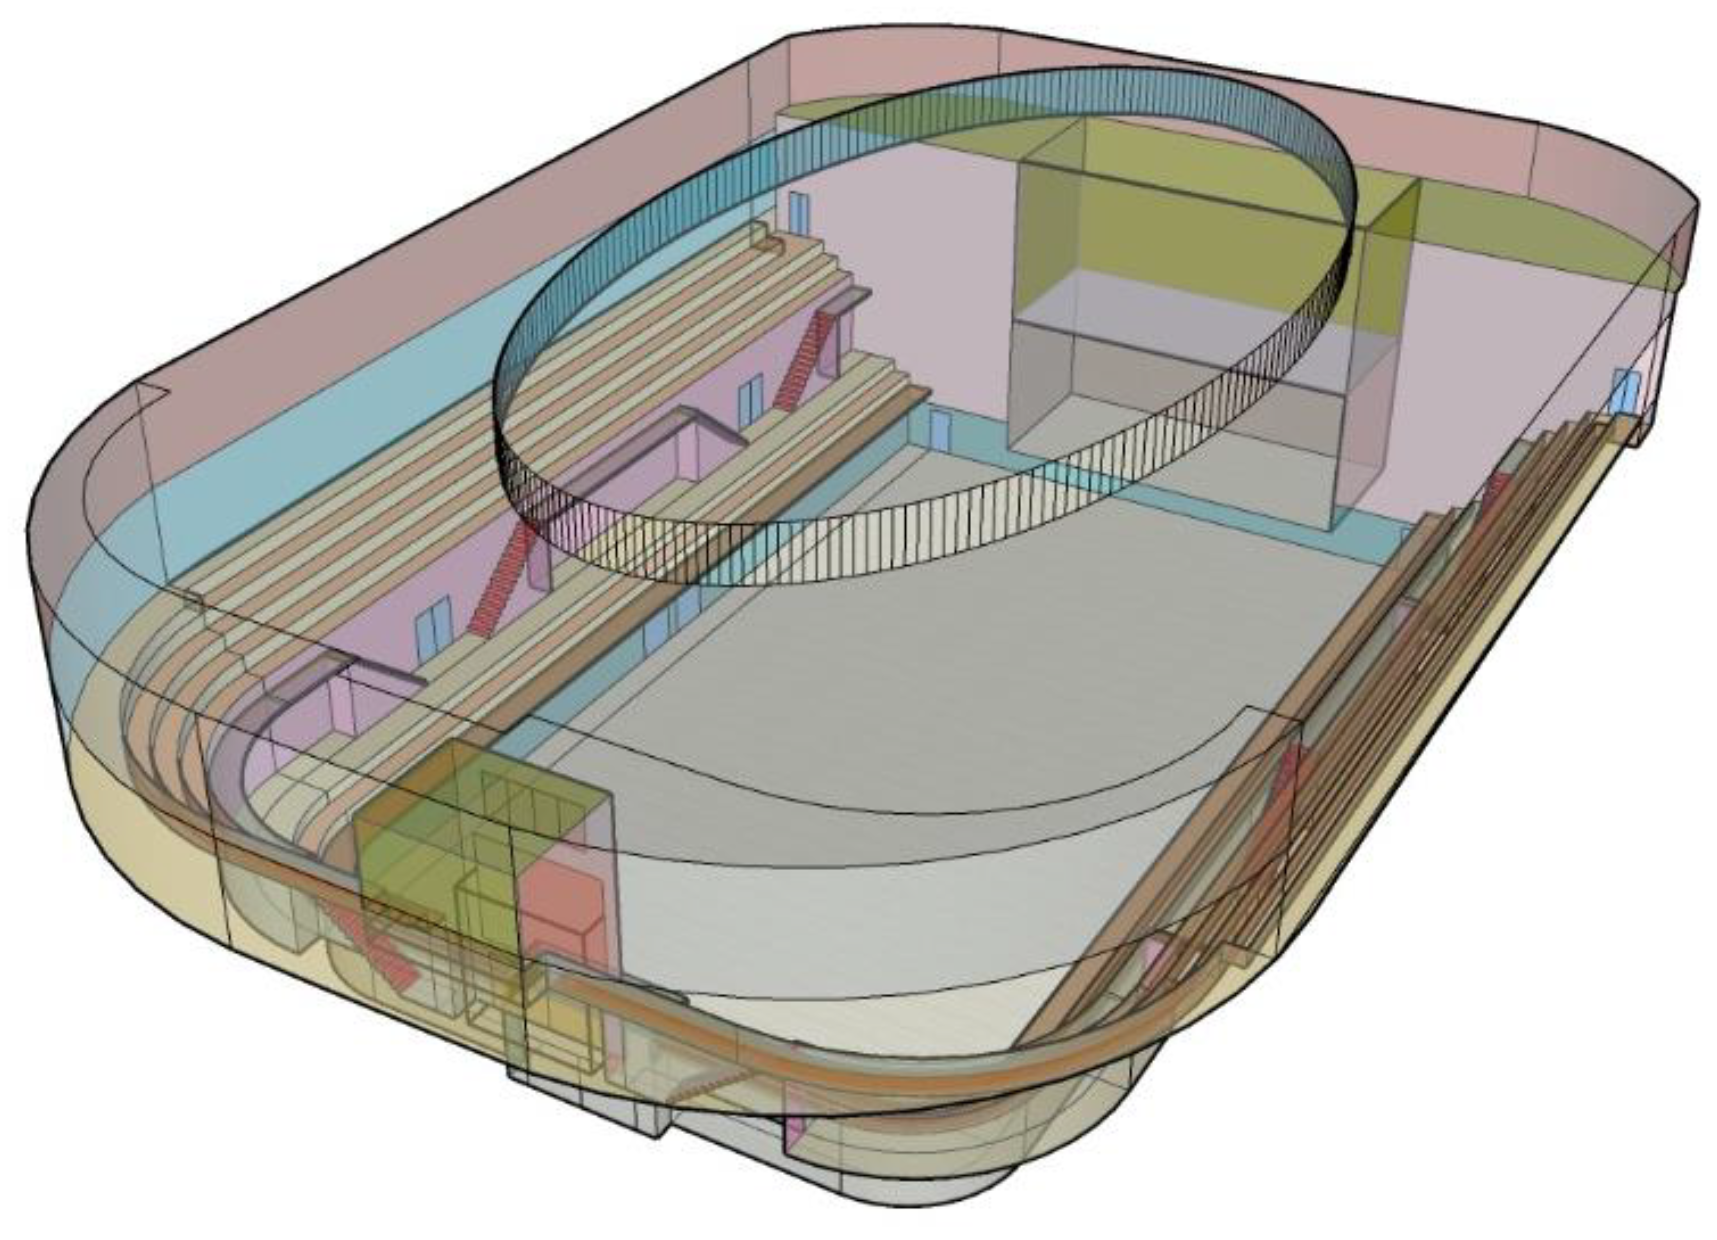
The indoor volume of the gymnasium is 32,800 m3, with 1272 fixed seats in the grandstands, corresponding to a volume of 26 m3 per seat. The acoustic model is shown in Figure 4, the simulation parameters used are shown in Table 4, model parameters are shown in Table 5.

3.2.2. Calibration of Simulated Predictions with Measured Data

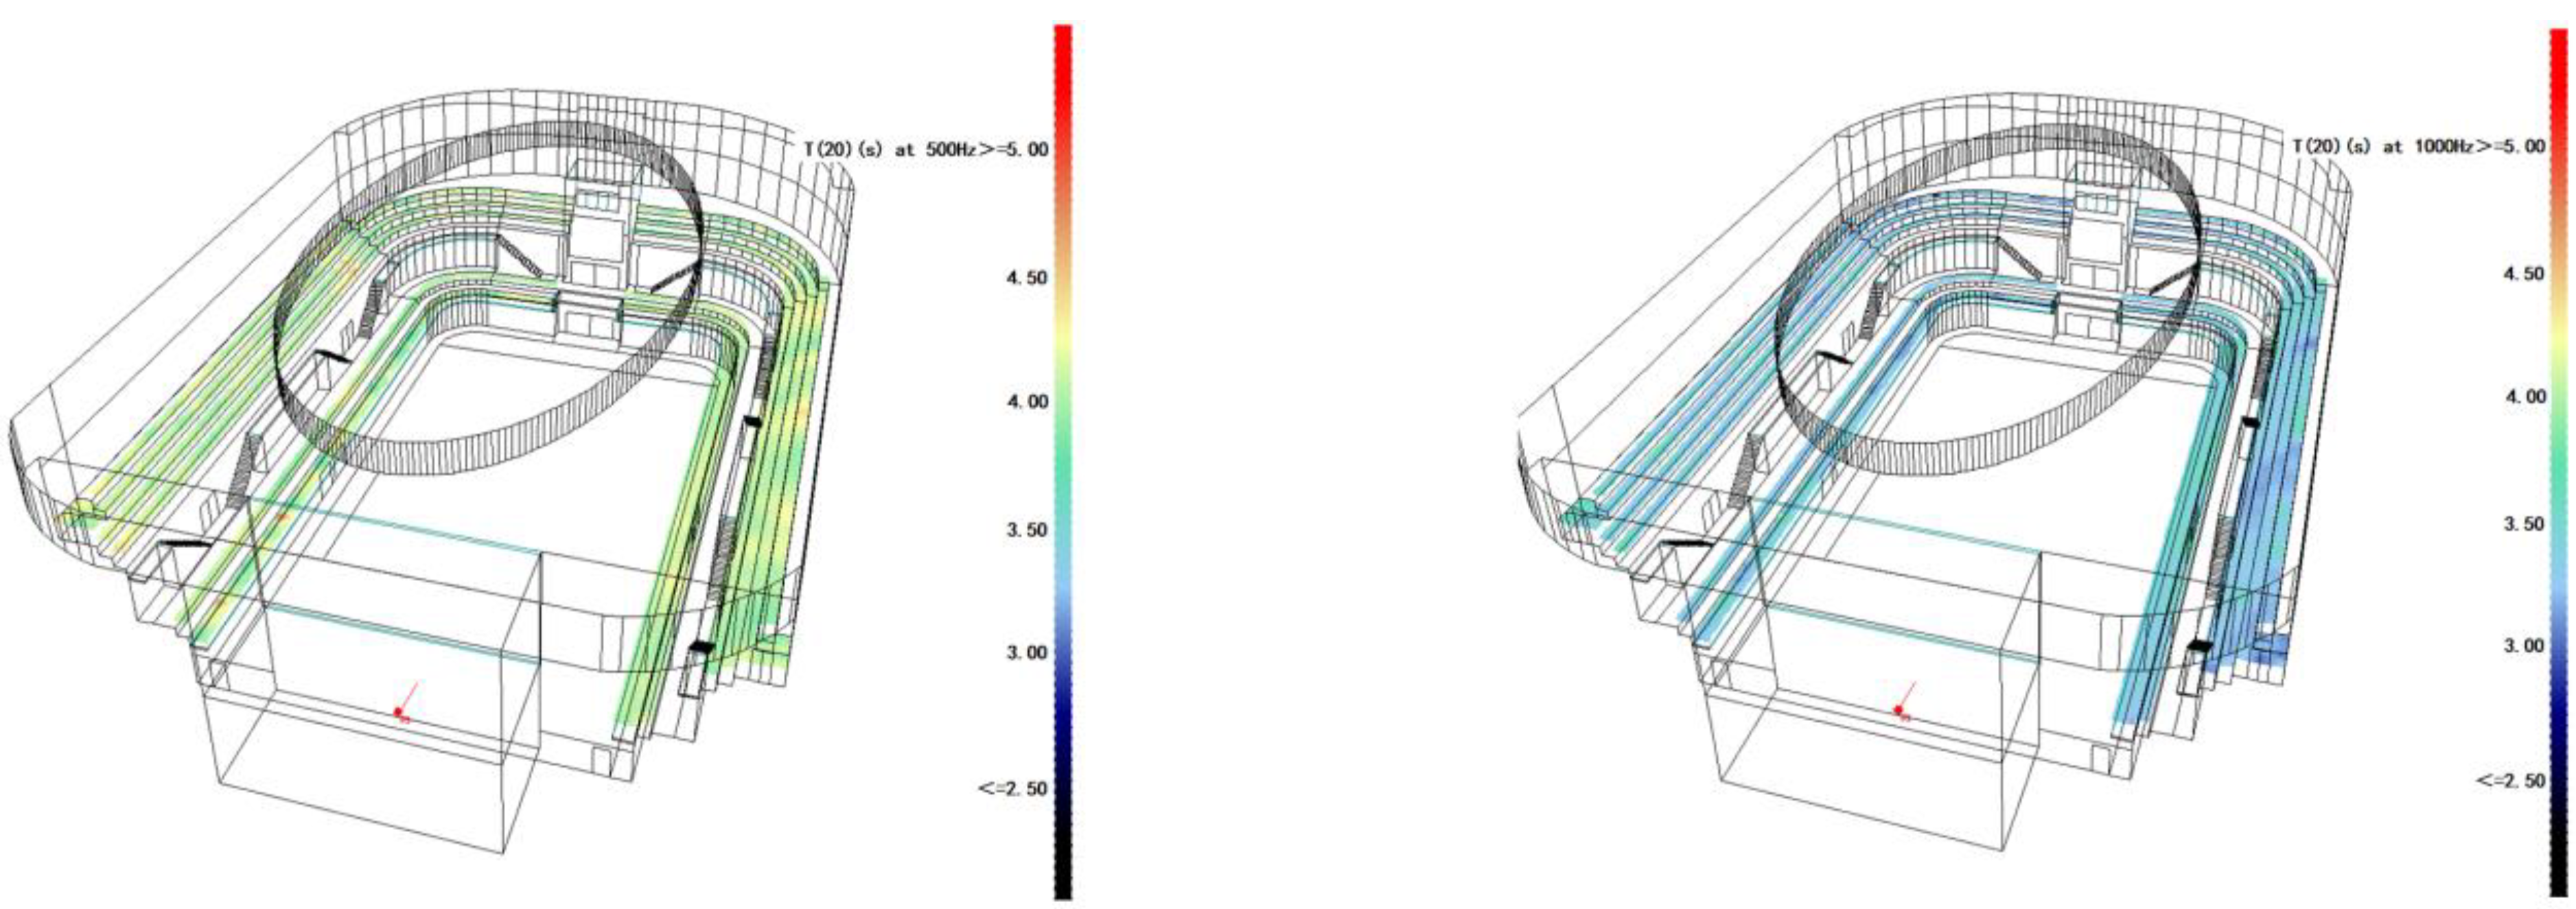
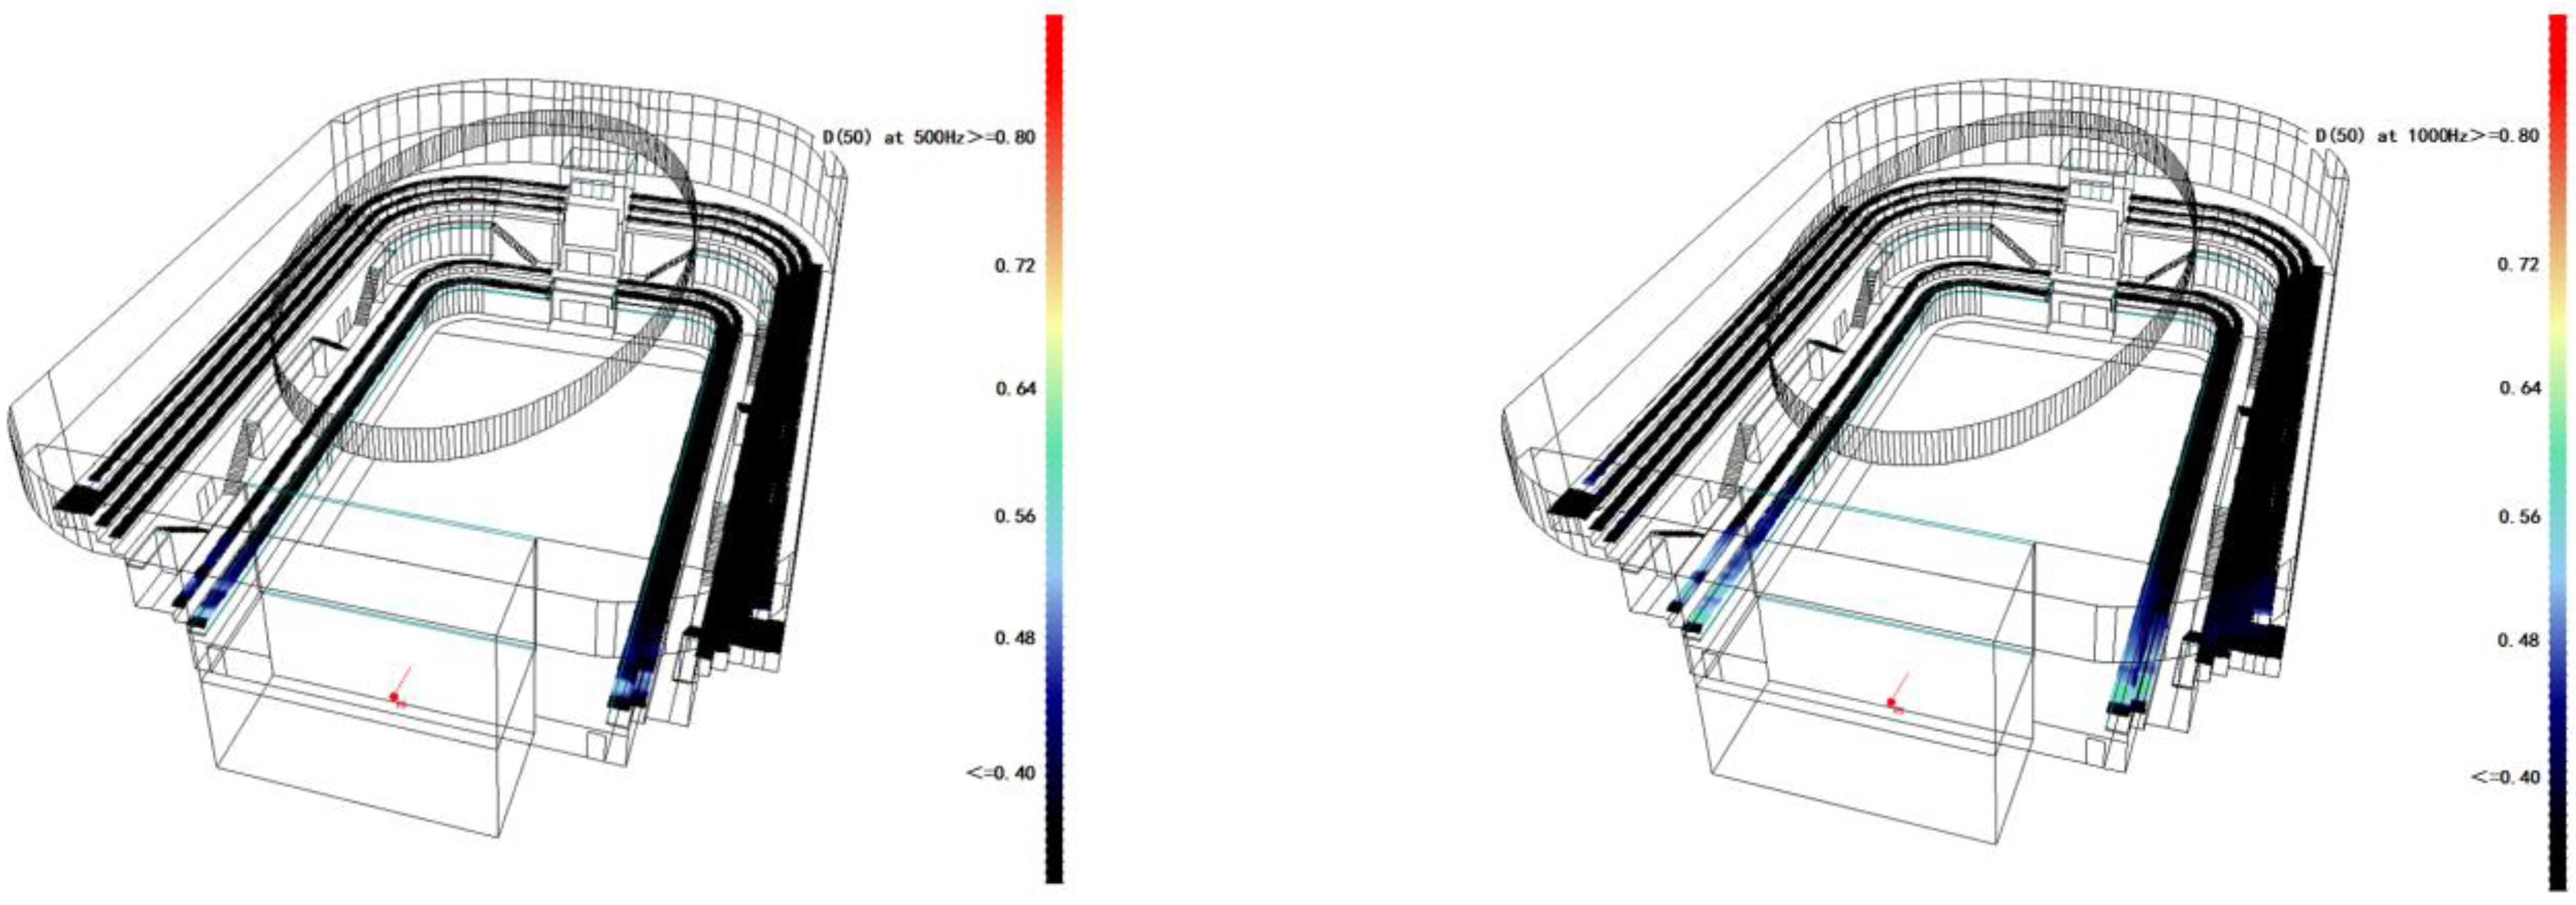
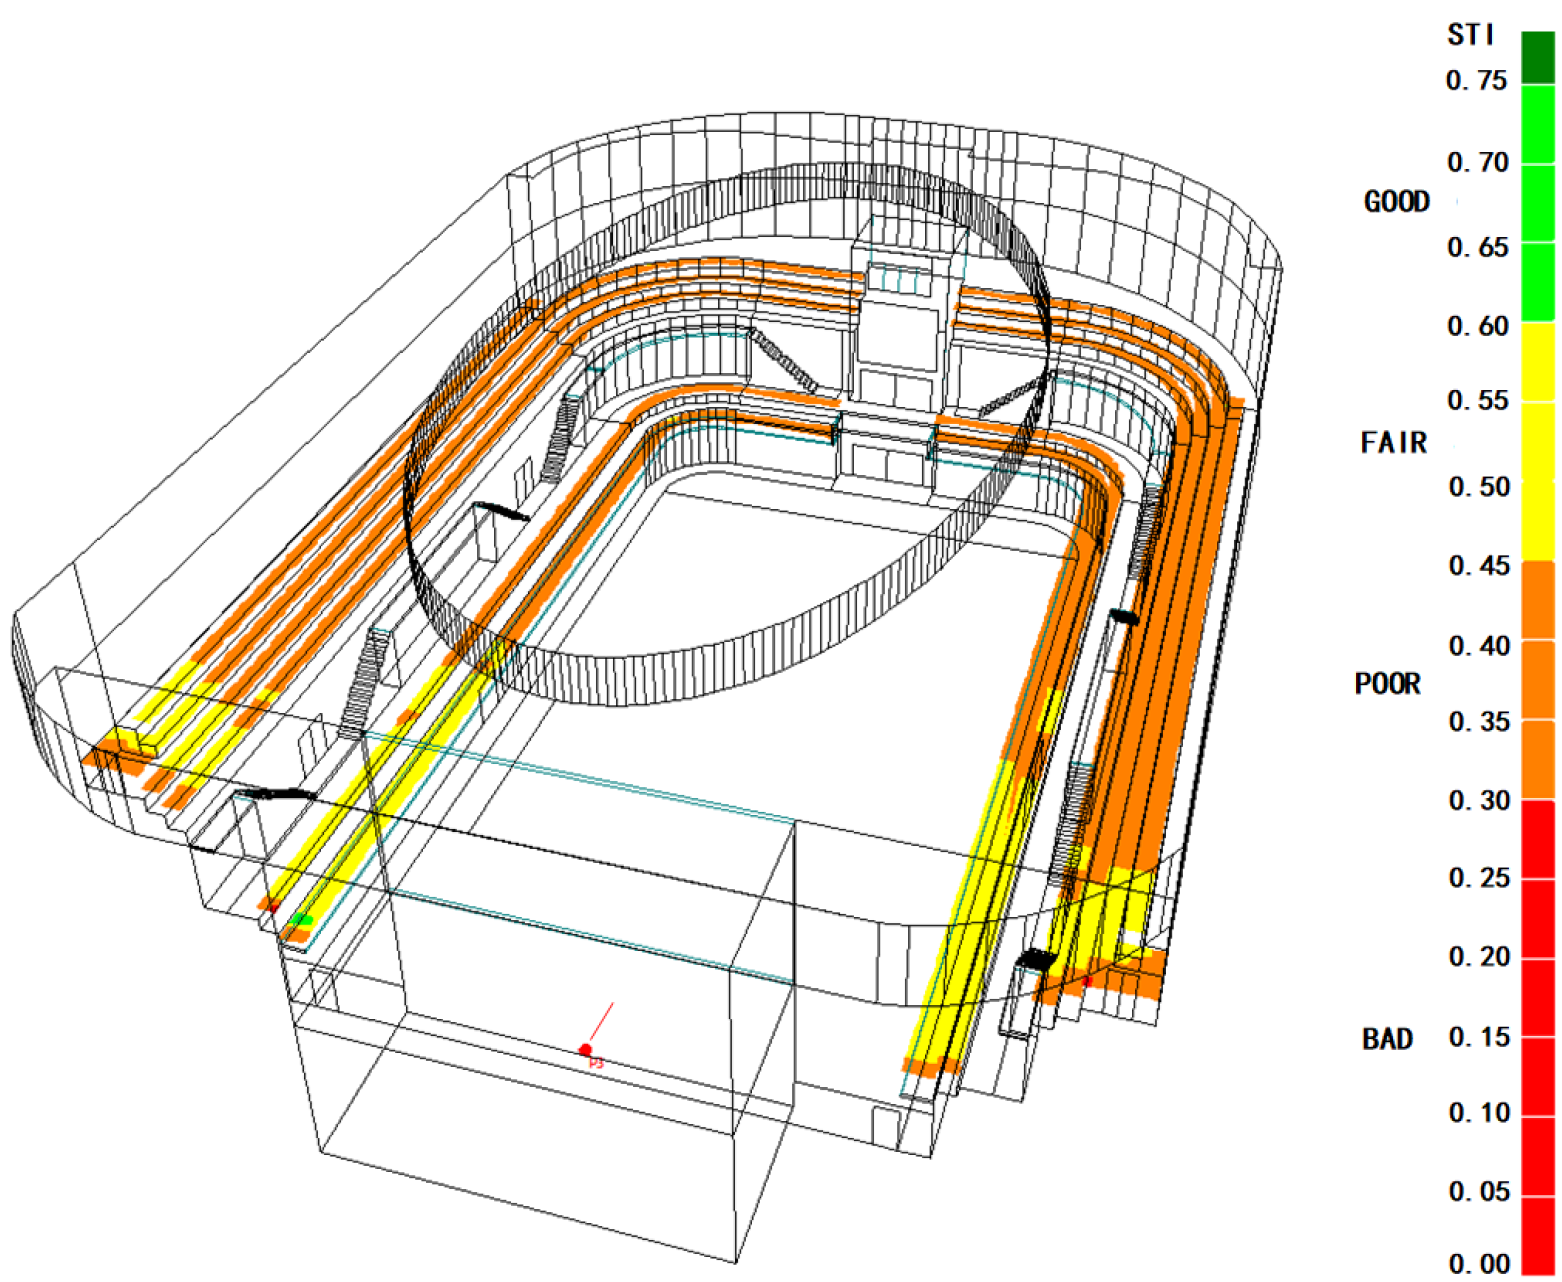
Under unoccupied conditions, the calibrated simulation results are summarized in Table 4, and the T20, D50 color map at the intermediate frequencies of 500 Hz and 1000 Hz is shown in Figure 5 for T20, in Figure 6 for D50, and STI is shown in Figure 7. A Just Noticeable Difference (JND) comparison between the simulated results (Table 6) and the measured values (Table 1) is presented in Table 7. It can be observed that the differences in T20 and D50 correspond to 1 JND, while the STI differs by 2 JNDs. According to the findings of Vorländer [37], discrepancies within 2 JNDs are acceptable for acoustic simulations. Therefore, the simulated predictions in this study exhibit good agreement with the measured results. This indicates that the established acoustic model is highly reliable and that the estimated absorption coefficients of the interior surfaces are reasonably accurate. Therefore, acoustic design based on this model can be expected to produce predictions closely matching the actual acoustic performance, which is critical for the acoustic design and assessment of the project.

4. Simulation Prediction and Over-Standard Analysis Under Fully Occupied Conditions

In gymnasiums, the total amount of sound absorption in the seating area varies significantly with audience occupancy. Therefore, it is necessary to calculate the acoustic parameters under fully occupied conditions [38]. The fully occupied condition refers to the situation where the second- and third-floor stands are completely occupied by the audience, and the ground-floor activity area is also completely occupied by the audience. Since on-site measurements under full occupancy were not feasible, ODEON software was used to predict the acoustic performance under these conditions. The aim was to assess whether key acoustic parameters would exceed standard limits and, based on the results, to provide targeted optimization and justification of the sound absorption scheme.

4.1. Prediction of Indoor Acoustic Parameters Under Full Occupancy

4.1.1. Calculation of Absorption Coefficients for Occupied Seats

Based on experiment results, the reverberation chamber method [33] was used to measure the absorption of plastic seats in the occupied state, and the corresponding absorption coefficients were derived accordingly. The results are presented in Table 8.

4.1.2. Full-Occupancy Condition

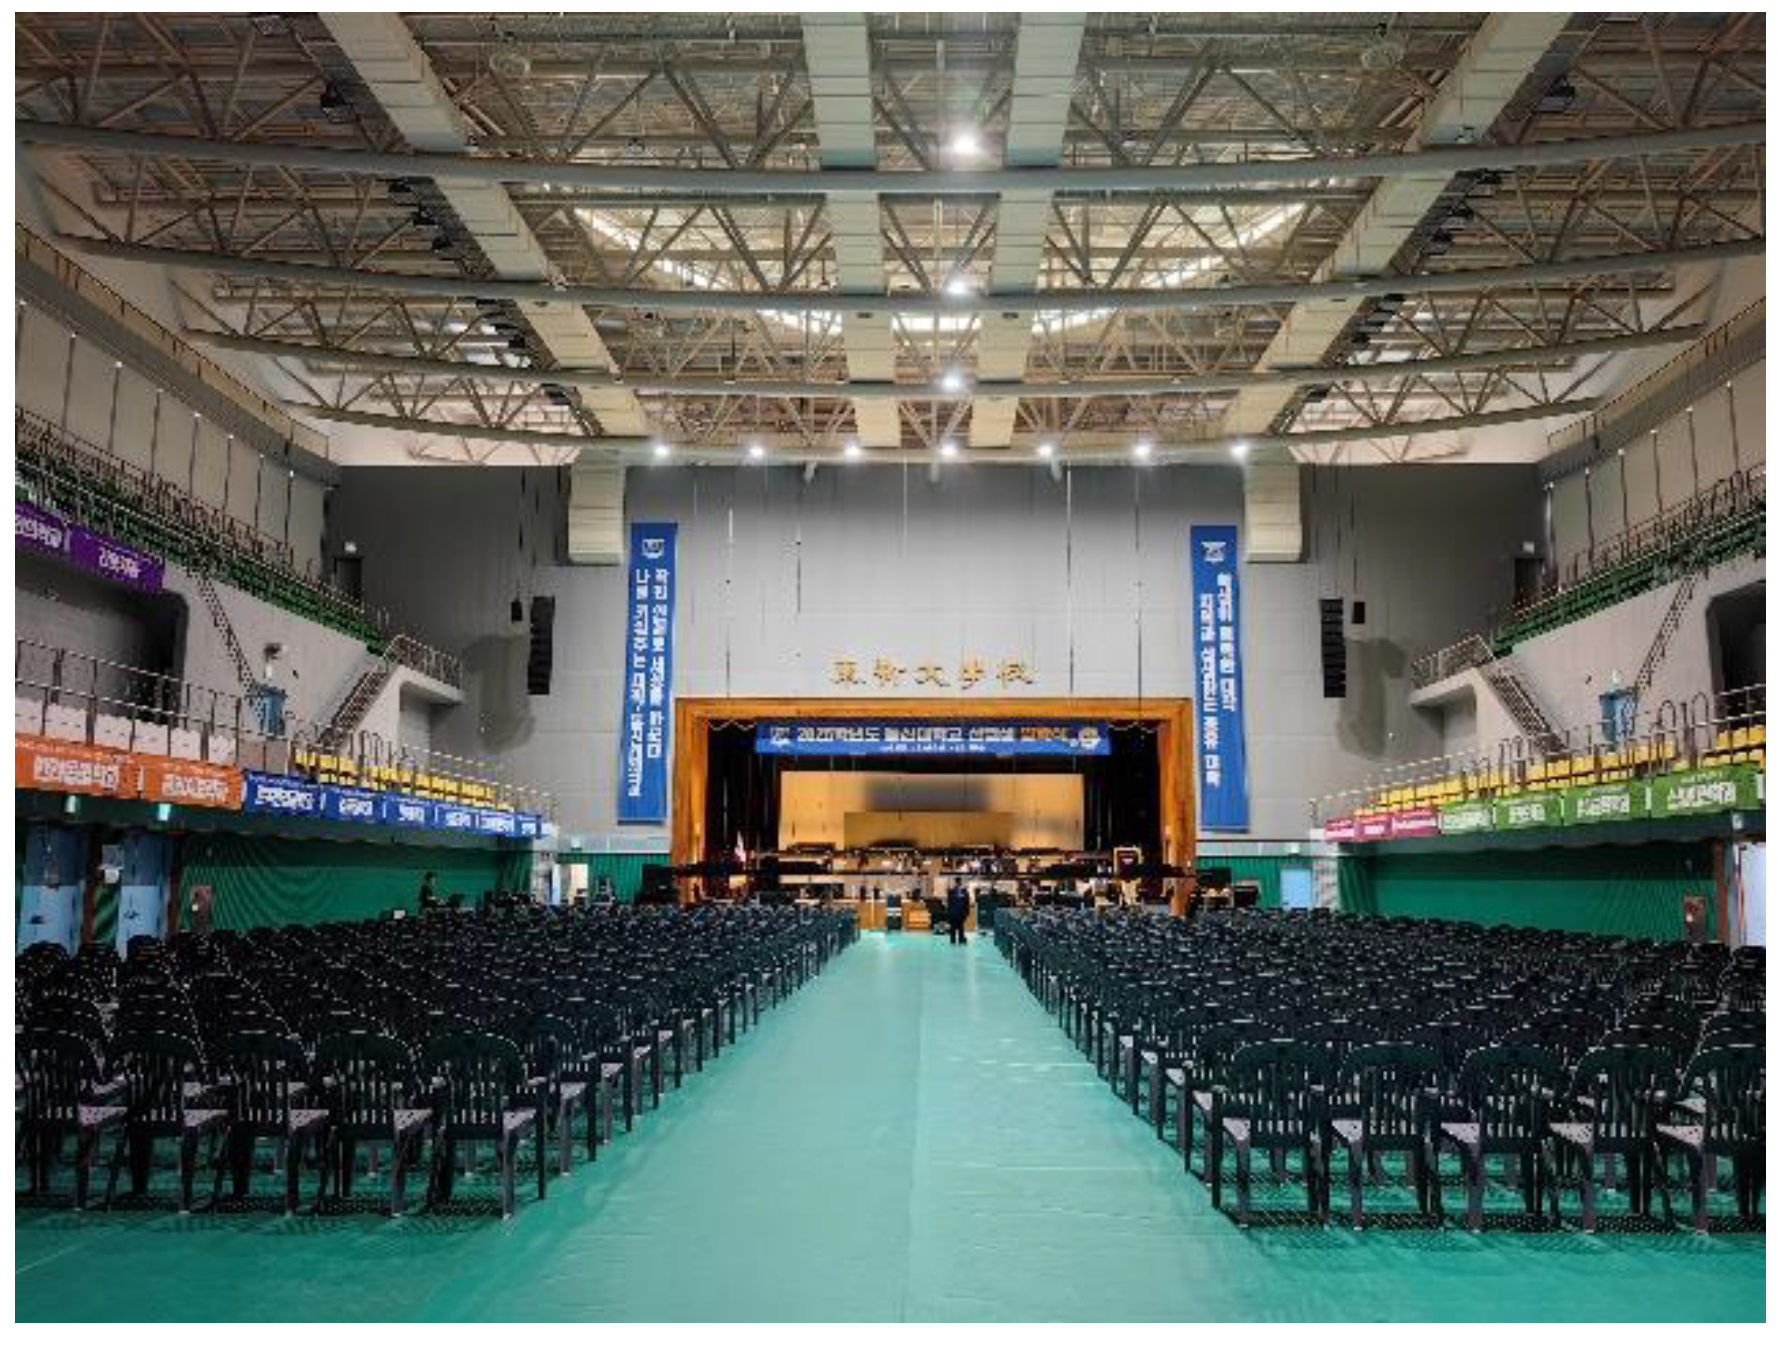
In the condition of full audience occupancy, the gymnasium is primarily used for large-scale events such as opening ceremonies, graduation ceremonies. In this scenario, spectators are seated in the second and third tier stands, while 784 temporary chairs on the floor of the activity area are fully occupied (see Figure 8), resulting in the maximum total indoor sound absorption.

4.1.3. Simulation Prediction Results

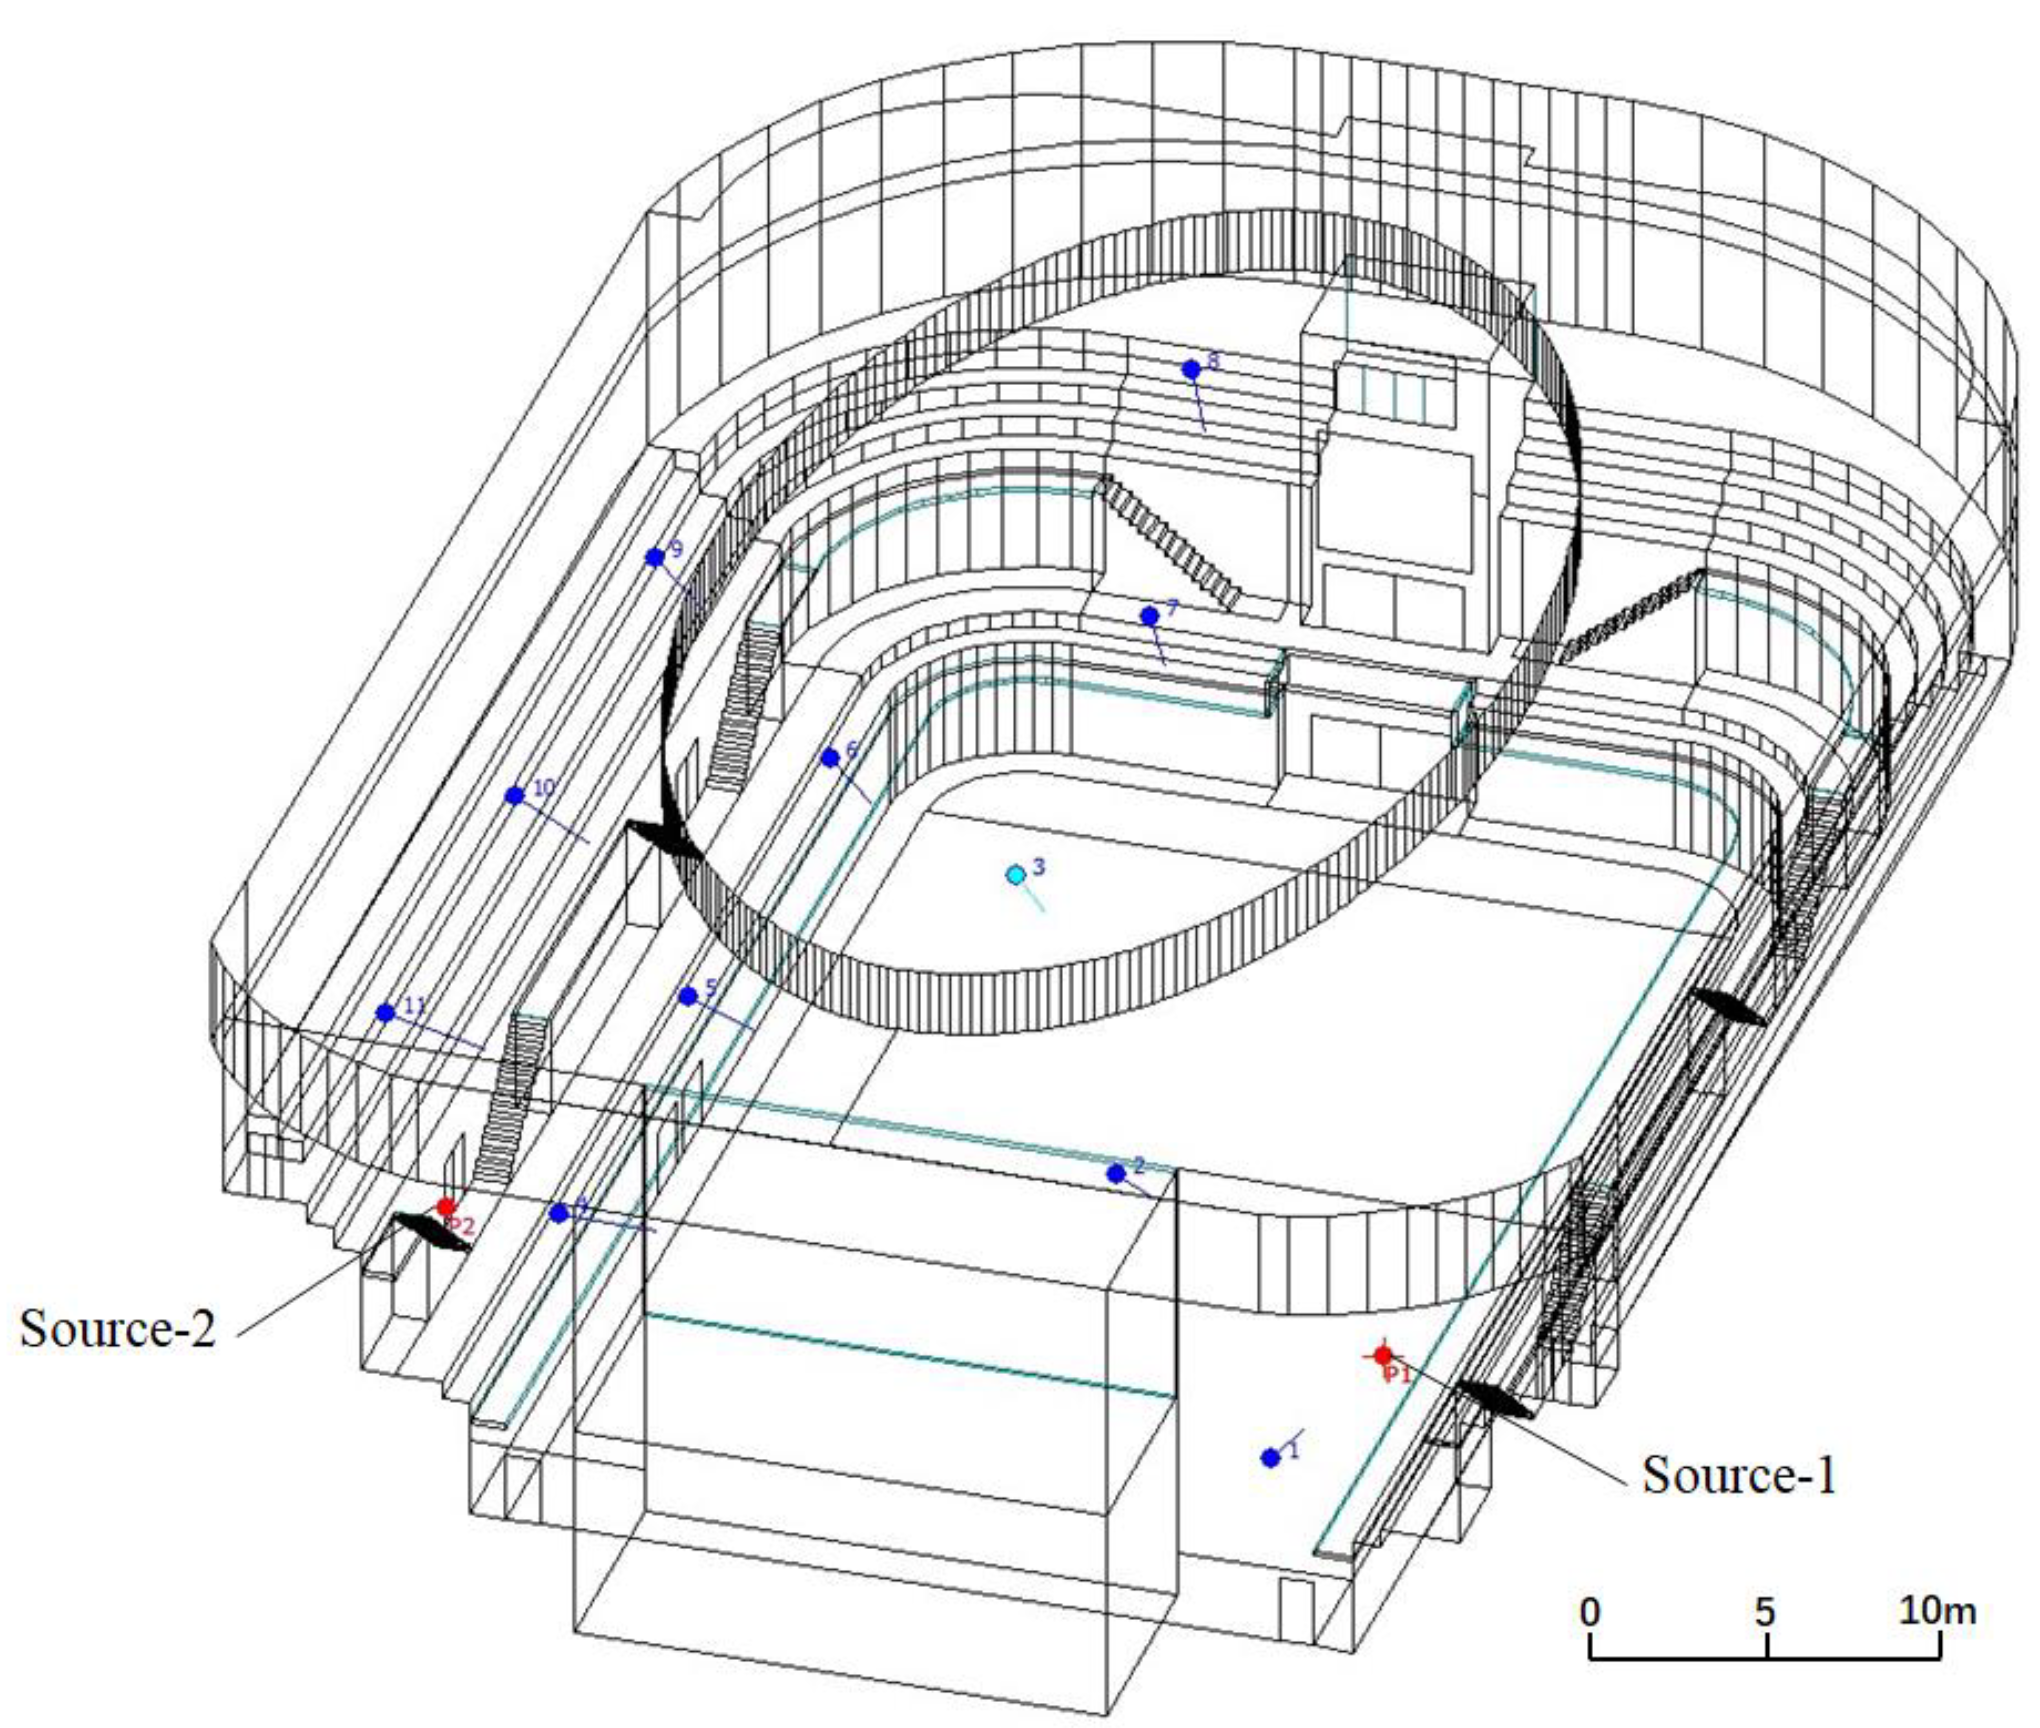
The gymnasium employs a sound reinforcement system composed of two loudspeakers, which are used simultaneously during major events. In the acoustic model, the sound source positions were set to correspond closely to the actual locations of the two loudspeakers, ensuring that the simulation results were consistent with real conditions. This configuration is of significant importance for the validation of the practical design scheme. The sound source positions in the model are shown in Figure 9.
The simulated prediction results of T20, D50, and STI under full-occupancy conditions are shown in Table 9.

4.2. Exceedance Evaluation

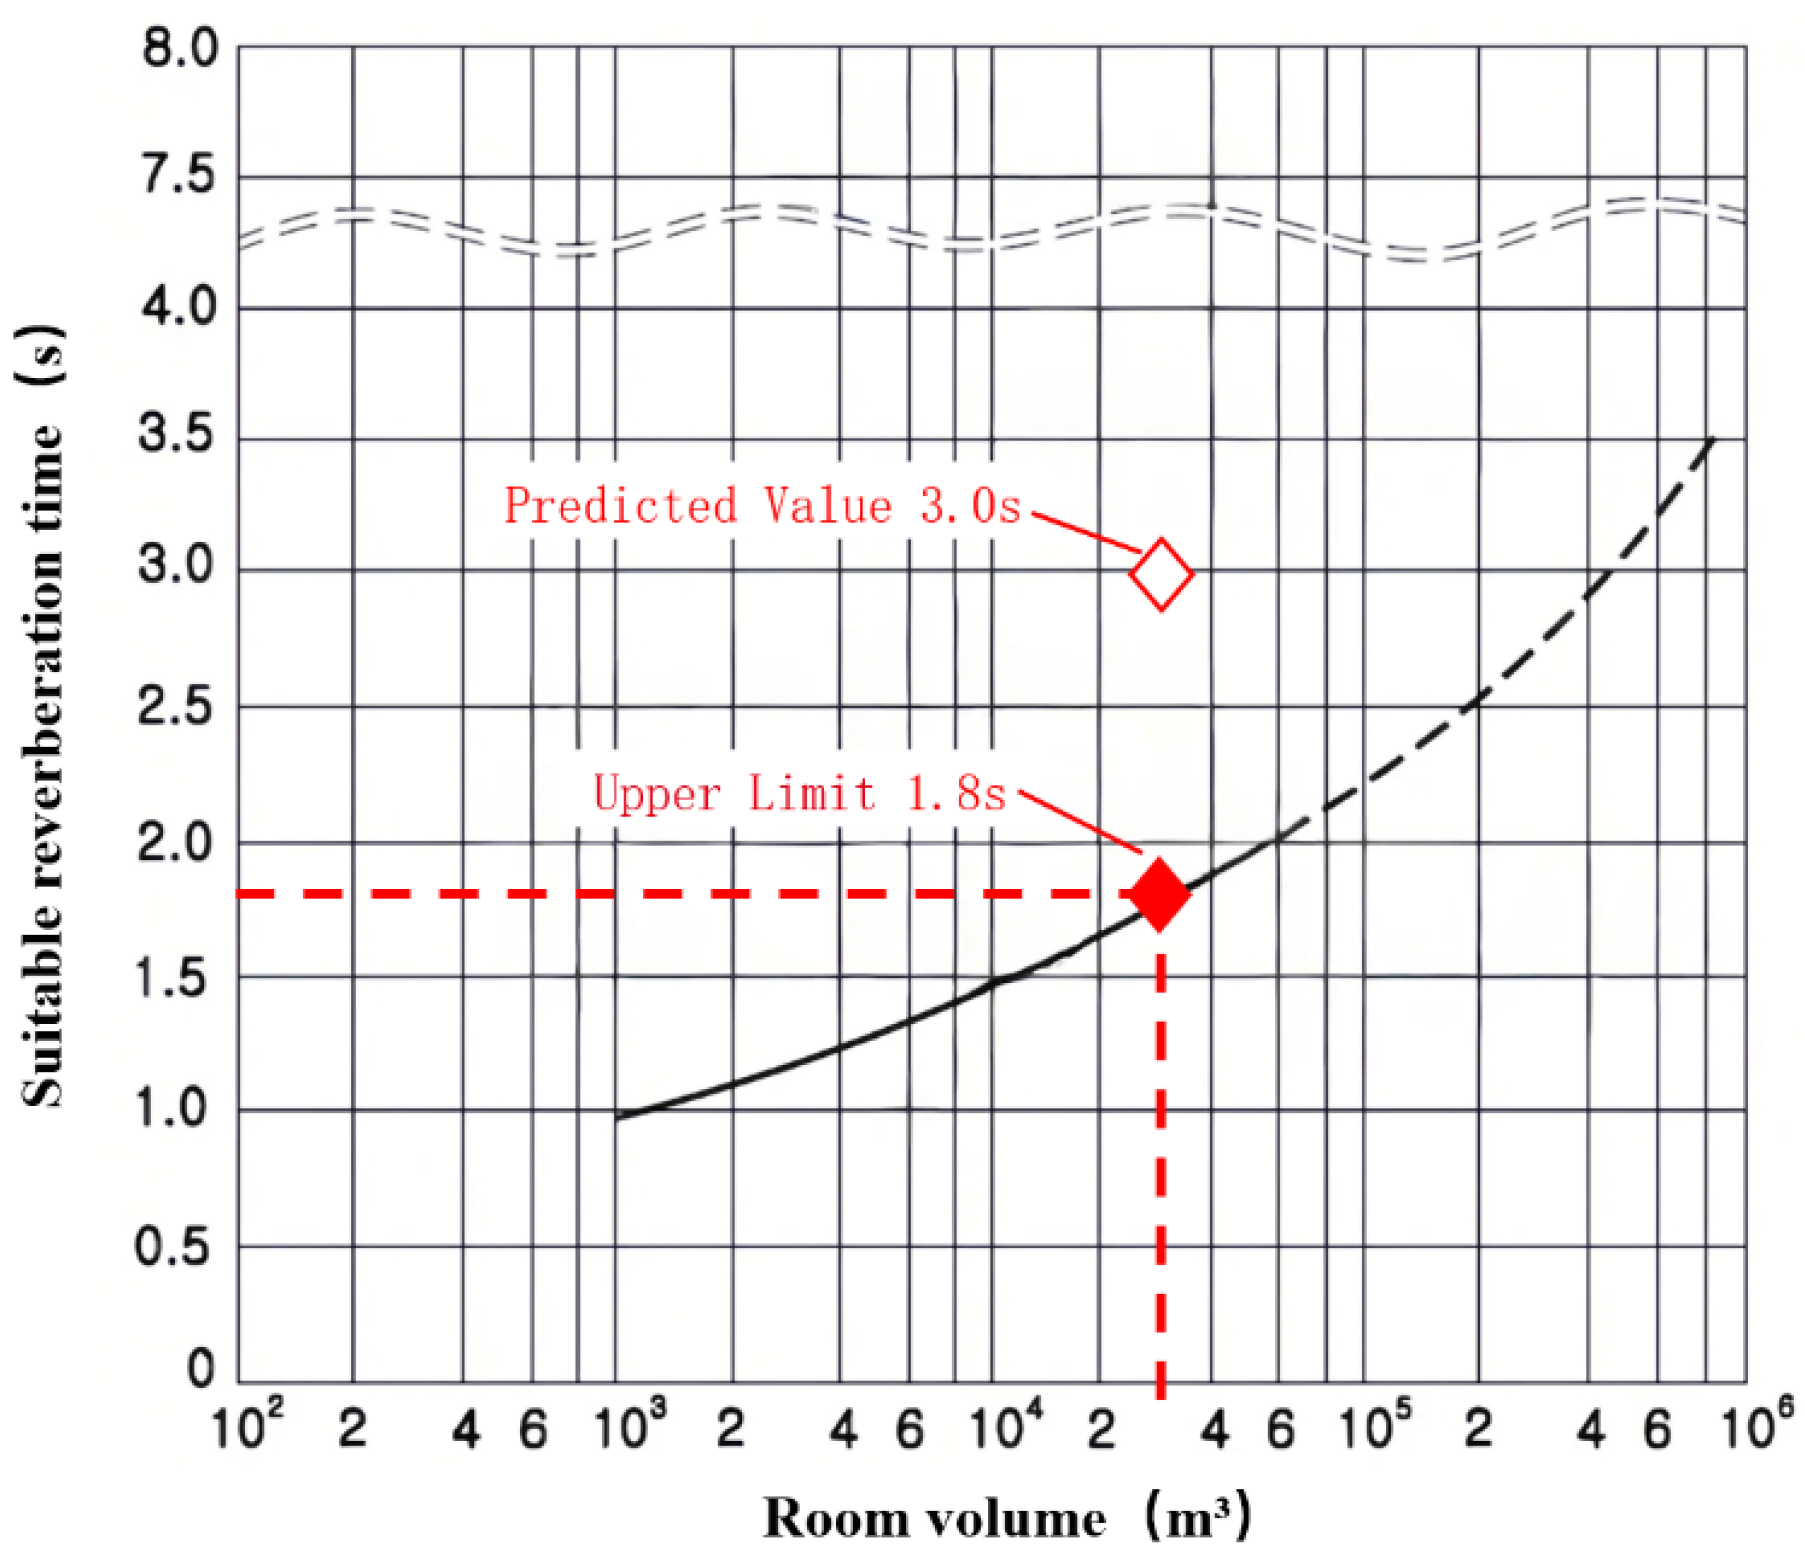
In Korea, the acoustic performance criteria for multi-purpose gymnasiums are typically based on the reverberation time limit curve proposed by the Korean scholar Kim Jae-Soo (see Figure 10), which adopts 500 Hz as the reference frequency [39]. The volume of the gymnasium investigated in this study is 32,800 m3. According to this limit curve, the upper limit of reverberation time at the mid-frequency of 500 Hz is 1.8 s. Under full-occupancy conditions, however, the simulated reverberation time at 500 Hz was found to be 3.0 s. This indicates that the current reverberation time exceeds the recommended limit by approximately 1.2 s. In other words, the additional sound absorption should be sufficient to control the reverberation time for large scale assemblies, requiring a reduction of about 1.2 s at the mid-frequency of 500 Hz.
Based on the explanation of D50 provided by Barron [40], values of 0.50 or higher generally indicate good speech clarity. Under the current conditions of the gymnasium, the predicted D50 in the mid-frequency range of 500–1000 Hz is 0.35 when fully occupied, which is 0.15 lower than the recommended threshold, indicating that the speech clarity does not yet meet the desirable standard.
According to ISO 9921 [29], an STI threshold of 0.45 is generally considered adequate for speech communication spaces. The average pre-renovation STI value of 0.47 in this project satisfies this basic criterion; however, further enhancement is desirable to achieve optimal speech intelligibility.

5. Technical Demonstration of Sound Absorption Scheme

Drawing on practical experience in the acoustic design and construction of gymnasiums, satisfactory indoor acoustic performance can generally be achieved only through a considerable amount of total sound absorption, with extensive use of sound-absorptive materials on both walls and ceilings [27]. However, this approach is relatively coarse and often leads to high construction costs. In this study, additional sound-absorbing materials were introduced together with the existing absorptive ceiling, and their placement was optimized through systematic analysis. The goal was to explore a cost-effective strategy that balances acoustic performance with economic efficiency. The simulation prediction was conducted using the calibrated ODEON model, in which the corresponding acoustic parameters of the design scheme were input to obtain the predicted results.

5.1. Design and Demonstration Analysis of Five Sound Absorption Schemes

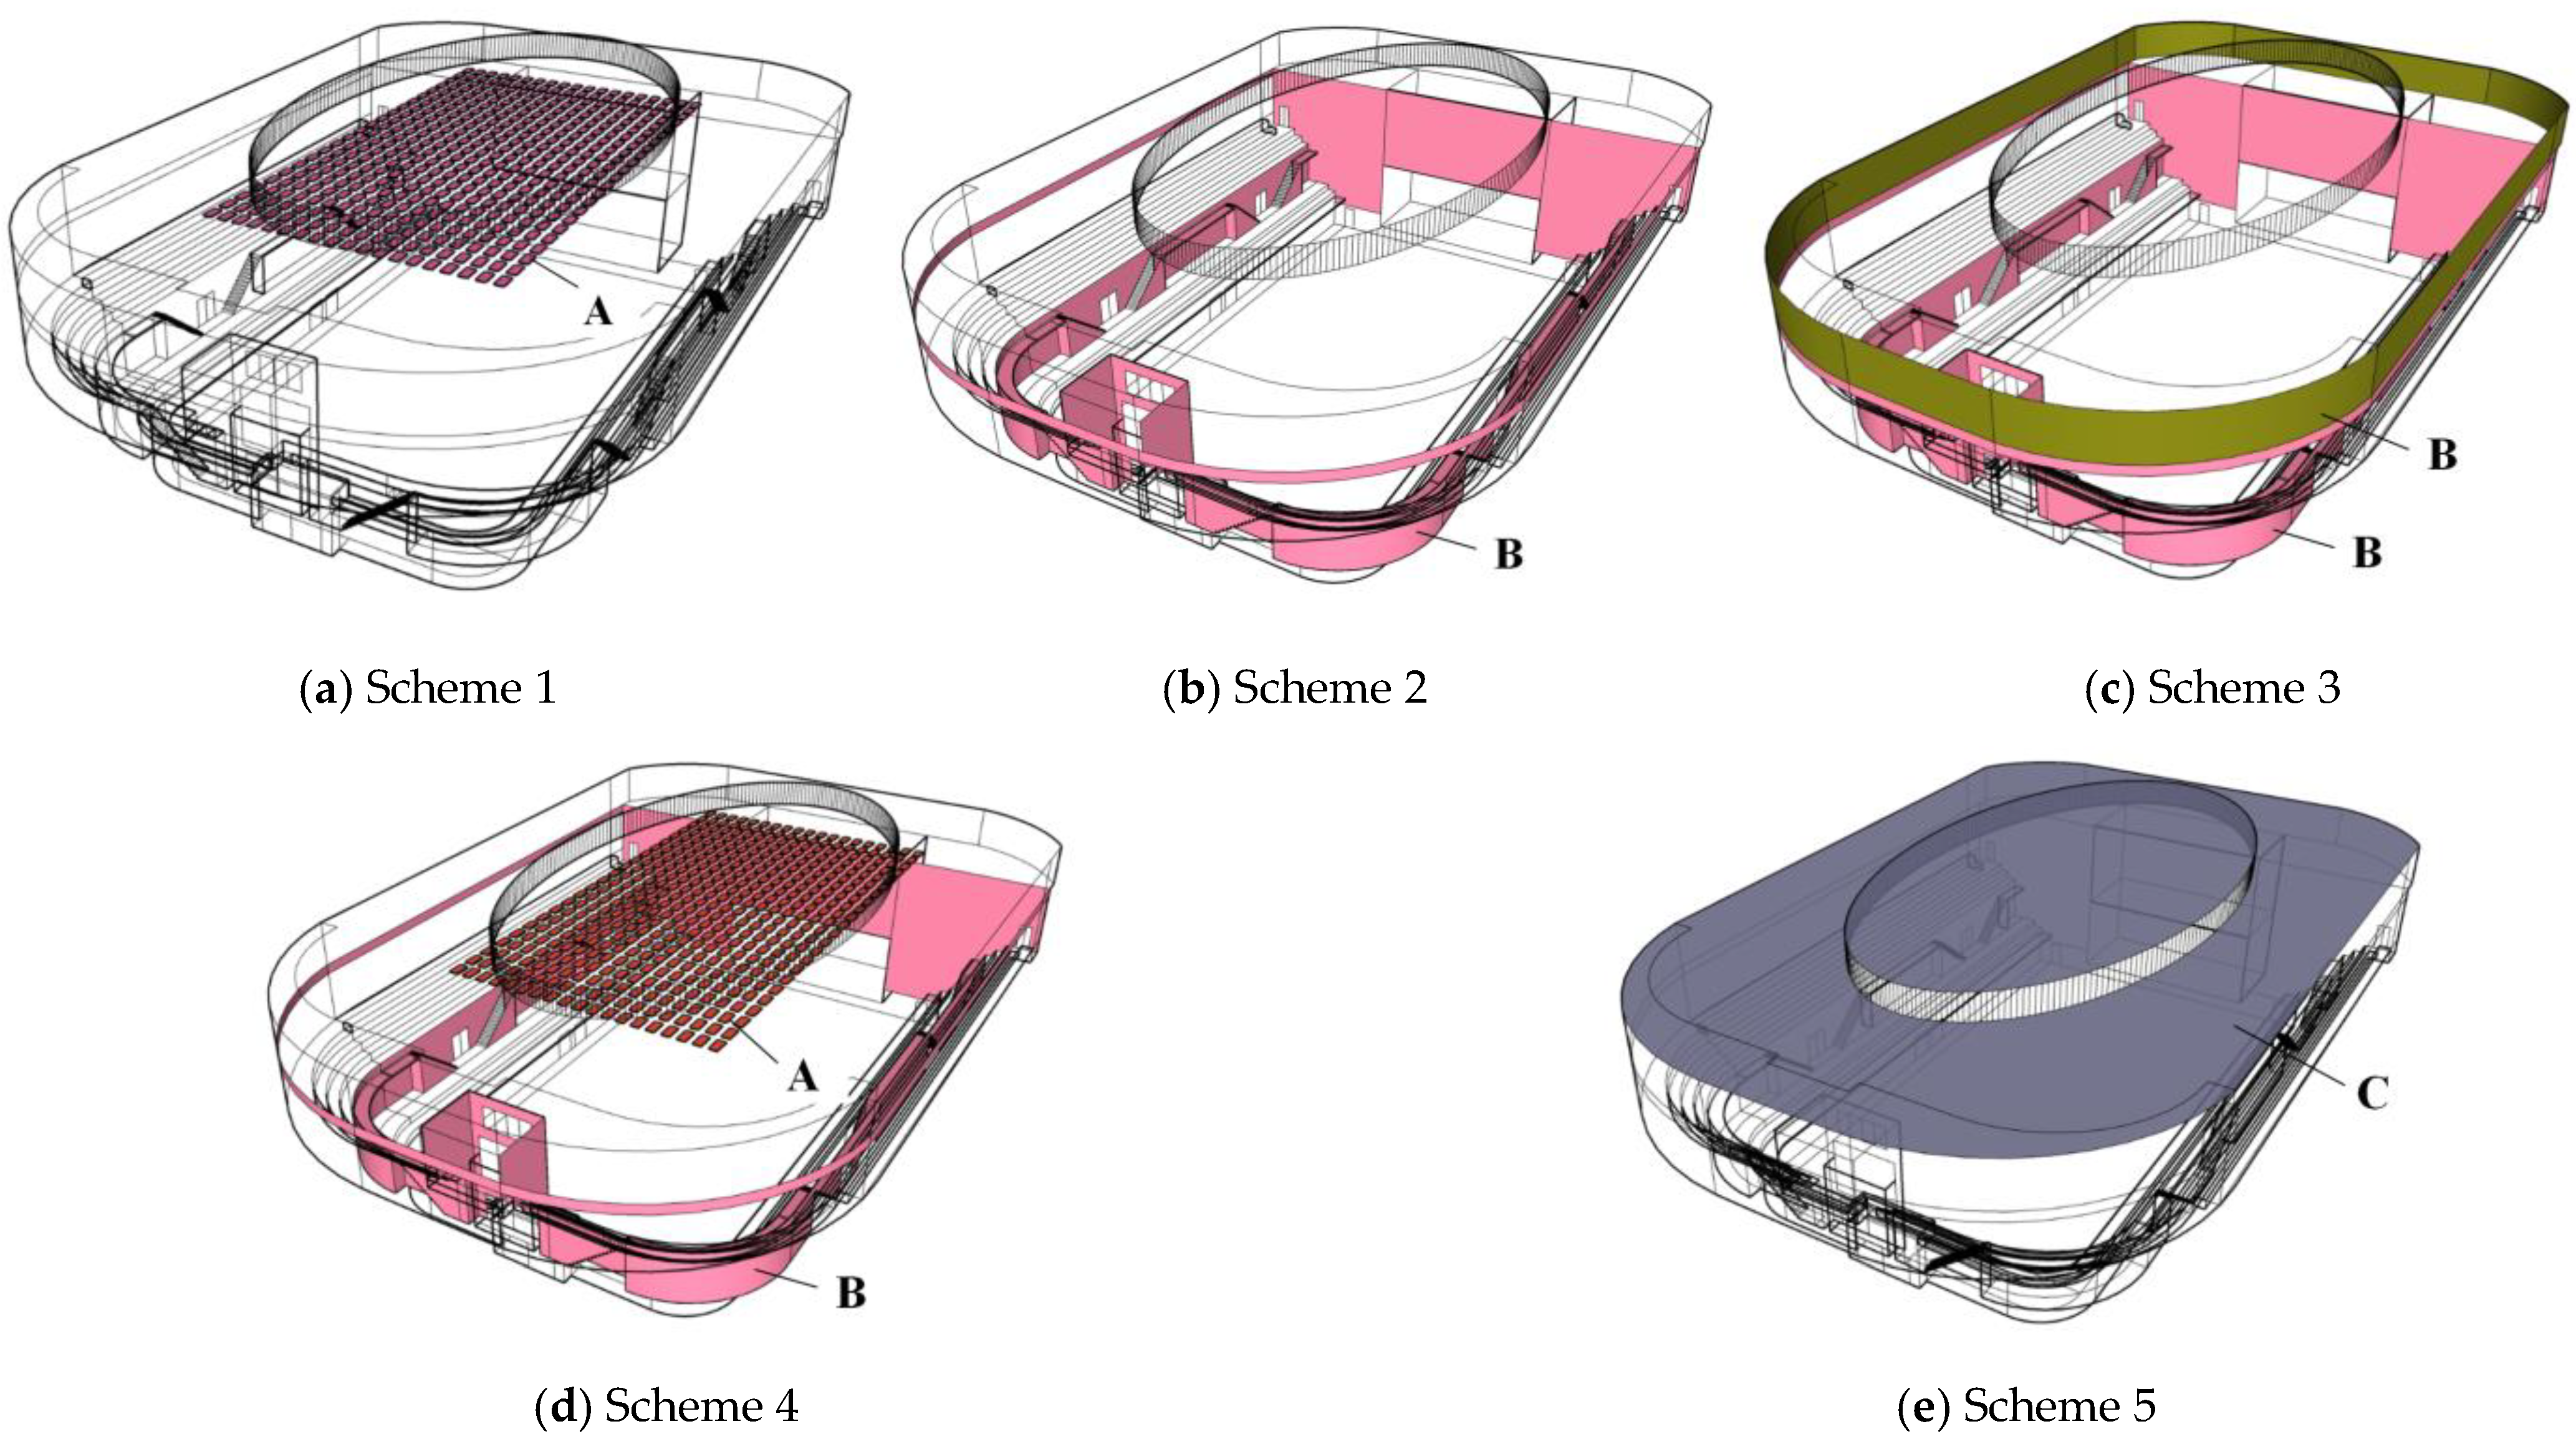
The existing ceiling provides a sound absorption coefficient of approximately 0.3 at 500 Hz. Therefore, the design of additional sound-absorbtion must consider the existing ceiling contribution. In large spaces, highly absorptive materials are essential to effectively control first-order reflections [41]. In this study, polyester fiber acoustic cotton was selected as the primary additional material. Five alternative schemes were designed and evaluated to identify a solution that balances cost-effectiveness with construction simplicity. The technical details of these five schemes are summarized in Table 10. All schemes employ prefabricated commercial products provided by manufacturers, which offer both excellent acoustic performance and ease of installation. Their absorption properties are presented in Table 11. The specific implementation of each scheme is shown in Figure 11.

5.1.1. Scheme 1

In Scheme 1, space absorbers are hung below the ceiling, supported by steel cables that are arranged along the walkways of the space-frame roof structure, The installation layout is shown in Figure 11a. The absorbers have little impact on existing air outlets and lighting fixtures. As all surfaces are directly exposed to the sound field, absorption efficiency is maximized, and the effective coefficient based on projected area can exceed 1 [44]. Fabric-based panels with high absorption are recommended [45]; in this study, polyester fiber decorative acoustic panels were selected for their broadband and efficient performance [46]. The acoustic parameters, spatial standard deviation (σs) in the occupied gymnasium is presented in Table 12.

5.1.2. Scheme 2

In this scheme, most wall surfaces are covered with sound-absorbing panels, offering both extensive absorptive area and ease of construction. The installation layout is shown in Figure 11b. The acoustic parameters, spatial standard deviation (σs) in the occupied gymnasium is presented in Table 13.

5.1.3. Scheme 3

Building upon Scheme 2, this scheme extends sound-absorbing treatment to the upper walls on the third floor, achieving full wall coverage across the gymnasium. The installation layout is shown in Figure 11c. The acoustic parameters, spatial standard deviation (σs) in the occupied gymnasium is presented in Table 14.

5.1.4. Scheme 4

This scheme combines the approaches of Schemes 1 and 2: spatial absorbers are suspended from the roof structure, while large portions of the wall surfaces are also treated with sound-absorbing panels. The installation layout is shown in Figure 11d. The acoustic parameters, spatial standard deviation (σs) in the occupied gymnasium is presented in Table 15.

5.1.5. Scheme 5

In this scheme, no structural modifications are made; instead, additional sound-absorbing ceiling panels are installed directly beneath the existing ceiling. The installation layout is shown in Figure 11e. The acoustic parameters, spatial standard deviation (σs) in the occupied gymnasium is presented in Table 16.

5.2. Summary of Scheme Evaluation

5.2.1. Comparative Analysis of the Predicted Results

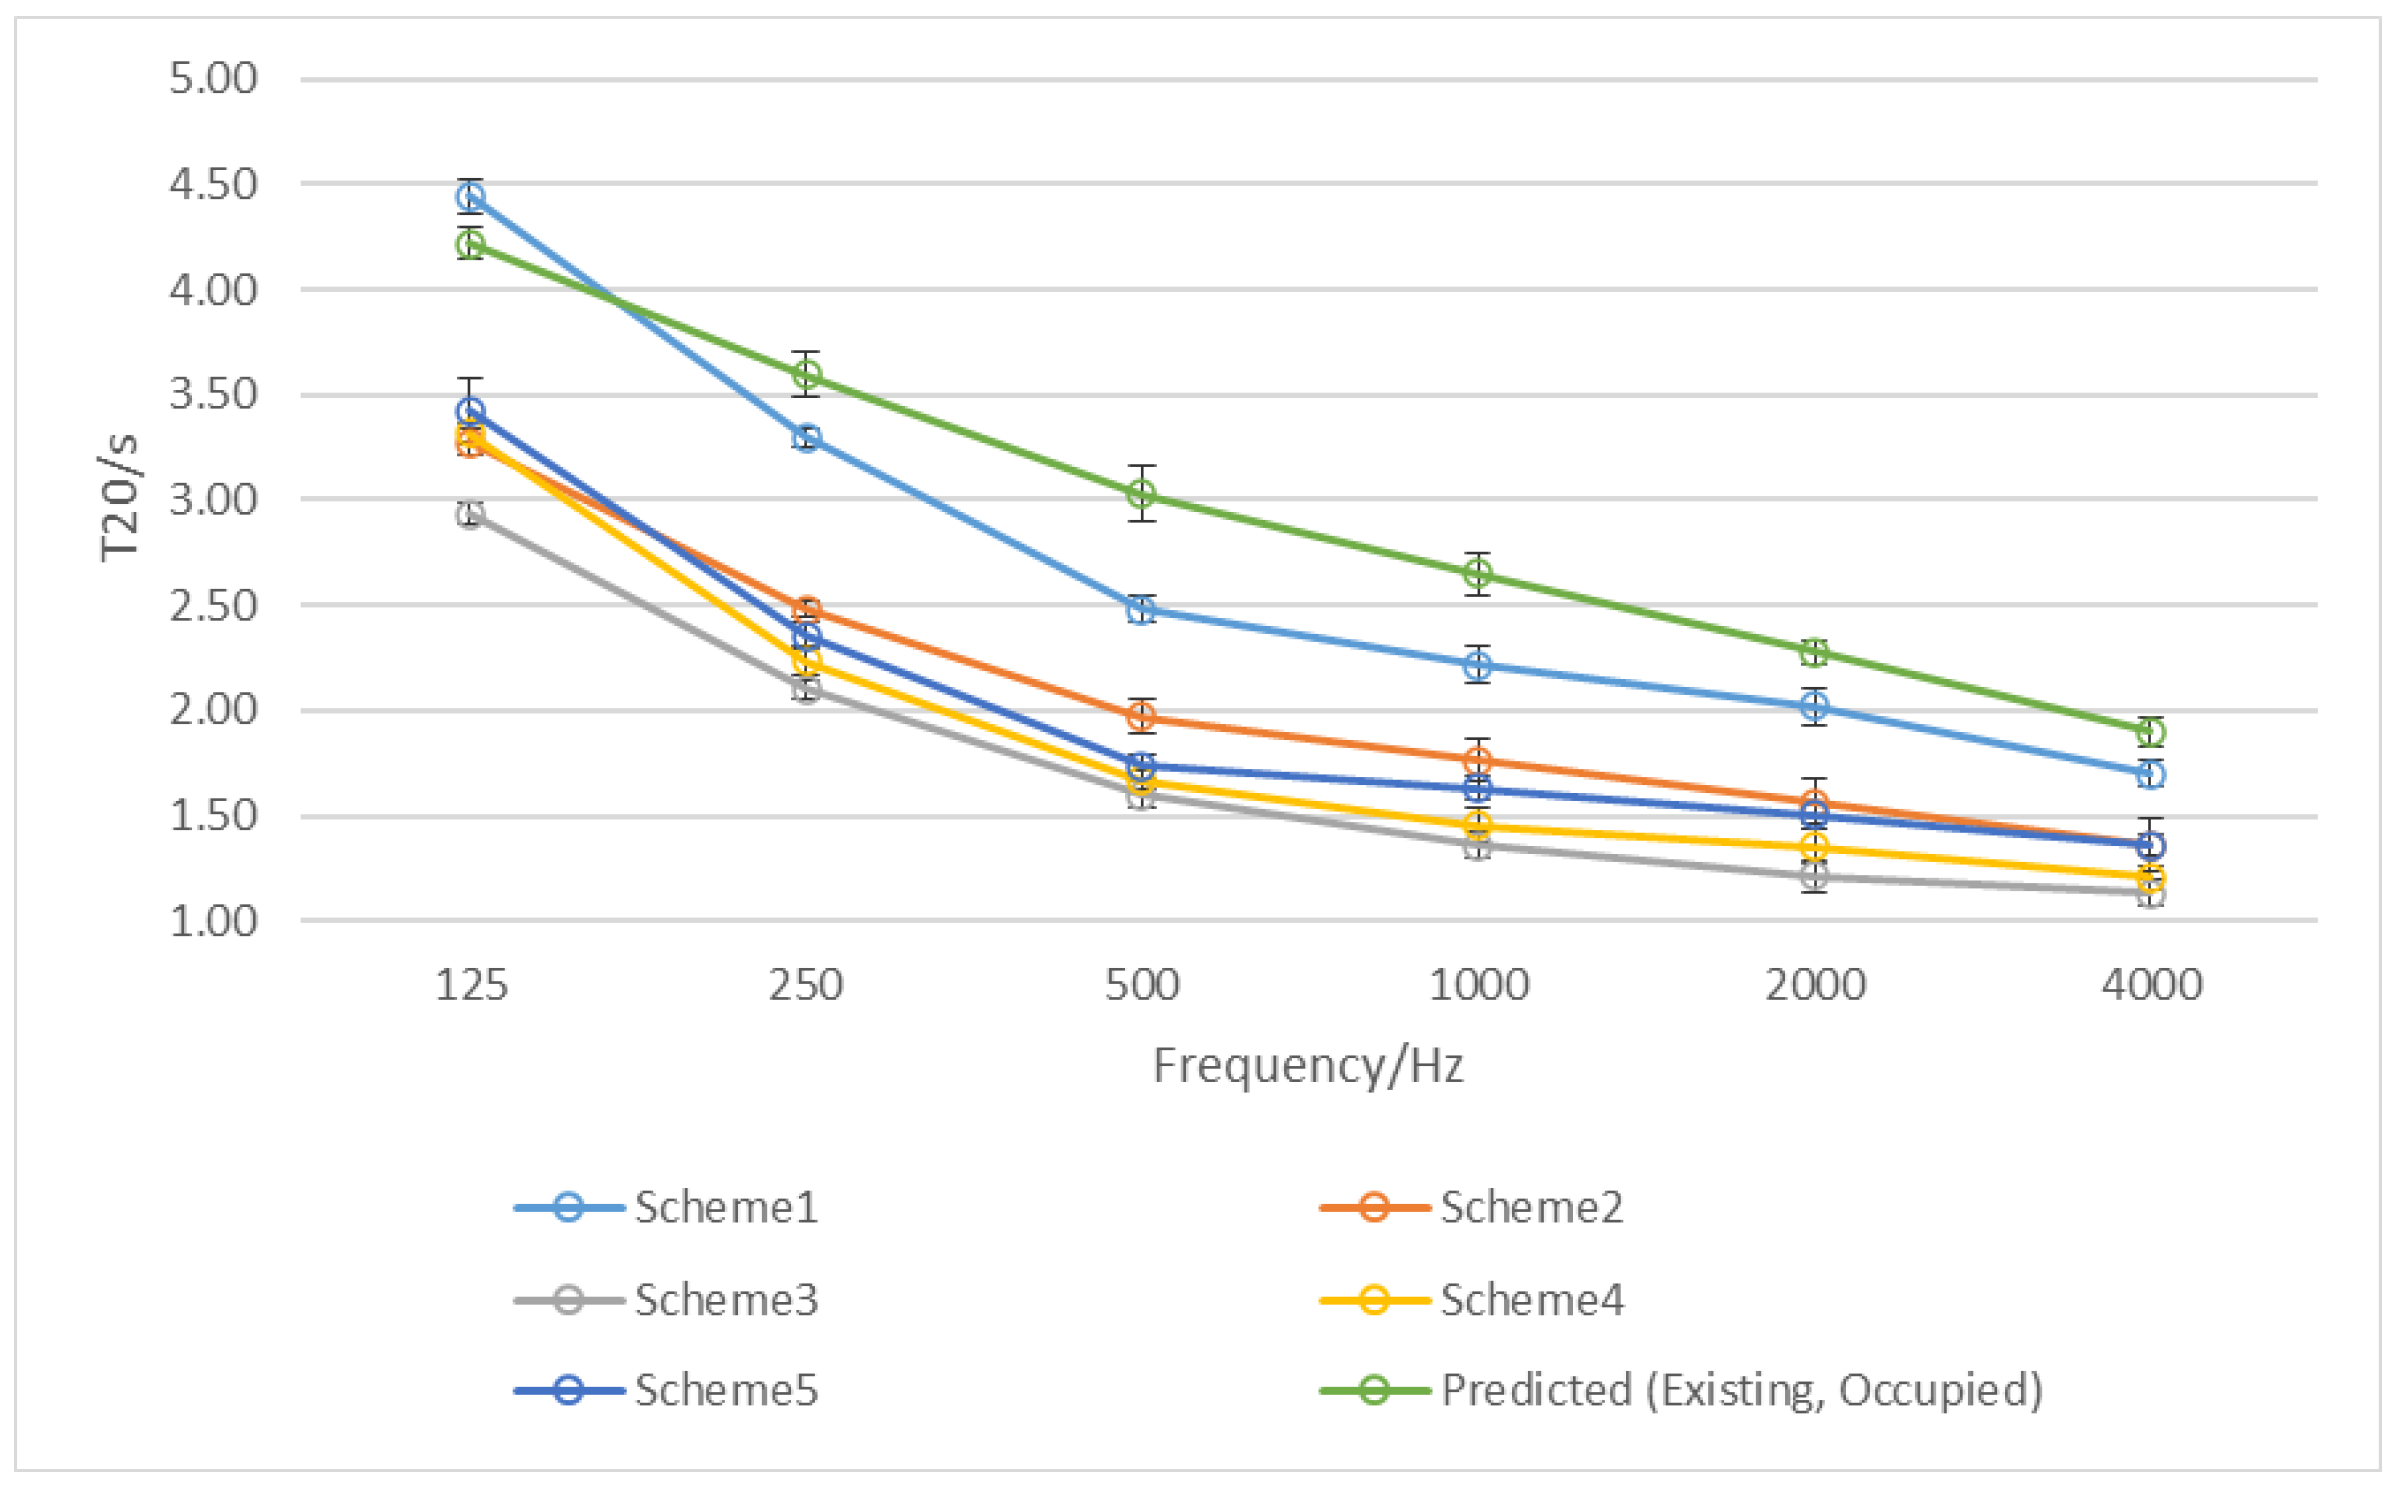
As shown in Figure 12, the overall improvement in reverberation time (T20) across the full frequency range of 125–4000 Hz follows the order: Scheme 3 > Scheme 4 > Scheme 5 > Scheme 2 > Scheme 1. In practical application, the mid-frequency evaluation in this project was based on the reverberation time limit curve for gymnasiums proposed by the Korean scholar Kim Jae-Soo, which adopts 500 Hz as the reference frequency [39]. The upper limit of T20 at 500 Hz was set to 1.8 s. According to the predicted results (rounded to one decimal place), the T20 values at 500 Hz were as follows: Scheme 1 = 2.5 s (exceeding by 0.7 s), Scheme 2 = 2.0 s (exceeding by 0.2 s), Scheme 3 = 1.6 s (0.2 s below the limit), Scheme 4 = 1.7 s (0.1 s below the limit), and Scheme 5 = 1.7 s (0.1 s below the limit). Therefore, the overall improvement ranking at 500 Hz was Scheme 3 > Scheme 4 (Scheme 5) > Scheme 2 > Scheme 1.
As shown in Figure 13, the overall improvement in clarity index (D50) across the full frequency range of 125–4000 Hz follows the order: Scheme 4 > Scheme 3 > Scheme 5 > Scheme 2 > Scheme 1.
The gymnasium discussed in this project is primarily designed for large-scale gatherings, which functionally resemble auditoriums or conference halls. For such spaces, a D50 value of 0.5 or higher is generally considered appropriate to ensure adequate speech clarity [40]. Using the average value between 500 Hz and 1000 Hz as the reference for mid-frequency analysis, the predicted D50 values are as follows: Scheme 1 = 0.42 (0.08 below the target), Scheme 2 = 0.47 (0.03 below), Scheme 3 = 0.51 (0.01 above), Scheme 4 = 0.54 (0.04 above), and Scheme 5 = 0.50 (equal to the target). Accordingly, the overall improvement ranking is Scheme 4 > Scheme 3 > Scheme 5 > Scheme 2 > Scheme 1.
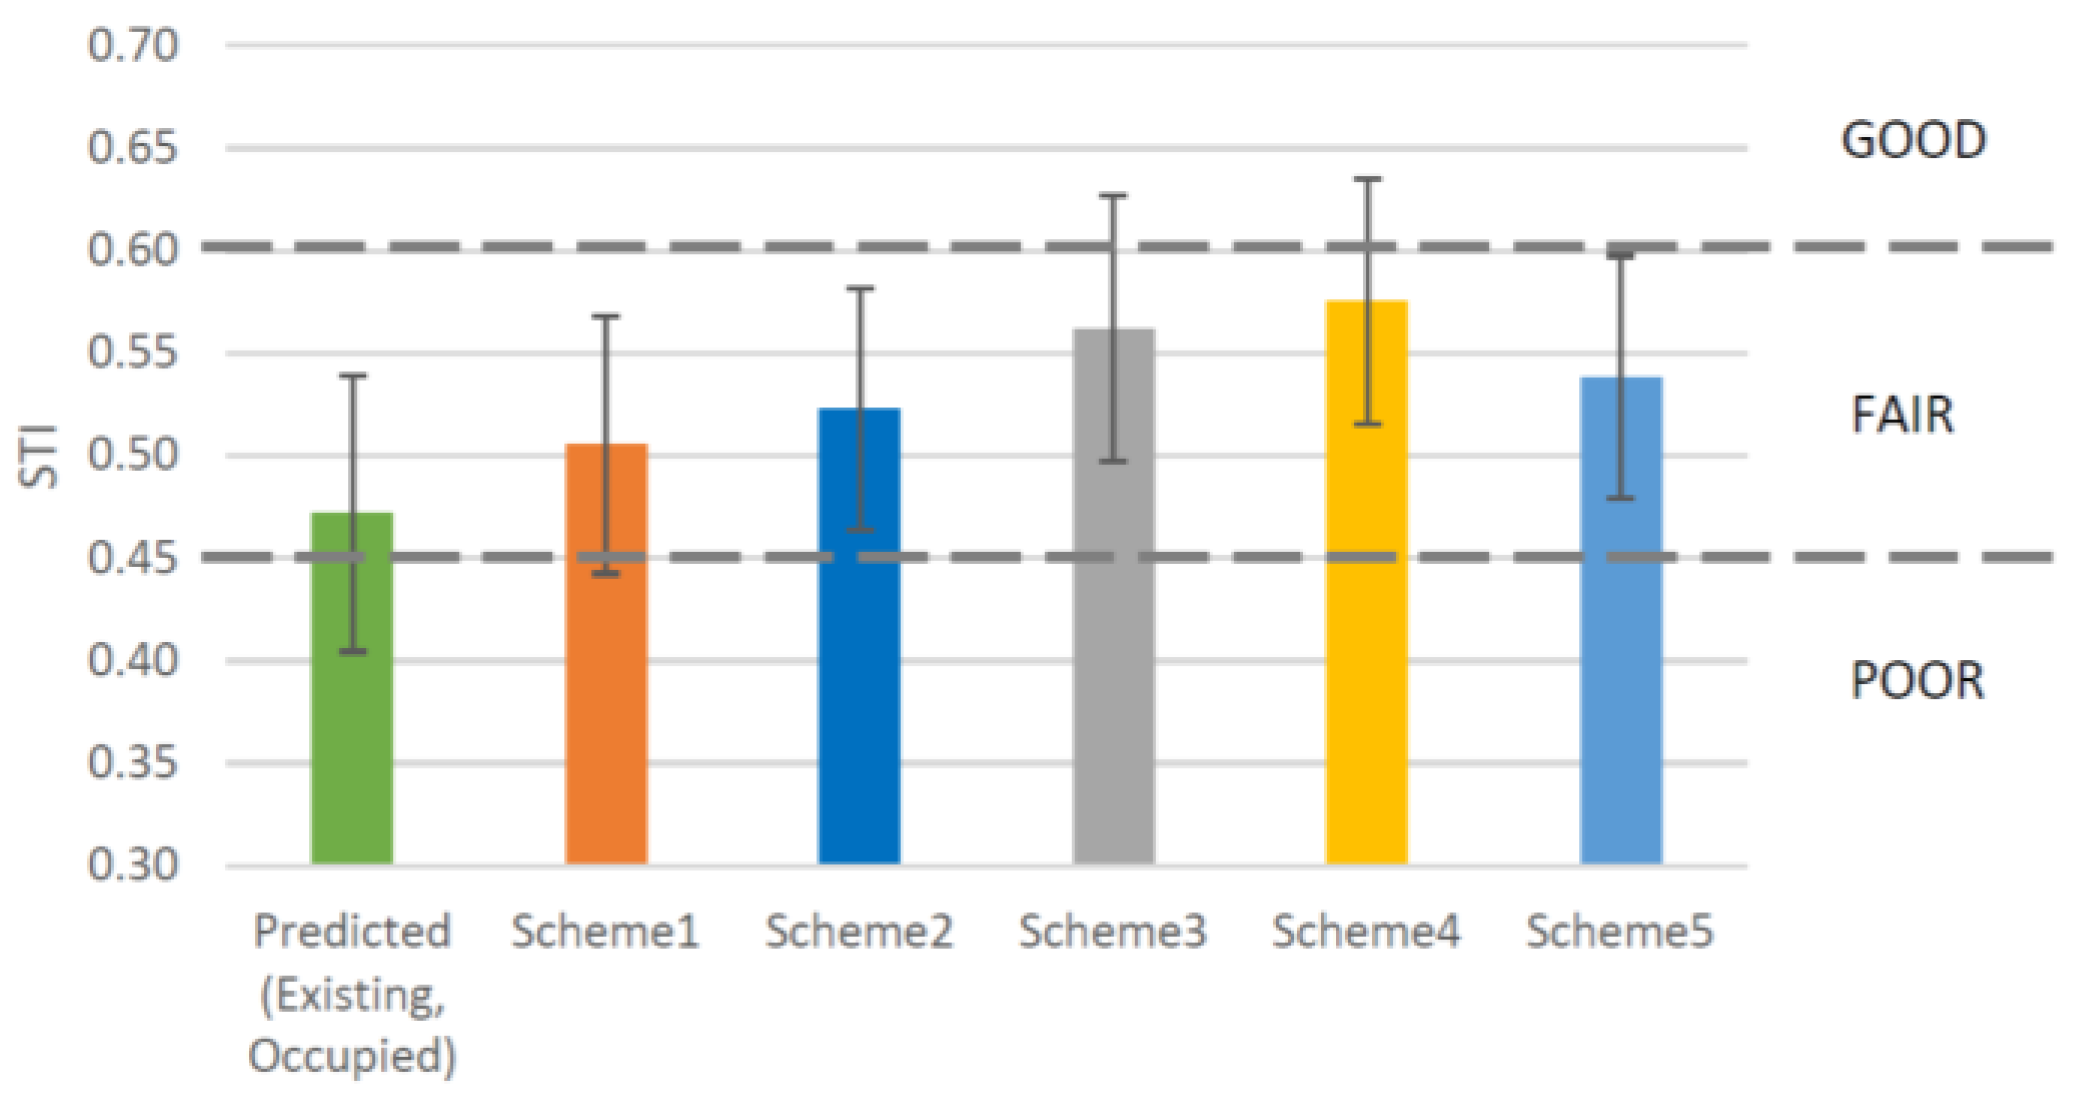
According to ISO 9921 [29], the Speech Transmission Index (STI) in this project should reach 0.45 or higher to be considered acceptable, with higher STI values indicating better speech intelligibility. As shown in Figure 14, the predicted STI values are as follows: Scheme 1 = 0.51 (0.06 above the criterion), Scheme 2 = 0.52 (0.07 above), Scheme 3 = 0.56 (0.11 above), Scheme 4 = 0.58 (0.13 above), and Scheme 5 = 0.54 (0.0 above). Accordingly, the improvement ranking in terms of speech intelligibility is Scheme 4 > Scheme 3 > Scheme 5 > Scheme 2 > Scheme 1.

5.2.2. Comprehensive Evaluation

Based on the comparison of the five design schemes, the acoustic performance can be summarized as follows:
(1) Schemes 3, 4, and 5 meet all the criteria for mid-frequency T20, D50, and STI, with Scheme 3 and 4 performing the best and Scheme 5 slightly lower.
(2) Scheme 2 exhibits a slightly exceeded T20 at 500 Hz (0.2 s above the 1.8 s limit). The average D50 across 500–1000 Hz is 0.47 (rounded to 0.5), meeting the minimum requirement of 0.5, and the STI is 0.52, which also satisfies the minimum requirement of 0.45.
(3) Scheme 1 shows a more significant T20 exceedance at 500 Hz (0.7 s above the 1.8 s limit). The average D50 across 500–1000 Hz is 0.5, meeting the minimum requirement, and the STI is 0.51, also above the 0.45 minimum requirement.
By combining the above acoustic analysis results with the comparison of sound-absorbing material installation quantities (see Table 17), it can be concluded that Scheme 2 represents the most cost-effective and economically efficient renovation option. This scheme achieves a balanced optimization between acoustic performance and construction economy, making it the optimal practical solution for the gymnasium renovation project.

6. Renovation Effect and Comprehensive Analysis

6.1. Aesthetic Effect

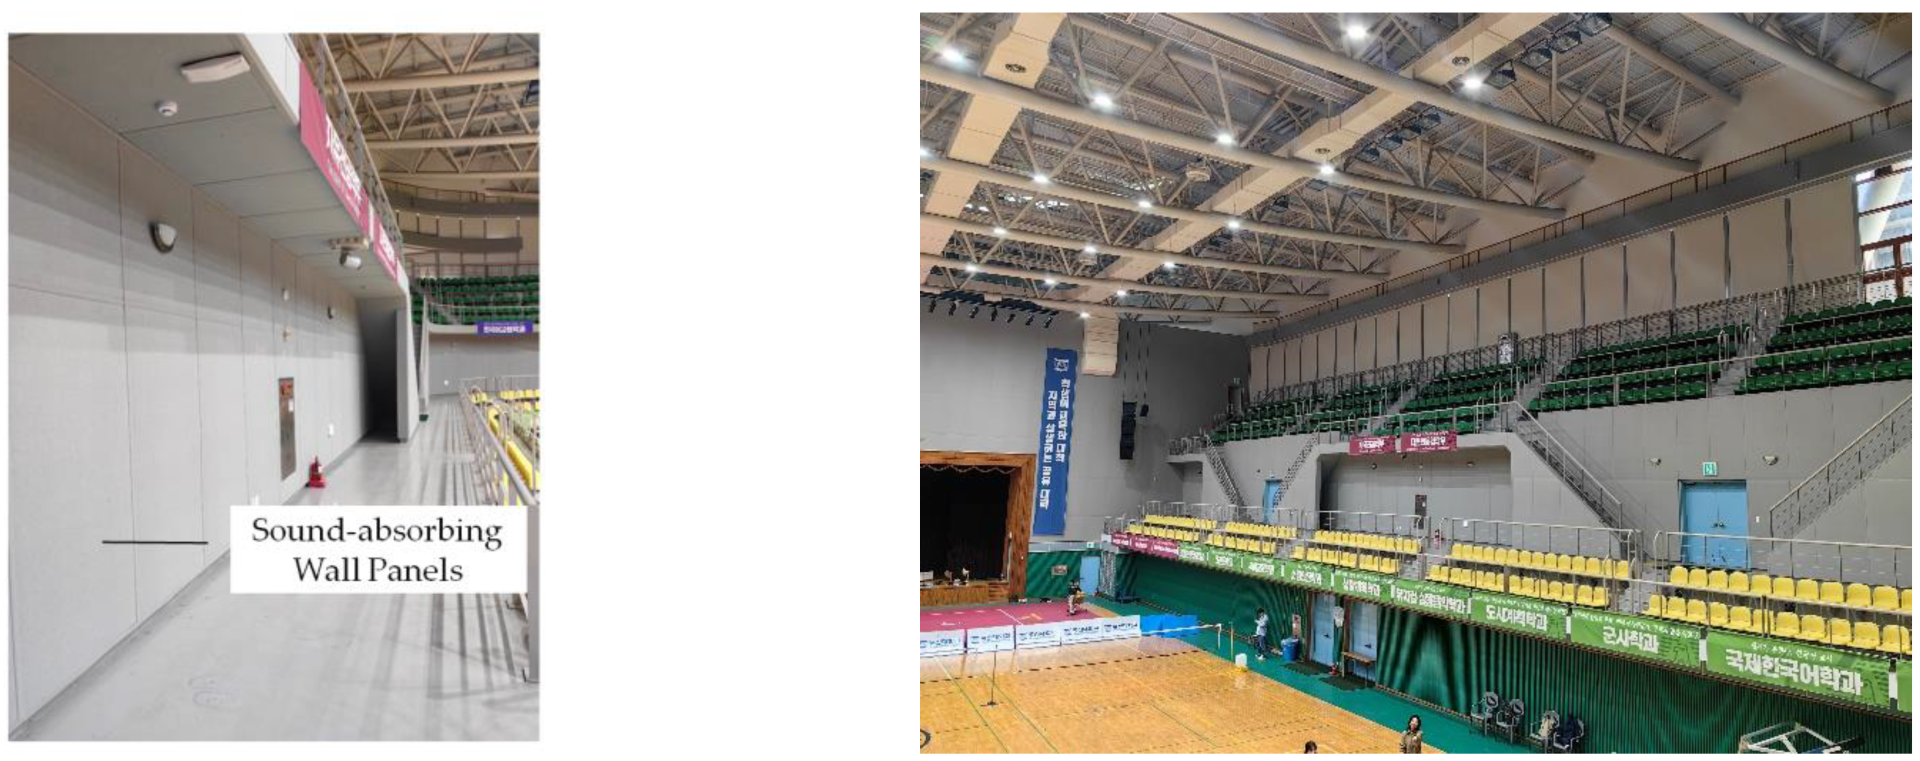
After the renovation, the decorative effect of the newly installed sound-absorbing materials is shown in Figure 15. The overall design is concise and elegant, achieving an organic integration of functionality and aesthetics. This renovation not only effectively improved the indoor acoustic environment but also considered visual appearance and practicality, thereby creating favorable comprehensive conditions for the subsequent use of the multipurpose gymnasium.

6.2. Measured Calibration and Predictive Analysis

6.2.1. Measured Acoustic Parameters After Renovation

In this case, the renovation was carried out following the design concept of Scheme 2. Under unoccupied conditions, the measured acoustic parameters of the gymnasium after renovation, along with the spatial standard deviation (σₛ), are presented in Table 18.

6.2.2. Calibration of the Unoccupied Acoustic Model

Under unoccupied conditions, the calibrated acoustic simulation results are presented in Table 19. This version of the model was developed based on Scheme 2 prior to renovation. Adjustments were primarily made to the absorption and scattering coefficients of the wall-mounted acoustic panels according to their installation positions. The absorption coefficients for the 125–4000 Hz octave bands were set to 0.12, 0.15, 0.24, 0.43, 0.86, and 0.85, respectively, and the scattering coefficient was increased from 0.2 to 0.6, instead of the valued of the absorption coefficient values shown in Table 11. This adjustment was made because the renovated wall surfaces were finished with fabric-covered acoustic panels, which are considerably rougher than the original latex-painted surfaces. In addition, the floor absorption coefficient corresponding to the seating area was changed from the occupied-seat condition to the unoccupied-seat condition, and the absorption parameters for unoccupied seats are consistent with the values presented in Table 3. A Just Noticeable Difference (JND) comparison analysis between the simulated predictions in Table 19 and the measured data in Table 18 (see Table 20) indicates that the difference in T20 is within 1 JND, while the differences in D50 and STI are within 2 JNDs. According to the findings of Vorländer [37], an error range within 2 JNDs is acceptable in acoustic simulations. Therefore, the simulated results in this study demonstrate good agreement with the measured data.
In summary, the established acoustic model exhibits high reliability, and the input values for the absorption and scattering coefficients of the wall-mounted acoustic panels are reasonably accurate. Based on this model, the acoustic prediction under occupied (full-audience) conditions can be considered consistent with the actual acoustic performance, this provides a solid and practical reference for evaluating the anticipated acoustic outcomes of the gymnasium.

6.2.3. Simulation Prediction Results

To assess the acoustic performance under actual full-occupancy conditions, the calibrated and refined model described above was used to further predict the T20, D50, and STI values, as presented in Table 21.
A comparison between Table 13 and Table 21, which contrasts the design predictions of Scheme 2 with the simulated full-occupancy values after renovation, shows that T20 differs by approximately 1 JND across the 125–4000 Hz range, D50 differs by about 2 JND at 125 Hz and by 1 JND across 250–4000 Hz, and STI differs by approximately 1 JND. These results indicate a good consistency between the scheme evaluation and the actual implemented performance.

6.3. Before-and-After Comparative Analysis

6.3.1. Reverberation Time (RT)

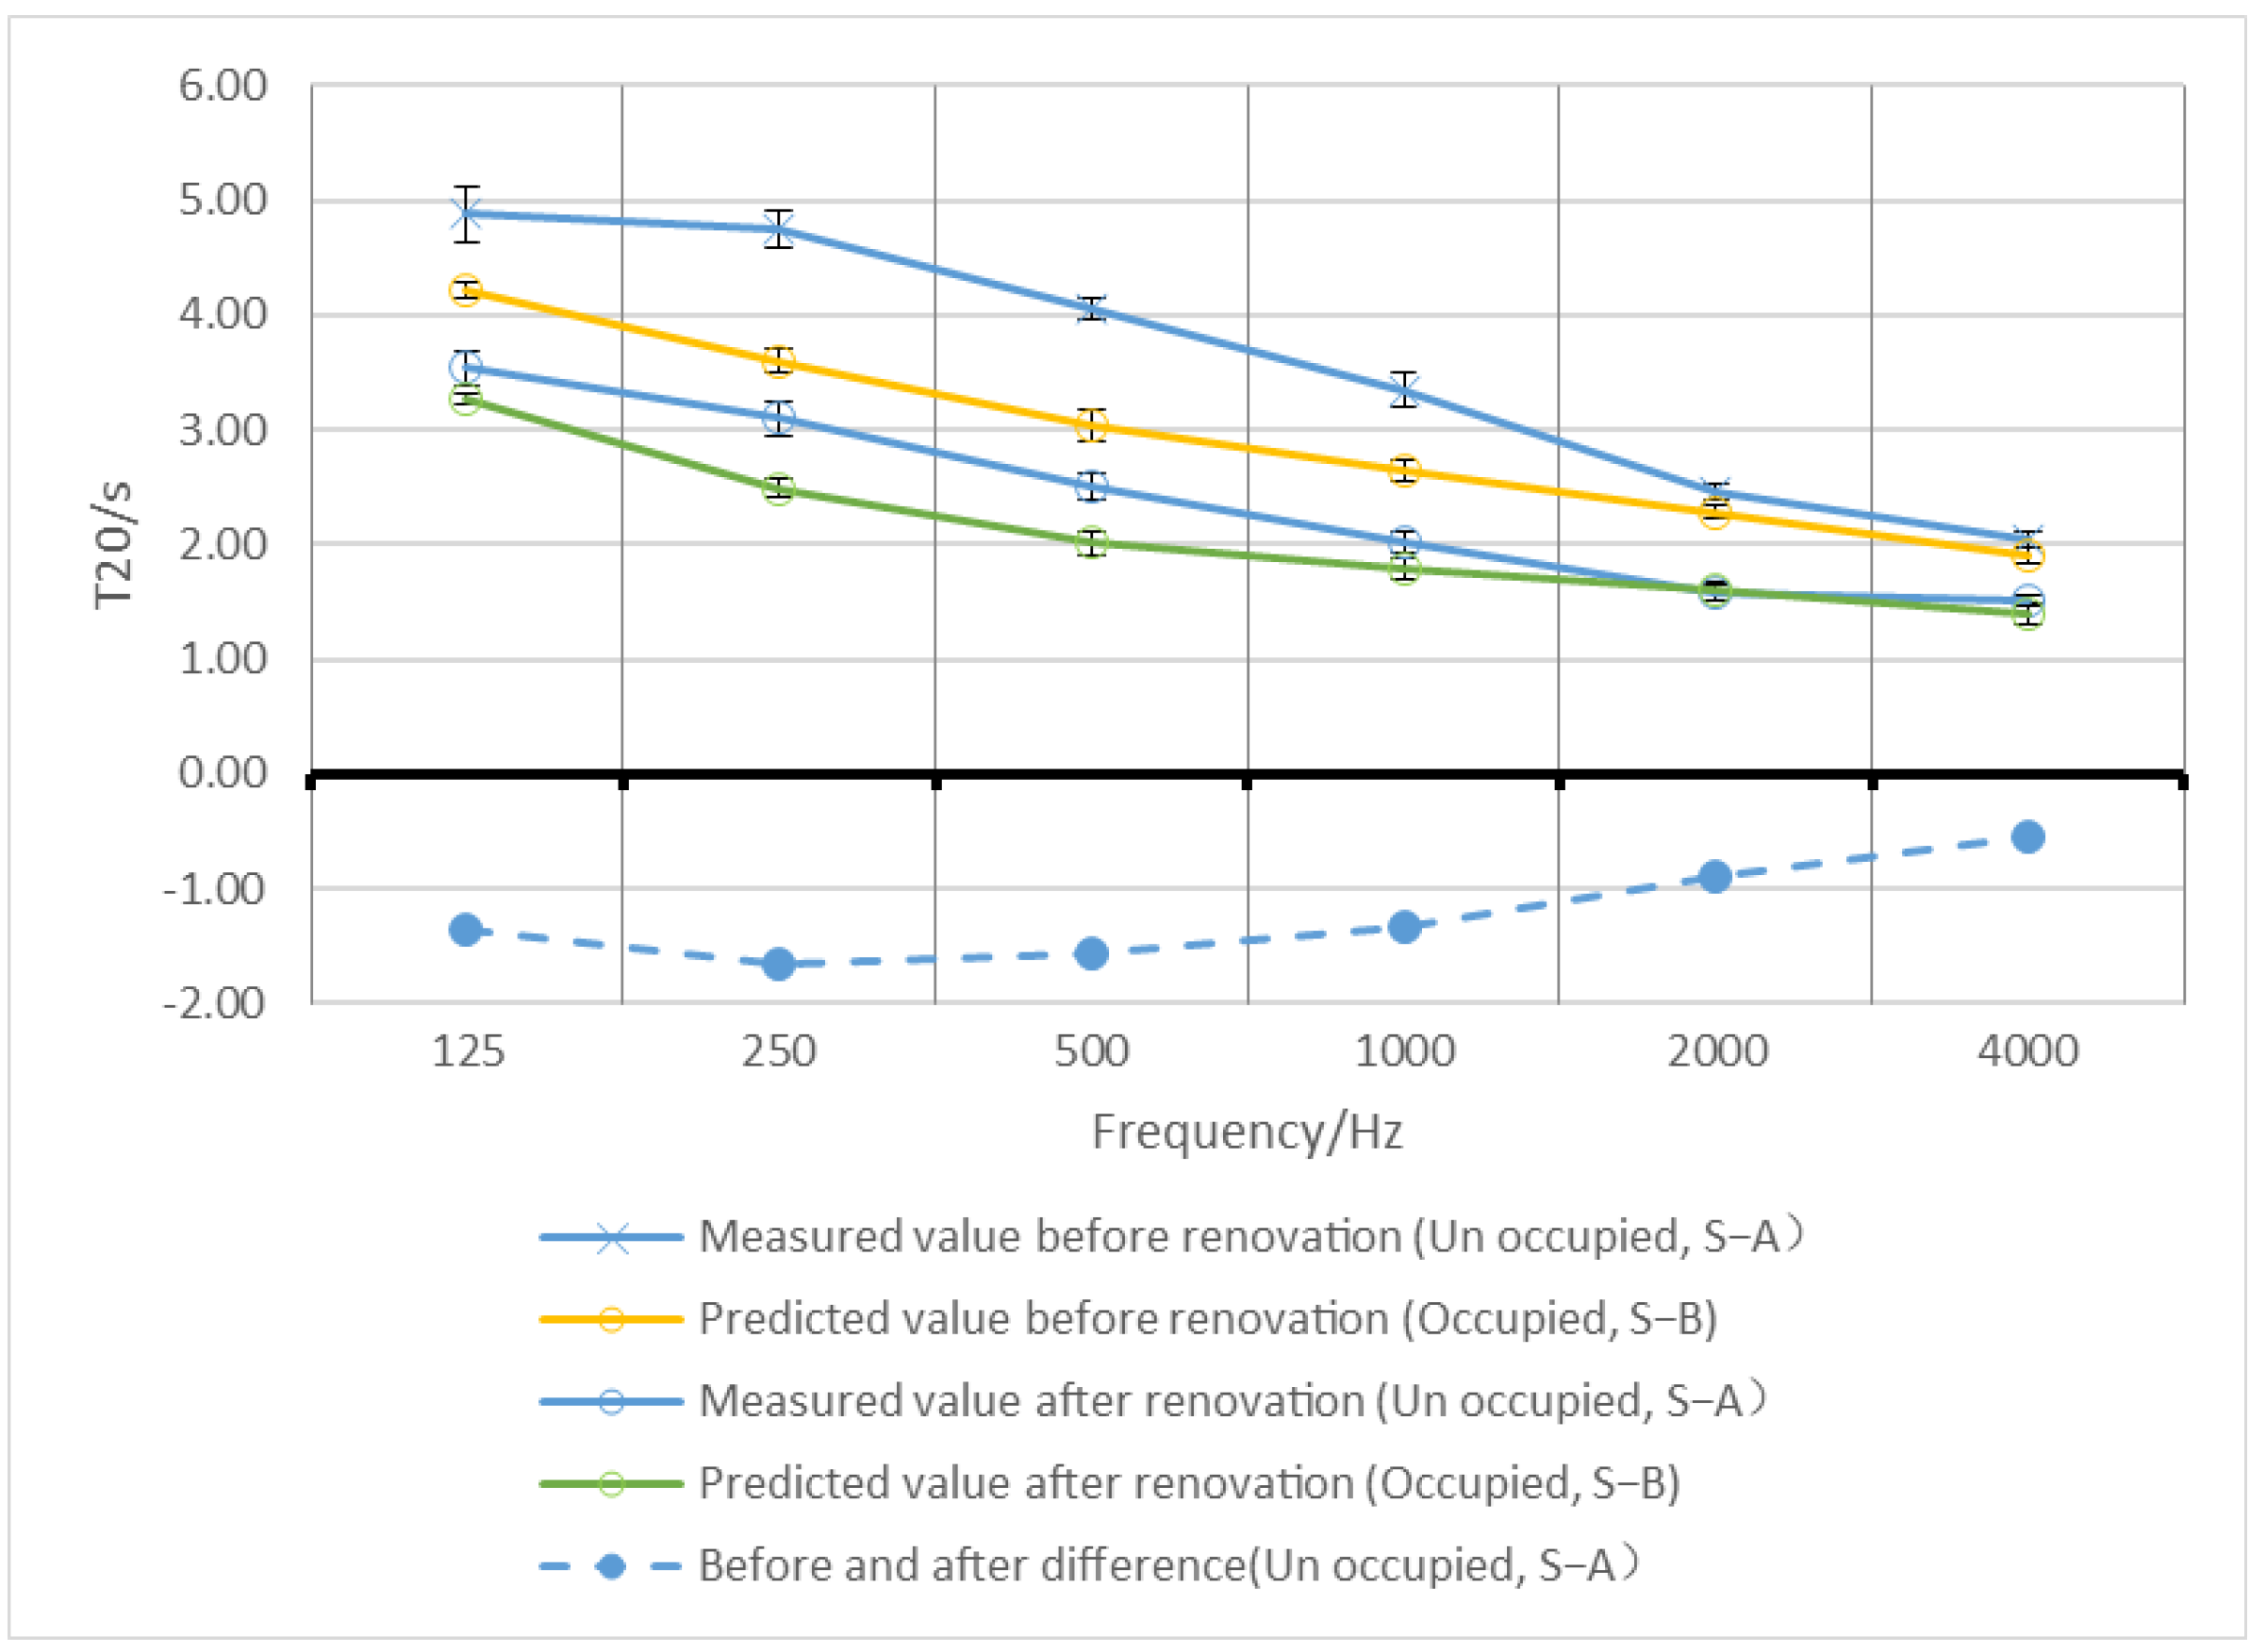
Using the mid-frequency of 500 Hz as the reference [39], the measured T20 values of the empty hall before and after renovation were compared (see Figure 16, blue line). The test sound source was placed at the center of the stage (denoted as S-A). For the average value of the eleven measurement positions, the T20 at 500 Hz decreased from 4.05 s (Table 1) to 2.50 s (Table 18), representing an improvement of 1.55 s. This indicates that after the installation of wall sound-absorbing panels according to Scheme 2, the T20 was significantly reduced, the improvement is more pronounced in the low- and mid-frequency range below 1000 Hz.
A comparison was also made between the predicted full-occupancy T20 values before and after renovation (see Figure 16, yellow and green lines). The simulated sound source was located on both sides of the proscenium wall (denoted as S-B), corresponding to the actual loudspeaker installation positions. For the average value of the eleven measurement points, the pre-renovation prediction under fully occupied conditions showed that the absorption increment due to the audience reduced the T20 at 500 Hz from 4.05 s (Table 1) to 3.03 s (Table 9), yielding an improvement of 1.02 s. After renovation, under the same conditions, the T20 at 500 Hz further decreased from 2.50 s (Table 18) to 2.01 s (Table 21), with an improvement of 0.49 s. Although both cases reflect the contribution of the audience seating absorption to the reduction in reverberation time in the simulation, the magnitude of improvement differs significantly. This discrepancy is mainly attributed to the enhanced overall sound absorption characteristics of the space after renovation, which reduced the relative proportion of audience absorption in the total absorption increment.
The upper limit of T20 at 500 Hz is 1.8 s. The post-renovation full-occupancy predicted value of 2.01 s exceeds this limit by 0.21 s, which is generally consistent with the expectations of Scheme 2.

6.3.2. Definition (D50)

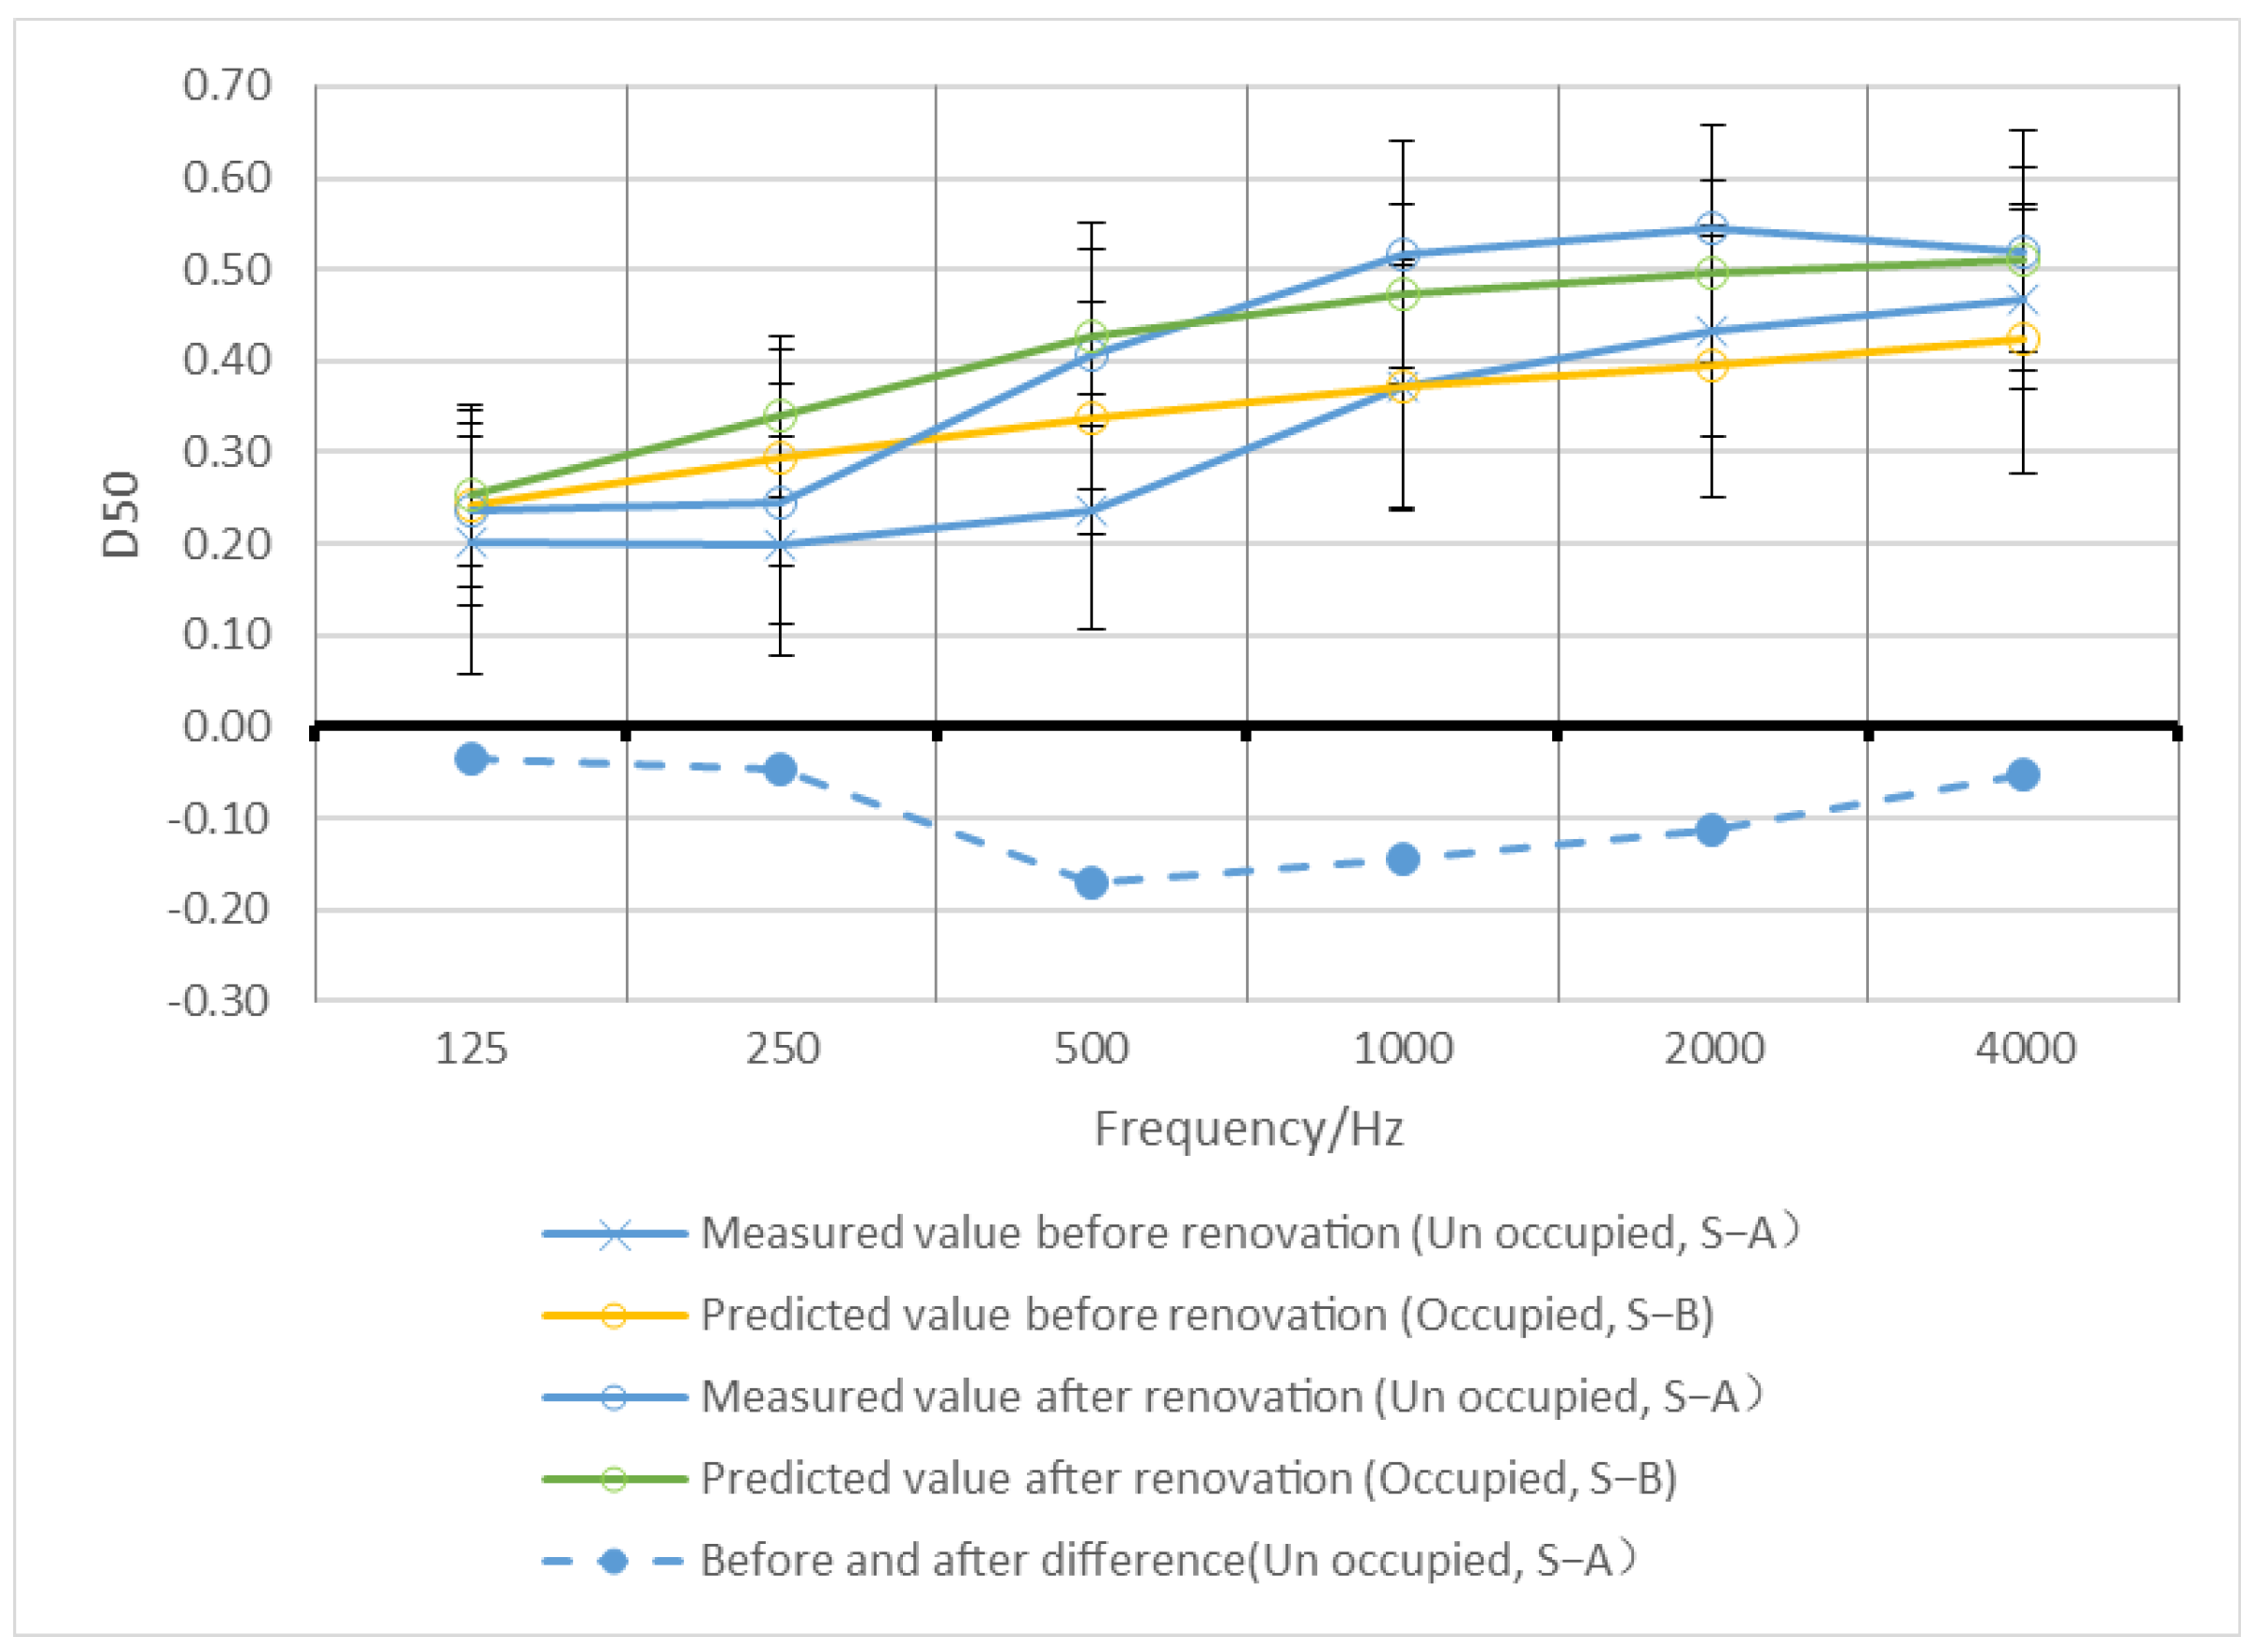
Using the mid-frequency range of 500–1000 Hz as the reference, the measured D50 values of the empty hall before and after renovation were compared (see Figure 17, blue line). The test sound source was arranged in the S-A configuration. For the average value of the eleven measurement positions, the D50 increased from 0.31 (Table 1) to 0.46 (Table 18), yielding an improvement of 0.15. This indicates that after the installation of wall sound-absorbing panels according to Scheme 2, the D50 increased significantly, with a more pronounced improvement observed in the mid-frequency at 500–1000 Hz.
A comparison was also made between the predicted full-occupancy D50 values before and after renovation (see Figure 17, yellow and green lines). The simulated sound source was arranged in the S-B configuration. For the average of the eleven measurement points, the pre-renovation prediction under fully occupied conditions showed that the absorption increment due to the audience increased the D50 from 0.31 (Table 1) to 0.35 (Table 9), an improvement of 0.10. After renovation, under the same conditions, the D50 slightly decreased from 0.46 (Table 18) to 0.45 (Table 21), with an improvement value of −0.01, indicating almost no enhancement. From the mid-frequency range of 500–1000 Hz, although both cases represent the contribution of audience absorption to the D50 improvement in the simulation, the magnitude of improvement differs considerably. This discrepancy is mainly due to the enhanced overall sound absorption characteristics of the space after renovation, which reduced the relative proportion of audience absorption in the total absorption increment, resulting in little additional contribution to D50 improvement.
Based on the explanation of D50 provided by Barron [40], values of 0.50 or higher generally correspond to good speech clarity. The post-renovation full-occupancy predicted mean D50 value of 0.45 at 500–1000 Hz is very close to this threshold, which aligns well with the expectations of Scheme 2 and provides satisfactory performance for auditorium and assembly functions of the gymnasium.

6.3.3. Speech Transmission Index (STI)

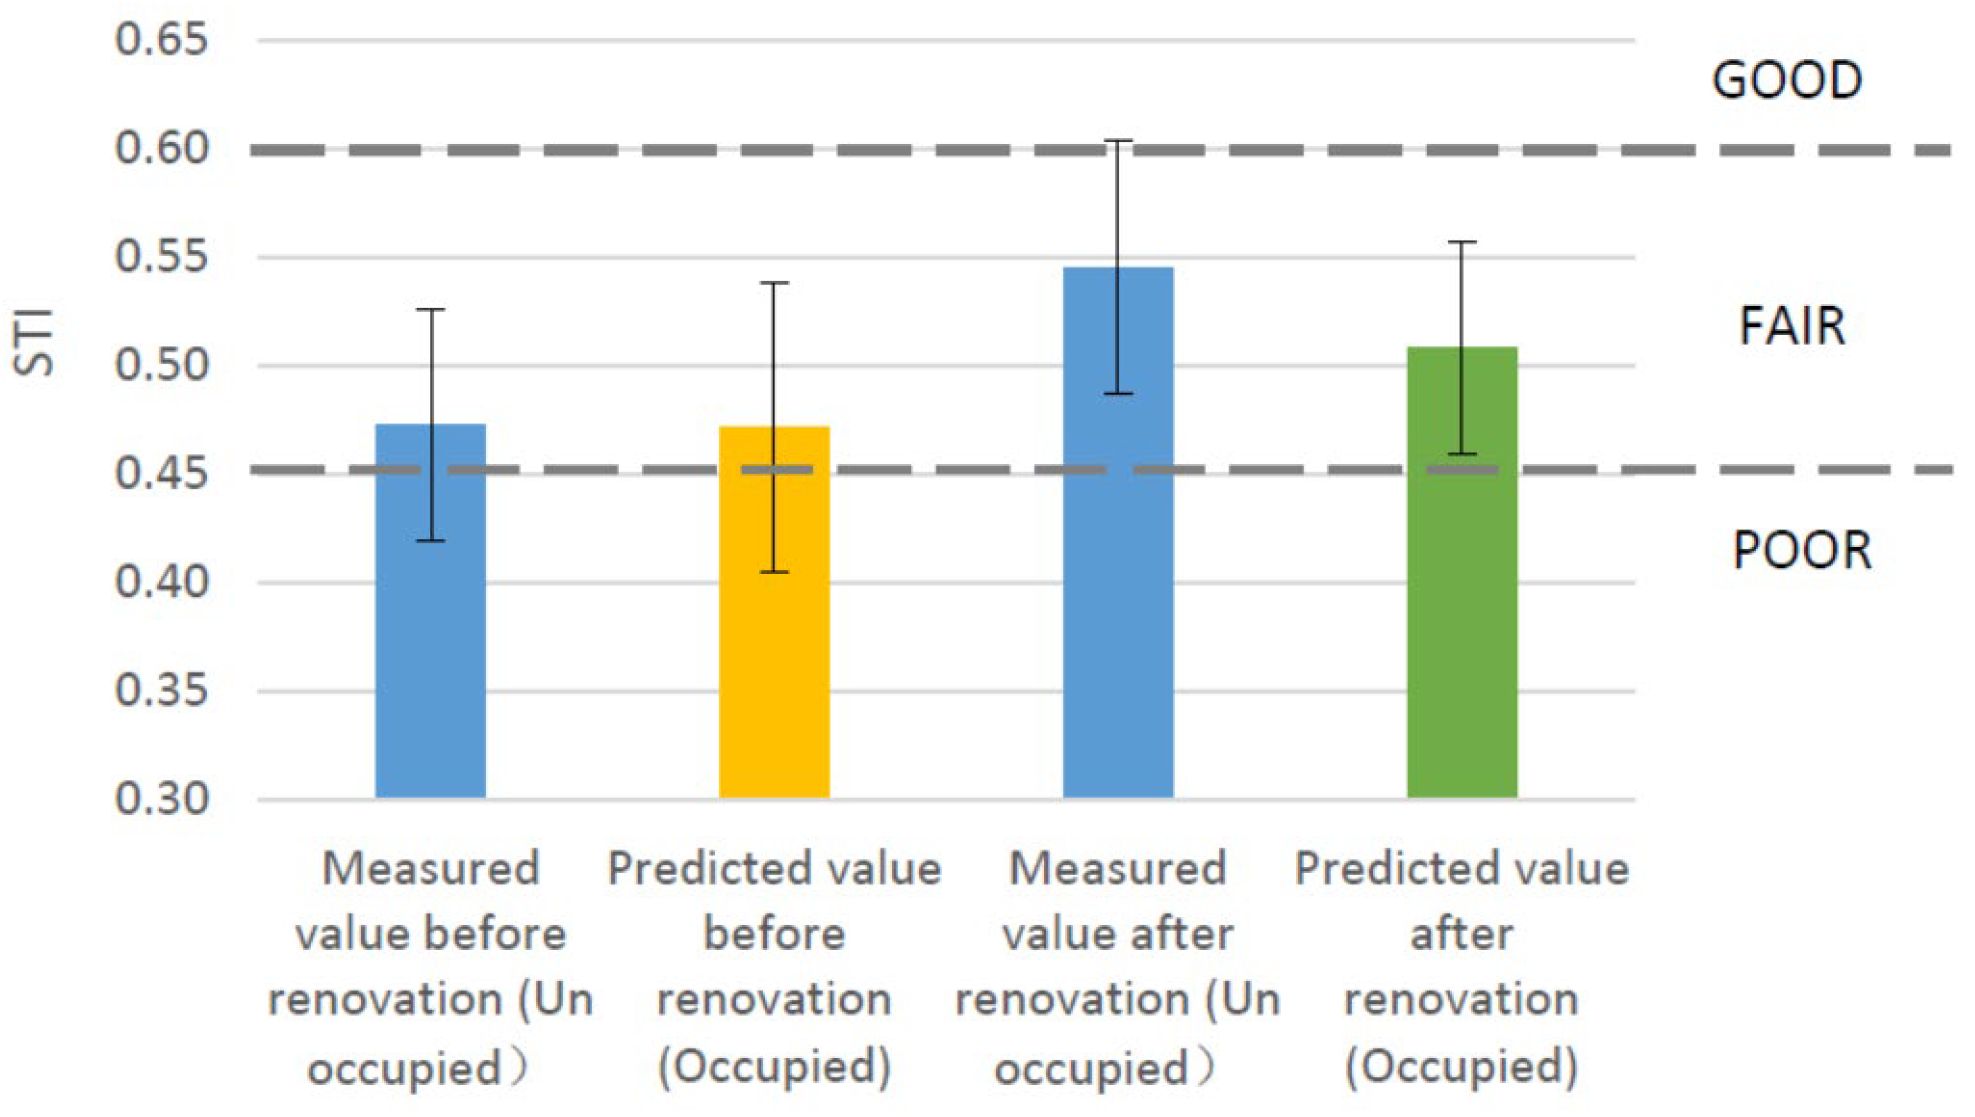
A comparison was made between the measured STI values of the empty hall before and after renovation (see Figure 18, blue bar). The test sound source was arranged in the S-A configuration. For the average of the eleven measurement points, The STI increased from 0.47 (Table 1) to 0.55 (Table 18), with an improvement of 0.08. This indicates that the installation of wall acoustic panels in Scheme 2 contributes to enhancing the STI; however, the magnitude of improvement remains relatively limited.
A further comparison was made between the predicted full-occupancy STI values before and after renovation (see Figure 18, yellow and green bar). The simulated sound source was arranged in the S-B configuration. For the average of the eleven measurement positions, before the renovation, the additional absorption introduced by a fully occupied audience did not produce a noticeable change in STI, which remained at 0.47 (Table 1 and Table 9). After the renovation, under the same fully occupied condition, the STI decreased from 0.55 (Table 18) to 0.51 (Table 21), yielding an improvement of –0.04, essentially indicating no change. In both cases, the simulated absorption increment contributed by audience occupancy did not lead to a significant improvement in STI. This is primarily because the seating area is located close to the grandstand wall, and the early reflections from this wall dominate the STI performance. Although audience absorption reduces the reverberation time, its effect on enhancing STI is comparatively limited.
According to ISO 9921 [29], an STI value of 0.45 or higher is sufficient to meet the requirements of general speech-oriented spaces. In this project, the pre-renovation mean STI value was 0.47, which theoretically indicates satisfactory speech intelligibility. However, in the actual field environment, strong echoes and excessively long reverberation time resulted in poor speech intelligibility despite the seemingly adequate STI value.

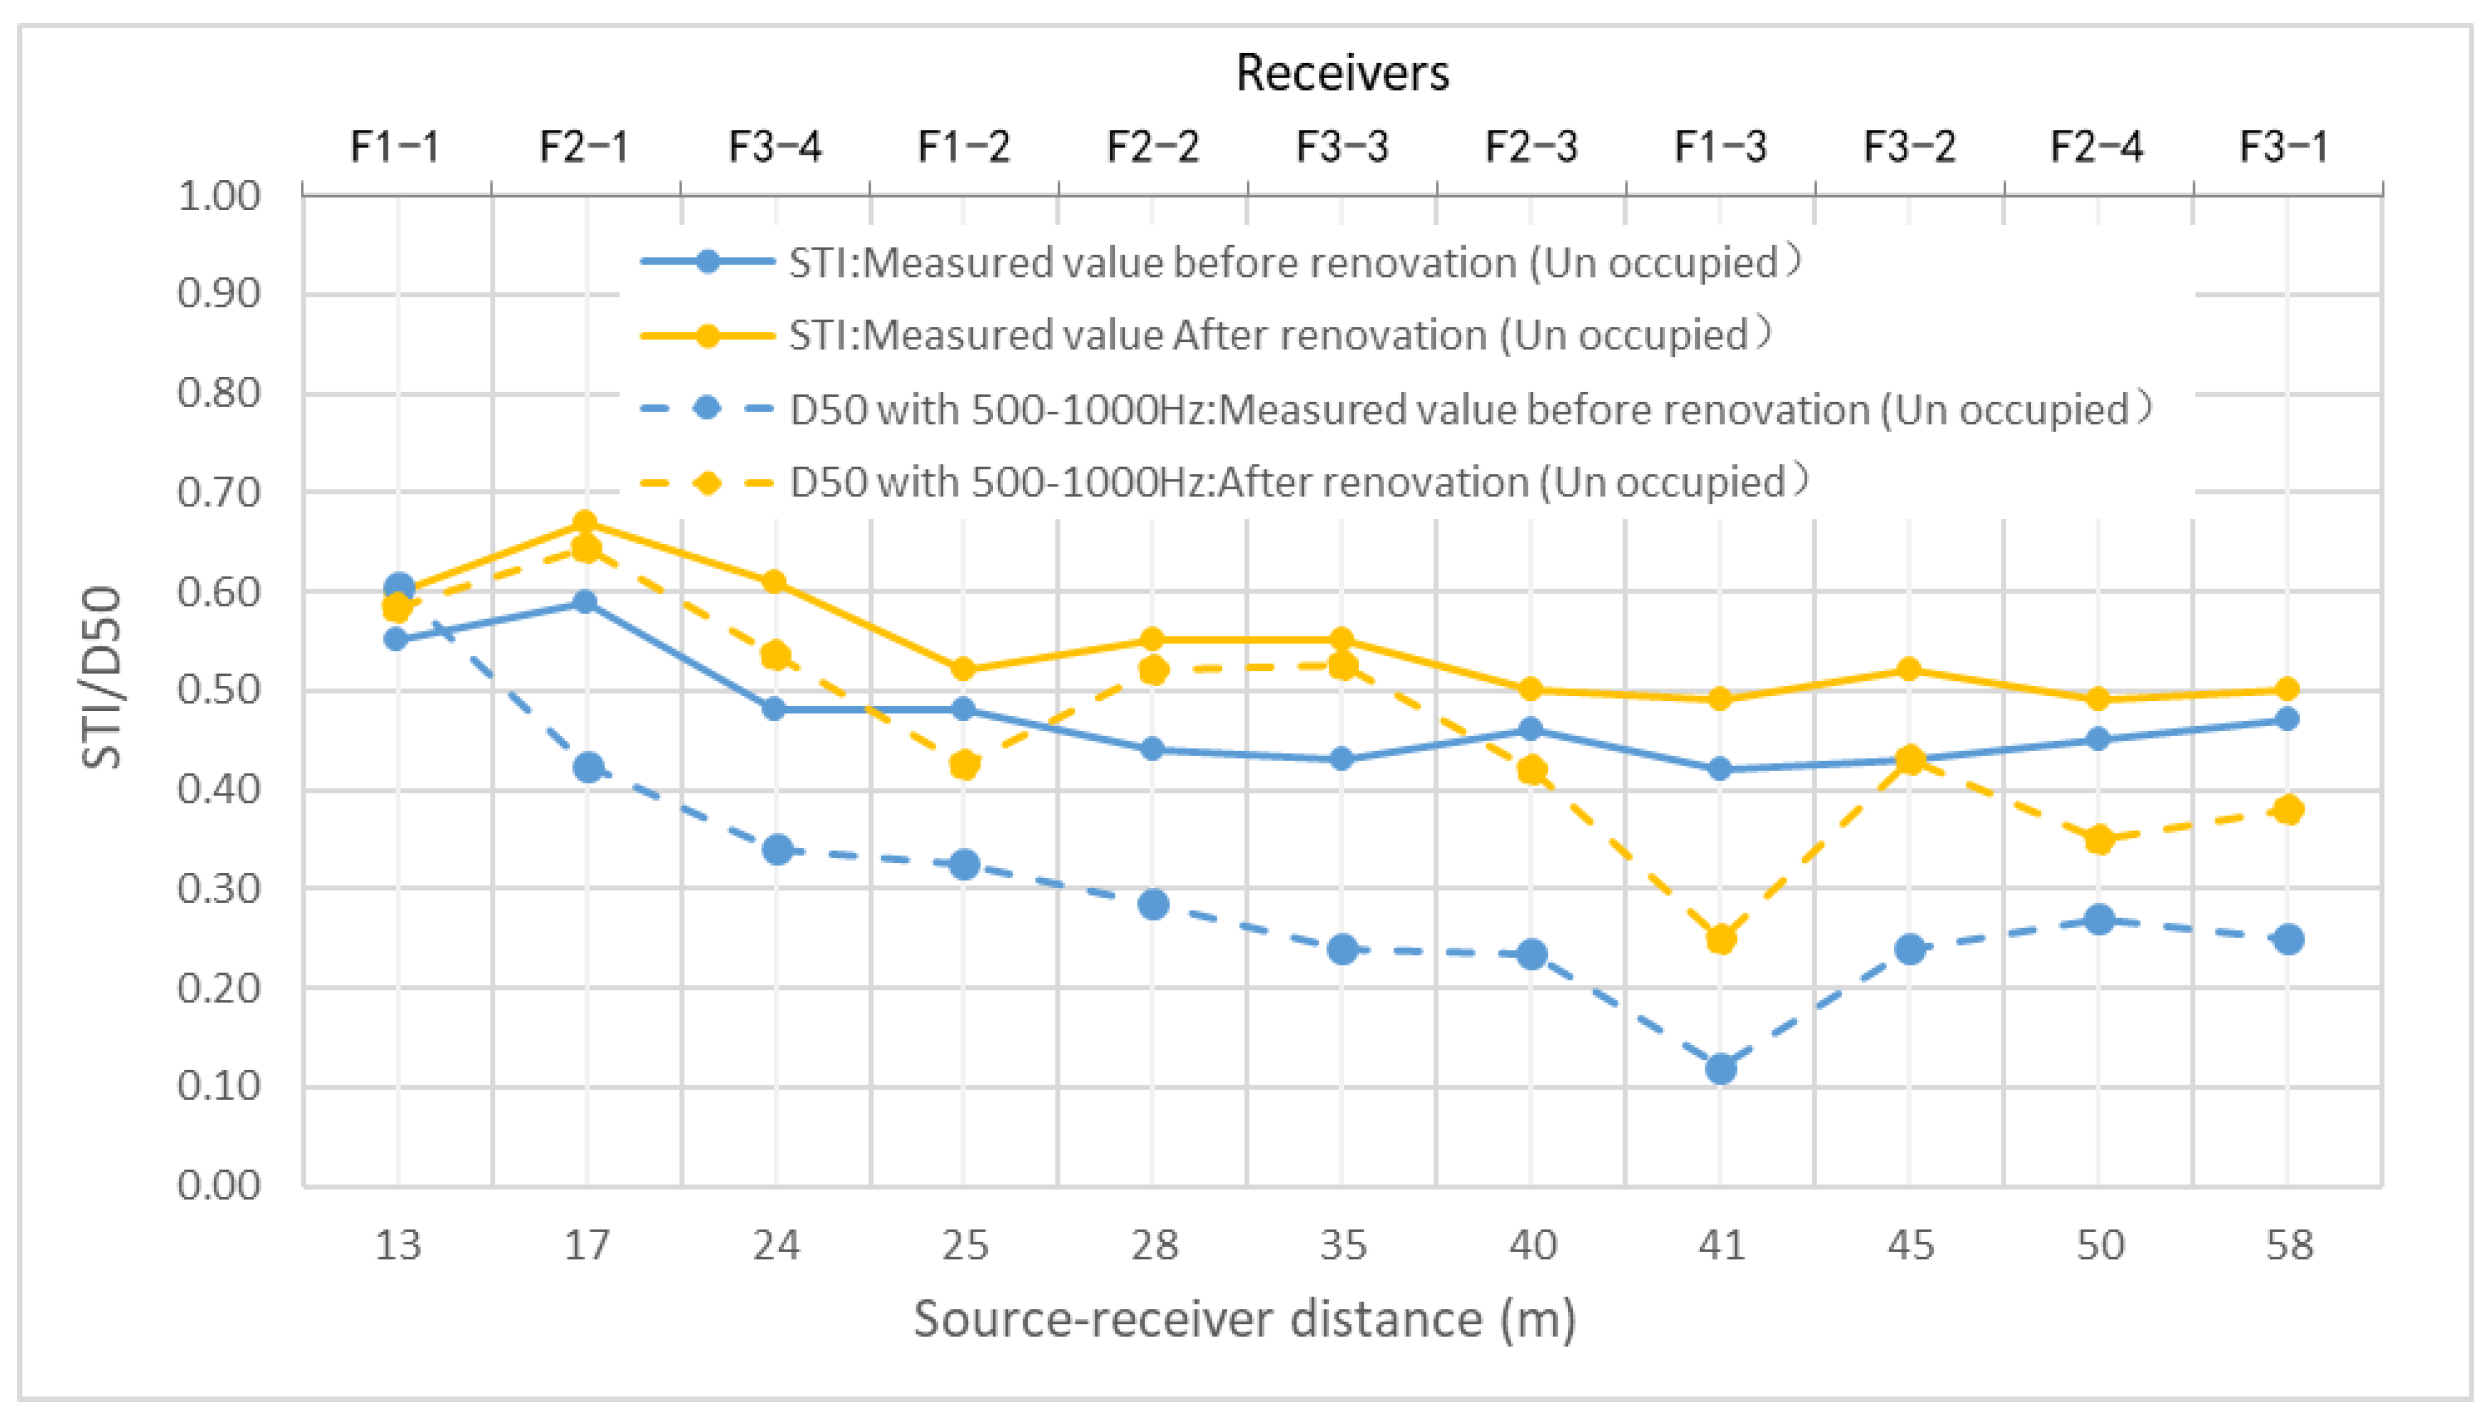
6.4. Correlation of STI and D50 with Source–Receiver Distance

From the measured results under empty-hall conditions before and after renovation (see Figure 19), it can be clearly observed that both STI and D50 show a strong correlation with the distance between the sound source and the receiver. The two parameters exhibit similar variation trends, which are primarily influenced by the direct sound strength, early reflection energy, and late reflection energy [47]. When the receiver is located closer to the sound source, the direct sound is stronger, resulting in higher STI and D50 values (e.g., measurement points F1-1, F2-1, and F3-4). Conversely, as the distance increases, both STI and D50 values gradually decrease. It is also noteworthy that the measurement points at higher elevations generally exhibit slightly higher STI and D50 values than those at lower positions.

7. Summary and Conclusions

The multi-purpose gymnasium examined in this study exhibited significant acoustic problems prior to renovation, characterized by distinct echo phenomena, excessively long reverberation time, and inadequate speech clarity. These deficiencies impaired the daily use of the facility and also created noticeable disturbance and discomfort for the people using it. As part of the existing ceiling had already been equipped with sound-absorptive materials, the renovation project was designed to maximize the contribution of the existing absorptive ceiling while optimizing the layout, selection, installation structure, and total area of the additional sound-absorbing materials. By establishing appropriate target acoustic parameters, a cost-effective and efficient renovation scheme was proposed. After the renovation, the gymnasium successfully hosted multiple large-scale assemblies and sporting events, demonstrating a remarkable improvement in the indoor acoustic environment. The adopted scheme achieved excellent acoustic performance with minimal construction investment and efficient implementation, while also significantly enhancing the overall utilization of the facility.
In the measurement of the existing acoustic conditions, 11 representative measurement positions were arranged, with the main acoustic parameters including T20, D50, and STI. The acoustic analysis was conducted based on the average values of the 11 measurement points, and the spatial standard deviation was adopted to represent the spatial uniformity of the acoustic parameters within the hall. Subsequently, the ODEON software was employed, and the Just Noticeable Difference (JND) method was used to calibrate and compare the pre-renovation empty-hall measured values with the simulated predictions, thereby establishing a highly accurate acoustic model and boundary absorption coefficients. Based on this model, the acoustic performance under full-occupancy conditions was further predicted and analyzed. The results showed that while the STI values performed satisfactorily, both T20 and D50 exceeded the recommended limits, with T20 exceeding the reference value at 500 Hz by approximately 1.2 s. Furthermore, five feasible acoustic renovation schemes were simulated and compared in terms of T20, D50, and STI under full-occupancy conditions. Each scheme was evaluated comprehensively with respect to its cost-effectiveness and compliance with acoustic standards. Among them, Scheme 2, although slightly exceeding the 500 Hz T20 target by 0.2 s, was found to satisfactorily meet practical usage requirements while significantly reducing the installation area of sound-absorptive materials, thus achieving an optimal balance between acoustic performance and economic efficiency. After the implementation of Scheme 2, the empty-hall field measurements indicated that the STI remained nearly unchanged, whereas T20 decreased substantially and D50 increased noticeably. On this basis, the JND method was applied again to recalibrate the empty-hall acoustic model, followed by a prediction of the full-occupancy acoustic parameters. A comparison between the predicted results of Scheme 2 and the measured post-renovation data revealed that the T20 differences across the 125–4000 Hz frequency range were approximately 1 JND, the D50 differences were about 2 JND at 125 Hz and around 1 JND between 250 and 4000 Hz, and the STI difference was also approximately 1 JND. These findings demonstrate that the acoustic model developed in this study is both reliable and accurate, providing a valuable reference for the acoustic design and renovation of similar multi-purpose gymnasiums.
As shown in Figure 19, Both STI and D50 exhibit a significant correlation with the source–receiver distance and show similar variation trends. When the receiver is located closer to the sound source, the direct sound dominates, resulting in higher STI and D50 values. Conversely, as the distance increases, both indices gradually decrease. It is also noteworthy that the measurement points at higher elevations show slightly higher STI and D50 values than those at lower positions. Furthermore, in this gymnasium case, the seating areas on the second and third levels are located close to the grandstand wall, allowing early reflections from the wall to become the primary contributors to STI performance. Although audience occupancy increases absorption and consequently reduces the reverberation time, its effect on improving STI remains relatively limited.
Calibration of the ODEON model using the measured values under empty-hall conditions served as a fundamental and critical step for verifying the reliability of prediction results among different renovation schemes. The study revealed that the scattering coefficient had a particularly significant influence on the simulation outcomes. Therefore, when comparing and evaluating design alternatives, in addition to assigning appropriate sound absorption coefficients to the absorptive materials, the selection and definition of scattering coefficients should also be regarded as one of the key parameters requiring special attention in similar projects.
In this project, the sound-absorbing panels installed on the grandstand walls were applied using a direct adhesive mounting method without an air cavity, which exhibits a typical mid-to-high frequency absorption characteristic. As shown in Figure 16, the T20 reduction is more pronounced in the low- and mid-frequency range below 1000 Hz, while Figure 17 demonstrates a more significant D50 improvement in the mid frequency range between 500 and 1000 Hz. It can thus be summarized that although the wall-mounted absorptive panels primarily target mid- to high-frequency absorption, the overall improvements in T20 and D50 were most evident within the mid-frequency range of 500–1000 Hz.
From the practical experience of this case study, although the T20 value of Scheme 2 slightly exceeded the target limit by 0.2 s at 500 Hz, the acoustic performance was still acceptable for assembly and performance activities within the gymnasium. Therefore, for multi-purpose venues of this type, slight deviations from the target acoustic parameters are considered acceptable, provided that a balance is maintained between acoustic performance, functional requirements, and cost-effectiveness.
The study also found that when the ceiling structure of the gymnasium already incorporates sound-absorptive elements with relatively low absorption coefficients, adding additional absorptive layers on the ceiling does not produce significant improvement and is therefore not recommended. In such cases, acoustic simulation and evaluation using specialized software should be conducted prior to implementation. Based on the findings of this study, adding absorptive materials to the walls can achieve a better balance between acoustic efficiency and economic feasibility. Moreover, the prediction results of Scheme 5 indicate that when the ceiling structure possesses a higher absorption coefficient, the overall indoor acoustic parameters are more likely to meet the standard requirements. These findings highlight the importance for architectural designers to consider ceiling construction carefully during the design phase—integrating sound absorption and thermal insulation functions in a unified design approach. Such a strategy not only ensures optimal performance and cost efficiency but also enables a one-step acoustic design solution, thereby avoiding the technical and financial challenges associated with subsequent retrofitting works. In future work, these findings could be combined with emerging data-driven environmental control and generative design frameworks [48,49,50,51,52] to support integrated, multi-objective optimization of acoustic, thermal and visual performance in multi-purpose gymnasiums.

Author Contributions

Conceptualization, X.W. and M.-S.K.; methodology, R.M., S.L. and M.-S.K.; software, C.D. and H.L.; validation, X.W.; formal analysis, J.Z. and W.D.; investigation, H.L. and W.D.; resources, X.W. and M.-S.K.; data curation, X.W. and J.Z.; writing—original draft preparation, X.W. and W.D.; writing—review and editing, X.W., R.M. and S.L.; visualization, C.D.; supervision, X.W. and H.L.; project administration, X.W.; funding acquisition, X.W. and J.Z. All authors have read and agreed to the published version of the manuscript.

Funding

This research received no external funding.

Data Availability Statement

The original contributions presented in this study are included in the article. Further inquiries can be directed to the corresponding authors.

Conflicts of Interest

The authors declare no conflicts of interest.

References

  1. Cowan, J. Architectural Acoustics Design Guide; McGraw-Hill: New York, NY, USA, 2000; pp. 176–177. [Google Scholar]
  2. ASTM C634-22; Standard Terminology Relating to Building and Environmental Acoustics. ASTM International: West Conshohocken, PA, USA, 2022.
  3. Al-Arja, O.A. Acoustic environment and noise exposure in fitness halls. Appl. Sci. 2020, 10, 6349. [Google Scholar] [CrossRef]
  4. Gastmeier, W.; Aitken, D. Reverberation in Gymnasia. Can. Acoust. 1999, 27, 3–7. [Google Scholar]
  5. Michel, H.; Myers, J. Increasing liveness and clarity in a multipurpose civic center. J. Acoust. Soc. Am. 2016, 140 (Suppl. 4), 3294. [Google Scholar] [CrossRef]
  6. Elam, G.A. Acoustically Sensitive Large Assembly Spaces at School: An Elementary School Retrofit and Expansion. Master’s Thesis, University of Washington, Seattle, WA, USA, 2020. [Google Scholar]
  7. Lu, S.; Xu, W.; Chen, Y.; Yan, X. An experimental study on the acoustic absorption of sand panels. Appl. Acoust. 2017, 116, 238–248. [Google Scholar] [CrossRef]
  8. Stanier, G.C.M. Characterizing Gymnasium Acoustics. Master’s Thesis, Ryerson University, Toronto, ON, Canada, 2020. [Google Scholar]
  9. Lee, Y.T.; Tsay, Y.S. Acoustical and Electroacoustical Process for Improving a Multi-Purpose Sports Stadium. In INTER-NOISE and NOISE-CON Congress and Conference Proceedings, Madrid, Spain, 16–19 June 2019; Institute of Noise Control Engineering: Reston, VA, USA, 2019; Volume 259, pp. 5732–5739. [Google Scholar]
  10. Li, M.; Wang, C.; Wu, Y.; Santamouris, M.; Lu, S. Assessing spatial inequities of thermal environment and blue-green intervention for vulnerable populations in dense urban areas. Urban Clim. 2025, 59, 102328. [Google Scholar] [CrossRef]
  11. Luo, Y.; Ma, X.; Li, J.; Wang, C.; De Dear, R.; Lu, S. Outdoor space design and its effect on mental work performance in a subtropical climate. Build. Environ. 2025, 270, 0360–1323. [Google Scholar] [CrossRef]
  12. Hornikx, M.; Hak, C.; Wenmaekers, R. Acoustic modelling of sports halls, two case studies. J. Build. Perform. Simul. 2014, 8, 26–38. [Google Scholar] [CrossRef]
  13. Zhao, Y.; Wu, S. The acoustics of gymnasium-Case study of multi-function gymnasium of Guangdong Pharmaceutical University. In Proceedings of the 2011 International Conference on Electric Technology and Civil Engineering (ICETCE), Lushan, China, 22–24 April 2011; pp. 3596–3598. [Google Scholar]
  14. Rougier, C.; Mercier, S.; Vercammen, M. The acoustics of AccorHotels Arena and other large-scale indoor pop venues. In Proceedings of the Forum Acusticum 2020 Conference, Lyon, France, 7–11 December 2020; pp. 1907–1912. [Google Scholar]
  15. Yang, D. Design as Exploration: Multi-Objective and Multi-Disciplinary Optimization (MOMDO) of Indoor Sports Halls. Ph.D. Thesis, Delft University of Technology, Delft, The Netherlands, 2023. [Google Scholar]
  16. Ananthaganeshan, K.A.; Gastmeier, W.J. Acoustical Performance Criteria, Treatment and Guidelines for Multifunctional School Gymnasia. Can. Acoust. 2007, 35, 25–30. [Google Scholar]
  17. Cairoli, M. Architectural customized design for variable acoustics in a multipurpose auditorium. Appl. Acoust. 2018, 140, 167–177. [Google Scholar] [CrossRef]
  18. Ellison, S.; Parker, M. Active acoustics in multi-purpose venues: A ten year retrospective. J. Acoust. Soc. Am. 2017, 142 (Suppl. 4), 2687. [Google Scholar] [CrossRef]
  19. Popovic, S.G.; Zaric, S.P.; Rajkovic, I. Analysis of Sports Halls in Terms of Eliminating Noise: Case Study on an Example in Podgorica, Montenegro. Sport Mont 2020, 18, 25–31. [Google Scholar] [CrossRef]
  20. Yan, X.; Lu, S.; Li, J. Experimental studies on the rain noise of lightweight roofs: Natural rains vs. artificial rains. Appl. Acoust. 2016, 106, 63–76. [Google Scholar] [CrossRef]
  21. Lüthi, G.; Desarnaulds, V. Reverberation Time in Sports Halls: Analysis of a Large Database of In-Situ Measurements and Simulations According to Absorption Positions. Build. Acoust. 2022, 36, 121–137. [Google Scholar]
  22. Alibaba, H.Z.; Ozdeniz, M.B. Acoustical Renovation of University Multipurpose Halls: The Case of Lala Mustafa Paşa Hall. Sustainability 2019, 11, 1397. [Google Scholar] [CrossRef]
  23. Kandemir, A.; Kavraz, M. Acoustic Evaluation of Trabzon Beşirli Central Tennis Court Multi-Purpose Hall. Fırat Univ. J. Eng. Sci. 2024, 36, 357–367. [Google Scholar] [CrossRef]
  24. GB/T 50076-2013; Code for Measurement of the Reverberation Time in Rooms. Standardization Administration of the People’s Republic of China: Beijing, China, 2013.
  25. ISO 3382-1:2009; Acoustics-Measurement of Room Acoustic Parameters-Part 1: Performance Spaces. International Organization for Standardization: Geneva, Switzerland, 2009.
  26. Wu, Y.; Kang, J.; Zheng, W.; Wu, Y. Acoustic Comfort in Large Railway Stations. Appl. Acoust. 2020, 160, 107137. [Google Scholar] [CrossRef]
  27. Escobar, V.G.; Morillas, J.B. Analysis of intelligibility and reverberation time recommendations in educational rooms. Appl. Acoust. 2015, 96, 1–10. [Google Scholar] [CrossRef]
  28. Vigran, T.E. Building Acoustics; Gower Publishing Limited: Aldershot, UK, 2008; pp. 109–120. [Google Scholar]
  29. ISO 9921:2003; Ergonomics-Assessment of Speech Communication. International Organization for Standardization: Geneva, Switzerland, 2003.
  30. Jedidi, M.; Boulila, A. Acoustic study of an auditorium by the determination of reverberation time and speech transmission index. Int. J. Architect. Eng. Urban Plan. 2016, 26, 25–32. [Google Scholar]
  31. Vinca, E.; Teufl, H.; Lechleitner, J.; Mahdavi, A. On the Reliability of Room Acoustics Simulation Models: A Case Study of Multi-Purpose Performance Halls. In Proceedings of the Building Simulation 2021, 17th Conference of IBPSA, Bruges, Belgium, 1–3 September 2021; pp. 1131–1138. [Google Scholar]
  32. Wattez, Y.; Tenpierik, M.; Nijs, L. The influence of profiled ceilings on sports hall acoustics: Ground effect predictions and scale model measurements. Appl. Acoust. 2018, 130, 156–157. [Google Scholar] [CrossRef]
  33. ASTM C423-23; Standard Test Method for Sound Absorption and Sound Absorption Coefficients by the Reverberation Room Method. ASTM International: West Conshohocken, PA, USA, 2023.
  34. Bradley, J.S. Predicting theater chair absorption from reverberation chamber measurements. J. Acoust. Soc. Am. 1992, 91, 1514–1524. [Google Scholar] [CrossRef]
  35. Zeng, X.; Christensen, C.L.; Rindel, J.H. Practical methods to define scattering coefficients in a room acoustics computer model. Appl. Acoust. 2006, 67, 771–786. [Google Scholar] [CrossRef]
  36. Qian, C.; Lindell, J.H.; Rode, P. Environmental and Architectural Acoustics, 2nd ed.; Xiang, Y., Translator; China Architecture & Building Press: Beijing, China, 2013; pp. 253–256. [Google Scholar]
  37. Vorländer, M. Auralization: Fundamentals of Acoustics, Modelling, Simulation, Algorithms and Acoustic Virtual Reality; Springer: Berlin/Heidelberg, Germany, 2008; p. 225. [Google Scholar]
  38. Din, N.C.; Bakar, A.A. Acoustic Comfort in Indoor Sporting Arena for E-Sports Venue: An Analysis of the Determining Criteria and a Conceptual Framework. In Proceedings of the 7th International Conference on Noise, Vibration and Comfort (NVC 2023), Kuala Lumpur, Malaysia, 5–17 December 2023; Volume 2721. [Google Scholar]
  39. Kim, J. Architectural Acoustics Design, Revised, 3rd ed.; Sejin Publishing Co., Ltd.: Seoul, Republic of Korea, 2008; p. 26. [Google Scholar]
  40. Barron, M. Auditorium Acoustics and Architectural Design, 2nd ed.; Spon Press: London, UK, 2010; p. 224. [Google Scholar]
  41. Lautenbach, M.; Heringa, P.; Vercammen, M. Acoustics for Large Scale Indoor Pop Events. In Proceedings of the International Symposium on Room Acoustics, Satellite Symposium of the 19th International Congress on Acoustics, Seville, Spain, 9–12 September 2007; pp. 1–6. [Google Scholar]
  42. Kang, Y. Practical Architectural Sound Absorption Design Technology; China Architecture & Building Press: Beijing, China, 2007; p. 121. [Google Scholar]
  43. Li, W.; Zhao, F.R. Experimental Study on Sound Absorption Properties of Several Commonly Used Sound-absorbing Materials. Chengshi Zhuzhai 2019, 12, 117–120. [Google Scholar]
  44. Zhong, X.Z. Jianzhu Xisheng Cailiao yu Geshen Cailiao, 2nd ed.; Chemical Industry Press: Beijing, China, 2005; pp. 54–55. [Google Scholar]
  45. Yu, X.; Yang, Y.Q.; Wang, H.W. Acoustic Design Practice of Outsize Multi-purpose Gymnasium. China Environ. Prot. Ind. 2019, 10, 109–113. [Google Scholar]
  46. Zhong, X.Z. Experimental Study on Sound Absorbing Properties of Polyester Fiber Board. Audio Eng. 2005, 10, 10–14. [Google Scholar]
  47. Shin, S.B.; Siebein, G.W. Difference in STI Measurements in a Lecture Room Caused by the Location, Orientation, and Directionality of Sound Sources and Receivers in the Room. In INTER-NOISE and NOISE-CON Congress and Conference Proceedings, New York, NY, USA, 19–22 August 2012; Institute of Noise Control Engineering: Reston, VA, USA, 2012; pp. 9839–9847. [Google Scholar]
  48. Zeng, T.; Ma, X.; Luo, Y.; Yin, J.; Ji, Y.; Lu, S. Improving Outdoor Thermal Environmental Quality through Kinetic Canopy Empowered by Machine Learning and Control Algorithms. Build. Simul. 2025, 18, 699–720. [Google Scholar] [CrossRef]
  49. Zeng, P.; Gao, W.; Li, J.; Yin, J.; Chen, J.; Lu, S. Automated Residential Layout Generation and Editing Using Natural Language and Images. Autom. Constr. 2025, 174, 106133. [Google Scholar] [CrossRef]
  50. Huang, Y.; Zeng, T.; Jia, M.; Yang, J.; Xu, W.; Lu, S. Fusing Transformer and Diffusion for High-Resolution Prediction of Daylight Illuminance and Glare Based on Sparse Ceiling-Mounted Input. Build. Environ. 2025, 267, 112163. [Google Scholar] [CrossRef]
  51. Zeng, P.; Yin, J.; Zhang, M.; Dai, Y.; Li, J.; Jin, Z.; Lu, S. CARD: Cross-Modal Agent Framework for Generative and Editable Residential Design. In Proceedings of the 2025 Conference on Empirical Methods in Natural Language Processing, Suzhou, China, 4–9 November 2025; Association for Computational Linguistics: Kerrville, TX, USA, 2025; pp. 9315–9330. [Google Scholar]
  52. Yu, T.; Li, J.; Jin, Y.; Wu, W.; Ma, X.; Xu, W.; Lu, S. Machine Learning Prediction on Spatial and Environmental Perception and Work Efficiency Using Electroencephalography Including Cross-Subject Scenarios. J. Build. Eng. 2025, 99, 111644. [Google Scholar] [CrossRef]
Figure 1. Current conditions of the gymnasium: (a) Interior view; (b) Ceiling; (c) Construction of perforated metal ceiling panels.
Buildings 15 04241 g001
Figure 2. Layout of measurement points in the gymnasium.
Buildings 15 04241 g002
Figure 3. Predicted absorption coefficient curve of the existing ceiling.
Buildings 15 04241 g003
Figure 4. Acoustic model.
Buildings 15 04241 g004
Figure 5. Simulated prediction of T20 at 500 Hz and 1000 Hz (unoccupied condition).
Buildings 15 04241 g005
Figure 6. Simulated prediction of D50 at 500 Hz and 1000 Hz (unoccupied condition).
Buildings 15 04241 g006
Figure 7. Simulated prediction of STI (unoccupied condition).
Buildings 15 04241 g007
Figure 8. On-site view of temporary seating arrangement on the floor of the activity area.
Buildings 15 04241 g008
Figure 9. The sound source positions in the model. In the figure, numbers 1-11 indicate the location of the receiving point.
Buildings 15 04241 g009
Figure 10. Recommended reverberation time. In the figure, the dotted line denote the corresponding scales on the horizontal and vertical axes.
Buildings 15 04241 g010
Figure 11. Schematic diagrams of the implementation methods for each sound absorption scheme. In the figure, A indicates Suspended Space Absorbers; B indicates Sound-absorbing Wall Panels; C indicates Sound-absorbing Ceiling Panels.
Buildings 15 04241 g011
Figure 12. Comparison of T20 for the various schemes (Frequency-dependent curve with σs).
Buildings 15 04241 g012
Figure 13. Comparison of D50 for the various schemes (Frequency-dependent curve with σs).
Buildings 15 04241 g013
Figure 14. Comparison of STI for the various schemes (With σs).
Buildings 15 04241 g014
Figure 15. Field photograph of the sound-absorbing materials after the renovation.
Buildings 15 04241 g015
Figure 16. Variation in T20 with frequency before and after renovation (With σs).
Buildings 15 04241 g016
Figure 17. Variation in D50 with frequency before and after renovation (With σs).
Buildings 15 04241 g017
Figure 18. Variation in STI parameter spatially averaged (With σs).
Buildings 15 04241 g018
Figure 19. STI and D50 curves as a function of distance between sound source and receiver.
Buildings 15 04241 g019
Table 1. Spatially averaged measured acoustic parameters (unoccupied condition).
SNItemFrequency/Hz
125250500100020004000
1T20, s (measured)4.884.754.053.352.462.05
σs0.240.160.090.150.070.07
2D50 (measured)0.210.190.250.380.440.47
σs0.140.120.130.130.110.09
3STI (measured)0.47
σs0.05
Table 2. Predicted absorption coefficients of the existing ceiling.
SNCeiling ComponentArea/m2Frequency/HzRemarks
125250500100020004000
1Predicted value by AcouSYS software23940.070.140.300.380.400.40
2Additional contribution of perforated metal panel relief to low frequencies0.10.1The relief-shaped ceiling provides additional absorption at 125 Hz and 250 Hz [32].
3Estimated value after superposition0.170.240.300.380.400.40Used as input conditions for the ceiling absorption coefficients.
Table 3. Estimated absorption coefficients of plastic seats in the audience stands.
SNItemNo.Frequency/HzRemarks
125250500100020004000
1Single seat absorption area of plastic seat (m2, Sabins)1272 pcs0.090.120.050.030.030.06The data were obtained from measurements conducted at the Architectural Acoustics Laboratory of Tsinghua University on similar seats, using the reverberation chamber method with 12 seats tested.
2Equivalent absorption coefficient of the seating area (Referred to floor area)568 m20.200.270.110.070.070.13The total absorption of 1272 plastic seats at each frequency was divided by the corresponding 568 m2 of grandstand floor area, yielding the equivalent absorption coefficient of the seating area referred to the floor surface [34].
Table 4. The simulation parameters used.
SNItemContent
1Scattering methodLambert
2Surface numbers1222
3Total surface area9073 m2
4Number of late rays10,000
5Transition order2
6Air conditions20 °C, 50% RH
7Number of early scattered rays50
Table 5. Model parameters.
SNLocationFinish/SurfaceArea StatisticsSound Absorption Coefficients (125–4000 Hz)Scattering Coefficient
Area/m2Area Ratio/%125250500100020004000
1Equivalent absorption coefficient of the seating area (referred to floor area)1272 plastic seats5686.3The same as SN2 in Table 30.6
2CeilingPerforated metal sheet239426.4 The same as SN3 in Table 20.6
3CeilingGlass skylights2172.4 0.100.070.050.030.030.020.1 1
41st floor activity area wallsSoft PVC material with a convex–concave surface pattern3634.0 0.050.030.030.030.030.030.5 1
52nd floor stands wallsLatex paint5385.9 0.050.030.030.030.030.030.3
63rd floor stands wallsLatex paint7588.4 0.050.030.030.030.030.030.3
7Glass windows5255.8 0.100.070.050.030.030.020.1 1
8DoorsMetal panels580.6 0.120.100.050.040.040.030.05 1
9ScreensLED180.2 0.120.070.050.040.040.030.05 1
10Upper part of podium wallsLatex paint3714.1 0.050.030.030.030.030.030.3
11Lower part of podium wallsAcoustic curtains and slatted wooden acoustic panels1982.2 0.30 20.50 20.70 20.80 20.85 20.85 20.5
12Activity area floorWooden flooring130114.3 0.15 20.10 20.05 20.03 20.03 20.03 20.2
13Other finishesCorridors, steps, etc., mainly hard surface finishes176419.4 0.050.030.030.030.030.030.3
Note: 1 The scattering coefficients are derived from the study by Zeng et al. [35]; 2 The sound absorption coefficients are derived from the study by Qian and Lindell [36].
Table 6. Spatially averaged predicted acoustic parameters (unoccupied condition).
SNItemFrequency/Hz
125250500100020004000
1T20, s (predicted)4.784.804.113.372.512.10
σs0.070.070.060.050.090.04
2D50 (predicted)0.220.220.240.280.350.37
σs0.110.110.120.130.140.15
3STI (predicted)0.42
σs0.07
Table 7. JND Evaluation Form.
SNItemMeasuredPredictedTypical JNDResultRemark
1T20, s3.703.74Rel.5%1 JNDAverage value of 500 and 1000 Hz
2D500.310.260.051 JND
3STI0.470.420.032 JND
Table 8. Estimated absorption coefficients of plastic grandstand seats in the occupied state.
SNItemLocationNo.Frequency/HzRemarks
125250500100020004000
1Sound absorption per occupied plastic seat (m2)Seating on the 2nd and 3rd tier stands1272pcs0.170.290.350.370.370.39Table 3 In the occupied condition, 12 plastic seats were measured using the reverberation chamber method. The data were obtained from tests conducted at the Architectural Acoustics Laboratory of Tsinghua University.
2Seating on the 1st floor activity area784 pcs
3Equivalent absorption coefficient of the occupied seating area relative to the floor surface2nd and 3rd tier stands568 m20.380.650.780.830.830.87The total sound absorption of the occupied plastic seats at each frequency, divided by the corresponding grandstand floor area, can be converted into the equivalent absorption coefficient of the seating area relative to the floor surface [34].
41st floor activity area1190 m20.110.190.230.240.240.26
Table 9. Spatially averaged predicted acoustic parameters (occupied condition).
SNItemFrequency/Hz
125250500100020004000
1T20, s (predicted)4.223.603.032.652.281.90
σs0.070.110.140.100.060.07
2D50 (predicted)0.240.290.340.370.390.42
σs0.110.120.130.140.140.15
3STI (predicted)0.47
σs0.07
Table 10. Technical routes of five sound absorption design schemes.
ItemDesign ConceptAbsorbing MaterialInstallation MethodInstallation Area of Absorbing Material (m2)
Scheme 1 Suspended ceiling-hung absorbersPrefabricated absorber modules made of 100 mm polyester fiber cotton wrapped in fabric, size 1200 L × 600 W × 100 T (mm)Suspended from steel wires below the roof truss walkway, spacing 500 mm850
Scheme 2 Absorber panels on most wall surfaces50 mm polyester fiber cotton wrapped in fabricModular installation, fixed to the wall using fabric-covered battens1078
Scheme 3 Absorber panels on all wall surfacesSame as Scheme 2Same as Scheme 21687
Scheme 4Combination of Scheme 1 and Scheme 2//1928
Scheme 5 Additional suspended ceiling panelsPerforated metal panels backed with 100 mm polyester fiber cottonDirectly fixed beneath the existing acoustic ceiling2393
Table 11. Absorption coefficient inputs for the materials used in the acoustic design.
SNItemFrequency/HzRemarks
125250500100020004000
1 Scheme 1 0.421.131.962.081.731.80The absorption coefficient data were obtained by referring to measurements of similar products [42].
(Since the sound absorption coefficient is defined as the ratio of the absorbed sound energy to the projected surface area of the absorber, its value may occasionally exceed 1.)
2Scheme 2/3/40.080.10.210.40.930.9The absorption coefficient data were obtained by referring to measurements of similar products [43].
3 Scheme 5 0.880.940.900.830.860.75Customized samples were fabricated according to the design requirements, and a total sample area of 10.3 m2 was measured using the reverberation room method [33]. The data were obtained from tests conducted at the Architectural Acoustics Laboratory of Tsinghua University.
Buildings 15 04241 i001
Buildings 15 04241 i002
Table 12. Scheme 1-Spatially averaged predicted acoustic parameters (occupied condition).
SNItemFrequency/Hz
125250500100020004000
1T20, s (predicted)4.453.302.482.222.021.70
σs0.080.040.060.090.090.06
2D50 (predicted)0.270.340.410.430.450.47
σs0.110.120.130.130.130.13
3STI (predicted)0.51
σs0.06
Table 13. Scheme 2-Spatially averaged predicted acoustic parameters (occupied condition).
SNItemFrequency/Hz
125250500100020004000
1T20, s (predicted)3.272.481.971.761.561.36
σs0.060.040.080.100.120.12
2D50 (predicted)0.340.400.450.480.500.52
σs0.120.120.120.130.130.13
3STI (predicted)0.52
σs0.06
Table 14. Scheme 3-Spatially averaged predicted acoustic parameters (occupied condition).
SNItemFrequency/Hz
125250500100020004000
1T20, s (predicted)2.942.101.601.361.221.14
σs0.050.040.060.070.080.07
2D50 (predicted)0.360.440.500.530.540.55
σs0.120.120.120.120.120.12
3STI (predicted)0.56
σs0.06
Table 15. Scheme 4-Spatially averaged predicted acoustic parameters (occupied condition).
SNItemFrequency/Hz
125250500100020004000
1T20, s (predicted)3.322.241.651.451.351.21
σs0.040.070.070.080.080.05
2D50 (predicted)0.340.440.530.560.560.58
σs0.110.110.110.110.120.11
3STI (predicted)0.58
σs0.06
Table 16. Scheme 5-Spatially averaged predicted acoustic parameters (occupied condition).
SNItemFrequency/Hz
125250500100020004000
1T20, s (predicted)3.422.361.741.631.511.36
σs0.150.070.060.050.040.05
2D50 (predicted)0.350.410.490.520.530.54
σs0.090.100.110.120.110.12
3STI (predicted)0.54
σs0.06
Table 17. Comprehensive Evaluation of the Five Schemes.
ItemDesignAbsorptive Material Area (m2)Acoustic Compliance EvaluationEvaluation
Scheme 1 Suspended space absorbers under the ceiling850☒ T20(500 Hz)
🗹 D50(500–1000 Hz)
🗹 STI
The installation quantity is relatively small; however, the mid-frequency (500 Hz) T20 exceeds the limit by 0.7 s, and the acoustic improvement is limited. Therefore, it is not recommended.
Scheme 2 Installation of sound-absorbing panels on most wall surfaces1078☒ T20(500 Hz)
🗹 D50(500–1000 Hz)
🗹 STI
The installation quantity is moderate. Both D50 and STI in the mid-frequency range (500–1000 Hz) meet the minimum requirements, with only T20 at 500 Hz slightly exceeding the limit by 0.2 s, basically satisfying the design expectations. The required area of sound-absorbing material is significantly reduced, resulting in the highest cost-effectiveness.
Scheme 3 Installation of sound-absorbing panels on all wall surfaces1687🗹 T20(500 Hz)
🗹 D50(500–1000 Hz)
🗹 STI
Acoustic performance exceeds the required limits; however, the installation quantities are large, leading to lower cost-effectiveness. Such schemes are inconsistent with the project goal of achieving a cost-effective renovation.
Scheme 4Combination of Scheme 1 and Scheme 21928🗹 T20(500 Hz)
🗹 D50(500–1000 Hz)
🗹 STI
Scheme 5 Additional sound-absorbing ceiling panels (without altering existing conditions)2393🗹 T20(500 Hz)
🗹 D50(500–1000 Hz)
🗹 STI
Note: 🗹 indicates that the standard is met; ☒ indicates that the standard is not met.
Table 18. Spatially averaged measured acoustic parameters (unoccupied condition, renovation completed).
SNItemFrequency/Hz
125250500100020004000
1T20, s (measured)3.543.102.502.021.581.51
σs0.150.150.120.100.080.05
2D50 (measured)0.240.240.410.520.540.52
σs0.080.130.140.120.110.13
3STI (measured)0.55
σs0.06
Table 19. Spatially averaged predicted acoustic parameters (unoccupied condition, renovation completed).
SNItemFrequency/Hz
125250500100020004000
1T20, s (predicted)3.573.082.522.141.691.52
σs0.060.060.040.060.080.05
2D50 (predicted)0.310.330.350.390.450.46
σs0.120.120.130.130.130.14
3STI (predicted)0.49
σs0.07
Table 20. JND Evaluation Form (unoccupied condition, renovation completed).
SNItemMeasuredPredictedTypical JNDResultRemark
1T20, s2.262.33Rel.5%1 JNDAverage value of 500 and 1000 Hz
2D500.460.370.052 JND
3STI0.550.490.032 JND
Table 21. Spatially averaged predicted acoustic parameters (occupied condition, renovation completed).
SNItemFrequency/Hz
125250500100020004000
1T20, s (predicted)3.272.492.011.791.591.40
σs0.040.080.100.100.090.10
2D50 (predicted)0.250.340.430.470.500.51
σs0.080.090.100.100.100.10
3STI (predicted)0.51
σs0.05
Disclaimer/Publisher’s Note: The statements, opinions and data contained in all publications are solely those of the individual author(s) and contributor(s) and not of MDPI and/or the editor(s). MDPI and/or the editor(s) disclaim responsibility for any injury to people or property resulting from any ideas, methods, instructions or products referred to in the content.