Abstract
The salt lake and saline–alkali soil regions of high plateaus are characterized by widespread Alkali–silica reactive (ASR) aggregates, which severely threaten the durability of constructed infrastructure, including railways, highways, and buildings. The research systematically investigates the uniaxial compressive mechanical behavior and stress–strain constitutive relationship of high-performance concrete (HPC) with ASR mitigation measures (performance grades C40, C45, C50, and C60) after ten years of immersion in a standard alkali solution. A corresponding three-dimensional random aggregate mesoscopic concrete model was developed, and mesomechanical numerical simulations were performed to explore the failure process, failure patterns, and underlying mesoscopic damage mechanisms of the specimens. Results show that While the uniaxial compressive strength and elastic modulus of HPC show an expected increase with the concrete strength grade following long-term alkali exposure, both properties demonstrate a clear decline as the equivalent alkali content rises. Comparing and analyzing the C50 specimens of different admixtures, it was found that the air-entraining agent provided the most effective ASR suppression and obtained the highest uniaxial compressive strength compared with the rust inhibitor. By normalizing the stress–strain curves, the long-term constitutive behavior of HPC under alkali corrosion was summarized. Furthermore, mesoscopic model visualizations indicate that cracks initially appear in the mortar and gradually propagate inward during loading, leading to compressive failure characterized by diagonal cracks. Tracking the mesoscopic damage patterns within the specimens demonstrates that microcracks originate in the mortar and progressively extend through aggregates, revealing the underlying micro-damage mechanism. By studying the SEM-EDS images, it is found that HPC with a specific mix ratio designed in this paper can effectively inhibit the ASR effect, and it still has good corrosion resistance in long-term alkali immersion.
1. Introduction
The rugged terrain of northwest China’s high-altitude regions contains widespread saline-alkali soils with salt contents 5–10 times greater than seawater [1]. High concentrations of chloride, sulfate, and alkali ions here create a highly conducive environment for the alkali-silica reaction (ASR) in concrete. This risk is intensified by the proven alkali reactivity of aggregates in areas such as Qinghai Province, severely affecting the durability and service life of concrete structures [2].
In 1992, based on the discovery of AAR by Stanton [3], Tang [4] divided AAR into ASR and alkali-carbonate reaction (ACR) according to the different types of harmful substances produced by AAR. Among them, ASR is called “concrete cancer” in civil engineering because of its wide range of occurrence, great harm, difficult treatment and high maintenance costs [5,6,7,8]; it is widely concerned by scholars in the industry.
In recent years, the durability of concrete structures has been widely acknowledged to be threatened primarily by Alkali-Silica Reaction (ASR). To investigate its impact, researchers have focused on reaction mechanisms, mitigation strategies, and detection methods, yielding substantial findings [9,10,11,12,13,14]. Figueira et al. [15] summarized decades of research and identified four necessary conditions for ASR: the presence of aggregates with critical alkali reactivity, high alkali concentration, a source of soluble calcium, and high humidity. The absence of any one condition prevents ASR occurrence. The review also covered the efficacy of various supplementary cementitious materials (SCMs) and additives—such as lithium compounds, GGBFS, FA, SF, and MK—in suppressing ASR. However, research on the mechanisms by which lithium additives reduce ASR-induced expansion remains limited, requiring further investigation.
Ding et al. [16] used the accelerated mortar bar method to evaluate the ASR mitigation effect of 20% lithium slag powder and 20% fly ash individually. Results showed that 20% lithium slag powder inhibited ASR by 76%, while fly ash achieved 93%, indicating superior effectiveness of fly ash at equivalent dosage. Further studies revealed that lithium slag powder can undergo slight self-expansion, and when used above 30%, its mitigation effect is slightly inferior to that of fly ash of the same dosage. Saha K. A. [17] attributed fly ash’s effectiveness in mitigating ASR to its chemical composition, with Class F (low-alkali, low-calcium) proving superior compared to Class C. The mechanism involves alkali binding to reduce pore solution pH and a modification of the ASR gel composition, thereby curbing its expansion and destructiveness.
Yang [18] and Kawamura [19] established a correlation between higher alkali content and increased ASR expansion in concrete with reactive aggregates. Their key finding, however, was the existence of a critical threshold beyond which the ASR gel undergoes a structural transformation, and its expansion capacity is lost.
Building on studies of ASR mitigation, researchers have also investigated the effects of ASR on concrete mechanical properties. Mohammadi et al. [20] reviewed the topic in detail, indicating that ASR significantly reduces various mechanical properties, with sensitivity depending on aggregate type and testing method; the elastic modulus and tensile strength were notably the most degraded properties, a result also identified by Swamy et al. [21]. Bektas et al. [22] replaced 15% and 25% of Portland cement with ground clay bricks in concrete with reactive sand and observed that while ASR-induced cracking negatively impacted flexural strength and elastic modulus, GCB altered ASR gel chemistry, reducing expansion damage. Ahmed et al. [23] studied ASR effects on compressive strength of cylinder specimens soaked for 4 and 28 weeks, finding that early-age compressive strength was not sensitive to ASR, but long-term exposure significantly reduced strength.
Although the above studies have discussed the ASR inhibition measures in detail, and the research on the mechanical properties of HPC in long-term immersion in alkali solution environment has also achieved good results, there is a lack of research on the strength change law and constitutive relationship of HPC under the dual action of long-term alkali corrosion and ASR. Therefore, this paper studies the expansion failure mechanism, mechanical properties, and constitutive relationship of HPC with ASR inhibition measures after 10 years of alkali solution immersion from the macro, meso, and micro analysis dimensions, which provides a theoretical basis for improving the service life of concrete under alkali solution immersion.
From a mesoscopic perspective, the microstructure of concrete constitutes a composite system, formed by a mortar matrix with discrete aggregate inclusions bonded by the interfacial transition zone (ITZ) [24,25]. The mesostructure directly influences macroscopic mechanical properties [26]. In recent decades, researchers have studied concrete failure mechanisms from a mesoscopic perspective, proposing various two-dimensional shapes and geometries for meso-models [27,28,29,30,31,32,33,34,35]. Among them, three-dimensional random aggregate models [36] are widely accepted due to their realistic consideration of aggregate randomness. Therefore, this paper uses a three-dimensional random aggregate mesoscopic concrete model to analyze the corrosion damage mechanism of HPC under the dual effects of long-term alkali solution immersion and ASR.
To investigate the uniaxial compressive stress–strain behavior and mesoscopic damage mechanisms of HPC after ten years of ASR under alkali immersion, this study designed four strength grades and six mix proportions (three equivalent alkali contents), totaling 54 specimens. The specimens were immersed in alkali solutions of three different equivalent alkali concentrations for ten years. Changes in uniaxial mechanical properties and stress–strain behavior over time were tracked. Using mesoscopic material parameters derived from Wang [37], three-dimensional random aggregate models were constructed to analyze HPC failure mechanisms after long-term ASR exposure under alkali immersion.
2. Experiments
2.1. Materials
This study employed P.O 42.5 and P.II 52.5 cements from Qilianshan Cement Group Co., Ltd. in Lanzhou, China (Lanzhou, China), whose properties are listed in Table 1. Additional components included Class I fly ash from Yongdeng Lian Dian Fly Ash Co., Ltd. in Lanzhou, China (Gansu, China), with S95-grade GGBFS and silica fume procured from Xiangyang Trading Co., Ltd. in Lanzhou, China (Gansu, China) and Lantian Environmental Protection Technology Co., Ltd. in Xining, China (Qinghai, China), respectively. The chemical compositions of the mineral admixtures and cementitious materials are presented in Table 2, while the contents of alkali-reactive components are shown in Table 3.
Coarse aggregates were granite gravel sourced from the study region, with granite gravel (5–31.5 mm). The physical properties and chemical compositions of both coarse and fine aggregates are summarized in Table 4. Alkali–silica reactivity tests using the accelerated mortar bar test (AMBT) indicated 14-day expansions of 0.008% and 0.123% for coarse and fine aggregates, respectively. According to Chinese industry standards, the fine aggregates used in this study possess potential alkali reactivity. To verify their reactivity, Professor Luduyou [38] conducted petrographic analysis, which revealed that approximately 10% of the fine aggregates were alkali-activated, mainly originating from microcrystalline quartz, cryptocrystalline quartz, and strained quartz dispersed within heterogeneous sandstone, as shown in Figure 1.

Figure 1.
Polarizing microscope photos of fine sand particles [38]. (a) Microcrystalline quartz of greywacke in fine-grained sand. (b) Blurred boundary quartz particles of greywacke in fine-grained sand. (c) Strain quartz of greywacke in fine-grained sand. (d) Fine-grained sand calcite matrix mixed with a small amount of hidden quality quartz.
Mixing was carried out using standard potable water, with the admixtures consisting of a PJ-FDN polycarboxylate high-performance water-reducing agent, an air-entraining agent, and an FDN steel corrosion inhibitor all supplied by Xining Yangjian Waterproof Admixture Co., Ltd, Xining, China.

Table 1.
Physical and mechanical properties of cement [39].
Table 1.
Physical and mechanical properties of cement [39].
| Cement | Specific Surface Area/m2·kg−1 | Fineness/% | Standard Consistency Water Demand/% | Setting Time/min | Flexural Strength/MPa | Compressive Strength/MPa | |||
|---|---|---|---|---|---|---|---|---|---|
| Initial | Final | 3d | 28d | 3d | 28d | ||||
| P.O 42.5 | 348 | 0.8 | 26 | 145 | 220 | 5.5 | 7.6 | 21.6 | 48.7 |
| P.II 52.5 | 412 | 0.8 | 25 | 95 | 146 | 5.6 | 9.3 | 26.8 | 57.2 |

Table 2.
Chemical composition of cement, FA, GGBFS, and SF (%) [39].
Table 2.
Chemical composition of cement, FA, GGBFS, and SF (%) [39].
| Cementitious Materials | CaO | SiO2 | Al2O3 | Na2O | K2O | SO3 | Fe2O3 | Cl− | Ignition Loss |
|---|---|---|---|---|---|---|---|---|---|
| P.II 52.5 | 65.88 | 19.56 | 3.78 | 0.50 | 0.82 | 2.41 | 3.69 | 0.022 | 0.94 |
| P.O 42.5 | 59.45 | 20.98 | 9.38 | 0.24 | 0.59 | 2.44 | 3.64 | 0.023 | 1.28 |
| GGBFS | 37.38 | 26.09 | 26.88 | 0.49 | 0.83 | 1.75 | 0.67 | 0.014 | 0.31 |
| SF | 0.50 | 90.51 | 0.96 | 1.03 | 2.00 | — | 0.64 | 0.26 | 2.26 |
| FA | 2.94 | 52.68 | 32.42 | 0.74 | 1.46 | 0.74 | 7.47 | 0.0012 | 0.34 |

Table 3.
Alkali active components of cementitious materials% [39].
Table 3.
Alkali active components of cementitious materials% [39].
| Cementitious Materials | K2O | NaO | K2O + 0.658NaO |
|---|---|---|---|
| P.II 52.5 | 0.82 | 0.50 | 1.04 |
| P.O 42.5 | 0.59 | 0.24 | 0.63 |
| GGBFS | 0.40 | 0.27 | 0.53 |
| SF | 2.00 | 1.03 | 2.35 |
| FA | 1.35 | 0.63 | 1.52 |

Table 4.
Physical properties and chemical composition of coarse and fine aggregate [39].
Table 4.
Physical properties and chemical composition of coarse and fine aggregate [39].
| Aggregate | Bulk Density /kg·m−3 | Apparent Density /kg·m−3 | Percentage of Void/ % | Soil Content/ % | Flat Elongated Particles Content/% | Crush Index/% | SO42−/% | Cl− /% |
|---|---|---|---|---|---|---|---|---|
| Sand | 1470 | 2648 | 38.1 | 5.6 | - | - | 0.11 | 0.0054 |
| Stone | 1535 | 2680 | 41.0 | 0.8 | 2.9 | 8.2 | 0.02 | 0.0063 |
2.2. Mix Proportions
Four strength grades of concrete were designed in this study according to the types and dosages of mineral admixtures and chemical admixtures. For C40 and C45, only an air-entraining agent was added, and the specimens were labeled Ca40 and Ca45. C50 was prepared with three different admixture combinations: air-entraining agent only (Ca50), corrosion inhibitor only (C50Z), and a combination of air-entraining agent and corrosion inhibitor (Ca50Z). C60 incorporated both air-entraining agent and corrosion inhibitor, labeled Ca60Z.
During mixing, different amounts of NaOH were added to adjust the equivalent alkali content, allowing investigation of its effect on HPC deterioration and failure behavior. To differentiate the alkali concentration in HPC, the specimen labels include a suffix: −0 denotes low equivalent alkali content, representing only the inherent alkali from the raw materials (0.6–0.8%). Suffixes −1 and −2 indicate the addition of NaOH to the mixing water, resulting in medium and high equivalent alkali contents of 1.3–1.4% and 1.8–1.9%, respectively.
The unit material quantities and equivalent alkali contents for each strength grade of HPC are summarized in Table 5.

Table 5.
Mixture proportions of the concrete.
2.3. Corrosive Medium
The concrete specimens were cast, vibrated, and standard-cured for 28 days before being demolded and subjected to full immersion in a 1 mol/L NaOH solution maintained at 38 °C (Figure 2).
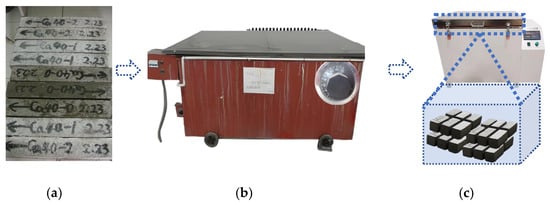
Figure 2.
The soaking solution process of the specimen. (a) Making concrete specimens. (b) Maintenance specimen. (c) The specimens were immersed in standard alkaline solution.
2.4. Experimental Methods
2.4.1. Uniaxial Compressive Mechanical Test
Uniaxial compression was applied using an MTS system (Figure 3a). The prism specimens were prepared by affixing strain gauges and displacement sensors, with data collected concurrently by the MTS and a strain acquisition system. Figure 3b shows the fully instrumented specimen within the test setup.

Figure 3.
Uniaxial compression test.
The specimens in this study were immersed in alkali solution for up to ten years. Given the exceptionally long exposure time, these specimens are particularly valuable for durability research; therefore, no repeat tests were conducted. During the experimental process, ultrasonic nondestructive testing was employed. By utilizing the physical relationship between wave propagation speed and distance, along with measurements of expansion and relative dynamic elastic modulus, the mechanical property evolution of the concrete under long-term alkali exposure was characterized. These data provide a basis for predicting strength under even longer corrosion durations.
2.4.2. Interface Transition Zone Thickness Test
In this paper, HVS-1000 M touch screen digital microhardness tester is used to test the thickness of coarse aggregate interface transition zone and fine aggregate interface transition zone, which is used to analyze the change rule of interface transition zone thickness of HPC with ASR inhibition measures after 10 years of alkali immersion.
2.4.3. Microphase and Microstructure Test
The micro-phase analysis of ASR corrosion products was carried out by X-ray diffractometer. The instrument used was an ETD-2000 small ion sputtering instrument. The microstructure of the specimens after ASR corrosion was analyzed by electron microscopy (SEM) provided by COXEM Co., Ltd. in Daejeon City, South Korea and energy dispersive spectroscopy (EDS) provided by Beijing Boyuan Micro-nano Technology Co., Ltd. In Beijing, China. The instrument used was EM-30 PLUS desktop microstructure analysis system (scanning electron microscope SEM) provided by COXEM Co., Ltd. in Daejeon City, South Korea.
2.4.4. Data Processing
Considering that the MTS testing system exhibits its own displacement prior to specimen deformation, this intrinsic displacement must be subtracted from the total measured displacement to obtain the actual strain of the specimen, ensuring test accuracy. The actual strain of the specimen is calculated using Equation (1).
To further characterize the concrete’s resistance to elastic deformation, the static elastic modulus, E, was introduced as a reference parameter, which is calculated using Equation (2).
The variables in the equations are defined as follows:
: actual specimen strain (mm)
μ0: Total measured displacement (mm)
F: Applied load (N)
K: Stiffness of the testing machine (N/mm)
Ec: Static compressive elastic modulus of concrete (GPa)
Fi: Load at 40% of the uniaxial compressive strength (kN)
A: Cross-sectional area of the specimen (mm2)
L: Gauge length (mm)
εi: Average deformation across both sides of the specimen under Fi (mm)
Due to ASR-induced corrosion during alkali immersion, the length, width, and height of the HPC specimens change. The longitudinal dimensional change can be used to calculate the expansion rate, as expressed in Equation (3). Using the relationship between ultrasonic wave propagation speed, travel distance, and the specimen geometry, the relative dynamic elastic modulus is determined via Equation (4), which is subsequently used to estimate the internal damage variable D according to Equation (5).
3. Results and Discussion
3.1. Evolution and Mechanical Behavior of HPC Under Uniaxial Compression
3.1.1. Trends in Uniaxial Compressive Strength
The results of uniaxial compression, stress–strain tests, and nondestructive measurements are summarized in Table 6. The key factors exerting dominant influences on the uniaxial compressive mechanical properties and internal damage parameters of HPC, based on the peak secant modulus (defined as peak stress/peak strain) and the data in Table 6, are the equivalent alkali content, strength grade, and admixture type.

Table 6.
HPC axial compressive performance parameters and internal damage parameters.
As shown in Table 6, the internal damage variable under low alkali conditions is slightly smaller than that under high alkali conditions, indicating that HPC experiences less damage after ten years of immersion in alkali solution when the equivalent alkali content is low. Regarding the effect of admixtures on internal damage, a comparison of Ca50-0, C50Z-0, and Ca50Z-0 shows minimal differences, although HPC incorporating the air-entraining agent exhibits a slightly lower damage variable than that with the corrosion inhibitor.
For expansion, all HPC mix proportions show expansion rates below 0.1% with little variation. This is likely due to the specific mix design used in this study, which effectively limits ASR and reduces the expansion caused by corrosion products. These results indicate that this specially designed HPC maintains good corrosion resistance even after prolonged immersion in alkali solution.
The evolution of uniaxial compressive properties in ASR-mitigated HPC following ten years of alkali immersion is summarized in Figure 4. The uniaxial compressive strength of HPC exhibits a general decrease with rising equivalent alkali content, as evidenced in Figure 4 for specimens of identical strength grade and admixture type. However, the magnitude of strength reduction varies across different alkali levels for specimens of the same grade. For instance, the uniaxial compressive strengths of Ca40-0, Ca40-1, and Ca40-2 are 31.1 MPa, 30.5 MPa, and 29.7 MPa, corresponding to reductions of 1.9% from low to medium alkali and 2.6% from medium to high alkali. Similarly, Ca60Z-0, Ca60Z-1, and Ca60Z-2 exhibit strengths of 47.9 MPa, 45.9 MPa, and 43.7 MPa, with reductions of 4.2% and 4.7%. These results indicate that, under the same equivalent alkali conditions, higher-strength HPC exhibits greater uniaxial compressive strength but is more sensitive to increases in equivalent alkali content.

Figure 4.
Effect of equivalent alkali content on the uniaxial compressive strength of HPC.
Figure 4 also illustrates the effects of the air-entraining agent and corrosion inhibitor. Specifically, for the C50-grade specimens-C50Z, Ca50, and Ca50Z-under low alkali conditions, their uniaxial compressive strengths are 35.8 MPa, 41.9 MPa, and 41.5 MPa. Clearly, the specimen with only the air-entraining agent (Ca50) exhibits the highest strength, followed by Ca50Z, while C50Z shows the lowest strength. Under medium alkali conditions, the strengths of the three specimens are similar. Under high alkali conditions, Ca50 and Ca50Z outperform C50Z, demonstrating that the inclusion of an air-entraining agent provides superior ASR mitigation. This finding highlights the significance of incorporating ASR inhibition measures in HPC design.
3.1.2. Effects of Internal Corrosion Damage and Expansion on Compressive Strength
As discussed above, under long-term alkali exposure, the equivalent alkali content of HPC significantly affects its mechanical properties. In addition, internal damage caused by ASR gel expansion and cracking increases both the internal damage variable and the expansion, further reducing HPC’s mechanical performance. Figure 5 summarizes the fitted relationships between uniaxial compressive strength, internal corrosion damage, and expansion, as derived from the data in Table 6.

Figure 5.
The relationship between uniaxial compressive strength and internal damage variable and expansion rate. (a) Relationship between uniaxial compressive strength and internal damage variables. (b) The relationship between axial compressive strength and expansion rate.
The fitted relationship in Figure 5a demonstrates a significant linear correlation (R = 0.789, n = 18) between uniaxial compressive strength and the internal damage variable, with the coefficient exceeding the critical value (0.622) at α = 0.001 and validating the statistical significance. Figure 5b reveals that strength grade profoundly influences the relationship between uniaxial compressive strength and expansion, necessitating grade-specific analysis. Overall, a consistent inverse linear correlation is observed, with expansion diminishing as strength grade increases, in agreement with experimental observations.
Furthermore, by analyzing the relationships between uniaxial compressive strength, internal damage variable, and expansion, uniaxial compressive strength can be estimated using nondestructive measurements of internal damage and expansion. This approach provides a valuable and practical method for predicting HPC compressive strength without destructive testing.
3.1.3. Evolution of Elastic Modulus of HPC
The elastic modulus reflects the stiffness of concrete, which is the resistance to elastic deformation, directly affecting structural deformation, stability, and cracking performance. Numerous factors influence the elastic modulus, including raw materials, concrete strength grade, admixtures, and curing environment. In this study, the effects of equivalent alkali content, strength grade, and admixtures on the elastic modulus were analyzed, as shown in Figure 6 and Figure 7.
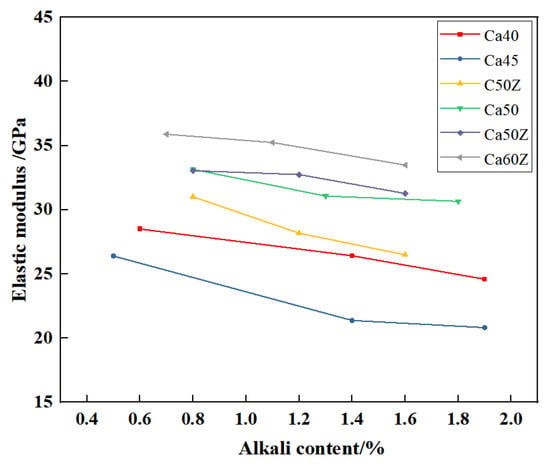
Figure 6.
Influence of equivalent alkali content on the elastic modulus of high-performance concrete (HPC).
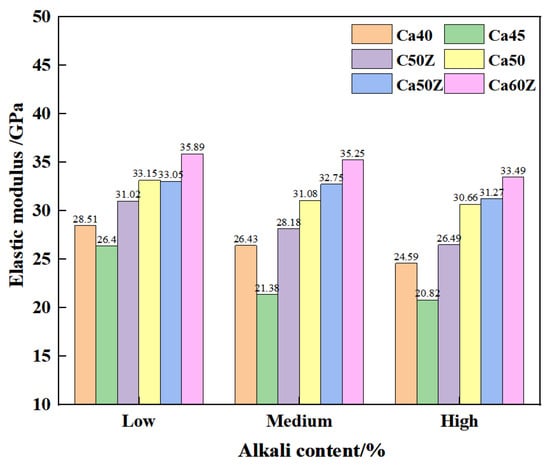
Figure 7.
Influence of different strength grades on the elastic modulus of HPC.
Figure 6 indicates a decrease in the elastic modulus as the equivalent alkali content rises. A similar degrading trend was observed for the uniaxial compressive strength. This further demonstrates the significant impact of equivalent alkali content on HPC mechanical performance.
Figure 7 shows the relationship between elastic modulus and strength grade. Under the same equivalent alkali content, higher-strength concrete generally exhibits a higher elastic modulus. However, C40 and C45 do not strictly follow this trend, though the difference between them is small.
Further analysis reveals that the elastic modulus of HPC varies with the type of admixture. For low alkali content C50-grade specimens, the elastic moduli of C50Z, Ca50, and Ca50Z are 35.8 GPa, 41.9 GPa, and 41.5 GPa, showing C50Z < Ca50Z < Ca50. This indicates that, regardless of alkali content, HPC formulations with an air-entraining agent (with or without corrosion inhibitor) yield a higher elastic modulus than those with only a corrosion inhibitor. This trend echoes the analogous effect of admixtures on compressive strength.
As mentioned above, among the factors influencing the elastic modulus, the aggregate in the raw materials has the greatest effect. Given that aggregates directly influence concrete strength, it follows that a correlation likely exists between the elastic modulus and uniaxial compressive strength. To investigate this relationship, several predictive models have been proposed. The most representative models include those from the Code for Design of Concrete Structures (GB 50010-2010) [40], the American Concrete Institute (ACI 318-11M) [41], and Dhir [42], expressed in Equations (6)–(8).
By fitting the elastic modulus and uniaxial compressive strength data from Table 6 using the above models, these findings are summarized in Figure 8. The correlation coefficients R corresponding to Equations (6)–(8) are 0.525, –0.294, and –0.290. With a sample size of n = 18 and a significance level of α = 0.001, the critical correlation coefficient is 0.622, indicating that these models cannot accurately represent the relationship between strength and elastic modulus. Therefore, the data from Table 6 were refitted, yielding the relationship shown in Equation (9), with a correlation coefficient of R = 0.786, which exceeds 0.622 and meets the correlation requirement. This demonstrates a significant relationship between the two parameters, indicating that Equation (9) can accurately describe the correlation between elastic modulus and compressive strength for HPC after long-term alkali exposure.
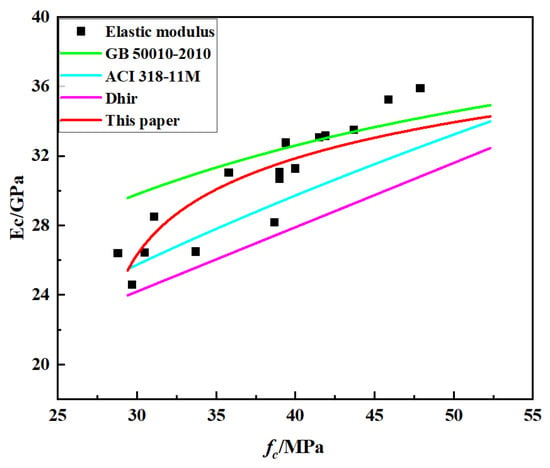
Figure 8.
Relationship between elastic modulus and axial compressive strength of HPC after 10 years of alkali immersion.
3.2. Failure Patterns Under Uniaxial Compression and Evolution of Stress–Strain Curves
3.2.1. Failure Characteristics and Complete Stress–Strain Curve Analysis
Figure 9 presents the failure patterns and full stress–strain curves of HPC specimens with different strength grades under uniaxial compression. The initial loading phase was characterized by linear-elastic deformation, with the specimens showing no signs of surface cracking or damage and retaining full structural integrity. As loading continues, the specimens remain largely within the elastic range, and no apparent surface damage or cracks are observed. The presence of admixtures suppresses the propagation of internal microcracks, extending the elastic deformation stage.
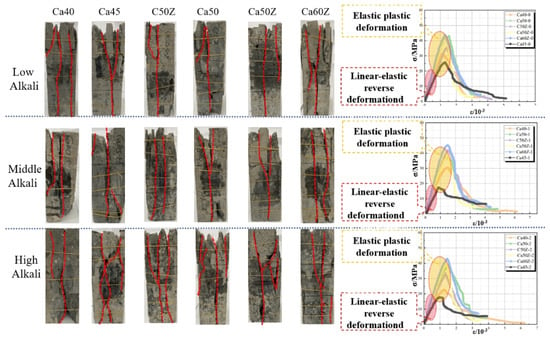
Figure 9.
Failure mode and stress–strain relationship of HPC in alkali solution under uniaxial compression.
When the stress approaches the concrete’s ultimate strength, internal microcracks begin to propagate and gradually develop into visible cracks. At this stage, cracks initiate in the mortar matrix and gradually appear on the specimen surface as fine fissures. The number and length of these cracks increase progressively. As the stress further increases, cracks rapidly extend and begin to coalesce, forming a connected crack network. At this point, visible cracks appear on the specimen surface, with significant increases in width and length.
Primary cracks gradually form and penetrate the entire specimen, typically wide and prominent, extending along the loading direction. Continued loading leads to the full interconnectivity of the crack network, resulting in spalling, crushing, and a complete loss of structural integrity.
Figure 9 further depicts the complete stress–strain curves for HPC specimens of varying strength grades under uniaxial compression. Despite differences in grade, all curves follow a consistent pattern, comprising three distinct stages: linear elasticity, plastic deformation, and elastoplastic deformation. The response progresses from a linear elastic stage (proportional stress–strain increase) through plastic deformation (driven by internal cracking) to an elastoplastic stage until peak stress. Beyond the peak, stress softens and eventually stabilizes around 7 MPa.
3.2.2. Normalized Stress–Strain Equations and Analysis
This study adopts a piecewise constitutive model, an industry standard for handling the complexity of concrete’s uniaxial compressive stress–strain behavior. The ascending branch (0 ≤ x < 1) utilizes the relationship by Yu Hongfa [43], and the descending branch (x ≥ 1) employs that of Lai Jianzhong et al. [44], as specified in Equation (10).
The variables in Equation (10) are defined as follows:
y: Normalized stress (σ/σ0)
x: Normalized strain (ε/ε0)
a, b: Curve-shaping parameters
A parametric analysis was conducted by normalizing the stress–strain data via Equation (10), as depicted in Figure 9. This analysis demonstrates that parameters a and b govern the shape of the normalized curve, thereby directly influencing the macroscopic mechanical performance, a conclusion supported by the trends in Figure 6.
Parameter a governs the ascending branch’s shape. A high value of parameter a yields a steeper ascent, characterized by enhanced plastic deformation and energy absorption prior to peak stress. Conversely, the low value of parameter a results in a near-linear response, indicating prolonged elastic dominance. Parameter b controls the post-peak behavior, dictating material toughness. As b approaches infinity, the curve plateaus, signifying fully ductile behavior with substantial deformation capacity. In contrast, b = 0 indicates immediate load loss at peak stress, representing perfectly brittle fracture with rapid, unstable crack propagation.
The stress–strain data from this study were normalized, and the fitted parameters are summarized in Table 7. The correlation coefficients corresponding to parameters a and b are all greater than 0.622, satisfying the correlation requirements of this experiment. This indicates that the constitutive relationship in Equation (10) aligns well with the stress–strain behavior of the concrete specimens tested. From the results in Figure 10 and Table 7, it is evident that parameters a and b are influenced by factors such as equivalent alkali content and admixtures. For a given strength grade, parameter *a* exhibits a step-change from low to medium alkali conditions but generally plateaus between medium and high alkali levels, except for C45. This trend suggests that the initial increase in alkali content significantly promotes ASR, causing expansion and internal damage that amplifies strain variability, while further alkalinity increases yield diminishing effects. Similarly, parameter b exhibits a variation trend with equivalent alkali content nearly identical to that of a. Regarding the effect of admixtures on b, the values for C50Z-0, Ca50-0, and Ca50Z-0 are 0.159, 0.074, and 0.050, respectively. Notably, specimens incorporating the air-entraining agent exhibit smaller b values compared with those containing only the corrosion inhibitor. This is because the air-entraining agent introduces abundant air voids, providing space for ASR products to expand, thereby reducing the damage caused by expansion and resulting in smaller strain variations.

Table 7.
Normalized curve fitting parameters.
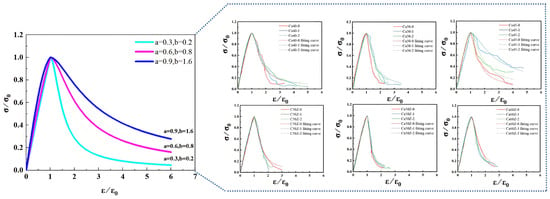
Figure 10.
Normalized stress–strain curve and the influence of parameters a and b.
3.3. Numerical Simulation of Uniaxial Compression and Mesoscale Damage Mechanism of HPC Under Long-Term Alkali Solution Immersion
3.3.1. A Mesoscale Approach: Modeling and Validating the Deterioration Process of HPC Under Long-Term Alkali Solution Immersion
A three-dimensional random aggregate concrete model was established using the modeling methods proposed by Wu Zhangyu [45,46] and the mesoscale material parameters from Wang [37]. Different types of specimens were numerically simulated to obtain peak stress and peak strain. The numerical results were then compared with experimental data, as shown in Table 8 and Figure 11.

Table 8.
Peak stress, strain, and their errors of test and numerical simulation.
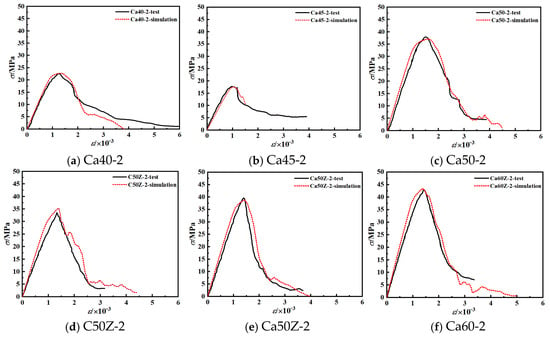
Figure 11.
Comparison of experimental and simulated stress–strain curves.
Table 8 indicates that there are discrepancies between the experimentally measured and numerically simulated peak stress and peak strain values, although most deviations remain within a reasonable range, with only a few outliers. Further analysis reveals that the error range for peak stress lies between −2.25% and 5.43%, whereas the error range for peak strain spans −5.59% to 9.78%. The larger error in peak strain compared with peak stress can be attributed to the greater sensitivity of strain measurements and simulations to material heterogeneity and equipment accuracy, coupled with the inherently small magnitude of peak strain.
Given that the numerical simulations agree well with experimental measurements, the mesoscale model is validated and proves capable of simulating the long-term mechanical performance and failure processes of ASR-mitigated HPC under alkali immersion.
3.3.2. Analysis of the Failure Process and Meso-Mechanism in HPC Prisms Under Uniaxial Compression
As established, the equivalent alkali content significantly influences HPC’s uniaxial compressive strength, with high-alkali conditions causing the most severe damage. This trend is visually exemplified in Figure 12, which compares the experimental and numerical failure morphologies of different strength-grade specimens under high-alkali exposure.
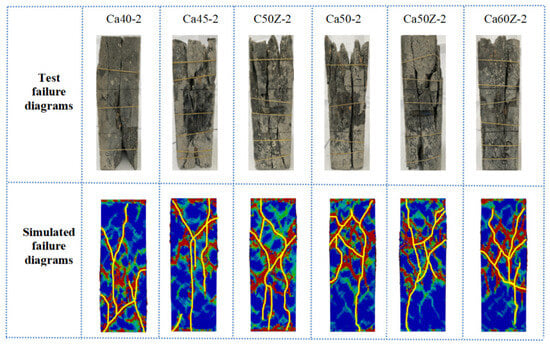
Figure 12.
HPC test and numerical simulation failure pattern of different strength grades under high alkali state after 10 years of immersion in standard alkali solution.
From Figure 12, it can be observed that low-strength concrete exhibits poor overall integrity, with pronounced strain localization. The end regions are more susceptible to multiple microcracks during compression. As loading continues, these microcracks propagate and coalesce, resulting in spalling and severe damage. In contrast, high-strength concrete demonstrates greater crack resistance, with fewer and more concentrated cracks, typically forming a single main crack that traverses the entire specimen.
Further observation of Figure 11 shows a consistent pattern in crack propagation under loading: cracks predominantly extend along the longitudinal direction, with minimal transverse cracking. Damage is more severe in the central region. This behavior arises because the specimen ends are constrained by the loading plates, limiting lateral deformation at the ends. As stress continues to increase, the central portion undergoes expansion, inducing lateral deformation and gradually accumulating stress and damage, ultimately leading to severe failure in the middle region.
Considering that the central region of the specimen exhibits the most severe damage, the prismatic specimen Ca50Z-0 was partially sectioned for internal observation. Specifically, one-third of the specimen was cut and separated, and the extracted portion was further trimmed along the central axis by one-quarter. Meanwhile, the mortar and aggregate components of the specimen were separated to facilitate a comparative study of their failure processes at different loading stages, as shown in Figure 13.
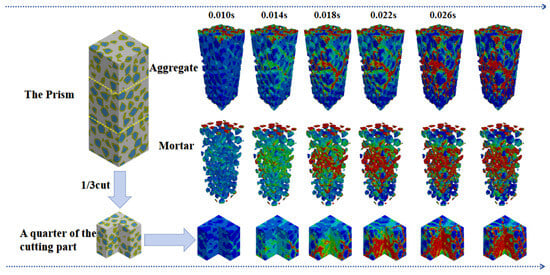
Figure 13.
Components and local failure process of Ca50Z-0 after 10 years immersion in alkali solution.
Overall, cracks initially appeared on the surface of the HPC specimen and gradually propagated inward as loading progressed, eventually forming compression-induced failure with diagonal cracks. A comparative observation of the aggregate and mortar damage revealed that mortar experienced damage first, while significant damage in the aggregates was only observed later. Under compression, damage was predominantly localized in the mortar, manifesting as substantial lateral deformation. Progressive loading intensified this damage and triggered brittle splitting failure in certain aggregates.
Figure 14 illustrates the damage evolution of the aggregates in specimen Ca50Z-2 during loading. Initially, the aggregates showed no signs of damage, whereas regions of high strain appeared in the surrounding mortar. With increasing stress, cracks propagated through the mortar and gradually penetrated the aggregates. After some loading, cracks began to develop within the aggregates, indicating that stress had reached and compromised their internal structure. As loading continued, cracks eventually traversed the aggregates, forming continuous principal cracks through the specimen and resulting in complete loss of load-bearing capacity. These observations indicate that microcracks originate in the mortar and progressively extend through the aggregates. In concrete, aggregates not only provide strength but also influence the propagation path of cracks.
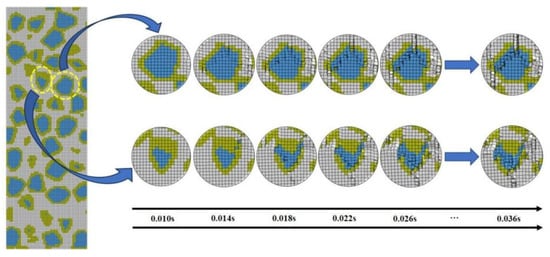
Figure 14.
Crack propagation and aggregate of specimen section.
3.4. Microstructure and Microscopic Mechanism of ASR Inhibition of HPC in Alkaline Solution
In this paper, the ASR corrosion products and microstructure of Ca50-2 mix ratio HPC with high expansion rate after 10 years of alkali immersion were analyzed by X-ray diffractometer, electron microscope (SEM) and energy dispersive spectrometer (EDS). It can be seen from Figure 15a that there are several obvious ASR corrosion products-alkali silica gel on the surface of the fine aggregate, and there is a circle of alkali silica gel wrapped around it. A small crack was formed due to the expansion and cracking of ASR gel, but no serious ASR failure characteristics were found. For coarse aggregate, as shown in Figure 15b, ASR was not found around the coarse aggregate, only micro-cracks appeared in the middle, indicating that under the long-term ASR suppression measures, ASR only occurs in the local area of HPC, and does not cause serious cracking damage.
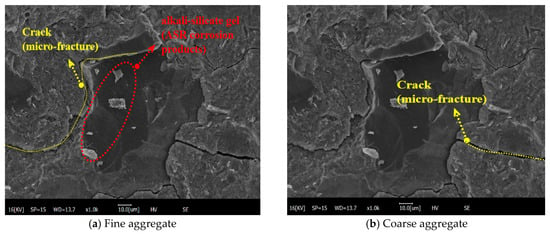
Figure 15.
SEM image of Ca50-2 after 10 years of immersion in alkaline solution.
In this paper, HPC specimens were prepared by adding mineral admixtures (Fa, SF, GGBFS). Through SEM-EDS analysis, it was found that in the alkali solution immersion, the hydration reaction of mineral admixtures produced a large number of needle-like hydration products [47,48,49] and stayed inside the air-entraining agent pores. This shows that the air-entraining agent pores provide storage space for hydration products and reduce the damage caused by the expansion of hydration products to HPC, as shown in Figure 16 and Figure 17. This shows that the air-entraining agent had a good effect on inhibiting ASR and further shows that the design of the specific mix ratio HPC in this paper can effectively inhibit ASR. And, it still has good corrosion resistance in long-term alkali solution immersion.
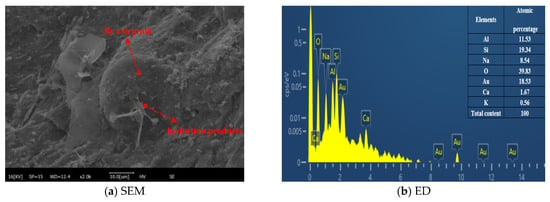
Figure 16.
SEM-EDS diagram of hydration products of Ca50-2 after soaking in alkaline solution after 10 years.
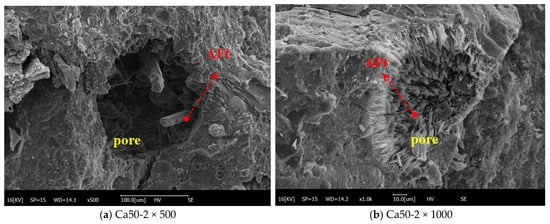
Figure 17.
SEM images of air-entraining agent and secondary hydration products of Ca50-2 after soaking in alkali solution after 10 years.
The microhardness distribution diagram of HPC specimens was obtained by microhardness test. According to the description of the thickness of the interface transition zone by Ma et al. [50], the thickness of ITZ of various specimens was roughly read from the microhardness distribution diagram, as shown in Table 9. It can be seen from Table 9 that before the corrosion of HPC in alkali solution, the thickness of the coarse aggregate interface transition zone was 50~70 μm, and the thickness of the fine aggregate interface transition zone was 40~60 μm. After alkali immersion corrosion, the thickness of the coarse aggregate interface transition zone was 60~90 μm, and the thickness of the fine aggregate interface transition zone was 50~70 μm. This shows that the thickness of the interfacial transition zone of HPC increases after 10 years of alkali solution immersion, but the increase is about 20 μm. It also shows that alkali solution immersion corrosion and ASR do not cause serious damage to HPC, which is consistent with the microscopic conclusion.

Table 9.
Summary of ITZ thickness before and after corrosion.
4. Conclusions
This study tracked the evolution of uniaxial compressive properties in HPC after 10 years of alkali immersion, with a focus on the roles of strength grade, alkali content, and admixtures. To this end, a constitutive stress–strain relationship was developed, and a 3D mesoscale model was utilized to probe the failure process and mechanisms. The key findings are summarized below:
- (1)
- While the axial compressive strength and elastic modulus of HPC increase with strength grade, they are reduced by elevated equivalent alkali content, which also intensifies internal damage and expansion. The observed linear dependence of strength on these damage parameters is of considerable significance, as it enables the non-destructive evaluation of compressive strength and offers substantial practical utility.
- (2)
- A large amount of FA, SF, and GGBFS was incorporated as ASR mitigation measures. Comparative analysis indicated that HPC with the air-entraining agent exhibited higher uniaxial compressive strength than specimens with only corrosion-inhibiting admixture. This demonstrates that the addition of air-entraining agents offers superior ASR mitigation, highlighting the significance of exploring ASR suppression strategies.
- (3)
- The study analyzed stress–strain curves and established a constitutive model, with parameters a and b influencing curve shape and concrete performance. An increase in a indicates that HPC exhibits predominantly plastic deformation in the corresponding stage, whereas a smaller a indicates mainly elastic behavior. As b approaches infinity, HPC demonstrates full ductility; conversely, when b = 0, the curve rapidly drops at the peak, indicating complete brittleness.
- (4)
- Mesoscale simulations of alkali-exposed HPC under uniaxial compression revealed distinct failure mechanisms correlated with strength. Low-strength specimens exhibited poor integrity, with cracks initiating from multiple sites, propagating extensively, and causing pronounced spalling. Conversely, high-strength concrete demonstrated superior crack resistance, characterized by fewer, more localized cracks that often coalesced into a single dominant shear fracture. Cross-sectional analysis confirmed that cracking consistently initiated within the mortar phase and propagated inwards under load, ultimately forming characteristic diagonal failure planes. By studying the SEM-EDS images, it was found that ASR only occurs in the local area of HPC, and does not cause serious cracking damage, which shows the design of the specific mix ratio HPC in this paper can effectively inhibit ASR. And HPC still has good corrosion resistance in long-term alkali solution immersion.
Author Contributions
Conceptualization, F.W. and W.L.; Methodology, F.W.; Software, F.W., J.G. and W.G.; Validation, F.W., J.G., W.L., H.Y., W.G., J.Y. and Q.T.; Formal analysis, F.W., J.G., W.L., H.Y., W.G., J.Y. and Q.T.; Investigation, F.W., J.G., H.Y., J.Y. and Q.T.; Resources, F.W., W.L., H.Y., W.G. and J.Y.; Data Curation, F.W.; Writing—Original Draft, F.W.; Writing—Review and Editing, H.Y.; Visualization, F.W., J.G., W.L., H.Y., W.G., J.Y. and Q.T.; Supervision, W.G.; Project Administration, F.W.; Funding Acquisition, H.Y. All authors have read and agreed to the published version of the manuscript.
Funding
This work was supported by the National Basic Research Program of China [grant number 2015CB655102]; the Qinghai Provincial Science and Technology Support Plan [grant number 2013-G-Q006A]; and the Special Training Program for Scientific and Technological Talents of Ethnic Minorities in Xinjiang [grant number 2024D03022].
Institutional Review Board Statement
The research does not involves human participants or animals.
Informed Consent Statement
Not applicable.
Data Availability Statement
The raw data supporting the conclusions of this article will be made available by the authors on reguest.
Conflicts of Interest
The authors declare that they have no conflicts of interest.
References
- Wang, J.; Fu, M.; Zheng, K.; Zhang, K.; Fan, Y.; Niu, D. Ion transport mechanism and diffusion model establishment in recycled aggregate concrete subjected to magnesium, sulfate, and chloride attack. Constr. Build. Mater. 2024, 428, 136273–136285. [Google Scholar] [CrossRef]
- Xie, Y.; Jia, Y.; Zhang, Y.; Yang, F.; Zhu, C. Alkali-aggregate reaction in concrete for construction of Qinghai-Tibet Railway. J. Railw. Sci. Eng. 2004, 1, 6–13. [Google Scholar]
- Stanton, T.E. Expansion of concrete through reaction between cement and aggregate. ASCE 1940, 66, 1781–1811. [Google Scholar] [CrossRef]
- Tang, M. Classification of alkali aggregate reaction. In Proceedings of the 9th International Conference of Alkali Aggregate Reaction in Concrete, London, UK, 27–31 July 1992; Volume 2, pp. 648–653. [Google Scholar]
- Fanijo, E.O.; Kassem, E.; Ibrahim, A. ASR mitigation using binary and ternary blends with waste glass powder. Constr. Build. Mater. 2021, 280, 122425. [Google Scholar] [CrossRef]
- Nguyen, A.; Gharehbaghi, V.; Le, N.T.; Sterling, L.; Chaudhry, U.I.; Crawford, S. ASR crack identification in bridges using deep learning and texture analysis. Structures 2023, 50, 494–507. [Google Scholar] [CrossRef]
- Venkatachalam, S.; Raja, K.; Vishnuvardhan, K.; Suchithra, S.; Maniarasan, S.; Saravanan, M.; Miruna, M.; Prabanjan, S. The ASR mechanism in concrete and the influence of lithium in mitigating it: A critical review. Mater. Today Proc. 2022, 65, A1–A6. [Google Scholar] [CrossRef]
- Lacsado, M.F.Y.; Velasco, I.I.I.V.L.; Juan, K.S. Expansion and Mitigation of Alkali-Silica Reaction in Binary Blended Concrete Confining Potentially Reactive Aggregates. Key Eng. Mater. 2023, 953, 75–82. [Google Scholar] [CrossRef]
- Chatterji, S. The role of Ca(OH)2 in the breakdown of Portland cement concrete due to alkali-silica reaction. Cem. Concr. Res. 1979, 9, 185–188. [Google Scholar] [CrossRef]
- Urhan, S. Alkali silica and pozzolanic reactions in concrete. Part 1: Interpretation of published results and an hypothesis concerning the mechanism. Cem. Concr. Res. 1987, 17, 141–152. [Google Scholar] [CrossRef]
- Chatterji, S.; Thaulow, N.; Jensen, A.D. Studies of alkali-silica reaction, part 6. Practical implications of a proposed reaction mechanism. Cem. Concr. Res. 1988, 18, 363–366. [Google Scholar] [CrossRef]
- Chatterji, S.; Thaulow, N.; Jensen, A.D. Studies of alkali-silica reaction. Part 5. Verification of a newly proposed reaction mechanism. Cem. Concr. Res. 1989, 19, 177–183. [Google Scholar] [CrossRef]
- Wang, H.; Gillott, J.E. Mechanism of alkali-silica reaction and the significance of calcium hydroxide. Cem. Concr. Res. 1991, 21, 647–654. [Google Scholar] [CrossRef]
- Garcia-Diaz, E.; Riche, J.; Bulteel, D.; Vernet, C. Mechanism of damage for the alkali–silica reaction. Cem. Concr. Res. 2006, 36, 395–400. [Google Scholar] [CrossRef]
- Figueira, R.; Sousa, R.; Coelho, L.; Azenha, M.; de Almeida, J.; Jorge, P.; da Silva, C.J.R. Alkali-silica reaction in concrete: Mechanisms, mitigation and test methods. Constr. Build. Mater. 2019, 222, 903–931. [Google Scholar] [CrossRef]
- Ding, J.T.; Bai, Y.; Cai, Y.B. Suppressing effect of lithium slag on alkali silica reaction and separation of its self-expansion. J. Ho Hai Univ. (Nat. Sci.) 2008, 36, 824–827. [Google Scholar]
- Saha, A.K.; Khan, M.N.N.; Sarker, P.K.; Shaikh, F.A.; Pramanik, A. The ASR mechanism of reactive aggregates in concrete and its mitigation by fly ash: A critical review. Constr. Build. Mater. 2018, 171, 743–758. [Google Scholar] [CrossRef]
- Yang, H.Q.; Li, P.X.; Rao, M.J. Long term investigation and inhibition on alkali-aggregates reaction of Three Gorges Dam concrete. Constr. Build. Mater. 2017, 151, 673–681. [Google Scholar] [CrossRef]
- Kawamura, M.; Iwahori, K. ASR gel composition and expansive pressure in mortars under restraint. Cem. Concr. Compos. 2004, 26, 47–56. [Google Scholar] [CrossRef]
- Mohammadi, A.; Ghiasvand, E.; Nili, M. Relation between mechanical properties of concrete and alkali-silica reaction (ASR); a review. Constr. Build. Mater. 2020, 258, 119567. [Google Scholar] [CrossRef]
- Swamy, R.N.; Al-Asali, M.M. Engineering properties of concrete affected by alkali-silica reaction. Mater. J. 1988, 85, 367–374. [Google Scholar]
- Bektas, F.; Wang, K. Performance of ground clay brick in ASR-affected concrete: Effects on expansion, mechanical properties and ASR gel chemistry. Cem. Concr. Compos. 2012, 34, 273–278. [Google Scholar] [CrossRef]
- Ahmed, T.W.; El-Dieb, A.S.; Reda Taha, M.M. Evaluating the reactivity of alkali-silica reactive aggregates under the combined effect of stress and alkali attack. Constr. Build. Mater. 2018, 158, 380–391. [Google Scholar]
- Jin, L.; Liu, M.; Zhang, R.; Du, X. Cracking of cover concrete due to non-uniform corrosion of corner rebar: A 3D meso-scale study. Constr. Build. Mater. 2020, 245, 118449. [Google Scholar] [CrossRef]
- Liu, C.; Xie, D.; She, W.; Liu, Z.; Liu, G.; Yang, L.; Zhang, Y. Numerical modelling of elastic modulus and diffusion coefficient of concrete as a three-phase composite material. Constr. Build. Mater. 2018, 189, 1251–1263. [Google Scholar] [CrossRef]
- Lu, Y.; Tu, Z. Mesoscale modelling of concrete for static and dynamic response analysis-Part 2: Numerical investigations. Struct. Eng. Mech. Int. J. 2011, 37, 215–231. [Google Scholar] [CrossRef]
- Naito, N.; Maeda, K.; Konno, H.; Ushiwatari, Y.; Suzuki, K.; Kawase, R. Rockfall impacts on sand cushions with different soil mechanical characteristics using discrete element method. Soils Found 2020, 60, 384–397. [Google Scholar] [CrossRef]
- Camborde, F.; Mariotti, C.; Donzé, F.V. Numerical study of rock and concrete behaviour by discrete element modelling. Comput. Geotech. 2000, 27, 225–247. [Google Scholar] [CrossRef]
- Ng, T.T. Triaxial test simulations with discrete element method and hydrostatic boundaries. J. Eng. Mech. 2004, 130, 1188–1194. [Google Scholar] [CrossRef]
- Schlangen, E.; Van Mier, J.G.M. Simple lattice model for numerical simulation of fracture of concrete materials and structures. Mater. Struct. 1992, 25, 534–542. [Google Scholar] [CrossRef]
- Fascetti, A.; Ichimaru, S.; Bolander, J.E. Stochastic lattice discrete particle modeling of fracture in pervious concrete. Comput. Aided Civ. Infrastruct. Eng. 2022, 37, 1788–1808. [Google Scholar] [CrossRef]
- Zhou, G.T.; Xu, Z.H. 3D mesoscale investigation on the compressive fracture of concrete with different aggregate shapes and interface transition zones. Constr. Build. Mater. 2023, 393, 132111. [Google Scholar] [CrossRef]
- Häfner, S.; Eckardt, S.; Luther, T. Mesoscale modeling of concrete: Geometry and numerics. Comput. Struct. 2006, 84, 450–461. [Google Scholar] [CrossRef]
- Unger, J.F.; Eckardt, S. Multiscale Modeling of Concrete. Arch. Comput. Methods Eng. 2011, 18, 341–393. [Google Scholar] [CrossRef]
- Lilliu, G.; Van Mier, J.G.M. On the relative use of micro-mechanical lattice analysis of 3-phase particle composites. Eng. Fract. Mech. 2007, 74, 1174–1189. [Google Scholar] [CrossRef]
- Wittmann, F.H.; Roelfstra, P.E.; Sadouki, H. Simulation and analysis of composite structures. Mater. Sci. Eng. 1985, 68, 239–248. [Google Scholar] [CrossRef]
- Wang, F.; Yu, H.; Ma, H.; Cheng, M.; Guo, J.; Zhang, J.; Liu, W.; Gao, W.; Tao, Q.; Guo, J. Mechanical Performance of The ITZ and Mesoscopic Compression Failure Mechanism of HPC with ASR Inhibition Measures under Long-term Brine Corrosion. Case Stud. Constr. Mater. 2024, 21, e03505. [Google Scholar] [CrossRef]
- Peng, G. Study on the Durability of Concrete Structures in Subway Engineering Under High-Altitude Saline Soil Environment in Northwest China. Ph.D. Thesis, Nanjing University of Aeronautics and Astronautics, Nanjing, China, 2018. [Google Scholar]
- Guo, J.; Guo, J.; Yu, H.; Ma, H.; Zhang, J.; Yan, J.; Wang, F.; Zhang, L. Mechanical Properties and Mesoscopic Numerical Simulation of Local Weakening in HPC under 10 Years of Alkali Solution Immersion. Buildings 2024, 14, 1965. [Google Scholar] [CrossRef]
- GB 50010-2010; Code for Design of Concrete Structures. Architecture & Building Press: Beijing, China, 2015.
- ACI 318-11M; Building Code Requirements for Structural Concrete and Commentary. American Concrete Institute: Farmington Hills, MI, USA, 2011.
- Dhir, R.K.; Limbachiya, M.C.; Leelawat, T. Suitability of recycled concrete aggregate for use in BS 5328 EDSignated mixes. Proc. Inst. Civ. Eng.-Struct. Build. 1999, 134, 257–274. [Google Scholar] [CrossRef]
- Yu, H.; Da, B.; Yuan, Y.; Zhu, H. Proportioning Design and Compressive Strength Law of All-Coral Seawater Concrete; Annual Progress Report on Open Subjects; State Key Laboratory of Explosion Shock Compressive Strength Law of All-Coral Seawater Concrete People’s Liberation Army University of Science and Technology: Nanjing, China, 2014. [Google Scholar]
- Lai, J. Preparation and Dynamic Behaviour of Ultra-High Performance Cementitious Composites. Ph.D. Thesis, Southeast University, Nanjing, China, 2007. [Google Scholar]
- Wu, Z.; Zhang, J.; Yu, H.; Ma, H.; Chen, L.; Dong, W.; Huan, Y.; Zhang, Y. Coupling effect of strain rate and specimen size on the compressive properties of coral aggregate concrete: A 3D mesoscopic study. Compos. Part B Eng. 2020, 200, 108299. [Google Scholar] [CrossRef]
- Wu, Z.; Zhang, J.; Yu, H. Three-Dimensional Mesoscopic Investigation on Quasi- Static Compressive Properties of Coral Aggregate Concrete. ACI Mater. J. 2021, 118, 121–132. [Google Scholar] [CrossRef]
- Yan, J.; Yu, H.-F.; Zhang, W.-Q.; Zhang, L.-F.; Ma, H.-Y.; Gong, X.; Cheng, M.; Zhang, X.-T. Expansion and mechanical properties of high-performance concrete with ASR inhibition measures exposed to alkaline solution at 38°C for 10 years. Constr. Build. Mater. 2022, 353, 129044. [Google Scholar] [CrossRef]
- Ho, Q.V.; Le, T.H.M.; Huynh, T.P. The influence of pre-compression on the durability of high-performance concrete incorporating industrial by-products. Proc. Inst. Mech. Eng. Part L: J. Mater. Des. Appl. 2024, 238, 901–915. [Google Scholar] [CrossRef]
- Yan, J.; Yu, H.-F.; Zhang, W.-Q.; Zhang, L.-F.; Gong, X.; Cheng, M.; Zhang, X.-T. Full uniaxial compressive stress–strain curve of high-performance concrete with ASR inhibition measures exposed to lye solution at 38° C for 10 years. Constr. Build. Mater. 2022, 351, 128919. [Google Scholar] [CrossRef]
- Ma, H.; Tu, Y.; Yu, H.; Diao, Y.; Han, W.; Zhang, M. Mechanical properties and microstructural characteristics of coral-aggregate-concrete ITZ: Experimental study. J. Build. Eng. 2023, 72, 106647. [Google Scholar] [CrossRef]
Disclaimer/Publisher’s Note: The statements, opinions and data contained in all publications are solely those of the individual author(s) and contributor(s) and not of MDPI and/or the editor(s). MDPI and/or the editor(s) disclaim responsibility for any injury to people or property resulting from any ideas, methods, instructions or products referred to in the content. |
© 2025 by the authors. Licensee MDPI, Basel, Switzerland. This article is an open access article distributed under the terms and conditions of the Creative Commons Attribution (CC BY) license (https://creativecommons.org/licenses/by/4.0/).