Article

Experimental Characterization of the Seismic Response of Industrial Steel Piping Systems

1
Department of Civil Engineering and Architecture, University of Pavia, 27100 Pavia, Italy
2
European Centre for Training and Research in Earthquake Engineering, 27100 Pavia, Italy
3
Department of Engineering for Innovation, University of Salento, 73100 Lecce, Italy
4
Department of Technological Innovations and Safety of Plants, National Institute for Insurance Against Accidents at Work, 00133 Rome, Italy
*
Author to whom correspondence should be addressed.
Buildings 2025, 15(22), 4197; https://doi.org/10.3390/buildings15224197
Submission received: 17 October 2025 / Revised: 12 November 2025 / Accepted: 17 November 2025 / Published: 20 November 2025
(This article belongs to the Section Building Structures)

Abstract

Industrial plants are vulnerable to different natural hazards, which can cause significant damage, economic losses, and loss of functionality, generating what is called a Natural Hazard Triggering Technological Disaster (Na-Tech event). Considering the different possible hazard sources, earthquakes can subject industrial plants to demanding scenarios, making it important to better understand and characterize their seismic response. Among the different components of industrial plants, piping systems represent a key element as they transport liquids and gases among different equipment and reservoirs. Any induced damage to piping systems can lead to leakage and loss of containment of hazardous substances, causing floods, fires, and explosions, starting a cascade effect along the industrial plant. This study evaluates the seismic response of diverse configurations of industrial steel piping systems through experimental tests. Twelve piping specimens composed of different geometrical layouts (i.e., straight, Omega, and V loops) and joint mechanisms (i.e., welded and flanged joints) were subjected to cyclic axial loads and seismic inputs, measuring displacements, deformations, forces, and acceleration in key points. The results show that some configurations, especially those with flanged connections, can exhibit larger seismic demands in terms of local deformations and acceleration response.

1. Introduction

Industrial plants are highly vulnerable to various natural hazards, such as earthquakes, floods, storms, and extreme temperatures, which can lead to the so-called Na-Tech (Natural Hazard Triggering Technological) events. These events are of interest due to their significant implications in terms of human, economic, and functionality losses [1]. Among the different hazards that can affect industrial plants, seismic events can have large deleterious effects, affecting the overall resilience capacity of communities [2,3]. Industrial plants are composed of different components, structures, and equipment based on their functionality and purpose, each of which can be characterized by its structural and seismic properties. In this regard, steel piping systems represent a crucial component used for the transportation of liquids and gases between equipment, components, and reservoirs. Due to their geometrical characteristics and interaction with other components of industrial plants, steel pipes can be subjected to large forces, displacements, and deformations induced by earthquakes, resulting in leakage and loss of containment of hazardous substances, and subsequently, causing floods, fires, explosions, and possibly starting a cascade effect along the industrial plant [4,5,6,7,8,9,10,11]. Moreover, examples of actual steel pipe failures due to seismic inputs can be found at [12,13,14].
Despite the importance of steel piping systems and their connections for the vulnerability assessment of industrial plants, there is still a gap in the understanding and assessment of their seismic response due to the complexity of their components, joints, and geometries. Few studies have focused on the experimental characterization of the structural and seismic properties of steel pipes, especially those that are neither buried nor suspended. For example, Kamel Abbasnia and Shariati [15] investigated the ratcheting behavior of steel pipe elbows. Pournara and Karamanos [16] evaluated the mechanical behavior of steel pipes considering local wall distortions. Wang et al. [17] conducted an experimental and fragility analysis of piping systems characterized by grooved fit joints. The lack of experimental data represents a significant challenge for the development of reliable and manageable numerical models, as well as for the proper design and implementation of piping systems considering seismic demand. In this regard, several authors have proposed calibrated and simplified models to simulate piping elements, especially considering geometrical variations and different joint typologies, as well as to identify failure mechanisms such as low cycle fatigue and local buckling [18,19,20,21,22]; nevertheless, more actual data are necessary for producing and improving modeling assumptions such as stiffness variations, inherent damping levels, and hysteretic response. This study presents the results of an experimental campaign conducted on several pipe specimens with varying geometries and joint characteristics, subjected to cyclic axial loads and seismic inputs. The response of the pipe specimens was measured in terms of hysteretic response, deformations, displacements, and acceleration response. Based on these results, several structural properties were computed, such as yield force, initial stiffness, and post-yield stiffness.

2. Experimental Campaign

The structural characteristics and seismic response of steel piping systems were obtained from cyclic axial tests and shake table tests. The different tested configurations were selected aiming at using typical thermal and seismic expansion joints, as well as to evaluate clearly the influence of the axial stiffness on the hysteretic response of the pipe configurations. For both test typologies, several piping layouts (i.e., varying pipeline geometry) were constructed using welded and flanged joints. Pipes CHS-CF 114.3 × 3.6 made of S235 steel were used for both test typologies. Table 1 reports the cross-section properties of the used pipe and material. All pipeline specimens were welded at both ends to 22.0 × 22.0 × 2.0 cm steel plates that served as anchoring elements. The perpendicular span of all the specimens, including the anchoring steel plates, was equal to 4010 mm. The welded joints were made using flux-cored arc welding, whereas the flanged joints were composed of PN16 steel flanges. In total, six pipeline configurations were tested under cyclic axial conditions, and six other pipeline configurations were subjected to actual seismic inputs. All the tests were conducted at the Eucentre Foundation in Pavia, Italy.

2.1. Cyclic Tension Test

Three pipeline layouts using welded and flanged joints, for a total of six specimens, were tested following a cyclic axial load protocol. The loading protocol was adapted from the FEMA 461 document [23], which provides a solid base for the seismic response assessment of nonstructural elements. In addition, as demonstrated by Filiatrault et al. [24], this load protocol allows a better characterization of the structural and seismic properties of steel pipes compared to other alternatives. The load protocol followed a displacement control procedure, considering only tension displacements to avoid premature failure due to compression critical loads. The load protocol is defined by two cycles characterized by a target displacement amplitude, then the amplitude is increased by 140% repeating another two cycles, and continuing until reaching a desired limit state (i.e., failure). Figure 1 and Figure 2 show the loading protocol used and the laboratory setup, respectively.
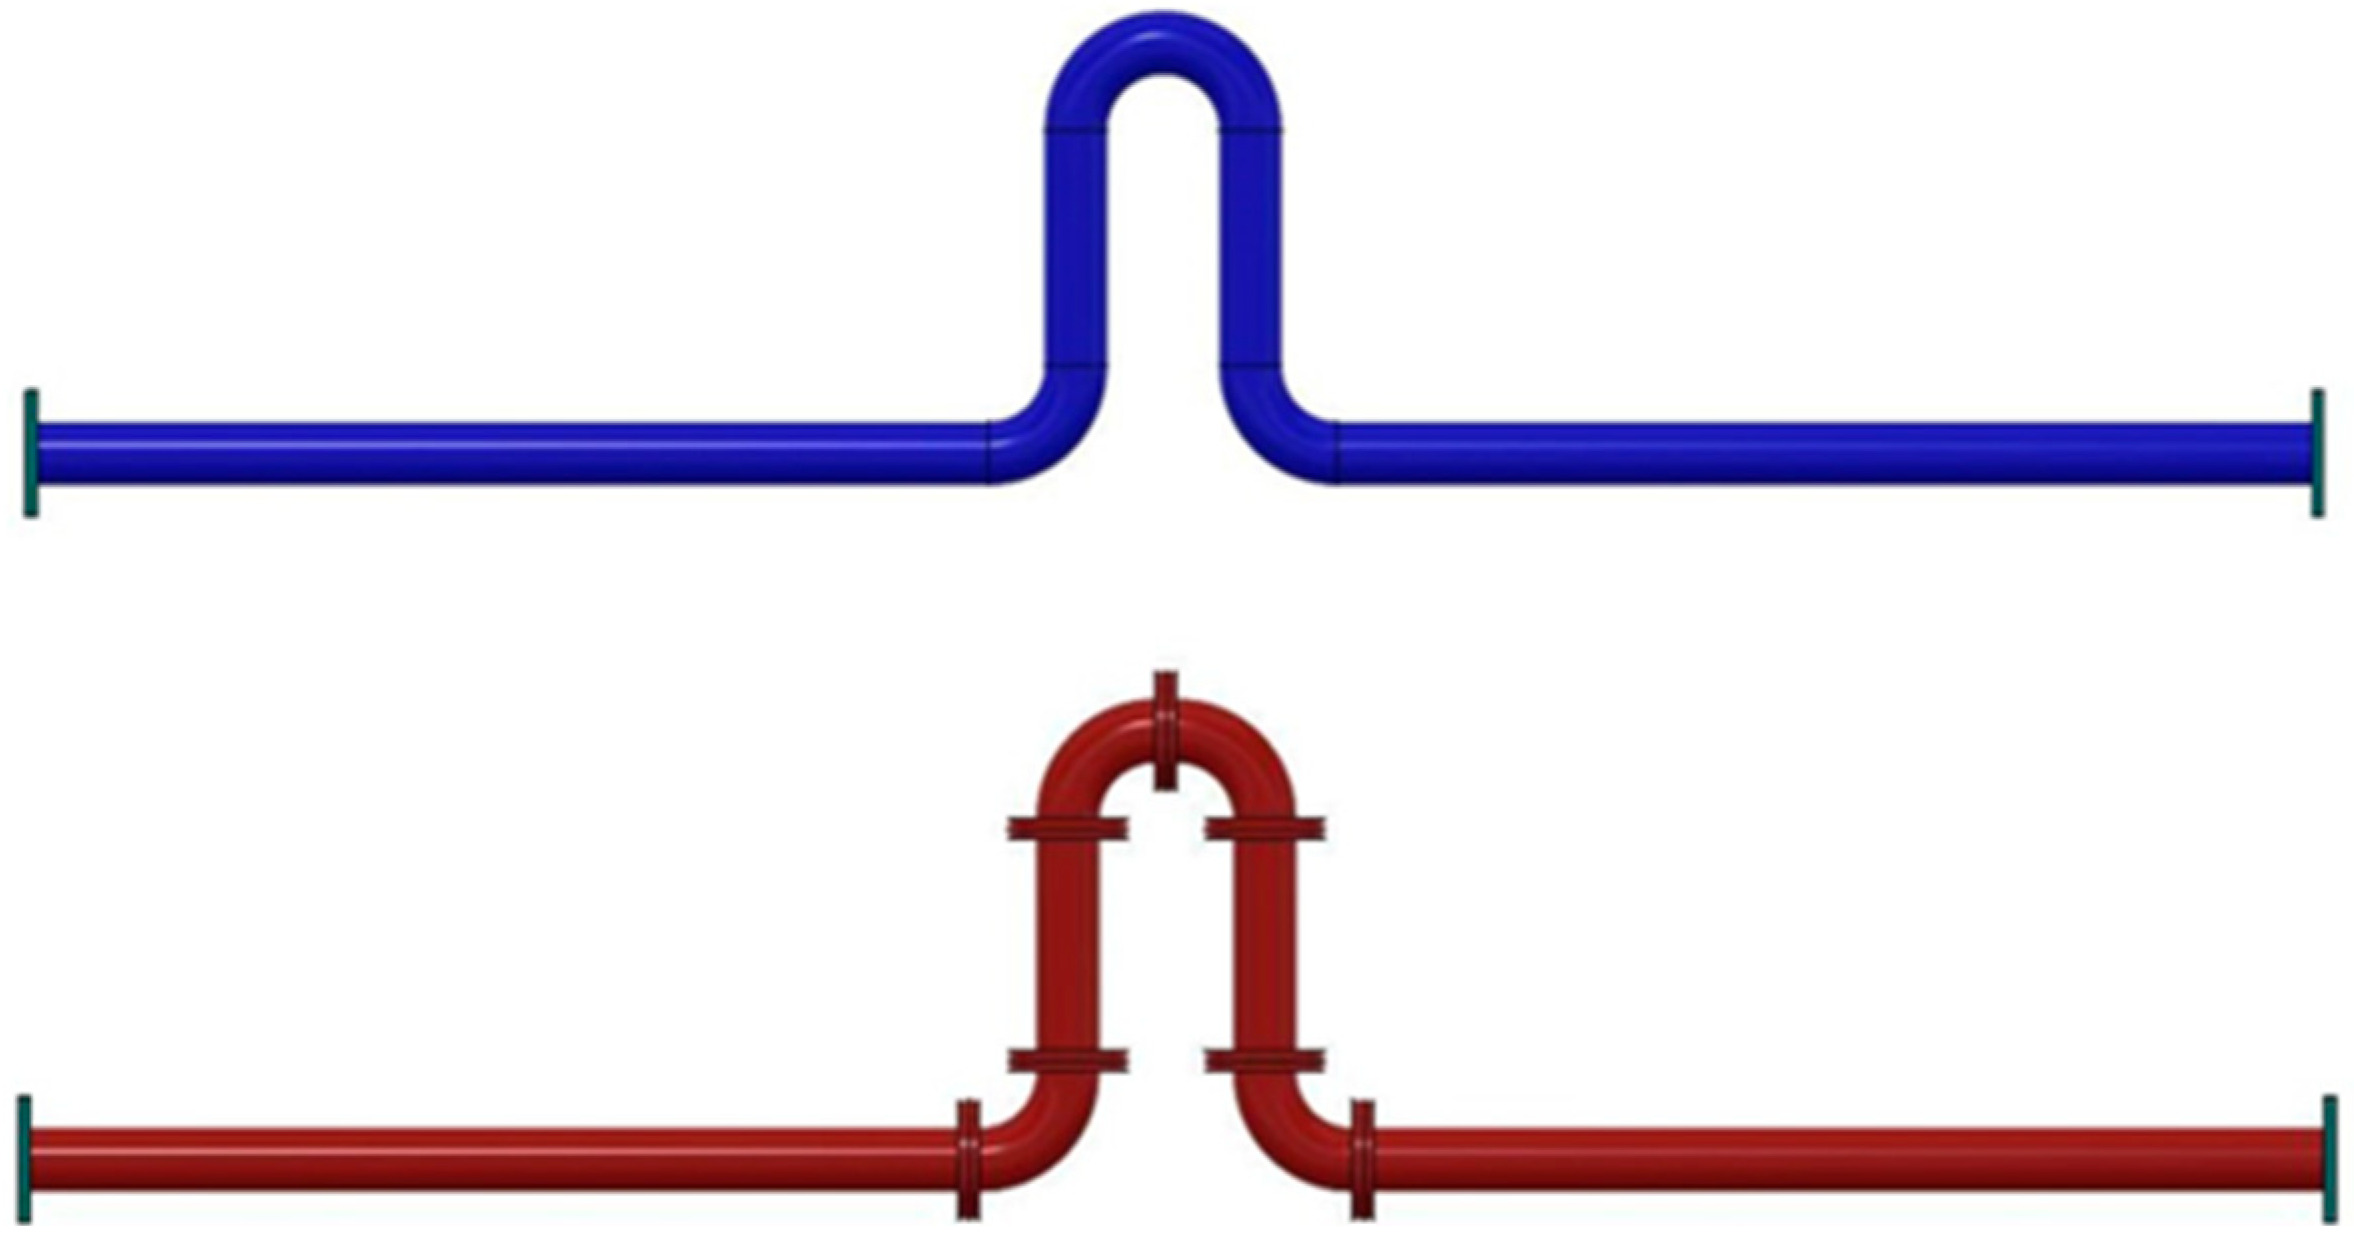
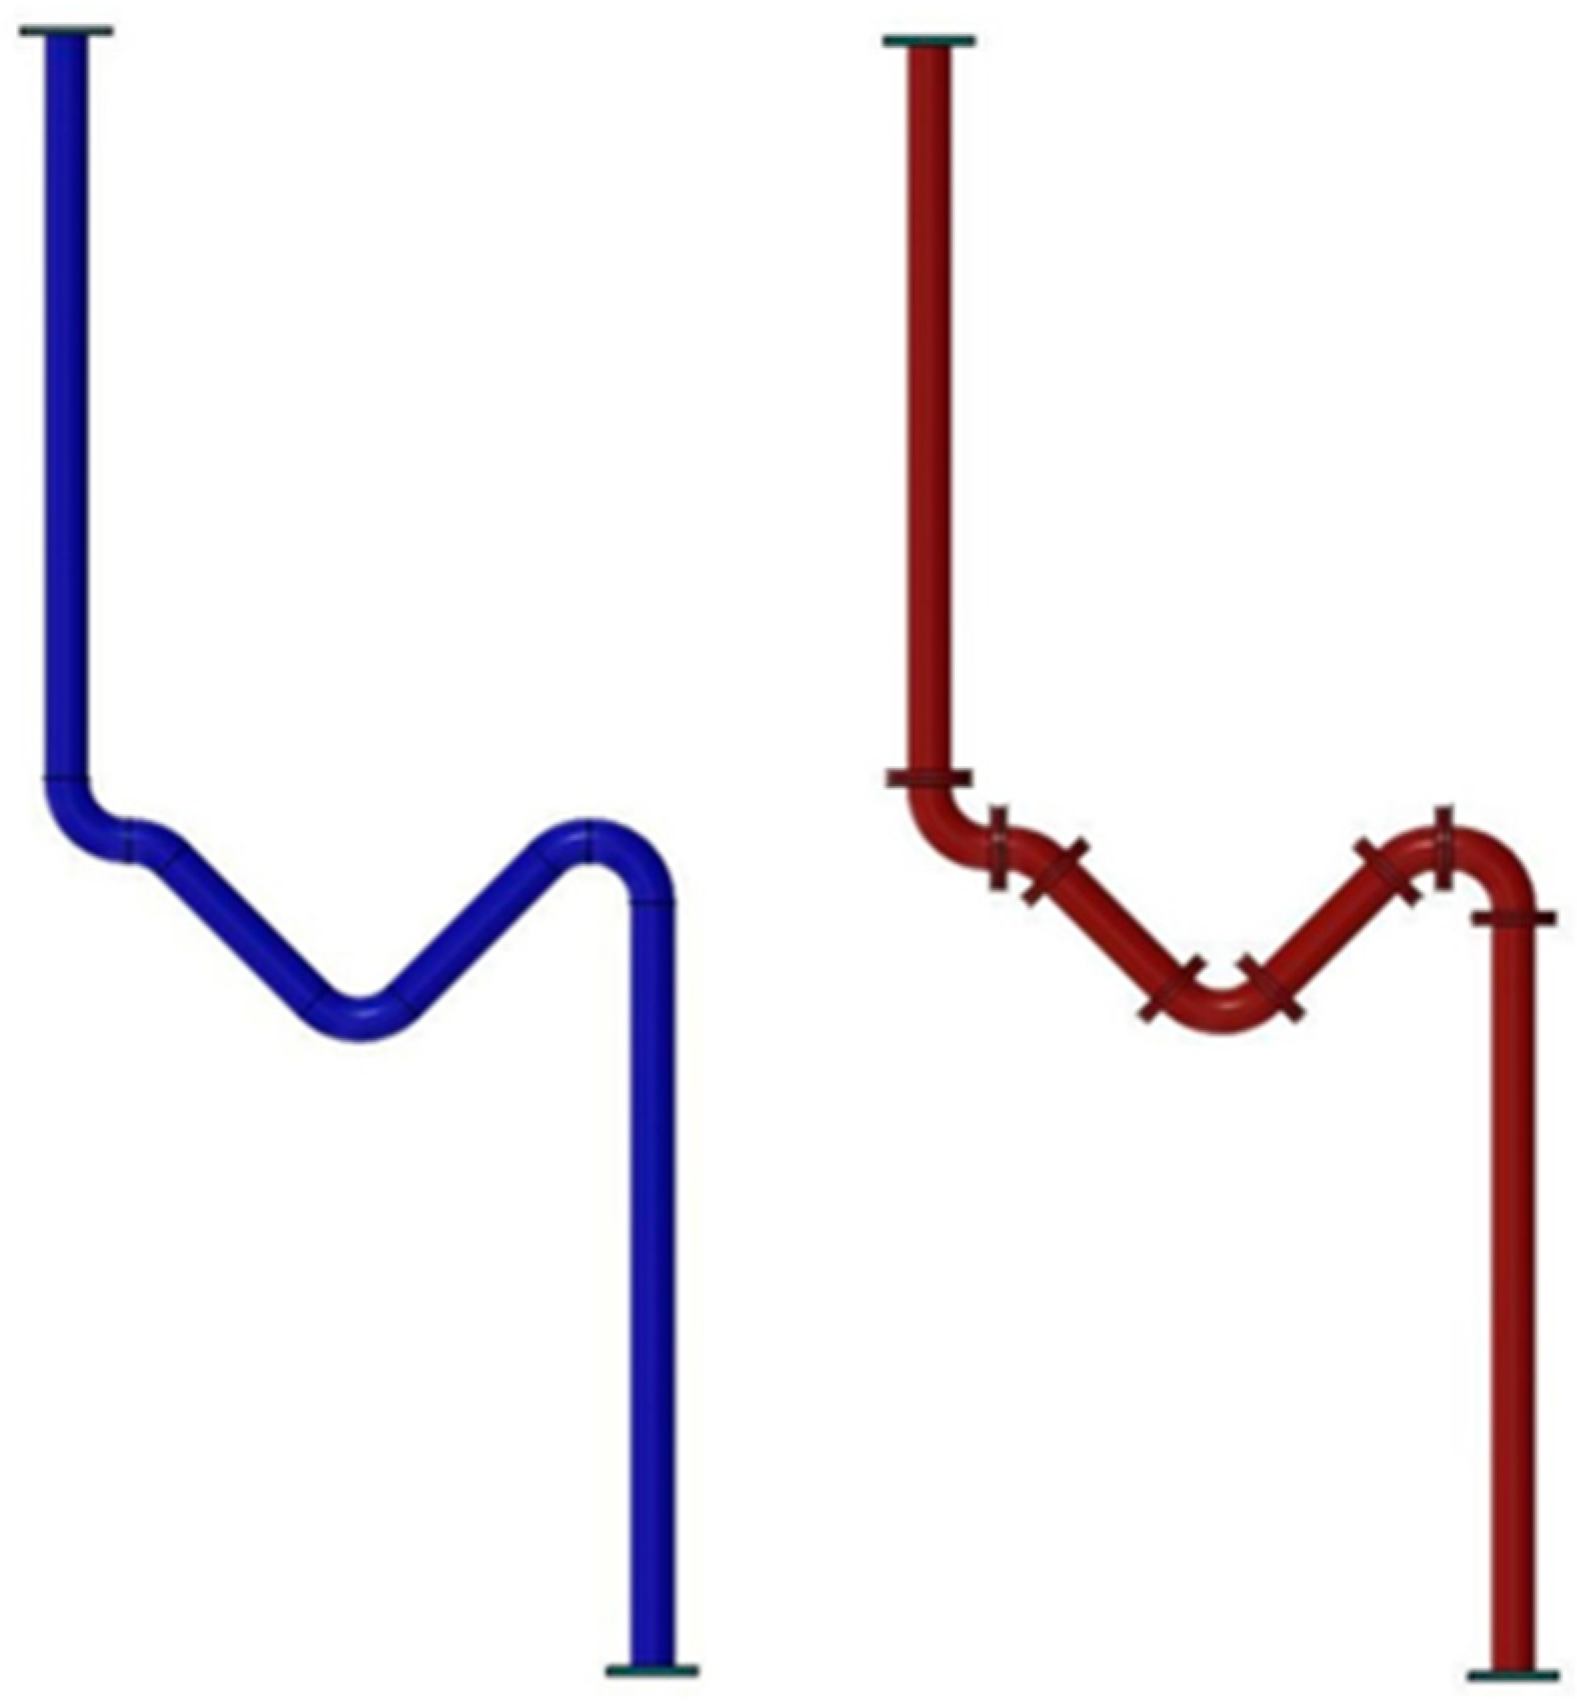
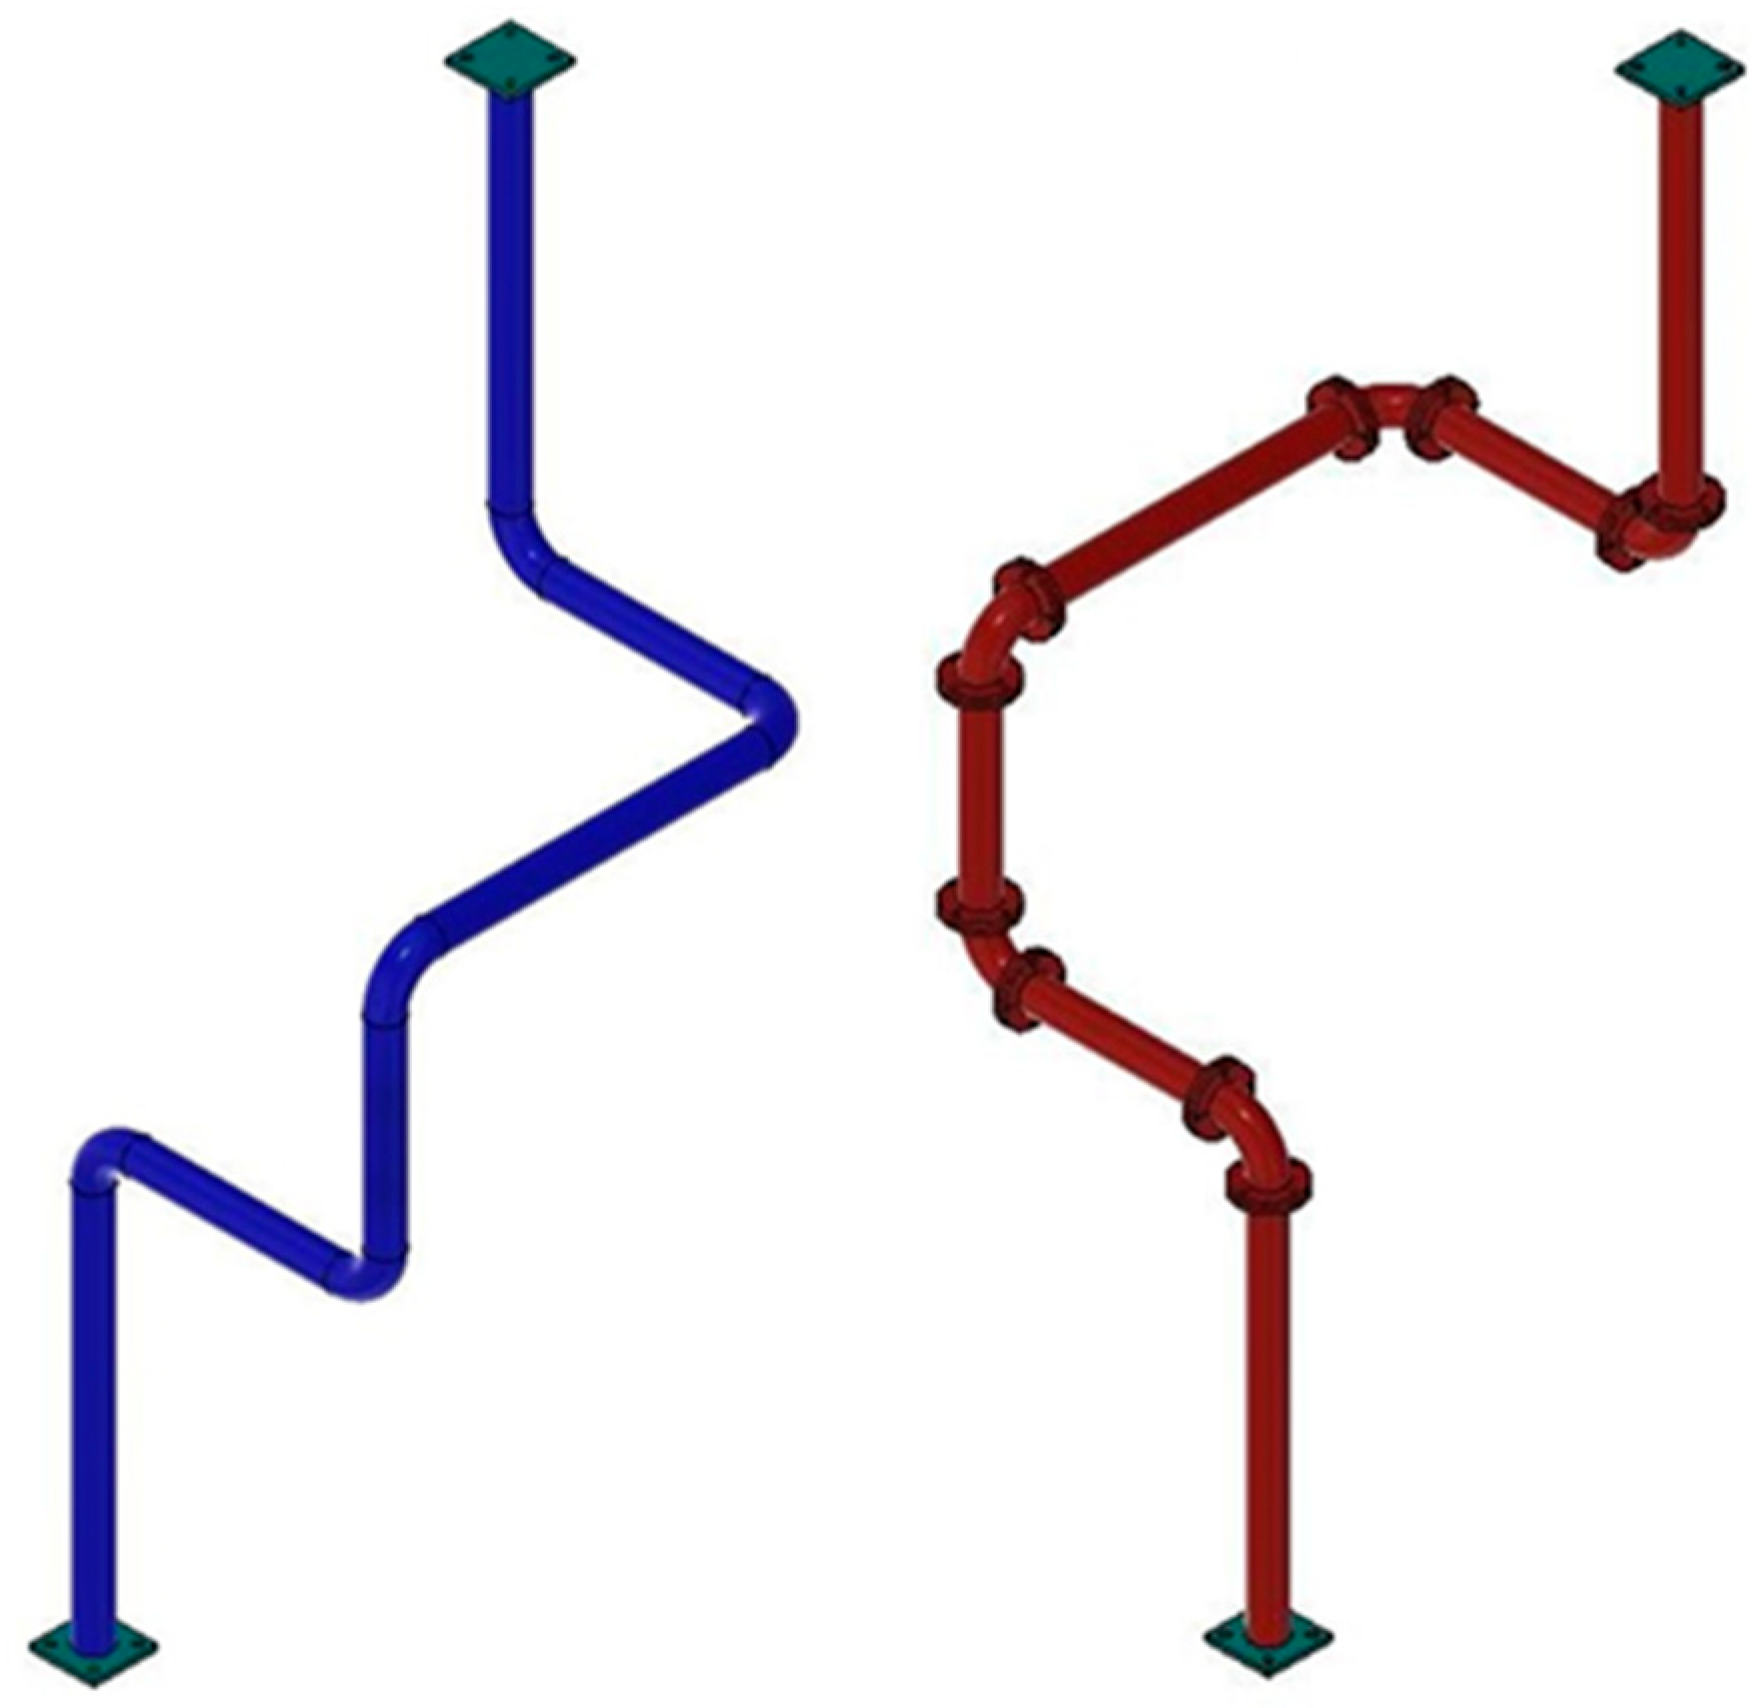
Figure 3, Figure 4 and Figure 5 show the six specimens tested under cyclic axial load conditions. Pipes 1 and 2 represent a straight continuous pipe and a straight pipe with a flanged joint in the middle span, respectively. Pipes 3 and 4 represent an Omega loop (i.e., 90° elbows) with a deviation from the principal axis equal to 715 mm, using welded and flanged joints, respectively. Finally, pipes 5 and 6 represent a V loop (i.e., 45° elbows) with a deviation from the principal axis equal to 436 mm, using welded and flanged joints, respectively. The response of the pipe specimens was measured in terms of displacements with linear variable differential transformers (LVDT) between the body of the actuator and its head and between the initial and final portions of the loop, applied forces using a load cell at the head of the actuator. In addition, some specimens were also equipped with Fiber Bragg Grating sensors to measure axial strains at specific points. Moreover, simplified numerical models of the three aforementioned geometrical configurations were also implemented and subjected to a monotonic load (i.e., pushover command) to evaluate the envelope and estimate the deformed shape and maximum tension stresses of the specimens. These results serve as a reference point to assess the influence of joint typology (i.e., welded or flanged). The numerical models were generated using Midas Gen 2024 and were composed of fiber sections characterized by a Menegotto-Pinto hysteresis model [25] with a yield stress equal to 0.38 kN/mm2 and a post-yield stiffness equal to 1% of the elastic stiffness. The different pipe elements were assumed fixed-connected, and the stiffness of the end plates was explicitly modeled for better accuracy of the results, assuming an elastic stiffness equal to 180 kN/mm.

2.2. Shake Table Test

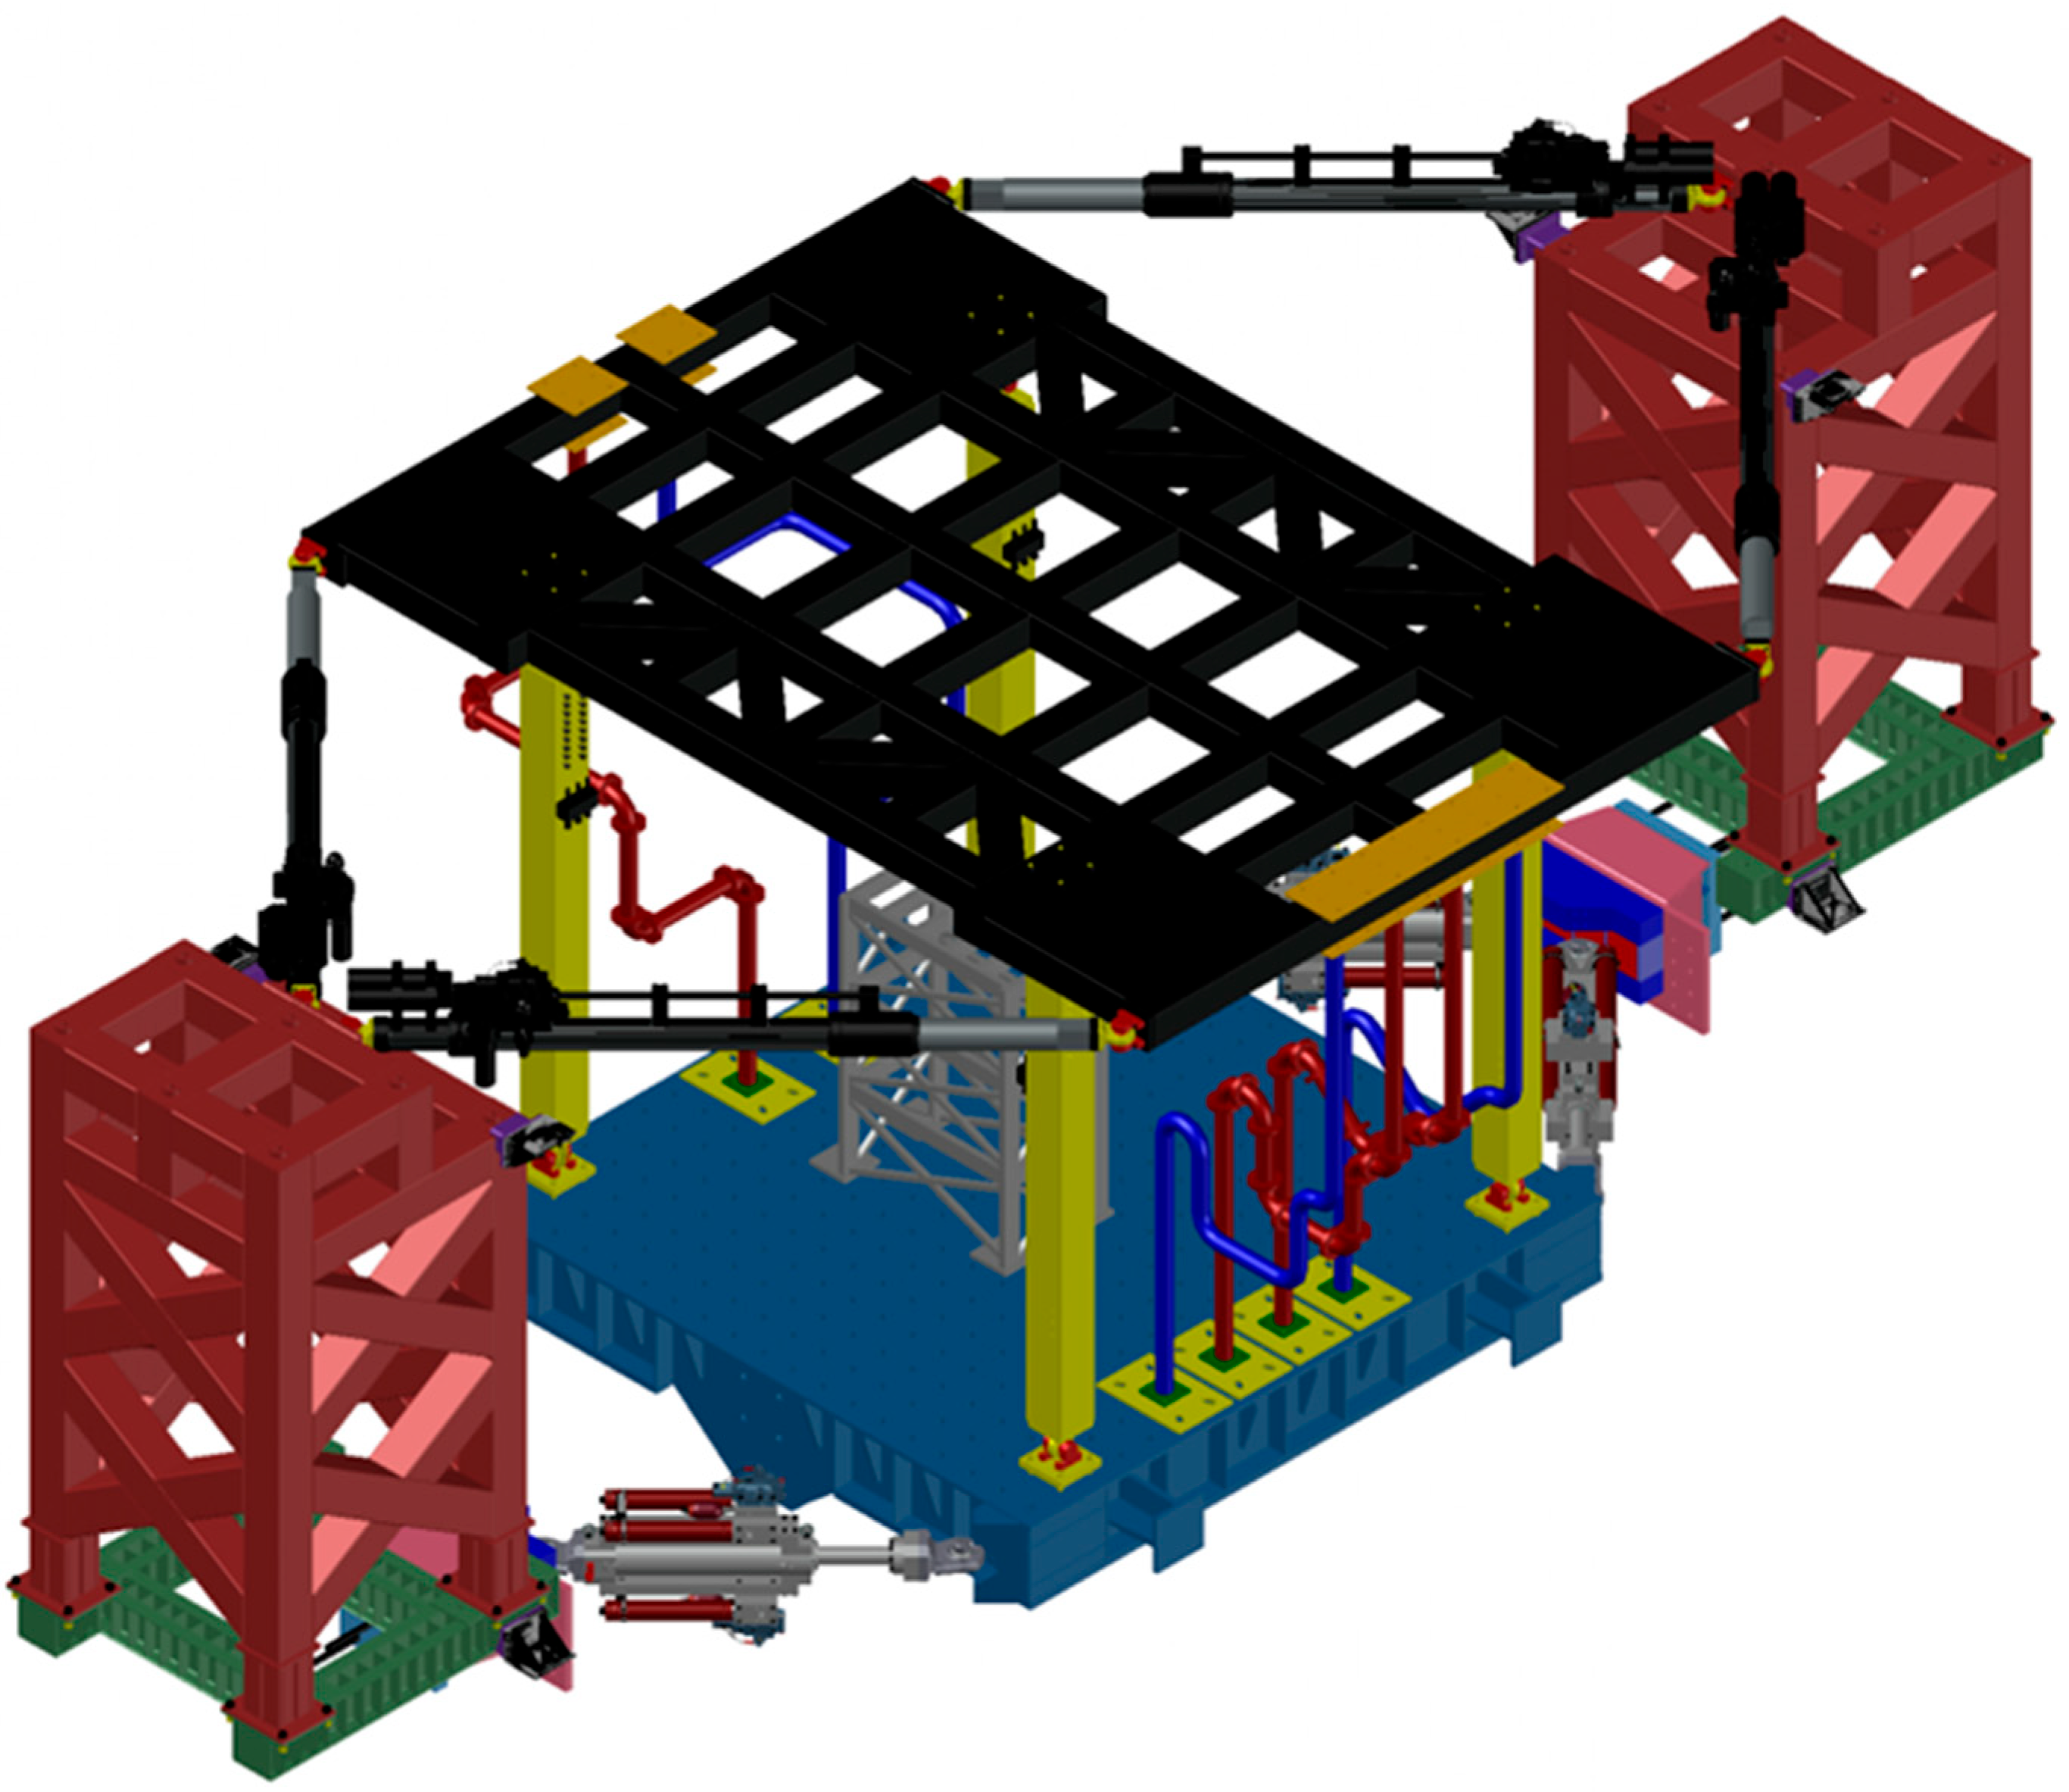
Three pipeline layouts, composed of different loops and joints typologies, were subjected to horizontal seismic inputs using the 9D shake-table available at the Eucentre Foundation. This shake-table can simulate different seismic inputs in two independent parallel shake tables, one 4060 mm above the other one, therefore, recreating different floor accelerations of the same structure. The shake-table can reproduce in total nine degrees of freedom, six in the bottom table and three in the top table, with a maximum translational displacement of one meter and a peak velocity of two and three meters per second for the bottom and top tables, respectively. Figure 6 illustrates the shake-table setup. To obtain the actual seismic demand on industrial steel pipelines, a 3D two-story steel moment-resisting frame tower was designed and subjected to nonlinear time history analysis using horizontal ground motions.
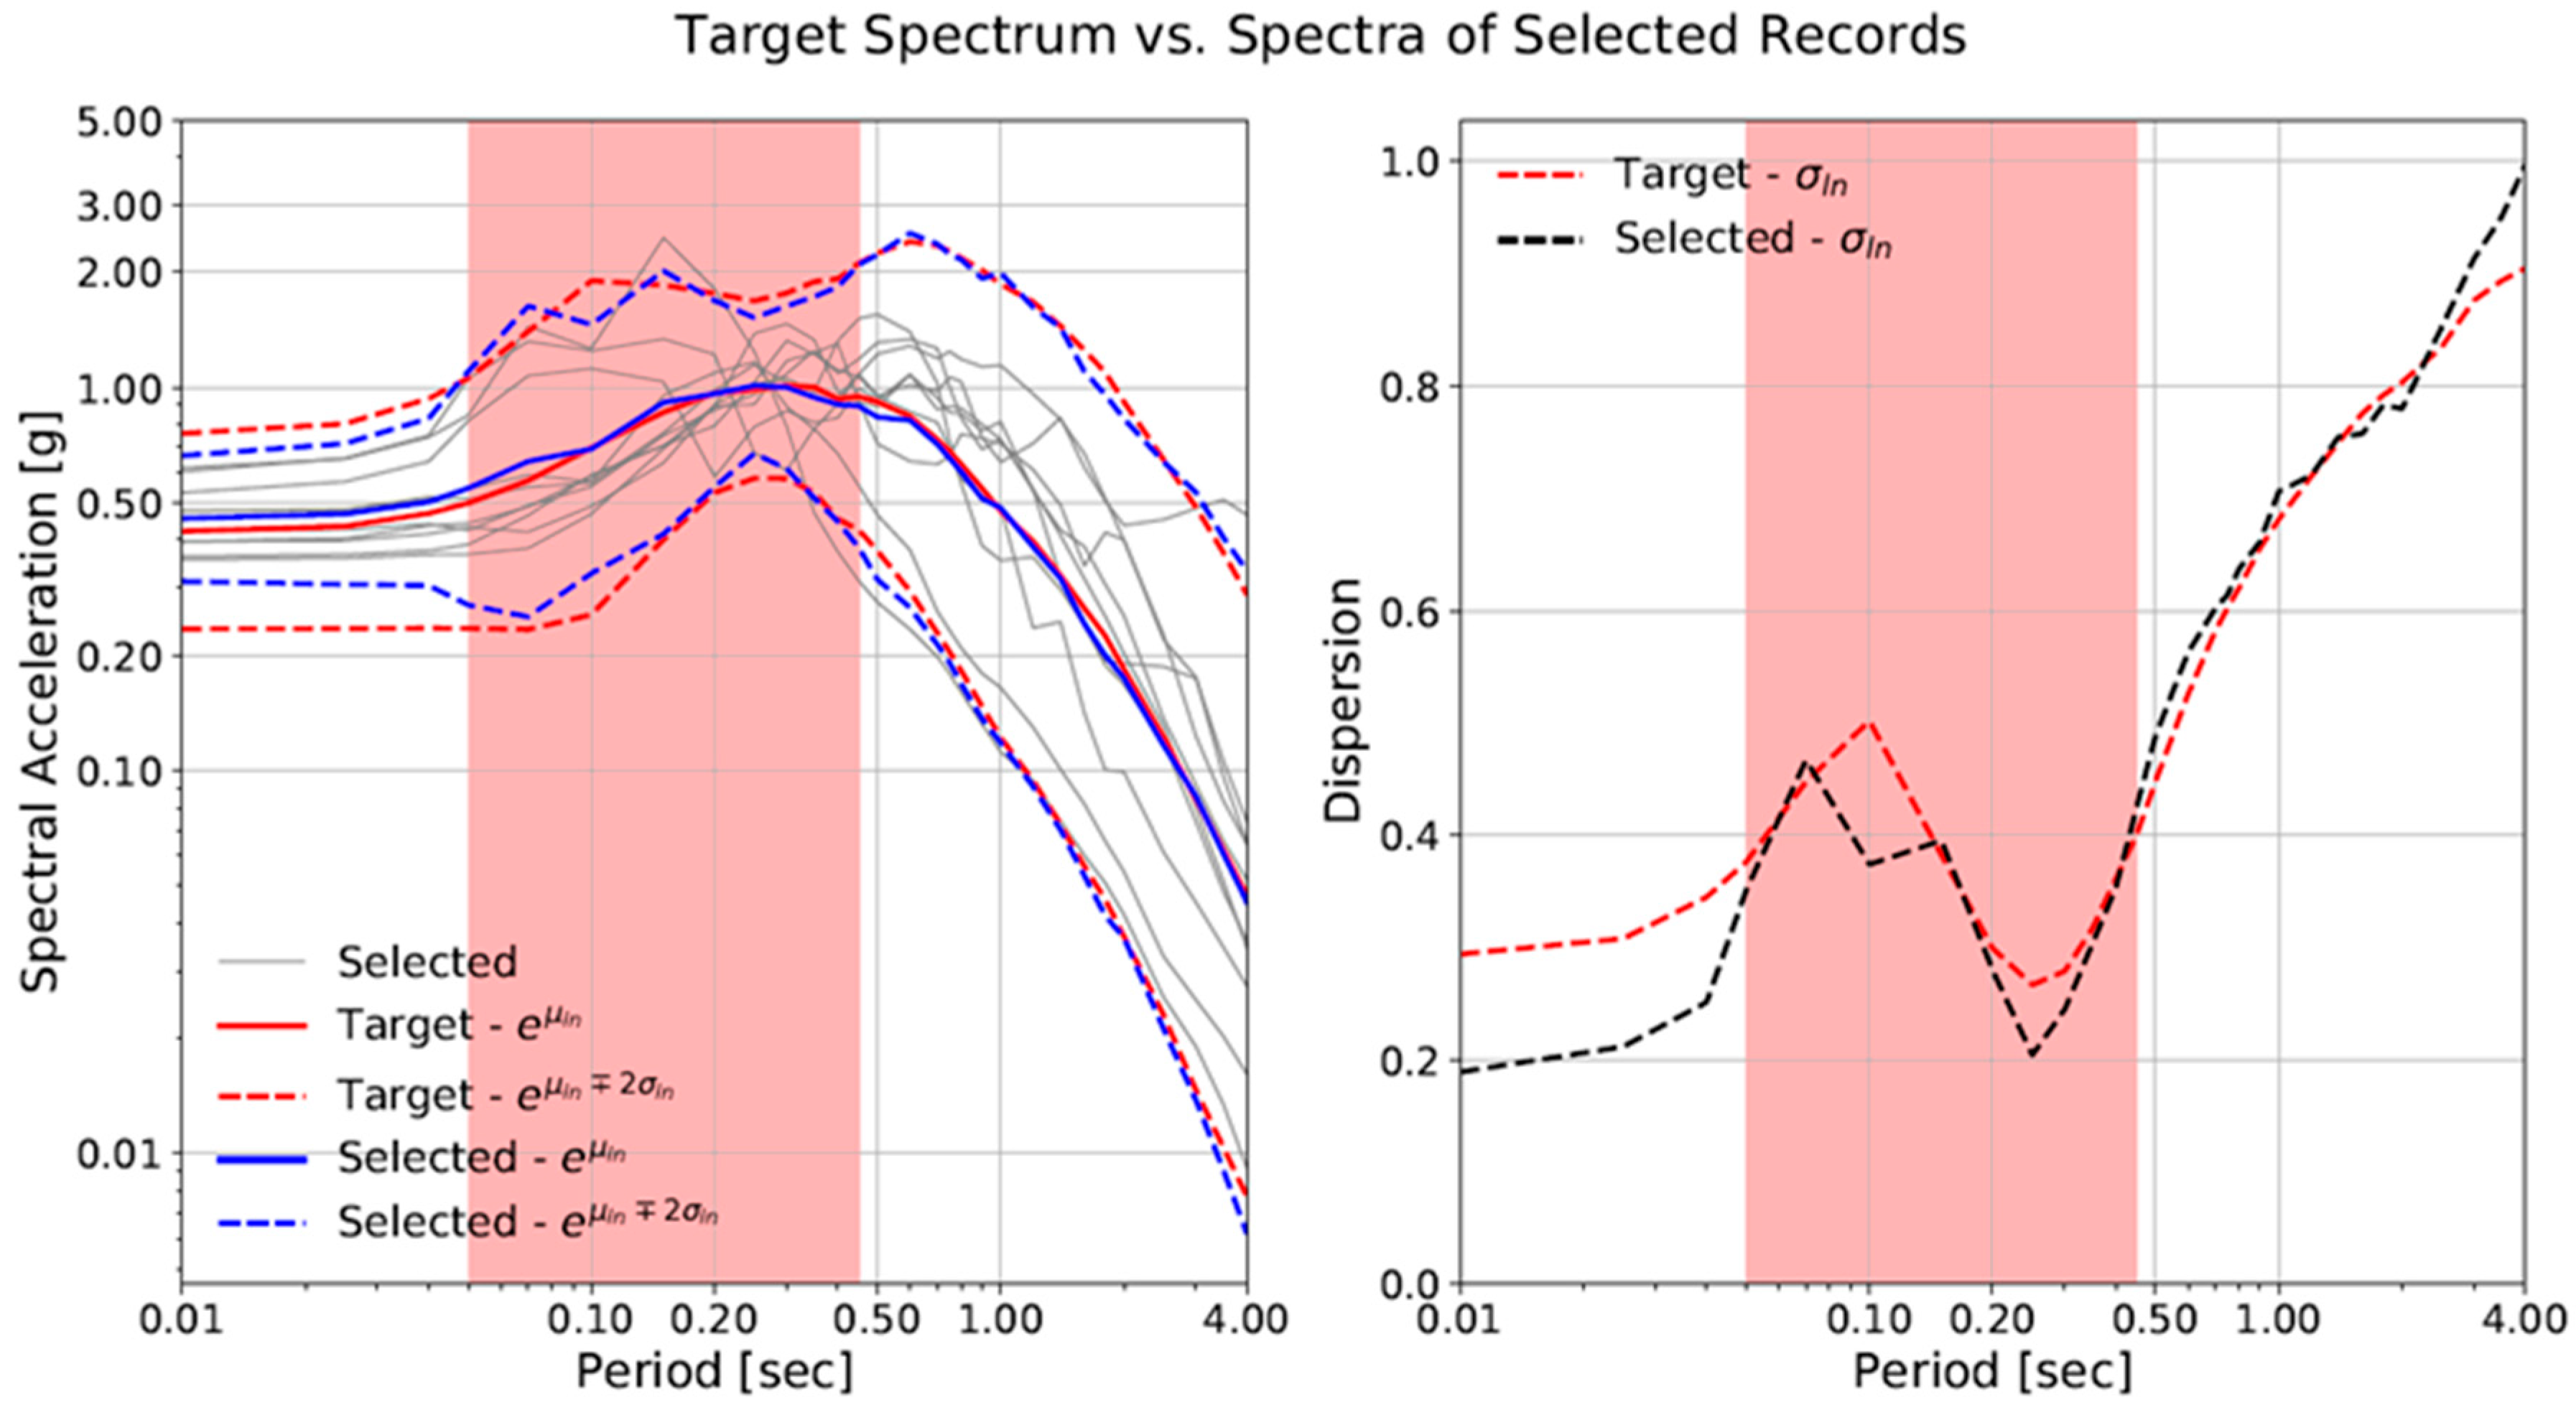
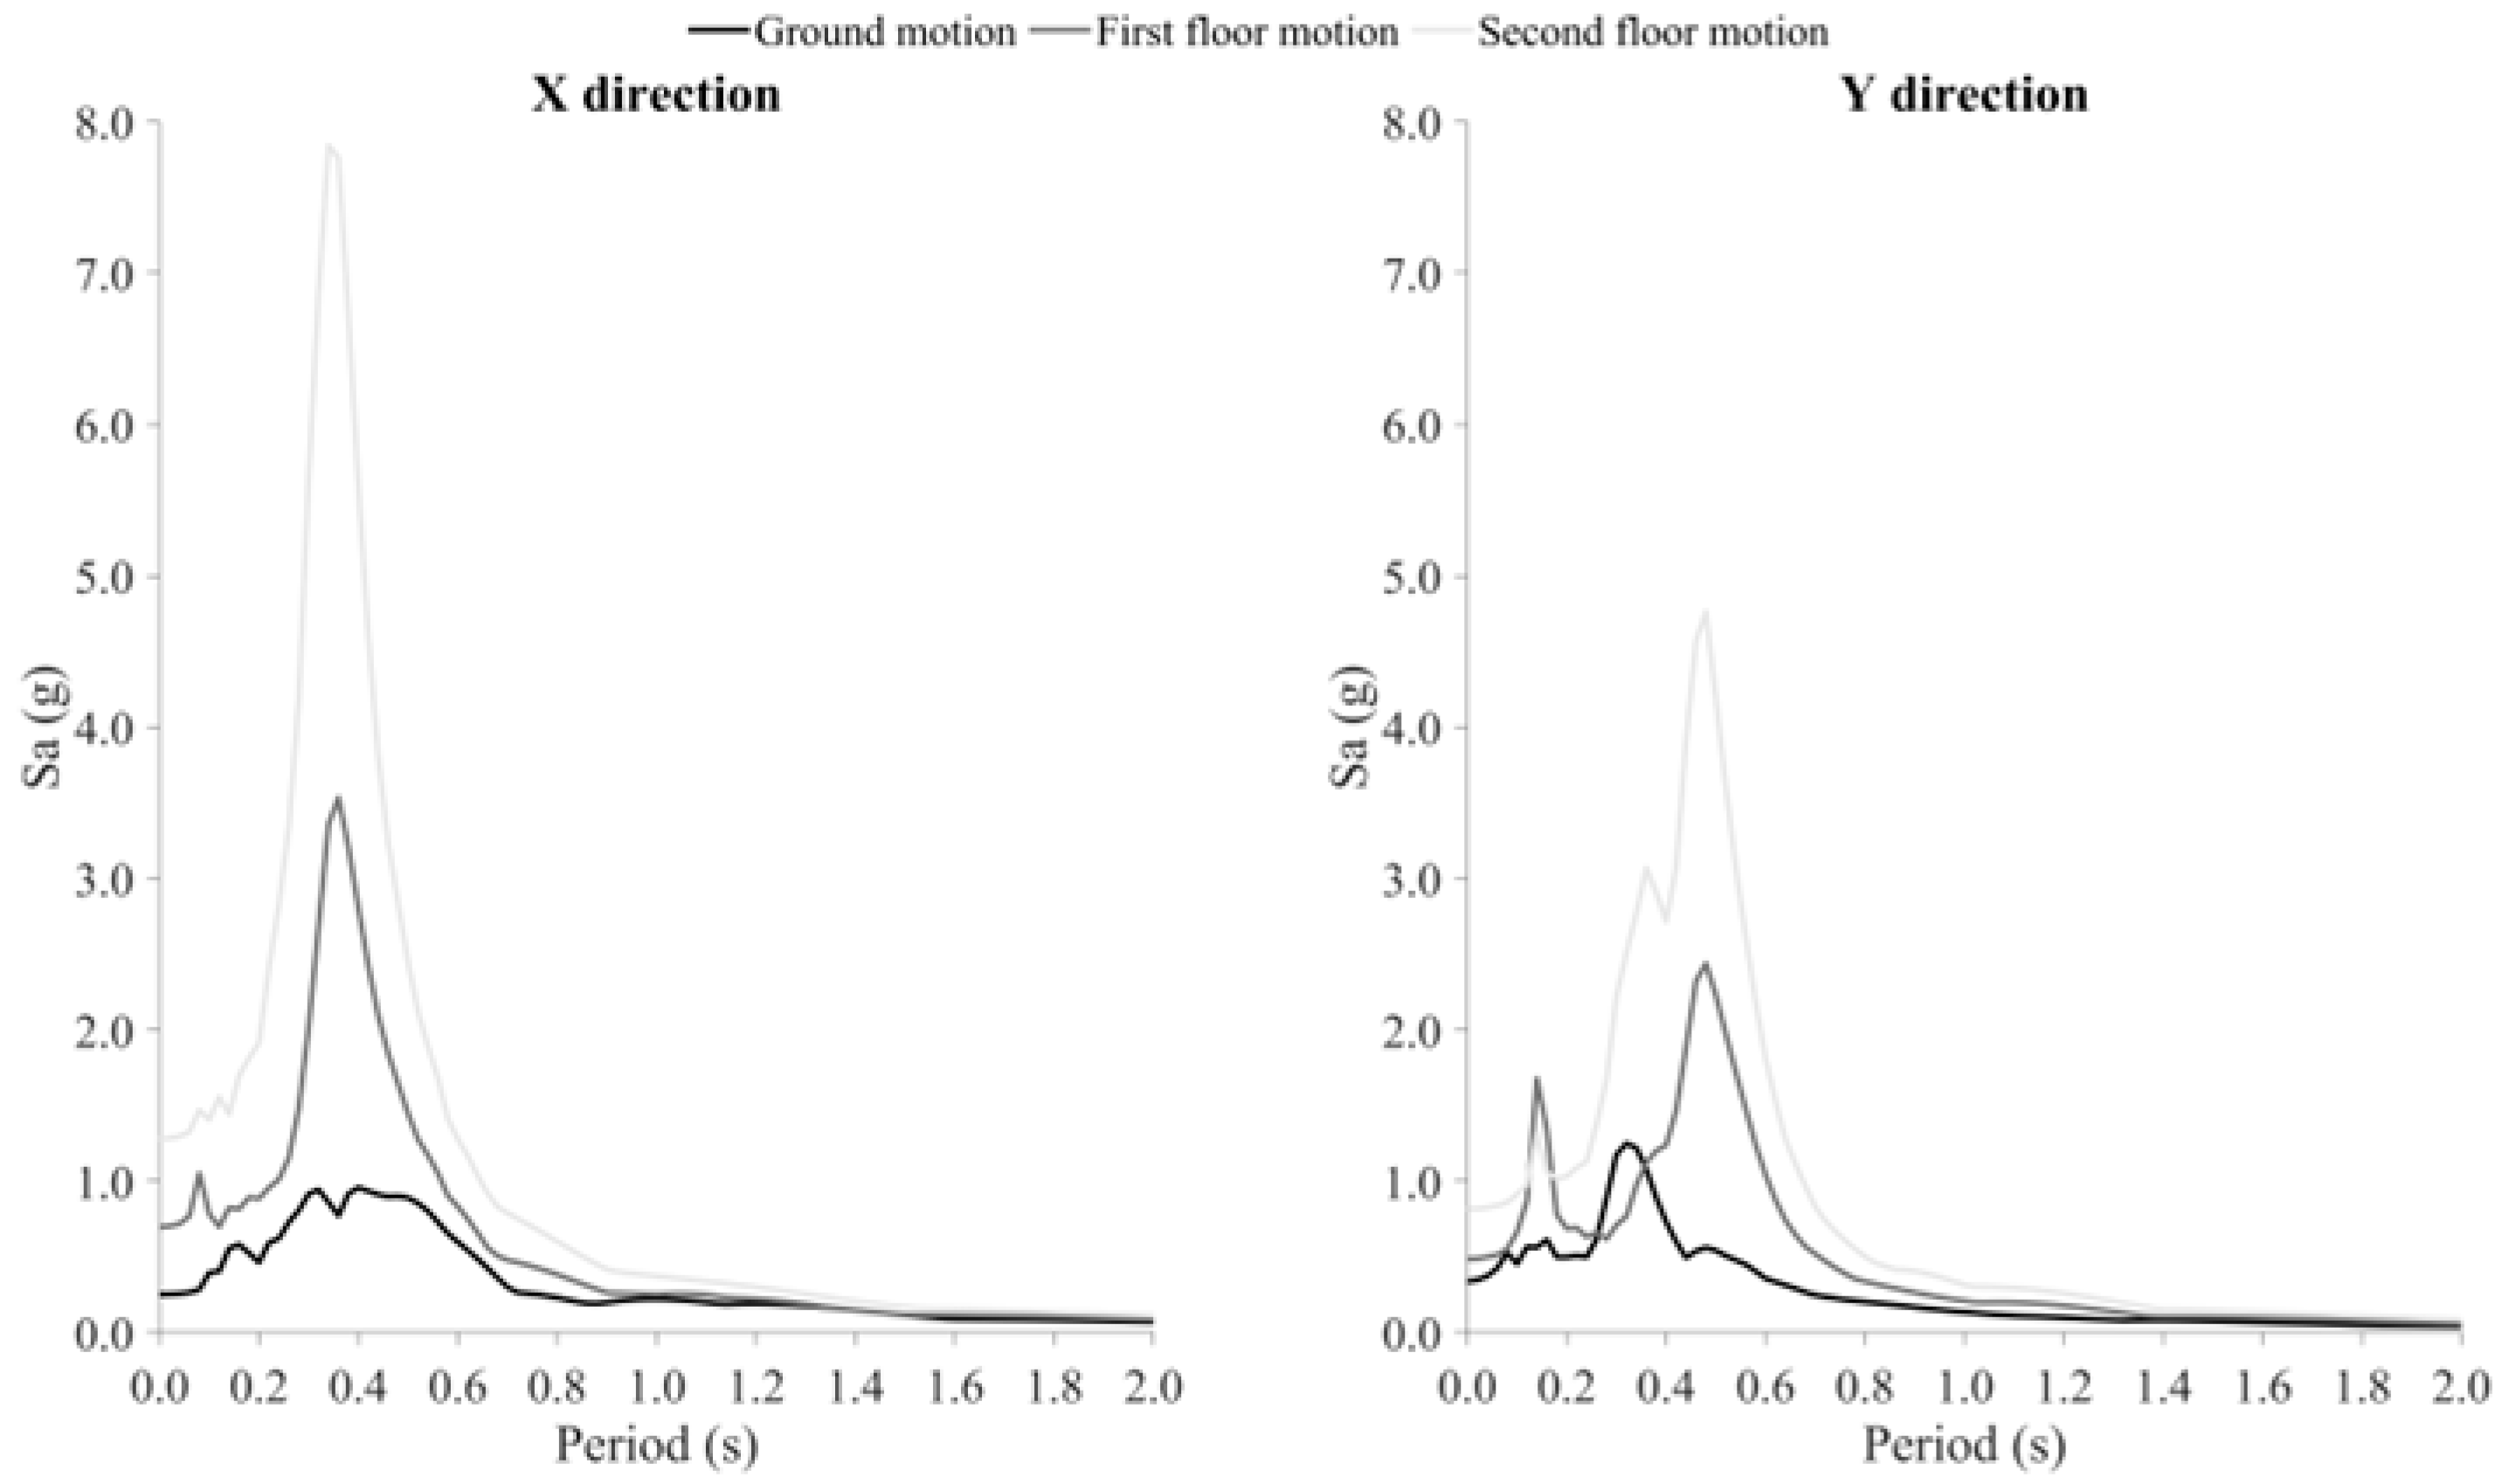
Figure 7 illustrates the steel frame tower. The steel tower was assumed to be located at L’Aquila (AQ), with site conditions characterized by soil type D. The beams and the columns are composed of IPE 330 and HEB 360 S235 elements, respectively. The floor height is equal to 4.2 m with a rectangular plan geometry of 5 m by 6 m. The steel frame has a total weight of 66.74 kN distributed as 21.67 kN on the top slab and 33.37 kN on the bottom slab. The fundamental periods for translation on the weak axis, strong axis, and torsional axis are equal to 0.421 s, 0.312 s, and 0.359 s, respectively. The steel tower was verified following the requirements of the Eurocode 3 and 8 [26,27]. It was modeled assuming distributed plasticity through fiber elements characterized by a Menegotto-Pinto hysteresis model [25]. The steel tower was subjected to nonlinear response analyses using a ground motion record set composed of ten pairs of accelerograms. The ground motions were selected for a probability of exceedance of 1% in 50 years, using a conditional mean spectrum characterized by the average spectral acceleration (AvgSa) between 0.05 s and 0.45 s. Figure 8 and Figure 9 show the selection of the ground motion records and the seismic input and floor response spectra of the selected ground motion. Based on the results of the nonlinear time history analysis, a pair of accelerograms (i.e., one record, TK.0302.00.HNE.D.TK-1995) was selected to be used as the input motion for the shake-table test. This selection was based on the seismic response of the frame in terms of accelerations and displacements, aiming to have maximum compatibility with the laboratory equipment characteristics.
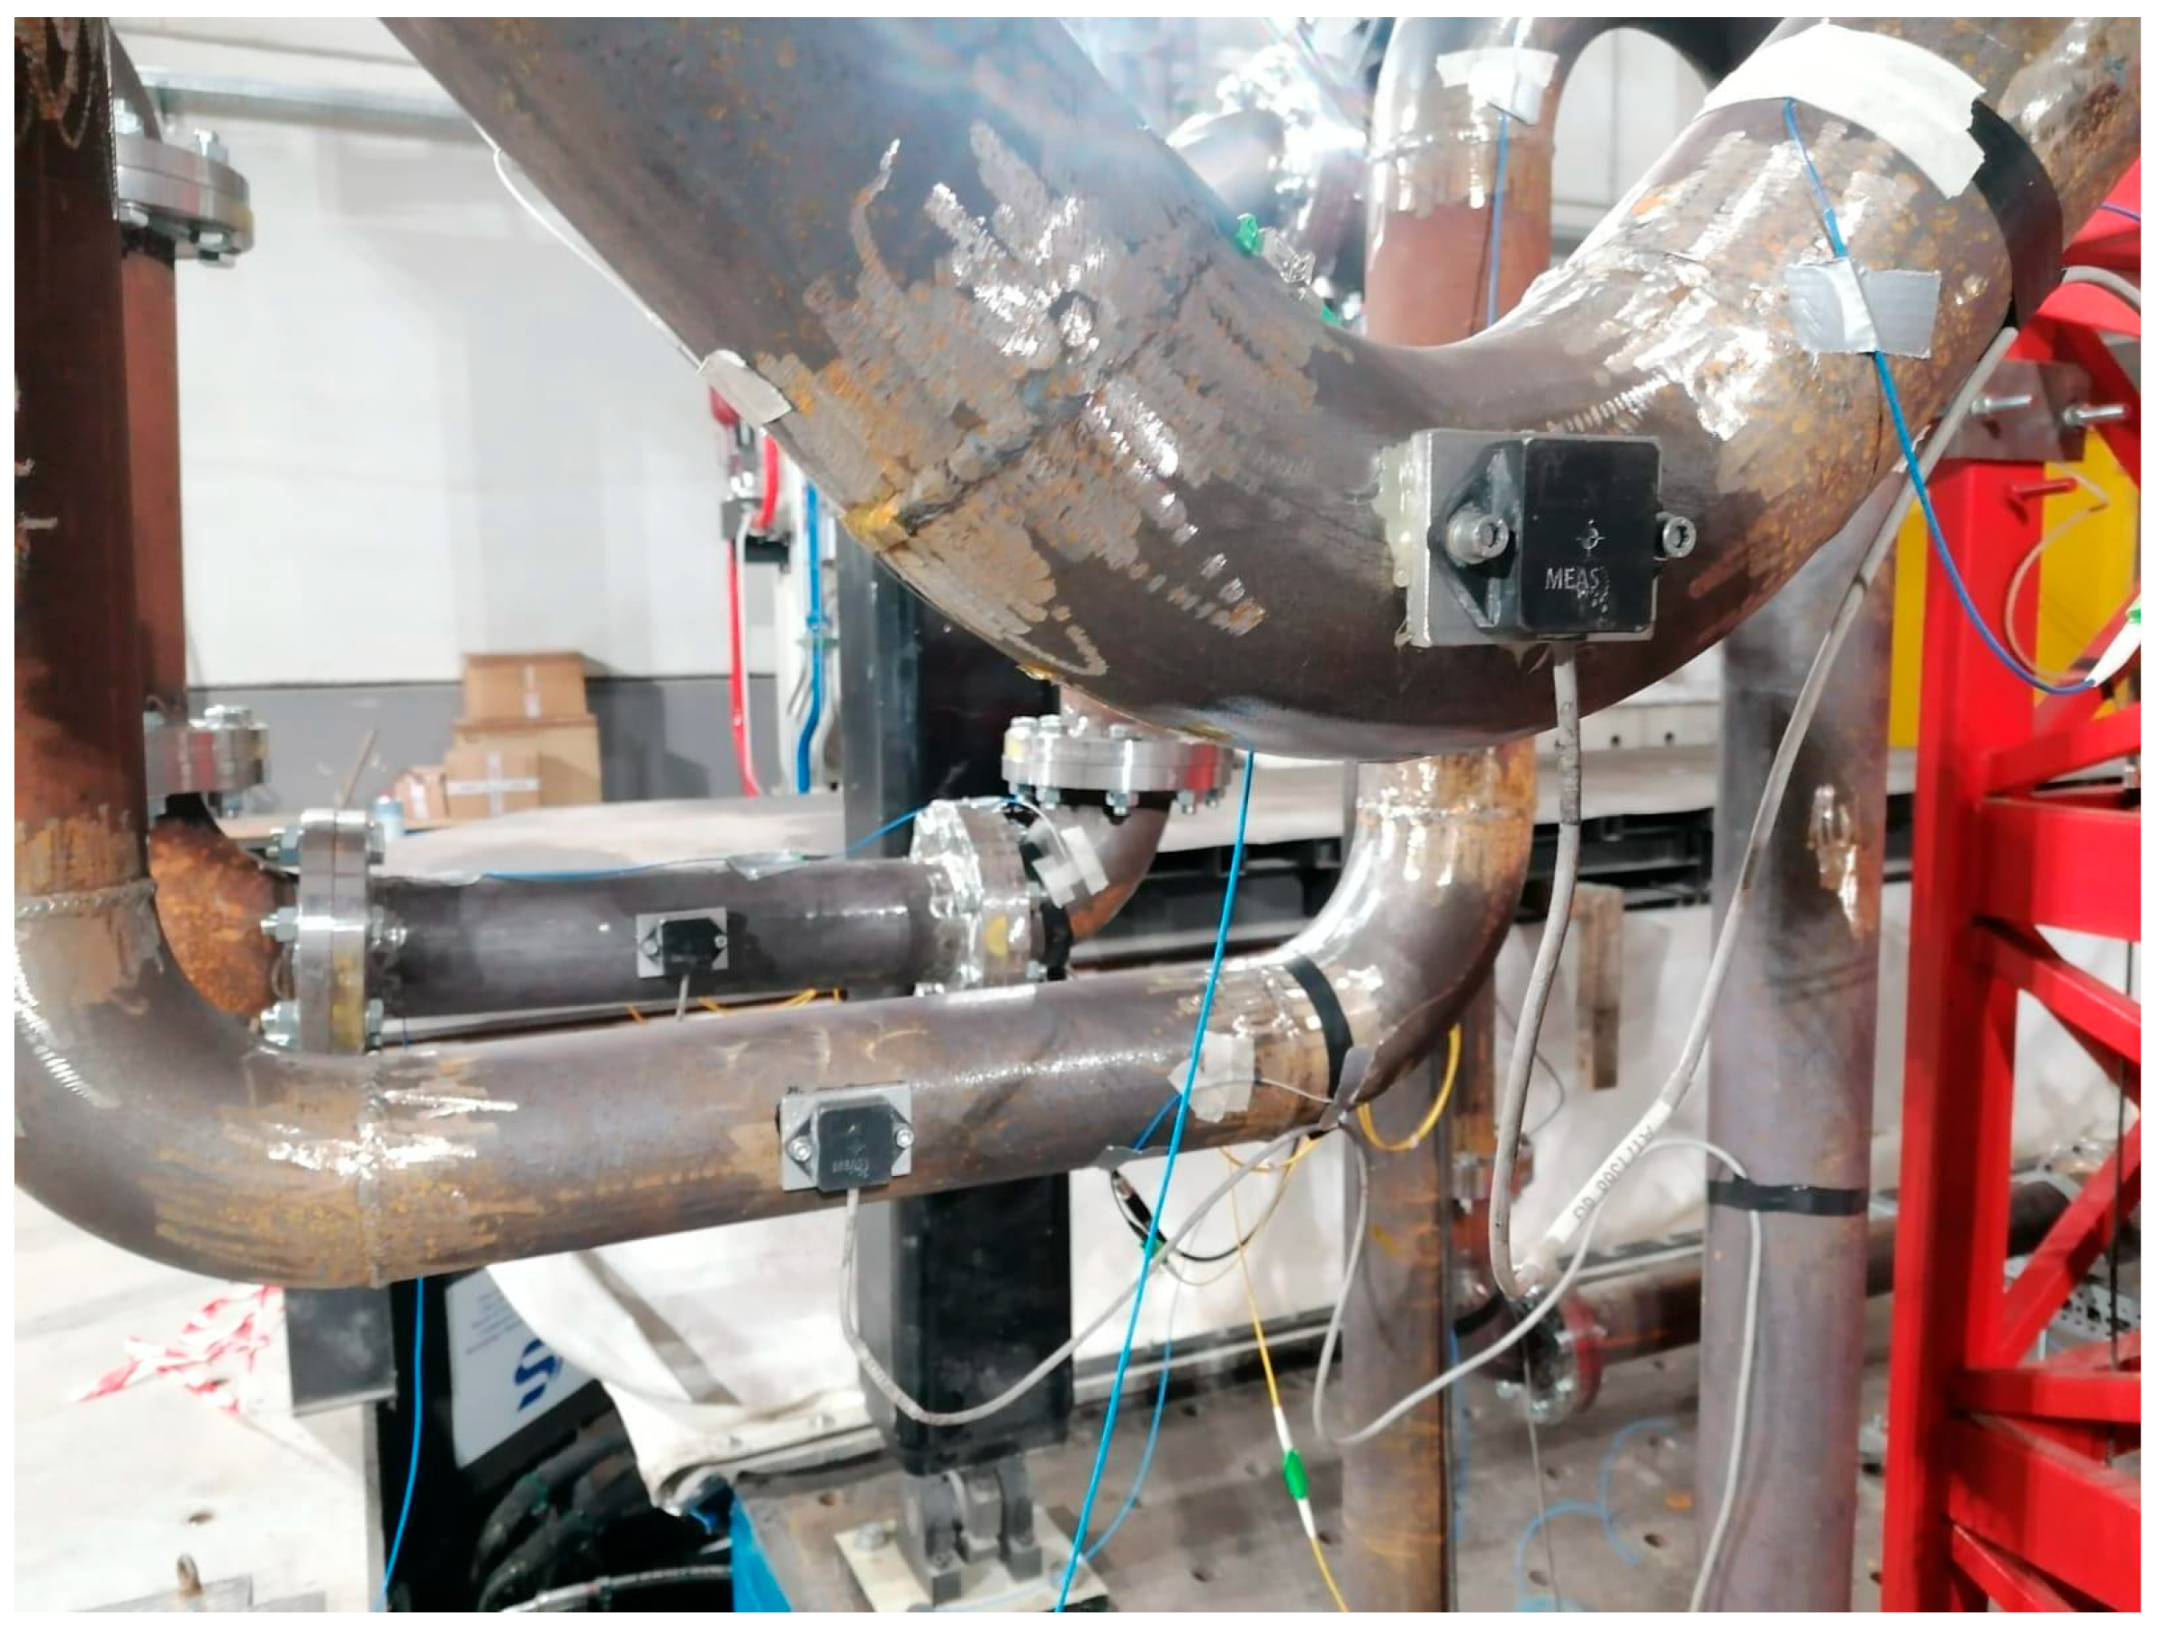
The pipe specimens were assumed to be attached to the first and second floors; therefore, the respective floor motions were used as seismic input for the bottom and top shake-tables, respectively. Six pipe specimens, simulating an Omega loop with 1070 mm length and 761 mm height (Figure 10), a V loop with 1125 length and 436 mm height (Figure 11), and a 3D piping layout composed of straight pipes and 90 degrees elbow connections (Figure 12), were subjected to the selected floor motions scaled from 10% to 140%. The seismic response of the pipe specimens was measured in terms of displacements in the in-plane direction, accelerations at the center of the loop, and strain at key points using Fiber Bragg Grating sensors.

3. Experimental Results

The results obtained from both experimental setups were processed to identify different structural parameters that allow for a better understanding of the seismic response of steel pipelines and the generation of recommendations for their seismic design in a general context.

3.1. Cyclic Axial Tension Test Results

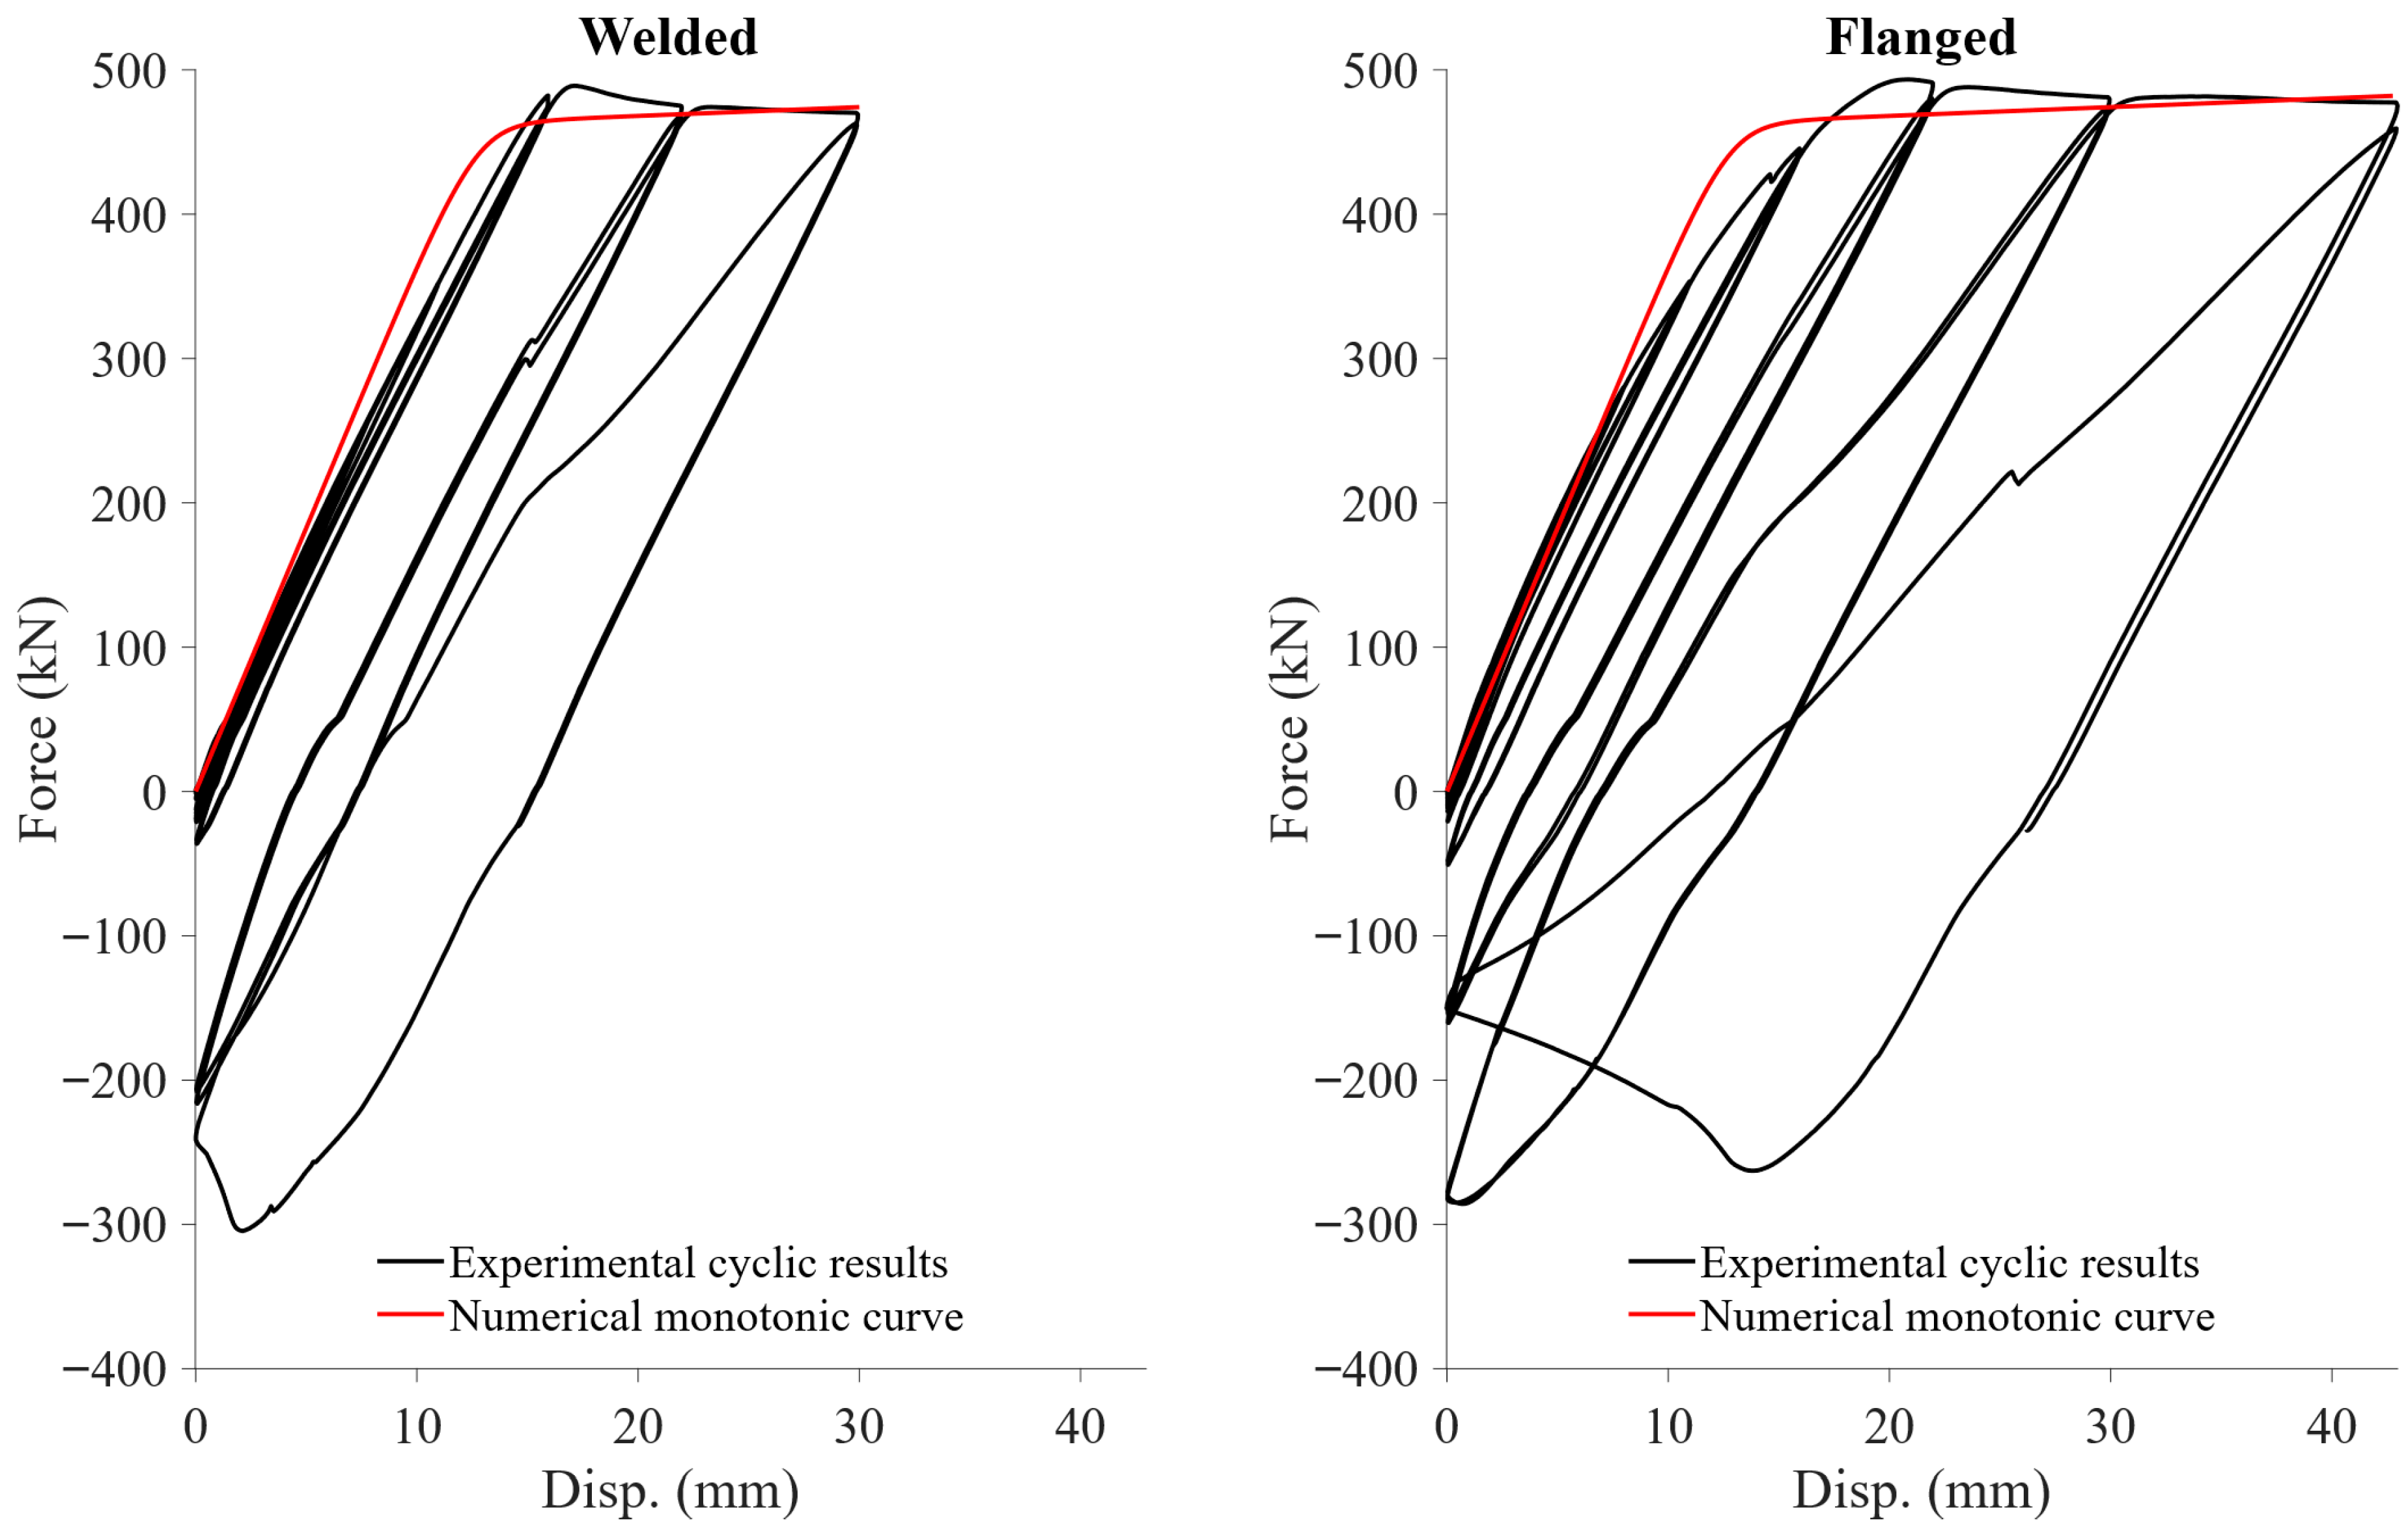
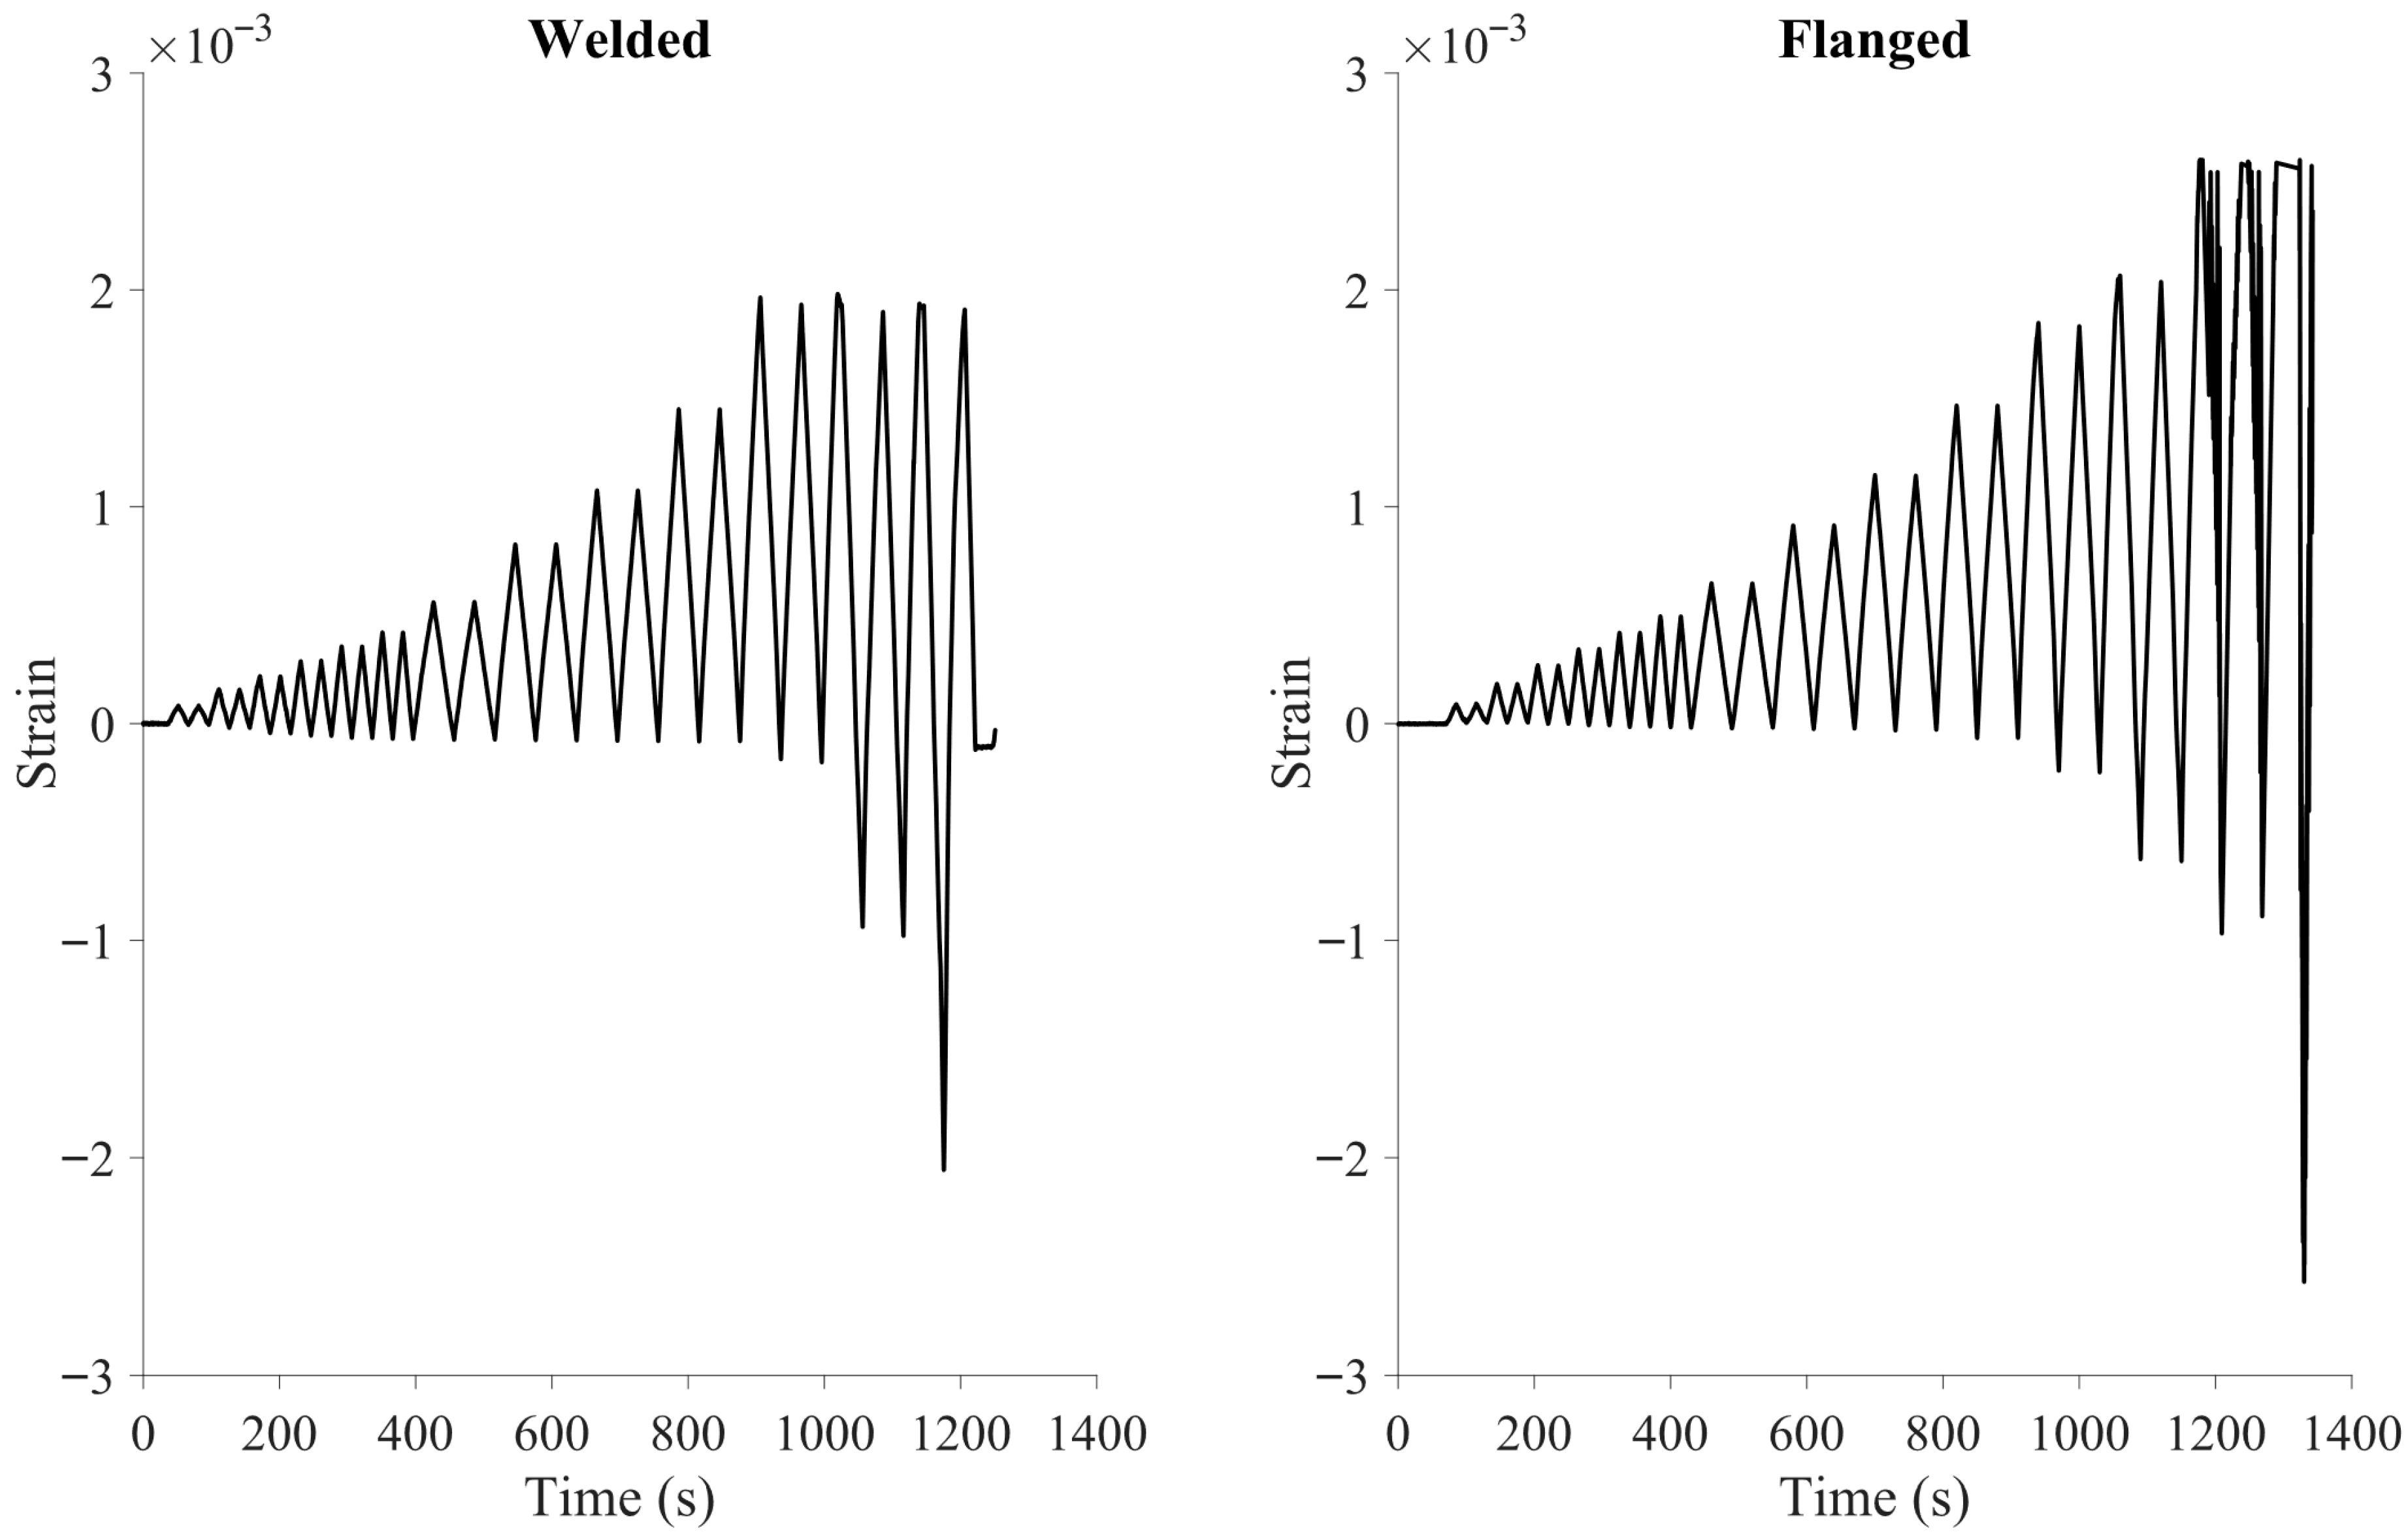
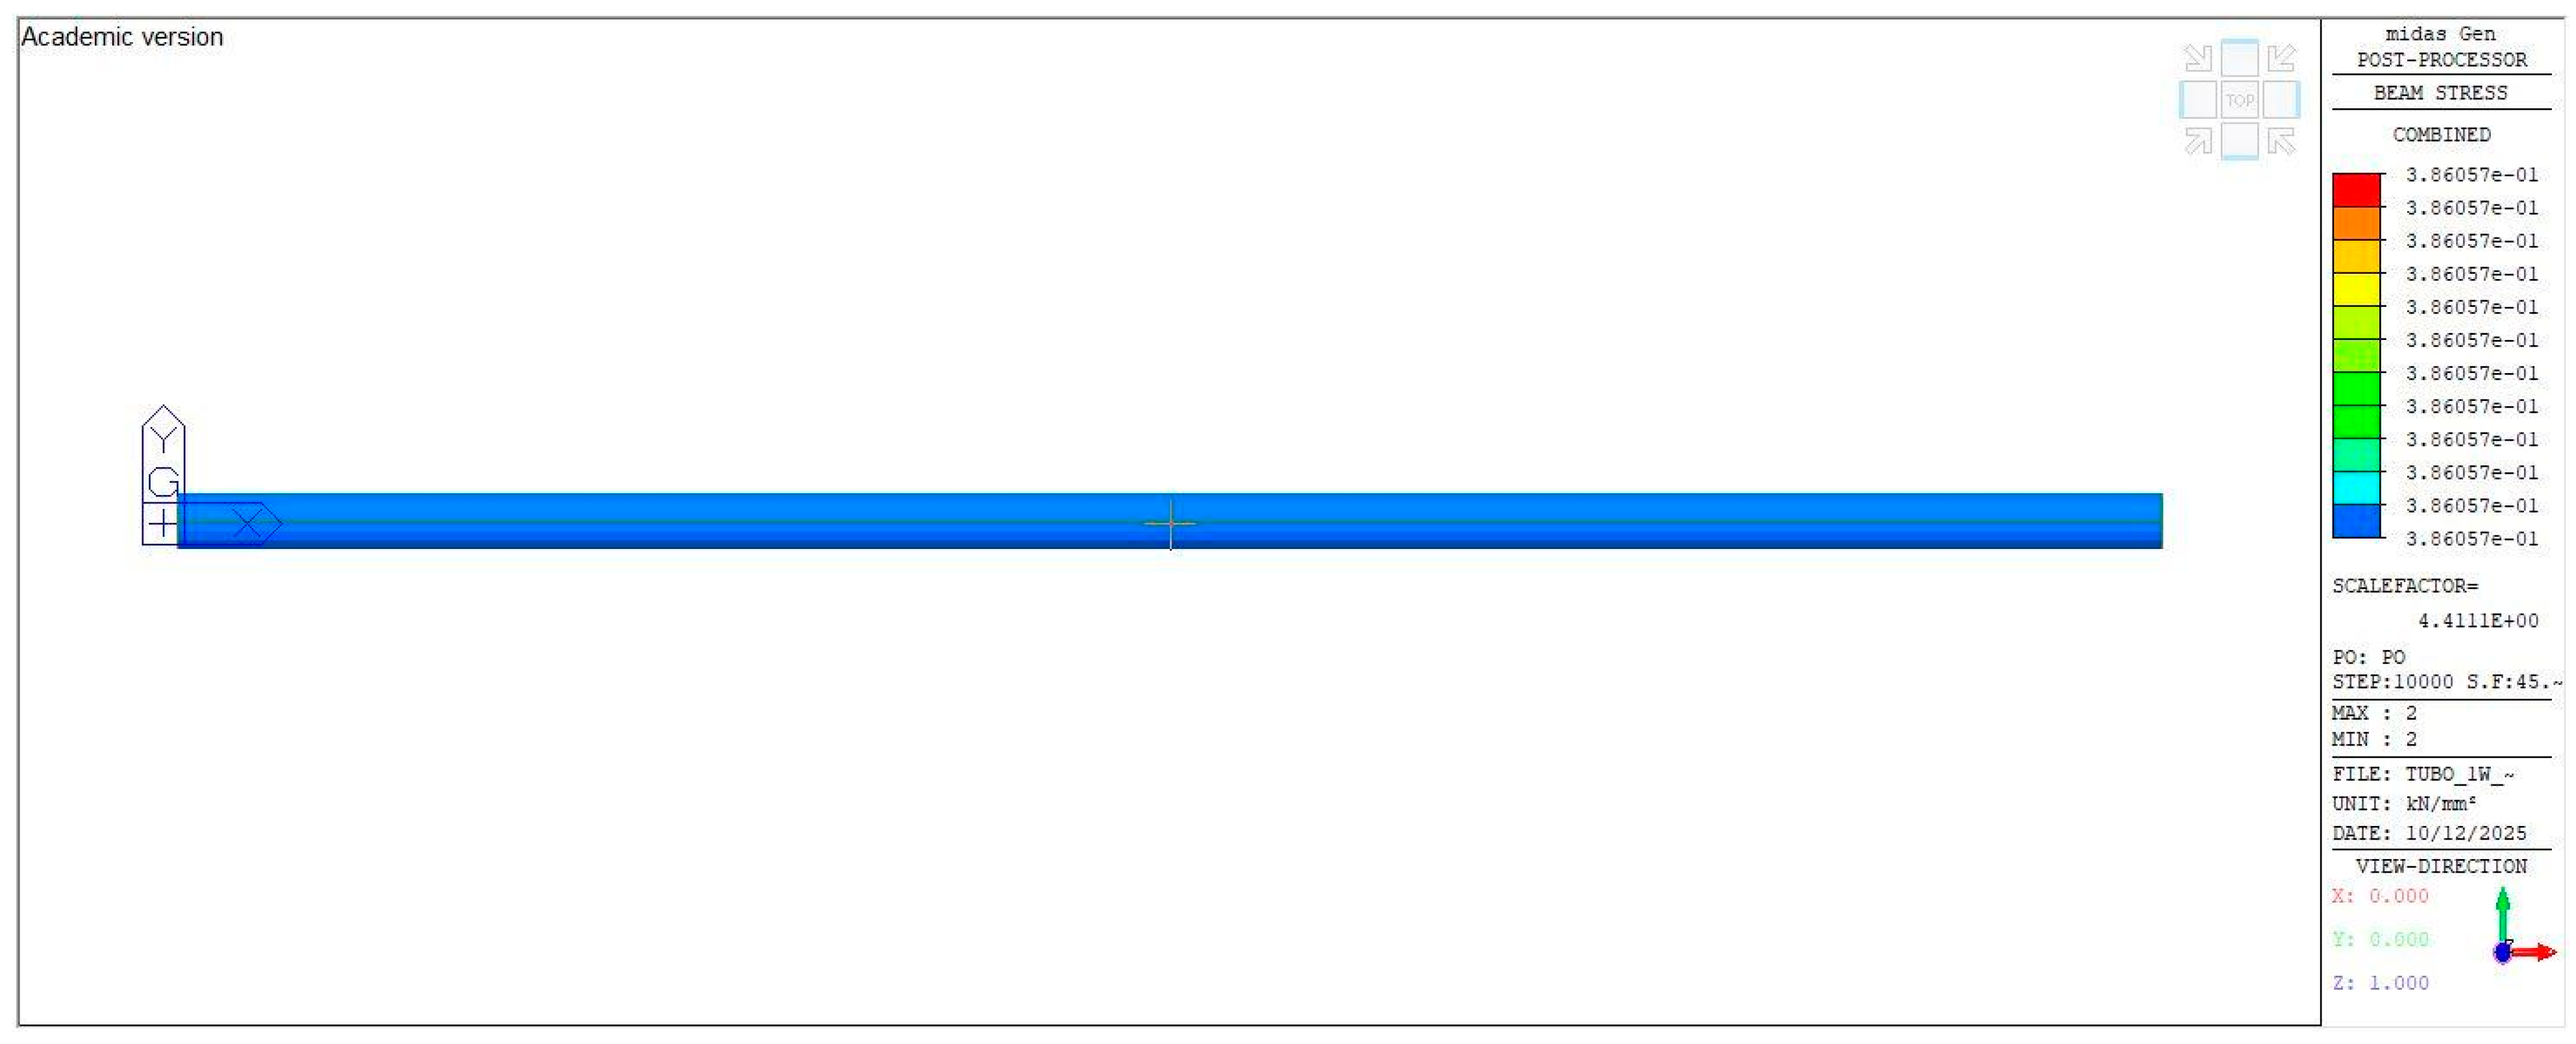
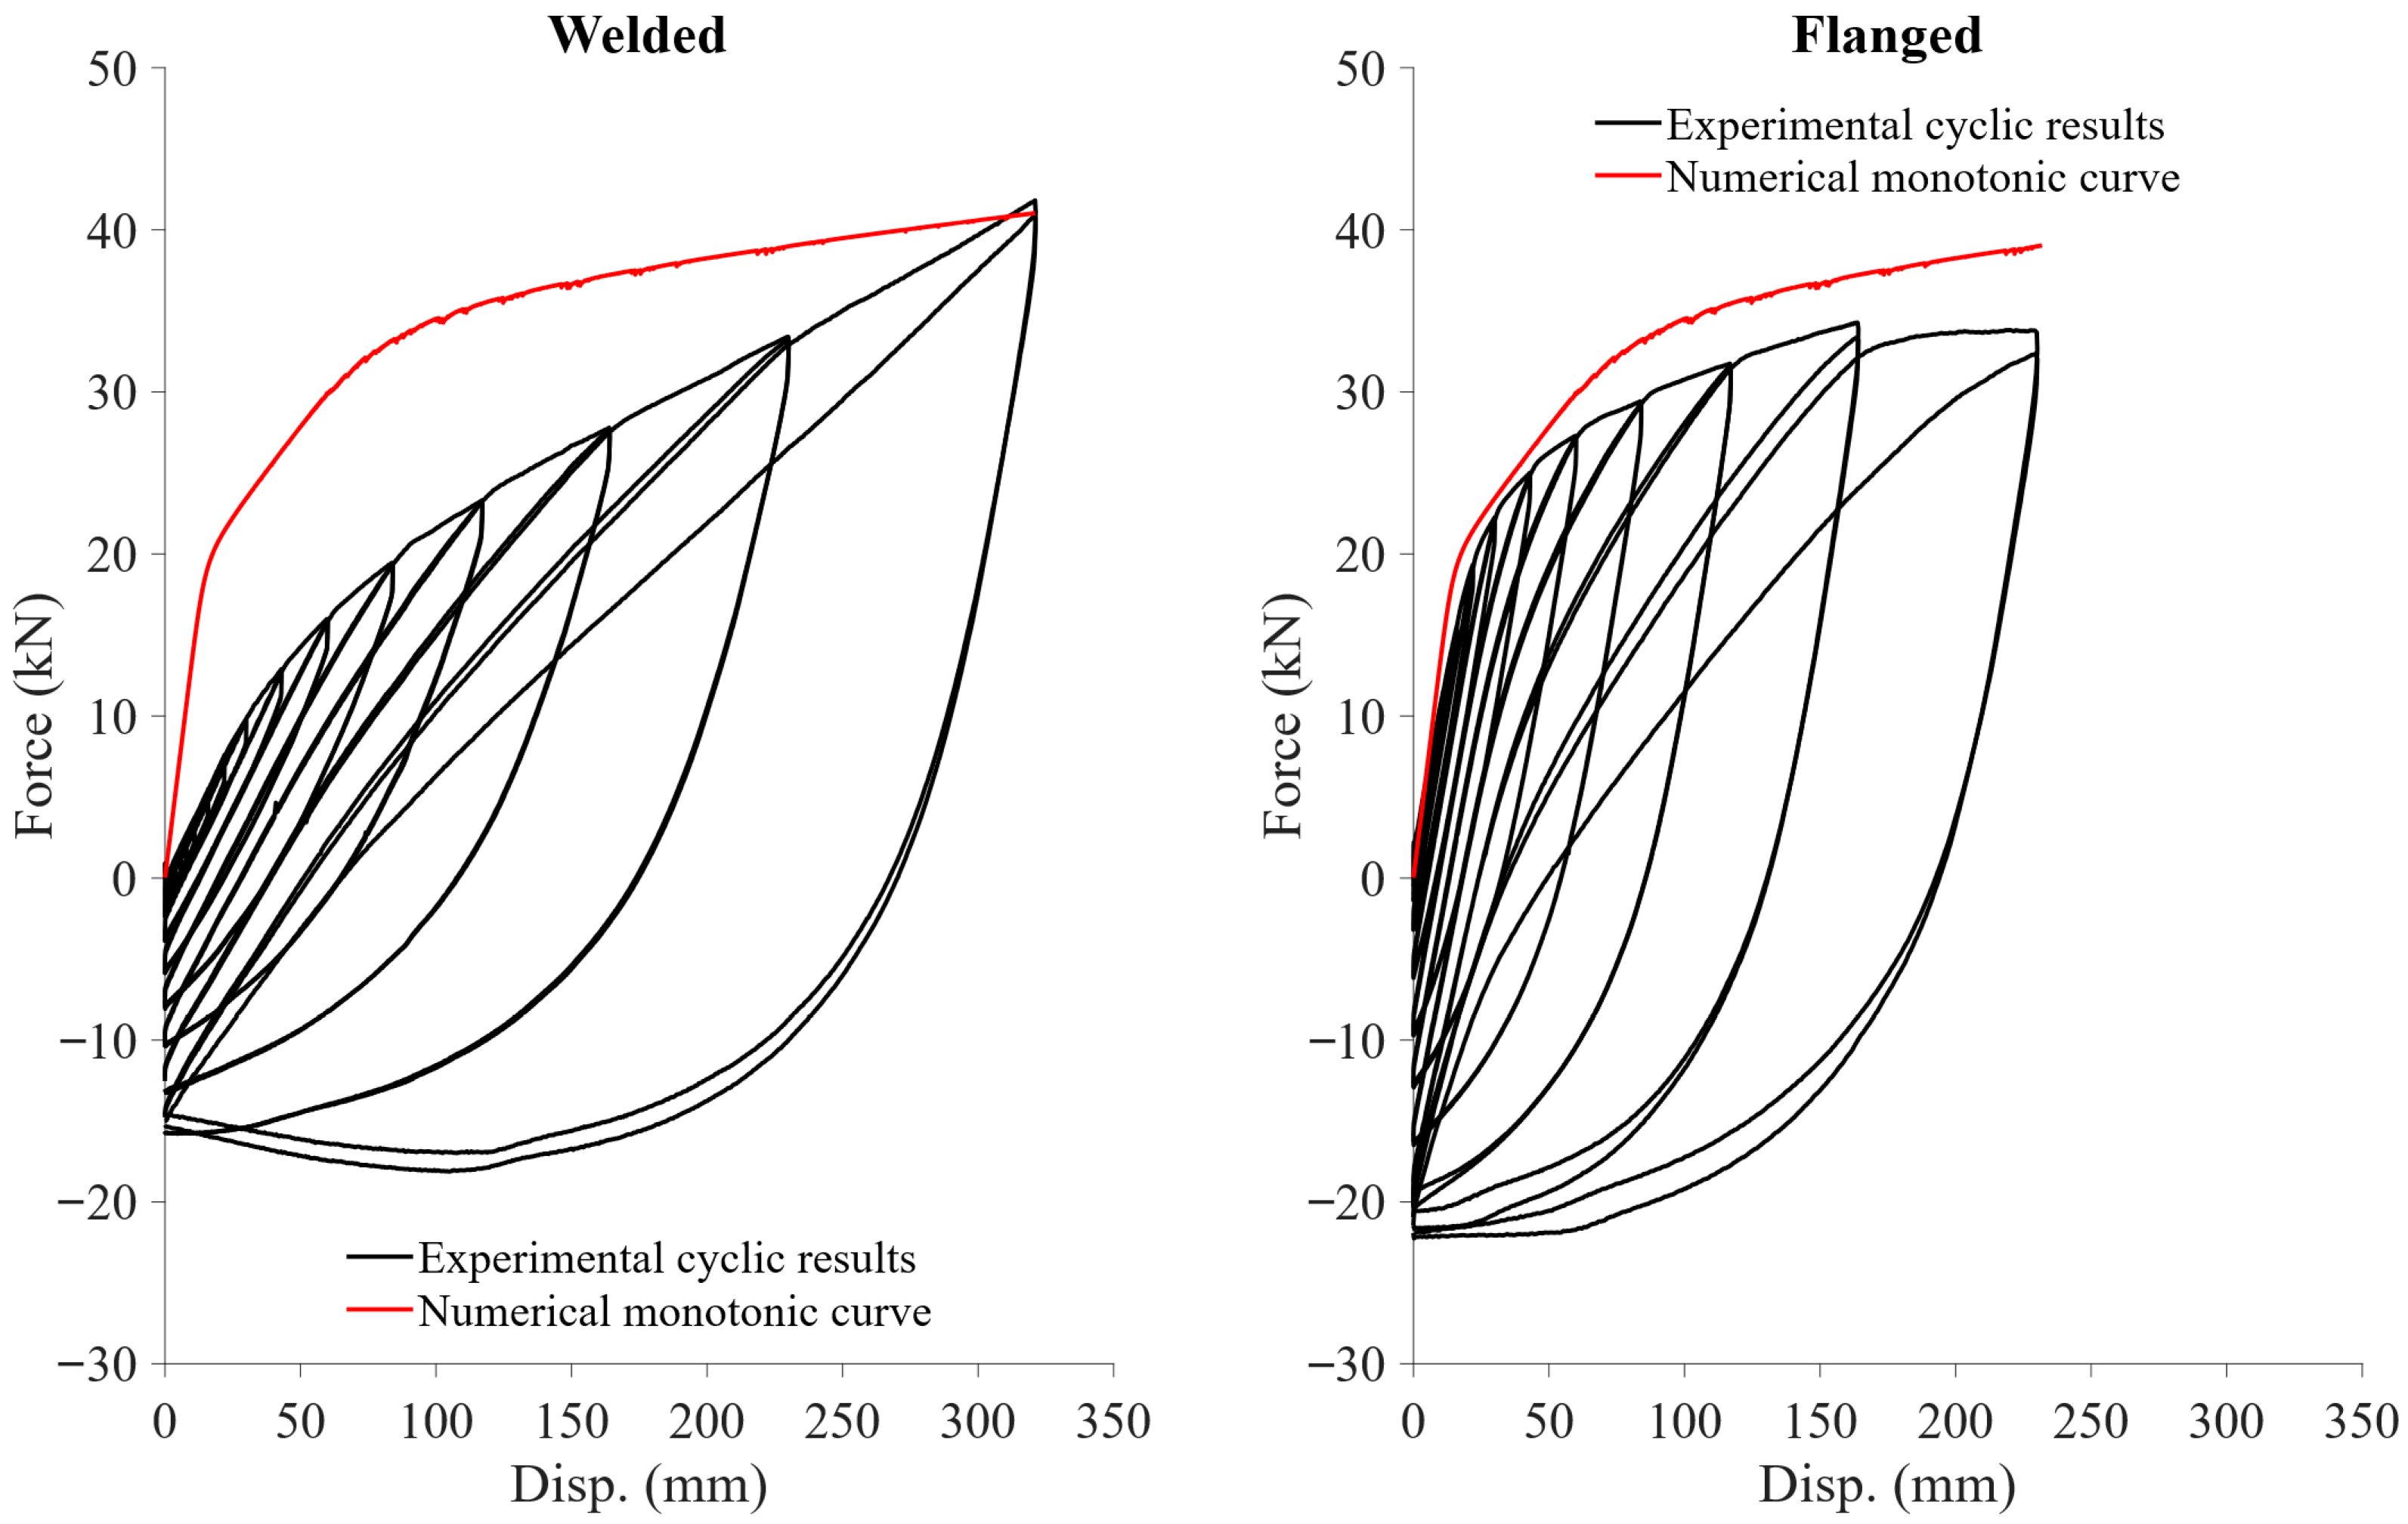
As explained previously, six pipe specimens, representing three different loops (i.e., straight, Omega, and V loops) and using two joint typologies (i.e., welded and flanged joints), were tested under cyclic axial tension only loads following a displacement protocol as recommended by the FEMA 461 document [23]. First, as a reference, specimens 1 and 2, corresponding to the straight pipes with welded and flanged joints (see Figure 3), were tested. Figure 13 shows the setup of the cyclic test of specimens 1 and 2; Figure 14 and Figure 15 show the hysteresis behavior obtained from the cycled test of both specimens and the strain time histories obtained with the Fiber Bragg Grating sensors, respectively. Finally, Figure 16 shows the stress distribution at maximum displacement from the numerical simplified model.
The results show that both specimens exhibited a large plastic deformation, which can be observed due to the development of negative forces, although the cycle protocol only considered positive displacements. This response was generated by the need to compensate for the residual deformation caused by the pipe yield in tension. In addition, both specimens exhibited similar maximum forces in both tension and compression, without showing hardening behavior after yield. Both configurations reached general instability due to compression critical load; therefore, the tests were finished before completing the load protocol. However, the specimen with the flanged joint at the middle span reached a larger maximum peak displacement compared to that of the straight pipe before the generation of the critical load instability (i.e., 22 mm and 43 mm of peak displacement of the straight and flanged specimens, respectively). This difference could be explained by a possible reduction in the effective length of the pipe elements as the flanges limit the rotation at the middle pipe span. In addition, a larger stiffness degradation of the flanged specimen (i.e., from an average of 46 kN/mm in the elastic cycles to an average of 29 kN/mm in the inelastic cycles) compared to that of the straight pipe (i.e., from an average of 44 kN/mm in the elastic cycles to an average of 29 kN/mm in the inelastic cycles) caused by local buckling of the pipe near the flanges. As expected, the numerical model and the Fiber Bragg Grating results show a uniform distribution of the stresses and strains along the element. In this regard, the strain time history highlighted the compression deformation as the negative strain increases with increasing amplitudes of the input load. Figure 17 shows the setup of the cyclic test of the second geometrical configuration composed of specimens 3 and 4 and corresponding to Omega loops with welded and flanged joints (see Figure 4); while Figure 18 and Figure 19 show the hysteresis behavior obtained from the cycled test of both specimens and the strain time histories of specimen 4 obtained with the Fiber Bragg Grating sensors, respectively. Finally, Figure 20 shows the stress distribution at maximum displacement from the numerical simplified model.
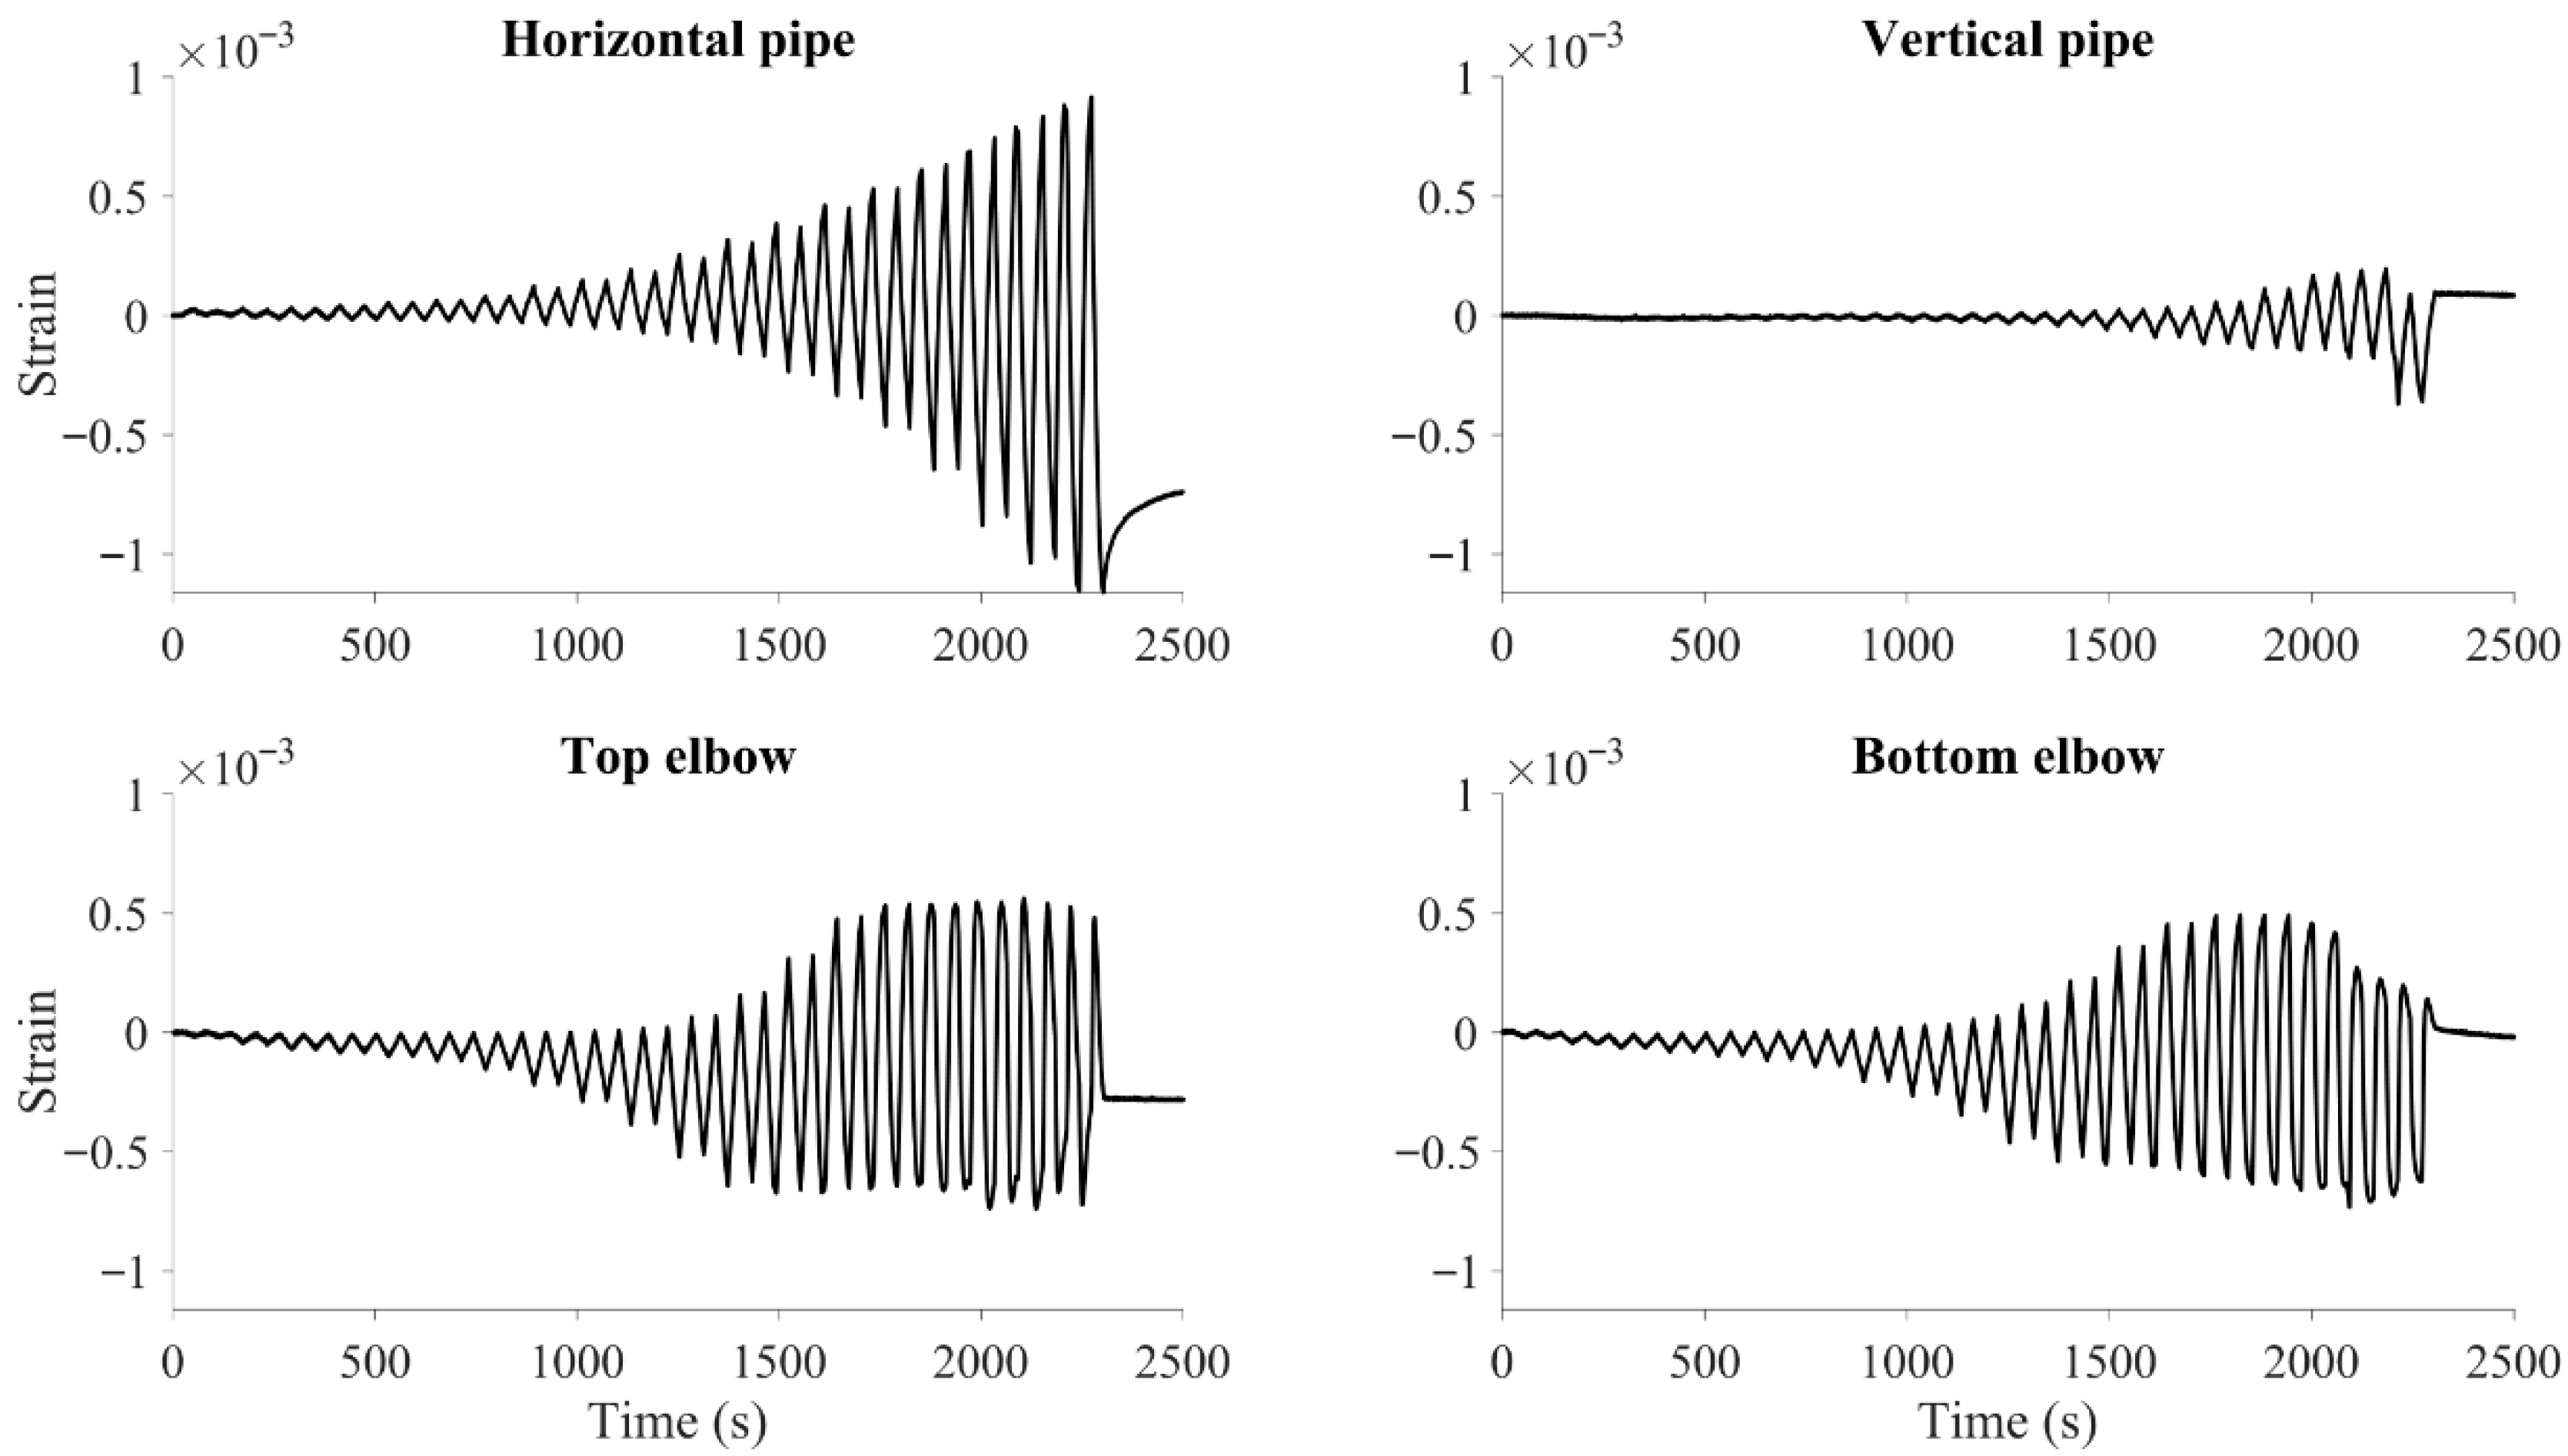
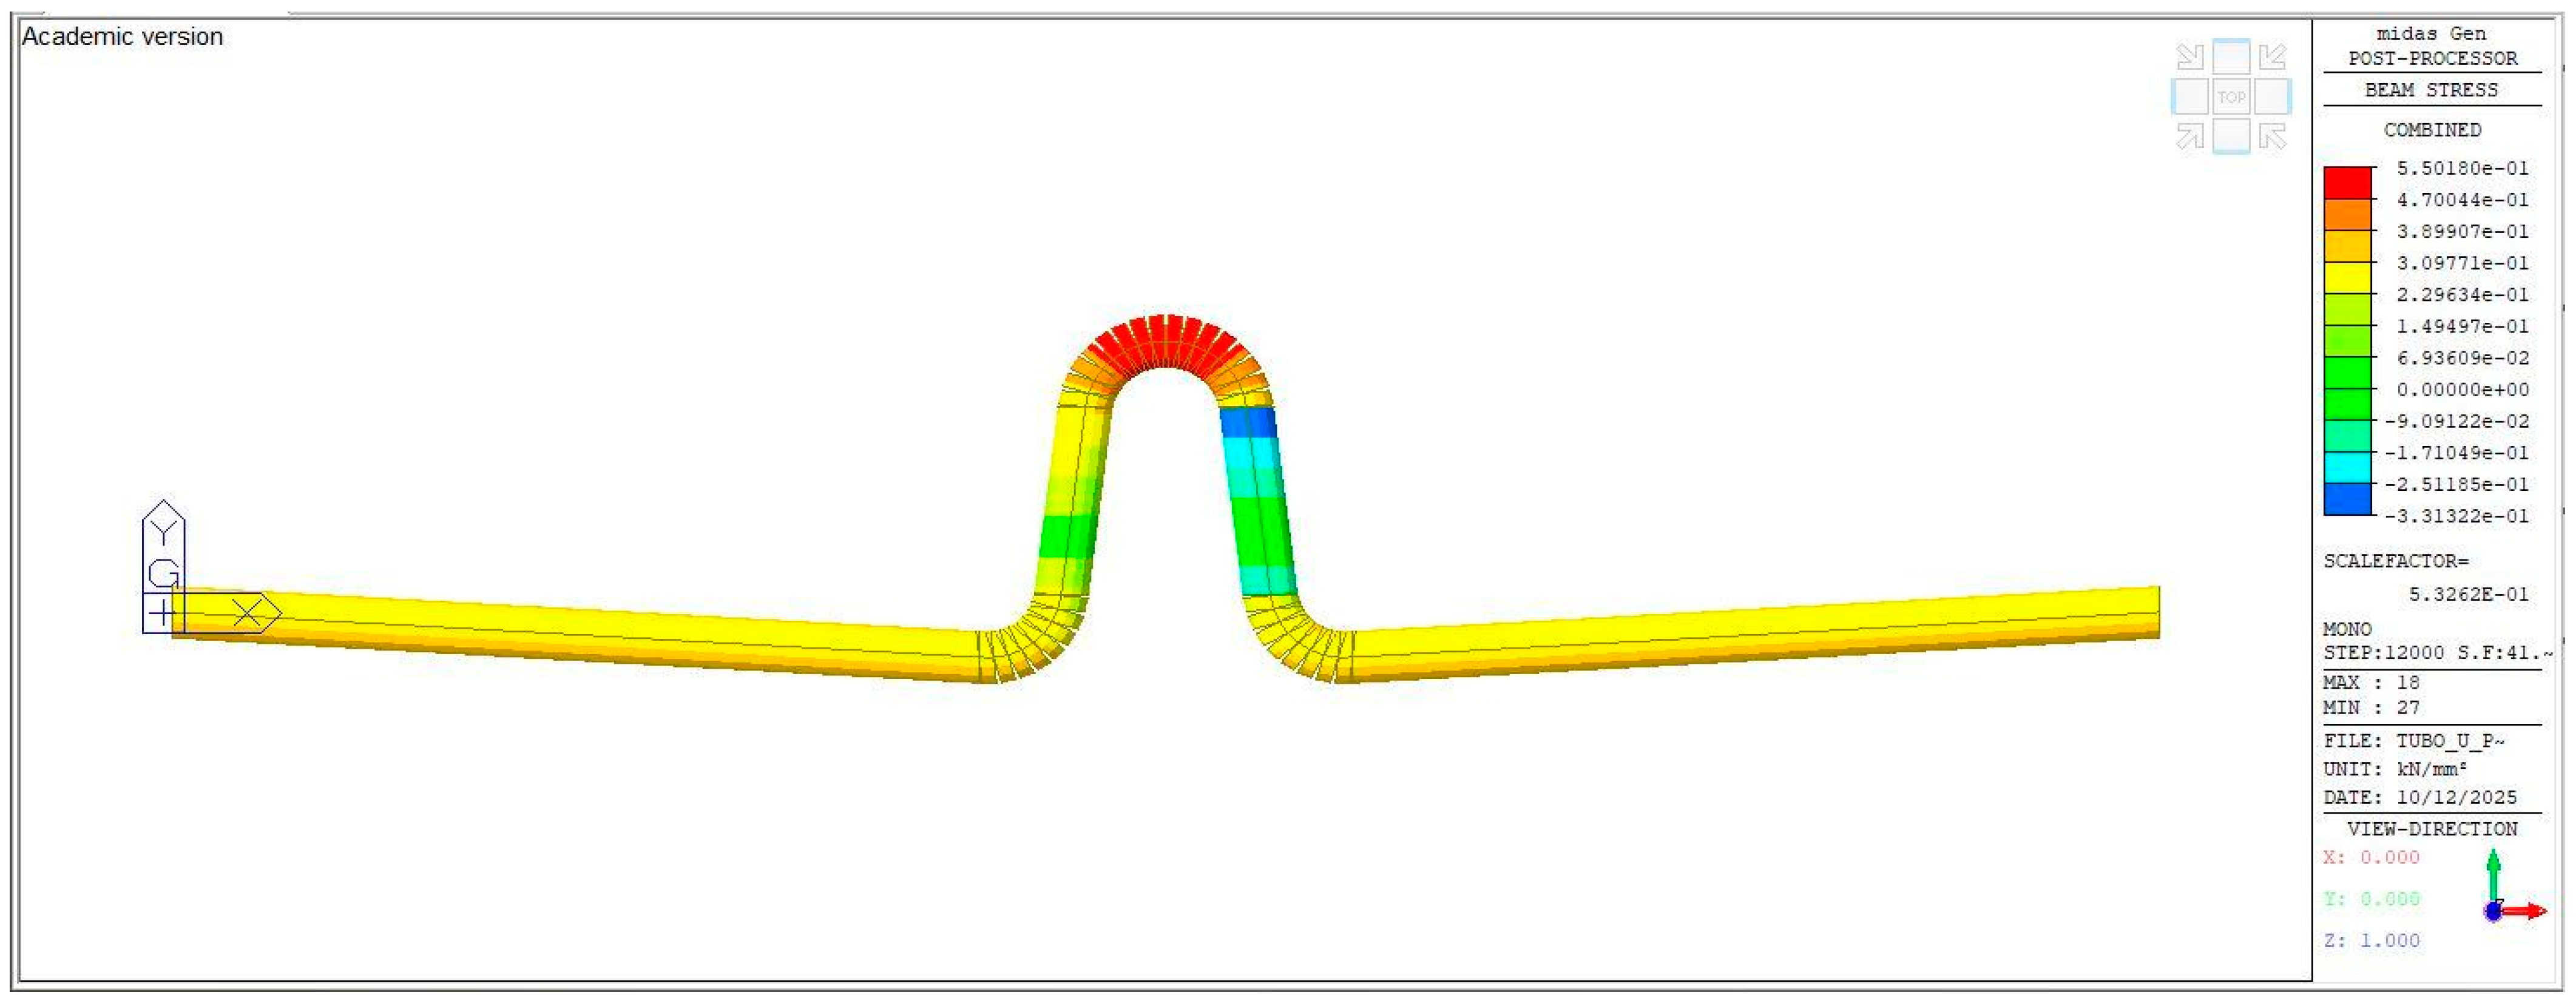
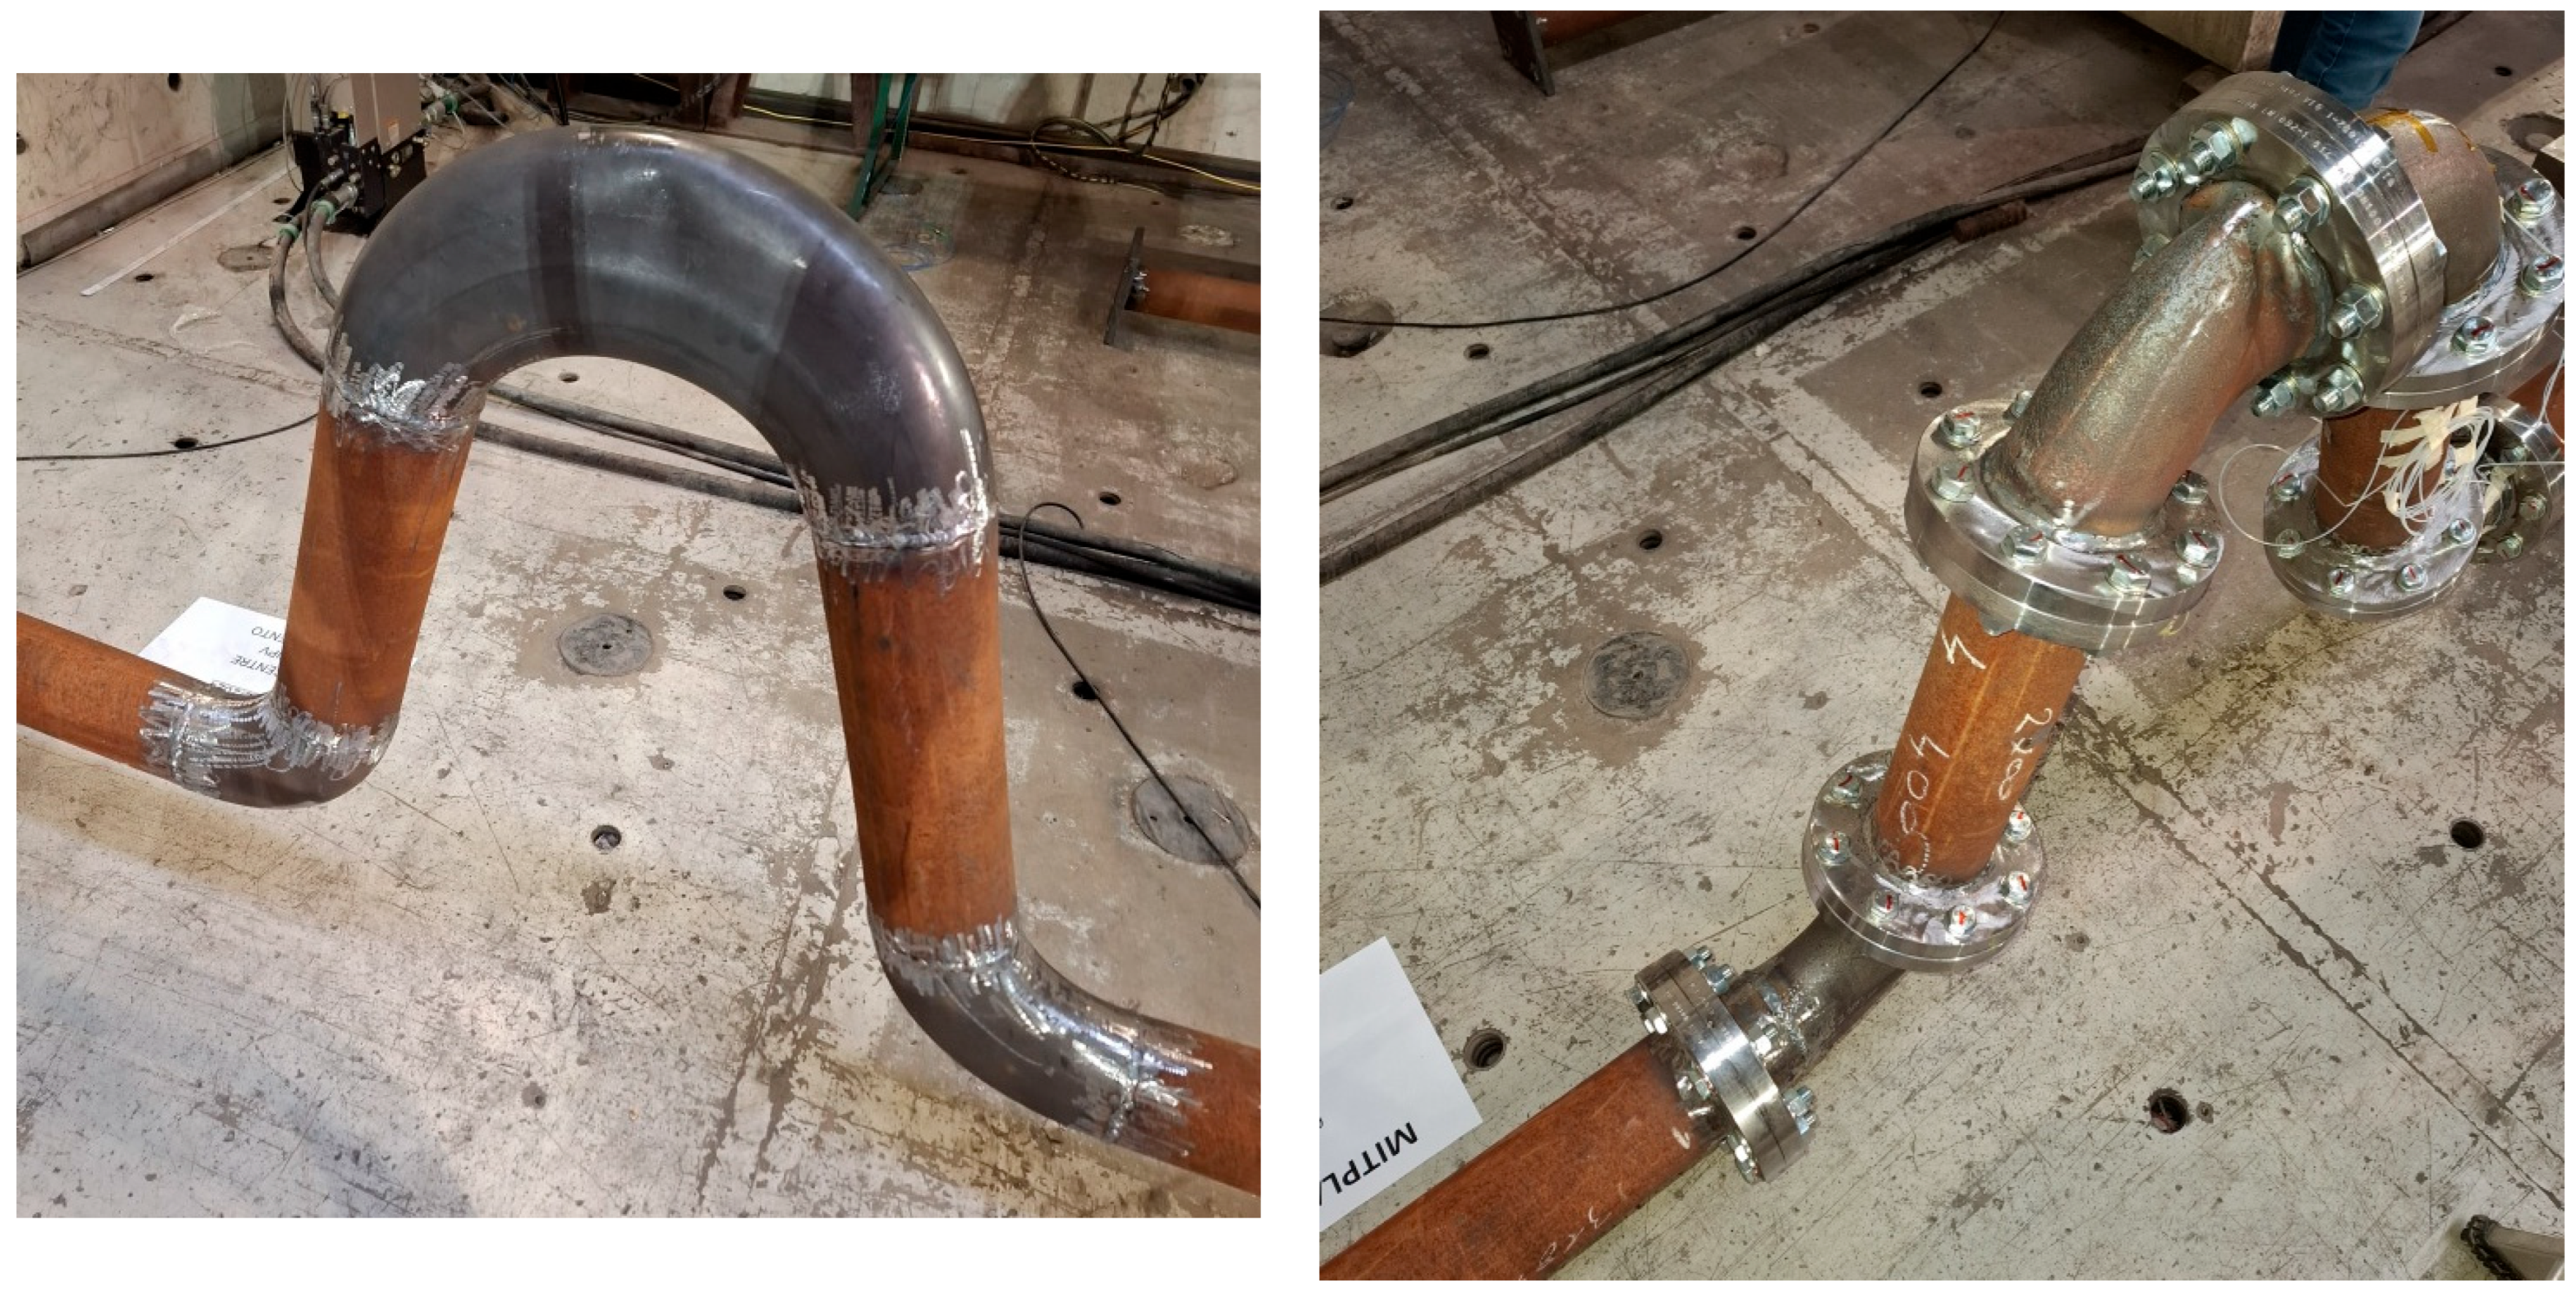
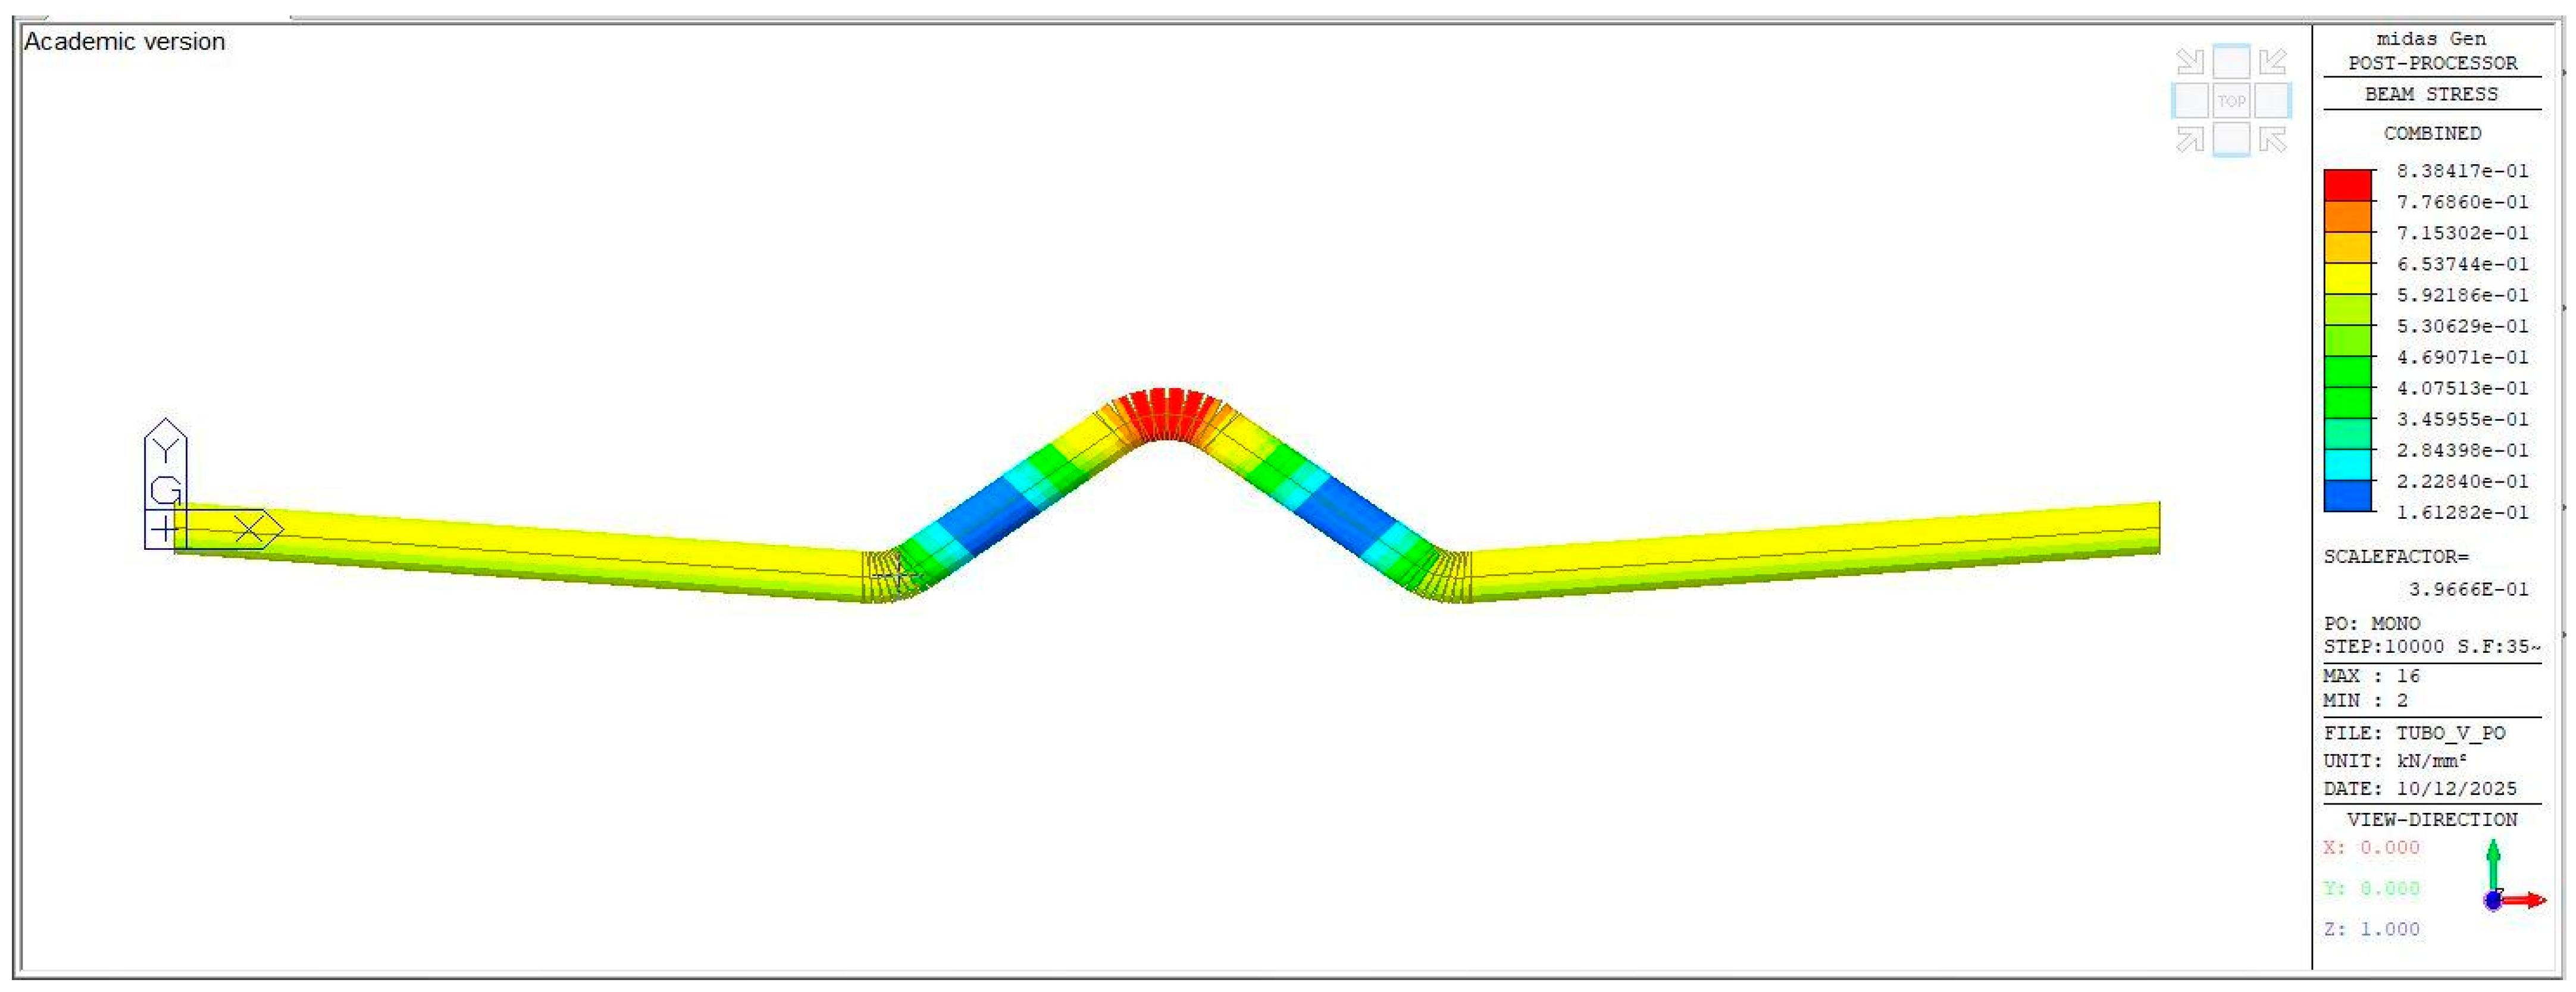
As expected, the specimens characterized by Omega loops were more flexible than the straight specimens (i.e., specimens 1 and 2). Specimen 3, which was composed of welded joints, exhibited a smaller initial stiffness than that of specimen 4 with flanged joints. However, the post-yield stiffness showed the opposite trend, having specimen 3, a larger post-yield stiffness than that of specimen 4. As observed in the straight specimens, a negative load was reached due to the plastic elongation of the pipes. The specimen 3 (i.e., welded joints) reached instability for compression load without exhibiting any evident rupture of the elements or the welds. The strain time histories corroborated the stress distribution observed in the numerical model. The vertical pipes that form the Omega loop maintained an almost zero deformation. Moreover, the horizontal pipe exhibited a behavior rather similar to that observed on the straight specimens, with increasing deformations as the amplitude of the input increased. On the other hand, the strains measured at the elbow’s elements confirmed the local instability observed as the peak strains were limited due to the local buckling of the pipe wall near the flange joint. Figure 21 shows the final state of specimens 3 and 4. The plastic deformation was concentrated in the elbow elements, which exhibited a contraction in the horizontal transversal direction and an expansion in the vertical longitudinal direction. On the other hand, specimen 4 (i.e., flanged joints) presented a rupture of one flanged-pipe connection. The plastic deformation was also concentrated on the elbow elements; however, due to the abrupt stiffness change between the pipes and the flanges, the elbow section exhibited local buckling near the flanged-pipe connections. Figure 22 shows the setup of the cyclic test of the third geometrical configuration composed of specimens 5 and 6 and corresponding to V loops with welded and flanged joints (see Figure 5); while Figure 23 and Figure 24 show the hysteresis behavior obtained from the cycled test of both specimens and the stress distribution at maximum displacement from the numerical simplified model, respectively.
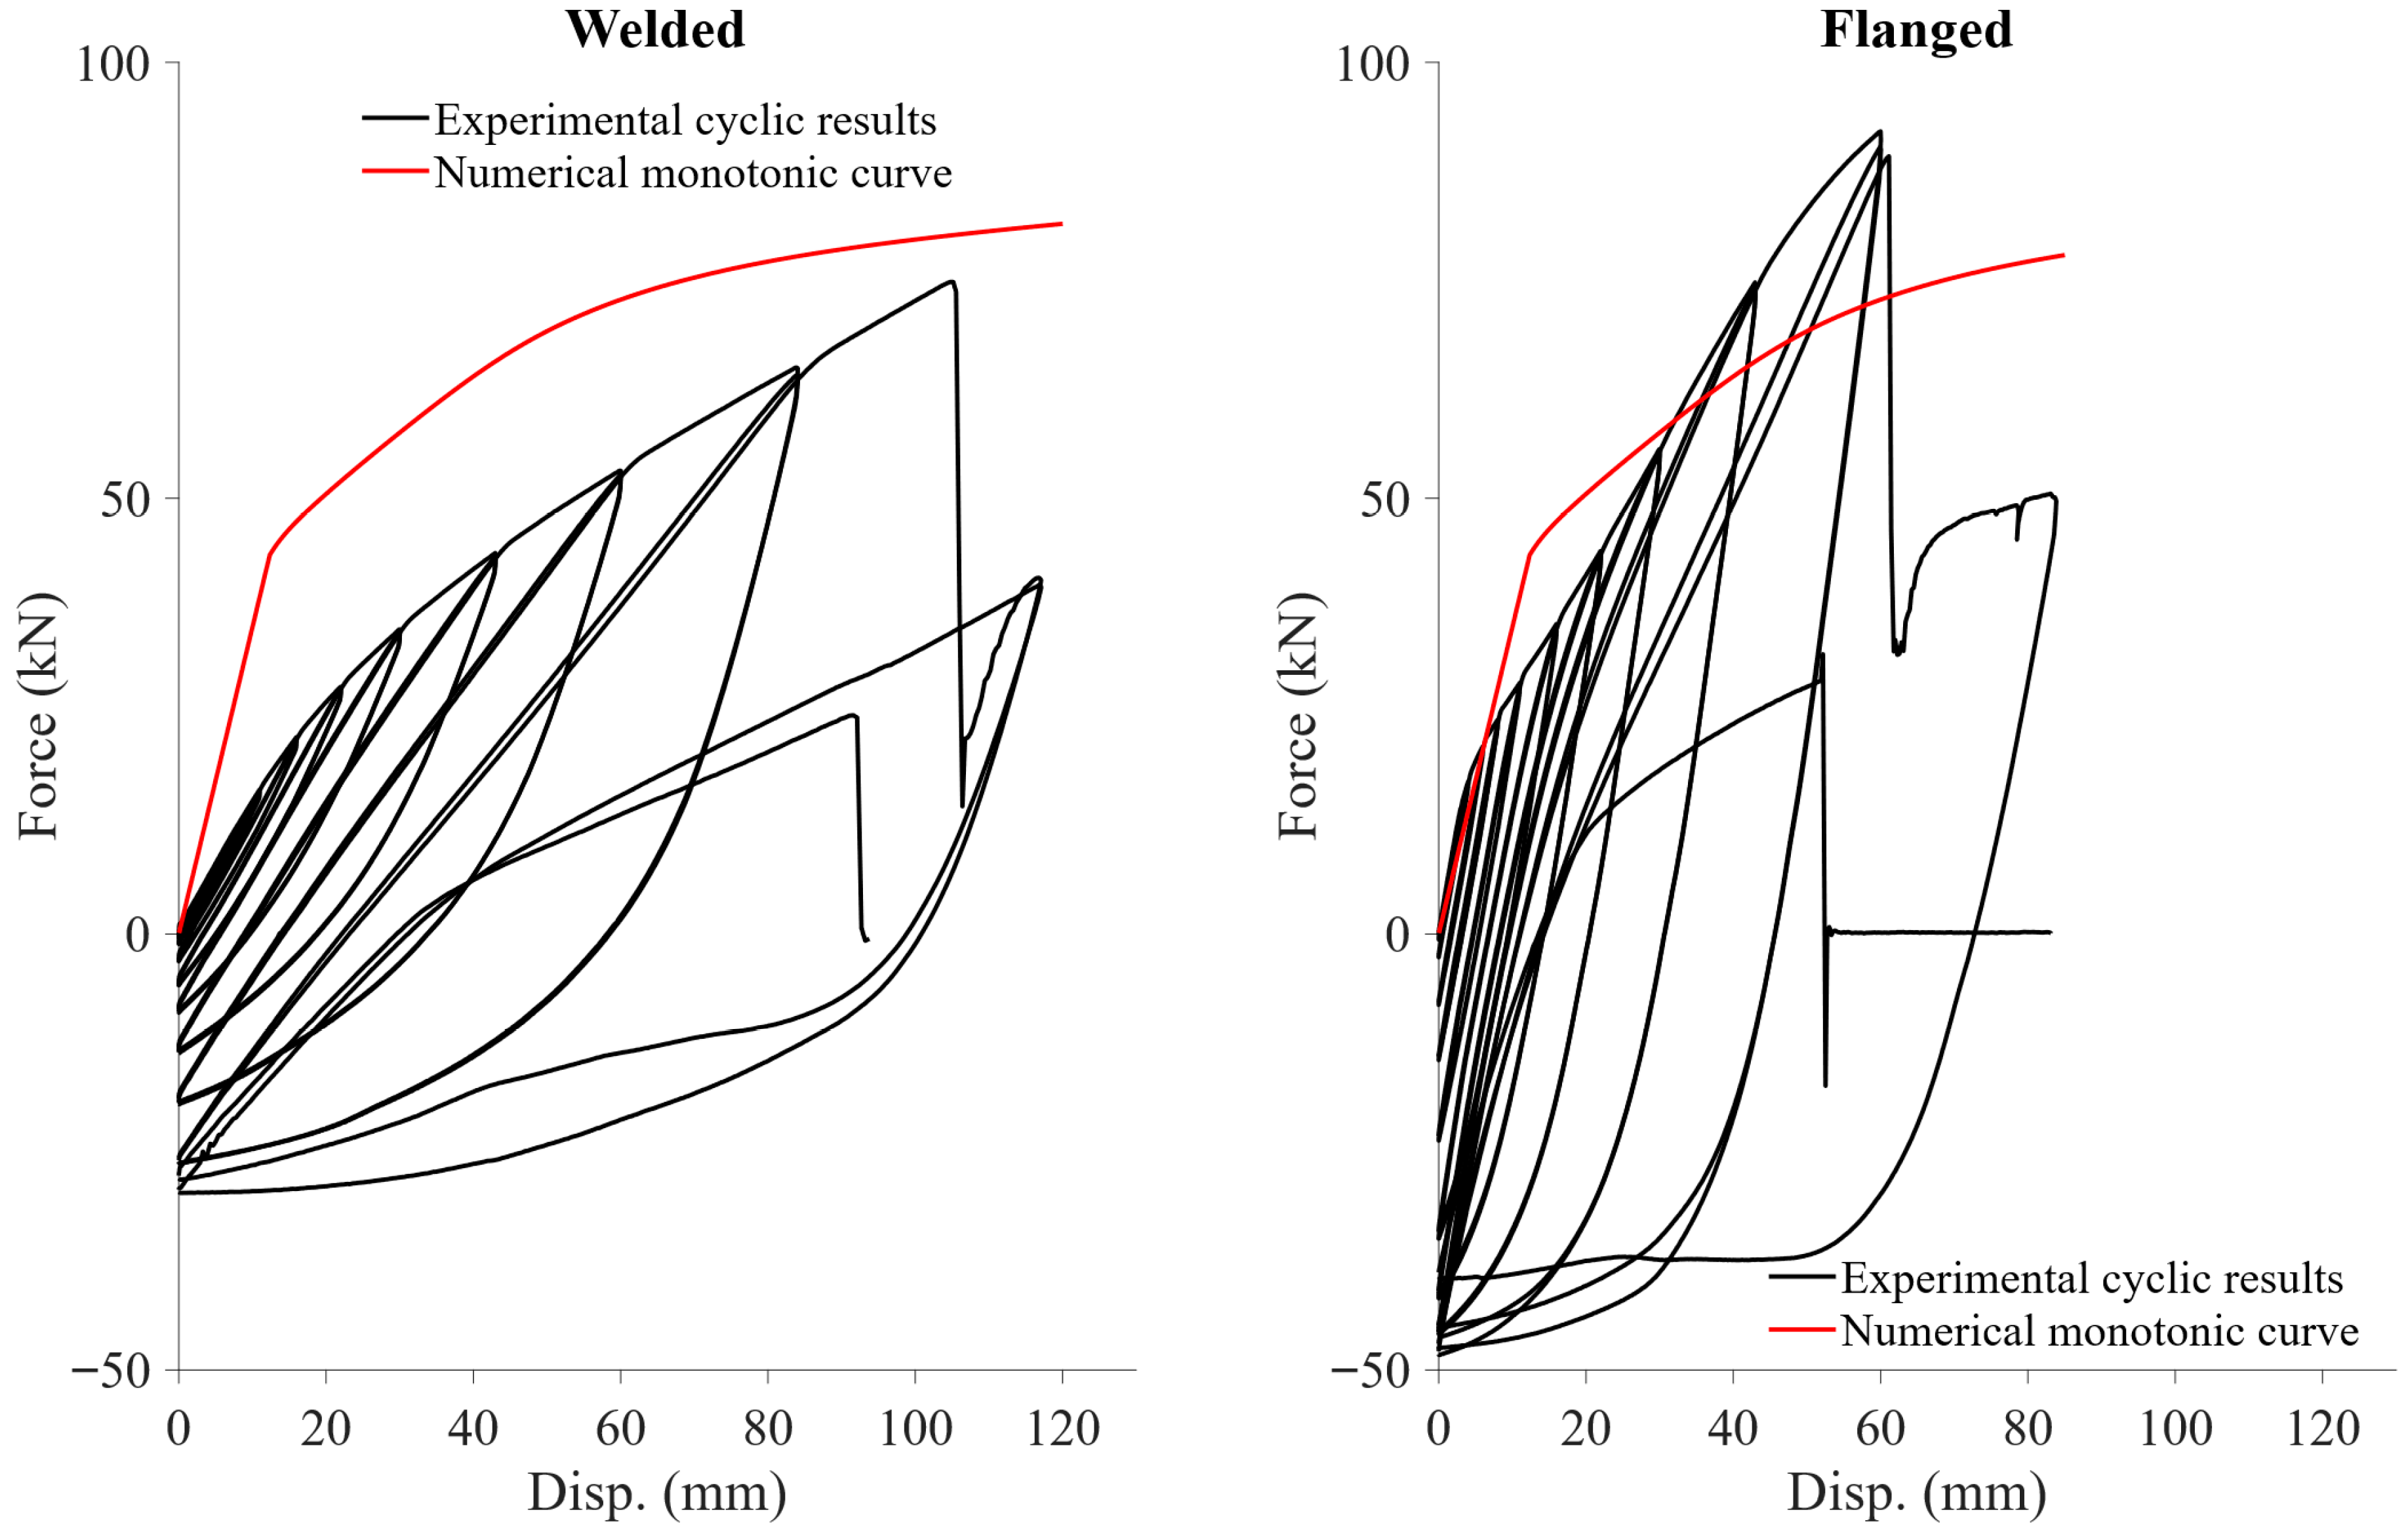
The configurations characterized by V loops showed smaller initial stiffness than those of the straight pipes but larger than those of the Omega loops (i.e., 0.35 and 0.90 kN/mm for the welded and flanged Omega specimens, respectively, compared to 1.48 and 4.89 kN/mm for the welded and flanged V specimens, respectively). The results show larger initial and post-yield stiffness in specimen 6 than in specimen 5. Similar to the Omega loop specimens, the plastic deformation was concentrated on the elbow elements without reaching the same magnitude of deformation exhibited by specimens 3 and 4. Figure 25 illustrates the final state of specimens 5 and 6. As observed in the previous specimens, a compression load was developed due to the plastic elongation of the specimens, yet they did not reach instability by the critical load, as both specimens presented a rupture. In the case of specimen 5, the rupture was generated in a welded connection between an elbow and pipe element, while for specimen 6, the rupture was generated inside the elbow element close to the flanged-pipe connection. In addition, specimen 6 (i.e., flanged joint) exhibited local buckling inside the elbow elements due to the abrupt change in stiffness between the pipe section and the flange, leading to the aforementioned rupture of the element.

3.2. Shake Table Test Results

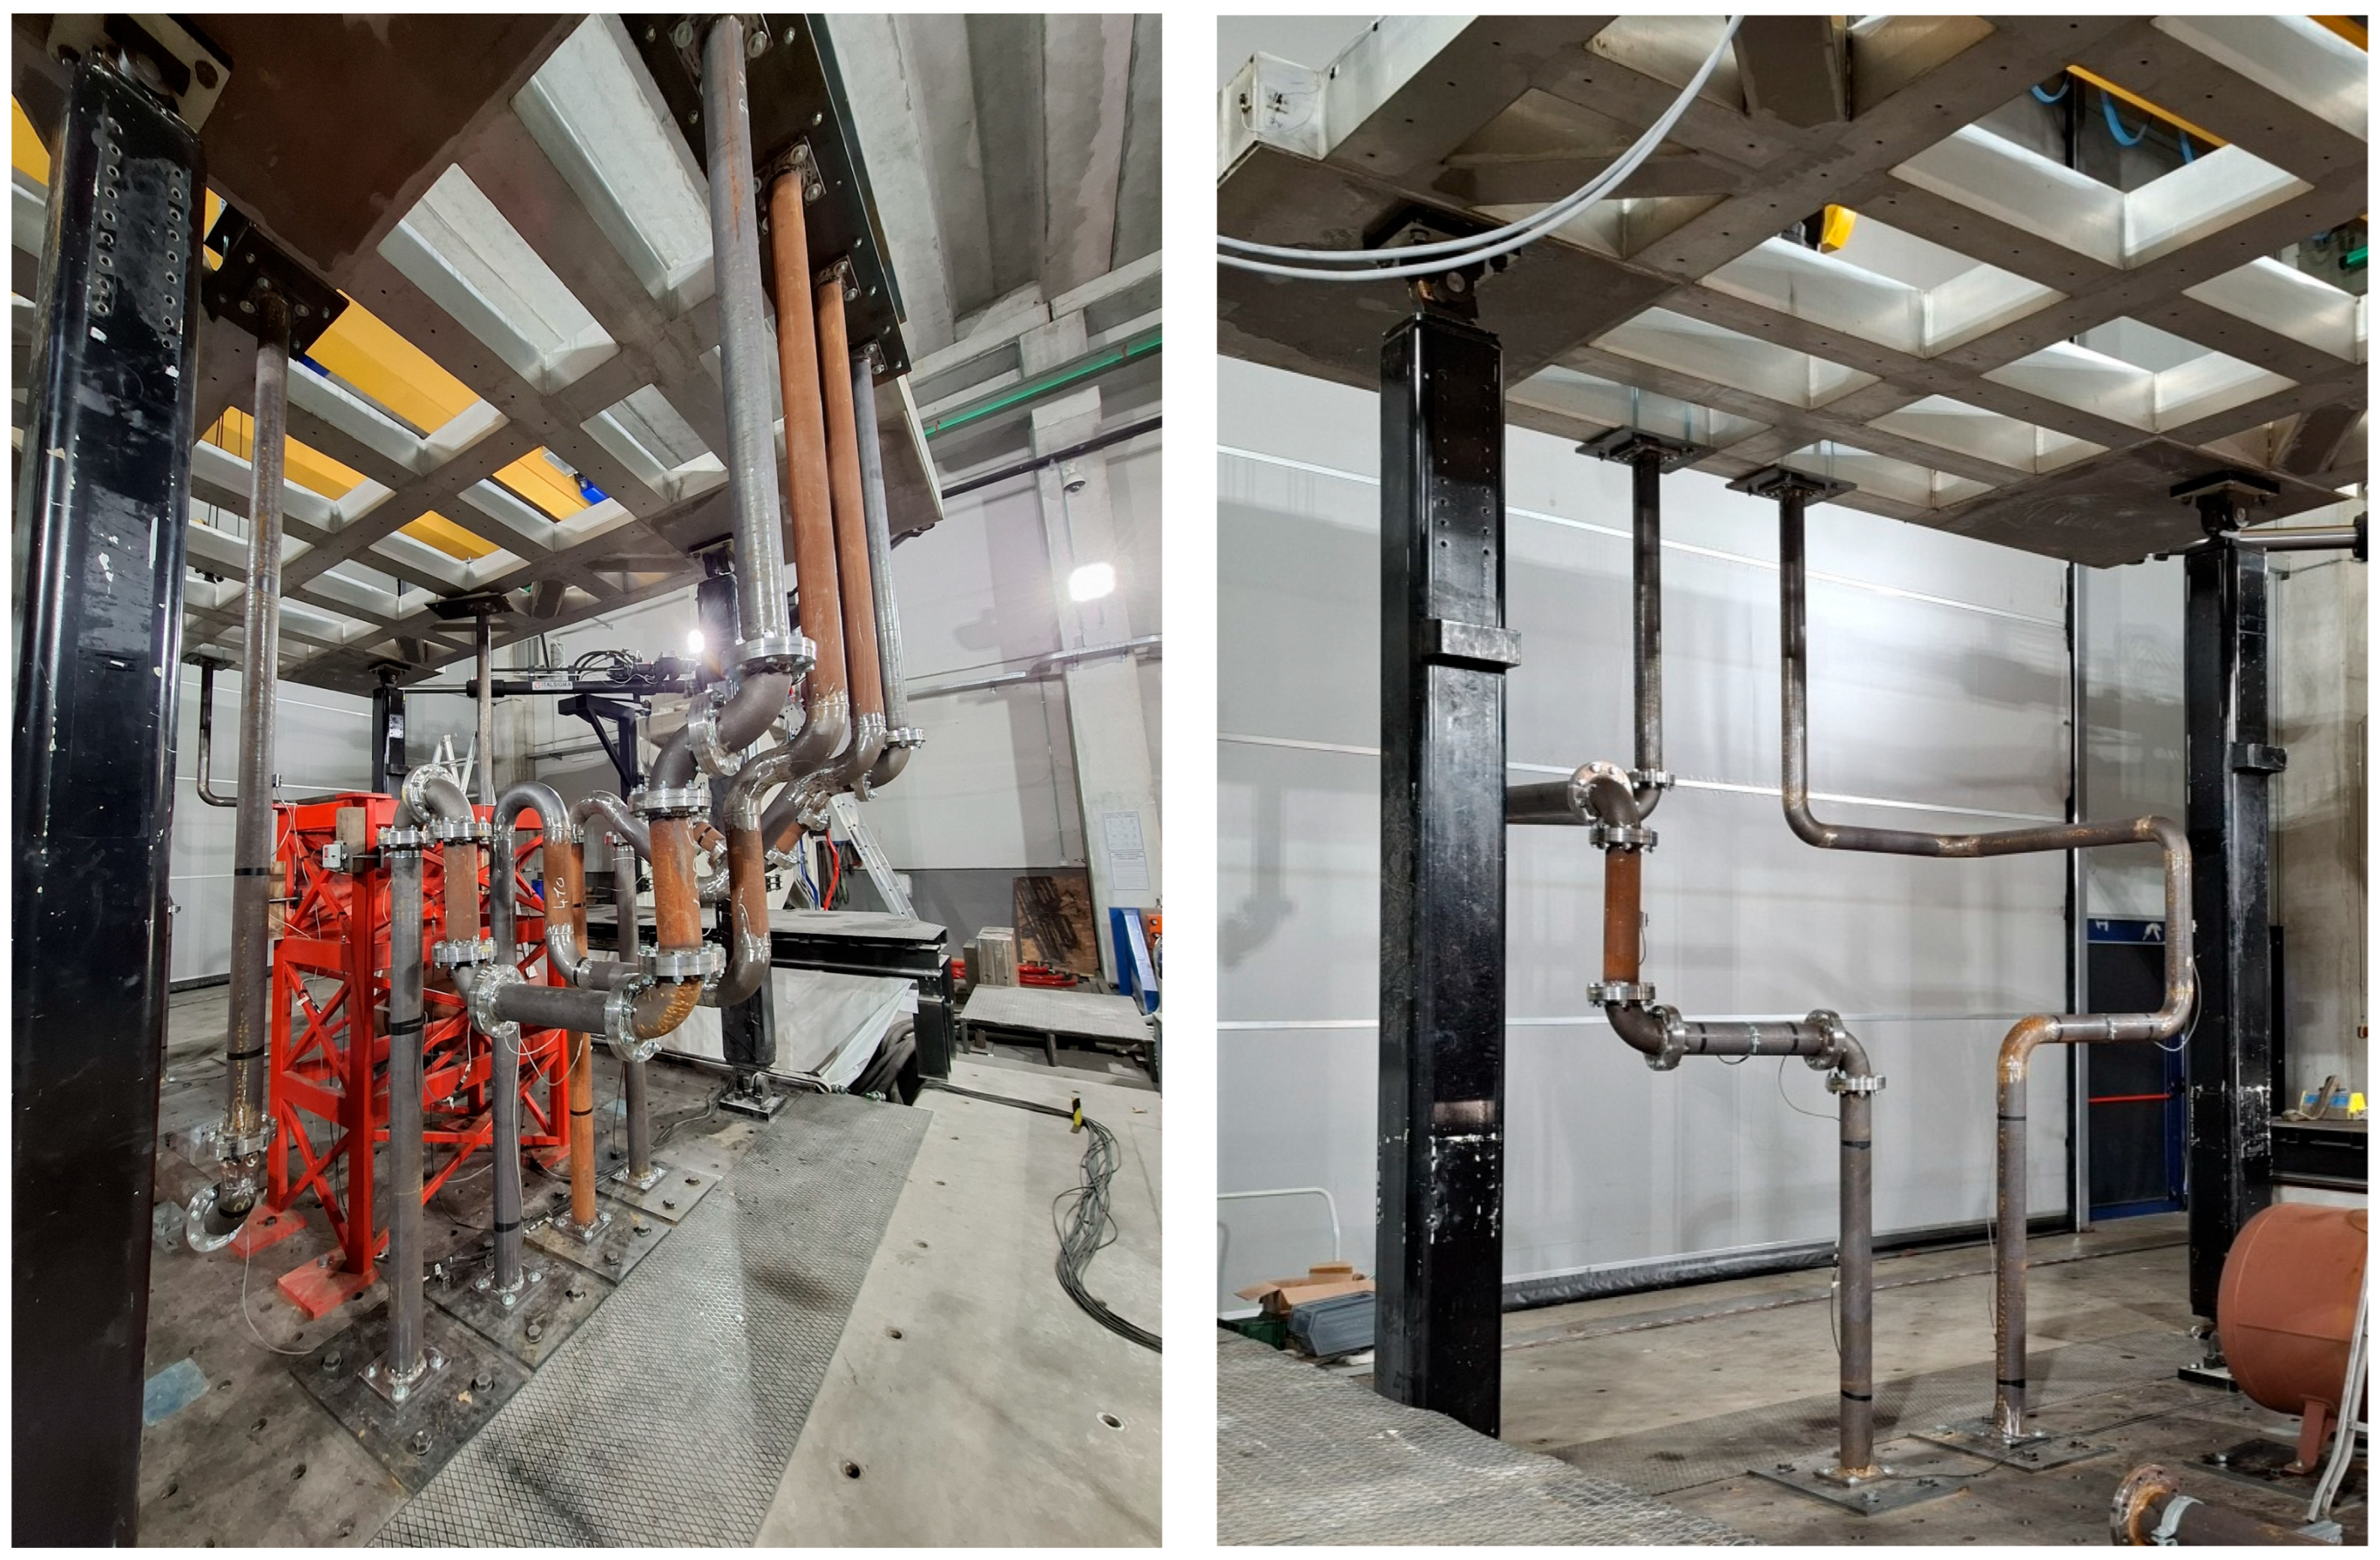
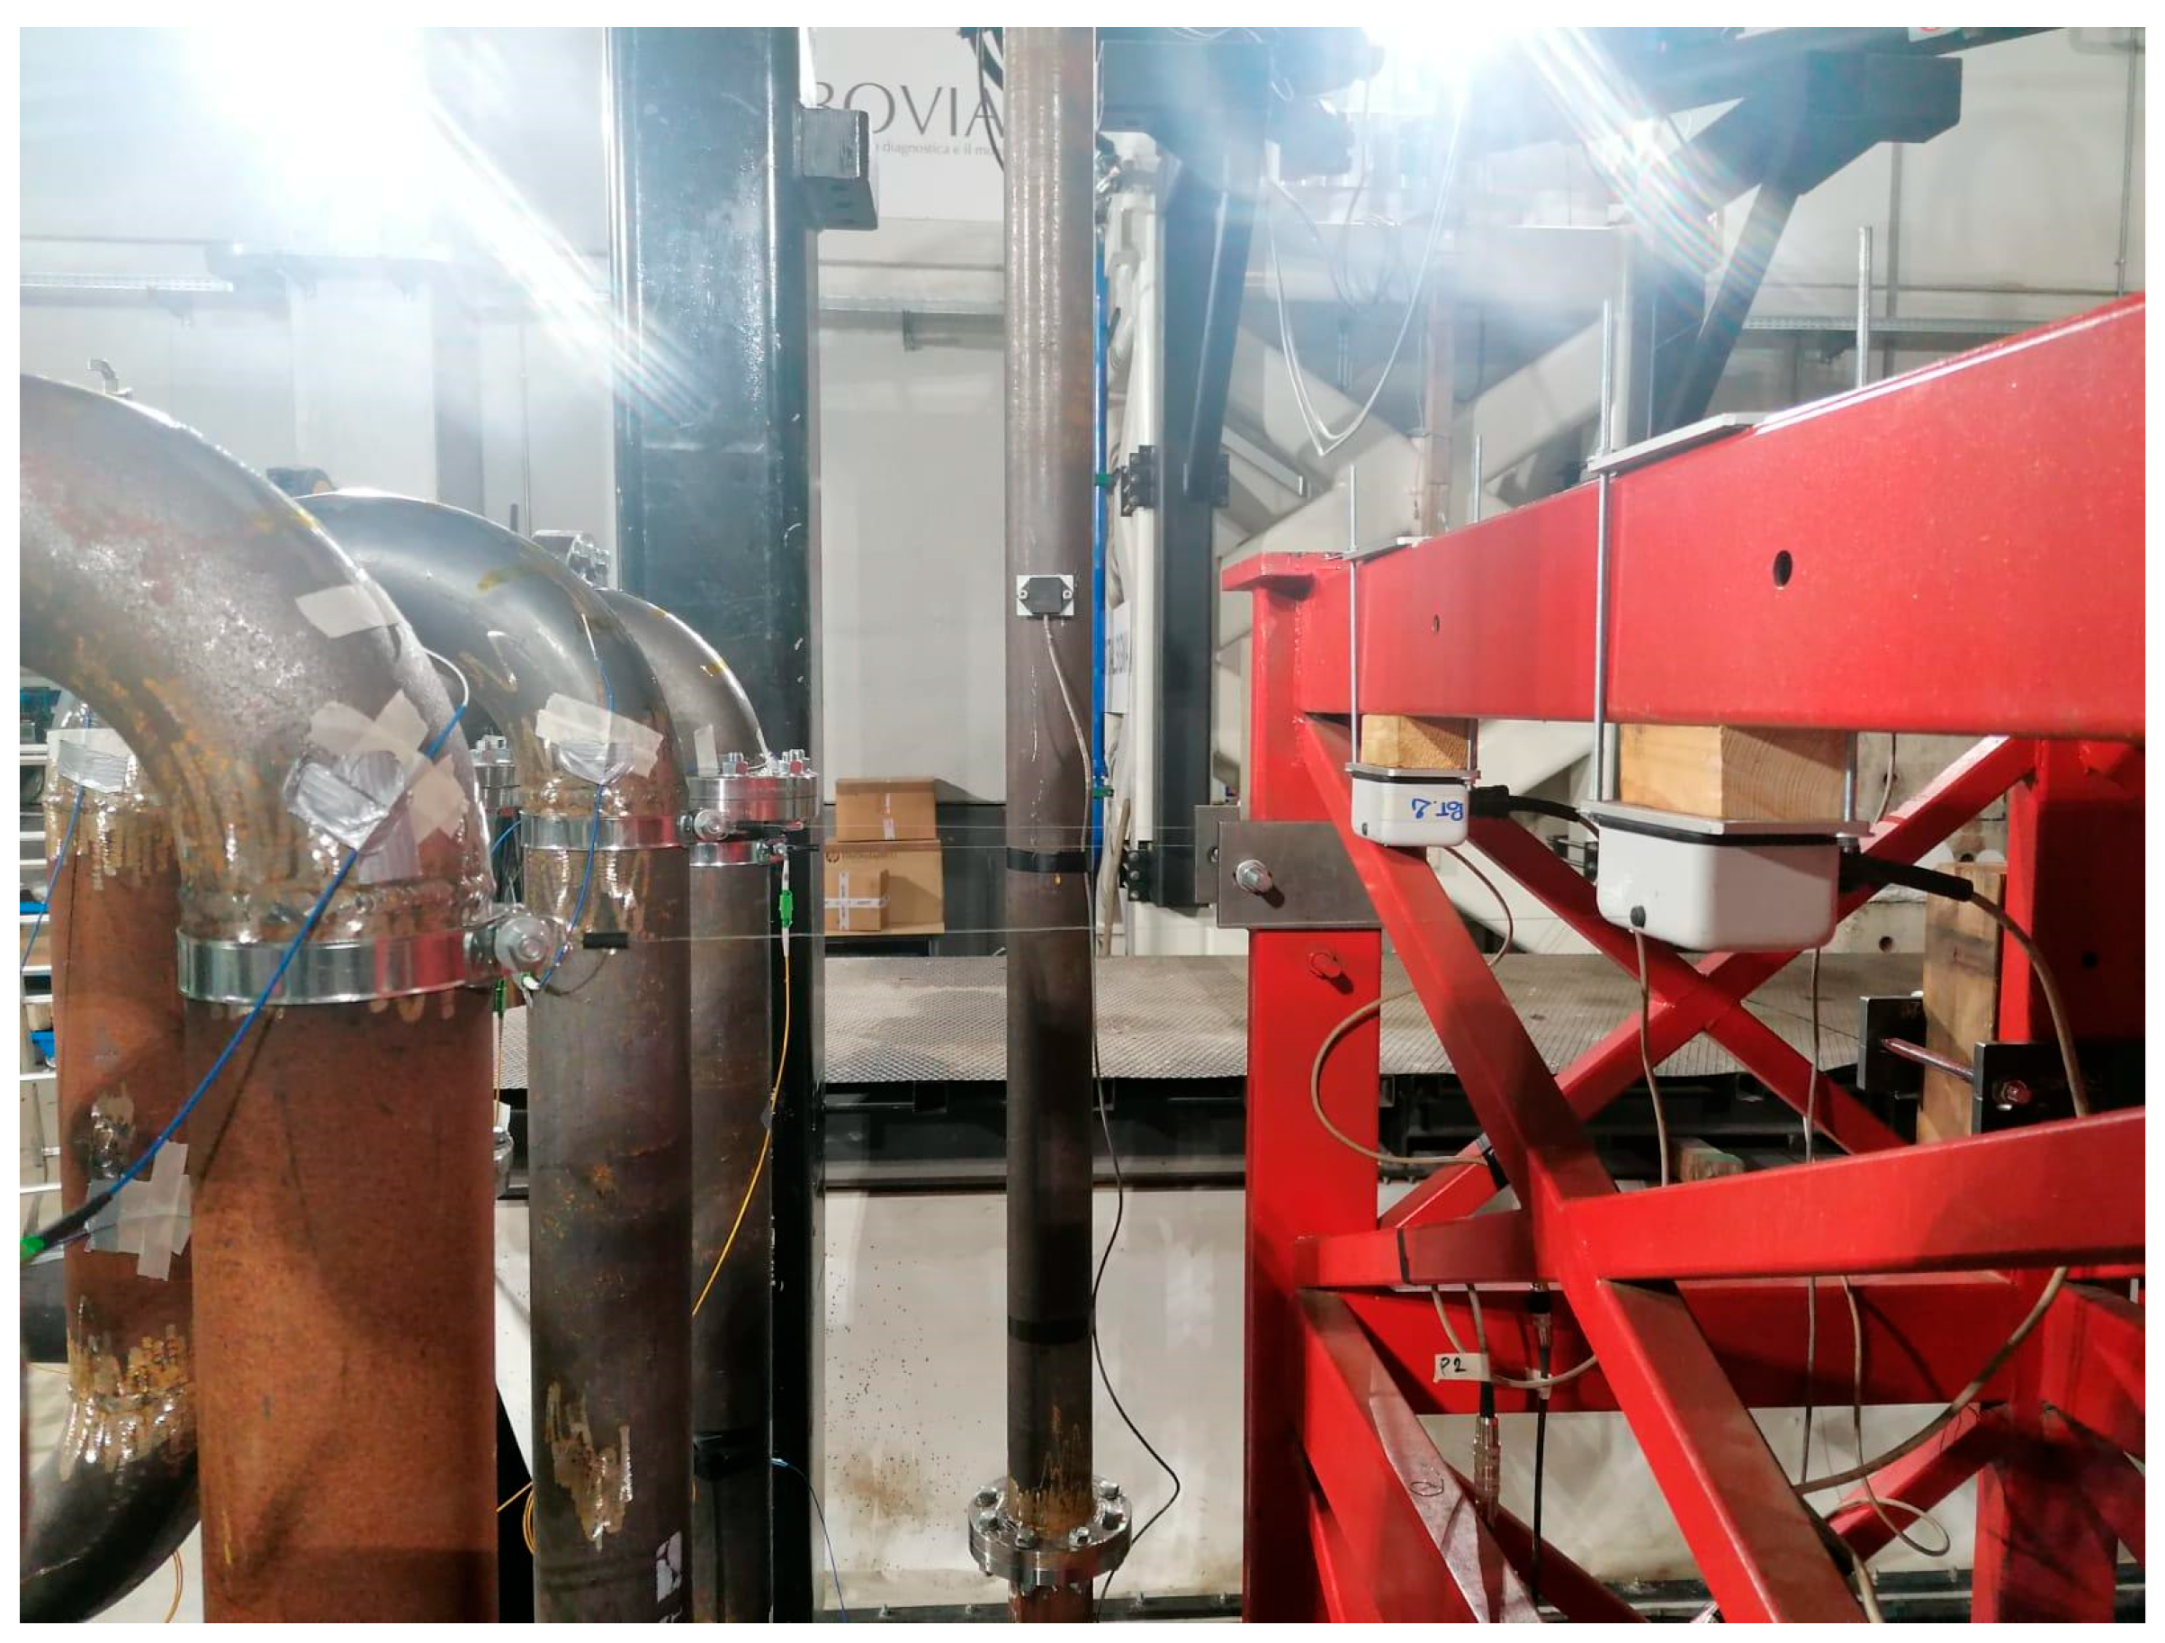
As mentioned before, a group of specimens with similar loop configurations (i.e., straight pipes, Omega loops, V loops) was subjected to actual seismic inputs, assuming they were located inside a steel-framed tower. Figure 26 illustrates the actual setup of the shake table. All pipe specimens were tested simultaneously and subjected to two independent seismic inputs at their bottom and top ends, simulating the relative displacements that occur at different floors of a support structure. The seismic input was scaled from 10% to 140% of the reference design earthquake; in addition, after each test, a free vibration test was conducted to verify any change in the dynamic properties of the specimens. Table 2 reports the comparison of the first three vibration periods of each specimen measured after the 10% and 140% shake intensity tests.
The free vibration test showed that the specimens characterized by flanged joints exhibited larger vibration periods. This trend is explained by the larger lumped masses added by the flanged joints compared to the rather continuous mass distributions of the welded specimens. In addition, a negligible period elongation was noted for all the specimens when comparing the calculations after the 10% and 140% shake intensity levels; therefore, it can be concluded that the pipe specimens did not suffer damage or reach plastic behavior during the tests. This corroborated the large deformation capacity observed during the cyclic tests. The flanged straight pipe loop (i.e., specimen 12) exhibited the largest fundamental period, followed by the flanged Omega loop (i.e., specimen 8) and the flanged V loop (i.e., specimen 10). Then, the same order is repeated by the welded connections (specimens 11, 7, and 9, respectively). It is important to notice that the computed fundamental periods vary from 0.128 s to 0.0557 s, which indicates that the pipe specimens were rather rigid; hence, it is not expected that a significant dynamic amplification of the seismic forces will occur, as their seismic demand is determined mainly by the PGA.
Considering that no variation in the stiffness properties of the pipe specimens was detected between the 10% and 140% shake intensity test, it is expected that the difference in the seismic response of the specimens varies linearly as the intensity increases. Therefore, the following results are based on the 100% shake intensity, which corresponds to a design intensity earthquake based on the discretization explained in Section 2.

3.2.1. Acceleration Response

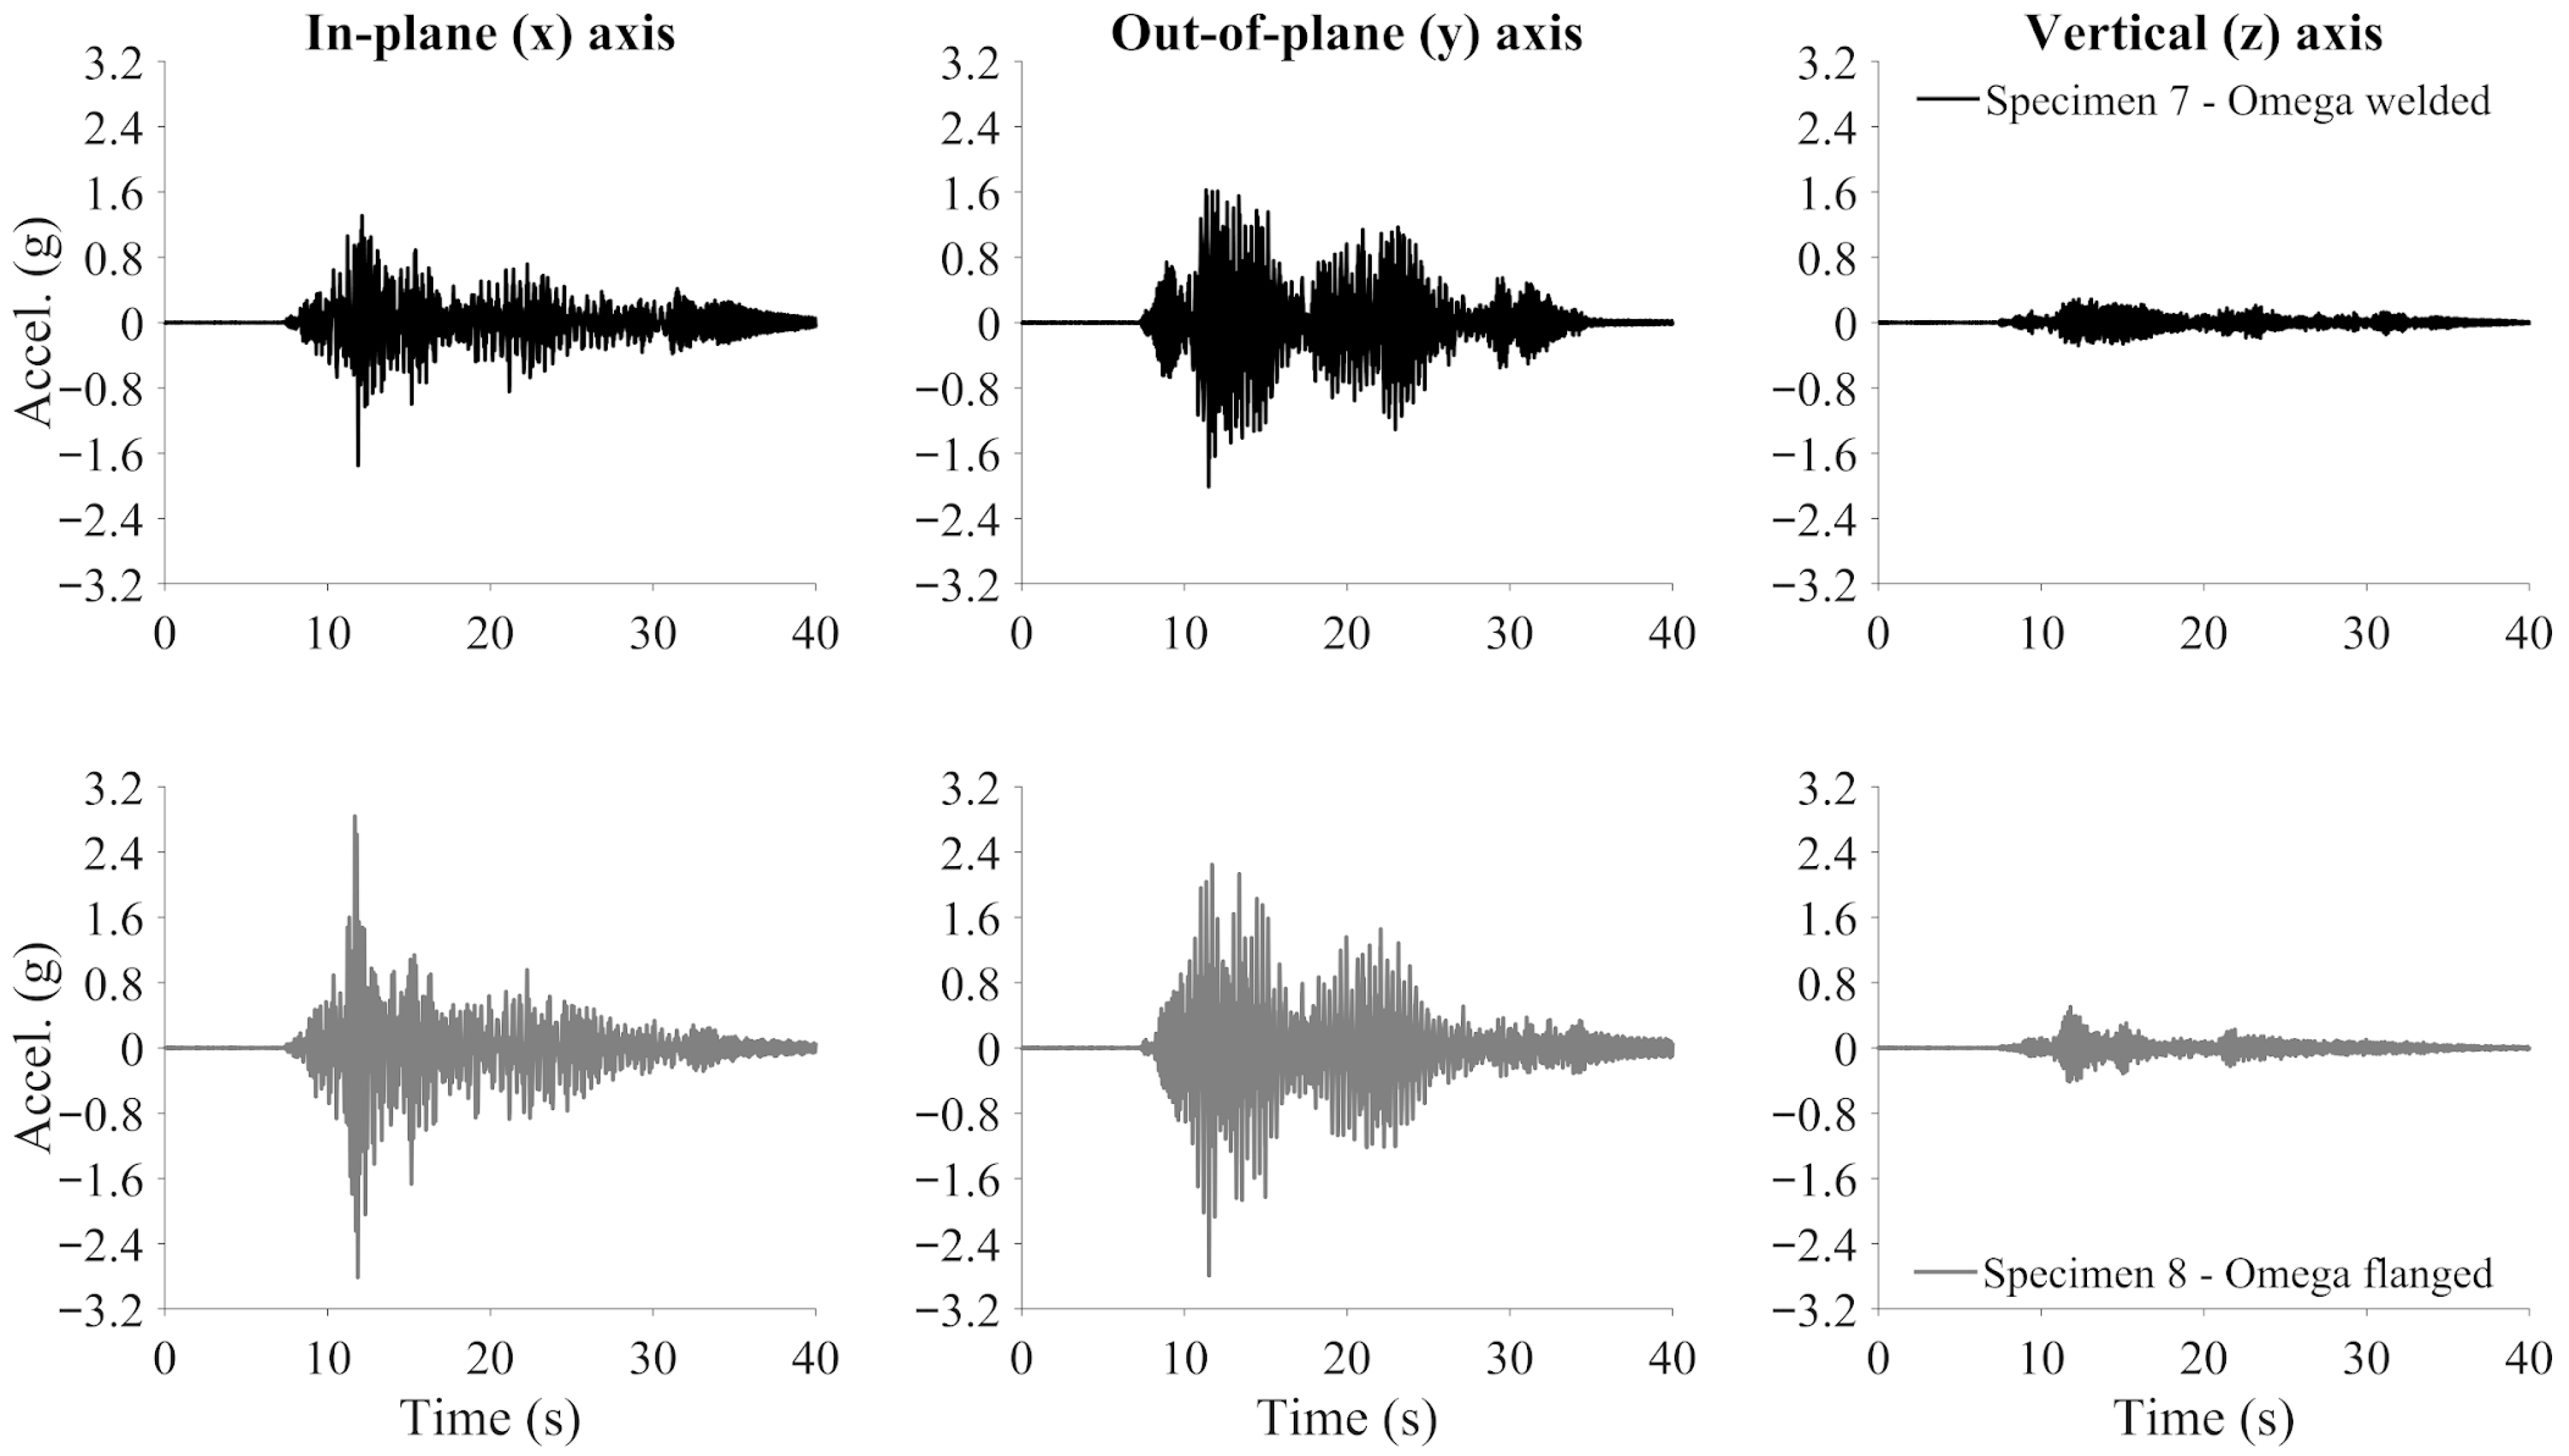
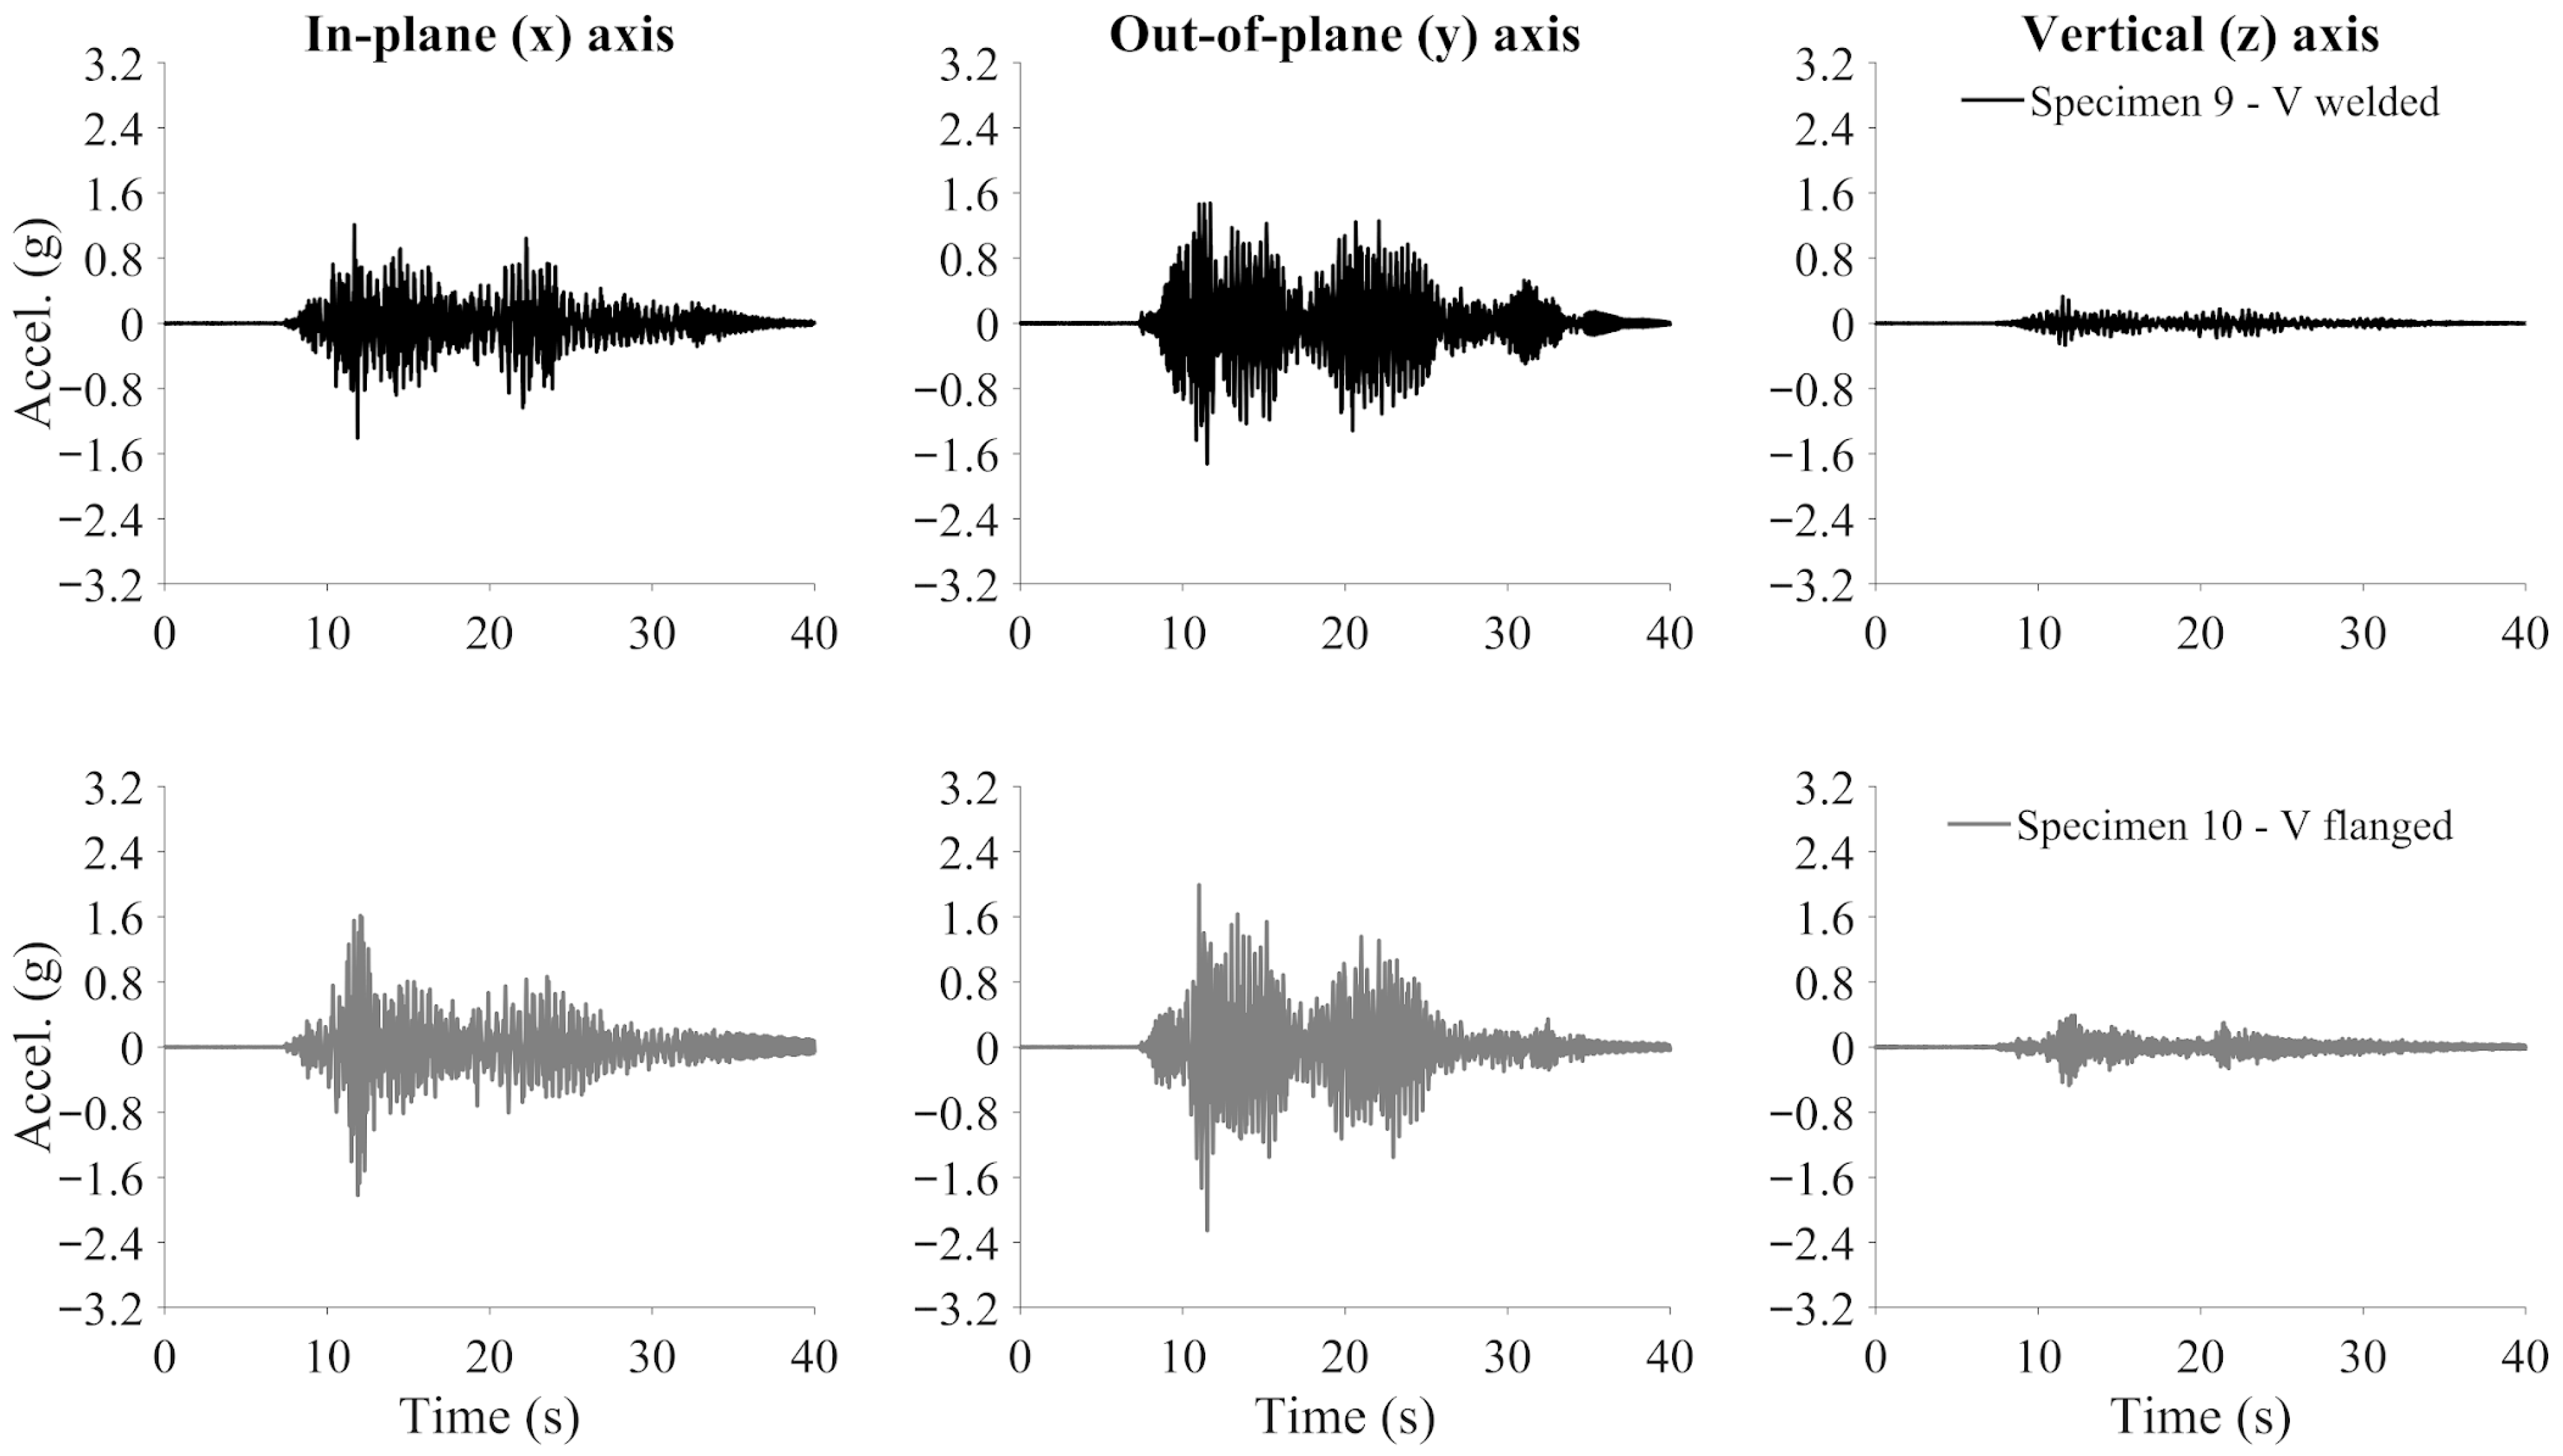
The acceleration response of the pipe specimens was measured through 3D accelerometers located in the middle section, as shown in Figure 27. Table 3 reports the maximum absolute acceleration registered for each specimen. The flanged specimens (i.e., specimens 8, 10, and 12) exhibited larger peak absolute accelerations than those exhibited by the welded specimens (i.e., specimens 7, 9, and 11). In addition, the out-of-plane direction tended to exhibit larger accelerations than those measured in the in-plane direction. These trends corroborated the computation of the vibration periods of the pipe specimens, as the larger peak accelerations corresponded to larger vibration periods, therefore, evidencing a small dynamic amplification of the floor motions. Moreover, due to the geometry of the specimens, they experienced not negligible vertical accelerations although no vertical inputs were considered. This vertical acceleration response was more significant for the straight pipe specimens (i.e., specimens 11 and 12, see Figure 14) as they had a more irregular layout, leading to larger vertical acceleration responses. Figure 28, Figure 29 and Figure 30 show the acceleration response time histories of the pipe specimens. These results show that the acceleration response was dominated by high-frequency components, corroborating the computed vibration periods reported in Table 2. It was also noticed that a small vibrational decay in the signal, indicating rather low inherent damping values.

3.2.2. Displacement Response

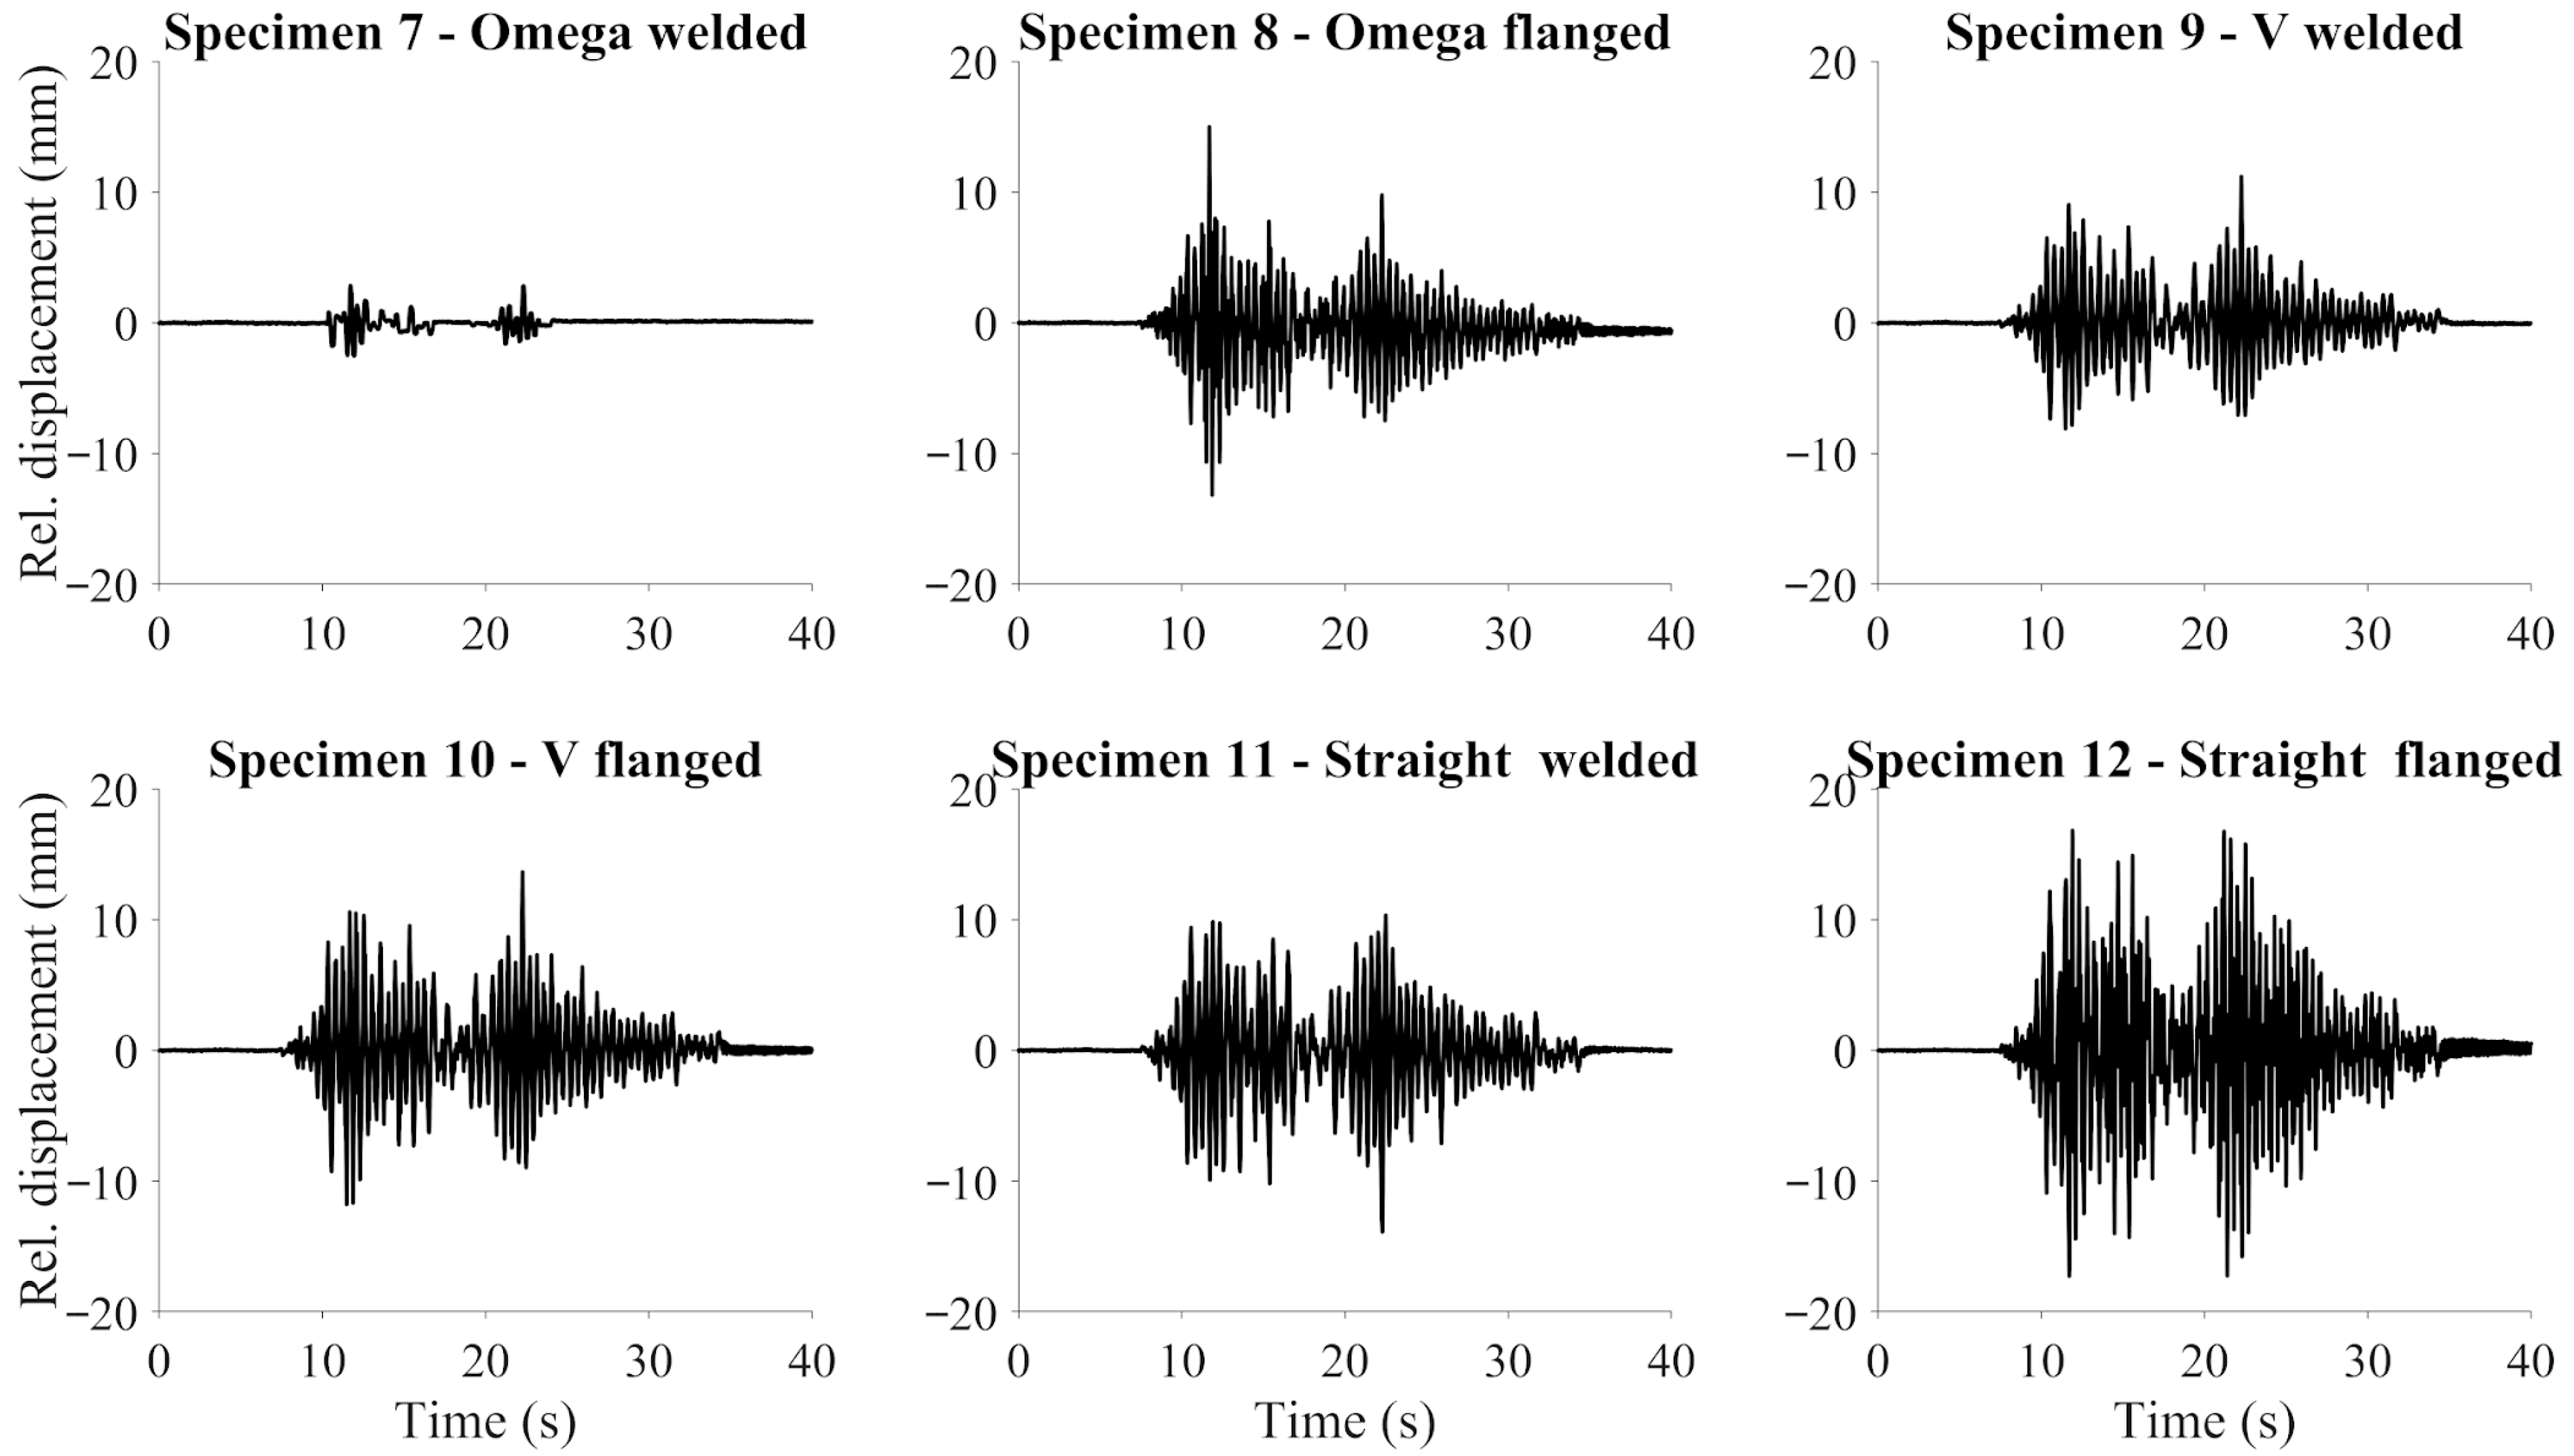
The relative in-plane displacement at the middle height span of the pipe specimens was measured through LDVTs located in the middle section, as shown in Figure 31. Table 4 reports the peak relative in-plane displacement at the middle height span registered for each specimen, and Figure 32 illustrates the in-plane relative displacement response time histories of the 100% intensity level. First, it is important to note that there was a problem with the displacement registration of specimen 7 that was only noticed after conducting the postprocessing of the results. Therefore, although these values were included in the tables and figures for completeness, they were not considered for the analysis of results. In addition, it is an isolated case that did not affect the integrity and accuracy of the results obtained from other instruments and specimens. Similarly to the results observed in the acceleration response, the flanged specimens (i.e., specimens 8, 10, and 12) exhibited larger peak relative in-plane displacements than those exhibited by the equivalent welded specimens (i.e., specimens 9 and 11) with increments between 20% and 30%. These larger relative displacements could have been generated by the larger dynamic amplification in the specimens characterized by flanged joints due to the additional masses of the flanges. Also, the relative in-plane displacement corroborated the stiff trends observed in the acceleration results. The specimens characterized by Omega loops (i.e., specimen 8) were more flexible than those characterized by V loops (i.e., specimens 9 and 10), exhibiting larger relative in-plane displacements. The straight specimens (i.e., specimens 11 and 12), due to their more irregular geometry layout, exhibited larger peak in-plane relative displacements compared to the other configurations. However, all the specimens exhibited peak in-plane relative displacement in the same order of magnitude.

3.2.3. Strain Measurements

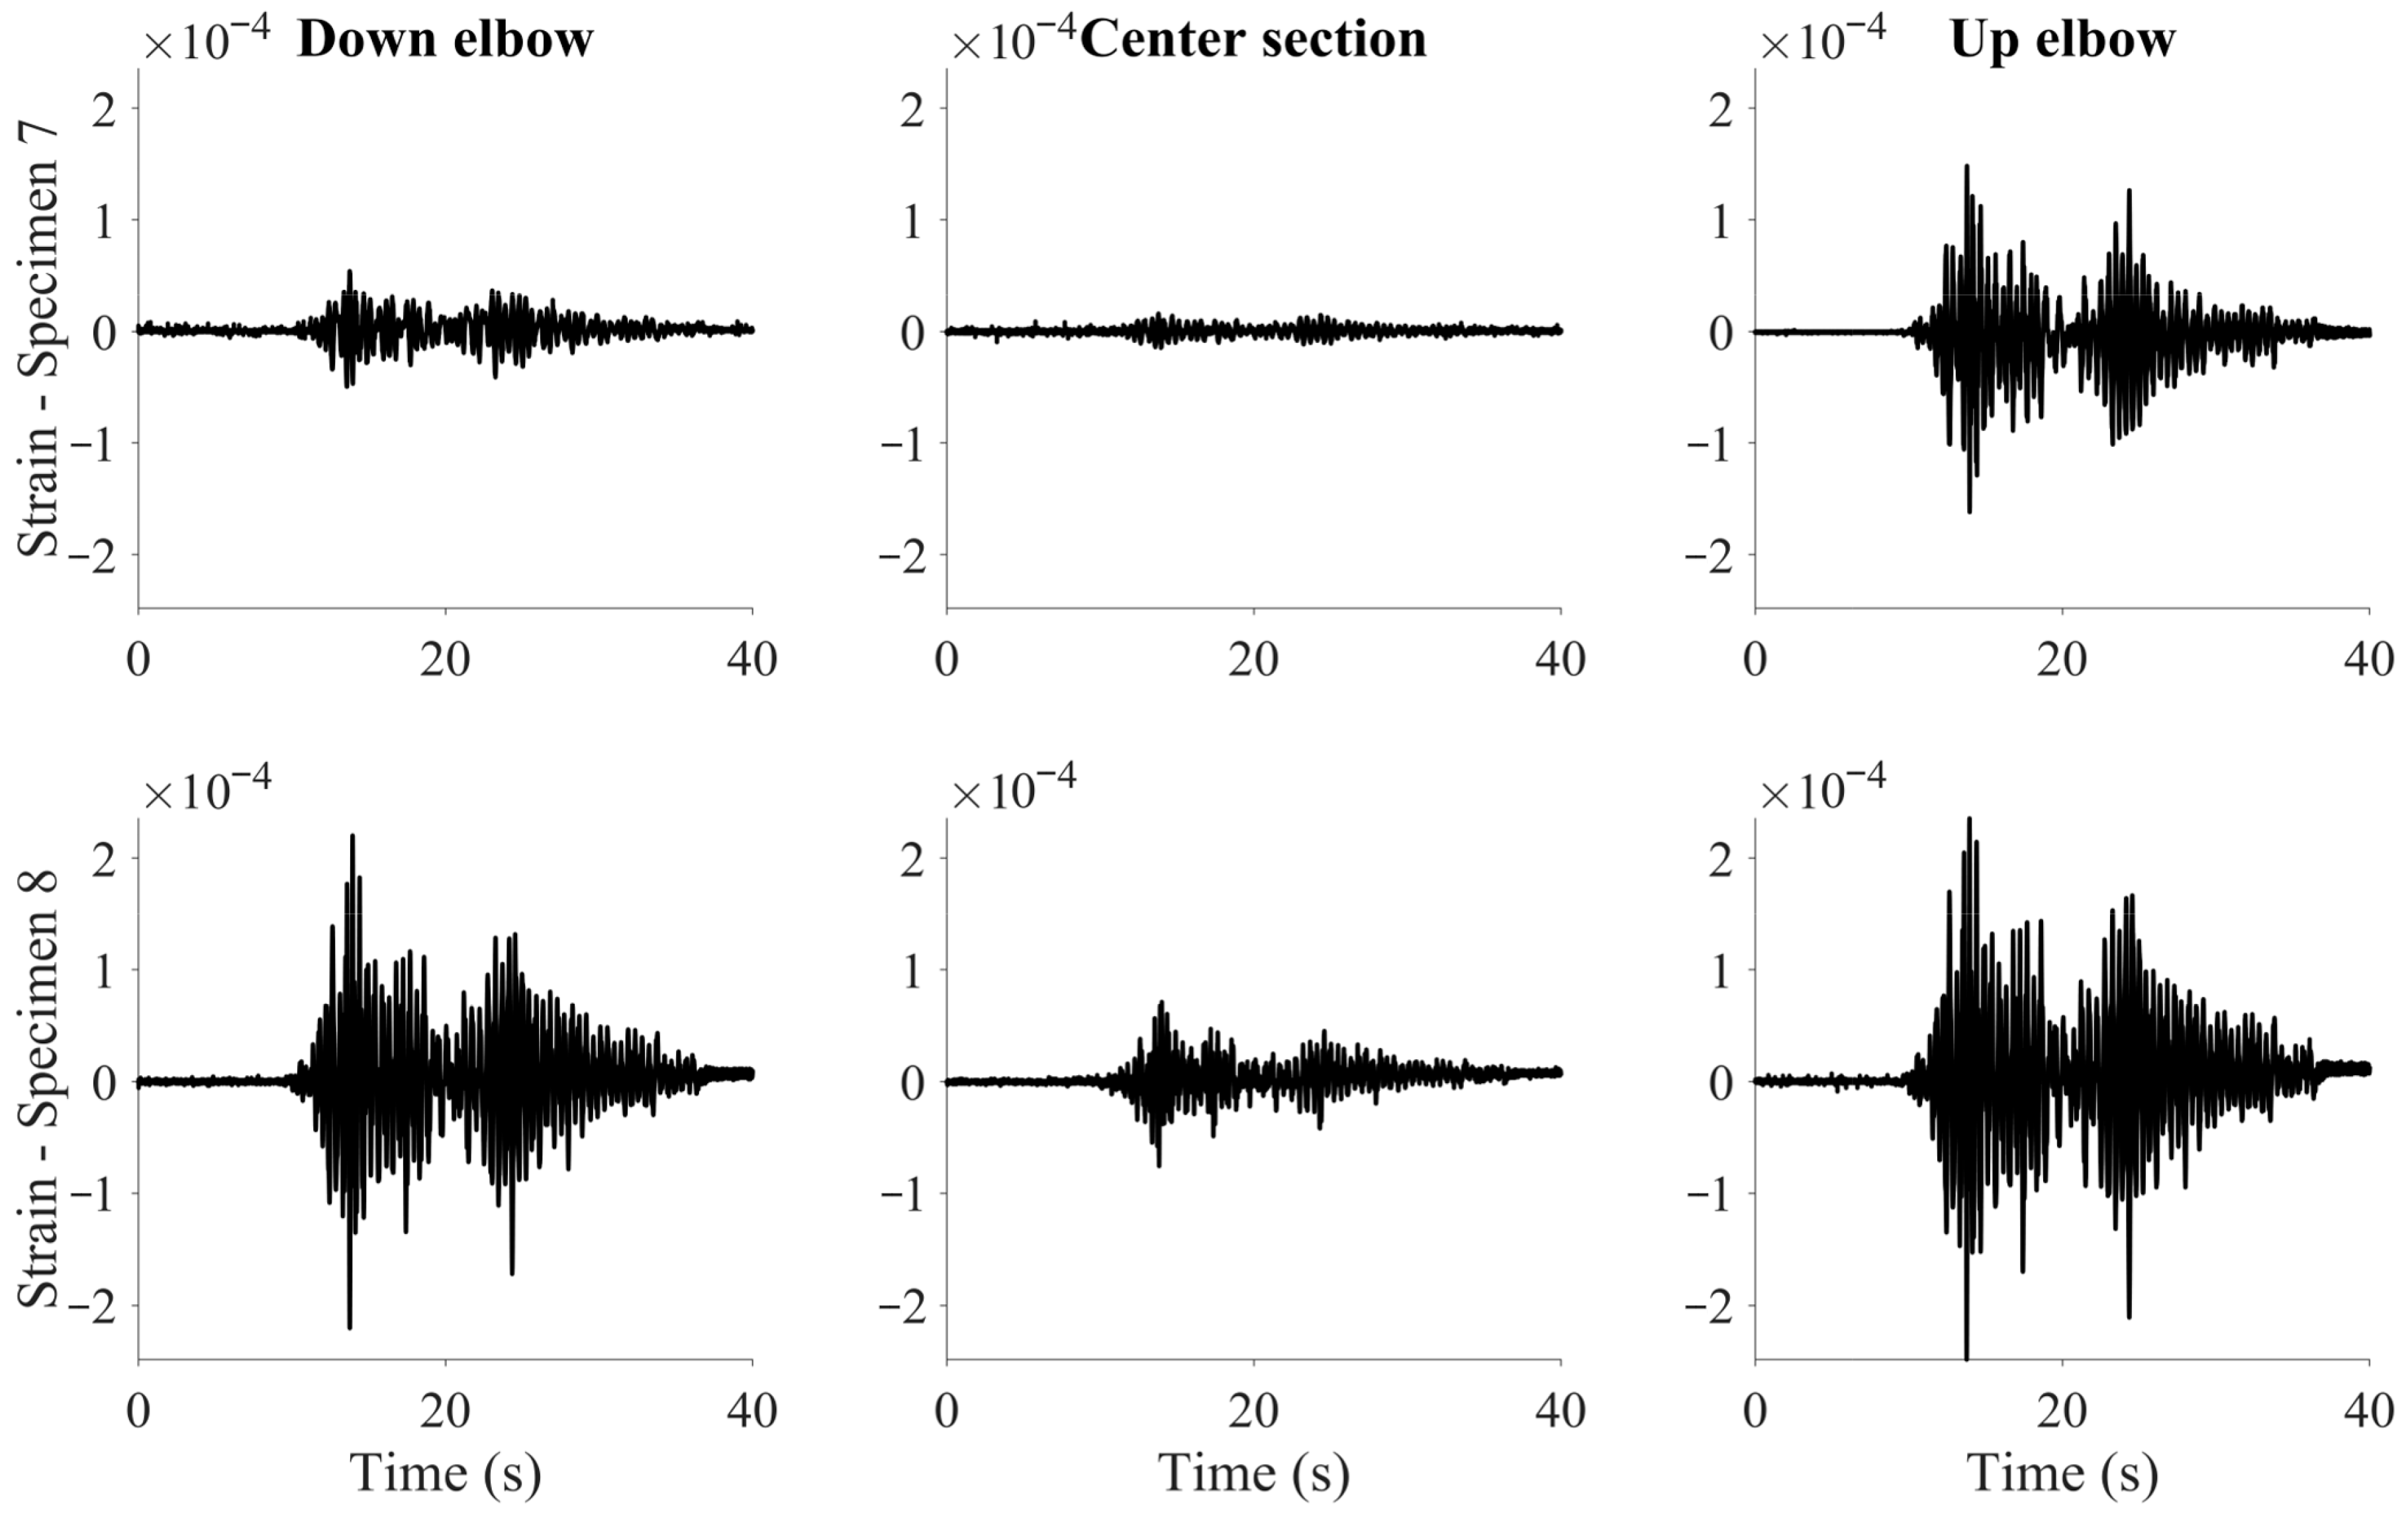
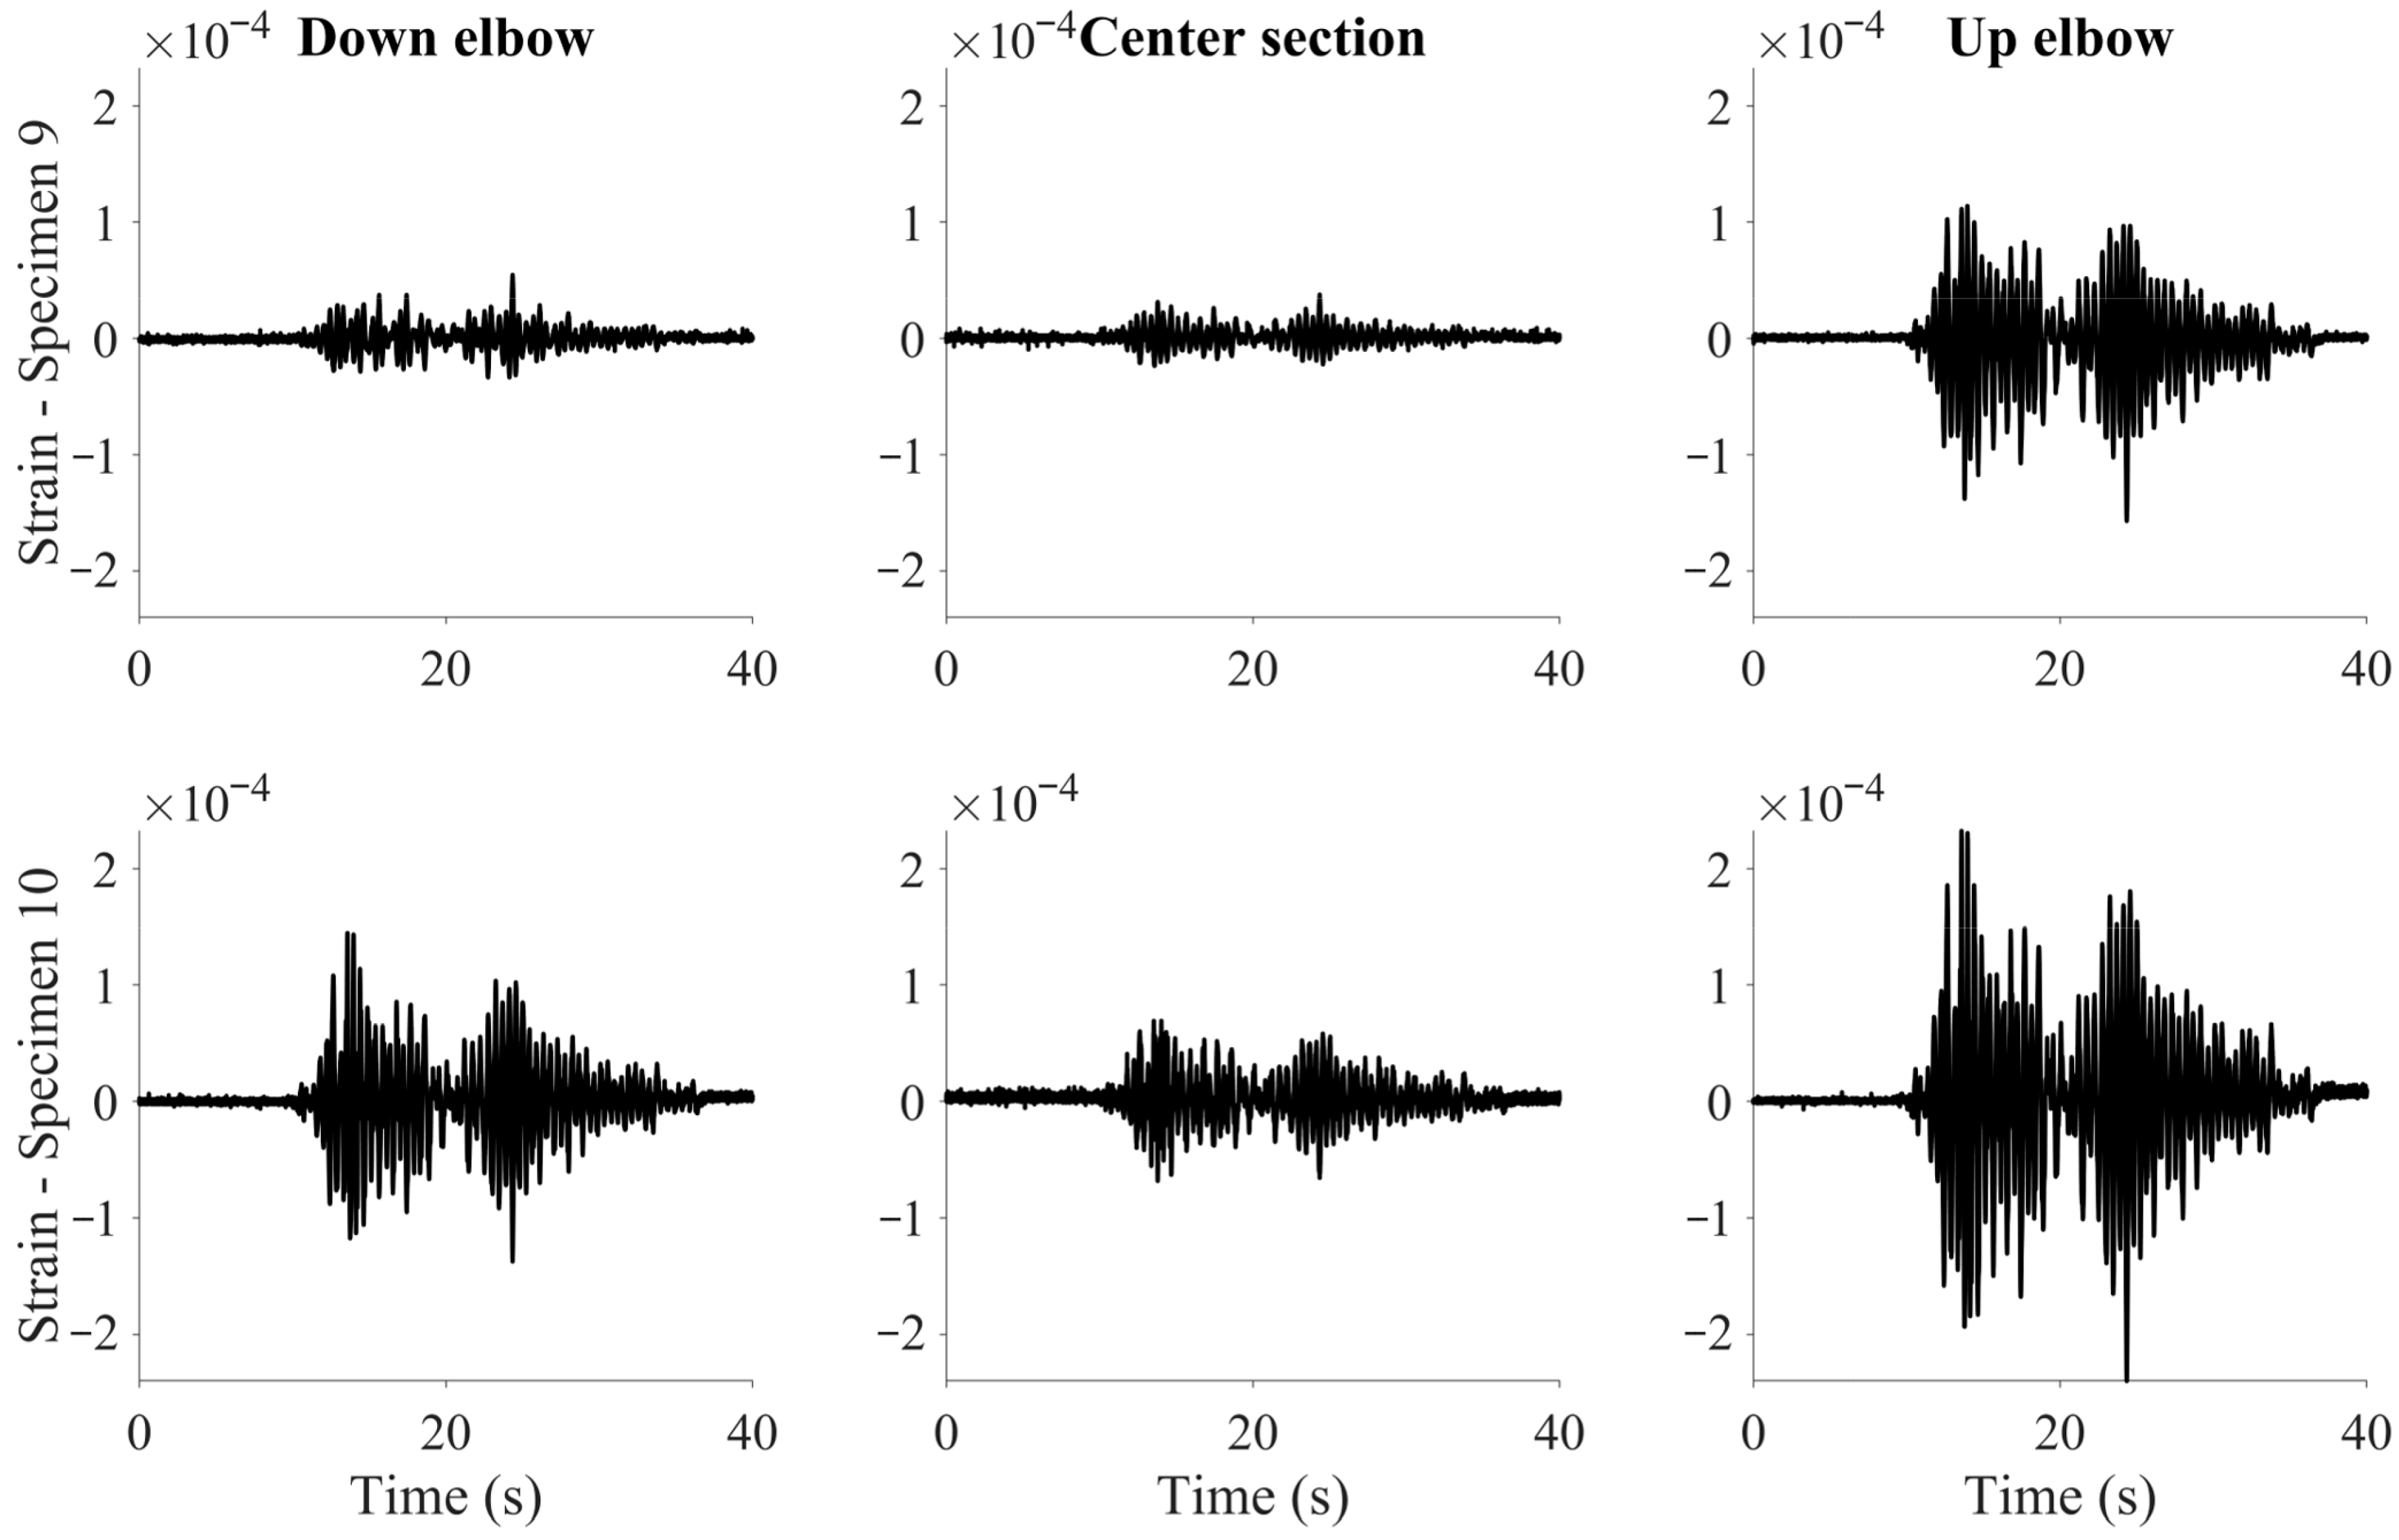
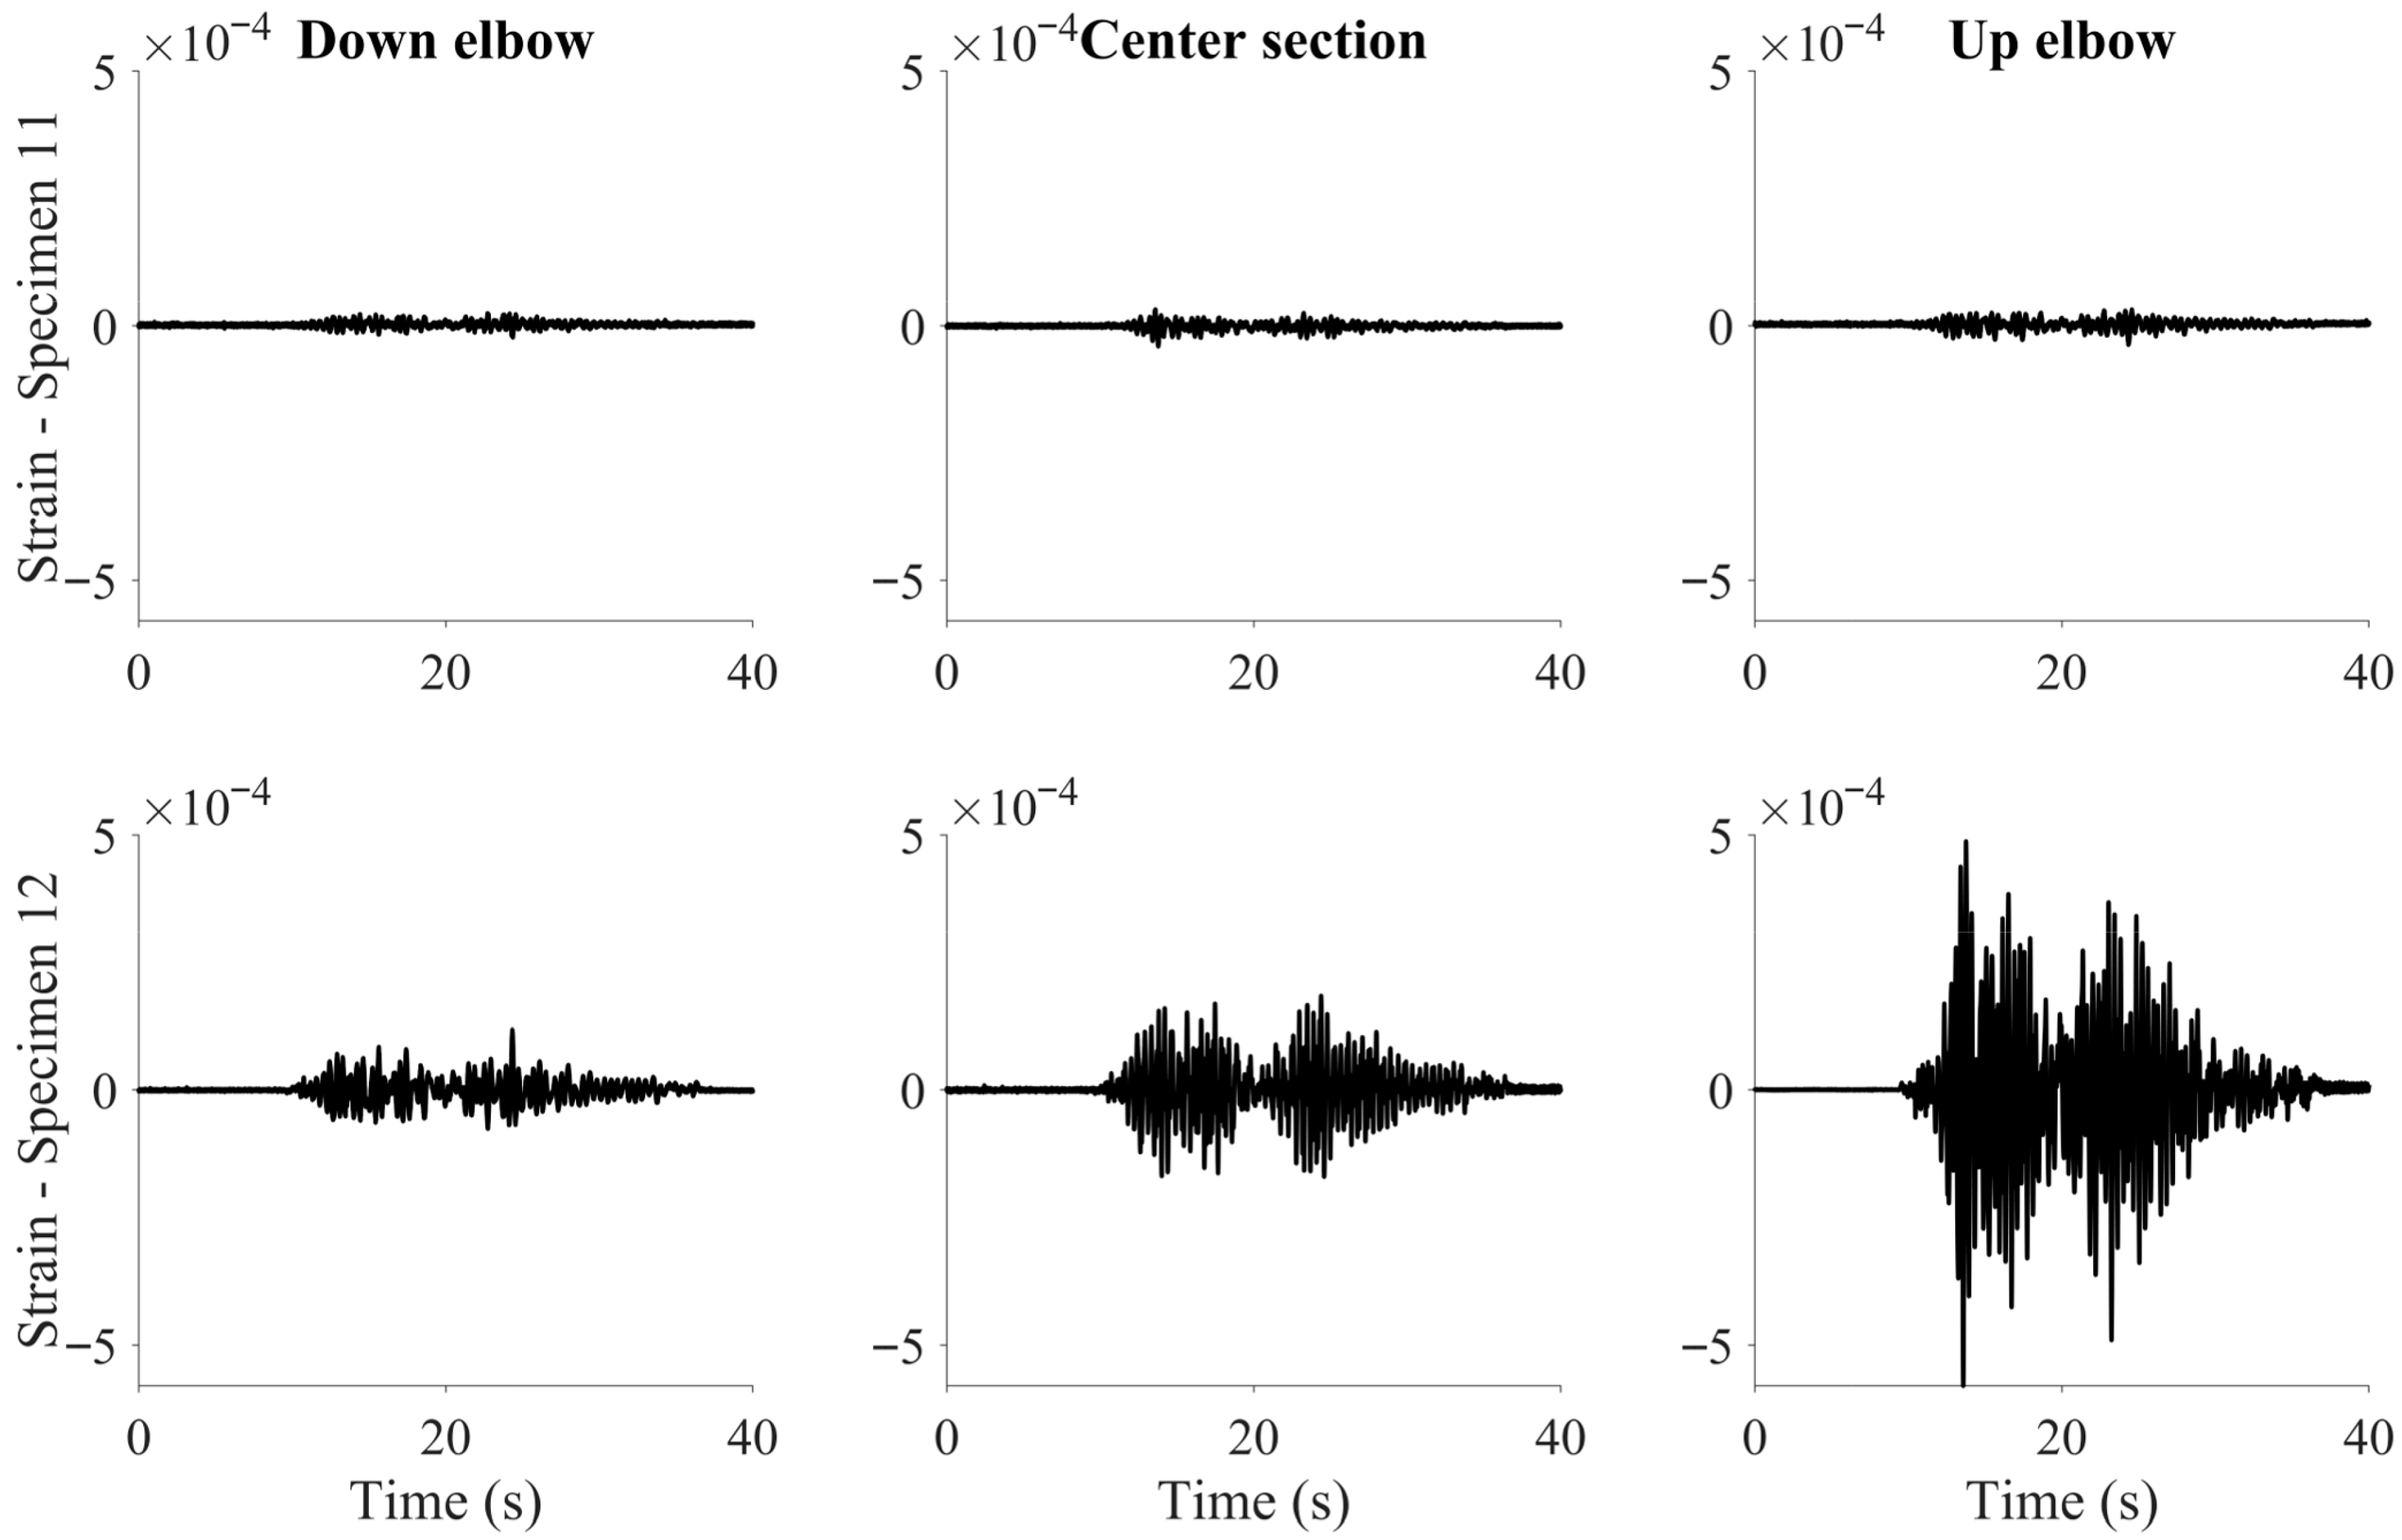
The axial strain measurements obtained with the Fiber Bragg Grating sensors corroborate the aforementioned results, showing larger deformations on the specimens equipped with flanged joints; however, the difference between specimens with the same geometrical configuration is relatively similar. It is important to highlight that specimen 12 exhibited the largest deformation, in line with the other results and with the observations during the test. As none of the shaking intensities were able to induce an inelastic response of the specimens, the strain time histories are rather similar, with just a variation in the amplitude of the response. Figure 33, Figure 34 and Figure 35 show the strain time histories of the specimens subjected to the 120% intensity level.

4. Characterization of Structural Properties

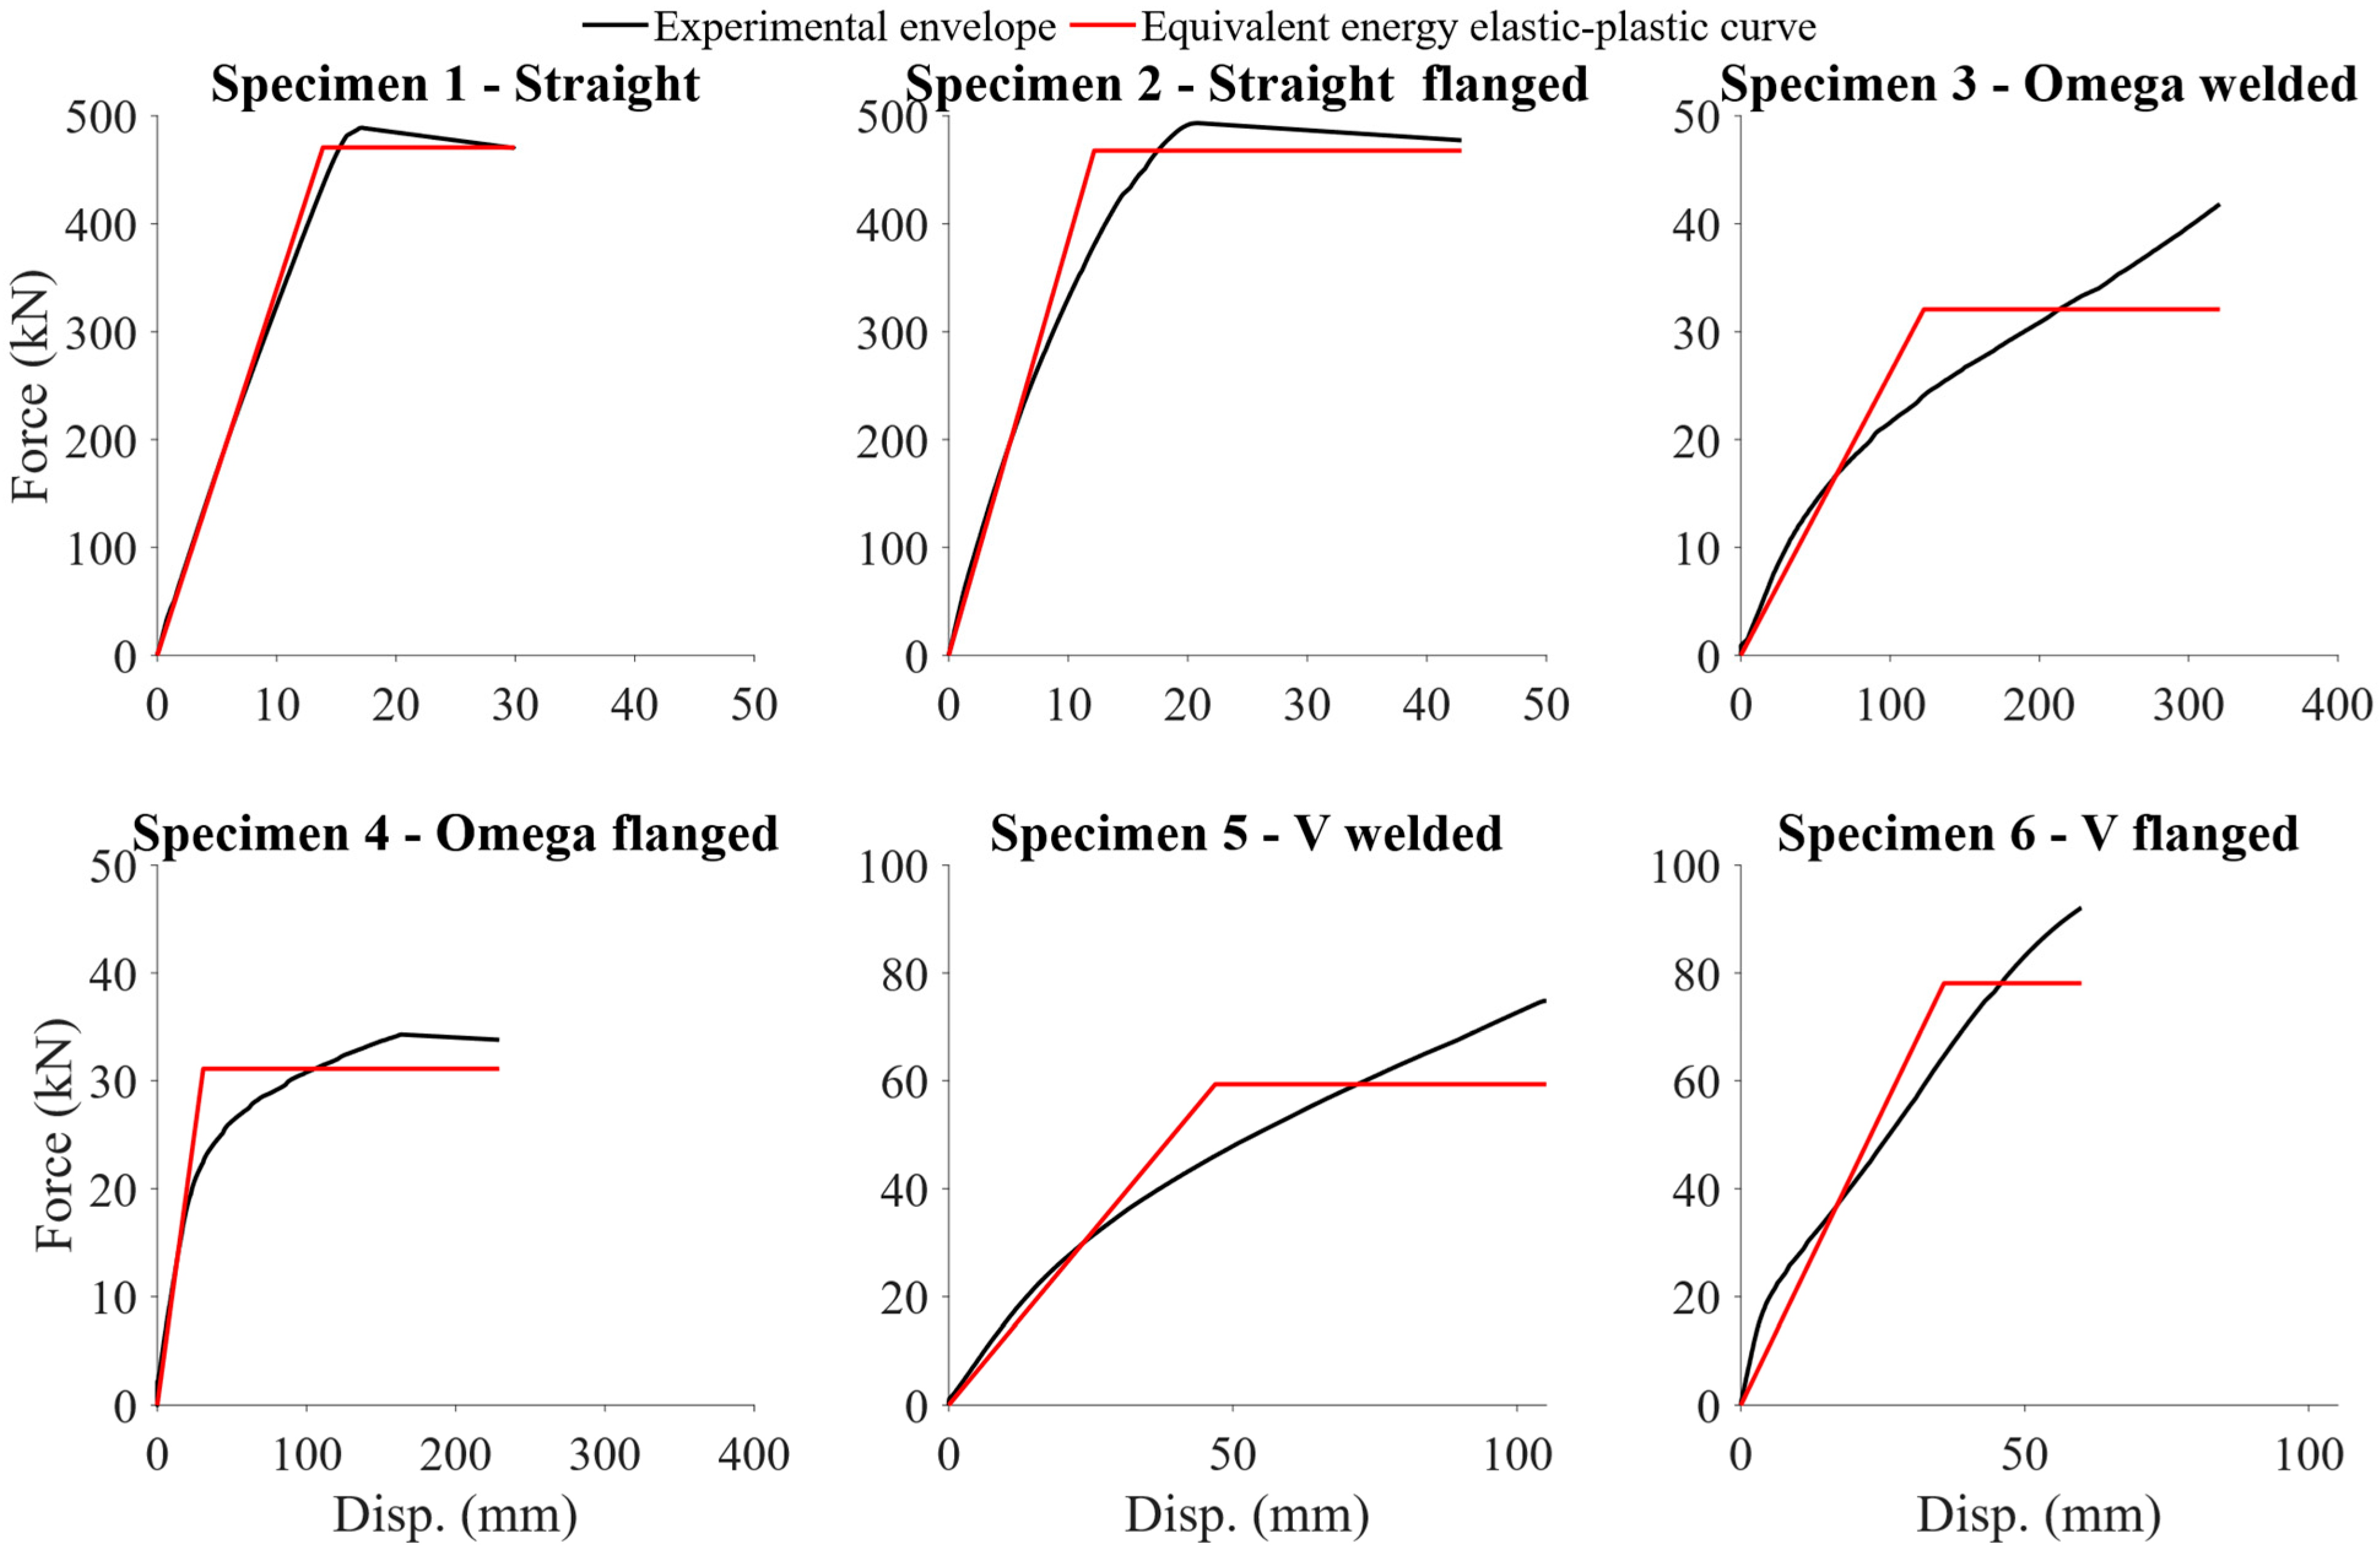
Based on the aforementioned results, several structural properties such as elastic stiffness, yield force, yield displacement, ultimate force, ultimate displacement, axial ductility, and equivalent energy elastic-plastic curve were computed for the different specimens tested under cyclic loads and actual seismic loads. Table 5 reports the structural properties, and Figure 36 shows the equivalent energy elastic-plastic curves computed from the results of the cyclic load tests. The use of different geometrical configurations (i.e., Omega and V loops) reduces the induced compression loads due to plastic elongation, reducing the possibility of reaching buckling instability. In addition, these configurations are characterized by larger flexibility, which results in larger displacements and smaller maximum forces, helping to protect the connection between the piping system and the attached components. In addition, these configurations exhibited larger yield displacements, allowing for an increased range of displacements before exhibiting inelastic behavior, and therefore, permanent damage and deformation of the pipes.

5. Conclusions

To fulfill the objective of resilient societies, it is necessary to better understand the behavior of different typologies of buildings and structures to natural and human-made hazards. In this regard, industrial plants represent an important opportunity for improvement due to their intrinsic vulnerability and significant impact after a failure. Piping systems are one of the most common and vulnerable components of an industrial plant. Due to their structural properties, diversity of geometrical and joint configurations, and interaction with other components, the seismic response of piping systems is still not well characterized, including considerable gaps in the basic principles for their proper seismic design.
This study presented the results of a comprehensive experimental campaign, in which twelve different geometrical and joint configurations of steel piping elements were subjected to cyclic axial loads and actual seismic inputs to characterize their structural properties and seismic response, allowing for the identification of critical aspects and deleterious effects. In general, it was observed that Omega loops and V loops exhibited smaller axial stiffnesses compared to that of the straight loops. This resulted in larger displacements and smaller forces, allowing for better deformation compatibility and reducing the seismic demand on the connections at the end of the piping systems. In addition, the use of welded or flanged joints also significantly modifies the overall capacity of the system. Specimens equipped with welded joints tend to exhibit larger flexibility and better strain distribution than those equipped with flanged joints. In addition, the pipe sections equipped with flanged joints show a significant local buckling phenomenon due to the abrupt changes in the section stiffness between the pipe and the flange. This local buckling leads to premature failure of the areas close to the flanges. However, it is important to note that on the straight specimens, the presence of a flanged joint at the middle span led to a reduction in the effective length of the pipe, increasing the critical load needed to reach buckling under compression loads. In this regard, it was observed that although the specimens were only subjected to positive (i.e., tension) displacements, the plastic elongation of the piping induced compression forces during the unloading phase of the load protocol. For the specimens that did not present a rupture of the connection, these induced compression loads were large enough to reach buckling instability. This behavior was corroborated by the strain time histories, registering a cumulative negative deformation as the amplitude of the input load increased. These results obtained from the cyclic axial tests highlight the importance of piping geometrical configurations flexible enough to deal with thermal- and seismic-induced deformations, protecting the components attached to them. In addition, although large displacements are not expected under design earthquake intensity conditions, special attention should be paid to the local buckling behavior observed on the flanged specimens, as it can lead to the rupture of the pipe. This deleterious behavior can be solved by using more flexible joint materials or thicker pipe elements.
Moreover, the specimens subjected to actual seismic inputs through the use of a shake table test also provided interesting results. The different geometrical loops did not significantly influence the seismic response (i.e., shear inputs) of the different specimens. However, the specimens equipped with flanged joints tend to exhibit larger seismic responses, especially in terms of accelerations, strains, and in-plane displacements, than those equipped with welded joints. This can be explained by the larger masses concentrated at the flanges, increasing the seismic response of those elements. This trend was particularly evident between specimens 11 (i.e., welded straight loops) and 12 (i.e., flanged straight loops), in which the seismic response of specimen 12 was considerably larger than that of specimen 11. In addition, it was possible to observe during the test a larger vibration of the piping elements near the flanged joints.
The results of this experimental campaign provide crucial data for the development of design recommendations and guidelines for industrial steel piping systems. Further studies should be conducted to continue characterizing the structural and seismic properties of steel piping systems, such as assessing damage limit states and loss of containment capacity.

Author Contributions

Conceptualization, B.C., G.G., E.B., D.P. and M.C.; Methodology, B.C., G.G., E.B., D.P. and M.C.; Software, B.C.; Validation, G.G., E.B. and D.P.; Formal analysis, B.C.; Investigation, B.C.; Resources, G.G.; Data curation, B.C. and M.C.; Writing—original draft, B.C.; Writing—review & editing, B.C., G.G., E.B., D.P. and M.C.; Visualization, B.C.; Supervision, G.G., E.B., D.P. and M.C.; Project administration, G.G.; Funding acquisition, G.G. All authors have read and agreed to the published version of the manuscript.

Funding

The authors gratefully acknowledge the Italian National Institute for Insurance against Accidents at Work (INAIL) for their financial contributions to the MITPLANT project through the “Bando Bric 2022” framework.

Data Availability Statement

The datasets generated during and/or analyzed during the current study are available from the corresponding author on reasonable request.

Conflicts of Interest

The authors declare no conflicts of interest.

References

  1. Campedel, M. Analysis of Major Industrial Accidents Triggered by Natural Events Reported in the Principal Available Chemical Accident Databases; OPOCE: Luxembourg, 2008; Available online: https://publications.jrc.ec.europa.eu/repository/handle/JRC42281 (accessed on 2 November 2025).
  2. Van Loenhout, J.; Below, R. Human Cost of Disasters: An Overview of the Last 20 Years 2000–2019; Centre of Research on the Epidemiology of Disasters–United Nations Office for Disaster Risk Reduction: Brussels, Belgium, 2021. [Google Scholar]
  3. Bevere, L.; Ewald, M.; Wunderlich, S. A Decade of Major Earthquakes: Lessons for Business; Swiss Re Institute: Zurich, Switzerland, 2019. [Google Scholar]
  4. Miglietta, C.; Perrone, D.; Gabbianelli, G.; Micelli, F.; Ciucci, M. Release of Hazardous Substance Due to Seismic Loads: Influence of Pipe to Tank Connection in Fragility Estimation. Chem. Eng. Trans. 2024, 111, 127–132. [Google Scholar] [CrossRef]
  5. Nascimbene, R. Vulnerability of Industrial Plant Equipment to Natural Hazards. In Management Strategies and Resilience Against NaTech Events; Cozzani, V., Paolacci, F., Eds.; CISM International Centre for Mechanical Sciences: Udine, Italy; Springer: Berlin/Heidelberg, Germany, 2025; Volume 616. [Google Scholar] [CrossRef]
  6. Vathi, M.; Karamanos, S.A.; Kapogiannis, I.A.; Spiliopoulos, K.V. Performance criteria for liquid storage tanks and piping systems subjected to seismic loading. J. Press. Vessel. Technol. 2017, 139, 051801. [Google Scholar] [CrossRef]
  7. Perrone, D.; Brunesi, E.; Filiatrault, A.; Peloso, S.; Nascimbene, R.; Beiter, C.; Piccinin, R. Seismic numerical modelling of suspended piping trapeze restraint installations based on component testing. Bull. Earthq. Eng. 2020, 18, 3247–3283. [Google Scholar] [CrossRef]
  8. Gabbianelli, G.; Rapone, A.; Milanesi, R.R.; Nascimbene, R. Impact of Far- and Near-Field Records on the Seismic Fragility of Steel Storage Tanks. Appl. Mech. 2025, 6, 24. [Google Scholar] [CrossRef]
  9. Melissianos, V.E.; Karaferis, N.D.; Bakalis, K.; Kazantzi, A.K.; Vamvatsikos, D. Operational status effect on the seismic risk assessment of oil refineries. Int. J. Disaster Risk Reduct. 2024, 113, 104842. [Google Scholar] [CrossRef]
  10. Grajales-Ortiz, C.; Melissianos, V.E.; Bakalis, K.; Kohrangi, M.; Bazzurro, P.; Vamvatsikos, D. Seismic Damage Assessment of a Crude Oil Hydrodesulphurisation Unit. Part I: Exposure and Modelling. Int. J. Disaster Risk Reduct. 2025, 124, 105519. [Google Scholar] [CrossRef]
  11. Melissianos, V.E.; Karaferis, N.D.; Bakalis, K.; Kazantzi, A.K.; Vamvatsikos, D. Hazard, exposure, fragility, and damage state homogenization of a virtual oil refinery testbed for seismic risk assessment. Earthq. Spectra 2025, 41, 547–578. [Google Scholar] [CrossRef]
  12. FEMA E-74; Reducing the Risk of Nonstructural Earthquake Damage—A Practical Guide. National Earthquake Hazard Reduction Program (NEHRP): Gaithersburg, MD, USA, 2012.
  13. Jain, S.K.; Lettis, W.R.; Murty, C.V.R.; Bardet, J.P. Bhuj, India Earthquake Reconnaissance Report. 2001. Available online: https://sudhirjain.info/INL_005.pdf (accessed on 2 November 2025).
  14. Karagiannakis, G.; Di Sarno, L.; Necci, A.; Krausmann, E. Seismic risk assessment of supporting structures and process piping for accident prevention in chemical facilities. Int. J. Disaster Risk Reduct. 2022, 69, 102748. [Google Scholar] [CrossRef]
  15. Kamel Abbasnia, S.; Shariati, M. Experimental and numerical investigation of ratcheting behavior in seamless carbon steel 90° elbow pipe with small dimensions under constant internal pressure and in-plane cyclic bending. Int. J. Press. Vessel. Pip. 2023, 204, 104974. [Google Scholar] [CrossRef]
  16. Pournara, A.E.; Karamanos, S.A. Mechanical Behavior of Steel Pipes With Local Wall Distortions Under Cyclic Loading, in: Volume 3: Design and Analysis. In Proceedings of the ASME 2012 Pressure Vessels and Piping Conference, American Society of Mechanical Engineers, Toronto, ON, Canada, 15–19 July 2012; pp. 507–513. [Google Scholar] [CrossRef]
  17. Wang, T.; Shang, Q.; Chen, X.; Li, J. Experiments and Fragility Analyses of Piping Systems Connected by Grooved Fit Joints With Large Deformability. Front. Built Environ. 2019, 5, 49. [Google Scholar] [CrossRef]
  18. Bursi, O.S.; Reza, M.S.; Abbiati, G.; Paolacci, F. Performance-based earthquake evaluation of a full-scale petrochemical piping system. J. Loss Prev. Process Ind. 2015, 33, 10–22. [Google Scholar] [CrossRef]
  19. Karamanos, S.A.; Giakoumatos, E.; Gresnigt, A.M. Nonlinear Response and Failure of Steel Elbows Under In-Plane Bending and Pressure. J. Press. Vessel Technol. 2003, 125, 393–402. [Google Scholar] [CrossRef]
  20. EN 13480-3; Metallic Industrial Piping e Part 3: Design and Calculation. British Standards Institution: London, UK, 2002.
  21. Nakamura, I.; Shibutani, T.; Kuriyama, Y.; Kasai, N. Shaking Table Test on a Piping System Model for Developing High-Quality Simulation Model. In Volume 7: Seismic Engineering; ASME Nondestructive Evaluation, Diagnosis and Prognosis (NDPD) Division; The American Society of Mechanical Engineers: New York, NY, USA, 2023. [Google Scholar] [CrossRef]
  22. Naeim, B.; Javadzade Khiavi, A.; Khajavi, E.; Taghavi Khanghah, A.R.; Asgari, A.; Taghipour, R.; Bagheri, M. Machine Learning Approaches for Fatigue Life Prediction of Steel and Feature Importance Analyses. Infrastructures 2025, 10, 295. [Google Scholar] [CrossRef]
  23. FEMA. Interim Testing Protocols for Determining the Seismic Performance Characteristics of Structural and Nonstructural Components; FEMA 461; Federal Emergency Management Agency: Washington, DC, USA, 2007. [Google Scholar]
  24. Filiatrault, A.; Perrone, D.; Brunesi, E.; Beiter, C.; Piccinin, R. Effect of cyclic loading protocols on the experimental seismic performance evaluation of suspended piping restraint installations. Int. J. Press. Vessel. Pip. 2018, 166, 61–71. [Google Scholar] [CrossRef]
  25. Menegotto, M.; Pinto, P.E. Method of Analysis of Cyclically Loaded RC Plane Frames Including Changes in Geometry and Non-Elastic Behavior of Elements Under Normal Force and Bending; Preliminary Report IABSE; IABSE: Zurich, Switzerland, 1973; Volume 13. [Google Scholar]
  26. European Committee for Standardization. Eurocode 3, Design of Steel Structures; Tech. Rep.; European Committee for Standardization: Brussels, Belgium, 2011. [Google Scholar]
  27. European Committee for Standardization. Eurocode 8, Design of Structures for Earthquake Resistance: Part 1: General Rules, Seismic actions and Rules for Buildings; Tech. Rep.; European Committee for Standardization: Brussels, Belgium, 2011. [Google Scholar]
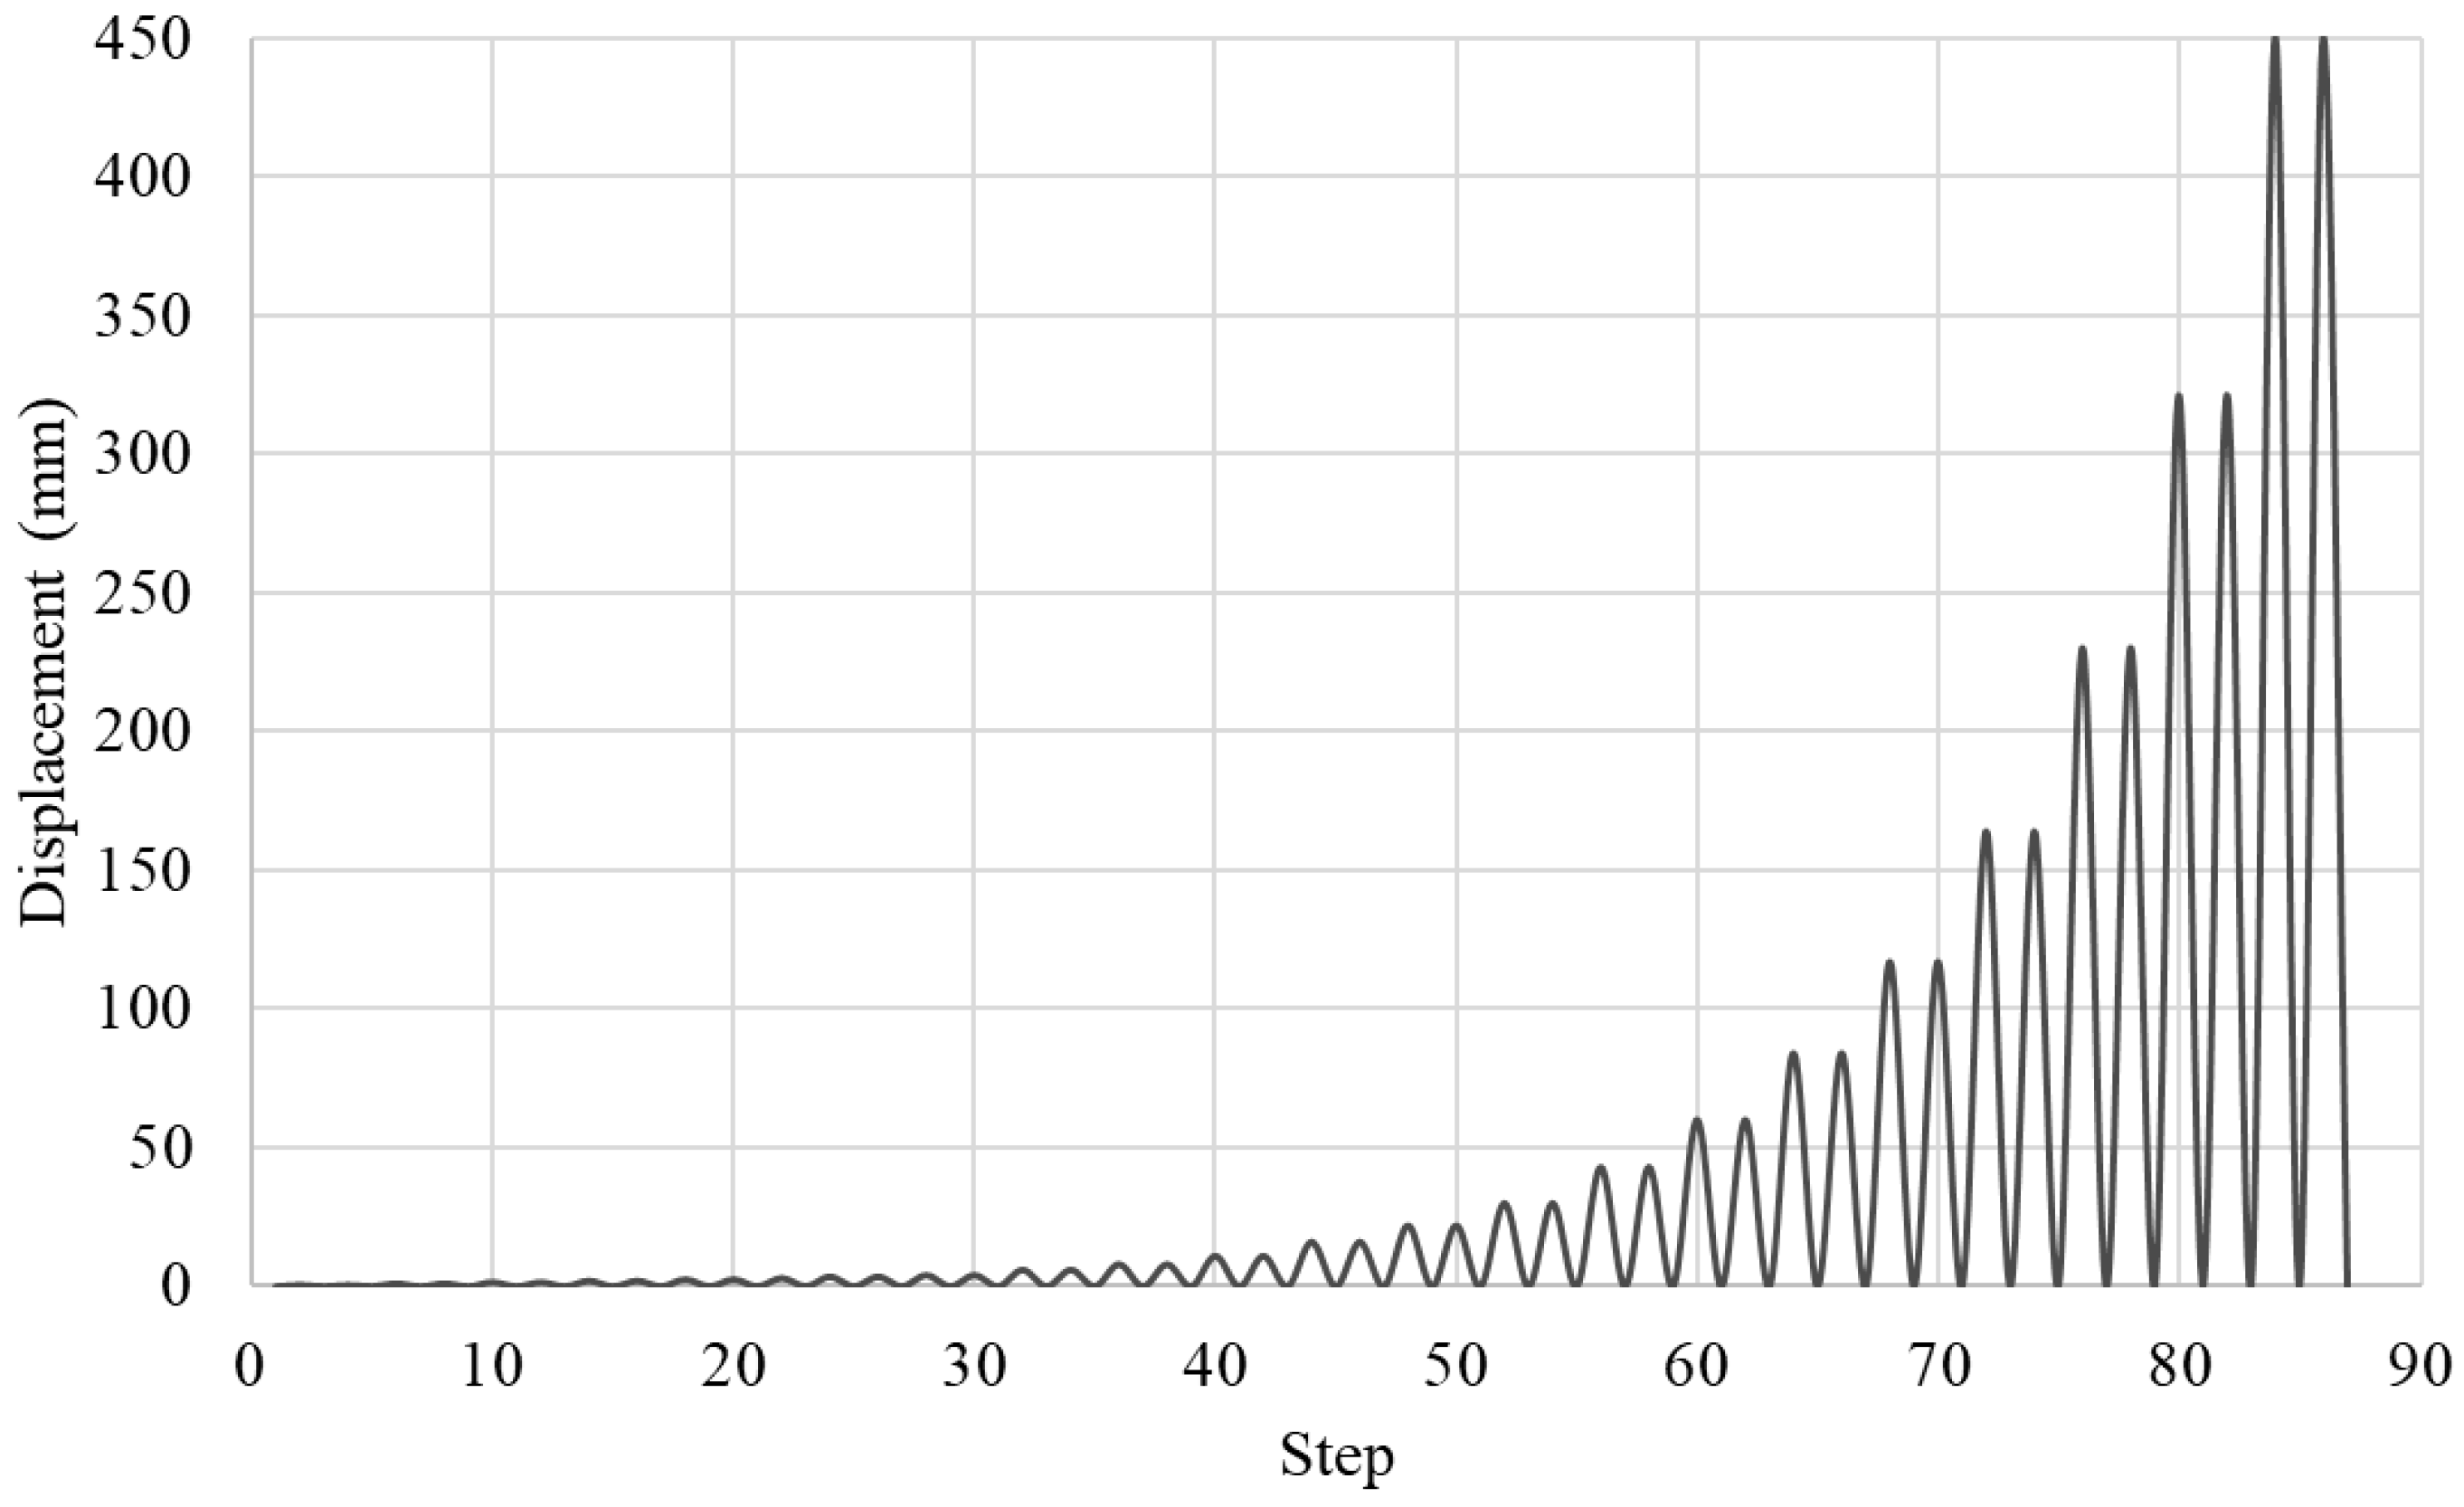
Figure 1. Cyclic axial load protocol.
Buildings 15 04197 g001
Figure 2. Cyclic test setup.
Buildings 15 04197 g002
Figure 3. Straight pipe specimens for cyclic test.
Buildings 15 04197 g003
Figure 4. Omega loop specimens for cyclic test.
Buildings 15 04197 g004
Figure 5. V loop specimens for cyclic test.
Buildings 15 04197 g005
Figure 6. Shake-table test setup.
Buildings 15 04197 g006
Figure 7. Two-story steel frame tower.
Buildings 15 04197 g007
Figure 8. Selection of the ground motion records.
Buildings 15 04197 g008
Figure 9. Seismic input and floor motions acceleration spectra.
Buildings 15 04197 g009
Figure 10. Omega loop specimens for shake table test.
Buildings 15 04197 g010
Figure 11. V loop specimens for shake table test.
Buildings 15 04197 g011
Figure 12. Straight pipes loop specimens for shake table test.
Buildings 15 04197 g012
Figure 13. Test setup of specimens 1 (i.e., straight) and 2 (i.e., flanged joint).
Buildings 15 04197 g013
Figure 14. Hysteresis curves of specimens 1 and 2 subjected to the cyclic axial load protocol.
Buildings 15 04197 g014
Figure 15. Strain time-histories of specimens 1 and 2 obtained with the Fiber Bragg Grating sensors.
Buildings 15 04197 g015
Figure 16. Stress distributions and the deformed shape of the numerical model of the straight configuration.
Buildings 15 04197 g016
Figure 17. Test setup of specimens 3 (i.e., welded Omega loop) and 4 (i.e., flanged Omega loop).
Buildings 15 04197 g017
Figure 18. Hysteresis curves of specimens 3 and 4 subjected to the cyclic axial load protocol.
Buildings 15 04197 g018
Figure 19. Strain time histories of specimen 4 obtained with the Fiber Bragg Grating sensors.
Buildings 15 04197 g019
Figure 20. Stress distributions and deformed shape of the numerical model of the Omega loop configuration.
Buildings 15 04197 g020
Figure 21. Final state of specimens 3 and 4.
Buildings 15 04197 g021
Figure 22. Test setup of specimens 5 (i.e., welded V loop) and 6 (i.e., flanged V loop).
Buildings 15 04197 g022
Figure 23. Hysteresis curves of specimens 5 and 6 subjected to the cyclic axial load protocol.
Buildings 15 04197 g023
Figure 24. Stress distributions and deformed shape of the numerical model of the V loop configuration.
Buildings 15 04197 g024
Figure 25. Final state of specimens 5 and 6.
Buildings 15 04197 g025
Figure 26. Shake table test setup with different specimens.
Buildings 15 04197 g026
Figure 27. Example of the accelerometer’s placement.
Buildings 15 04197 g027
Figure 28. Acceleration response time history of specimens 7 and 8 (Omega loop).
Buildings 15 04197 g028
Figure 29. Acceleration response time history of specimens 9 and 10 (V loop).
Buildings 15 04197 g029
Figure 30. Acceleration response time history of specimens 11 and 12 (Straight loop).
Buildings 15 04197 g030
Figure 31. Example of the potentiometer’s placement.
Buildings 15 04197 g031
Figure 32. In-plane relative displacement response time histories of the 100% intensity level.
Buildings 15 04197 g032
Figure 33. Strain time history of specimens 7 and 8 (Omega loop).
Buildings 15 04197 g033
Figure 34. Strain time history of specimens 9 and 10 (V loop).
Buildings 15 04197 g034
Figure 35. Strain time history of specimens 11 and 12 (Straight loop).
Buildings 15 04197 g035
Figure 36. Experimental envelope curve and equivalent energy elastic-plastic curve of the specimens subjected to the cyclic axial loads.
Buildings 15 04197 g036
Table 1. Pipe section properties.
PipeOuter DiameterThicknessAreaMoment of InertiaRadius of GyrationYield StrengthOuter
Diameter
ThicknessArea
mmmmcm2cm4mmMPammmmcm2
CHS 114.3 × 3.6114.33.615.52191.9839.2235114.33.615.52
Table 2. Fundamental periods of the pipe specimens computed after the 10% and 140% shake intensity tests.
PipeSpecimenPeriods (s) at 10% IntensityPeriods (s) at 140% Intensity
Welded Omega loop 0.06660.0680
70.03500.0353
0.02360.0237
Flanged Omega loop 0.10790.1129
80.06200.0629
0.02360.0236
0.05570.0565
Welded V loop90.02950.0299
0.02360.0235
0.09780.0992
Flanged V loop100.04940.0498
0.02060.0208
0.08300.0835
Welded straight loop110.05940.0596
0.03410.0346
Flanged straight loop 0.12760.1285
120.08300.0835
0.05940.0596
Table 3. Peak absolute accelerations recorded at the center of each pipe specimen under the 100% shake intensity test.
PipeSpecimenPeak Absolute Acceleration (g)
In-Plane (x) AxisOut-of-Plane (y) AxisVertical (z) Axis
Welded Omega loop71.752.010.29
Flanged Omega loop82.842.790.50
Welded V loop91.411.720.33
Flanged V loop101.822.250.47
Welded straight loop112.001.501.02
Flanged straight loop123.092.401.41
Table 4. Maximum relative in-plane displacement at the middle height span under the 100% shake intensity test.
PipeSpecimenPeak Relative in-Plane Displacement (mm)
10% Intensity50% Intensity100% Intensity140% Intensity
Welded Omega loop70.130.602.855.93
Flanged Omega loop81.746.9114.9922.44
Welded V loop90.995.2211.2016.14
Flanged V loop101.467.1013.6619.97
Welded straight loop111.757.0413.9019.10
Flanged straight loop123.428.8417.2925.01
Table 5. Structural properties of the different configurations obtained from the cyclic tests.
PropertySpecimen 1Specimen 2Specimen 3Specimen 4Specimen 5Specimen 6
StraightStraight FlangedOmega WeldedOmega FlangedV WeldedV Flanged
Elastic stiffness (kN/mm)33.9338.420.261.011.272.18
Yield force (kN)470.79467.8332.0831.1259.3778.11
Yield displacement (mm)13.8812.18122.6630.8246.9235.79
Ultimate force (kN)488.93493.3241.8134.2874.8192.08
Ultimate displacement (mm)29.9442.97321.22230.16105.1660.04
Axial ductility2.163.532.627.472.241.68
Disclaimer/Publisher’s Note: The statements, opinions and data contained in all publications are solely those of the individual author(s) and contributor(s) and not of MDPI and/or the editor(s). MDPI and/or the editor(s) disclaim responsibility for any injury to people or property resulting from any ideas, methods, instructions or products referred to in the content.