Article

Numerical and Experimental Investigation on Time-Dependent Crack Extension in Concrete Under Sustained Loads

1
School of International Education, Jilin Jianzhu University, Changchun 130118, China
2
Changzhou University Huaide College, Jingjiang 214500, China
3
Department of Mechanical Engineering, The University of Western Australia, Perth, WA 6009, Australia
4
School of Civil Engineering, Jilin Jianzhu University, Changchun 130118, China
*
Author to whom correspondence should be addressed.
Buildings 2025, 15(22), 4180; https://doi.org/10.3390/buildings15224180
Submission received: 28 September 2025 / Revised: 24 October 2025 / Accepted: 2 November 2025 / Published: 19 November 2025

Abstract

For concrete structures dominated by fracture failure, e.g., containment and gravity dams, sustained load deformations primarily arise from crack extension and concrete viscoelasticity. As cracks progressively grow under sustained loads, accurate prediction of the time-dependent fracture process in concrete accounting for crack-viscoelasticity interactions are crucial for the stability and safe design of concrete structures. This paper presents an initial fracture toughness ( K IC i n i )-based numerical model to predict the time-dependent crack extension in concrete under sustained loads. The model integrates a time-dependent tension-softening constitutive relation, the generalized Kelvin chain model for viscoelastic behavior and K IC i n i -based criterion for crack extension. The accuracy of the model was verified with two sets of experimental data available in the literature. The results indicated that the tension-softening constitutive law that quantifies the relation cohesive stress (sw), loading time (t), and COD can be successfully implemented in the numerical model. The predicted CMOD versus time and crack length versus time curves show good agreements with the test results regardless of loading level, specimen configuration and material property, demonstrating the predictive capability of the model in describing the crack extension in concrete exposed to sustained loads.

1. Introduction

For concrete structures dominated by fracture failure, such as concrete containment and gravity dams, sustained load deformations primarily arise from crack extension and concrete viscoelasticity. To mitigate concrete cracking, containment structures are frequently equipped with prestressing systems, which are designed to maintain compressive stresses in the concrete throughout its service life, counteracting the tensile stresses resulting from design-basis pressures. However, time-dependent factors, such as concrete creep under sustained loads, lead to crack extension in concrete and hence gradual reductions in both the compressive stresses of concrete and the leak-tightness and overall safety of containment structures under accident conditions [1,2,3]. Therefore, it is desirable to evaluate the time-dependent crack growth in concrete under sustained loads.
To date, quasi-static fracture tests have been widely conducted on creep 3-p-b beams for evaluating the influence of sustained loads on fracture parameters of concrete. It was found that the peak load Pmax and fracture energy GF were increased after sustained loads, which can be attributable to the compression zone’s reinforcement effect within the ligament. Moreover, acoustic emission monitoring revealed a reduced fracture process zone (FPZ) length and heightened material brittleness [4]. In contrast, Omar et al. [5] observed no variations in Pmax but an elevated GF. Dong et al. [6,7,8] found that upon reaching the initial cracking load Pini, the sustained load condition led to significant enhancement in both the critical crack growth length and measured unstable fracture toughness, while the FPZ length monitored via digital image correlation (DIC) decreased. Rong et al. [9] identified a size effect that the sustained loads amplified Pini and K IC i n i , with enhancement positively correlated to specimen size. With the consideration of stress relaxation, the fracture toughness remained unchanged and therefore should be considered as inherent material parameters [10]. Similarly, creep tests on the rock-concrete interface by Dong et al. [10,11] and Yuan et al. [12,13,14] showed heightened Pini and Pmax and increased interface brittleness.
It has been accepted that concrete fracture exhibits significant nonlinearity due to strain softening, and this can be effectively described by the fictitious crack model (FCM) [15]. As known, the FCM incorporates a tension-softening constitutive model within the FPZ, represented as a relationship between cohesive stress (sw) and crack opening displacement (COD). Recently, advancing numerical methods, e.g., the finite element method (FEM), have expanded FCM application to nonlinear structural analysis, where the accuracy of the σw curve critically influences the validity of the numerical result. Thus, developing precise tension-softening constitutive models is essential for analyzing time-dependent fracture behaviors of concrete. Han et al. [16,17] developed a constitutive model characterizing strain-softening behavior under sustained loads, employing regression analysis to quantify the interrelationships among sw, COD, and loading duration. Under static conditions, Omar et al. [18] performed experimental tests after 60-day sustained loads at 30% and 60% levels, reporting no significant changes in Pmax or GF. Dong et al. [6,7] applied sustained loads (30% of Pmax and Pini) for 115 days, deriving post-loading tension-softening relationships via the J-integral method. At 30% load, cracks did not propagate, such that the FPZ evolution and constitutive relationships were unaffected. At Pini, crack extension occurred, significantly increasing the complete FPZ length while reducing the critical COD when sw = 0. Dong et al. [10] confirmed that after 30-day sustained loads at 30% and 60% levels, both Pini and Pmax increased substantially, whereas the GF, critical crack extension length, and initial and unstable fracture toughnesses were insensitive to sustained loads.
Under high levels of sustained loads, cracks in concrete exhibit progressive propagation accompanied by viscoelastic creep deformation. To clarify the relationship between sw and loading duration during creep fracture, Santhikumar et al. [19] coupled tension-softening behavior with viscoelastic properties through Kelvin chain and micromechanical frameworks, formulating constitutive models for concrete under sustained loads. Zhou [20] conducted 1 h stress relaxation tests on direct-tension cylindrical specimens to experimentally determine the time-dependent degradation law of sw, establishing the time-dependent cohesive stress relaxation curves across varying initial stress levels. These curves were subsequently integrated with the fictitious crack model to develop a tension-softening constitutive relationship for sustained loads. Based on Zhou [20]’s work, Li et al. [21] incorporated the tension-softening curve with K IC i n i -based criterion to estimate crack extension in 3-p-b beams subjected to sustained loads. Recently, Yuan et al. [22] applied a generalized Maxwell model to forecast long-term cohesive stress relaxation and analyzed interfacial crack extension in rock-concrete composites using an energy-based fracture criterion.
Within the framework of the fictitious crack model, four primary criteria are frequently employed for crack extension analysis: stress-based, strain-based, energy-based, and stress intensity factor (SIF, K)-based approaches. Among these, the SIF-based approach has been widely used, typically establishing equilibrium by equating the SIF attributable to applied loads ( K IC P ) with that arising from cohesive stresses ( K IC σ ). However, a divergence exists in how the disparity between K IC P and K IC σ is interpreted within SIF-based frameworks. One prominent interpretation is the nil-SIF criterion, which indicates that the mode I SIF (KI) vanishes at the tip of the FPZ, expressed mathematically as K IC P K IC σ = K I 0 . Initially conceived for mode I crack extension [23], this criterion was subsequently applied to analyze fiber-reinforced mortar [24] and then extended to characterizing the crack extension at the rock-concrete interfaces [25]. Following these applications, the nil-SIF criterion was further adapted for mixed-mode I-II fracture analysis in concrete [26,27,28].
Conversely, certain researchers claim that the relationship between the SIFs at the crack tip reflects the interplay between the crack-driving force, which tends to propagate the crack, and the cohesive forces, which act to resist this propagation. This criterion is known as the initial-fracture toughness ( K IC i n i )-based criterion and has been utilized to simulate the mode I crack extension in cementitious materials such as concrete [29,30,31], rock [32,33,34], as well as rock-concrete interfaces [35]. The K IC i n i -based crack extension criterion is mathematically articulated as K IC P K IC σ = K IC i n i , where K IC P and K IC σ denote the SIFs attributable to applied loads and cohesive forces, respectively. Based on the finite element modeling (FEM) analysis, a series of comparative studies have been conducted to demonstrate the predictive performance obtained from different SIF-based criteria in reproducing crack extension in concrete [36,37,38]. It was confirmed that the difference between the numerical results derived from these two criteria became more significant for low temperatures and higher strength concrete, which was mainly due to larger K IC i n i values.
To date, previous investigations have comprehensively addressed three critical factors governing time-dependent crack extension in concrete: (i) crack initiation criteria, (ii) crack initiation and propagation, and (iii) viscoelastic behavior. Recently, Han et al. [16] formulated a tension-softening constitutive model that quantifies the interrelationships among sw, loading duration, and COD during sustained loading processes. Nevertheless, the incorporation of the tension-softening law into finite element analysis (FEA) for simulating crack extension trajectories in concrete remains unexplored and has not been experimentally verified. Moreover, while the effectiveness of the K IC i n i -based criterion in the prediction of crack extension under static loads has been reported elsewhere, research on the predictive accuracy of this criterion in modeling concrete fracture under sustained loads remains limited.
Against this background, this study aims to develop a numerical model for predicting the complete time-dependent crack extension process of concrete subjected to sustained loads. The proposed model integrates the time-dependent tension-softening constitutive law and the K IC i n i -based crack extension criterion. Finally, the proposed model is verified through comparison with two sets of experimental results from the literature, considering different load levels and specimen dimensions. The primary novelty of this study is the development of a finite element (FE) model that integrates an K IC i n i -based crack propagation criterion with a time-dependent tension-softening constitutive relation to capture the creep-induced cohesive stress degradation. A further contribution is the comprehensive validation of this model, achieved through comparison with both our own experimental results and extensive creep fracture data for concrete and rock-concrete interfaces available in the literature.

2. Numerical Modeling

This section presents a finite element (FE) analysis to simulate crack propagation in concrete under sustained loads. The crack propagation criterion proposed by Wu et al. [29], which is based on the initial fracture toughness ( K Ic ini ), is adopted as detailed in Section 2.1. Section 2.2 derives a tension-softening constitutive model for sustained loads, establishing the relation among the cohesive stress, the COD, and the loading time t. Finally, based on the K Ic ini -based criterion and the proposed tension-softening model, an FE model for complete time-dependent crack extension in concrete under sustained loads is developed in Section 2.3.

2.1. Based Criterion

In modeling concrete fracture, the SIF at the crack tip is of utmost importance in the evaluation of crack extension in concrete since it determines if cracks will propagate. According to the K IC i n i -based criterion [29], the cohesive toughening effect can be incorporated into the crack extension analysis with the following equation:
K IC tip = K IC i n i = K IC P K IC σ
In Equation (1), K IC tip denotes the SIF at the crack tip; K IC P represents the SIF induced by the external load; K IC σ stands for the SIF caused by the sw; a, Da, and a0 refer to the crack length, increment crack length, and initial crack length, respectively. Comparing with the nil-K-based criterion where the crack propagates when the SIF at the crack tip equals zero, the K IC i n i -based crack extension criterion considers the inherent toughness against crack extension. In general, this criterion can be mathematically presented as follows:
K IC P a K IC σ Δ a < K IC i n i ,   crack   does   not   propagate
K IC P a K IC σ Δ a = K IC i n i ,   crack   is   under   critical   stage
K IC P a K IC σ Δ a > K IC i n i ,   crack   begins   to   extend
As the external load increases, a crack extension length of Δa forms along the ligament. Crack growth appears once the crack-tip SIF (i.e., difference between K IC P and K IC σ exceeds K IC i n i [see Equation (4)]. This nonlinear crack extension process stems from competition between external load-induced and cohesive-induced SIFs. The fracture energy (GF) is an important parameter in determining the tension-softening constitutive relationship of concrete under static fracture tests. For 3-p-b beam specimens, GF can be calculated using the following equation:
G F = W 0 + m g δ max B D a 0
where W0 is the area under the load–displacement (P-δ) curve; δmax is the loading-point displacement at failure; mg is the self-weight of the specimen between the supports; B is the beam width; D is the beam height; and a0 is the initial crack length.

2.2. Derivation of Time-Dependent Tension-Softening Constitutive Law [16]

To characterize the time-dependent crack extension behavior, the energy dissipation during creep deformation must be accounted for under sustained loads. Han et al. [16] formulated a tension-softening constitutive model that quantifies the interrelationships among sw, loading duration, and COD during sustained loading processes. In 3-p-b creep fracture tests conducted at various load levels, all external work is consumed by viscoelastic deformation, comprising both elastic and creep components. Figure 1 illustrates the schematic deflection versus time (δ-t) and load versus deflection (P-δ) curves, where δel and δcr denote the elastic and creep deformations, respectively, such that the total deformation is δ = δel + δcr. Upon unloading at time t1, a portion of deformation (approximately equal to δel) is immediately recovered. Let W represent the work exerted by the external force and We the elastic strain energy of the creep specimen, the energy (Wc) dissipated by creep deformation is then given by:
W c = W W e
Let S represent the load level and t the loading time, the relationship between Wc, t, and S can expressed by:
W c = 0.04 t 0.32 · 65.57 S 1.32 = 2.62 S 1.32 t 0.32
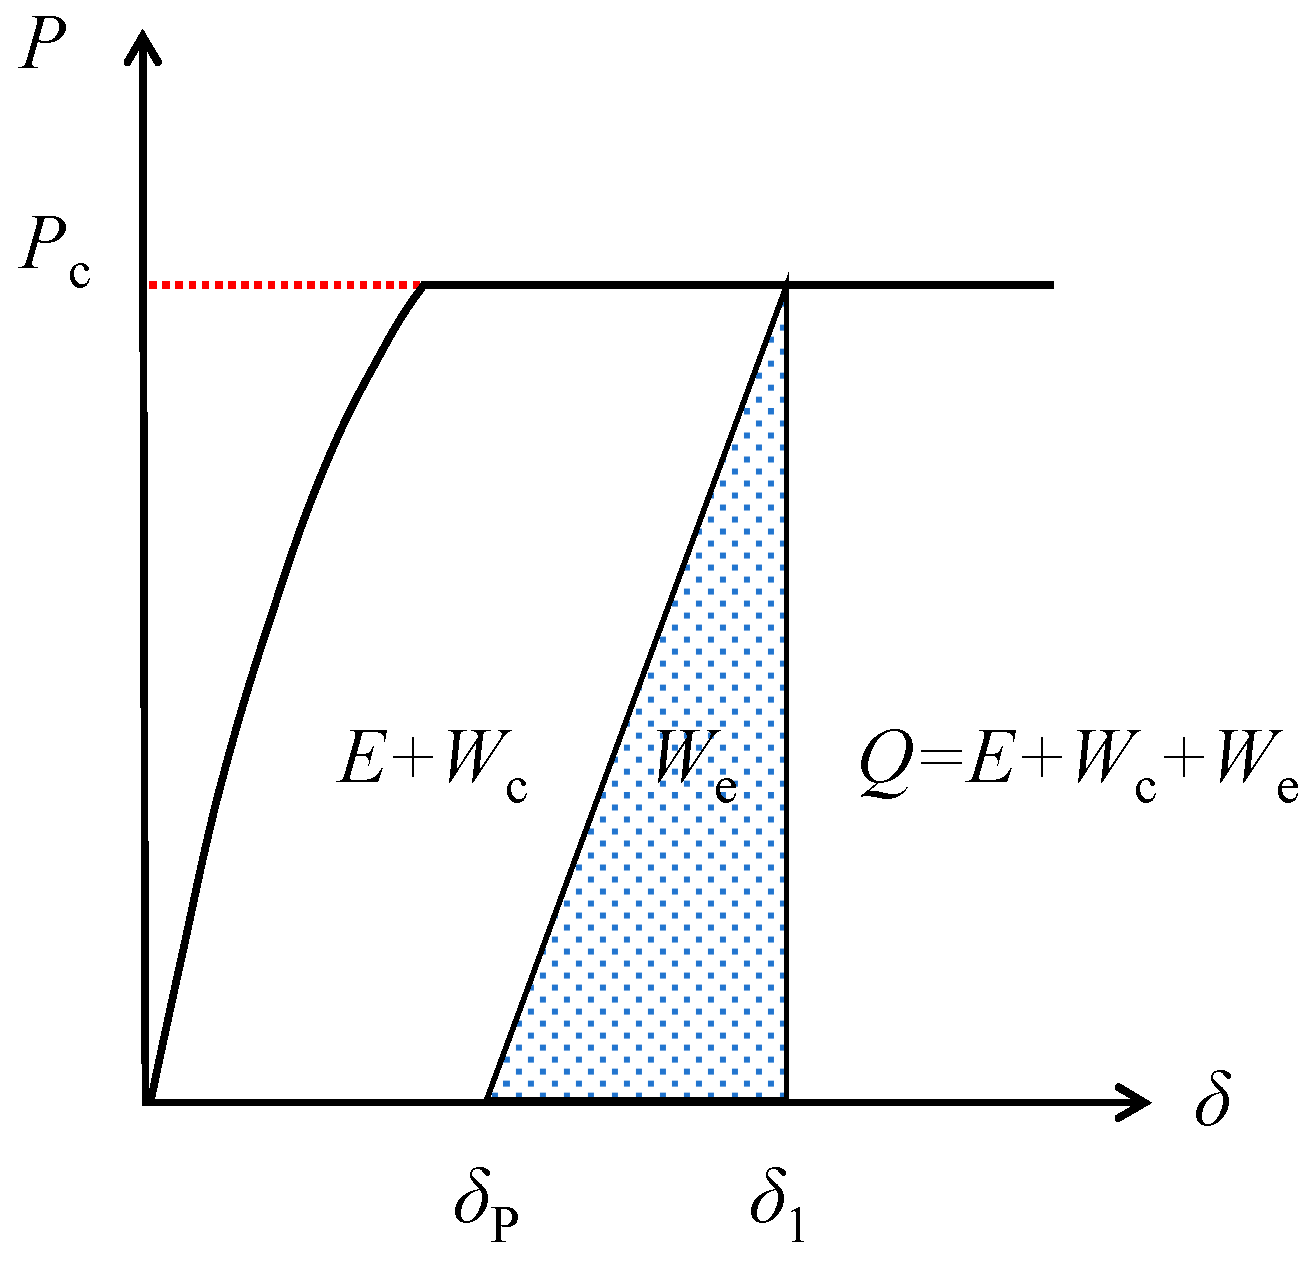
In 3-p-b creep tests under sustained loads of 75% to 90% Pini, the external work (Q) comprises energy for elastic deformation (We), creep deformation (Wc), and crack extension (E). The P-δ response features a linear unloading path, as depicted in Figure 2.
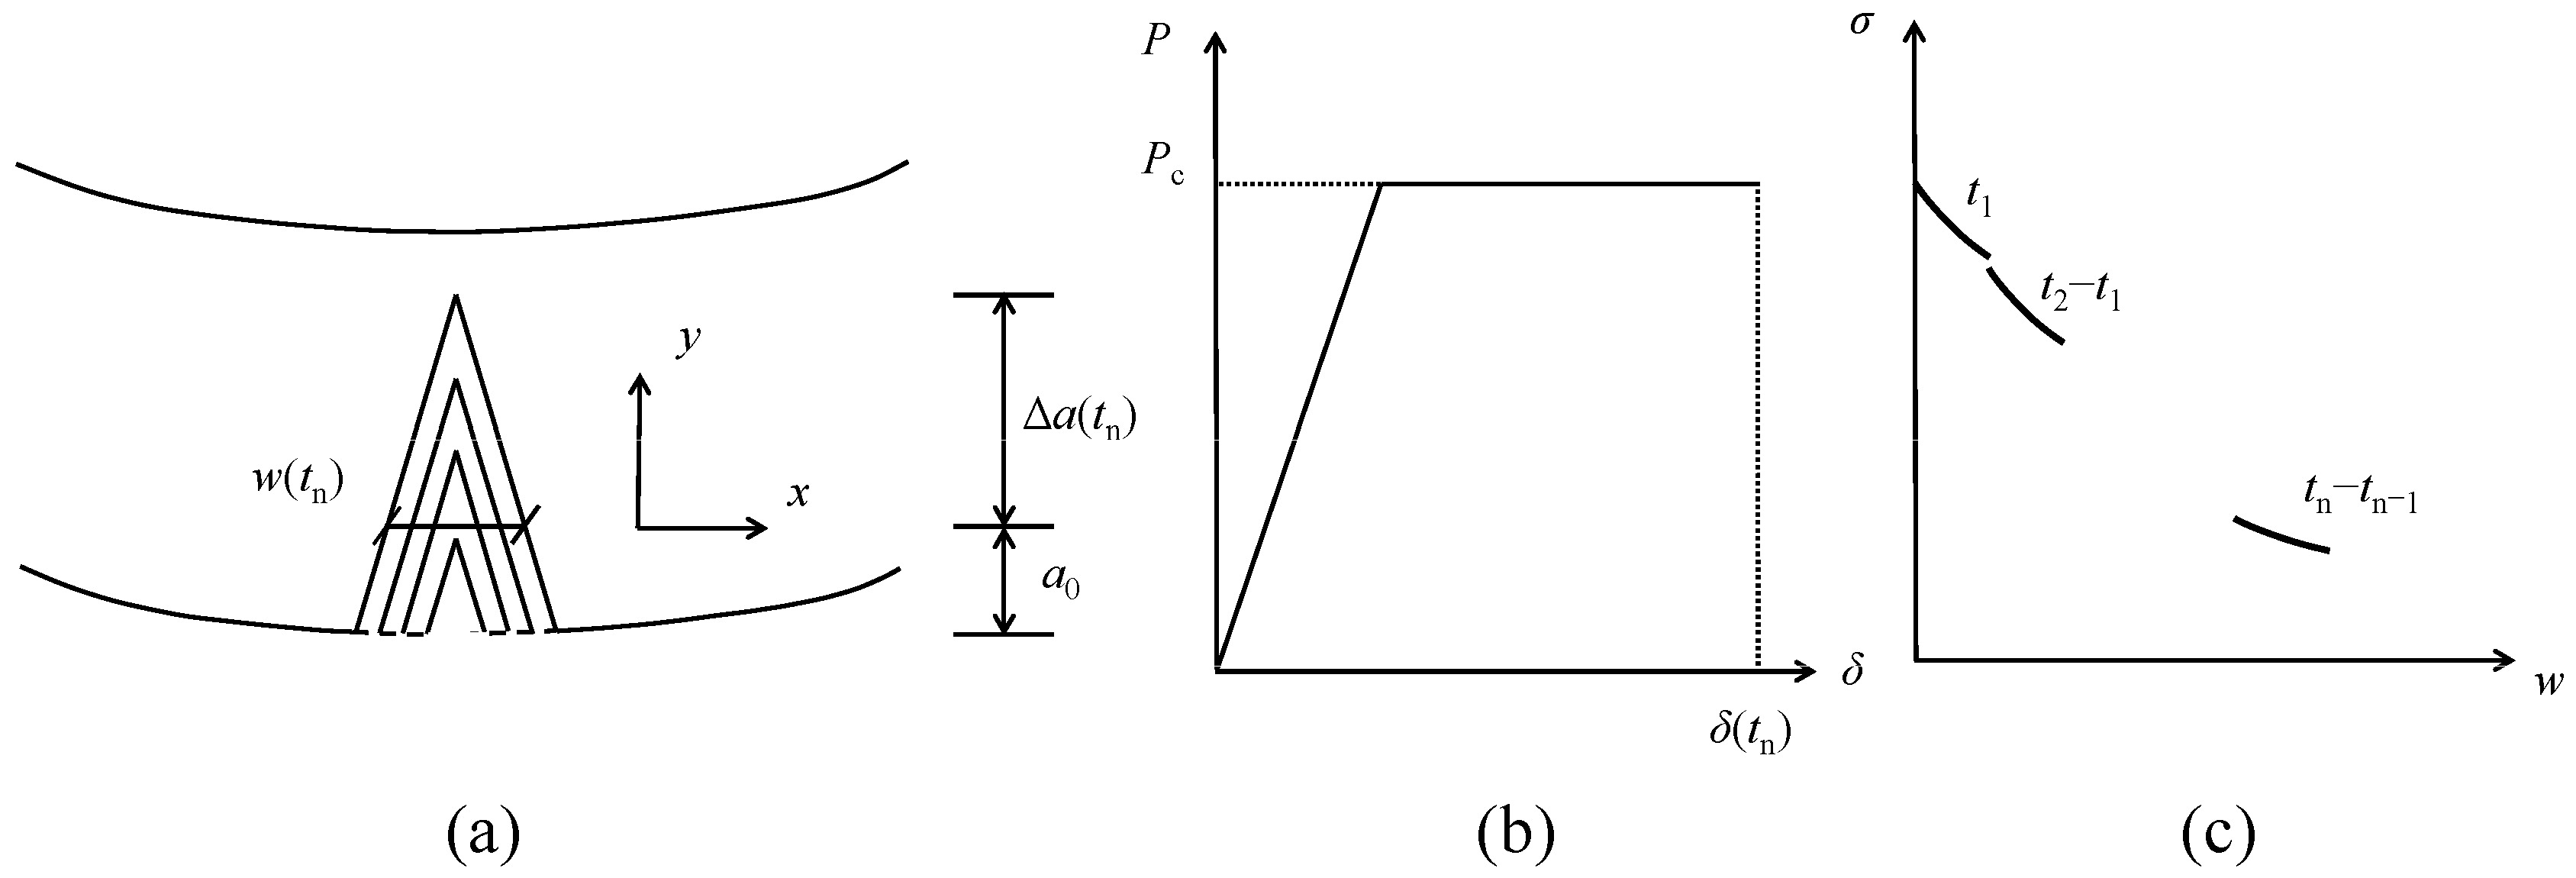
The fracture process is divided into N segments (Figure 3), with sw contributing equally to crack extension energy in each segment, yielding:
E = B [ 0 Δ a ( t 1 ) e ( t n , x ) d y + Δ a ( t 1 ) Δ a ( t 2 ) e ( t n 1 , x ) d y + + Δ a ( t i 1 ) Δ a ( t i ) e ( t n i , x ) d y + + Δ a ( t n 1 ) Δ a ( t n ) e ( t 1 , x ) d y ]
In Equation (8), B is the beam width and e t n , w ( t n ) denotes the energy per unit area consumed to crack growth at the time tn and can be obtained as:
e t n , w ( t n ) = 0 w ( t 1 ) σ ( t 1 , x ) d x + w ( t 1 ) w ( t 2 ) σ ( t 2 , x ) d x + + w ( t i 1 ) w ( t i ) σ ( t i , x ) d x + + w ( t n 1 ) w ( t n ) σ ( t n , x ) d x
Consider the geometric relationship in Figure 3 and differentiating it with respect to w gives:
d y = Δ a ( t i ) w ( t i ) d x
Substituting Equation (10) into Equation (8) and assuming N w = E w ( t n ) / B Δ a ( t n ) , it follows that:
[ N ( w ) ] = e t n , w ( t n ) e t n , w 1 Δ a ( t 1 ) Δ a ( t n ) 1 Δ a ( t 1 ) Δ a ( t n ) + e t n 1 , w 1 Δ a ( t 1 ) Δ a ( t n ) 1 Δ a ( t 1 ) Δ a ( t n ) e t n 1 , w 1 Δ a ( t 2 ) Δ a ( t n ) 1 Δ a ( t 2 ) Δ a ( t n ) + + e t n i , w 1 Δ a ( t i 1 ) Δ a ( t n ) e t n i , w 1 Δ a ( t i ) Δ a ( t n ) 1 Δ a ( t i ) Δ a ( t n ) + + e t 1 , w 1 Δ a ( t n 1 ) Δ a ( t n ) 1 Δ a ( t n 1 ) Δ a ( t n )
where e t n i + 1 , w 1 Δ a ( t i ) Δ a ( t n ) denotes the energy consumption per unit crack extension area corresponding to the crack-tip COD of 1 Δ a ( t i ) Δ a ( t n ) , and e t n i , w 1 Δ a ( t i ) Δ a ( t n ) represents the corresponding energy at the initial crack tip opening displacement of and time tn−i. The principle of continuity fundamentally requires that:
e t n i + 1 , w 1 Δ a ( t i ) Δ a ( t n ) 1 Δ a ( t i ) Δ a ( t n ) = e t n i , w 1 Δ a ( t i ) Δ a ( t n ) 1 Δ a ( t i ) Δ a ( t n )
Then [ N ( w ) ] = e t n , w ( t n ) . Substitution of Equation (9) into Equation (12) yields:
[ N ( w ) ] = [ 0 w ( t 1 ) σ 1 ( t 1 , x ) d x + w ( t 1 ) w ( t 2 ) σ ( t 2 , x ) d x + + w ( t i 1 ) w ( t i ) σ ( t i , x ) d x + + w ( t n 1 ) w ( t n ) σ ( t n , x ) d x ]
Differentiating Equation (13) in terms of w, the following equation is obtained:
[ N ( w ) ] = σ ( t 1 , w ( t 1 ) + σ ( t 2 , w ( t 2 ) σ ( t 2 , w ( t 1 ) + + σ 1 ( t i , w ( t i ) σ ( t i , w ( t i ) + + σ ( t n , w ( t n ) σ ( t n , w ( t n 1 )
where σ ( t i , w ( t i ) and σ ( t i + 1 , w ( t i ) represent sw at CODs of w ( t i ) and times of ti and ti+1. Based on the principle of continuity, the relationship between them can be obtained as:
σ ( t i , w ( t i ) = σ ( t i + 1 , w ( t i )
[ N ( w ) ] = σ ( t n , w ( t n )
Equation (16) expresses the time-dependent tension-softening constitutive law under sustained loads, derived based on the second derivative of N(w). For long-term loading values exceeding Pini, the energy E is calculated as:
E = Q W c W e = 0 δ w P ( δ ) d δ 2.62 S 1.32 t 0.32 1 2 P c ( δ w δ P )
which can be obtained from creep fracture tests. Then, the time-dependent tension-softening constitutive model can be determined based on two-parameter fitting. Based on the theoretical derivations, the proposed time-dependent tension-softening model is governed by the tensile strength ft, the fracture energy GF, and the time t. Therefore, once ft, GF, and t are known, the time-dependent tension-softening constitutive model can be determined and then implemented in the numerical model to predict the time-dependent crack propagation in concrete under sustained loads.

2.3. Finite Element Modeling

In the numerical study, the simulation of the complete time-dependent crack extension process of concrete under sustained loads was employed using ANSYS 15.0, where a plane stress model with thickness t was considered. High-order triangular elements (Plane 183) were utilized, featuring a circular refined mesh region of radius r centered at the crack tip. Herein, singular elements were embedded around the tip to address the stress singularity while dense elements were utilized to characterize the nonlinear crack-tip stress field. The boundary conditions constrained left-support nodes horizontally and vertically, and right-support nodes vertically only. A sustained load Pc is applied at the loading point. The mesh division of the complete beam model and the local crack-tip are presented in Figure 4.
Concrete fracture generally involves initiation, stable growth, and unstable growth stage as per the well-known double-K method [39,40]. To model this behavior, the crack growth process can be reasonably modeled as continuous crack initiation across a series of creep specimens with identical properties but incrementally increasing initial crack lengths. As previously mentioned in Section 2, the K IC i n i -based criterion was employed for determining the crack initiation and extension, i.e., crack extension occurs as the SIF at the crack tip exceeds K IC i n i . The detailed equations were presented in Equations (2)–(4). As established by Refs. [6,12], sustained loads will not change K IC i n i , which means that this parameter can be measured using easy quasi-static tests. However, the sustained loads applied exceed Pini, i.e., the crack has propagated to a certain length before concrete creep begins. Consequently, it is necessary to perform quasi-static load conditions to compute the crack length a1 before creep testing.

2.4. Calculation of Time-Dependent Crack Extension Process

For 3-p-b concrete beams under sustained loads, given the dimensions, material properties, and fracture parameters, the time-dependent tension-softening law can be determined (details can be found in Section 2.1). The specific analysis steps are given as follows:
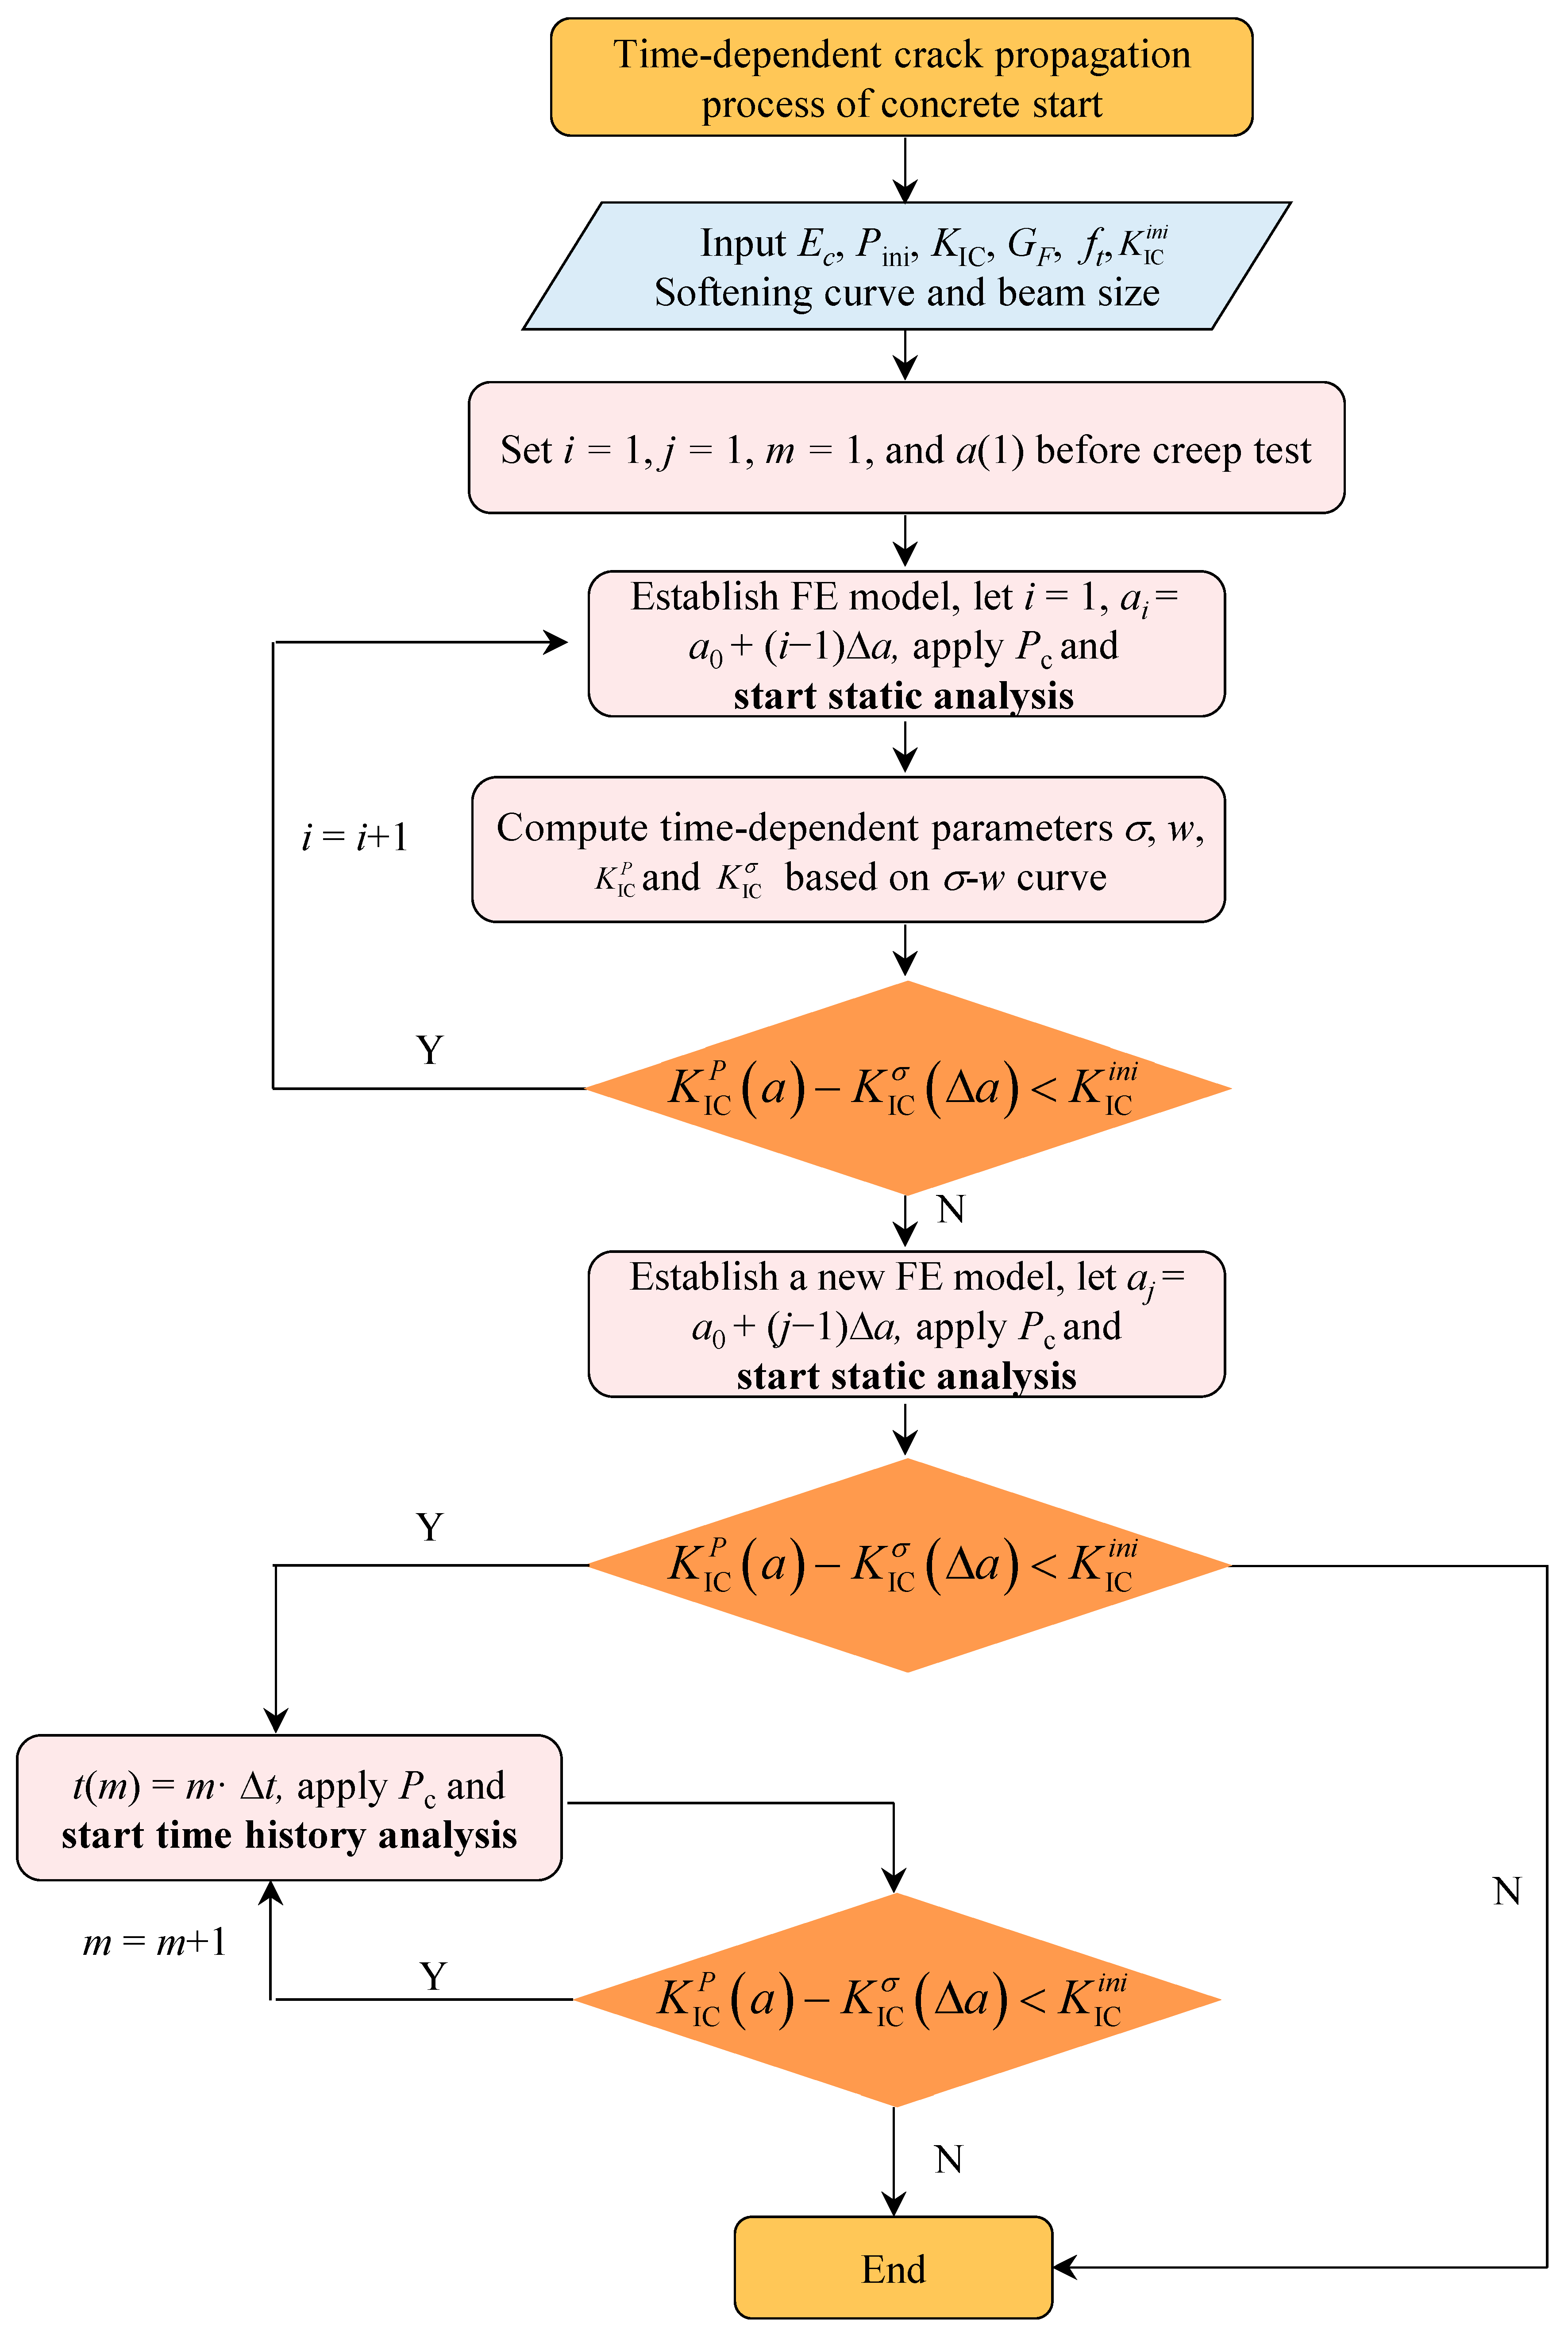
  • Model Initialization. Input the geometrical dimensions and material and fracture properties of 3-p-b beams for creep fracture tests. The parameters are initialized with i = 1 and j = 1, where i and j represent quasi-static and sustained load steps for crack extension, respectively.
  • Quasi-static loading analysis. First, define the crack length a(i) = a0 + (i − 1)Δd, where a0 stands for the initial crack length and Δd refers to the increment crack length for each quasi-static loading step. After the FE model is built, the quasi-static loading analysis starts. Second, apply P = Pc and σw, with which the SIFs K I P and K I σ can be computed. Finally, determine the difference between K I P and K I σ . If K I P K I σ > K Ic ini , increment i by I = i + 1 and repeat the aforementioned steps. Else, set a1 = a(i) and proceed to step (iii).
  • Sustained loading analysis. First, similar to the quasi-static loading analysis, set a(j) = a1 + (j − 1)Δd. Rebuild the model with Pc. To capture the viscoelastic behavior of concrete, define the material properties using the Prony series derived from the Kelvin chain model. Subsequently, perform the static analysis [see step (ii)]. If K I P K I σ < K Ic ini , then proceed to step (iv). Otherwise, terminate the program.
  • Time history analysis. Define the time at step m as t(m) = mΔt, where m = time step index and Δt = time increment. Apply σw(t) and conduct the time history analysis. Extract K I P and K I σ then calculate K I P K I σ . If K I P K I σ < K Ic ini , set m = m + 1 and repeat the analysis; If K I P K I σ > K Ic ini , then set j = j + 1 and return to step (iii) and proceed steps (iii) and (iv).
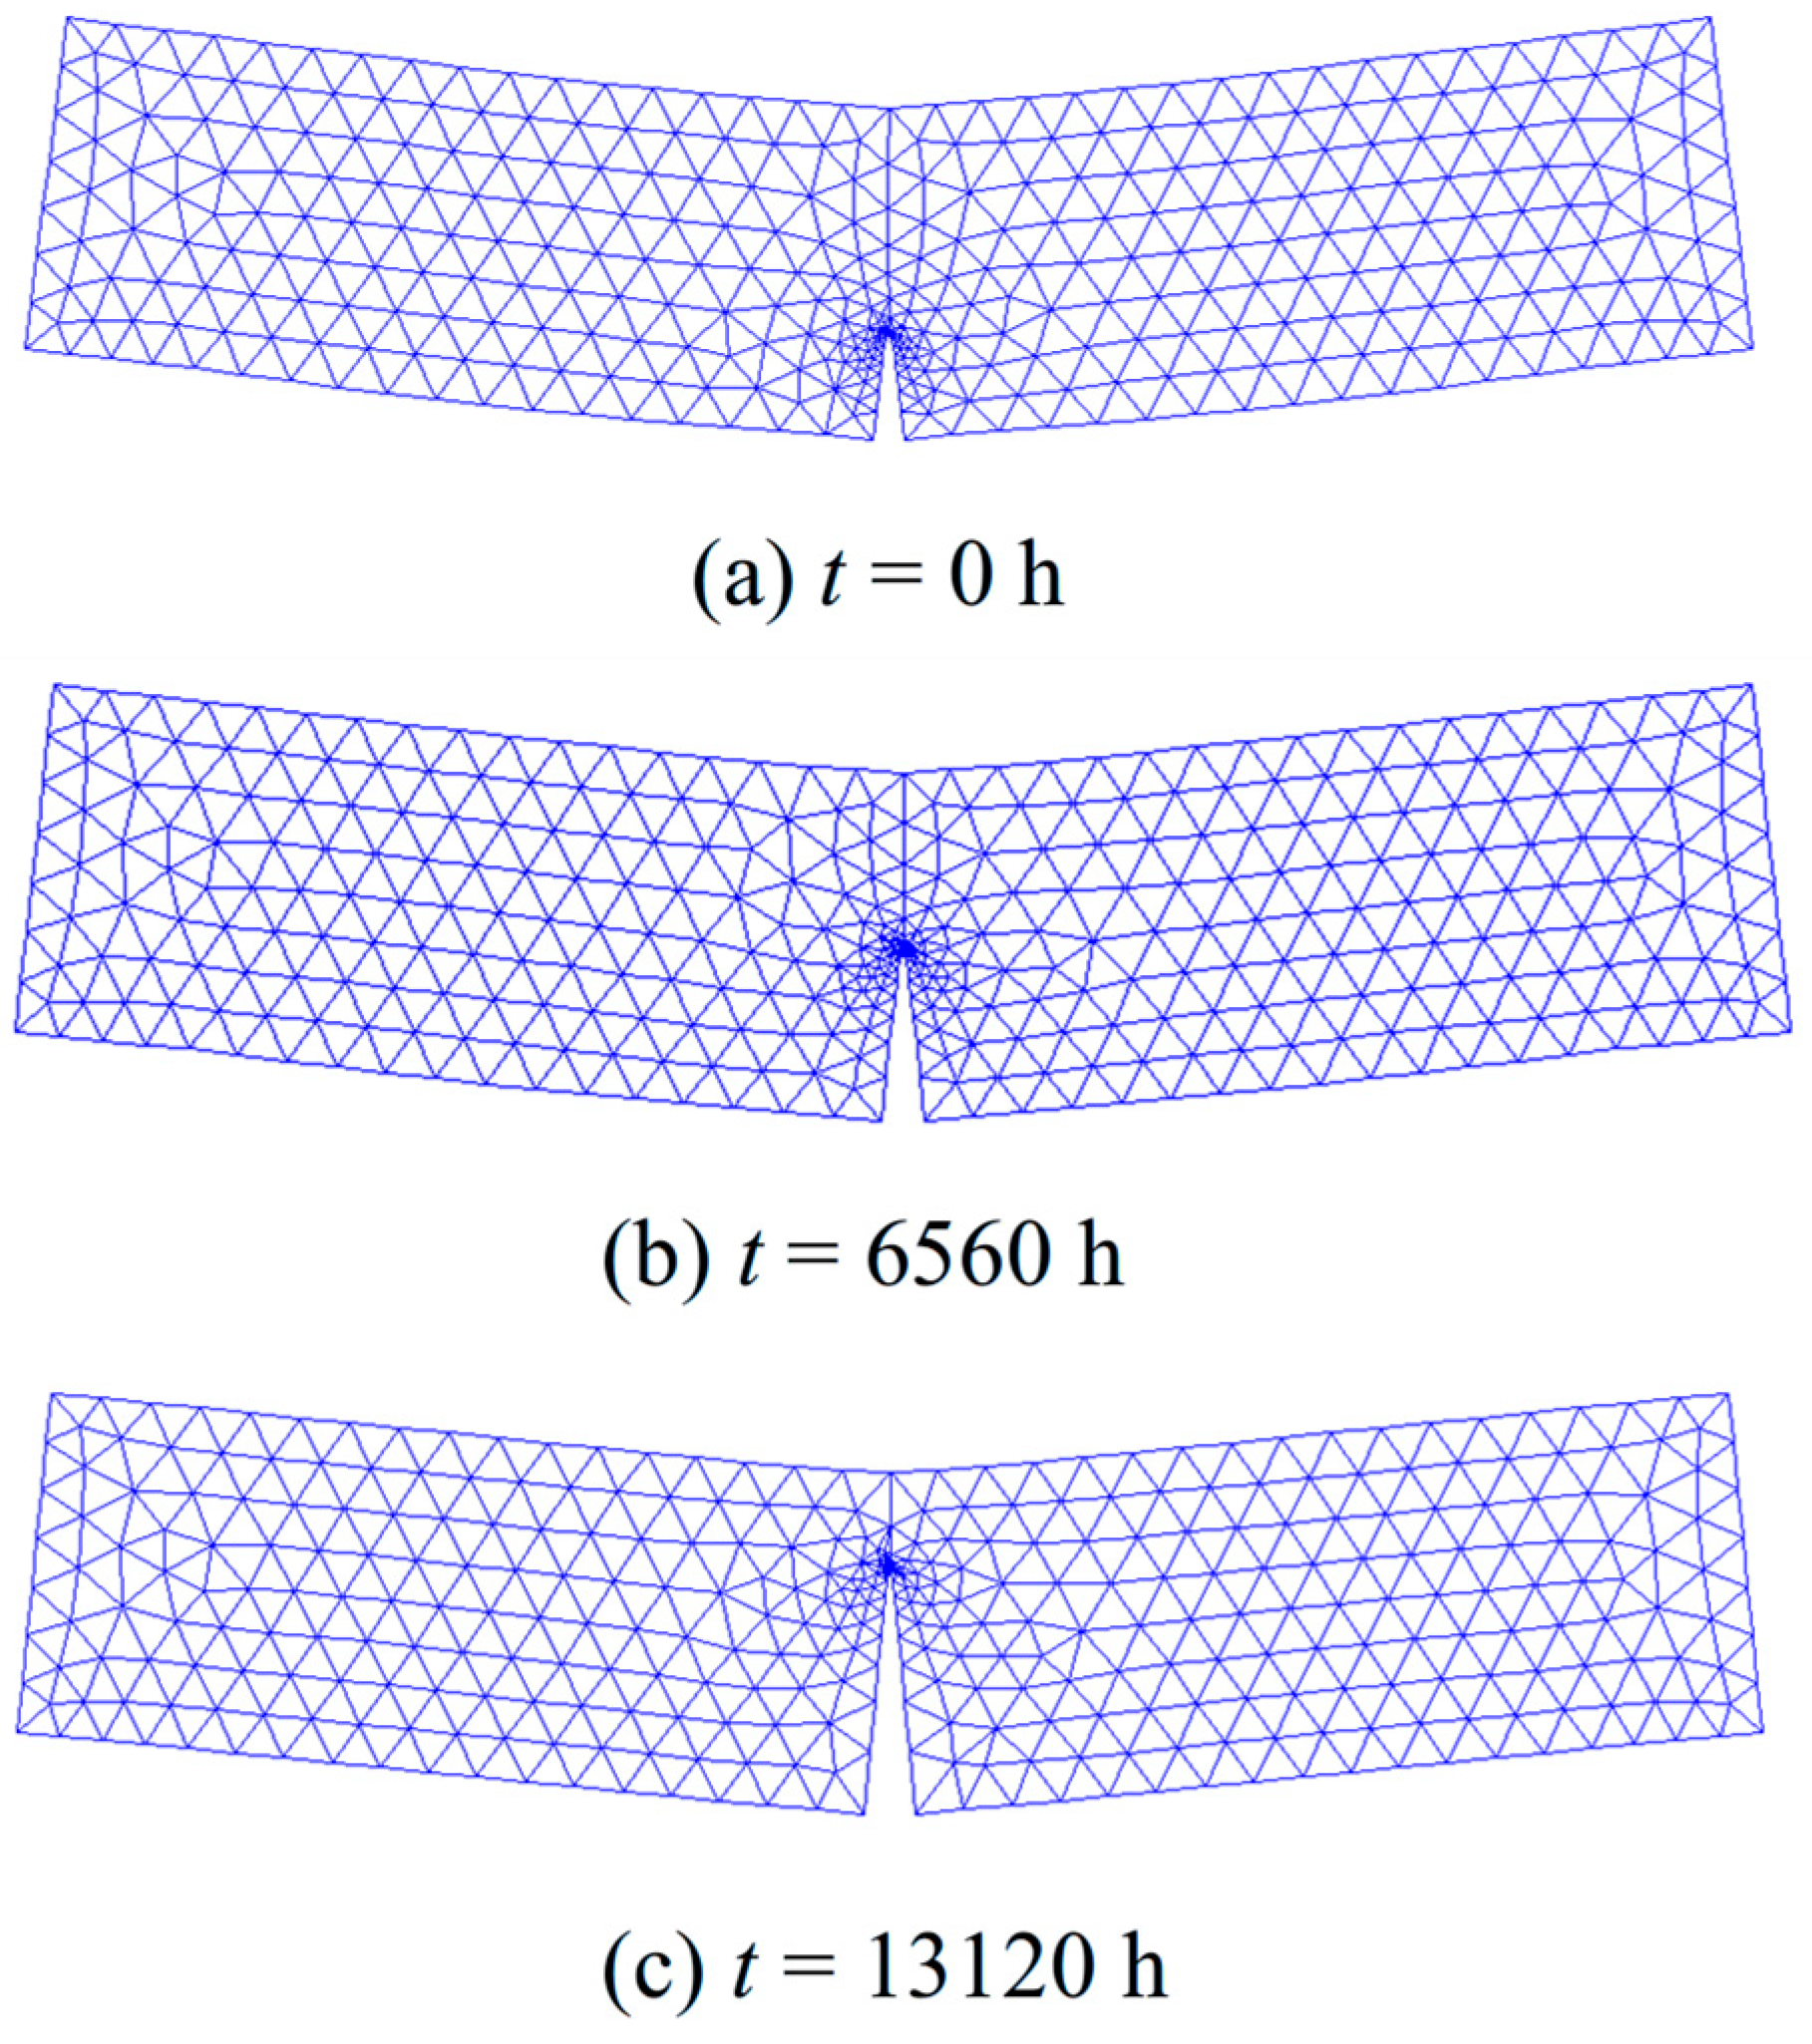
The computation process is demonstrated using the 3-p-b beam specimen S-0.90-1 [16] as subsequently reported in Section 3, which denotes the first sample under a sustained load level of 0.90. Figure 5 shows the deformation diagrams at three critical time points: initial loading (t = 0 h), mid-stage (t = 6560 h), and final stage (t = 13,120 h), where the relevant parameters used in the numerical analysis, including Pc, crack growth length Δa1 before creep, increment crack length Δd, and time increment Δt are provided in Table 1. Figure 6 gives the computational flowchart of the time-dependent crack extension process of concrete under sustained loads. It is noted that the material creep was not considered in the numerical model because of the 8-month curing period of concrete specimens, which stabilized the material properties throughout each test. Despite this, the proposed tension-softening constitutive model explicitly accounts for creep. By incorporating the loading time as a primary variable, the model captures the time-dependent degradation of cohesive stress due to creep. This constitutive relationship was implemented in ANSYS to accurately represent the evolution of cohesive stress within the FPZ.

3. Experimental Verification and Discussion

The validity of the derived numerical method for the time-dependent crack growth in concrete is to be verified with two groups of creep fracture test data presented in the literature [17,21].
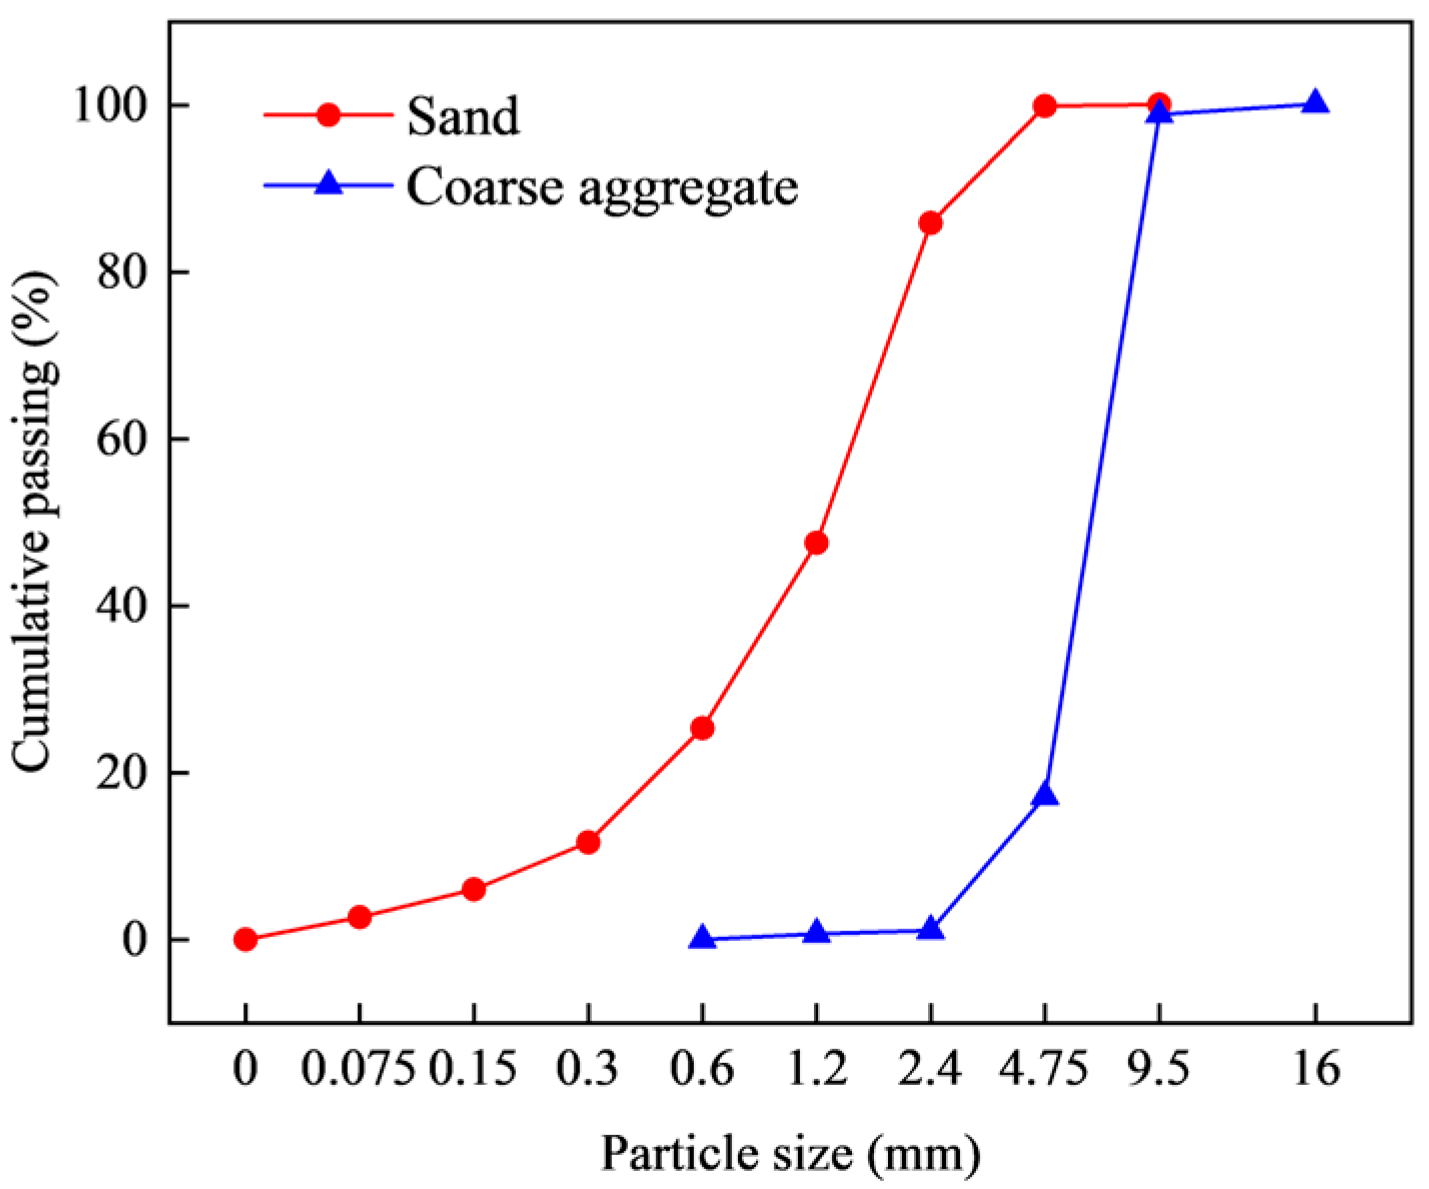
The first set of experimental data is taken from Han et al. [17]. In the experiment, creep fracture tests were carried out on 3-p-b concrete beams. The concrete mixture was proportioned with cement, water, fine aggregate, and coarse aggregate at 325, 195, 696, and 1184, respectively. The cement employed was P.O 42.5 ordinary Portland cement conforming to Chinese Standard GB 175-2020 [41]. Fine aggregate was natural river sand; coarse aggregate was crushed limestone with a nominal maximum particle size of 10 mm. The proportion of fine and coarse aggregate was 0.59. The coarse aggregate employed in this experiment was crushed limestone, characterized by a specific gravity of 2.68 and a water absorption of 0.43%. The chemical composition of cement was presented in Table 2. The specific surface area and fineness of the cement were 345 m2/kg and 0.66, respectively. The mix design of concrete is listed in Table 3. The aggregate gradation curve is shown in Figure 7. To characterize the mechanical properties of hardened concrete, standardized test samples were fabricated in accordance with the provisions of the Chinese code GB50010-2010 [42]. For cubic compressive strength (fcu) and splitting tensile strength (ft) measurements, 150 mm × 150 mm × 150 mm cube specimens were cast. Concurrently, 300 mm × 150 mm × 150 mm prism samples were fabricated to determine elastic modulus (Ec) and Poisson’s ratio (ν). The elastic modulus of concrete was determined using standard prismatic specimens under a compressive loading condition. Because the main objective of this study was to experimentally evaluate the effect of loading level on the crack propagation behavior of concrete and to validate the accuracy of the proposed numerical model, the slump test or any other workability test were not performed. Furthermore, the concrete mixtures were prepared without any superplasticizers or other chemical admixtures.
To mitigate the potential influence of ongoing hydration and microstructural development on the long-term creep behavior, all specimens underwent an extended water-curing regimen lasting 8 months prior to mechanical testing. This prolonged curing period was implemented to ensure stabilization of the material properties, minimizing temporal variations that could confound the interpretation of creep test results. Following this curing protocol and subsequent testing, the stabilized mechanical properties were measured and listed in Table 4. Figure 8 shows the schematic diagram of 3-p-b beam specimens. They were fabricated with a span length (L) of 400 mm, a cross-sectional width (B) of 100 mm, and a height (D) of 100 mm. An initial crack length (a0) of 30 mm was introduced at the midspan using a precision diamond saw equipped with a 2 mm thick blade.
Before creep tests, quasi-static 3-p-b beam tests were first performed to determine the quasi-static fracture properties. The experiments were performed via a servo-hydraulic MTS testing machine with a peak capacity of 250 kN, where the applied load values were precisely monitored via a 50 kN load cell. A displacement-controlled loading regime was implemented at a constant loading rate of 0.024 mm/min for ensuring stable crack extension and accurate parameter determination. Six identical specimens, designated S-1 through S-6, were subjected to this testing procedure to ensure statistical reliability of the results.
As shown in Figure 9, strain gauges were mounted on both sides of the initial crack tip to determine the initial cracking load (Pini). A clip gauge was positioned at the load application point to measure the loading-point displacement (δ). A clip gauge was located at the crack mouth to measure the crack mouth opening displacement (CMOD), while four additional clip gauges, spaced at 20 mm intervals along the ligament, were used to monitor the crack opening displacements (CODs) at various locations. Throughout the experiment, an Integrated Measurement and Control (IMC) system was employed to record the load, strain, and CODs at a sampling rate of 50 Hz. The crack extension length was calculated through linear regression analysis to the COD measurements.
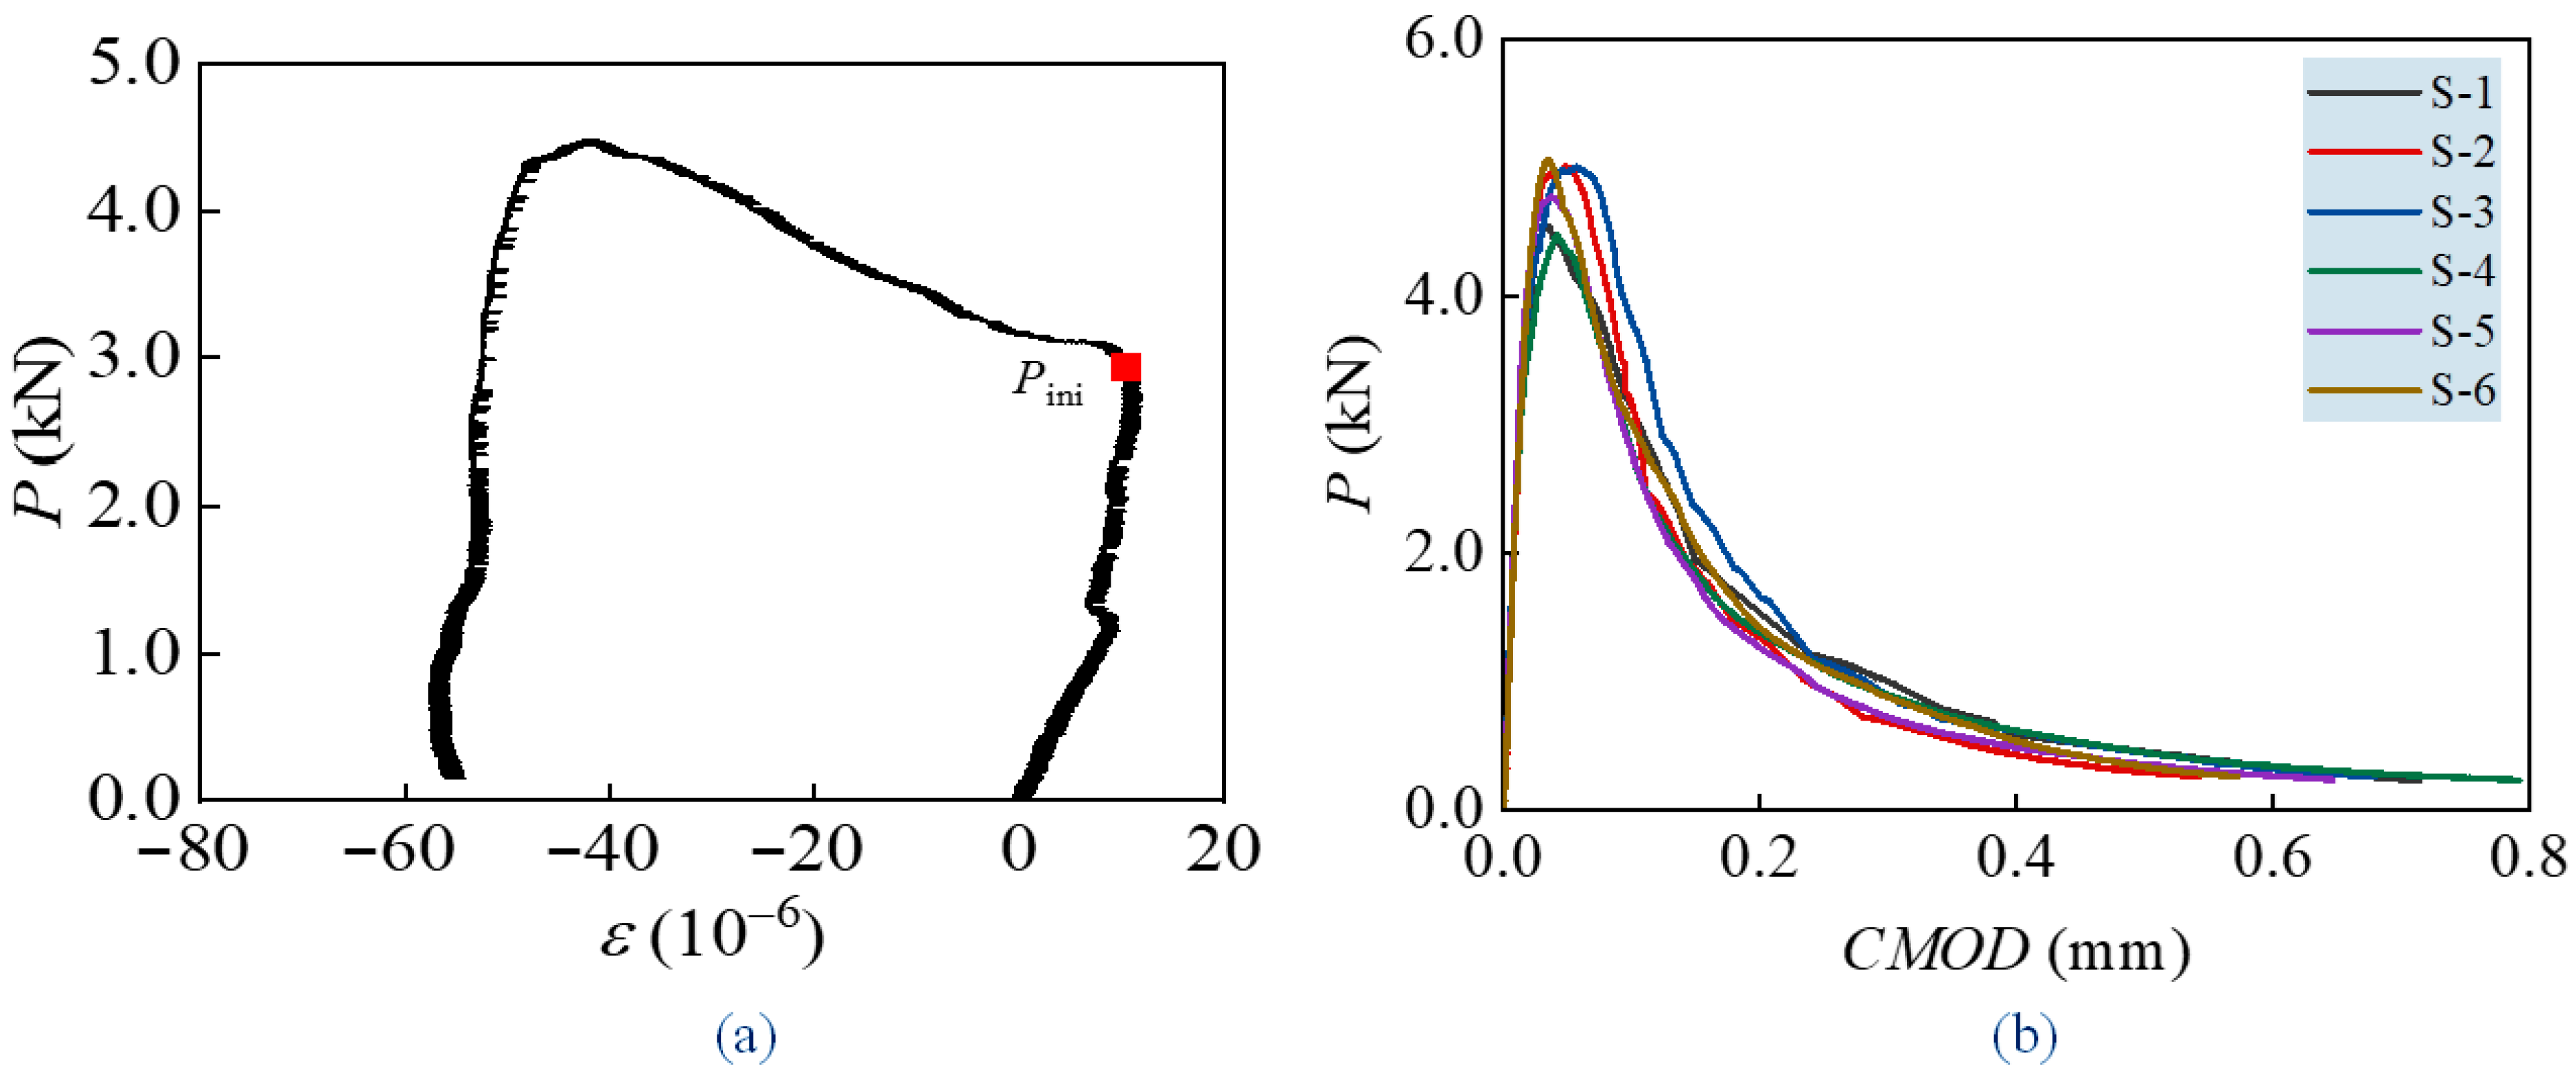
The onset of cracking was detected through a characteristic abrupt drop in strain gauge readings, resulting from the rapid release of accumulated elastic strain energy at the crack tip. Figure 10a presents the relationship between P and the crack-tip strain (ε) of Specimen S-1, where the distinct inflection point corresponds precisely to Pini. Figure 10b presents the P-CMOD curves derived from the tests for six samples (S-1 to S-6). The curves demonstrate consistent Pmax values across all specimens with acceptable errors, confirming the reliability of the specimen preparation and testing procedures. From these P-CMOD responses, two critical loads Pini and Pmax can be directly determined.
The value of K IC i n i was subsequently calculated using the following expression:
K Ic ini = 3 P ini L 2 D 2 B a 0 F ( a 0 D )
where the geometry-dependent correction factor F is defined as:
F ( a 0 D ) = 1.99 a 0 D ( 1 a 0 D ) 2.15 3.93 a 0 D + 2.7 ( a 0 D ) 2 ( 1 + 2 a 0 D ) ( 1 a 0 D ) 3 / 2
The values of Pini, Pmax, and K Ic ini are summarized in Table 5, presented as mean values ± standard deviation to quantify experimental repeatability. It was shown that the ratio between Pini and Pmax is 63.8%, which was consistent with the creep fracture tests conducted by previous studies [16].
To investigate the creep fracture lifetime of concrete under high sustained load levels, creep fracture tests were conducted at sustained load ratios of 0.80, 0.85, and 0.90 relative to the quasi-static Pmax. Each load level included six specimens, and a total of eighteen specimens were tested. The specimen designated as S-0.80-n, S-0.85-n, and S-0.90-n, where n denotes the specimen number, e.g., S-0.90-1 for the first specimen at 0.90 load ratio. Notably, at the 0.90 load level, the applied load exceeded Pini, indicating pre-existing crack extension prior to sustained loads. Tests were performed using a servo-hydraulic MTS testing machine to ensure precise load control and rapid data acquisition.
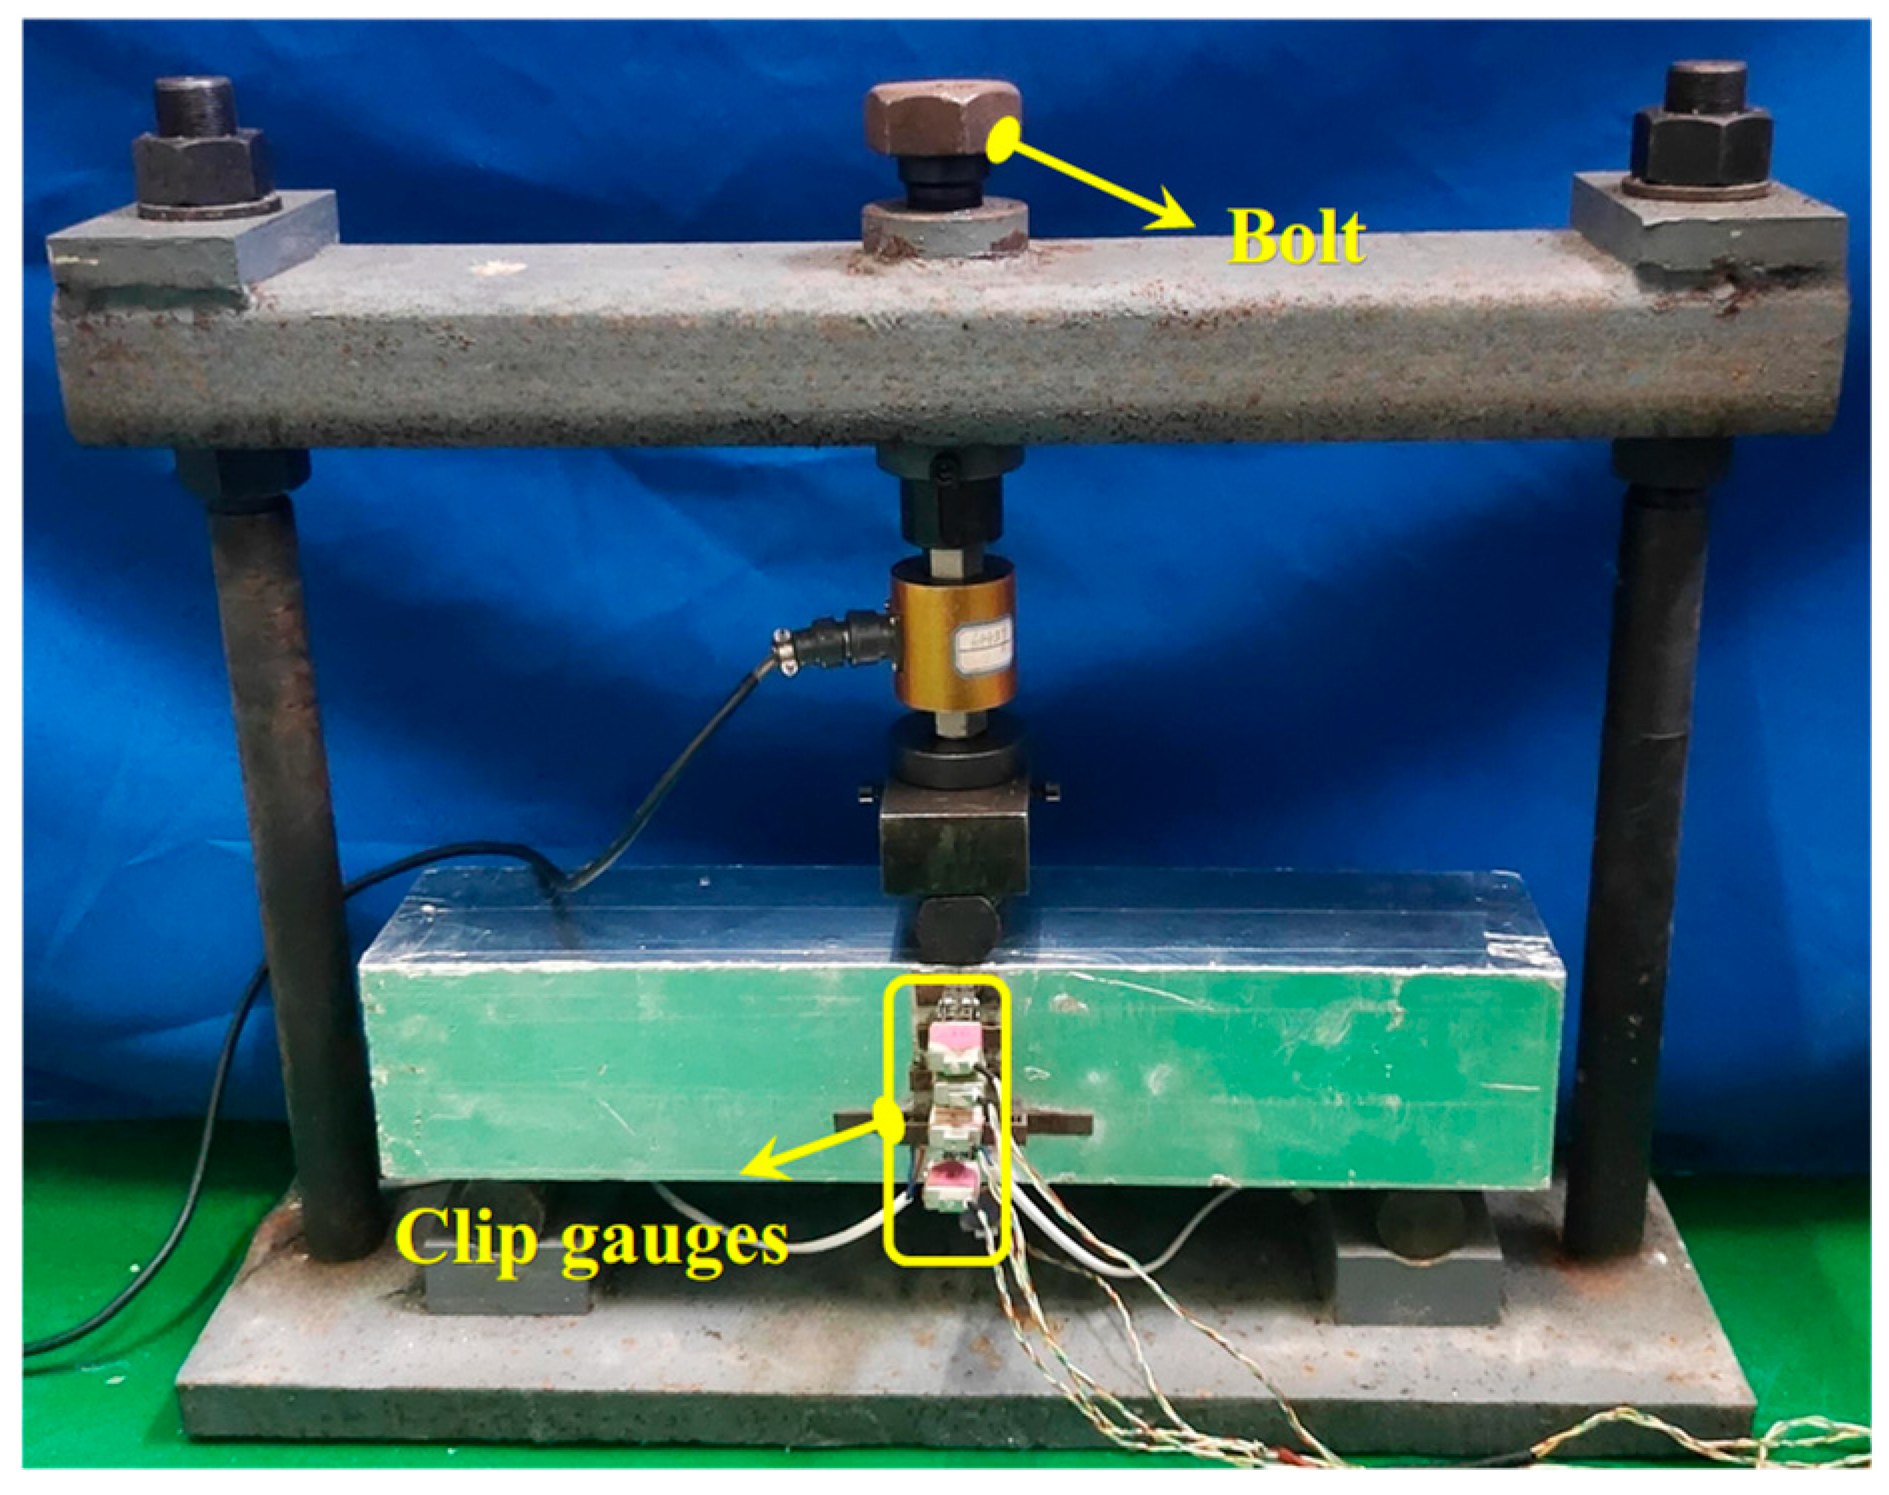
Owing to the anticipated short creep fracture lifetime at the 0.90 load level, the corresponding test was conducted on an MTS testing machine, utilizing the same loading and measurement instrumentation as the static fracture tests. For the remaining load levels, creep tests were performed using a custom-designed apparatus, as depicted in Figure 11. During the creep test, the sustained load tended to decrease as specimen displacement increased. To maintain a constant load, whenever the load dropped by 50 N, it was restored by tightening the adjustment bolt. Throughout the test, the values of CMOD, δ, and crack extension (Δa) were monitored using clip gauges, and all data were recorded at 1 Hz via an IMC system.
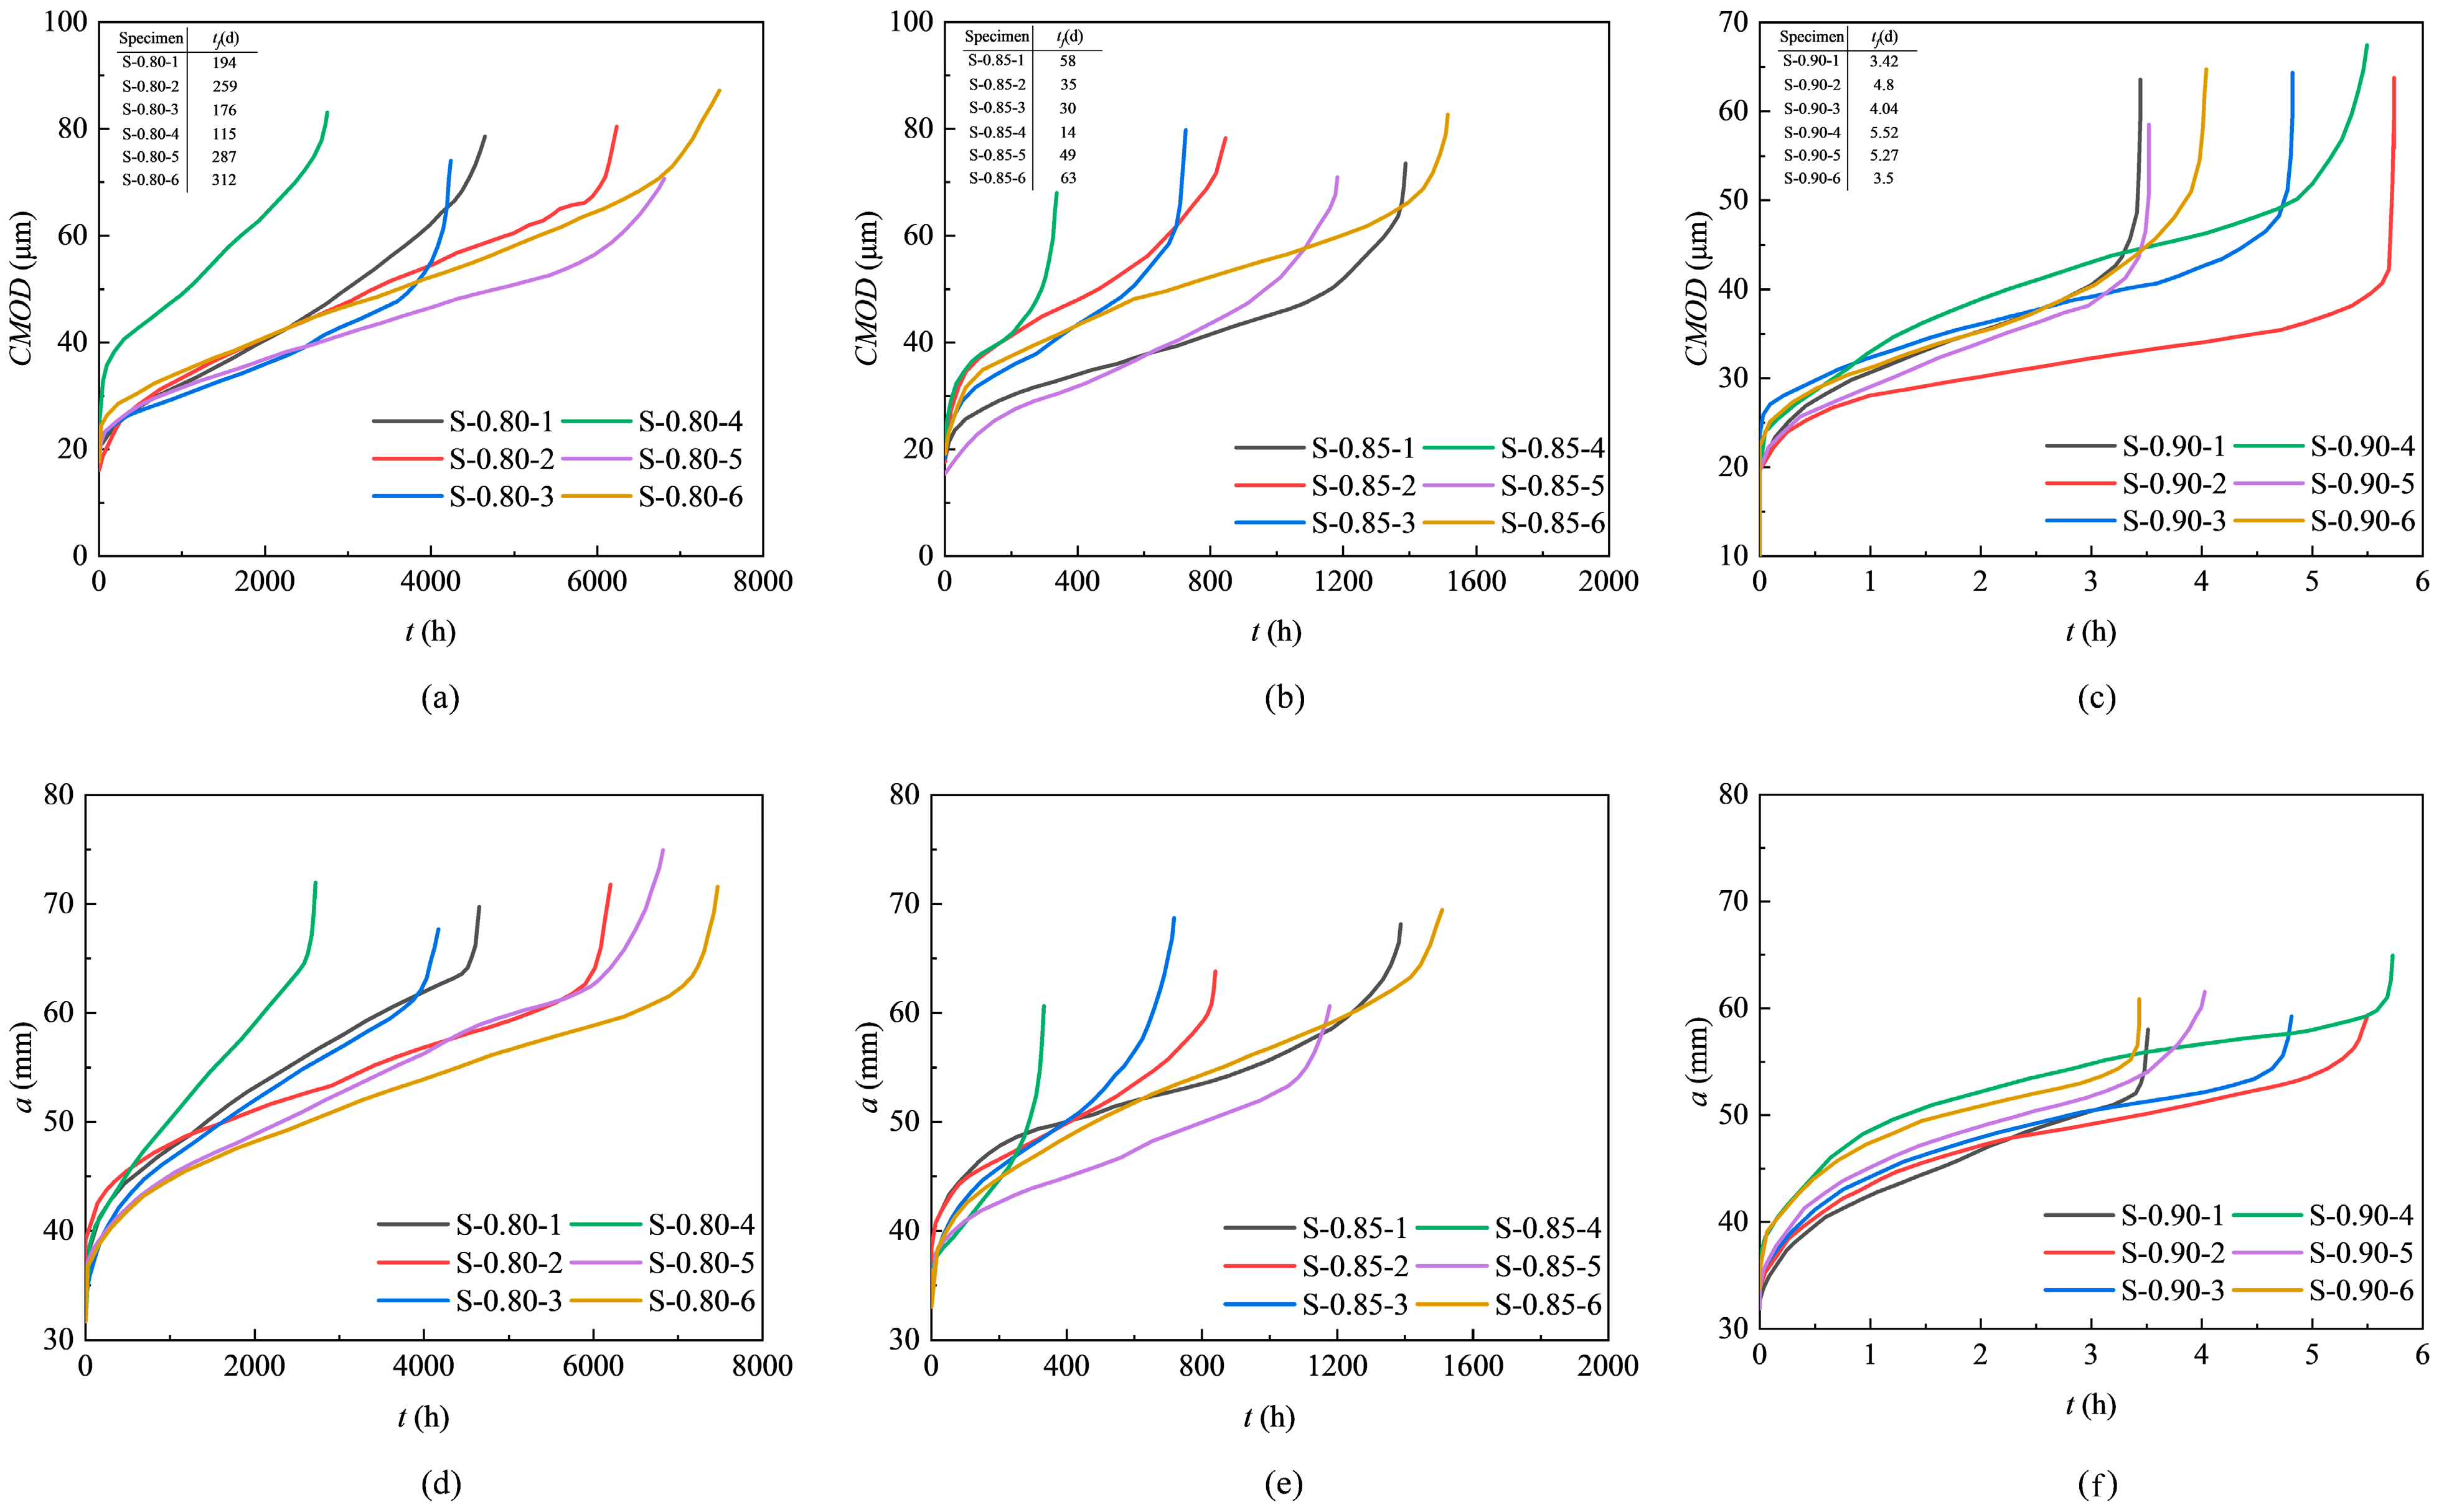
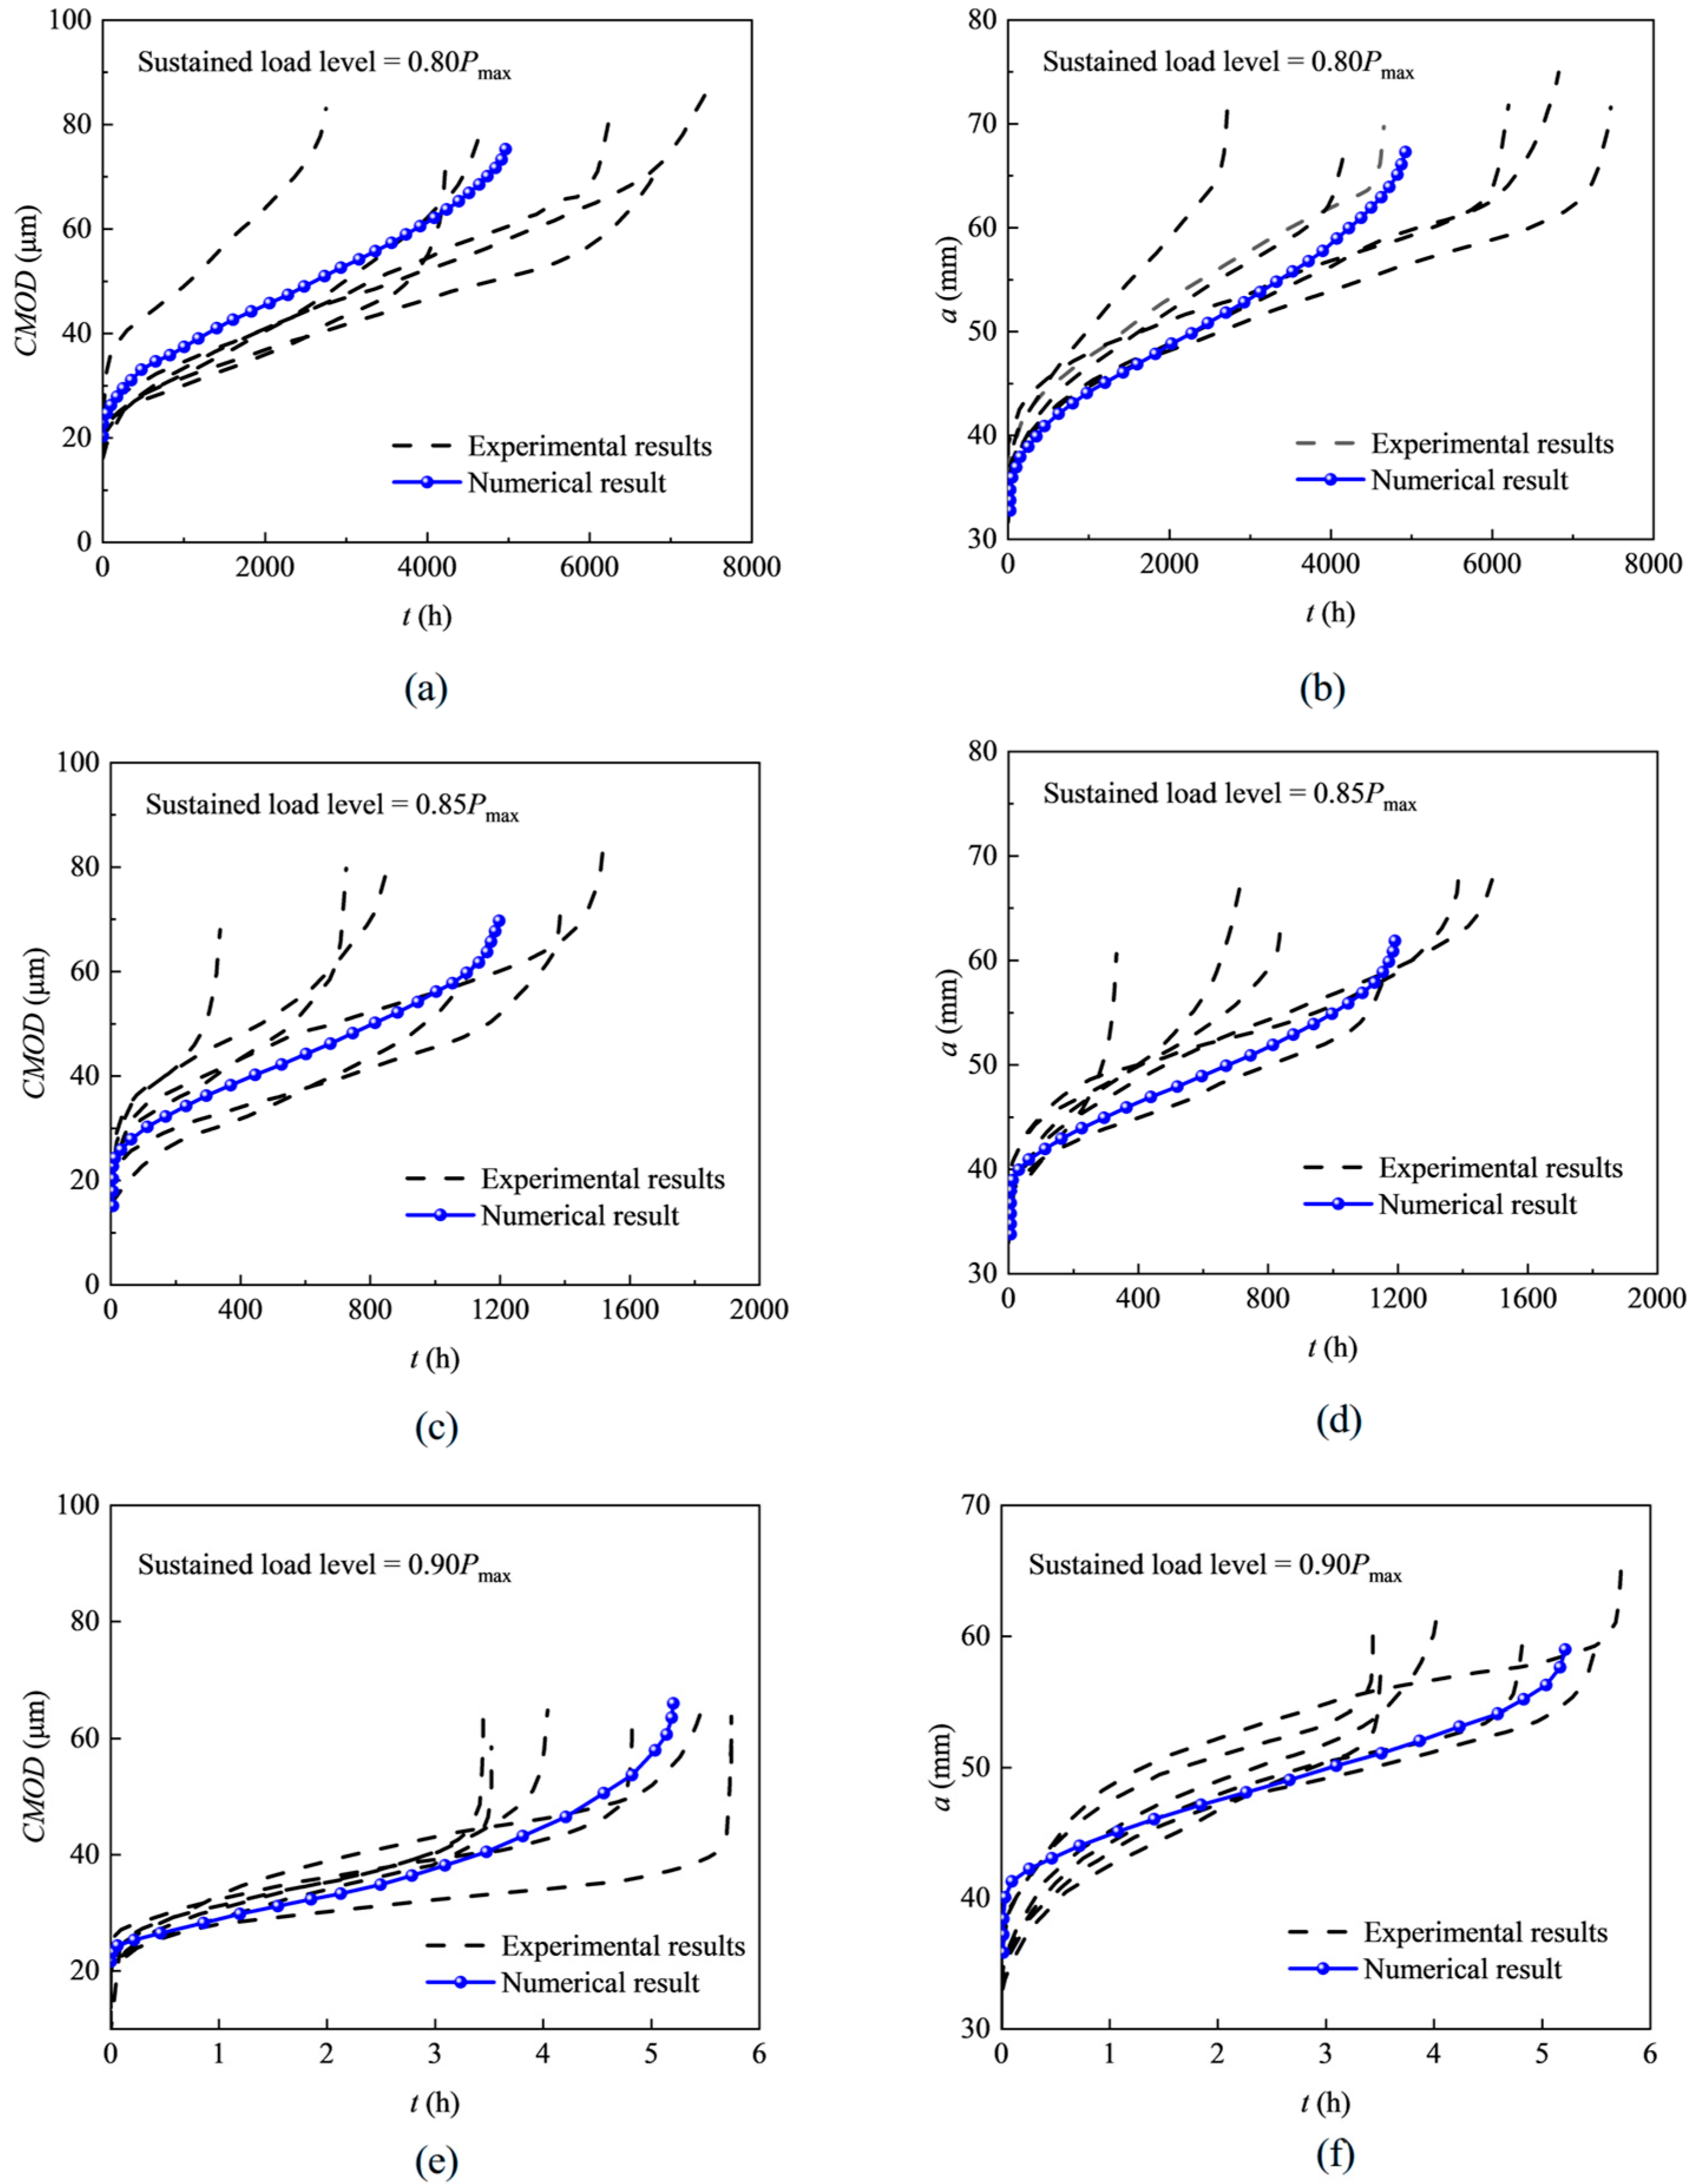
The measured CMOD versus time and crack length versus time curves for different sustained load levels are presented in Figure 12, respectively. The experimental results are listed in Table 6, where it is seen that the specimens under identical sustained loading levels show discreteness regarding creep fracture lifetime. The reason for this can be explained as follows. The creep fracture lifetime exhibits strong dependence on the applied load level. Increasing the load level from 0.80 to 0.90 exponentially reduces the lifetime from approximately 580 days to under 5 h. This is primarily attributed to the pronounced nonlinearity at elevated loads, which accelerates crack extension. In addition, higher load levels decrease both the CMODf and af values at creep failure, indicating significantly diminished deformation capacity. Despite this, the CMODf and af values presented minimal variability across replicate specimens.
Herein, the effectiveness and generality of the numerical model is verified with three groups of creep test data, including the experiment conducted by Han et al. [16], and the creep test on 3-p-b concrete beam specimens conducted by Li et al. [21].
Figure 13 shows the comparisons between the CMOD versus time and a versus time curves obtained from numerical predictions and the experiment. Despite the presence of discreteness of test data, the numerical predictions fall within the range of the experimental data, indicating that the proposed simulation can effectively predict the creep fracture in concrete exposed to sustained loads. Specifically, Table 7 compares the numerical (denoted by superscript ‘num’) and experimental (denoted by superscript ‘exp’) tf, CMODf, and af values on average. It is found that the numerical results match the test data well. In fact, the numerical results consistently predict lower values for both CMODf and af compared to experimental results. This discrepancy originates from the calibration method of the concrete viscoelastic model. Specifically, the parameter calibration for the temperature-dependent tension-softening constitutive model is predicated on CMOD measurements obtained under load levels below the initial cracking load Pini. These calibrated parameters are then employed in simulations where the sustained load exceeds Pini, and as a result, continuous crack propagation drives the material into a nonlinear creep phase. In this case, the crack growth is governed by damage accumulation, a phenomenon that traditional Kelvin chain models may not fully encapsulate. Consequently, the calibrated parameters may fail to accurately represent the intricate stress distribution at the crack tip during nonlinear creep, leading to a slight underestimation of both CMOD and crack length in numerical predictions. Despite this, the deviation between the simulated and experimental results remains within acceptable limits, demonstrating that the proposed numerical method can effectively capture the fundamental response of concrete under sustained loads. It is noted that while numerical predictions for CMOD and crack length are conservative, the simulated creep fracture lifetime agrees closely with experimental observations. This is because, once the sustained load exceeds Pini, the creep fracture lifetime is predominantly controlled by the degradation of cohesive stress within the FPZ, rather than the viscoelastic properties of concrete. The tension-softening model employed in this simulation is directly calibrated from creep fracture tests, enabling a precise representation of the cohesive stress degradation. It is noted that a significant scatter is observed in CMODf and af at creep failure. This dispersion is attributable to the substantial impact of load level on the fracture parameters. Additionally, concrete inherently exhibits variations in crack extension process, even between tested specimens within the same dimensions and loading conditions.
From Table 7, it can be confirmed that the numerically predicted values of tf, CMODf, and af at failure were in good agreement with the experimental results, with average relative errors of 13.51%, 5.35%, and 4.95%, respectively. Moreover, the loading level had a pronounced influence on these failure parameters. Specifically, as the loading level increased from 0.80 to 0.90, the values of CMODf and af reduced by 13.33% and 11.94%, respectively, while the creep fracture lifetime (tf) significantly decreased from 4960 h to 5.21 h.
The second set of experimental data is collected based on the creep test on concrete beam specimens performed by Li et al. [21]. In their experiment, 3-p-b concrete beam specimens featured nominal dimensions of 500 mm (length) × 100 mm (width) × 100 mm (depth), incorporating a precision-cut pre-notch with a depth of 30 mm. The concrete mix was proportioned at 1:0.60:2.01:3.74 (cement:water:sand:coarse aggregate) by weight. P.O.42.5 Ordinary Portland Cement (OPC) was utilized as the binder. The concrete mixture employed crushed stone with a 10 mm maximum particle size as coarse aggregate and well-graded natural river sand as fine aggregate. After 24 h demolding, the tested specimens underwent 28-day curing in a controlled environment at 20 ± 2 °C and 90% ± 5% relative humidity. For quasi-static 3-p-b tests, specimens were subjected to sustained loading levels corresponding to 90% and 95% of Pmax. Two replicate specimens were tested at each load level to assess experimental repeatability. The parameter used for numerical simulations were experimentally determined as follows: ft = 3.07 MPa, E = 33.5 GPa, ν = 0.20, GF = 100.3 N/m, and K Ic ini = 0.52   MPa · m 1 / 2 .
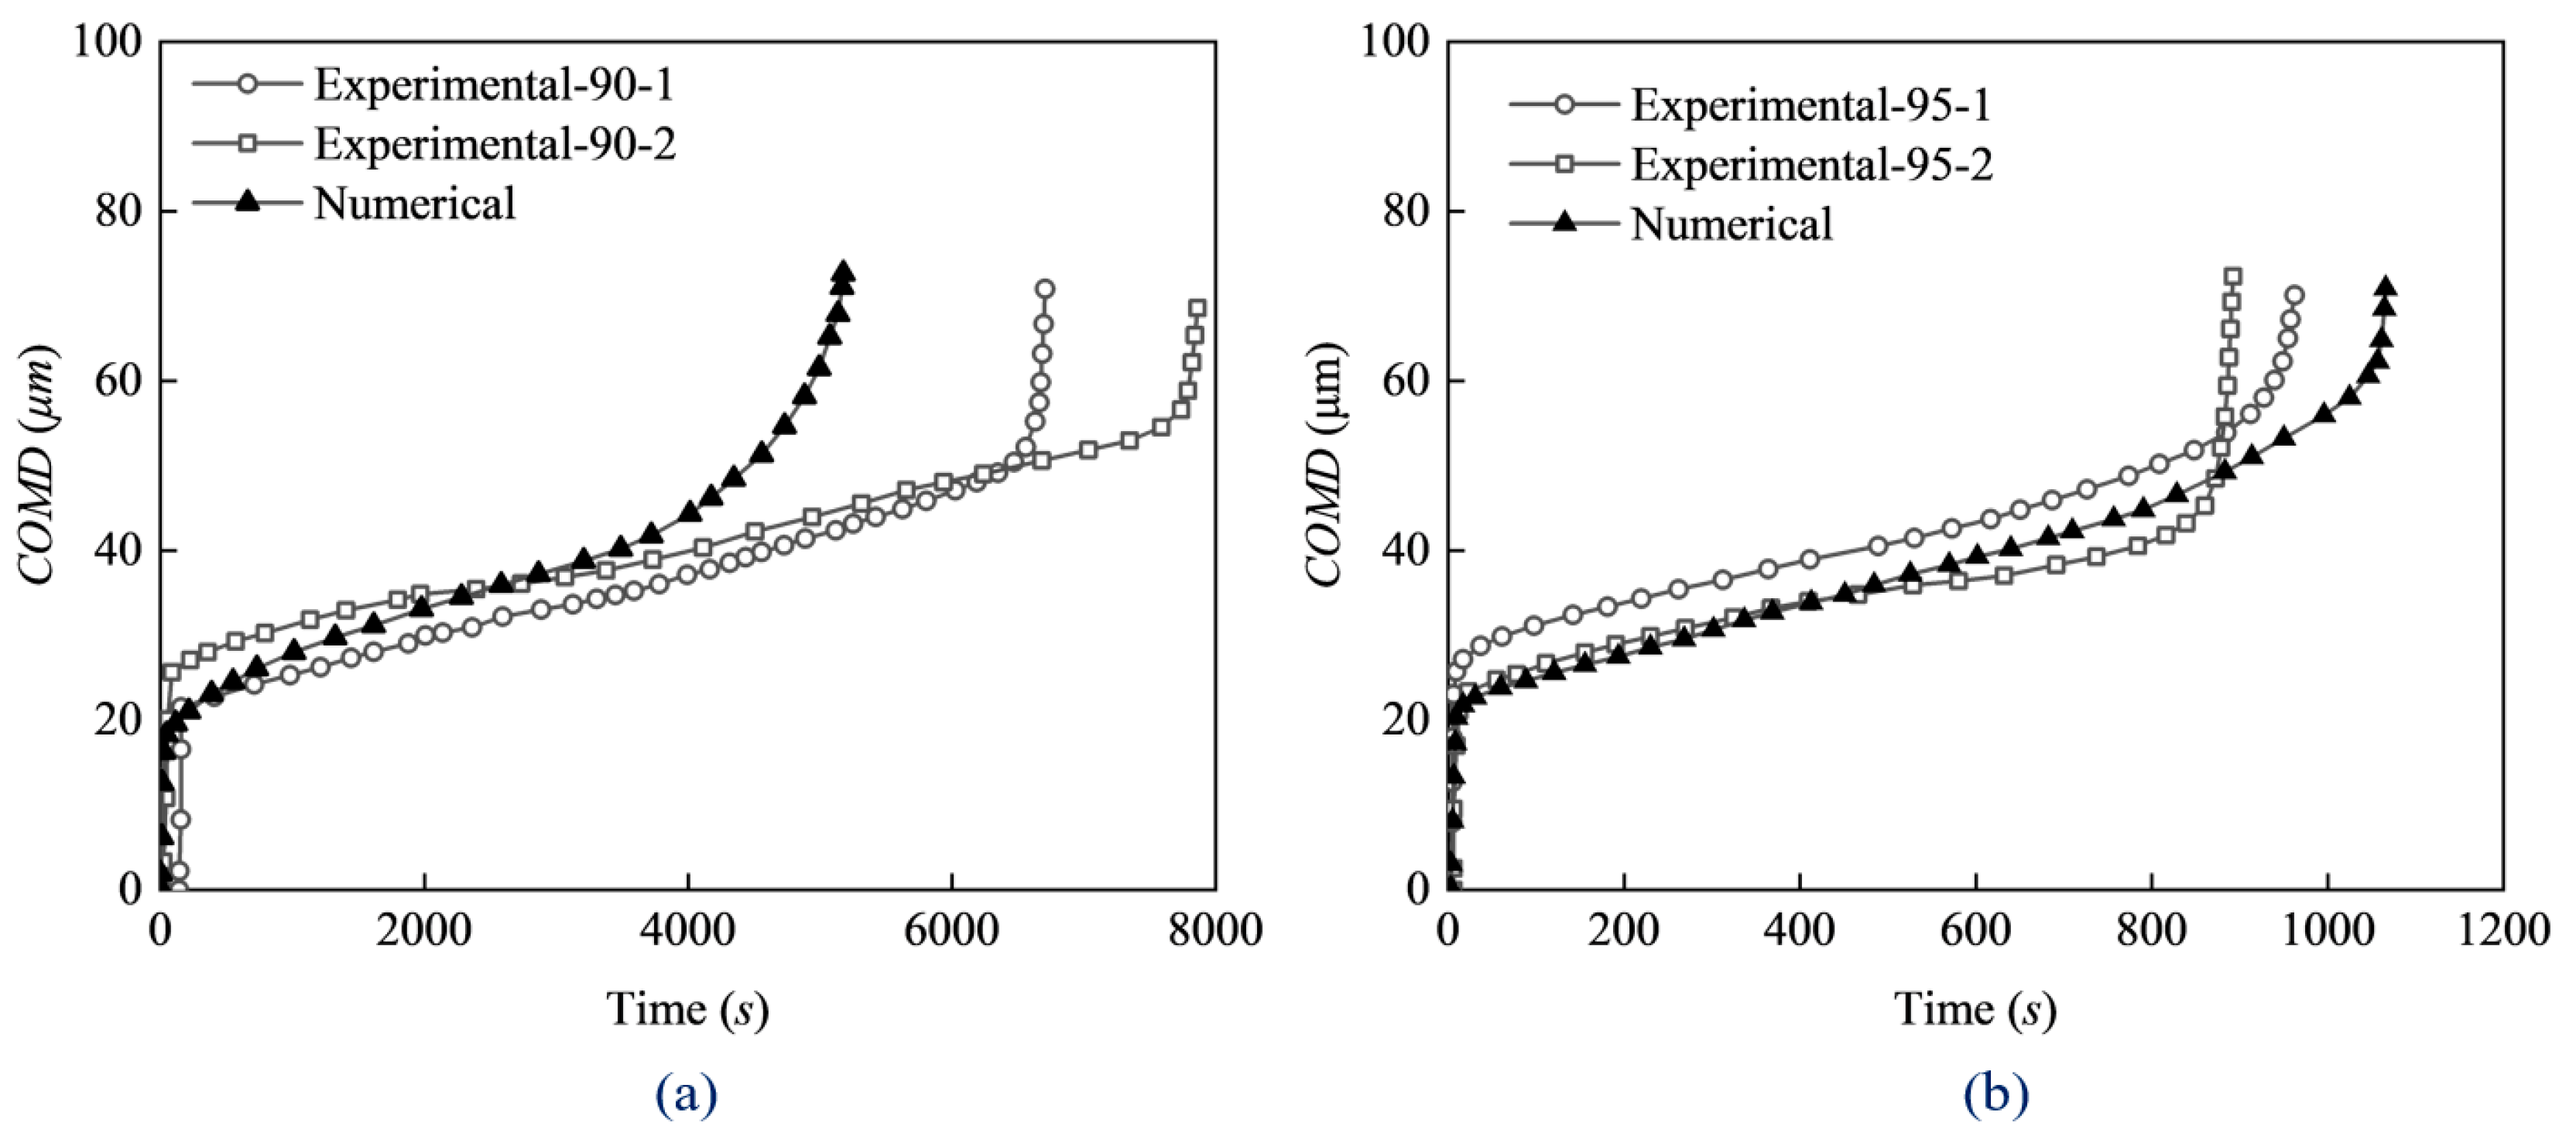
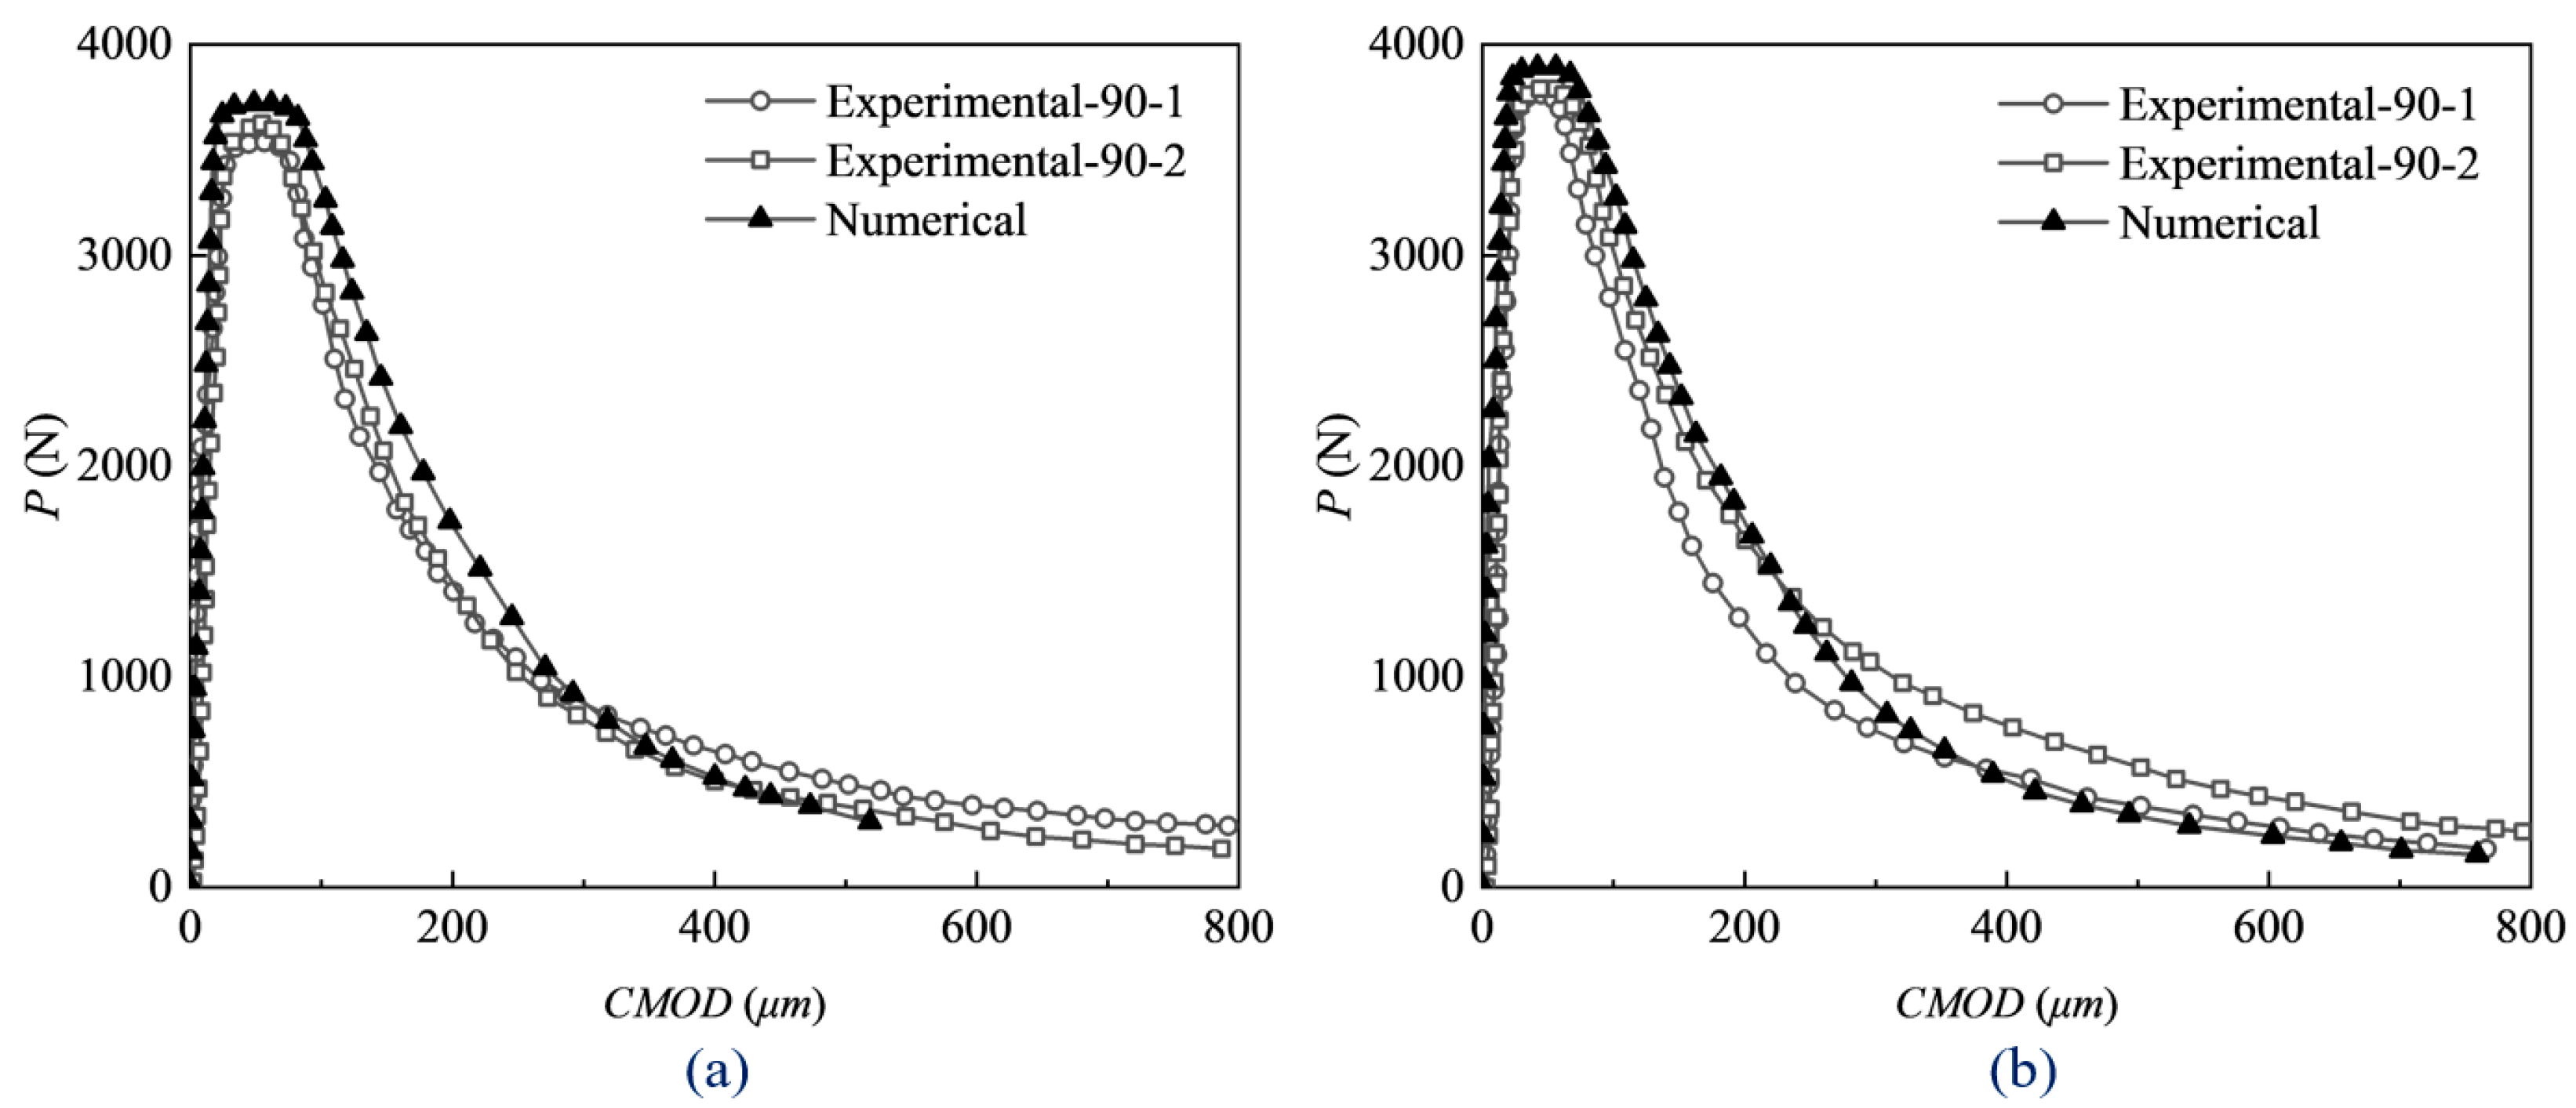
Given the input parameters, the complete fracture process under sustained loads can be numerically reproduced. Figure 14 illustrates the comparisons of the CMOD versus time curve and crack length versus time curve obtained from the numerical prediction and Li et al. [21]’s test, where the specimen number 90-1 denotes the first specimen under 90% Pmax. The results indicated that the numerical predicted CMOD-t and a-t curves agree well with the test data regardless of the load level. To be more specific, the experimental mean time-to-failure for concrete under 90% Pmax was 7240 s, while the numerical analysis predicted 5194 s. Similarly, at 95% Pmax, the experimental measured failure occurred at 924 s, compared to 1063 s predicted by the numerical model. Figure 15 illustrates the numerical and experimental P–CMOD under identical sustained load conditions (90% and 95% of Pmax). The good agreements in both CMOD–t evolution and P–CMOD responses confirmed that the proposed method effectively captures the creep crack extension process of concrete under sustained loads.
In the present study, the tension-softening constitutive law employed is directly derived from long-term creep fracture test and provides a physically representative basis for time-dependent crack extension analyses. This direct implementation of the constitutive law allows for accurate characterization of σw distributions. Moreover, the numerical framework shows a significant advancement by integrating two crucial factors, i.e., the inherent viscoelastic behavior of concrete and time-dependent relaxation of σw. Therefore, the model effectively captures the nonlinear creep behavior of concrete exposed to high loading levels.
It is important to note that the numerical model exhibits a main limitation that the viscoelastic parameters of concrete are calibrated based on creep deformation data acquired from experiments conducted at relatively low load levels. This assumption indicates that these parameters remain valid when exposed to high-stress scenarios, while the accumulation of damage within the concrete microstructure under high loads has not been considered. Therefore, future investigations are certainly essential in the following two aspects. First, analytical and numerical investigations should be carried out to incorporate the size effect. It has been reported elsewhere that concrete exhibits pronounced size-dependent behavior [43,44,45,46,47], where its fracture properties vary with the dimensions of the specimen or structure. This enhancement would enable reliable prediction of creep fracture life for large-scale concrete structures, such as containment structures and concrete dams, thus allowing for rational assessment of crack growth risks and facilitating the implementation of timely, data-driven maintenance and repair strategies to ensure structural integrity over the long term. Second, the methodology can be further generalized to simulate the behavior of reinforced concrete (RC) structures under sustained loads. A practical approach would be to simplify the complicated interaction between reinforcements (e.g., steel and FRP bars) and concrete. Specifically, the bridging effect of the reinforcement can be idealized as a system of equivalent external forces or internal stresses acting on concrete elements. By integrating this simplification, the proposed time-dependent numerical method can be extended to analyze long-term deformation and potential cracking of RC members, providing a powerful tool for durability assessment and service life prediction of concrete structures. The current model can be further modified to better capture damage-induced nonlinear creep under high sustained load levels by incorporating a damage parameter or adopting a more advanced viscoelastic-damage constitutive model. These will be investigated in our future studies.

4. Conclusions

This paper has presented a numerical model for predicting time-dependent crack extension in concrete exposed to sustained loads. According to the results obtained, the main conclusions are made as follows.
(1)
Based on the energy equilibrium between external work and dissipation from elastic deformation, creep, and crack growth, a tension-softening constitutive model that quantifies the relation among sw, t, and COD is developed and implemented in the numerical model.
(2)
Calibration of creep parameters in the proposed tension-softening model, combined with the fracture properties of concrete, facilitates prediction of time-dependent crack evolution and failure time under sustained loads. This approach integrates viscoelastic behavior with linear elastic fracture mechanics (LEFM) and enables long-term structural assessments.
(3)
Through comparisons with two sets of experimental data given in the literature, it is demonstrated that the predicted CMOD versus time and crack length versus time curves match well with the test results. This confirms the predictive capability of the K IC i n i -based criterion in describing crack extension in concrete exposed to sustained loads.
(4)
The numerical results indicated that increasing the load level from 0.80 to 0.90 resulted in moderate decreases in CMODf and af by 13.33% and 11.94%, respectively, while the creep fracture lifetime (tf) reduced significantly from 4960 h to 5.21 h.
(5)
The K IC i n i -based numerical framework integrates t and COD as primary state variables, employing the generalized Kelvin chain model to describe the viscoelastic behavior of concrete. Therefore, it has potential applications for creep analysis of RC structures where the reinforcement bridging effect can be idealized as equivalent external forces.

Author Contributions

Conceptualization, Z.Y. (Zheng Yao) and L.W.; methodology, L.W.; software, J.D.; validation, Z.L., B.J. and Z.C.; formal analysis, J.D. and B.J.; investigation, L.W. and Z.Y. (Zhuohui Yu); data curation, Z.Y. (Zhuohui Yu) and L.W.; writing—original draft preparation, Z.Y. (Zheng Yao); writing—review and editing, L.W.; visualization, Z.L. and Z.C.; supervision, L.W.; project ad-ministration, L.W.; funding acquisition, L.W. All authors have read and agreed to the published version of the manuscript.

Funding

This research was funded by China Council Scholarship (CSC) under grant number [202208130081].

Data Availability Statement

The original contributions presented in this study are included in the article. Further inquiries can be directed to the corresponding author.

Acknowledgments

The financial support provided by the China Council Scholarship (CSC) from the Chinese government is greatly acknowledged. We would like to thank Xiaoyan Han, Yanjie Wang, and Xiaozhi Hu for their constructive suggestions during the initial discussion of the research idea.

Conflicts of Interest

On behalf of all authors, the corresponding author states that there are no conflicts of interest.

References

  1. Jiménez, S.; Cornejo, A.; Barbu, L.G.; Barbat, A.H.; Oller, S. Failure pressure analysis of a nuclear reactor prestressed concrete containment building. Eng. Struct. 2021, 236, 112052. [Google Scholar] [CrossRef]
  2. Meng, T.; Jason, L.; Heitz, T.; Richard, B. Numerical methodology on prestressed reinforced concrete containment building: Creep, aging and leakage. Application to VERCORS mock-up. Eng. Struct. 2023, 280, 115625. [Google Scholar] [CrossRef]
  3. Li, X.; Gong, J. Effects of steel liner corrosion on the leak-tightness of prestressed concrete containment structure under severe accident loads. Ann. Nucl. Energy 2023, 180, 109487. [Google Scholar] [CrossRef]
  4. Saliba, J.; Loukili, A.; Grondin, F.; Regoin, J.P. Experimental study of creep-damage coupling in concrete by acoustic emission technique. Mater. Struct. 2012, 45, 1389–1401. [Google Scholar] [CrossRef]
  5. Omar, M.; Loukili, A.; Pijaudier-Cabot, G.; Le Pape, Y. Creep-Damage Coupled Effects: Experimental Investigation on Bending Beams with Various Sizes. J. Mater. Civ. Eng. 2009, 21, 65–72. [Google Scholar] [CrossRef]
  6. Dong, W.; Zhang, X.; Zhang, B.S.; Wu, Q. Influence of sustained loading on fracture properties of concrete. Eng. Fract. Mech. 2018, 200, 134–145. [Google Scholar] [CrossRef]
  7. Dong, W.; Rong, H.; Wu, Q.; Li, J. Investigations on the FPZ evolution of concrete after sustained loading by means of the DIC technique. Constr. Build. Mater. 2018, 188, 49–57. [Google Scholar] [CrossRef]
  8. Yang, M.; Rong, H.; Dong, W.; Yuan, W.; Zhang, B.; Yu, L. Energy criterion for predicting crack initiation in mixed mode I-II fracture of concrete under long-term loading. Constr. Build. Mater. 2025, 489, 142210. [Google Scholar] [CrossRef]
  9. Rong, H.; Dong, W.; Zhang, X.; Zhang, B.S. Size effect on fracture properties of concrete after sustained loading. Mater. Struct. 2019, 52, 16. [Google Scholar] [CrossRef]
  10. Dong, W.; Li, J.; Zhang, X.; Zhang, B.S. Evolutions of SIFs of concrete under sustained loading by considering the effects of stress relaxations. J. Mater. Civ. Eng. ASCE 2019, 31, 4019287. [Google Scholar] [CrossRef]
  11. Dong, W.; Yuan, W.; Zhang, B.; Zhong, H. Energy-based fracture criterion of rock-concrete interface considering viscoelastic characteristics. J. Eng. Mech. 2022, 148, 04021155. [Google Scholar] [CrossRef]
  12. Yuan, W.; Dong, W.; Zhang, B.; Huo, J. Viscoelasticity-induced fracture behavior of rock-concrete interface after sustaining creep process. Cem. Concr. Compos. 2023, 136, 104901. [Google Scholar] [CrossRef]
  13. Yuan, W.; Dong, W.; Wang, S.; Yu, L. Time-Dependent Fracture Analysis of Rock-Concrete Interface Under Compression-Shear State: Modeling and Numerical Implementation. Rock Mech. Rock Eng. 2025, 1–20. [Google Scholar] [CrossRef]
  14. Yuan, W.; Dong, W.; Li, P.; Wang, S.; Wang, L.; Liu, C. Crack propagation process and lifetime prediction method of concrete-rock interface under constant loading. Int. J. Rock Mech. Min. Sci. 2024, 181, 105839. [Google Scholar] [CrossRef]
  15. Hillerborg, A. Theoretical analysis of the double torsion test. Cem. Concr. Res. 1983, 13, 69–80. [Google Scholar] [CrossRef]
  16. Han, X.; Wu, Z.; Gao, H.; Zheng, J.; Yu, R.C. Tension-softening constitutive model of concrete under sustained loading. Constr. Build. Mater. 2024, 421, 135623. [Google Scholar] [CrossRef]
  17. Han, X.Y.; Wu, Z.M.; Jia, M.D.; Zheng, J.J.; Yu, R.C. A new method for determining the tension-softening curve of concrete. Theor. Appl. Fract. Mech. 2023, 126, 103992. [Google Scholar] [CrossRef]
  18. Flores, R.D.; Hellmich, C.; Pichler, B. Nonlinear creep of concrete: Stress-activated stick–slip transition of viscous interfaces and microcracking-induced damage. Cement Concrete Res. 2025, 191, 107809. [Google Scholar] [CrossRef]
  19. Santhikumar, S.; Karihaloo, B.L. Time-dependent tension softening. Mech. Cohesive-Frict. Mater. Int. J. Exp. Model. Comput. Mater. Struct. 1996, 1, 295–304. [Google Scholar] [CrossRef]
  20. Zhou, F.P. Time-Dependent Crack Growth and Fracture in Concrete; IAEA: Vienna, Austria, 1992. [Google Scholar]
  21. Li, J.; Dong, W.; Zhang, B.; Zhou, X. Prediction on crack propagation of concrete due to time-dependent creep under high sustained loading. J. Mater. Civ. Eng. 2022, 34, 04021451. [Google Scholar] [CrossRef]
  22. Yuan, W.; Dong, W.; Zhang, B.; Zhong, H. Time-dependent fracture behavior of rock-Concrete interface coupling viscoelasticity and cohesive stress relaxation. J. Eng. Mech. 2023, 149, 04022100. [Google Scholar] [CrossRef]
  23. Bažant, Z.P. Size effect on structural strength: A review. Arch. Appl. Mech. 1999, 69, 703–725. [Google Scholar] [CrossRef]
  24. Carpinteri, A.; Massabó, R. Reversal in failure scaling transition of fibrous composites. J. Eng. Mech. 1997, 123, 107–114. [Google Scholar] [CrossRef]
  25. Ooi, E.T.; Yang, Z.J. Modelling crack propagation in reinforced concrete using a hybrid finite element-scaled boundary finite element method. Eng. Fract. Mech. 2011, 78, 252–273. [Google Scholar] [CrossRef]
  26. Yang, Z.J.; Deeks, A.J. Fully-automatic modelling of cohesive crack growth using a finite element-scaled boundary finite element coupled method. Eng. Fract. Mech. 2007, 74, 2547–2573. [Google Scholar] [CrossRef]
  27. Ooi, E.T.; Yang, Z.J. A hybrid finite element-scaled boundary finite element method for crack propagation modelling. Comput. Methods Appl. Mech. Eng. 2010, 199, 1178–1192. [Google Scholar] [CrossRef]
  28. Song, C.; Ooi, E.T.; Natarajan, S. A review of the scaled boundary finite element method for two-dimensional linear elastic fracture mechanics. Eng. Fract. Mech. 2018, 187, 45–73. [Google Scholar] [CrossRef]
  29. Dong, W.; Wu, Z.; Zhou, X. Calculating crack extension resistance of concrete based on a new crack propagation criterion. Constr. Build. Mater. 2013, 38, 879–889. [Google Scholar] [CrossRef]
  30. Wu, Z.M.; Wu, X.; Zheng, J.J.; Dong, W.; Wu, Y.-F. An analytical method for determining the crack extension resistance curve of concrete. Mag. Concr. Res. 2014, 66, 719–728. [Google Scholar] [CrossRef]
  31. Dong, W.; Zhou, X.; Wu, Z. On fracture process zone and crack extension resistance of concrete based on initial fracture toughness. Constr. Build. Mater. 2013, 49, 352–363. [Google Scholar] [CrossRef]
  32. Yin, T.; Li, X.; Xia, K.; Huang, S. Effect of thermal treatment on the dynamic fracture toughness of Laurentian granite. Rock Mech. Rock Eng. 2012, 45, 1087–1094. [Google Scholar] [CrossRef]
  33. Yin, T.; Li, X.; Cao, W.; Xia, K. Effects of thermal treatment on tensile strength of Laurentian granite using Brazilian test. Rock Mech. Rock Eng. 2015, 48, 2213–2223. [Google Scholar] [CrossRef]
  34. Yin, T.; Zhang, S.; Li, X.; Bai, L. A numerical estimate method of dynamic fracture initiation toughness of rock under high temperature. Eng. Fract. Mech. 2018, 204, 87–102. [Google Scholar] [CrossRef]
  35. Dong, W.; Yang, D.; Zhang, B.; Wu, Z. Rock-concrete interfacial crack propagation under mixed mode I-II fracture. J. Eng. Mech. 2018, 144, 04018039. [Google Scholar] [CrossRef]
  36. Dong, W.; Wu, Z.; Tang, X.; Zhou, X. A comparative study on stress intensity factor-based criteria for the prediction of mixed mode I-II crack propagation in concrete. Eng. Fract. Mech. 2018, 197, 217–235. [Google Scholar] [CrossRef]
  37. Dong, W.; Wu, Z.; Zhou, X.; Wang, C. A comparative study on two stress intensity factor-based criteria for prediction of mode-I crack propagation in concrete. Eng. Fract. Mech. 2016, 158, 39–58. [Google Scholar] [CrossRef]
  38. Wang, Y.J.; Zeng, M.H.; Liu, H.B.; Yang, J.Q.; Li, X.X.; Hu, X.Z. A comparative study of nil-SIF-based and initial fracture toughness-based criteria for prediction of mode-I crack propagation in concrete at low temperatures. Eng. Fract. Mech. 2025, 317, 110909. [Google Scholar] [CrossRef]
  39. Xu, S.; Reinhardt, H.W. Determination of double-K criterion for crack propagation in quasi-brittle fracture, Part I: Experimental investigation of crack propagation. Int. J. Fract. 1999, 98, 111–149. [Google Scholar] [CrossRef]
  40. Xu, S.; Reinhardt, H.W. Determination of double-K criterion for crack propagation in quasi-brittle fracture, Part II: Analytical evaluating and practical measuring methods for three-point bending notched beams. Int. J. Fract. 1999, 98, 151–177. [Google Scholar] [CrossRef]
  41. GB 175-2020; Common Portland Cement. China Building Industry Press: Beijing, China, 2020.
  42. GB 50010-2010; Code for Design of Concrete Structures. China Building Industry Press: Beijing, China, 2010.
  43. Hu, X.; Wittmann, F. Size effect on toughness induced by crack close to free surface. Eng. Fract. Mech. 2000, 65, 209–221. [Google Scholar] [CrossRef]
  44. Duan, K.; Hu, X.Z.; Wittmann, F.H. Size effect on fracture resistance and fracture energy of concrete. Mater. Struct. 2003, 36, 74–80. [Google Scholar] [CrossRef]
  45. Duan, K.; Hu, X.; Wittmann, F.H. Boundary effect on concrete fracture and non-constant fracture energy distribution. Eng. Fract. Mech. 2003, 70, 2257–2268. [Google Scholar] [CrossRef]
  46. Hu, X.; Duan, K. Mechanism behind the size effect phenomenon. J. Eng. Mech. 2010, 136, 60–68. [Google Scholar] [CrossRef]
  47. Hu, X.; Duan, K. Size effect and quasi-brittle fracture: The role of FPZ. Int. J. Fract. 2008, 154, 3–14. [Google Scholar] [CrossRef]
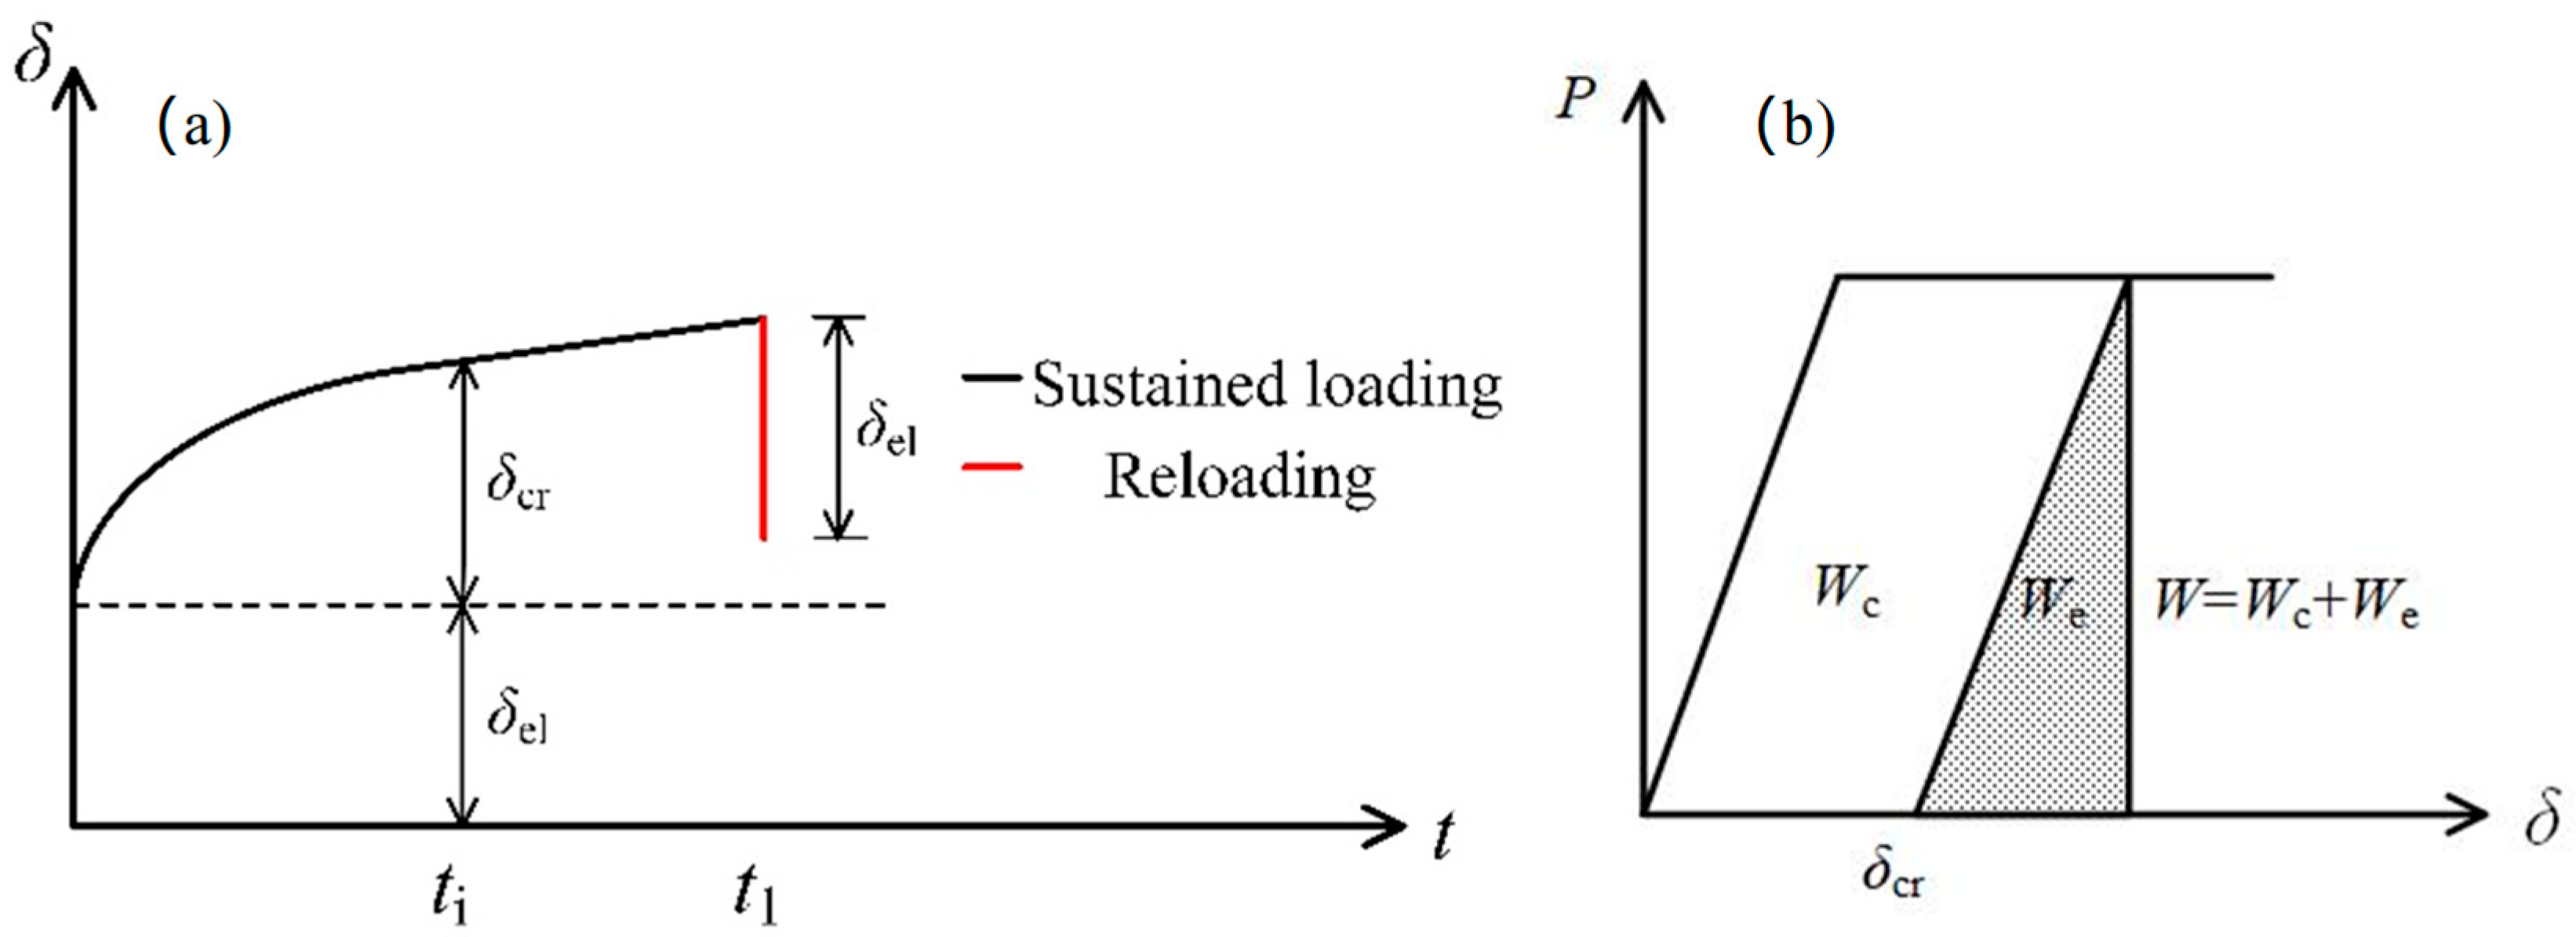
Figure 1. Schematic diagram of (a) δ-t curve and (b) P-δ curve during creep testing. δ is the total deformation; δel is the elastic deformation; δcr is the creep deformation; t is the loading time; t1 is the loading time at the initiation of unloading; P is the external load; W is the work exerted by the external force; We is the elastic strain energy of the creep specimen; and Wc is the energy dissipated by creep deformation.
Buildings 15 04180 g001
Figure 2. P versus δ response subjected to creep fracture. Pc is constant load; Q is the work contributed by external force; E is the energy for crack extension; δp is residual deformation after unloading; and δ1 is the creep deformation.
Buildings 15 04180 g002
Figure 3. (a) Creep crack extension; (b) P-δ response; and (c) s-w relationship. w is the crack opening displacement (COD); w(tn) is the COD at the loading time tn; a0 is the initial crack length; Δa(tn) is the crack extension at tn; δ(tn) is the creep deformation at tn; and s is the cohesive stress.
Buildings 15 04180 g003
Figure 4. FE model of 3-p-b beam: (a) mesh division of beam; (b) mesh division of region near crack tip.
Buildings 15 04180 g004
Figure 5. Deformation diagram for 3-p-b specimen S-0.90 obtained from numerical analysis, where t is the loading time in hours (h). Crack propagation at the time (a) t = 0 h; (b) t = 6560 h; and (c) t = 13,120 h.
Buildings 15 04180 g005
Figure 6. Flowchart of crack extension in concrete under sustained loads.
Buildings 15 04180 g006
Figure 7. Particle size gradation curve of coarse aggregate and sand.
Buildings 15 04180 g007
Figure 8. Schematic diagram of 3-p-b beam specimen under sustained loads. B and D represent beam width and height, respectively.
Buildings 15 04180 g008
Figure 9. Measurements of (a) crack-tip strain and δ and (b) crack growth length and CMOD [16].
Buildings 15 04180 g009
Figure 10. Test results of (a) P-ε curve and (b) P-CMOD curve [16].
Buildings 15 04180 g010
Figure 11. Creep fracture tests on 3-p-b beam specimens [16].
Buildings 15 04180 g011
Figure 12. Test results of CMOD versus t curve and crack length versus t curve for different load levels [16]. (a) CMOD-t curve for specimen S-0.80; (b) CMOD-t curve for specimen S-0.85; (c) CMOD-t curve for specimen S-0.90; (d) a-t curve for specimen S-0.80; (e) a-t curve for specimen S-0.85; and (f) a-t curve for specimen S-0.90.
Buildings 15 04180 g012
Figure 13. Comparison between experimental and numerical results under different load levels: (a) CMOD-t curve for specimens S-0.80; (b) a-t curve for specimens S-0.80; (c) a-t curve for specimens S-0.85; (d) a-t curve for specimens S-0.85; (e) CMOD-t curve for specimens S-0.90; and (f) a-t curve for specimens S-0.90.
Buildings 15 04180 g013
Figure 14. Comparison of CMOD-t curve obtained from numerical analysis and Li et al. [21]’s test. (a) specimen under creep load of 90% Pmax; and (b) specimen under creep load of 95% Pmax.
Buildings 15 04180 g014
Figure 15. Comparison of P-CMOD curve obtained from numerical analysis and Li et al. [21]’s test. (a) specimen under creep load of 90% Pmax; and (b) specimen under creep load of 95% Pmax.
Buildings 15 04180 g015
Table 1. Parameters employed in numerical analysis for Specimen S-0.90-1.
Specimen No.Pc (kN)Δa1 (mm)Δd (mm)Δt (h)
S-0.90-14.33610.01
Table 2. Chemical composition of cement.
CompositionCaOSiO2Al2O3Fe2O3MgOSO3
Content (%)59.3021.916.273.781.642.41
Table 3. Mix design of concrete.
Cement (kg/m3)Water (kg/m3)Fine Aggregate (kg/m3)Coarse Aggregate (kg/m3)
3251956961184
Table 4. Mechanical properties of concrete (average ± standard derivation).
fcu (MPa)ft (MPa)νEc (GPa)
49.70 ± 1.323.82 ± 0.340.20 ± 0.0034.41 ± 2.67
Table 5. Results of static 3-p-b fracture tests (average ± standard derivation) [16].
Pini (kN)Pmax (kN)Pini/PmaxFracture Energy
GF (N/mm)
Initial Fracture
Toughness K Ic ini
(MPa·m1/2)
Unstable Fracture Toughness K Ic un
(MPa·m1/2)
3.07 ± 0.254.81 ± 0.470.638 ± 0.48112.71 ± 13.470.5907 ± 0.251.89 ± 0.17
Table 6. Test results for all specimens at creep failure [16].
Specimen No.Pc (kN)tf (h)CMODf (μm)af (mm)
S-0.80-13.854652.72 (194 d)7869.58
S-0.80-26216.00 (259 d)8071.69
S-0.80-34223.82 (176 d)7468.33
S-0.80-42759.37 (115 d)8372.60
S-0.80-56885.68 (287 d)7375.93
S-0.80-67493.84 (312 d)8872.21
Average3.855371.91 ± 1641.51 (224 d)79 ± 5.1571.72 ± 2.41
S-0.85-14.091390.49 (58 d)7367.94
S-0.85-2847.21 (35 d)7863.72
S-0.85-3726.54 (30 d)7968.68
S-0.85-4338.72 (14 d)6860.87
S-0.85-51181.17 (49 d)7160.94
S-0.85-61518.17 (63 d)8269.44
Average4.091000.38 ± 406.04 (42 d)75 ± 4.8865.27 ± 3.57
S-0.90-14.333.426461.13
S-0.90-24.806859.83
S-0.90-34.046561.59
S-0.90-45.527359.90
S-0.90-55.726965.34
S-0.90-63.506058.99
Average4.334.50 ± 0.9167 ± 4.1161.13 ± 2.07
Table 7. Comparison of average values of tf, CMODf, and af at failure.
Specimen No.tf num
(h)
tf exp
(h)
CMODf num (μm)CMODf exp (μm)af num
(mm)
af exp
(mm)
S-0.804960537275796772
S-0.851194100069756265
S-0.905.214.5065675961
Disclaimer/Publisher’s Note: The statements, opinions and data contained in all publications are solely those of the individual author(s) and contributor(s) and not of MDPI and/or the editor(s). MDPI and/or the editor(s) disclaim responsibility for any injury to people or property resulting from any ideas, methods, instructions or products referred to in the content.