Article

Performance and Microstructure Characterization of Grouting Materials for Tailings Mined-Out Area Prepared by All-Solid Waste

1
School of Mechanical Engineering, North China University of Water Resources and Electric Power, Zhengzhou 450045, China
2
School of Civil Engineering and Communication, North China University of Water Resources and Electric Power, Zhengzhou 450045, China
3
China MCC5 Group Corp. Ltd., Zhengzhou 610063, China
4
Henan Building Materials Research and Design Institute Co, Ltd., Zhengzhou 450018, China
*
Author to whom correspondence should be addressed.
Buildings 2025, 15(22), 4177; https://doi.org/10.3390/buildings15224177
Submission received: 28 October 2025 / Revised: 12 November 2025 / Accepted: 17 November 2025 / Published: 19 November 2025
(This article belongs to the Section Building Materials, and Repair & Renovation)

Abstract

This study aims to develop a high-performance grouting material for mine goaf backfilling, creating a green and low-carbon cementitious alternative by utilizing coal gangue and sludge as the primary precursors. Based on an orthogonal experimental design, the effects of four factors including the coal gangue/sludge ratio, activator modulus, water–binder ratio, and sodium-to-aluminum ratio on the compressive strength of the geopolymer were systematically investigated. The mineral composition and microstructure of the geopolymer were analyzed using microscopic test methods such as XRD and SEM. The test results indicate that the water–binder ratio has the most significant effect on the polymerization performance of the coal gangue/sludge-based geopolymer (CSG), with compressive strength increasing as the water–binder ratio decreases. The Ca2+ provided by the sludge to the reaction system directly promotes the formation of new calcium-containing products such as anorthite and calcium silicate hydrate, which play an important role in improving the strength of geopolymers. Moreover, the developed CSG exhibits a significantly lower carbon footprint compared to conventional cement-based grouting materials, aligning with the goals of sustainable and green construction. When the coal gangue/sludge ratio is 7:3, the water–binder ratio is 0.3, the sodium-to-aluminum ratio is 0.64, and the activator modulus is 1.0, the 3-day compressive strength (CS) of the geopolymer reaches 34.5 MPa, demonstrating its potential as an effective and environmentally friendly grouting material for goaf applications.

1. Introduction

Coal mine mined-out areas are cavities formed beneath the surface due to excavation. If not properly handled, they are likely to cause cracks or even collapse on the surface, which seriously threatens the safety of ground buildings, transportation facilities, and residents’ lives and property. Therefore, grouting in coal mine goaf plays an important role in ensuring mine safety, environmental protection, and economic benefits. At present, the most widely used grouting materials are cement-based materials, but the use of cement-based materials has caused a huge economic burden to enterprises, and the strength growth cycle of Portland cement is long and the growth rate is relatively slow. Even if some early strength agents, anti-cracking agents, and other admixtures are added, the effect is not ideal, and the production process is accompanied by a large amount of carbon emissions [1]. Combined with China‘s current implementation of the ‘2030 carbon peak, 2060 carbon neutral‘ target, it is urgent to find a green, high-strength, and early strength grouting material.
Geopolymer is a new type of green cementitious material characterized by early strength and fast setting, acid resistance, and corrosion resistance. The greenhouse gas produced by manufacturing is significantly lower than that of traditional silicate concrete [2], a feature which has attracted widespread attention from scholars. Zhou et al. [3] employed the response surface methodology to optimize a geopolymer grouting material primarily composed of coal gangue, fly ash, and cement, achieving a 28-day compressive strength of 8.79 MPa. While this study confirmed the feasibility of utilizing coal gangue, the use of cement undoubtedly constrained the material’s environmental benefits. Sha et al. [4] studied the applicability of different grouting materials to repair the tunnel seepage problem, and considered that the polymer cement slurry was suitable for the treatment of fissure-dense seepage area or tunnel surface seepage area. Guo et al. [5] prepared a coal-based solid waste geopolymer grouting material with coal gangue and fly ash as the main cementitious material mixed with desulfurized gypsum and alkaline activator, and completed its application in practical engineering. The strength reached 6.9 MPa. These studies demonstrate potential, yet the (partial) reliance on cement persists as an environmental drawback, prompting the need for truly cement-free, all-solid-waste systems. The new cementitious material obtained by replacing cement with some solid wastes has the advantages of a short setting time and good fluidity. However, the use of cement still causes a lot of carbon emissions and environmental pollution. Therefore, research into all-solid-waste geopolymer has gradually become the focus of scholars.
Feng et al. [6] used metakaolin and slag as precursors to prepare geopolymer grouting materials. It is considered that when the slag substitution rate is 45%, the comprehensive performance of geopolymer is the best, and the 24 h CS reaches 21.2 MPa, which can be applied to some rapid grouting reinforcement projects. Li et al. [7] studied the grouting material of red mud–blast furnace slag–steel slag ternary system. It is considered that when the steel slag content is 10%, the mechanical properties of the red mud–blast furnace slag binary system can be improved, and the 28d strength can reach 12.78 MPa. Guo et al. [8] believed that when the ratio of coal gangue/slag/fly ash was 5: 4: 1, the modulus of sodium silicate was 1.64 M, the content of sodium silicate was 6.7%, and the content of Na2O was 5%, the performance of low-cost geopolymer grouting material was the best, and the 28d CS was 11.49 MPa. Guo et al. [9] believed that when the ratio of coal gangue to fly ash and bentonite was 23:22:5 and the NaOH content was 4%, the prepared grouting material had the best performance, and the CS was 11.2 MPa after 10 days of curing. Huang et al. [10] increased the calcium content in coal gangue geopolymer by adding slag and slaked lime, which can significantly improve the mechanical properties of geopolymer. Collectively, these studies on all-solid-waste systems [6,7,8,9,10] highlight a common and effective strategy: the incorporation of calcium-rich components (e.g., slag, steel slag) to form strength-enhancing phases (like C-S-H) alongside the geopolymeric gel, thereby addressing a key limitation of many low-calcium precursors.
The importance of evaluating material performance under specific service environments is increasingly recognized, as highlighted by recent developments in high-durability cementitious composites for marine conditions [11]. This underscores the necessity of developing tailored grouting materials, such as the one proposed here, capable of performing reliably in challenging settings like coal mine goafs. Fly ash and slag, which have prominent pozzolanic activity, are the most common solid wastes used to produce geopolymers [12]. Coal gangue, however, is rarely studied as a geopolymer precursor due to its chemical inertness. Although mechanical grinding and high-temperature calcination can increase the activity of coal gangue, the strength is still lower than that of geopolymers prepared by traditional matrix materials.
To address this limitation, particularly the low calcium content of coal gangue, the incorporation of calcium-rich waste materials has been proposed. Sludge from wastewater treatment is a promising candidate for this purpose. Building on recent insights that highlight the effectiveness of thermal pretreatment in activating sludge for use in cementitious systems [13], this study employs calcined sludge to provide the reactive calcium that coal gangue lacks. This synergistic approach leverages the fact that calcined sludge can serve as a source of active CaO, promoting the formation of strength-contributing phases such as C-S-H in geopolymer systems [14,15,16]. By utilizing sludge from a mixing station’s sewage treatment process as a calcareous component [17,18], this work aims to develop a high-performance, all-solid-waste grouting material, simultaneously addressing the challenges of sludge disposal and enhancing geopolymer properties.
This paper presents a study on geopolymer grouting materials prepared from coal gangue and sludge. Through an orthogonal experimental design, the influence of the coal gangue/sludge ratio, water–binder ratio, alkali activator modulus, sodium-to-aluminum ratio, and other factors on the mechanical properties were determined. Microstructural analysis via XRD and SEM revealed the complementary reaction mechanism of the sludge–coal gangue system and linked the pore structure characteristics to the macroscopic mechanical performance. The combination of macro- and micro-scale analyses thereby successfully identified an optimal mix ratio suitable for practical engineering use.

2. Materials

2.1. Coal Gangue

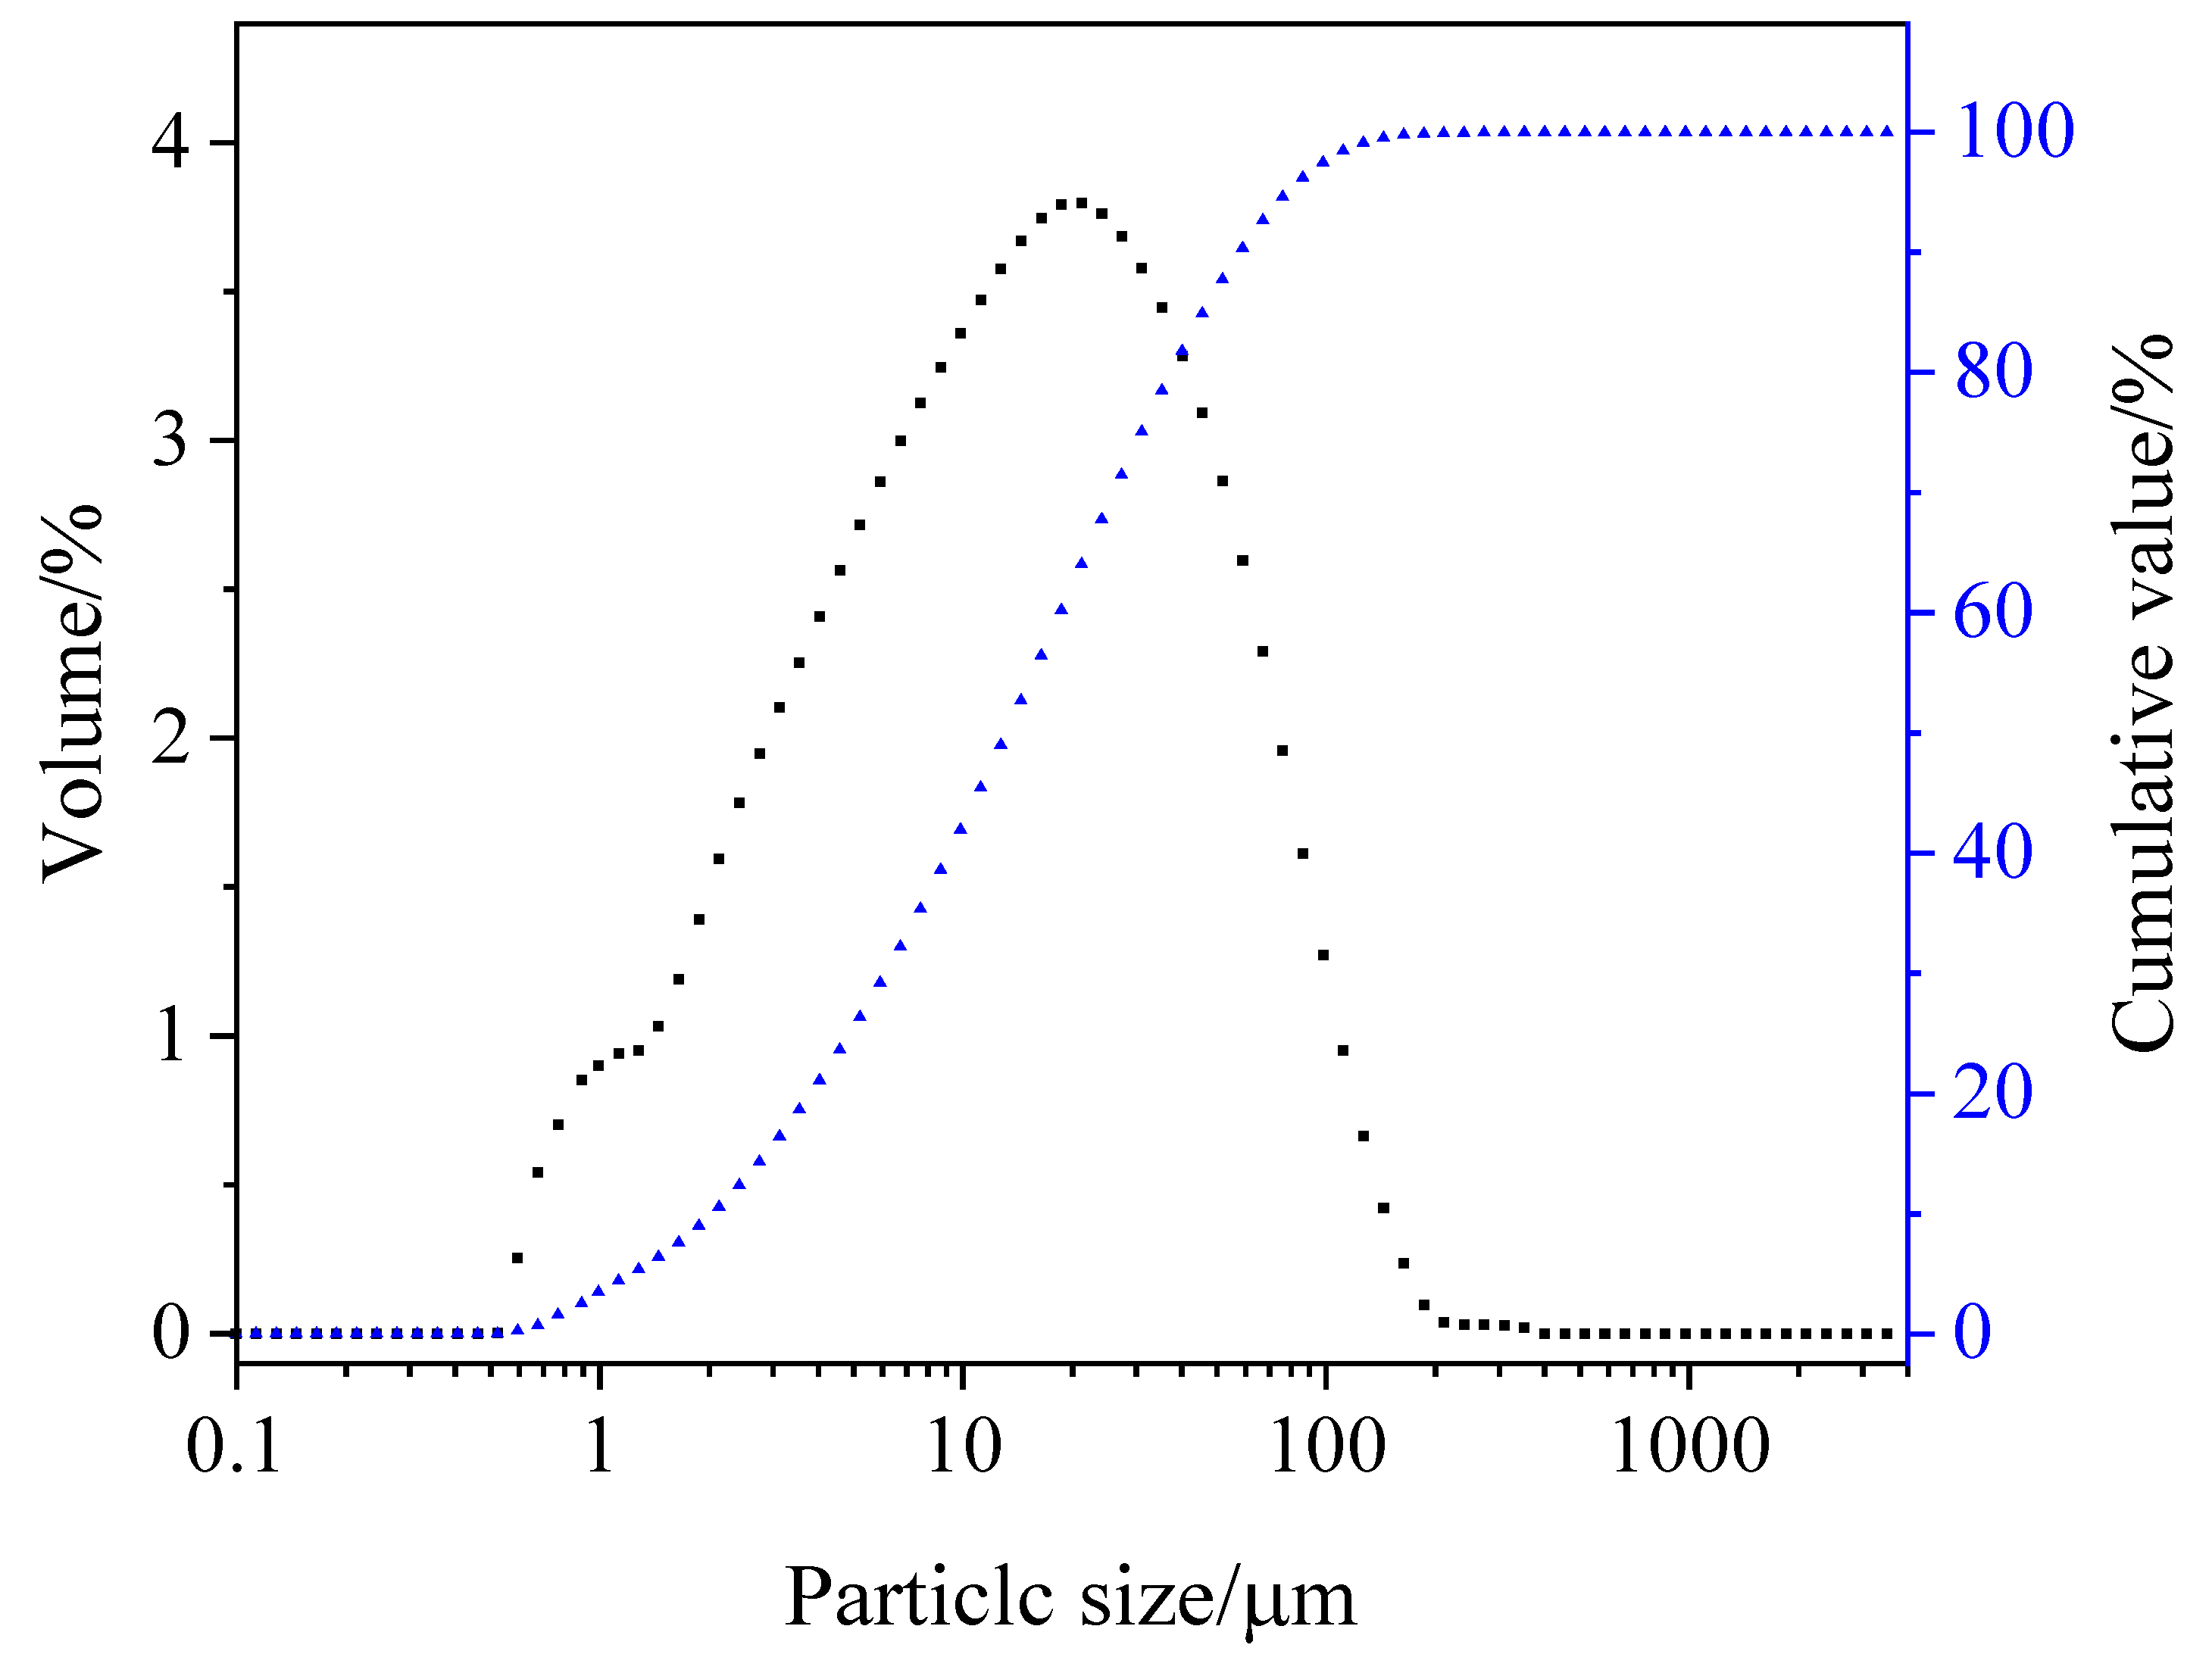
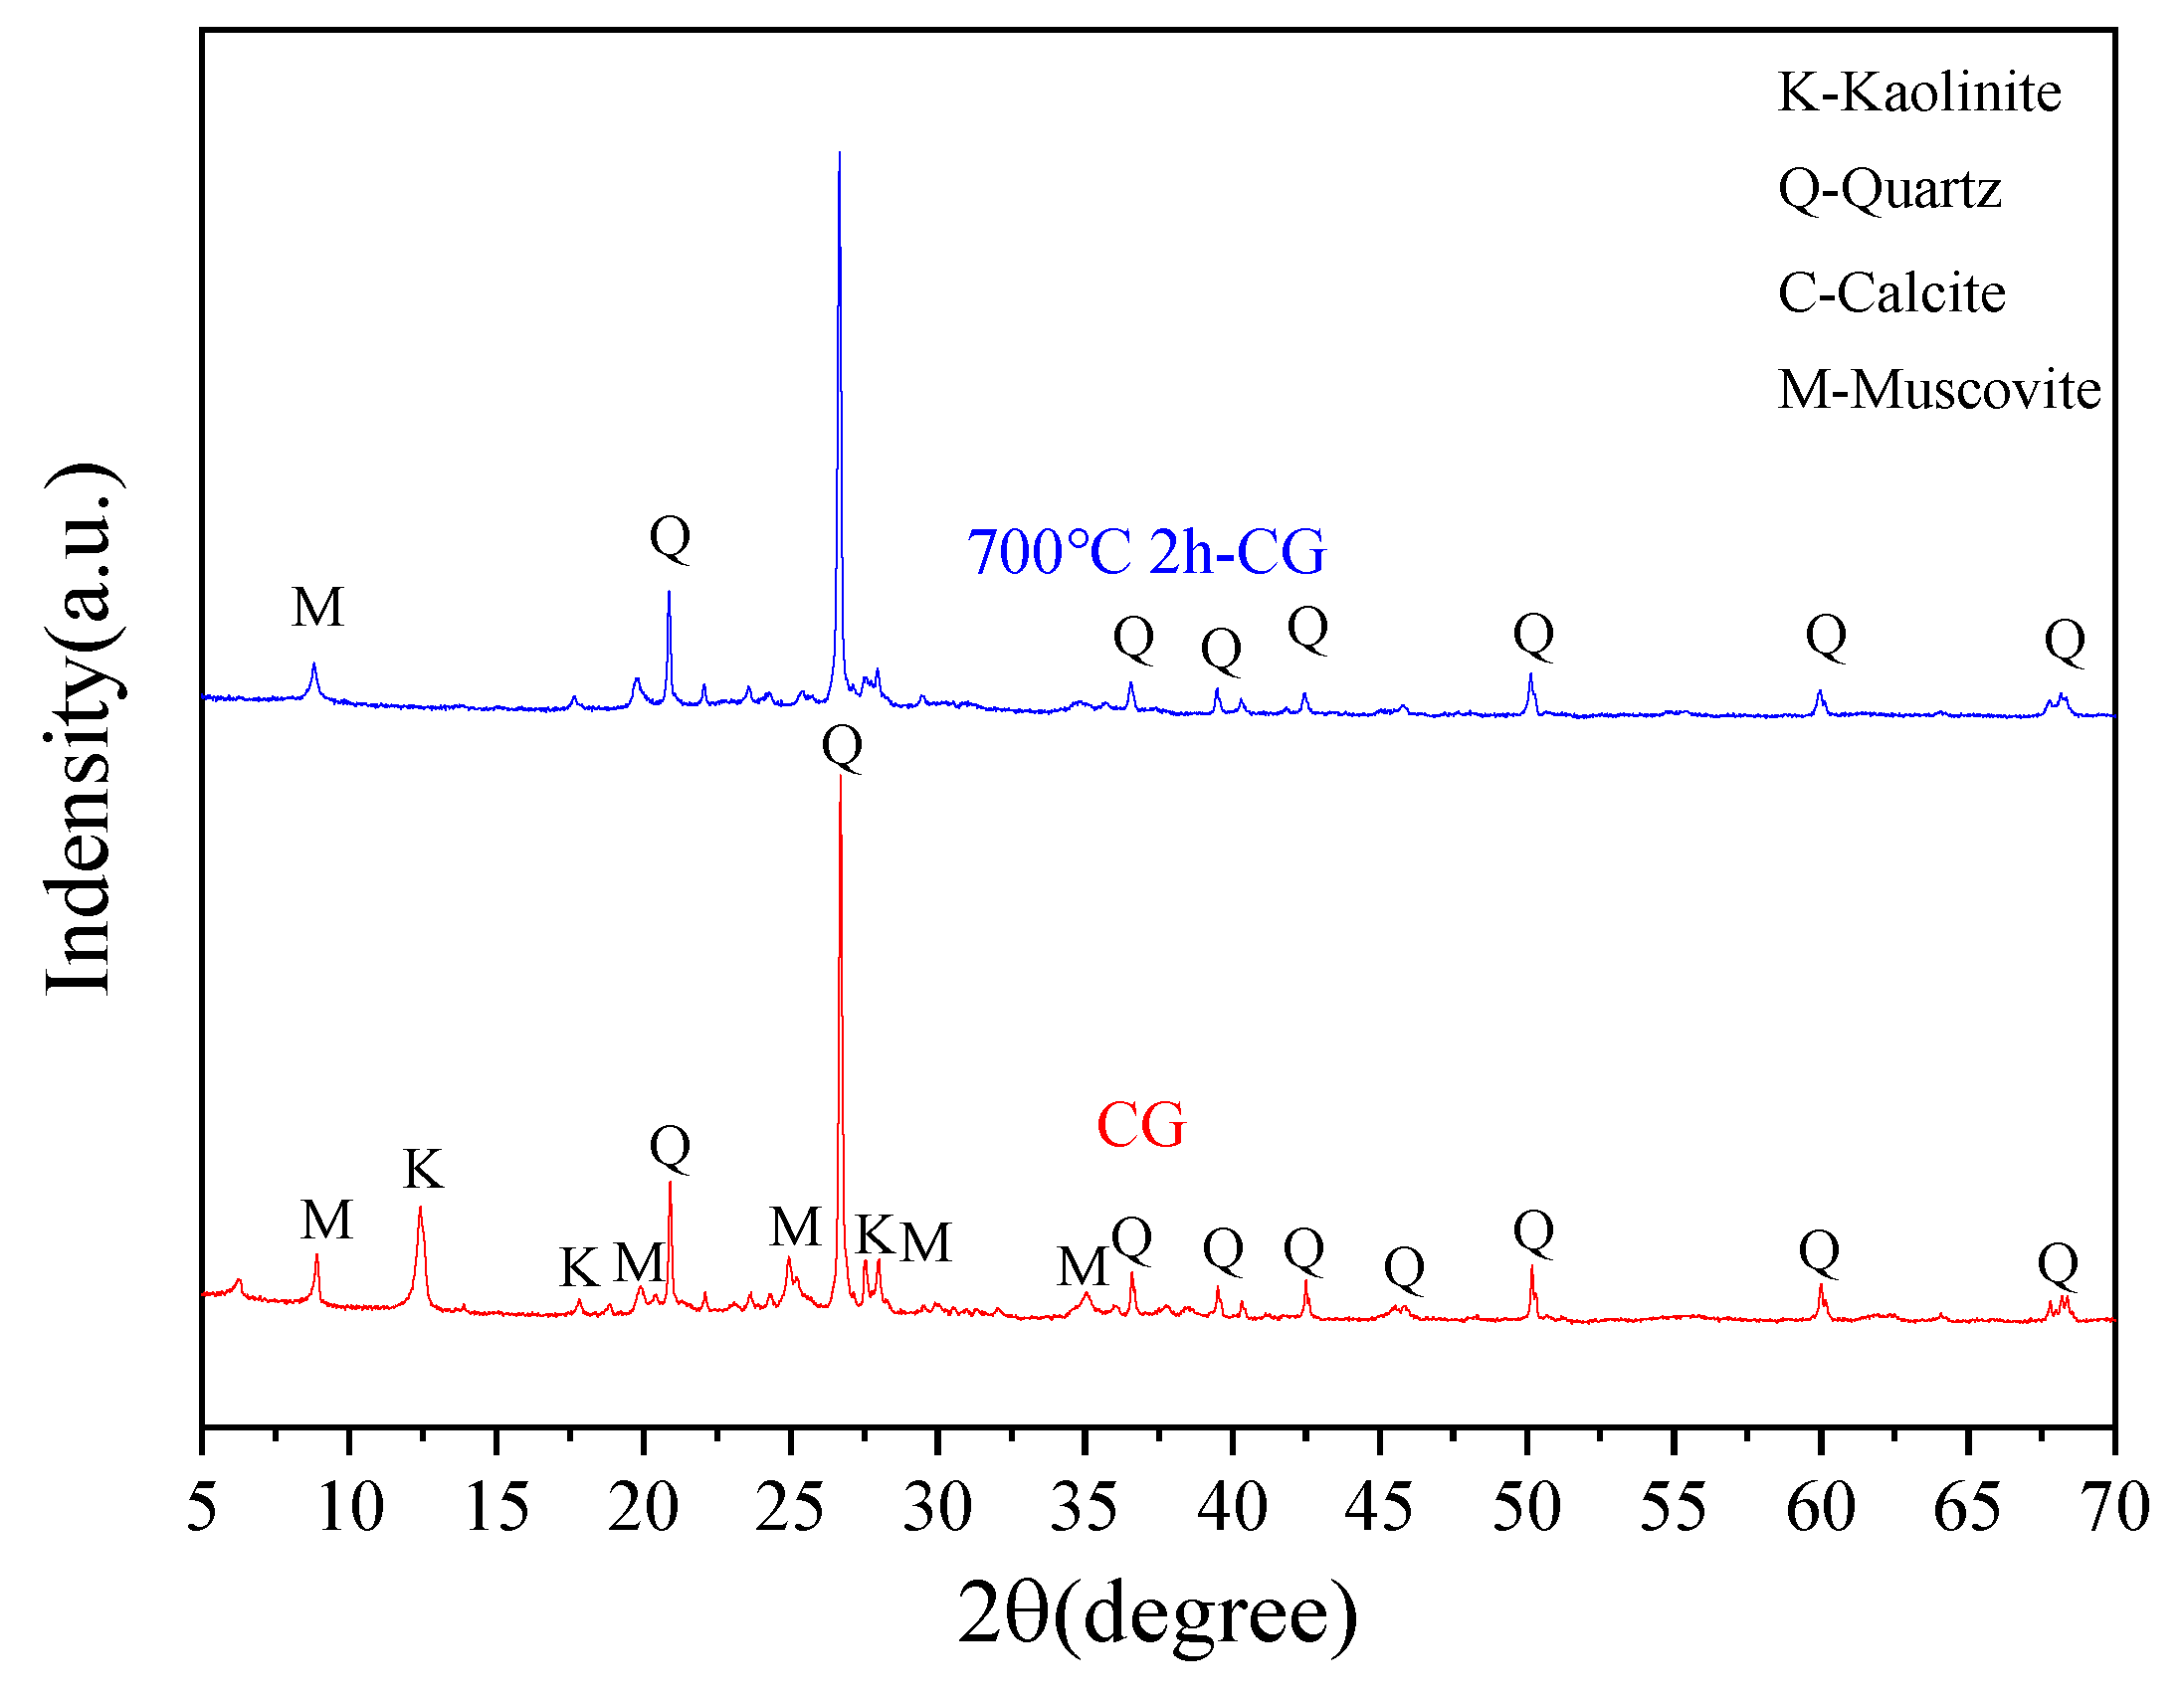
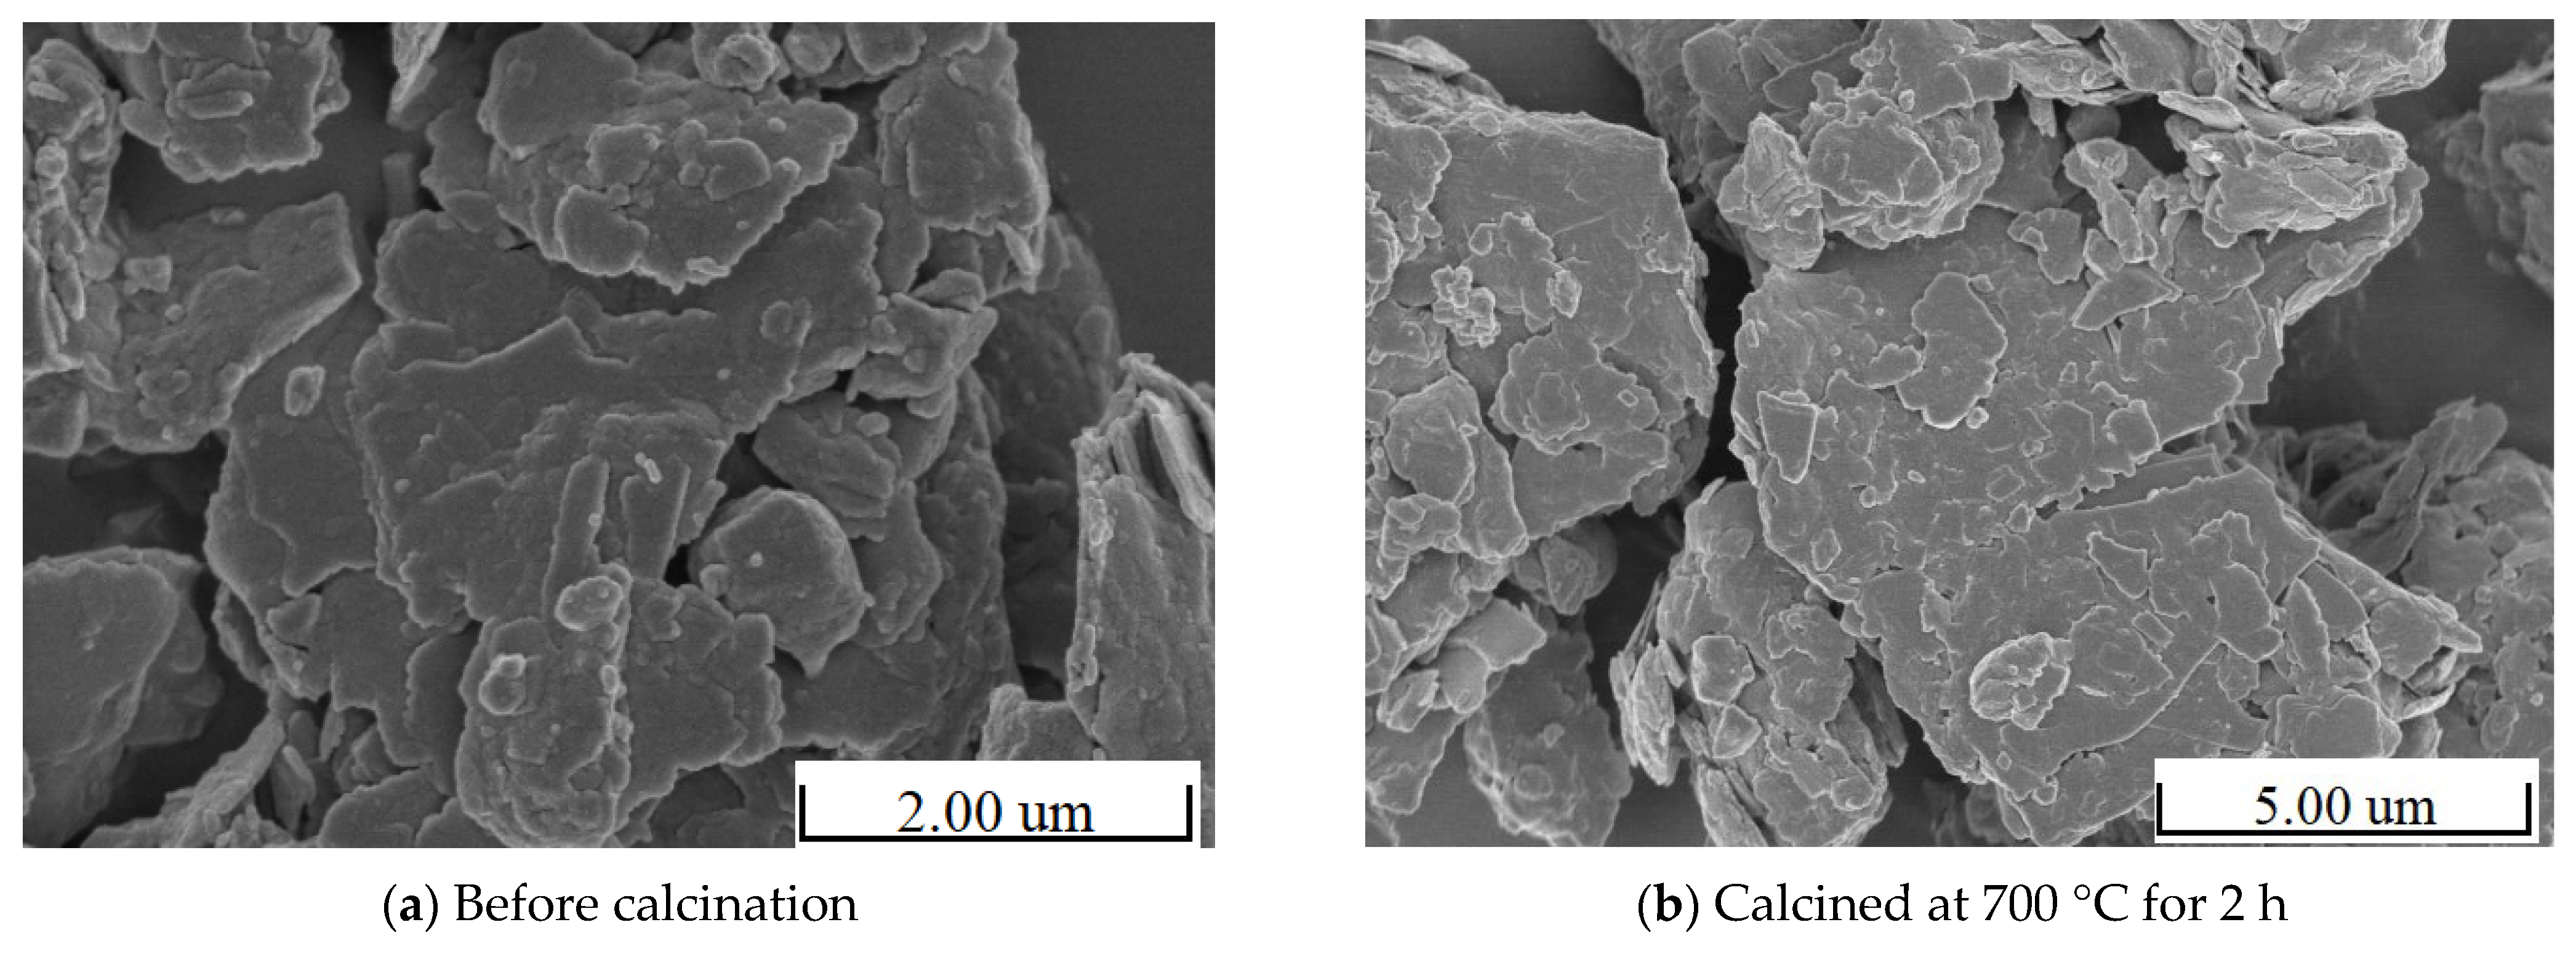
The coal gangue is produced in Gongyi City, Henan Province, China. The color is gray-black. After being calcined at 700 °C for 2h, the coal gangue is black (Figure 1), the fineness is 325 mesh, the density is 1.4 g/cm3, and the specific surface area is 404.6 m2/kg; the particle size distribution is shown in Figure 2 and the chemical composition is shown in Table 1. The main mineral composition of coal gangue is kaolinite, quartz, calcite, and muscovite. The XRD patterns are shown in Figure 3. Compared with before calcination, high-temperature calcination weakens the diffraction peak of kaolinite and enhances the diffraction peak of quartz. According to the results of scanning electron microscopy (Figure 4b), compared with the structure before calcination (Figure 4a), the structure in the SEM image is more compact, the kaolinite is reduced, and the quartz particles are increased. This is because the main mineral components of coal gangue (kaolinite, muscovite, etc.) are decomposed into amorphous SiO2 and Al2O3 under high-temperature calcination, making it more active.
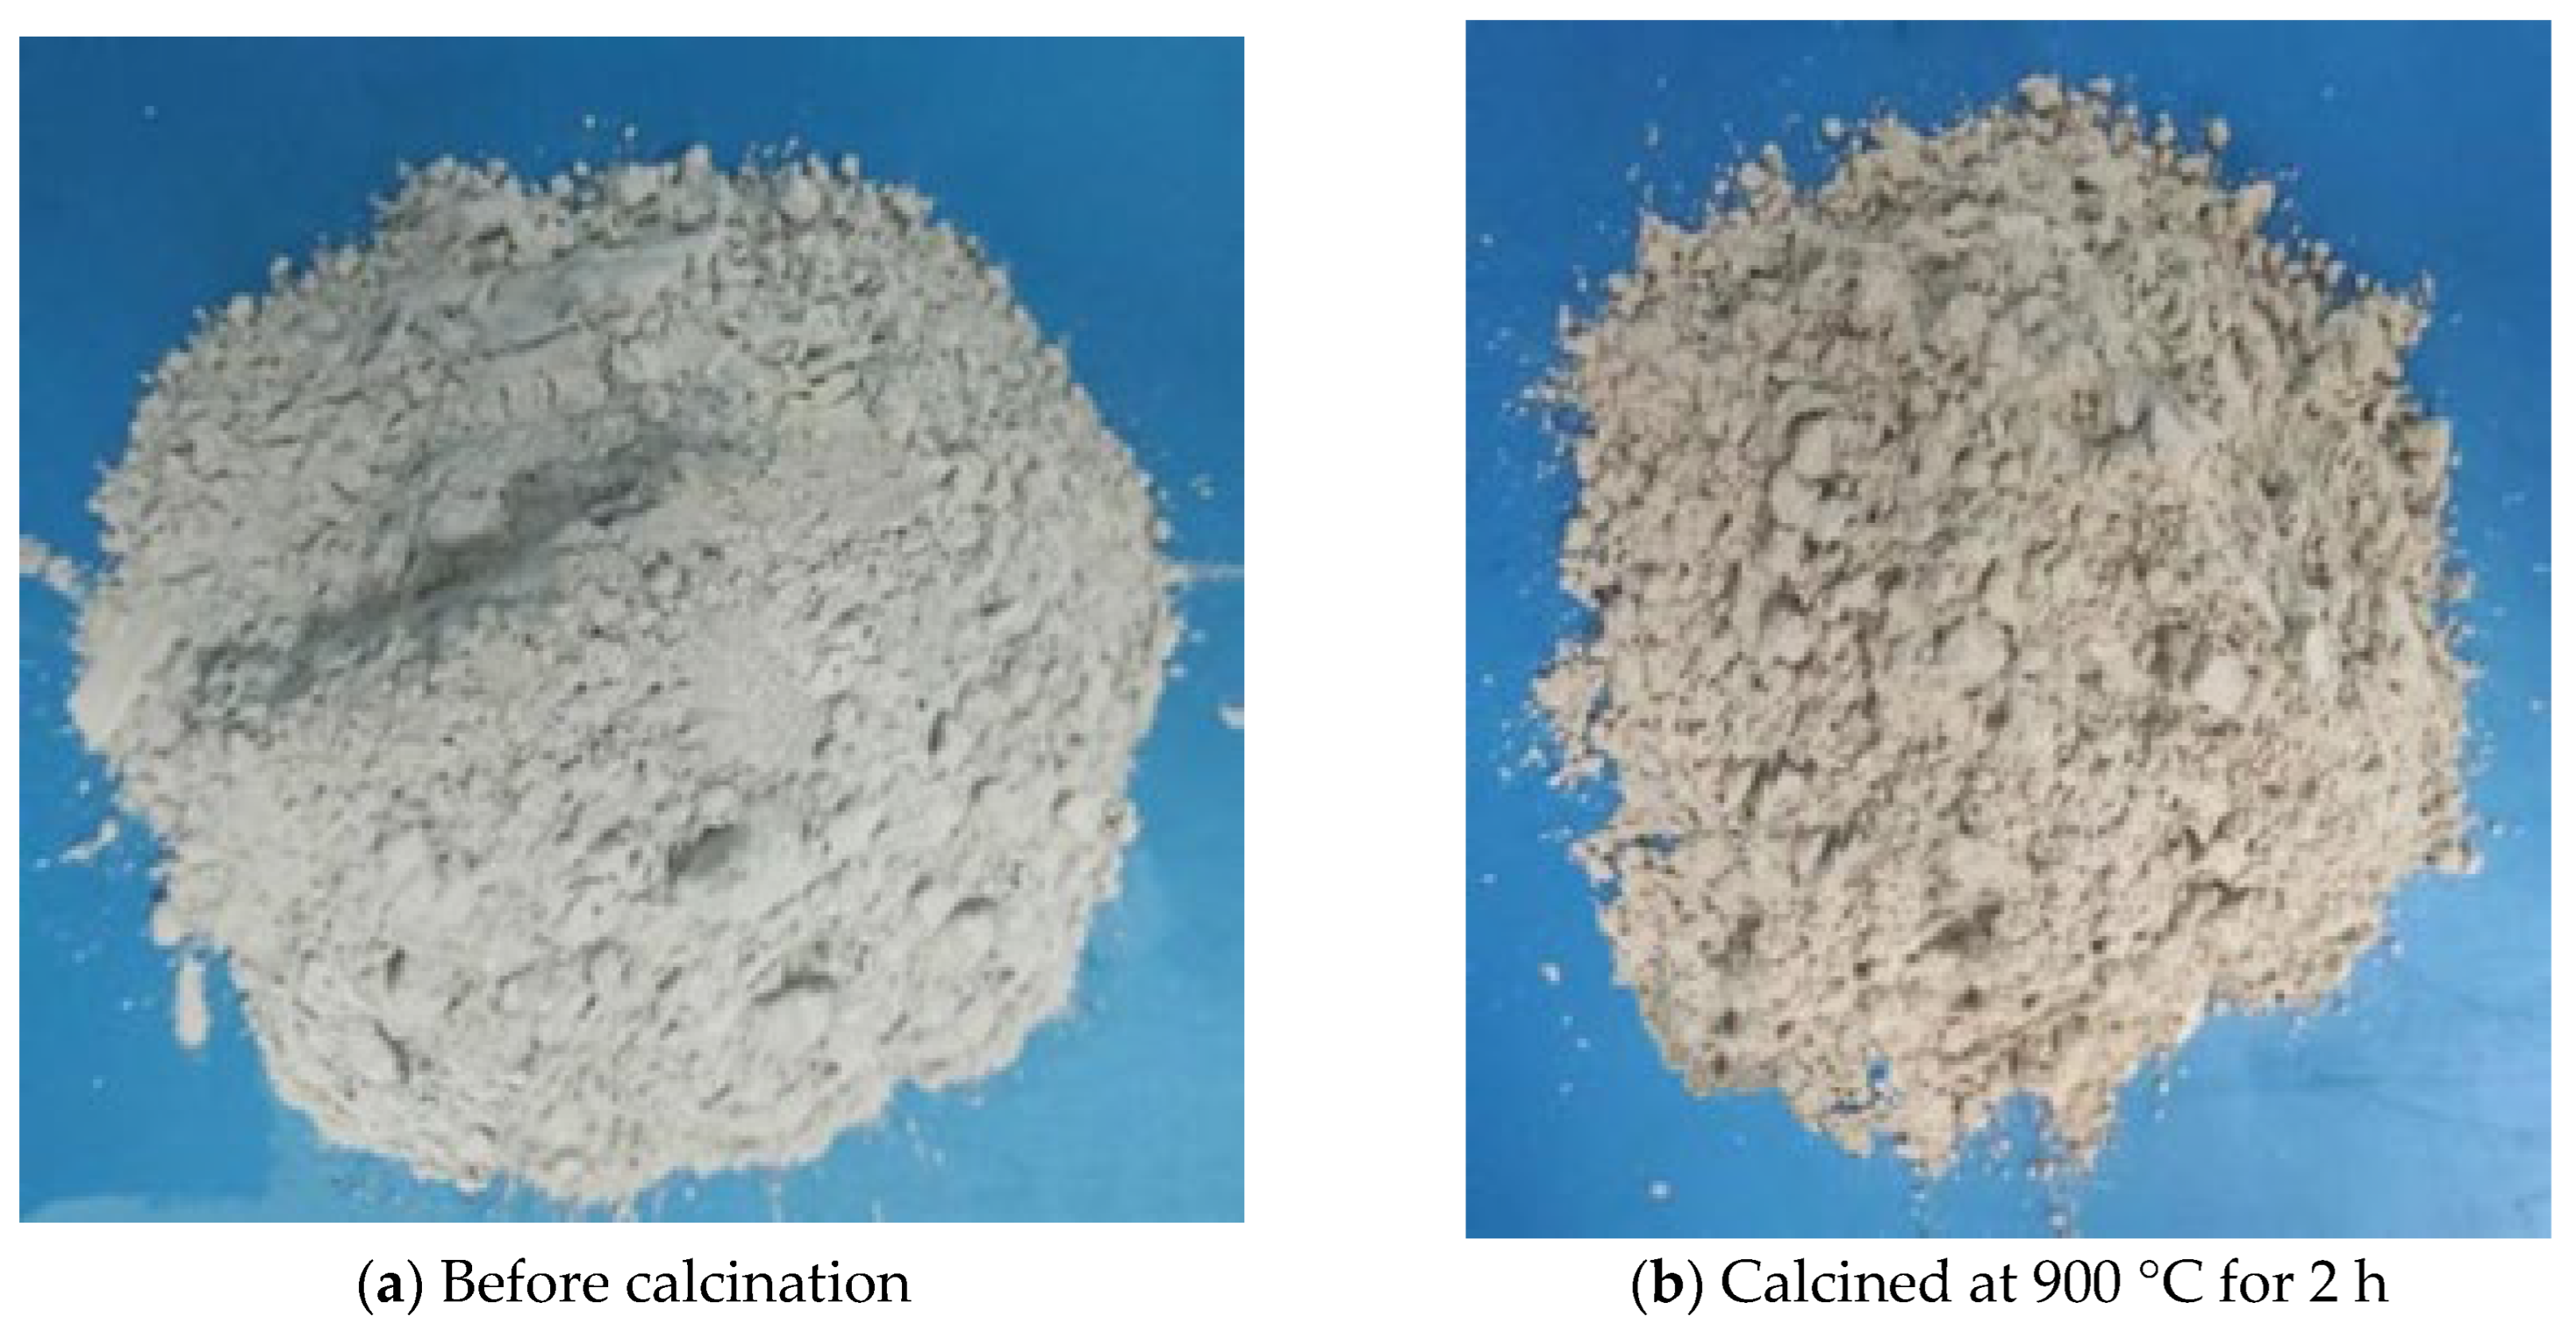
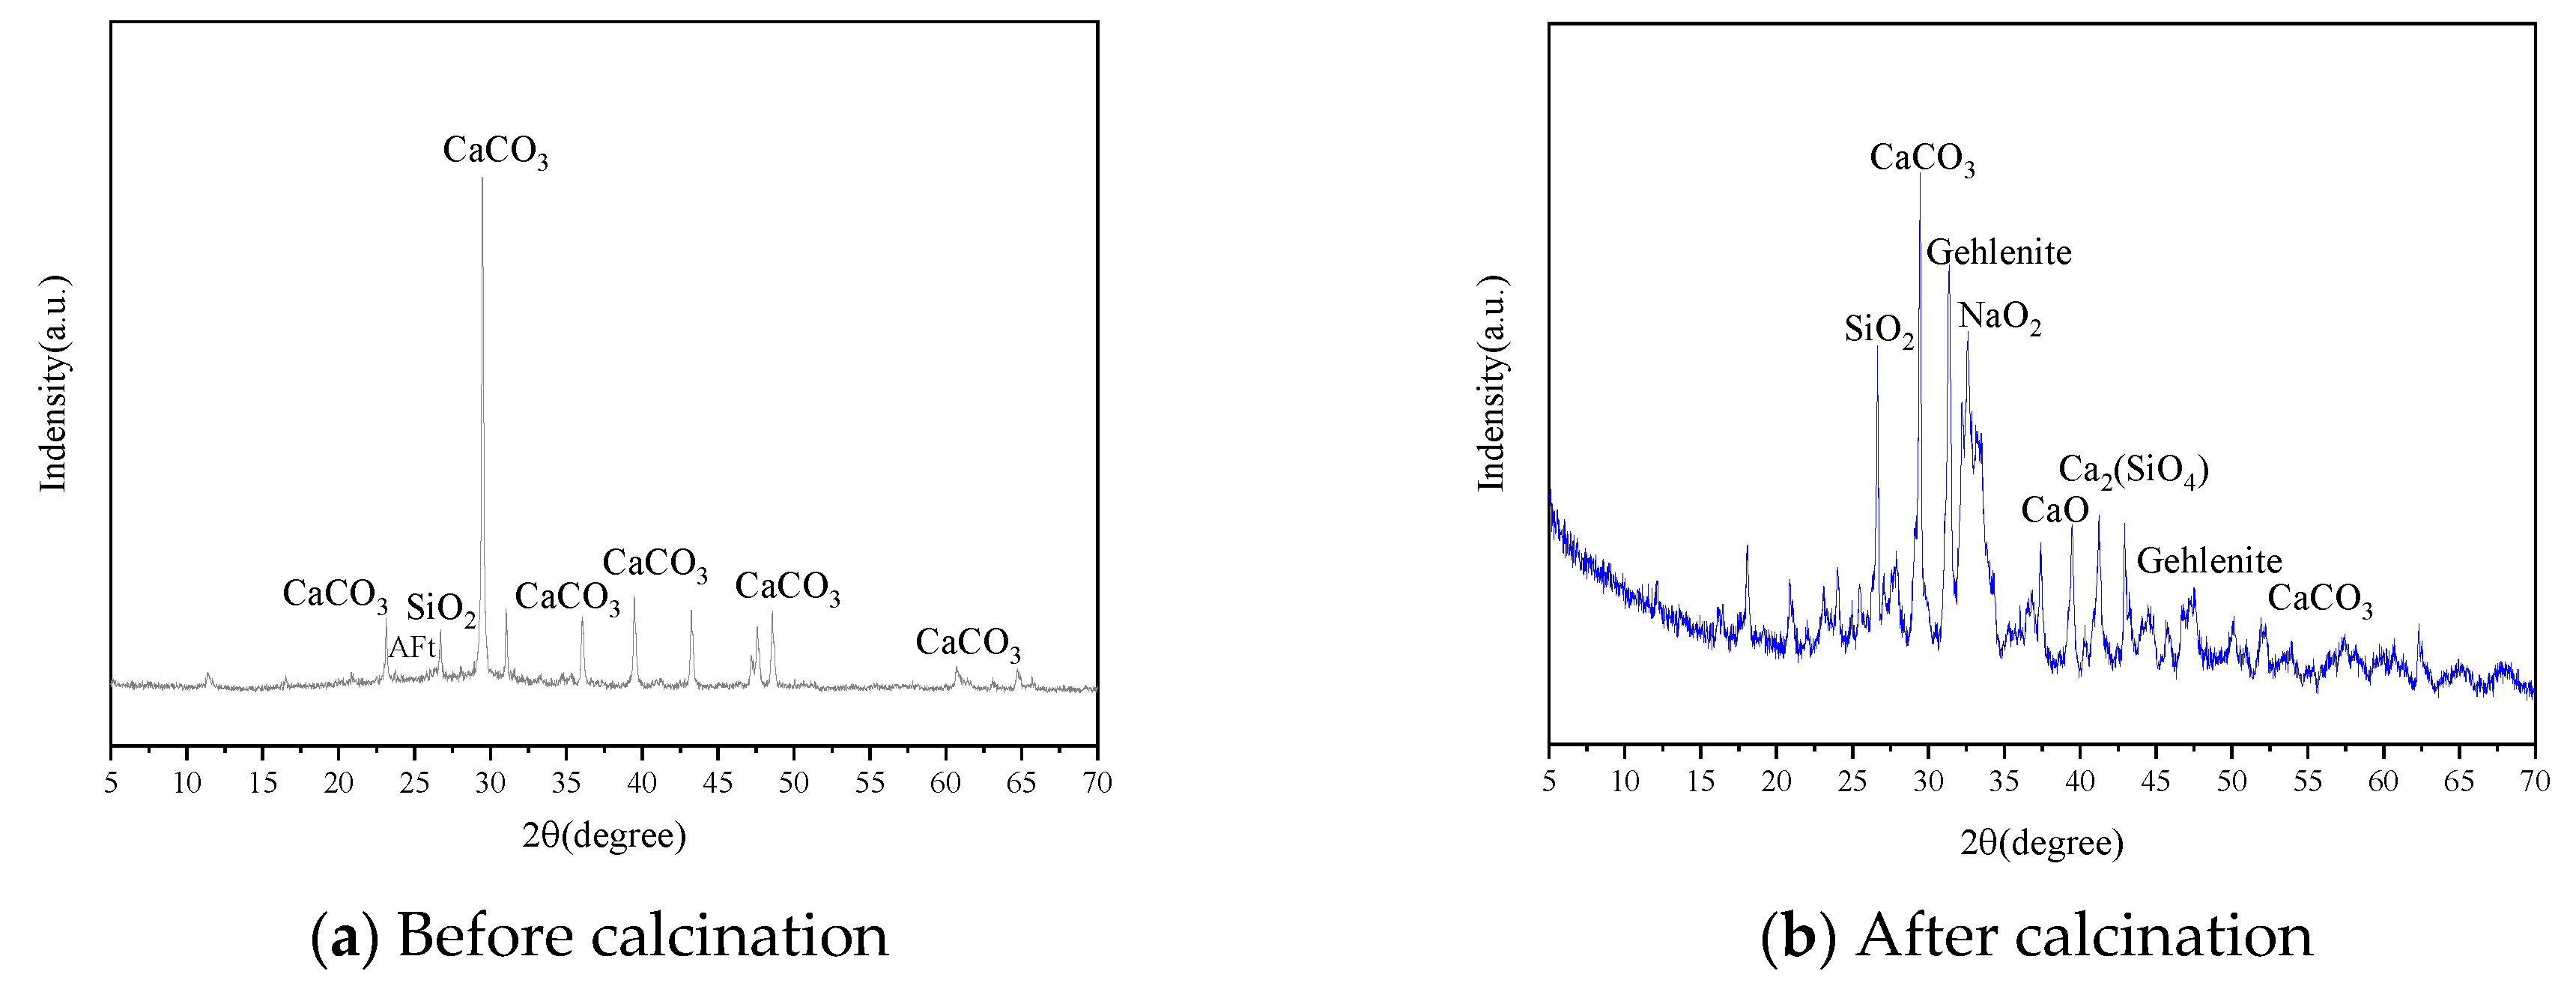
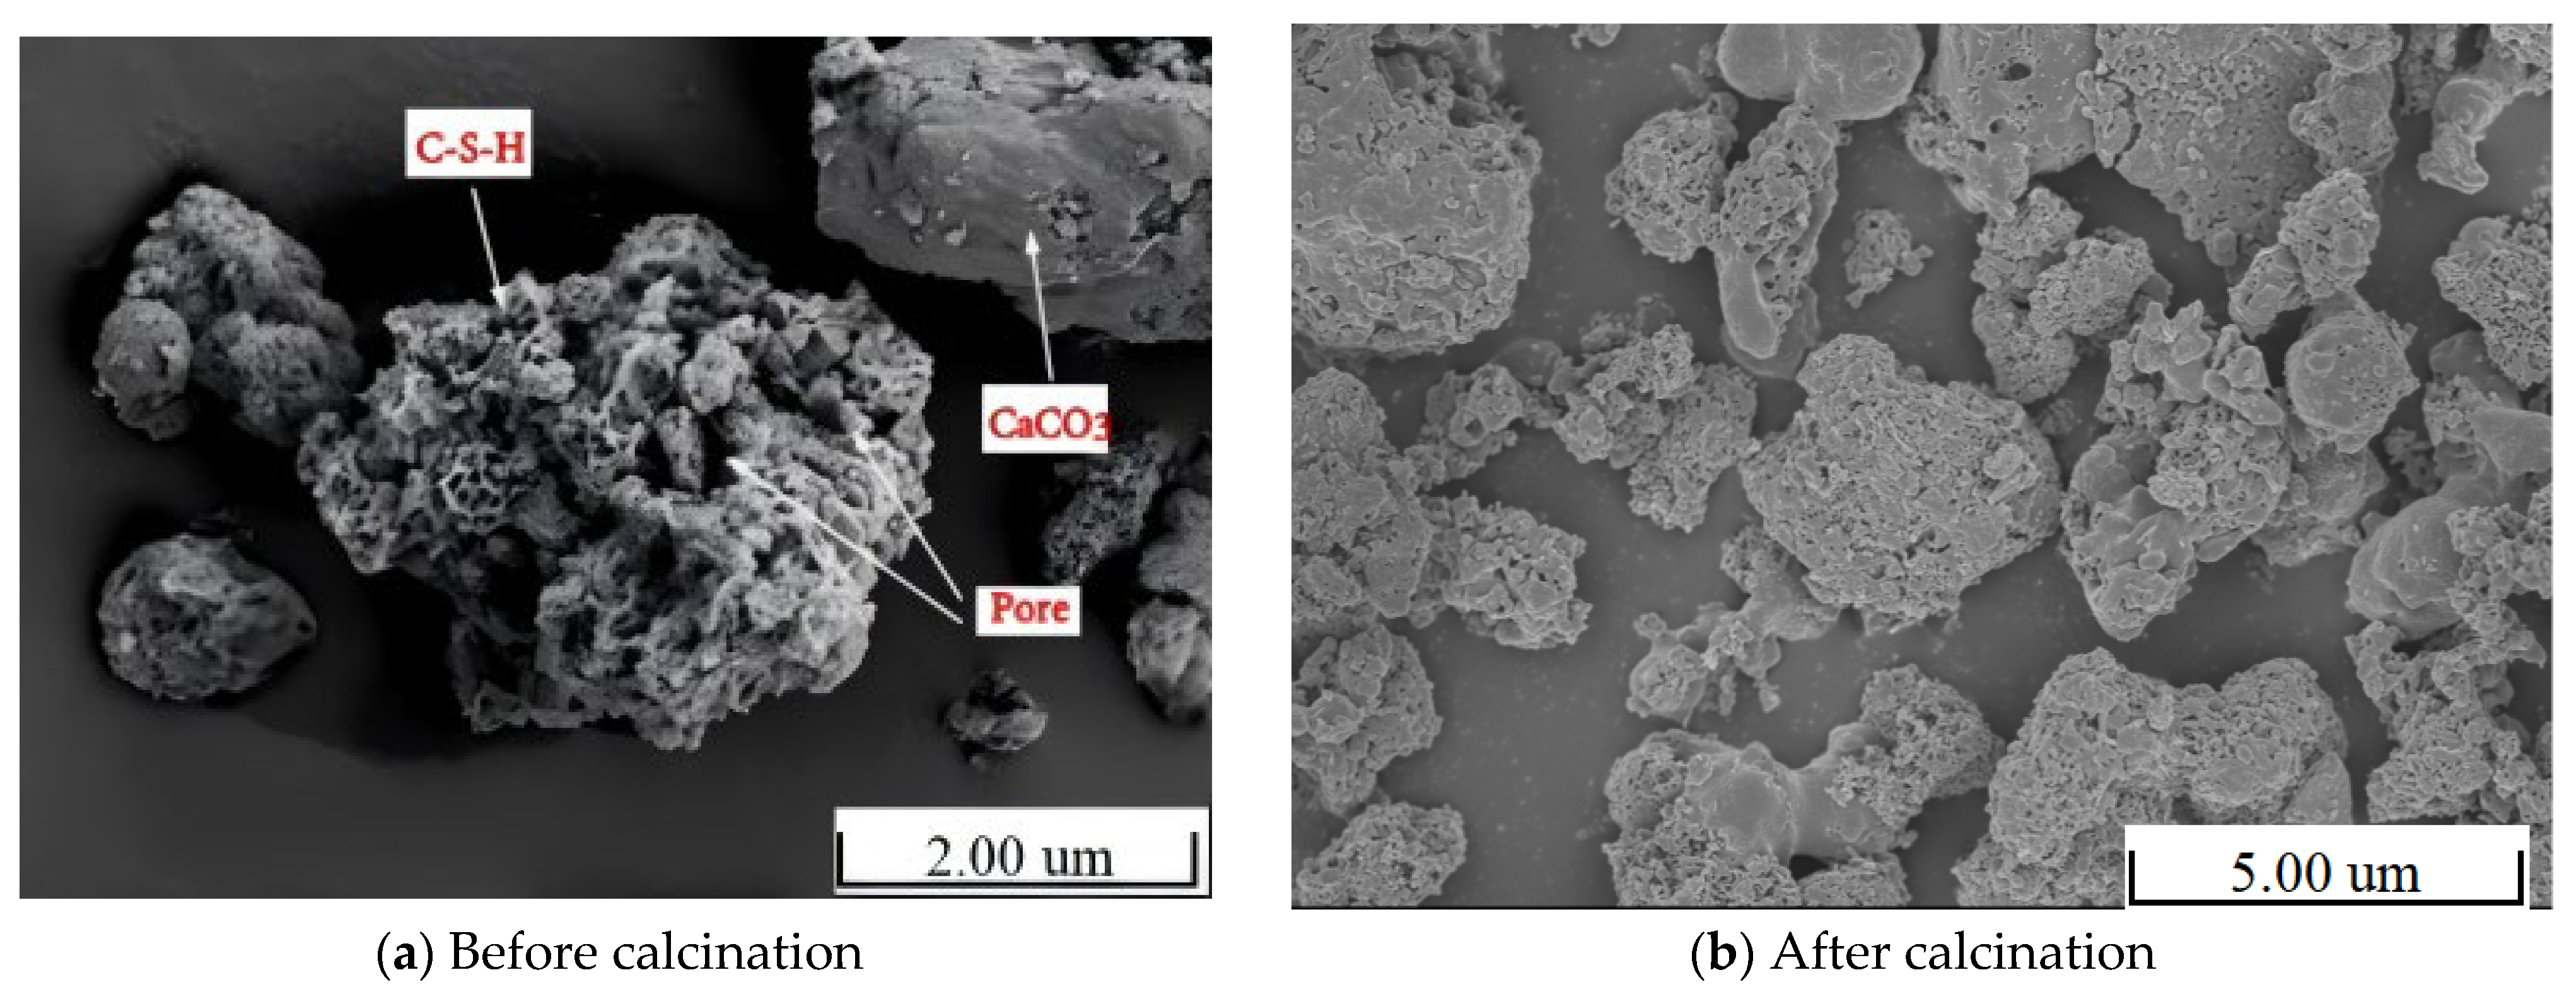
The sludge comes from the drainage ditch of the mixing laboratory of the comprehensive building of North China University of Water Resources and Electric Power, Zhengzhou, Henan Province, China. The sludge is put into a blast drying oven and dried at 80 °C for 6 h before grinding. The fineness of the sludge is tested using a negative pressure sieve (the aperture of the sieve was 45 μm), and the fineness of the sludge is 18.7%. The color of the sludge is gray (Figure 5a). The main mineral composition of the sludge is quartz (SiO2), calcite (CaCO3), Ca(OH)2, and ettringite (Aft), according to XRD phase analysis (Figure 6a). It can be seen from the chemical composition table (Table 2) that the content of CaO is high (41.96%). In the SEM analysis (Figure 7a), the presence of C-S-H gel, CaCO3, and small holes can be observed. After calcination at 900 °C for 2 h, the sludge is silver-gray (Figure 5b). Compared with before calcination, the diffraction peak of CaCO3 is weakened, and the diffraction peak of quartz is enhanced. The XRD phase analysis is shown in Figure 7b. High-temperature calcination destroys the original stable crystalline phases in the sludge, producing more unstable compounds (Na2O, etc.), reducing the activation energy for reaction, and enhancing its activity. Compared with before calcination, its structure is more loose and large agglomerates are more dispersed into smaller collectives, which are less connected to each other; SEM analysis is shown in Figure 7b.

2.2. Alkali Activators

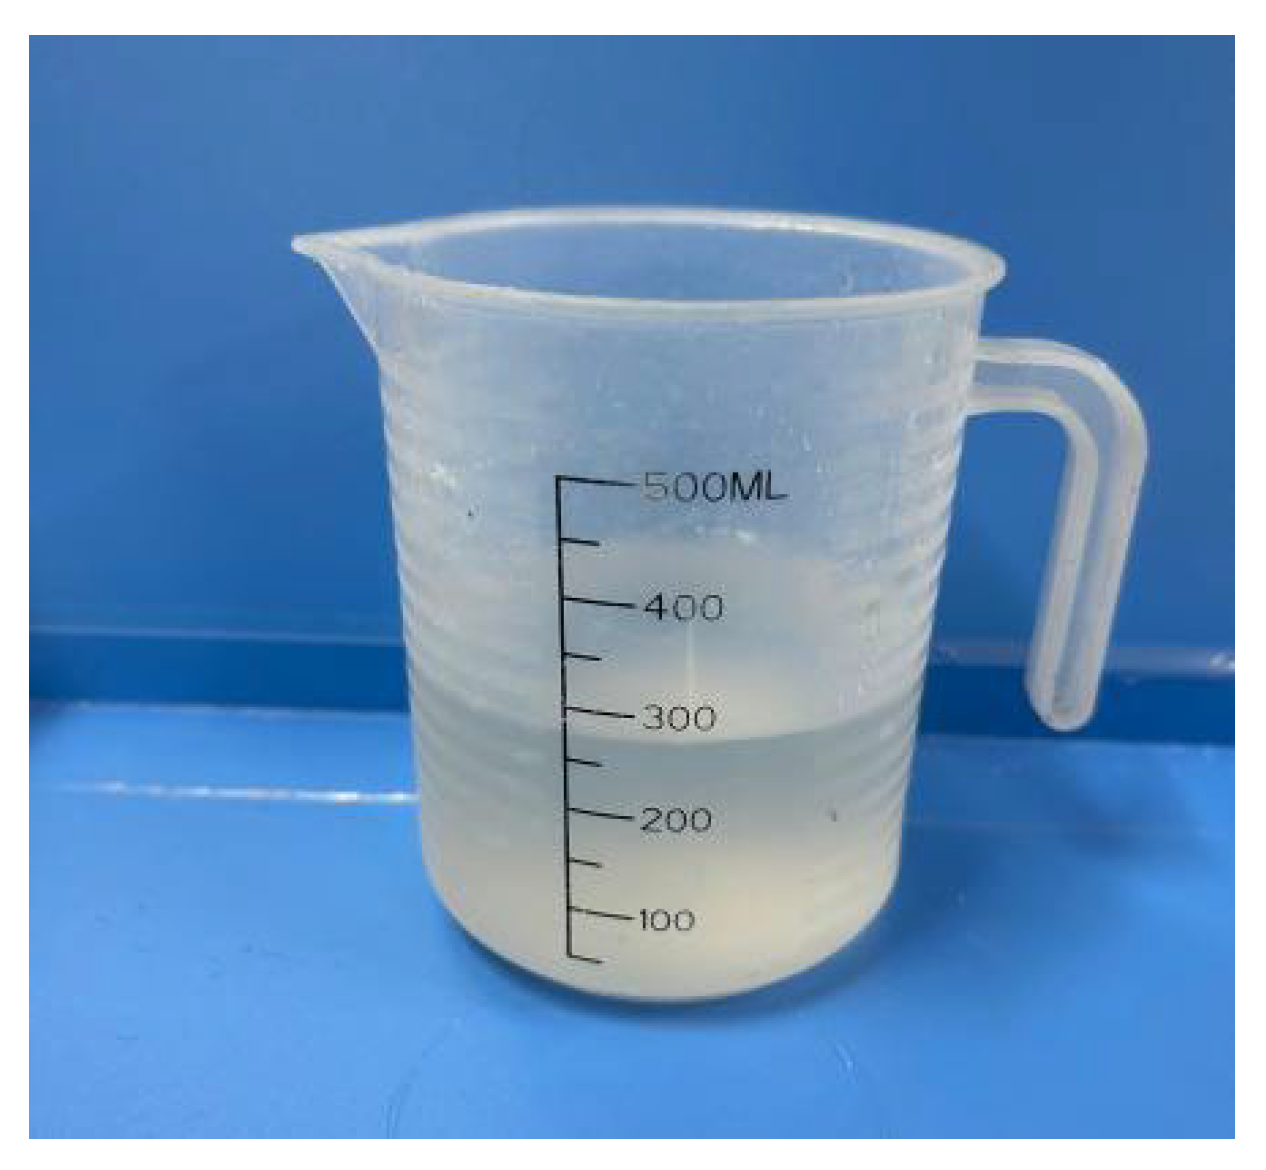
The alkali activator is prepared by mixing water glass solution with sodium hydroxide particles. The state of sodium silicate is liquid and viscous (Figure 8). The SiO2 content is 26.2%, the Na2O content is 8.3%, and the modulus is 3.3. In order to make the sodium silicate solution reach the modulus required for the test, a certain amount of sodium hydroxide is added to adjust the modulus of the sodium silicate solution, that is, the molecular ratio of silica (SiO2) to sodium oxide (Na2O) is changed by adding sodium hydroxide. The chemical reaction is shown in Equation (1).
N a 2 O · S i O 2 + 2 N a O H 2 ( N a 2 O · 0.5 S i O 2 ) + H 2 O
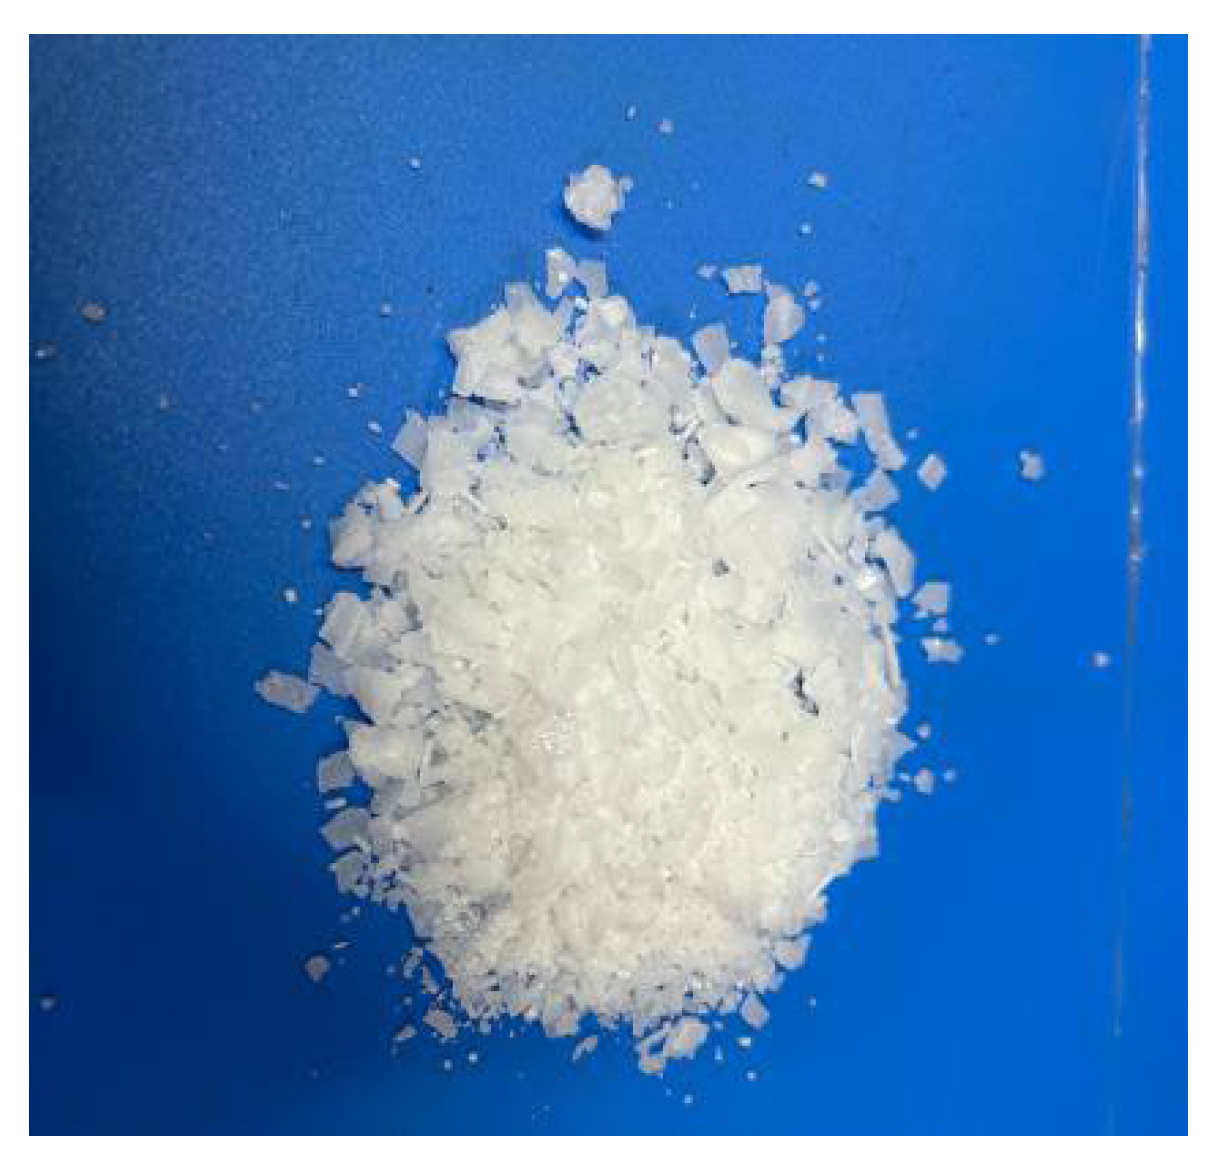
The analytically pure sodium hydroxide (NaOH) used in the test is produced by Tianjin Jinbei Fine Chemical Co., Ltd., Tianjin, China, white granular (Figure 9), and the purity is greater than 99%.

2.3. Water

Drinking water was used to prepare the CSG.

2.4. Research Methodology for Performance Testing

X-ray diffraction (XRD) analysis: X-ray diffraction patterns of the geopolymer mortar samples were obtained using a Bruker D8 ADVANCE X-ray diffractometer (Bruker AXS GmbH, Karlsruhe, Germany) with Cu Kα radiation. The measurements were conducted at a tube current of 40 mA and a tube voltage of 40 kV. The wavelength of the Cu target was 1.5406 Å.
Scanning electron microscopy (SEM) analysis: The microstructure of the geopolymer mortar was observed using a Hitachi S-4800 field emission scanning electron microscope (Hitachi High-Technologies Corporation, Tokyo, Japan) with an electron beam accelerated to 20 kV.

3. Test Scheme

Environmental considerations were integral to the experimental design. The orthogonal array was formulated to optimize the utilization of two solid wastes, coal gangue and sludge, which were activated at moderate temperatures (700 °C and 900 °C, respectively) significantly lower than those used for Portland cement clinker production (~1450 °C). This approach inherently reduces the energy consumption and carbon footprint of the resulting grouting material.

3.1. Mix Design

To investigate the significance of the influence of the water–binder ratio, sodium-to-aluminum ratio, activator modulus, and the significance of the influence of coal gangue/sludge on the strength of CSG, the optimal dosage range of each factor was obtained. The orthogonal test table (Table 3) of L16 (45) was designed, and the test mix ratio was designed according to the orthogonal table. The specific ratio is detailed in Table 4. The setting time of the slurry was detected according to the ‘Test methods for water requirement of normal consistency, setting time and soundness of the portland cement‘ (GB/T 1346-2011) [19].

3.2. Specimen Preparation

The calcination temperature of coal gangue was selected to be 700 °C. In the preparation stage of the experiment, the coal gangue was loaded into the special ceramic bowl and put into the SX-5-12 box-type resistance furnace (maximum service temperature 1200 °C, Shanghai Shiyan Electric Furnace Co., Ltd., Shanghai, China) to maintain 700 °C for 2 h and then removed as a precursor for use.
The dried and ground sludge was calcined at 900 °C for 2 h in a SX-5-12 box-type resistance furnace to decompose the stable CaCO3 into more active CaO. The average burning vector of the sludge was 24.5%.
The related parameters of the activator include the amount of NaOH, the amount of sodium silicate, the ratio of sodium silicate to NaOH, the ratio of sodium silicate to sodium hydroxide controlled by the modulus of the activator, and the amount of NaOH and sodium silicate controlled by the ratio of sodium to aluminum. The specific calculation formula is as follows:
The activator (solid content) used per unit precursor:
J = m 2 0.262 × a × b 1.2 c × 0.262 + 0.262 m 2
Sodium hydroxide used in unit water glass:
h = m 1 m 2 m 2 × 80
Sodium hydroxide used in unit activator:
N = h 60.09 m 1 + 62 + h × J
Water glass for unit activator:
S = ( J N ) / 0.345
In the formula, J is the activator (solid content) used per unit precursor, h is the sodium hydroxide used in unit water glass, N is sodium hydroxide used as unit activator, S is the water glass used for unit activator, m1 is the modulus of water glass, m2 is the target modulus of the activator, a is n (Na)/n (Al), b is the content of Al2O3 precursor, and c is the precursor Na2O content. (Note: All variables and parameters (J, h, N, S, m1, m2, a, b, c) are dimensionless).
The alkali excitation solution was prepared 24 h before use, and the excitation agent was prepared by the permanent magnet DC mixer manufactured by Huafeng Instrument Co., Ltd., Wenzhou, Zhejiang Province, China. The required NaOH was added at a constant speed while the water glass was stirred. After the temperature of the excitation agent was cooled to room temperature, the stirring was stopped to ensure the uniform mixing of the excitation agent components and improve the degree of polymerization. The water required for the preparation of geopolymer is water in the activator plus extra water.
Firstly, the coal gangue and the sludge were mixed dry and then put into the cement paste mixer for dry mixing for 1 min. While the mixer was running, the alkali activator was slowly added to the dry material and the mixture continued to be stirred for 3 min. The fresh paste was quickly poured into a (40 mm × 40 mm × 160 mm) steel mold and vibrated on an electric vibration table for 60 s to remove the residual air. The mold was covered with polyethylene film and solidified for 1 day. After demolding, it was transferred to a constant temperature curing box with RH = 95 ± 1% and T = 20 ± 2 °C. For each mix ratio, six specimens were poured and tested for macroscopic mechanics and microstructure at 3 days and 28 days of curing, respectively. The flow chart is shown in Figure 10.

4. Results and Analysis

4.1. CS

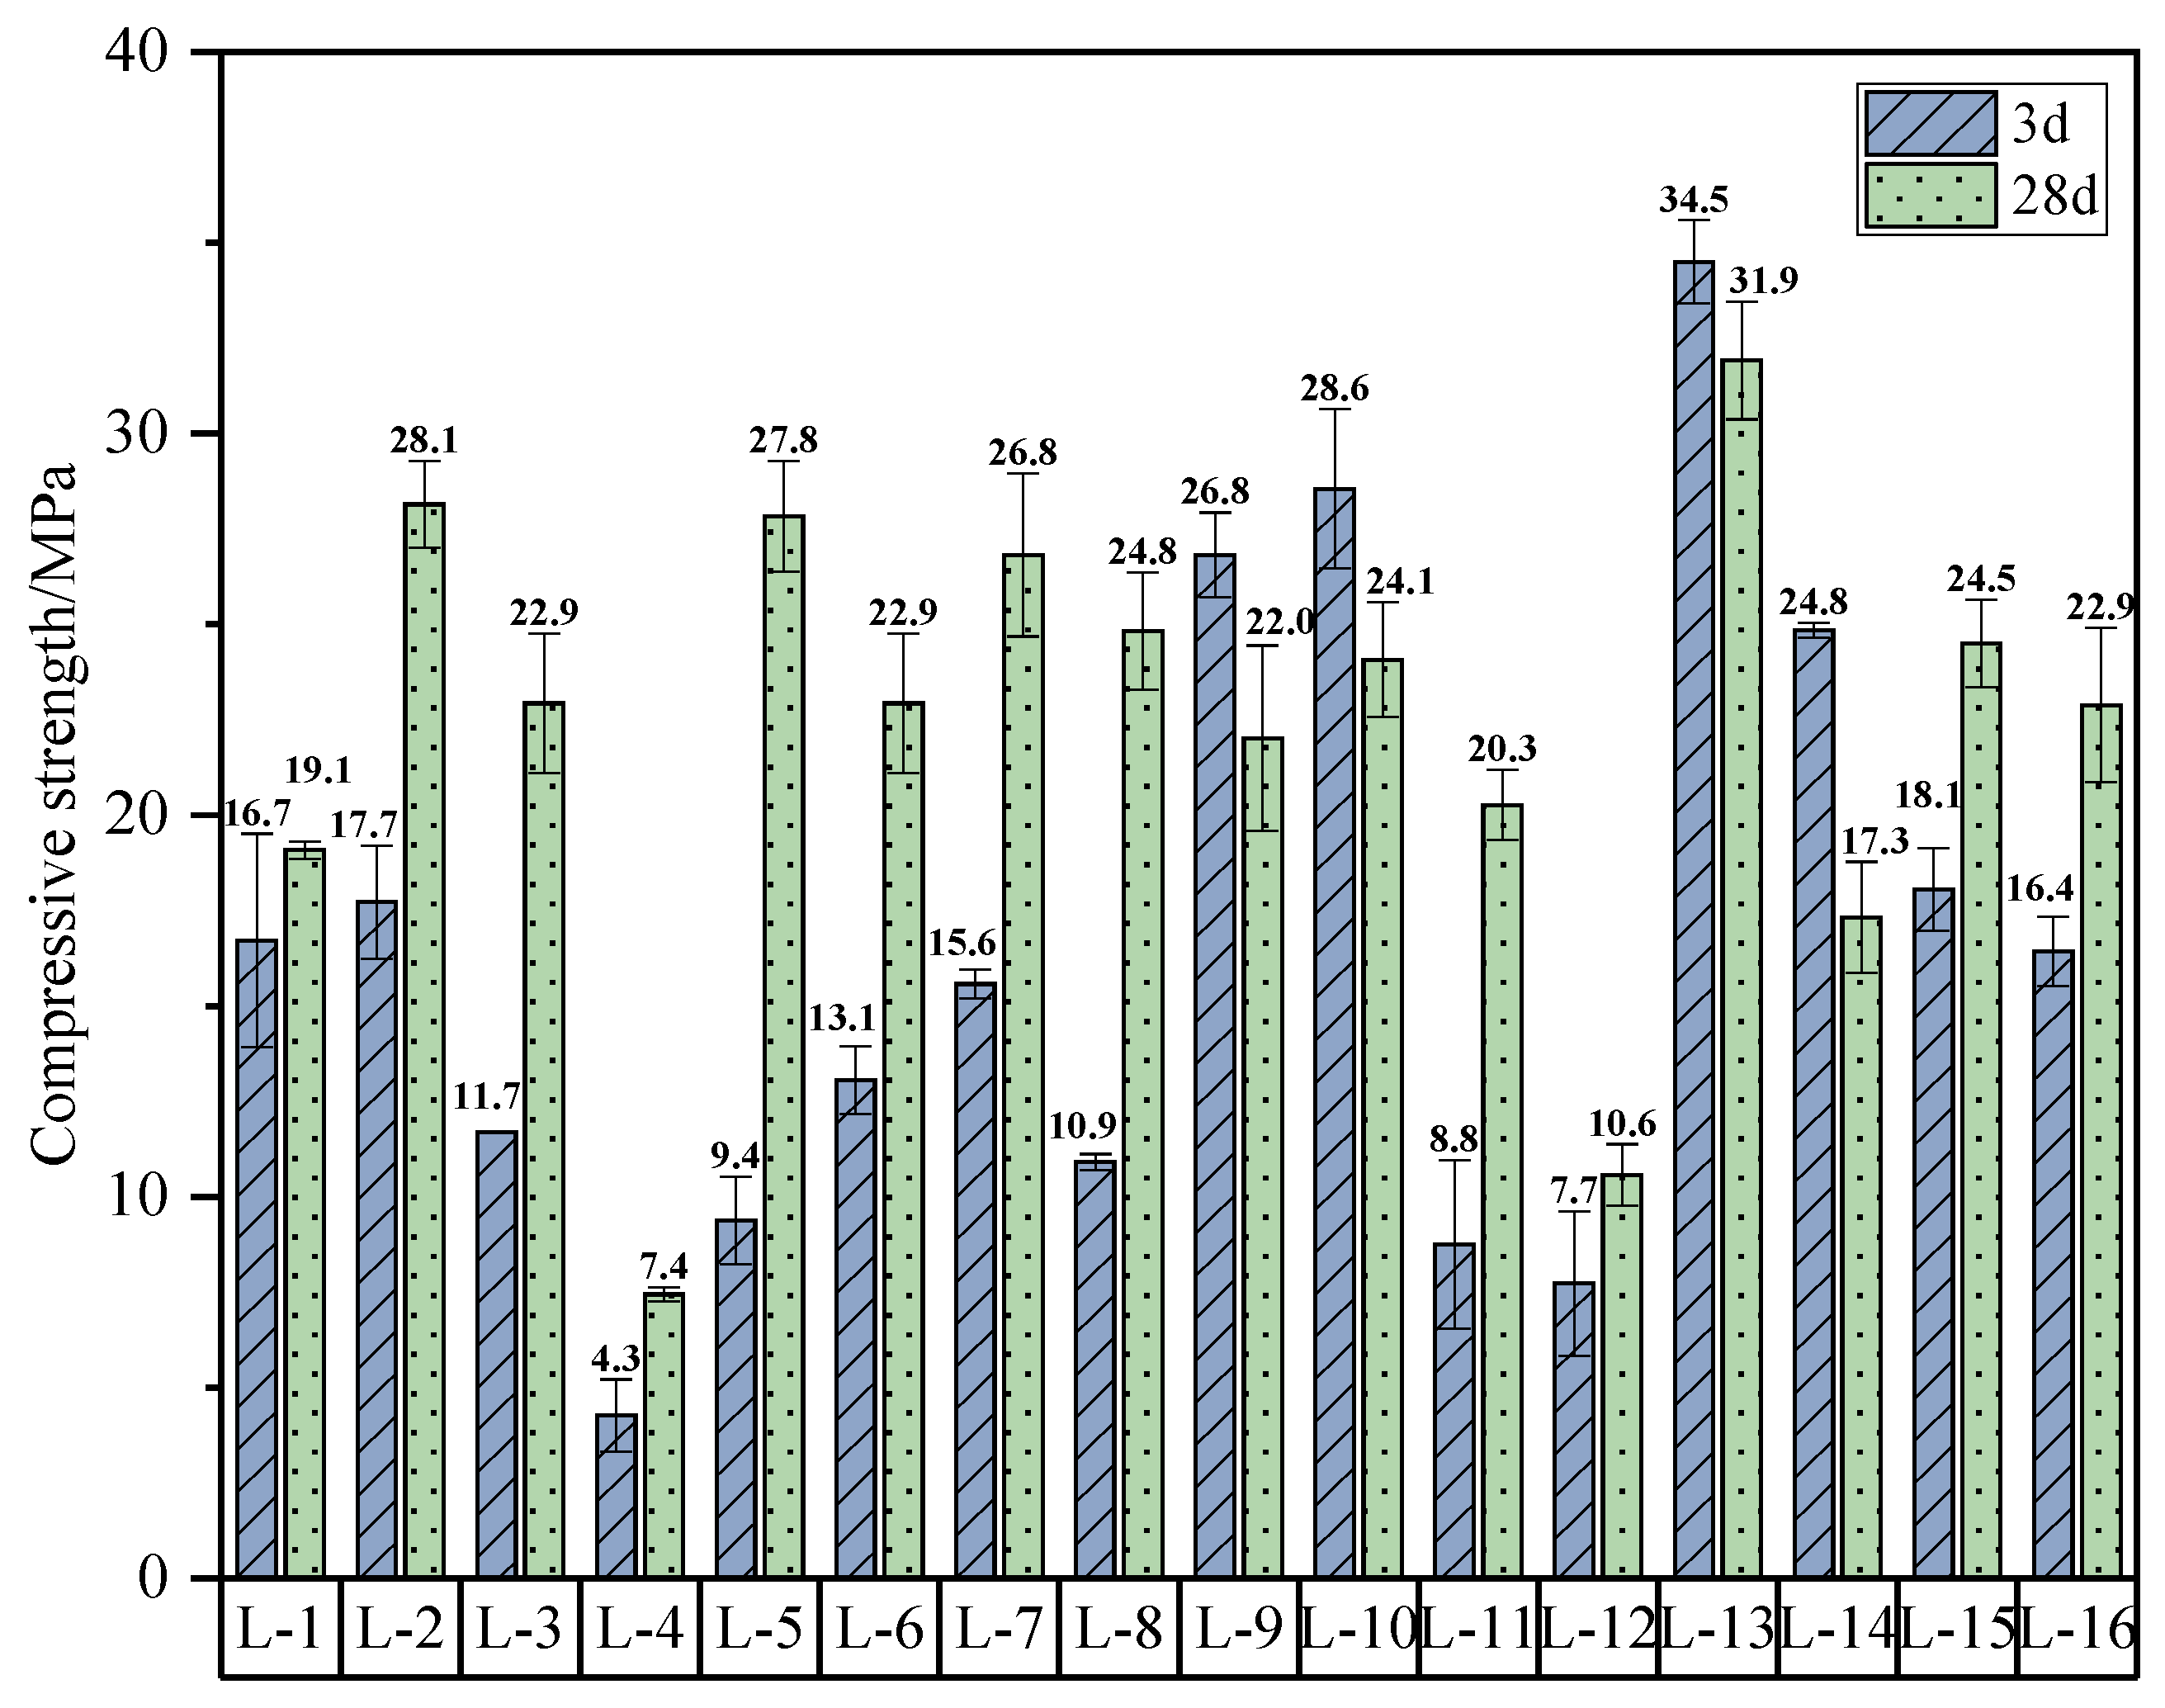
The CS data of each group of specimens at 3 d and 28 d are shown in Figure 11. The strength difference in the specimens under different ratios is more obvious, and the influence of various factors on the CS of CSG is more significant. The sample with the highest CS is the sample with the ratio of L-13, whose 3 d strength reaches 34.5 MPa. This impressive early-age performance demonstrates the potential of the proposed CSG mix for grouting applications.
However, the later strength retraction phenomenon observed in some ratios can be attributed to a synergistic mechanism involving delayed deleterious reactions. The excessive amount of activator and the high calcium content from sludge promote the rapid formation of strength-giving gels at early ages. Over the longer term, however, this can lead to the continued formation and expansion of calcium hydroxide (Ca(OH)2), inducing internal micro-cracks.
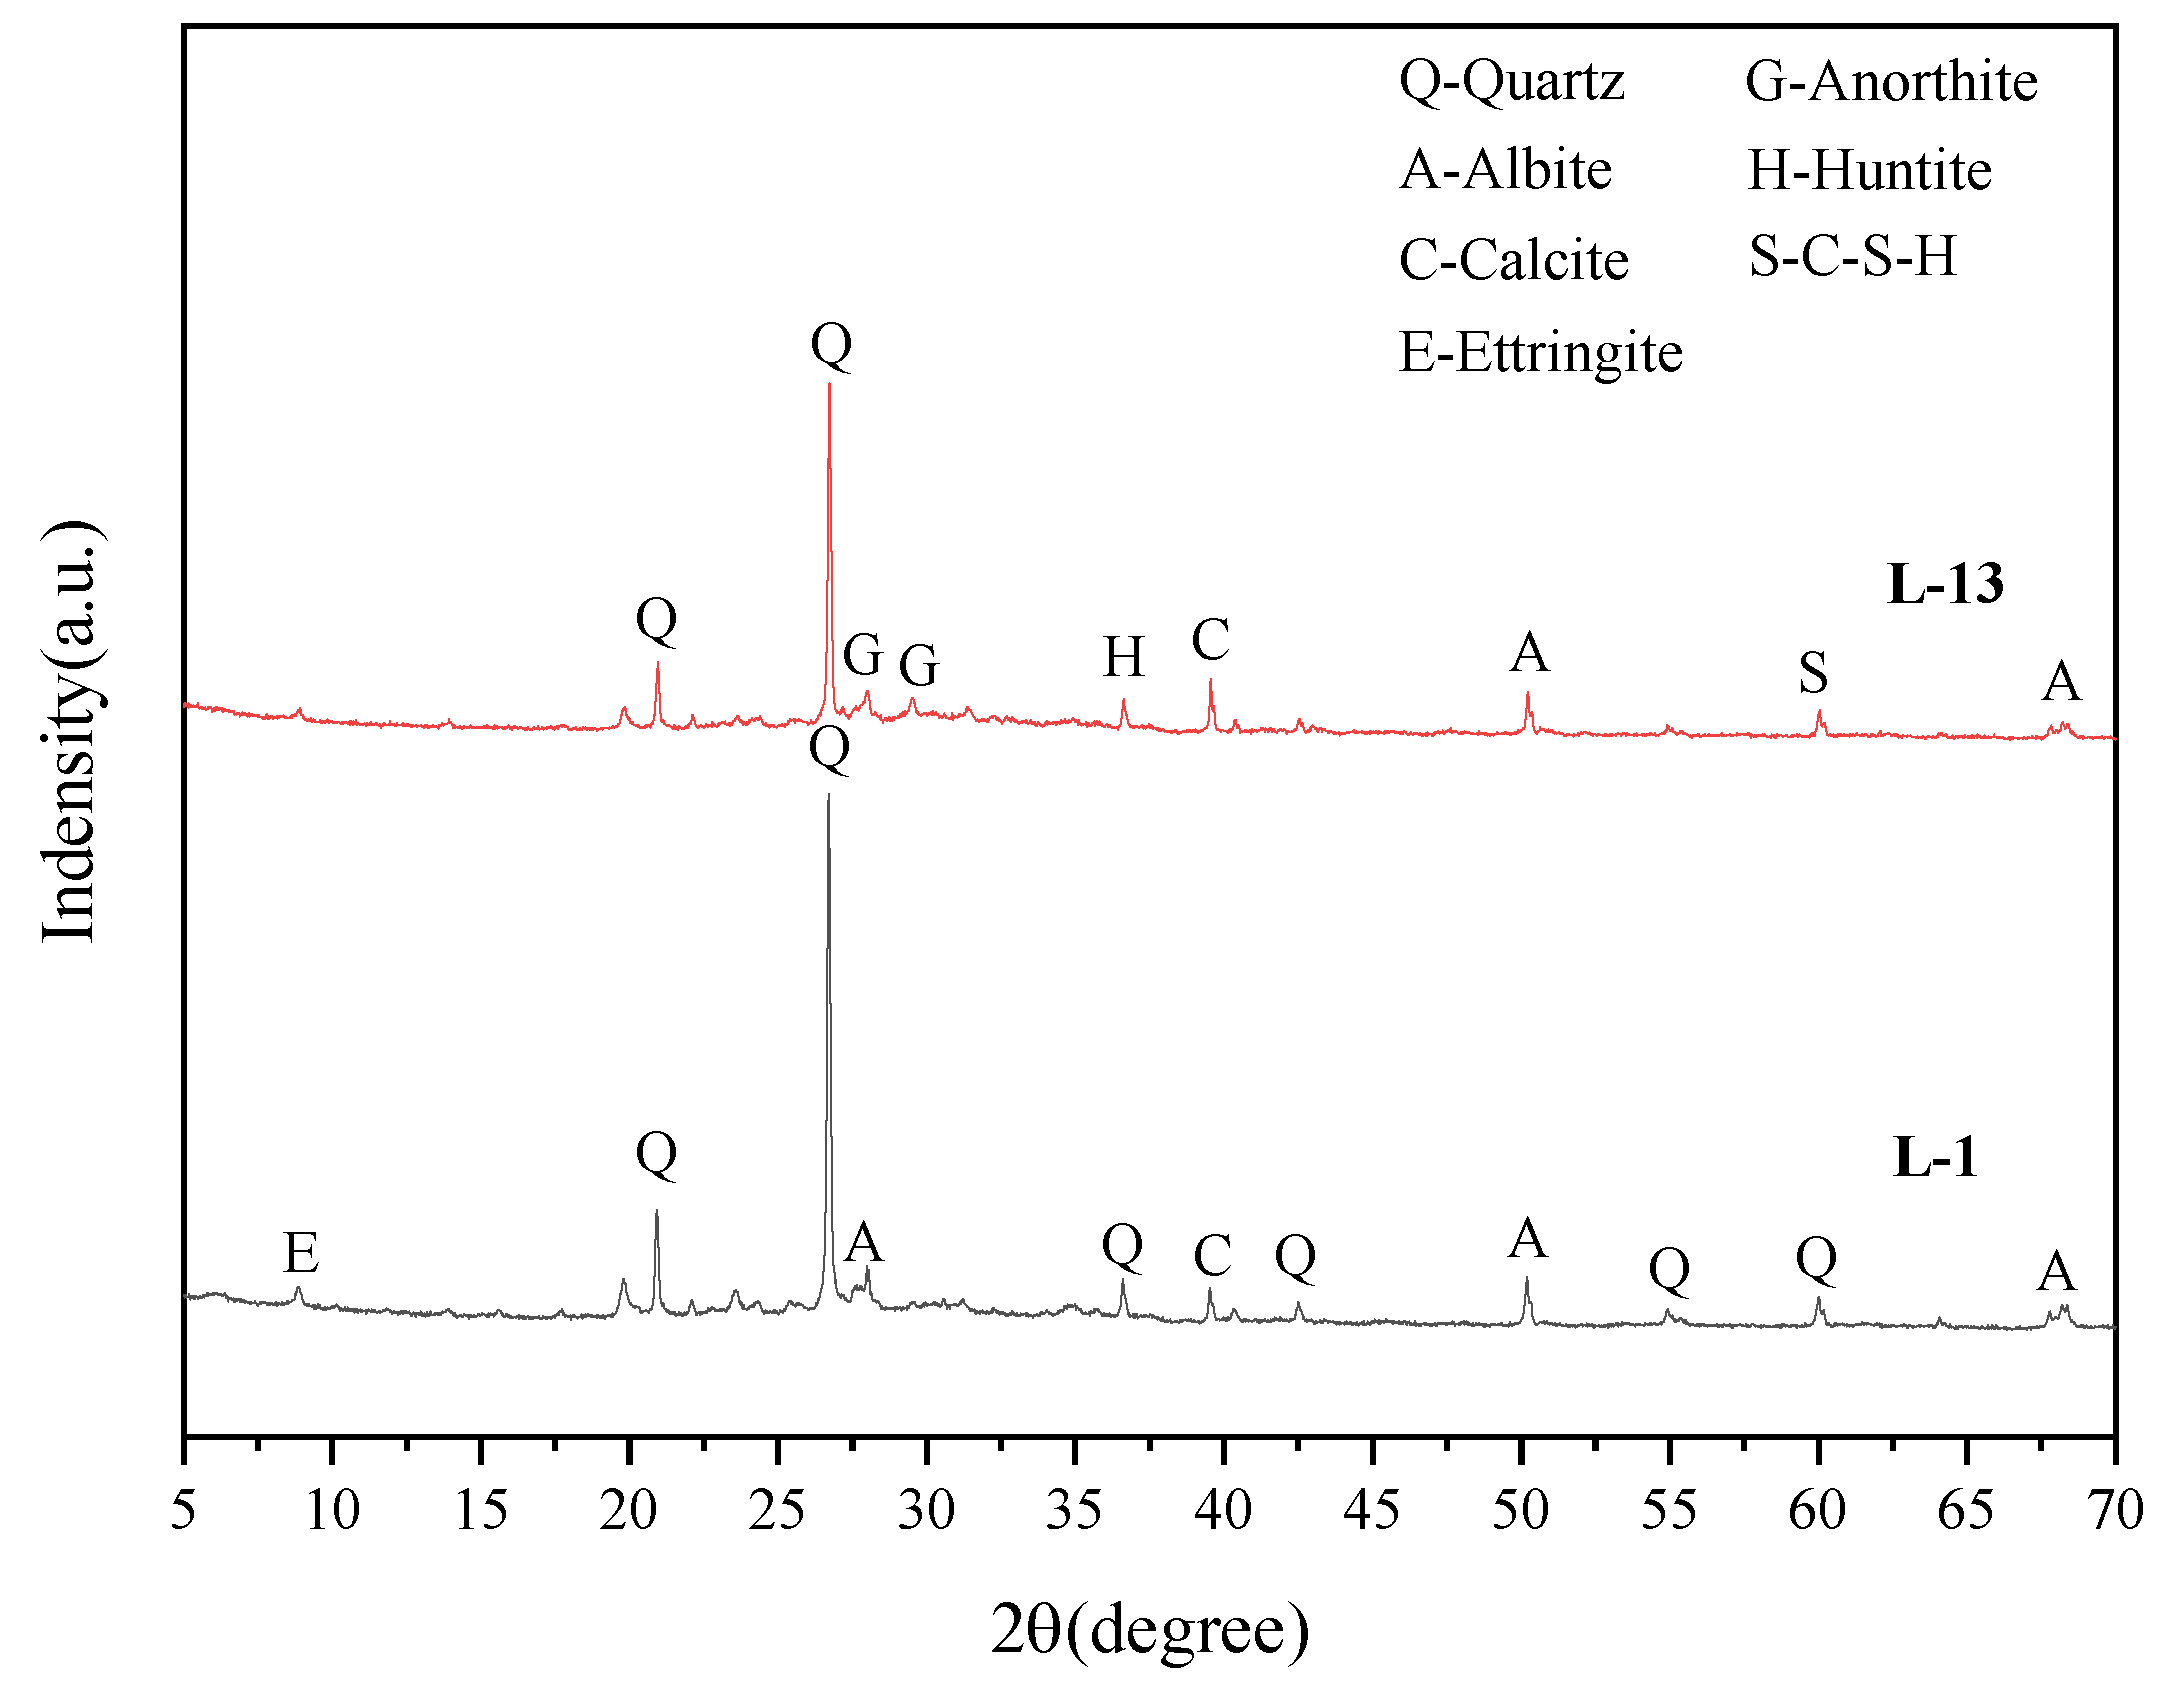
The driving force for such cracking—the presence of expansive products—is confirmed by XRD. The XRD analysis (Figure 12) for L-13 clearly identifies the formation of portlandite (Ca(OH)2) and other calcium-containing phases like anorthite and calcite. This microstructural evidence is vividly captured in the SEM images (Figure 13). The pure coal gangue specimen L-1 (Figure 13a,c) exhibits a loose and porous structure, inherently prone to damage from internal stress. More critically, even the high-performance specimen L-13, while significantly denser, likely developed localized micro-cracks not readily visible at the presented magnification. The crystallization pressure from the continued formation of these compounds, particularly portlandite, within the already dense matrix is the most plausible mechanism for the slight strength retraction, creating a network of fine cracks that compromises the structural integrity gained at early ages.
This phenomenon is corroborated by Wang et al. [20], who also noted limited long-term strength development in coal gangue-based geopolymers and attributed it to micro-cracking from volumetric changes and moisture loss. Consequently, while the CSG exhibits superior early strength, its long-term performance is governed by the precise control of the activator dosage and calcium balance to mitigate deleterious expansion.
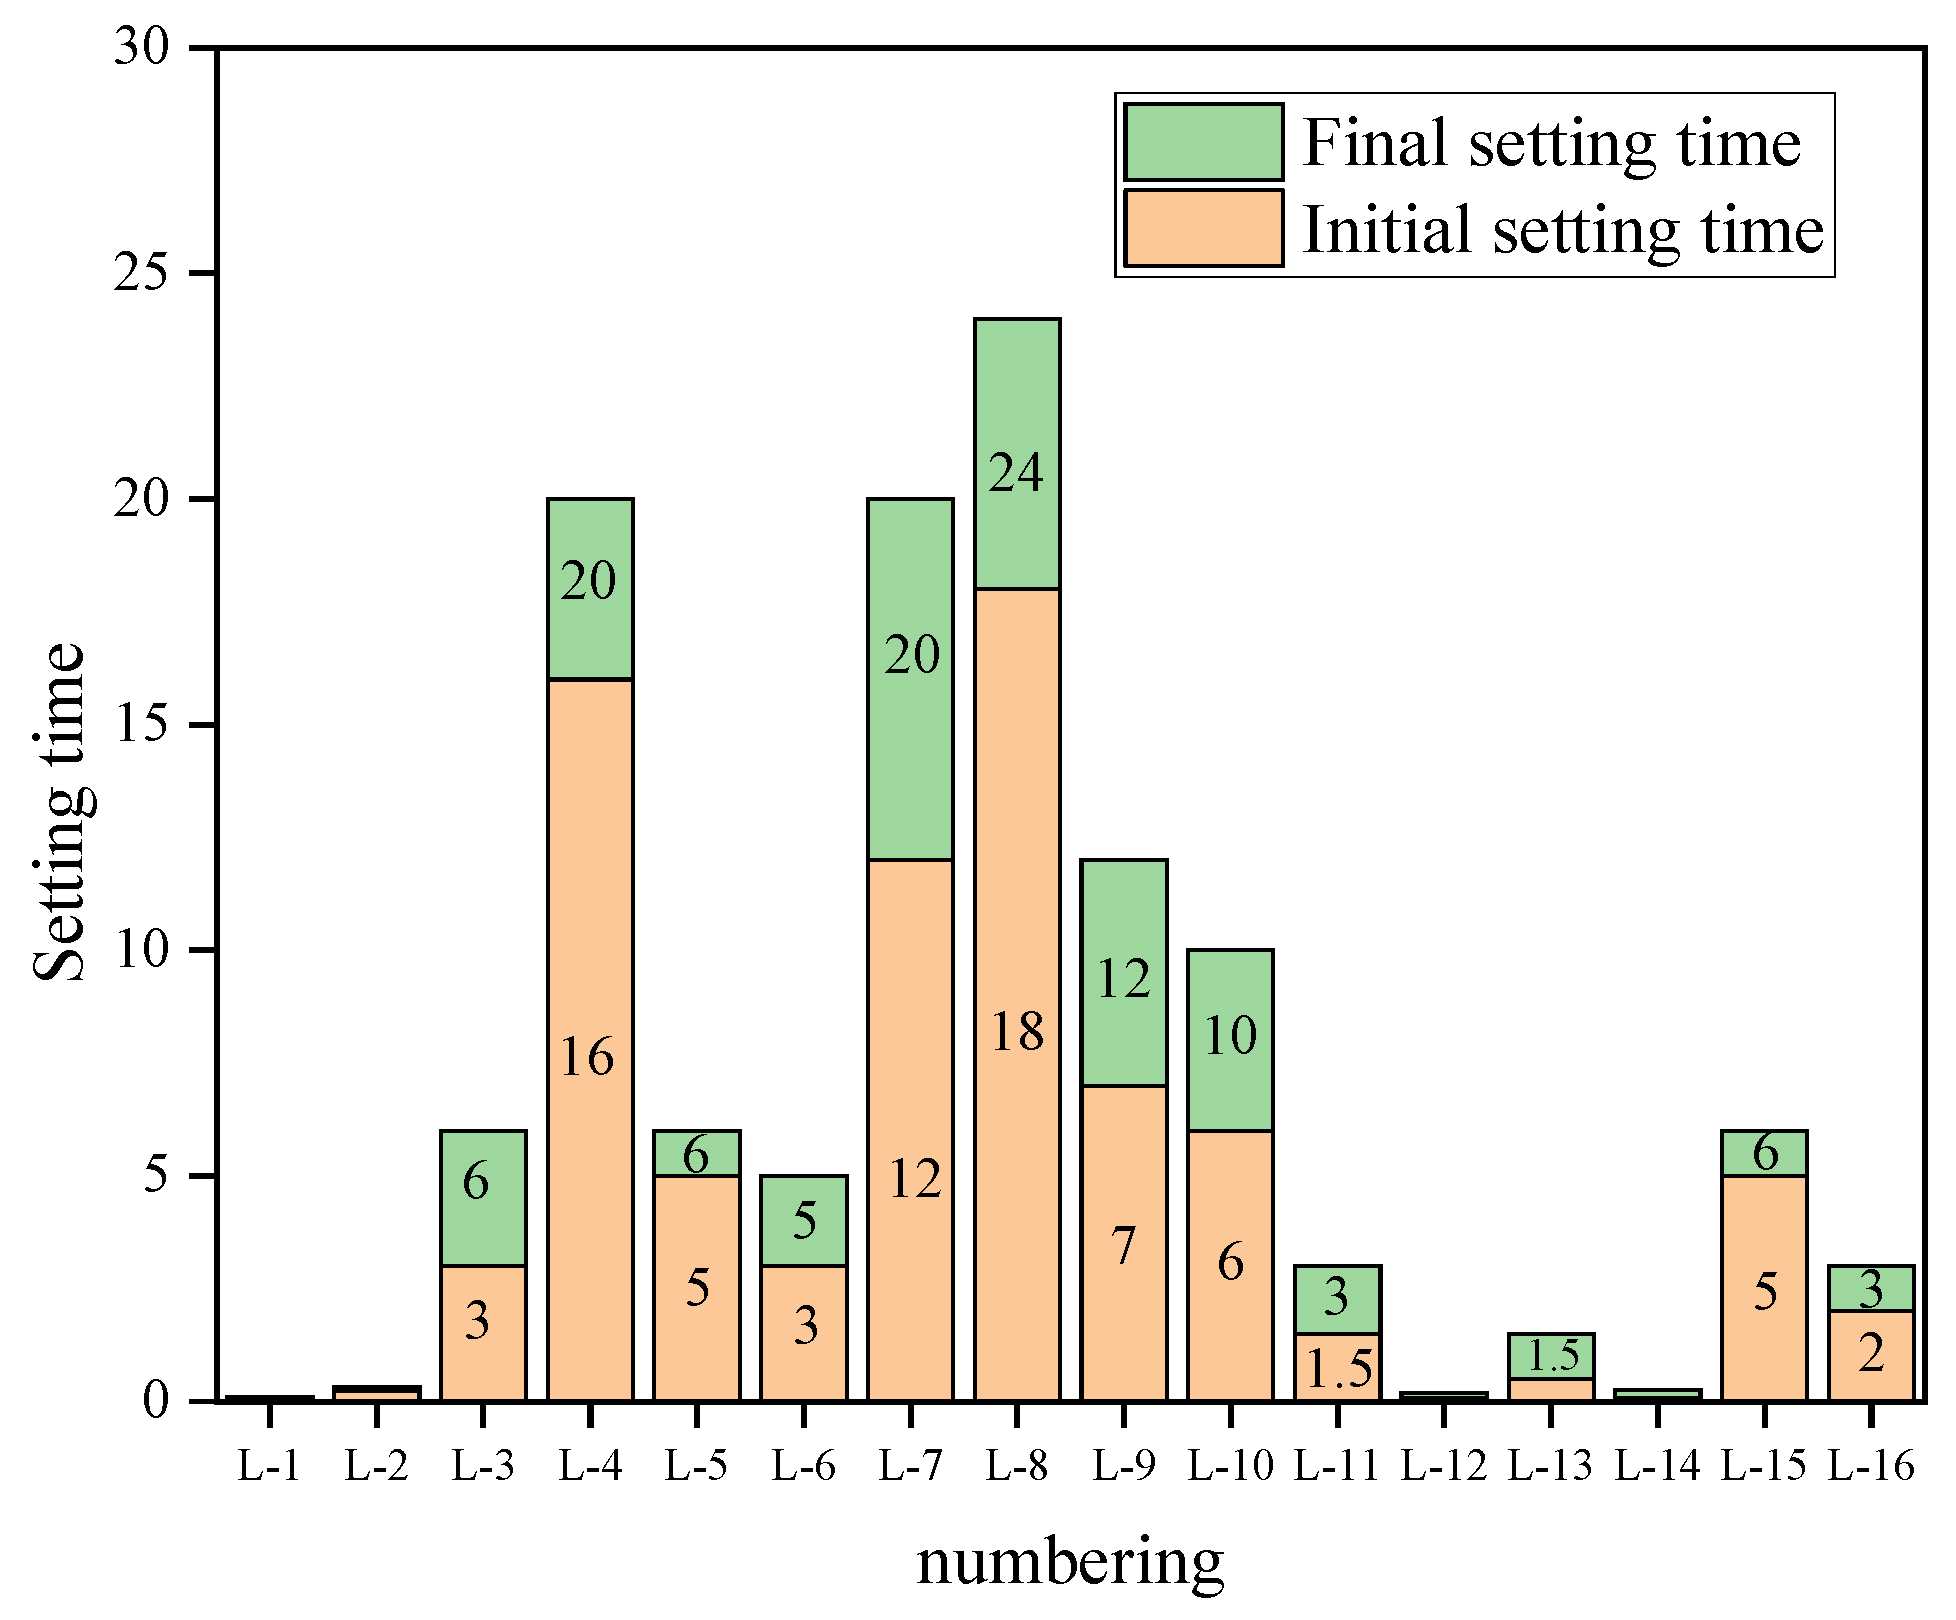
Geopolymer has early strength and fast setting properties. The length of setting time is also an indispensable part of the performance index of geopolymer, which is also closely related to the practical application of engineering. In Figure 14, the setting time of coal gangue geopolymer with different ratios can be seen, and all the ratios complete final condensation within 24 h.
The setting time data presented in Figure 14 is essential for assessing the workability and practical potential of the grouting material. It should be noted, however, that these results were obtained under standardized laboratory curing conditions (20 ± 2 °C, RH ≥ 95%). In actual grouting projects for coal mine goafs, the underground environment is often characterized by low temperatures and fluctuating humidity. Low temperatures tend to delay the alkali-activation reaction, prolonging the setting time—which can be beneficial for extending pumping distance—but require precise control to ensure adequate early-age strength development. Moreover, low-humidity conditions may lead to moisture loss in the grout, impairing not only workability during injection but also long-term hydration, potentially resulting in insufficient strength gain and susceptibility to shrinkage cracking. Therefore, further research should systematically investigate the performance evolution of CSG under varying temperature and humidity conditions, so as to provide a reliable basis for engineering applications in complex underground environments and ensure long-term performance stability.

4.1.1. Range Analysis

The range analysis of 3 dCS of CSG is shown in Table 5. Each factor has a significant effect on the CS of the sample at 3 days, and the degree of influence of different factors on the CS of CSG is different (the range values are 11.22, 12.61, 7.51, and 2.42, respectively). In range analysis, a larger range for a factor indicates a greater degree of influence. Among them, the range of factor B (water–binder ratio) is the largest, indicating that the water–binder ratio has the greatest influence on the early CS of CSG, which is an important factor. Compared with the lowest strength value (9.84 MPa), the maximum strength (22.45 MPa) increased by 128%. The order of the influence degree of each factor is as follows: water–binder ratio > coal gangue/sludge > n (Na)/n (Al) > activator modulus. The optimal combination of factor levels is as follows: water–binder ratio: 0.3, coal gangue/sludge ratio: 7:3, n (Na)/n (Al): 0.64, activator modulus: 1.0, under which the 3-day CS of CSG is the highest (34.5 MPa).
At the age of 28 d, various factors also had a significant effect on the CS of CSG (the range values were 6.80, 8.18, 2.06, and 8.43, respectively). At this time, factor D (activator modulus) has the greatest influence on the later strength of CSG, which is an important factor. The maximum strength group (26.29 MPa) at 28 d under different modulus was 47.2% higher than the minimum strength group (17.86 MPa). The influence degree of each factor on 28 d strength is as follows: activator modulus > water–binder ratio > coal gangue/sludge > n (Na)/n (Al). The combination of each factor level is as follows: water–binder ratio: 0.3, coal gangue/sludge: 9:1, n (Na)/n (Al): 0.56, activator modulus: 1.0. The CS of CSG at 28 d age is the highest.

4.1.2. Sensitivity Analysis

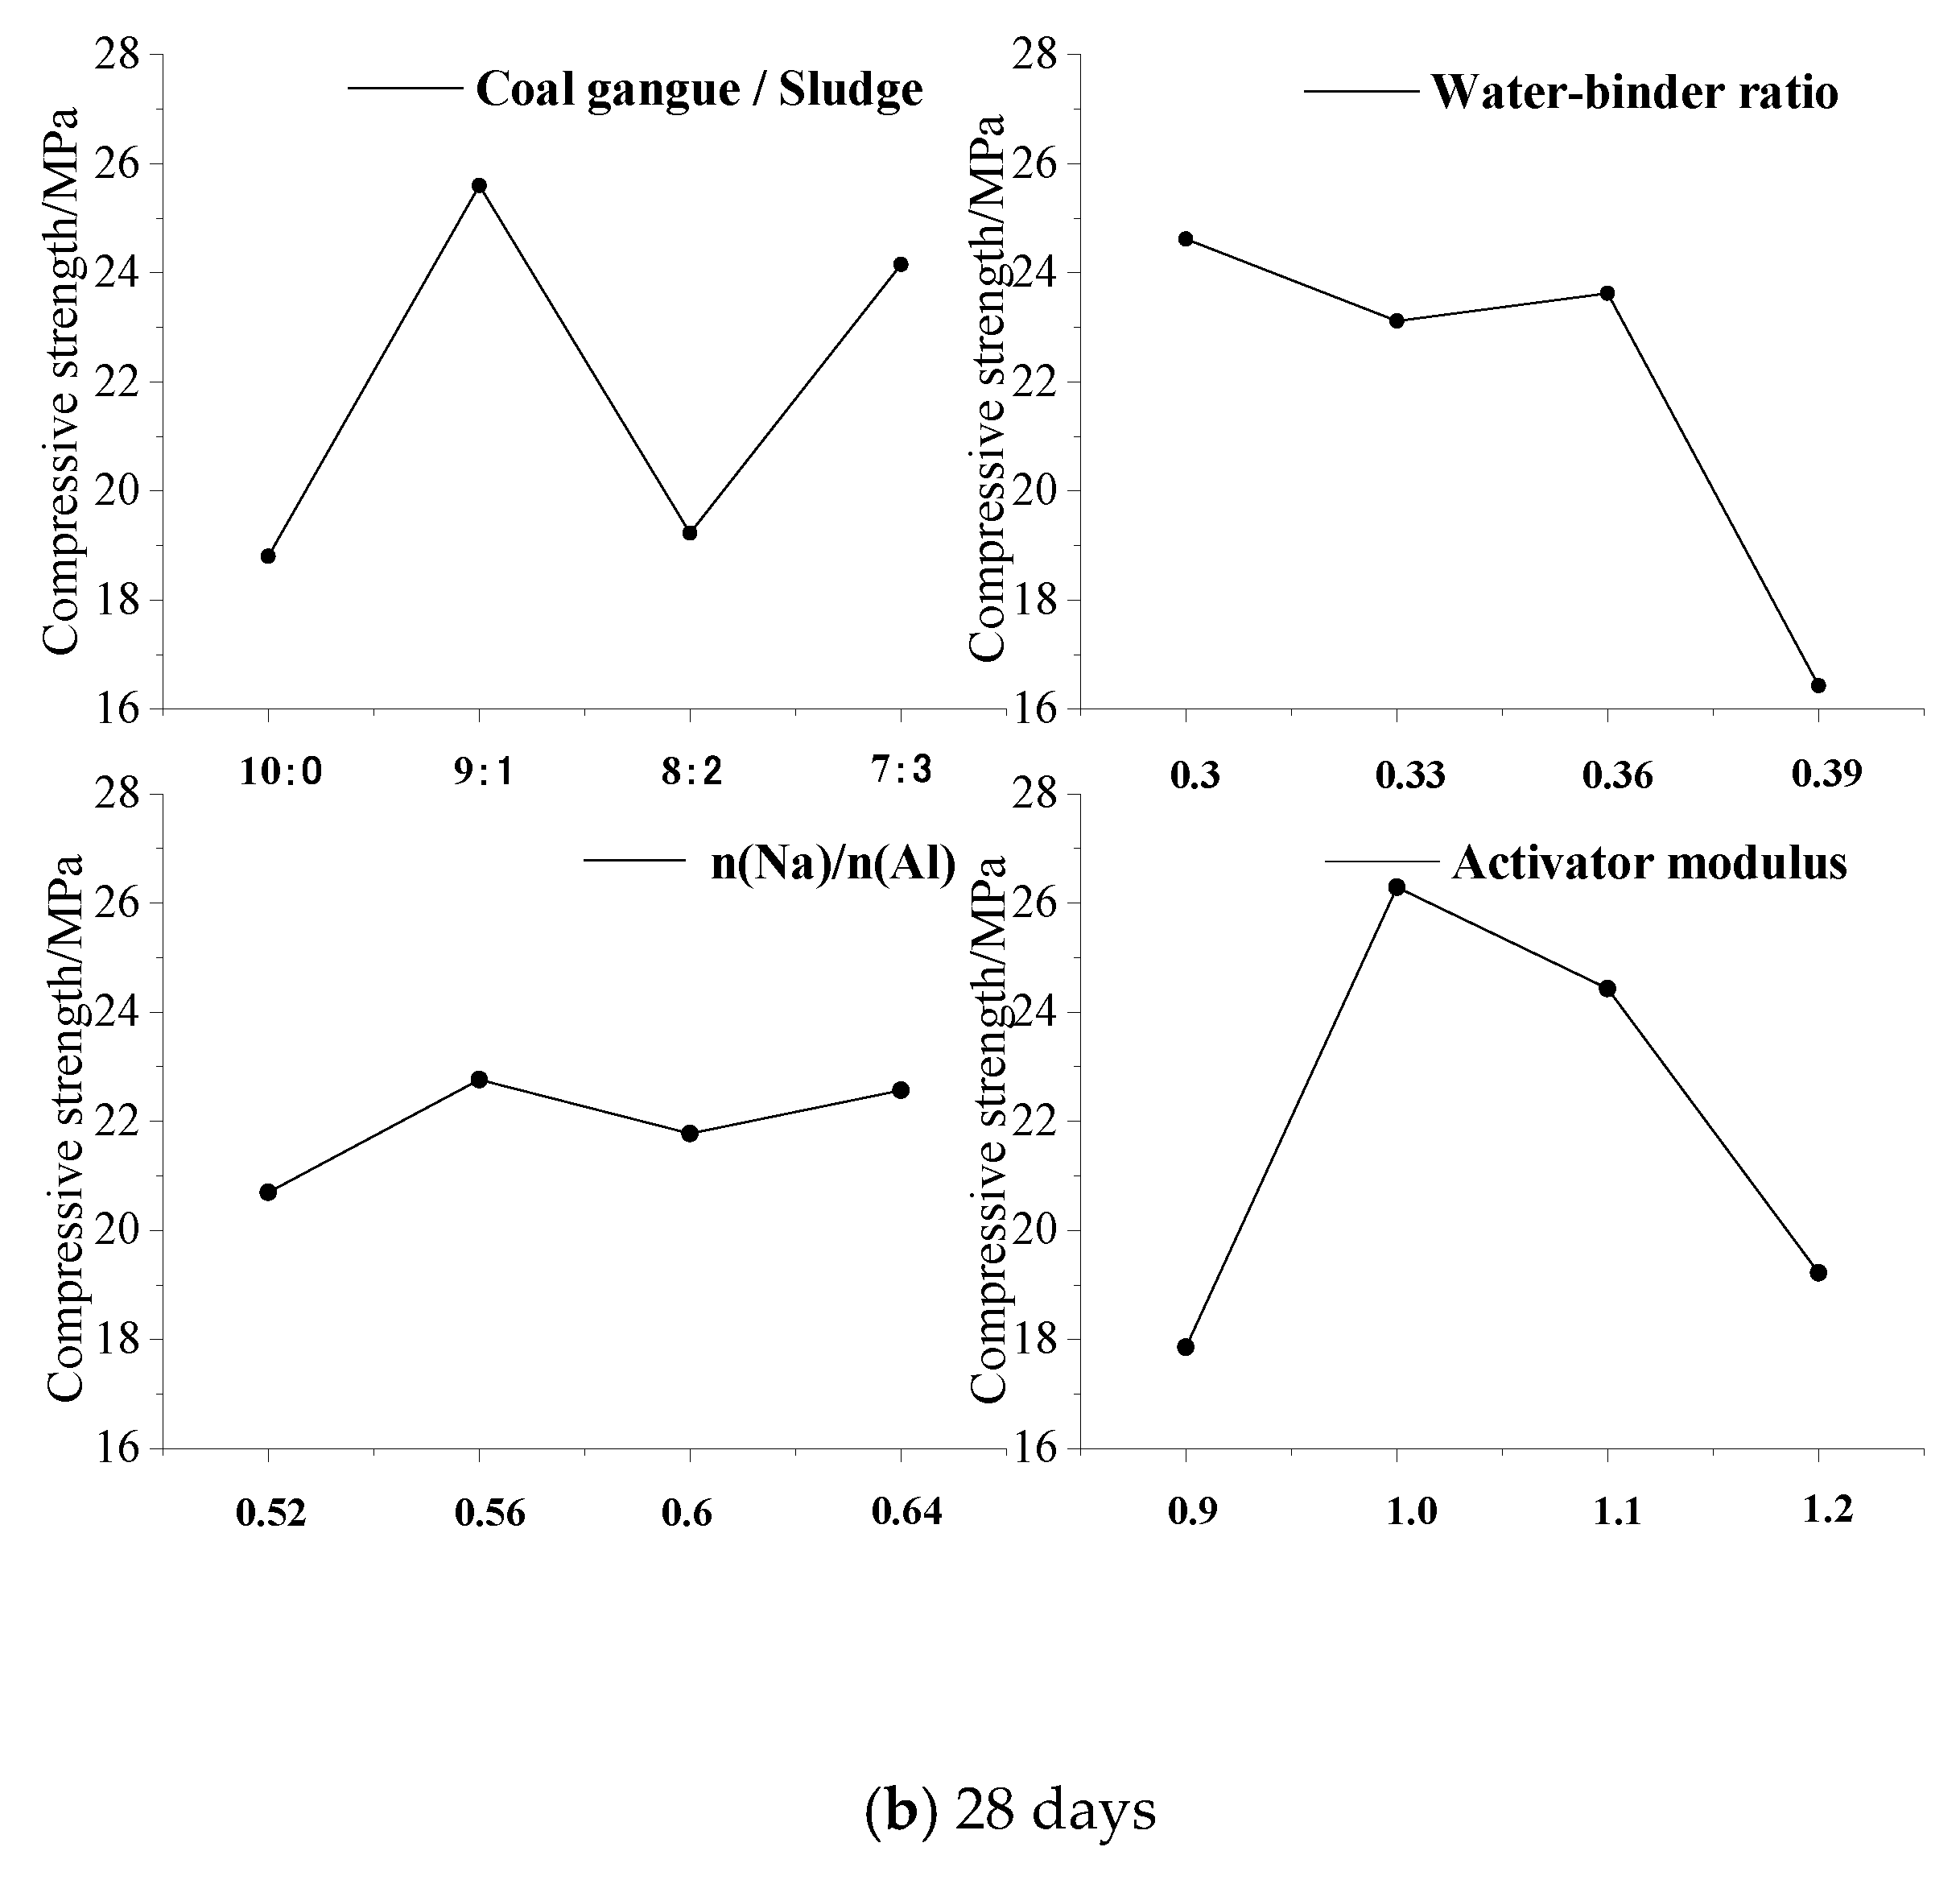
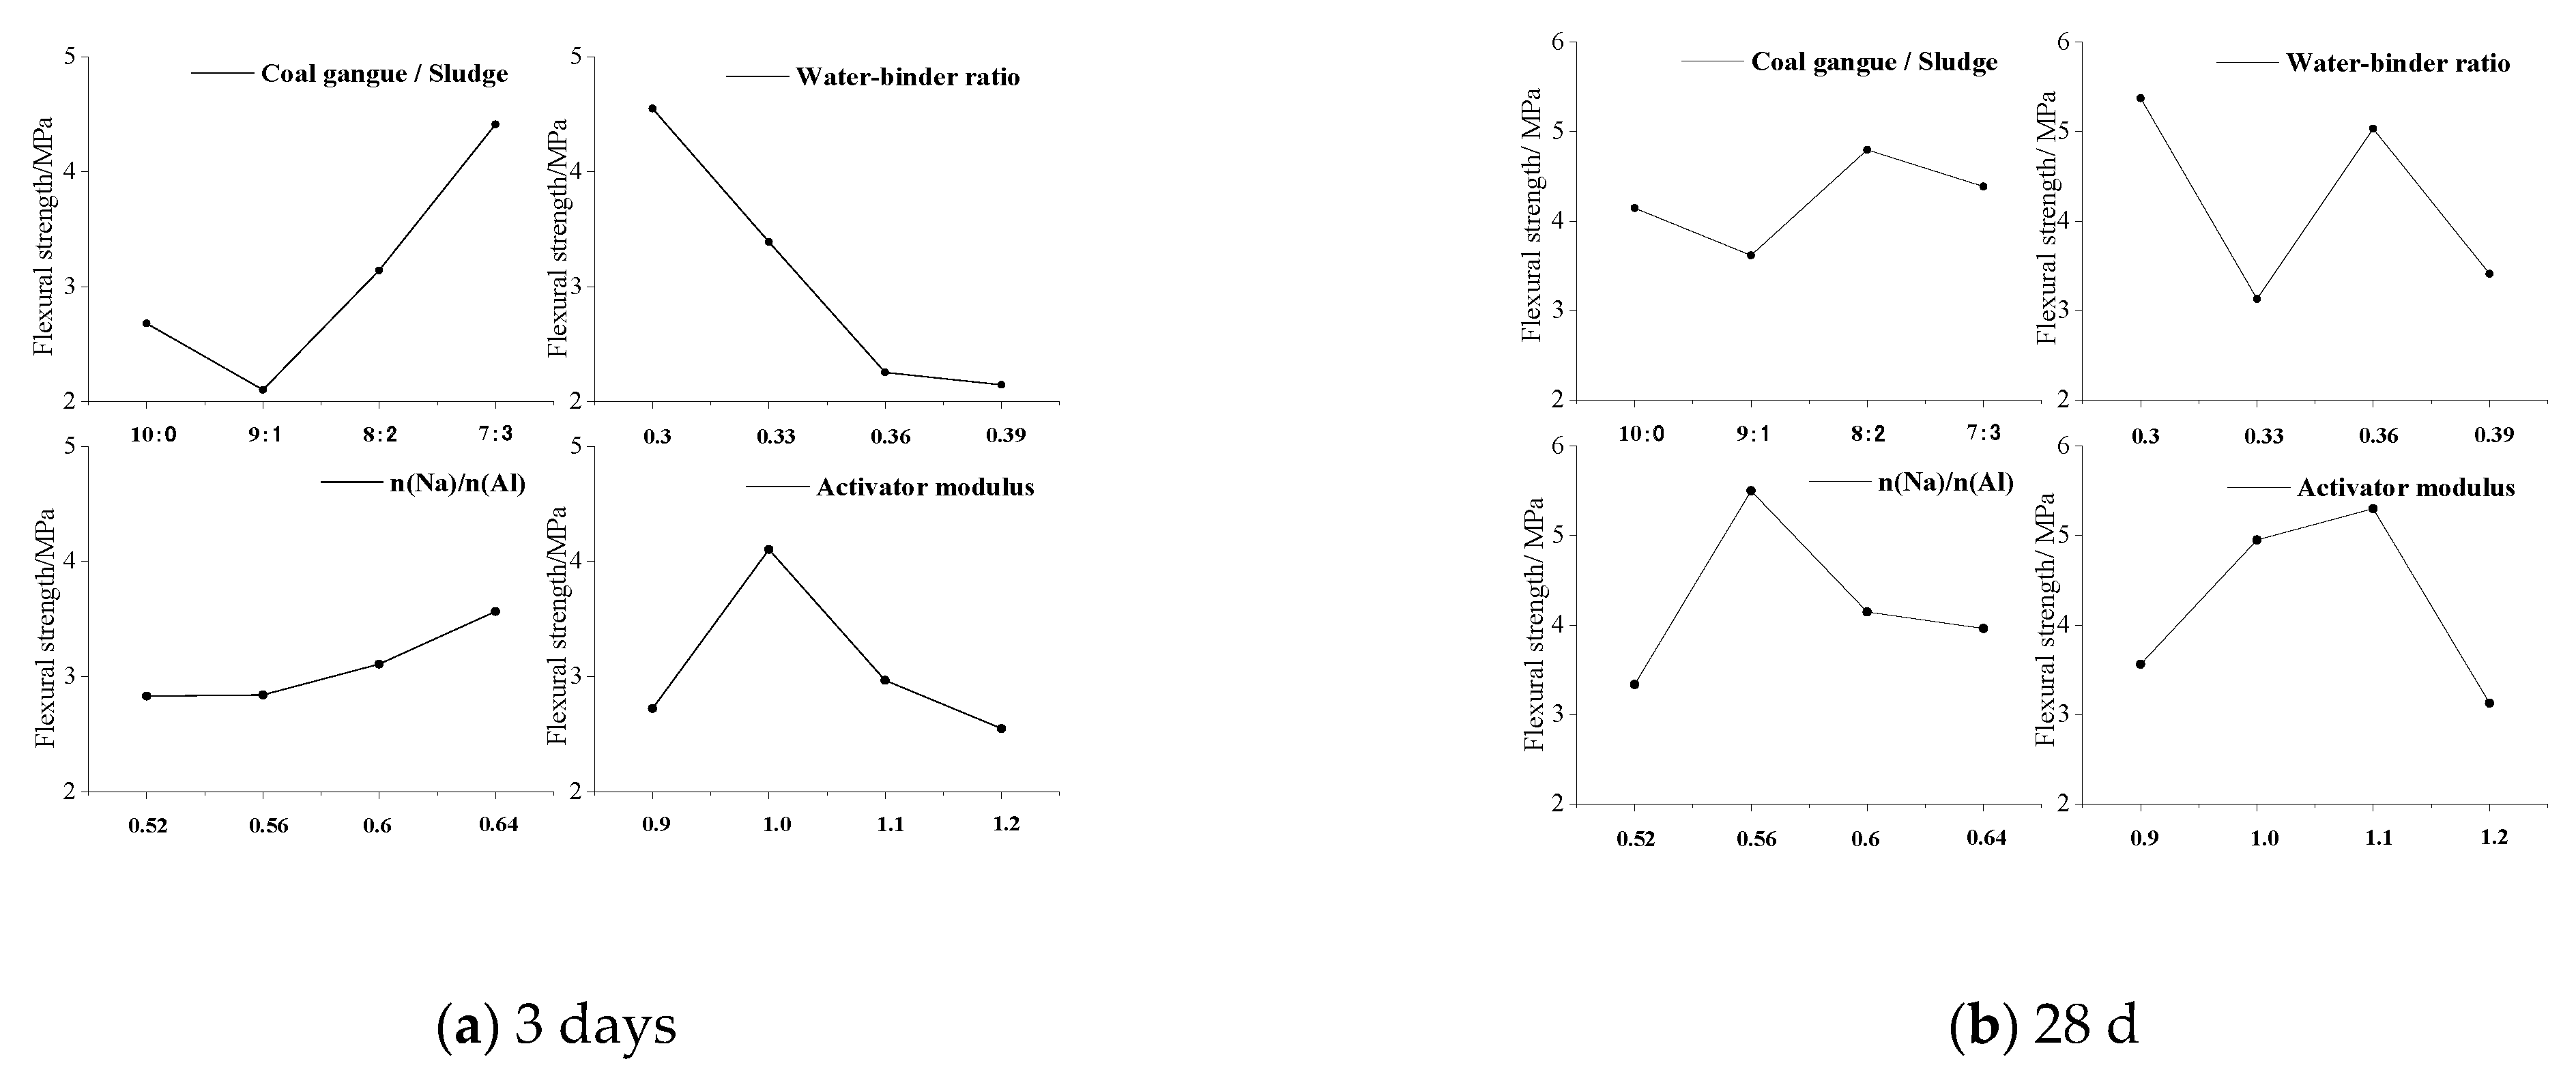
In order to explore the influence of different influencing factors on the CS of CSG in this experiment, the different levels of each influencing factor were used as abscissa to draw the influence curve of each influencing factor level on the CS (Figure 15). The ratio of coal gangue/sludge and the water–binder ratio have significant influence on the CS of CSG at 3 days. With the increase in the mass substitution ratio of sludge to coal gangue, the CS shows an upward trend. This is because there is a large number of calcium-containing minerals in the sludge activated by high temperature, and the low content of active calcium in coal gangue is one of the reasons for the low strength of geopolymer. The substitution of sludge for coal gangue provides a key active calcium component for geopolymer, thus increasing the CS. The larger the water–binder ratio, the better the working performance, but the lower the CS. An increase in the water–binder ratio increases the content of free water in the geopolymer, and increases the porosity of the specimen while increasing the workability of the CSG, resulting in a decrease in the strength of the specimen.
When the local polymer age reaches 28 d (Figure 15b), the modulus of the activator has the greatest influence on the CS of the CSG. With the increase in the modulus of the activator, the CS increases first and then decreases, and the optimal modulus is 1.0. The modulus of the activator refers to the ratio of SiO2 to Na2O in the solution. The higher the modulus, the lower the Na2O content in the activator, which is not conducive to the CSG reaction. However, too high Na2O content will make the surface reaction of coal gangue too fast, will hinder its further dissolution, and will not be conducive to the full progress of the geopolymer reaction.

4.1.3. Analysis of Variance

Table 6 is the results of further analysis of variance of CS based on the original data. In the analysis results of 3 dCS, the water–binder ratio has a significant effect on the early strength of CSG. In the analysis results of 28 d CS, coal gangue/sludge, water–binder ratio, and activator modulus have significant effects on the later strength. This may be because the calcium content, slurry uniformity, and Na2O content are the key factors affecting the geopolymer reaction and improving the strength of the specimen. Therefore, the above three variables can be regulated to achieve the appropriate CS of the specimen. The sodium-to-aluminum ratio has little effect on the CS of the sample in the variance analysis, but in the single-factor sensitivity analysis, the sodium-to-aluminum ratio has a significant effect on the early CS. The maximum CS change is 7.51 MPa, and the effect on the later CS also reaches 2.06 MPa. This may be because the level difference in the selected factor is small, which leads to lower sensitivity of the CS index to the level change in the factor, masking the importance of the factor. Therefore, in this case, it will be more meaningful to rely on single factor analysis to independently assess the impact of various factors.

4.2. Flexural Strength

4.2.1. Range Analysis

The range analysis of 3 d 4.2 FS (FS) of CSG is shown in Table 7. The selected factors have obvious influence on the FS of the sample at 3 d age, and the influence degree of different factors on the FS of CSG is different (the range values are 2.31, 2.40, 0.74, and 1.56, respectively). Among them, the range of factor B (water–binder ratio) is the largest, indicating that the water–binder ratio has the greatest influence on the early FS of CSG, which is an important factor; these results are similar to the analysis results of CS. Compared to the group with the lowest FS (2.15 MPa), the strength of the highest group (4.55 MPa) increased by 111%. The influence degree of each factor is as follows: water–binder ratio > coal gangue/sludge > activator modulus > n (Na)/n (Al). The combination of each factor level is as follows: water–binder ratio: 0.3, coal gangue/sludge: 7:3, n (Na)/n (Al): 0.64, and activator modulus: 1.0. At this time, the early FS of CSG is the highest (7.85 MPa).
At the age of 28 d, various factors also had a significant effect on the FS of CSG (the range values were 1.18, 2.25, 2.17, and 2.18, respectively). Factor B (water–binder ratio) had the most significant effect on the later FS, which is an important factor. The maximum difference in FS at 28 d under different water–binder ratios was 2.3 MPa, and the maximum strength group (5.37 MPa) was 71.6% higher than the minimum strength group (3.13 MPa). The primary and secondary order of the influence of various factors on the 28 dFS is water–binder ratio > activator modulus > n (Na)/n (Al) > coal gangue/sludge.

4.2.2. Sensitivity Analysis

The influence of different factors on the FS of CSG at 3 d age is shown in Figure 16. The ratio of coal gangue/sludge and water–binder ratio has a great influence on the FS of CSG, which is similar to the change rule of CS. With the increase in the mass substitution ratio of sludge to coal gangue powder, the FS decreases first and then increases, because the lack of calcium composition will hinder the formation of C-S-H gel, and the active calcium composition in sludge can make up for this defect. The content of aluminosilicate in sludge is low. When the content is low, the negative effect of replacing coal gangue on the geopolymerization reaction is greater than the positive effect caused by the addition of calcium-containing minerals, resulting in a decrease in strength. With the increase in water–binder ratio, the FS decreased. When the water–binder ratio increased from 0.36 to 0.39, the decrease rate of FS decreased significantly. This shows that when the water–binder ratio is large, the water–binder ratio can be appropriately increased to obtain better working performance with less strength loss. The increase in the water–binder ratio increases the content of free water in the geopolymer, and increases the porosity of the specimen while increasing the workability of the geopolymer, resulting in a decrease in the strength of the specimen.
When the age of CSG reaches 28 d (Figure 16b), the modulus of the activator has the greatest influence on the FS of CSG. With the increase in the modulus of the activator, the FS increases first and then decreases, and the optimal modulus is 1.0.

4.2.3. Analysis of Variance

Table 8 shows the results of further analysis of variance of FS based on the original data. It can be seen that the ratio of sodium-to-aluminum and the modulus of the activator have no significant effect on the 3 dCS, which is consistent with the results of variance analysis of FS. This may be because the hydration reaction has not been fully developed in the early stage. In the analysis results of 28 d FS, the water–binder ratio, sodium-to-aluminum ratio, and activator modulus had significant effects on the later strength. Coal gangue/sludge had no significant effect on the later FS in the variance analysis, but in the single factor sensitivity analysis, coal gangue/sludge had a significant effect on the 28 d FS. The maximum FS change was 1.18 MPa, and the maximum strength group (4.80 MPa) was 32.6% higher than the minimum strength group (3.62 MPa). Therefore, it is necessary to combine a variety of methods to analyze various factors.

4.3. Flexural–Compressive Ratio

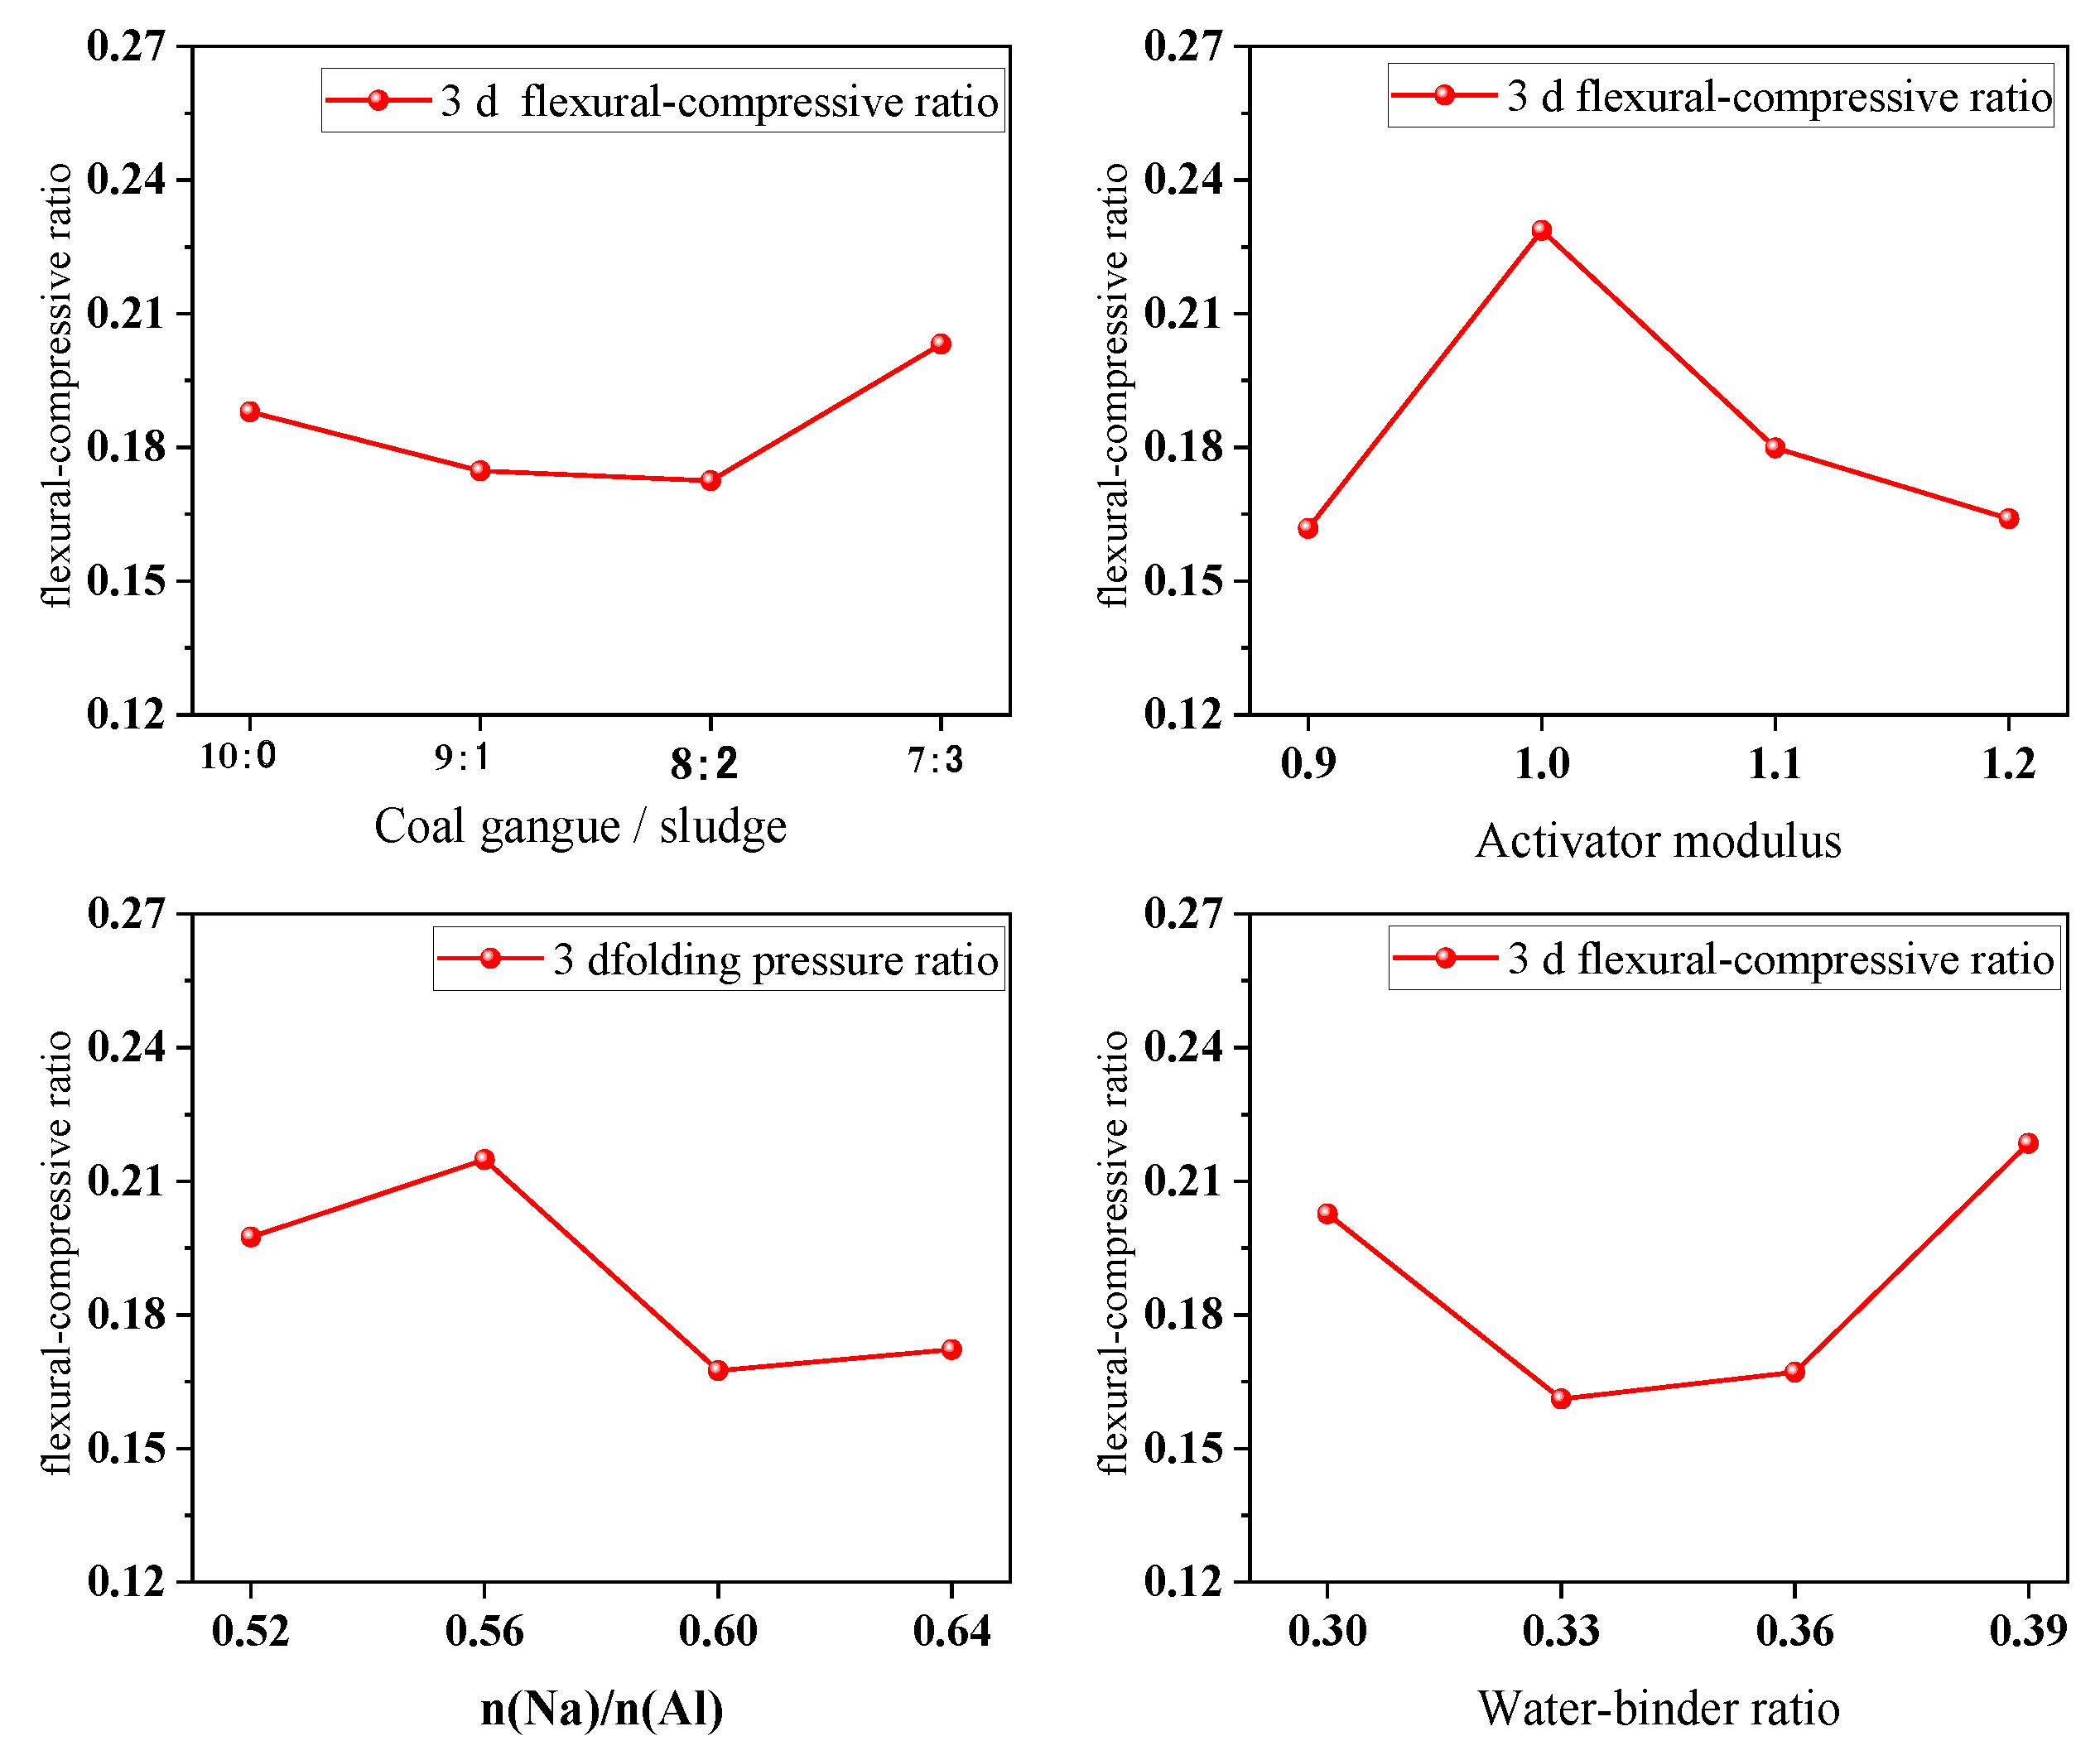
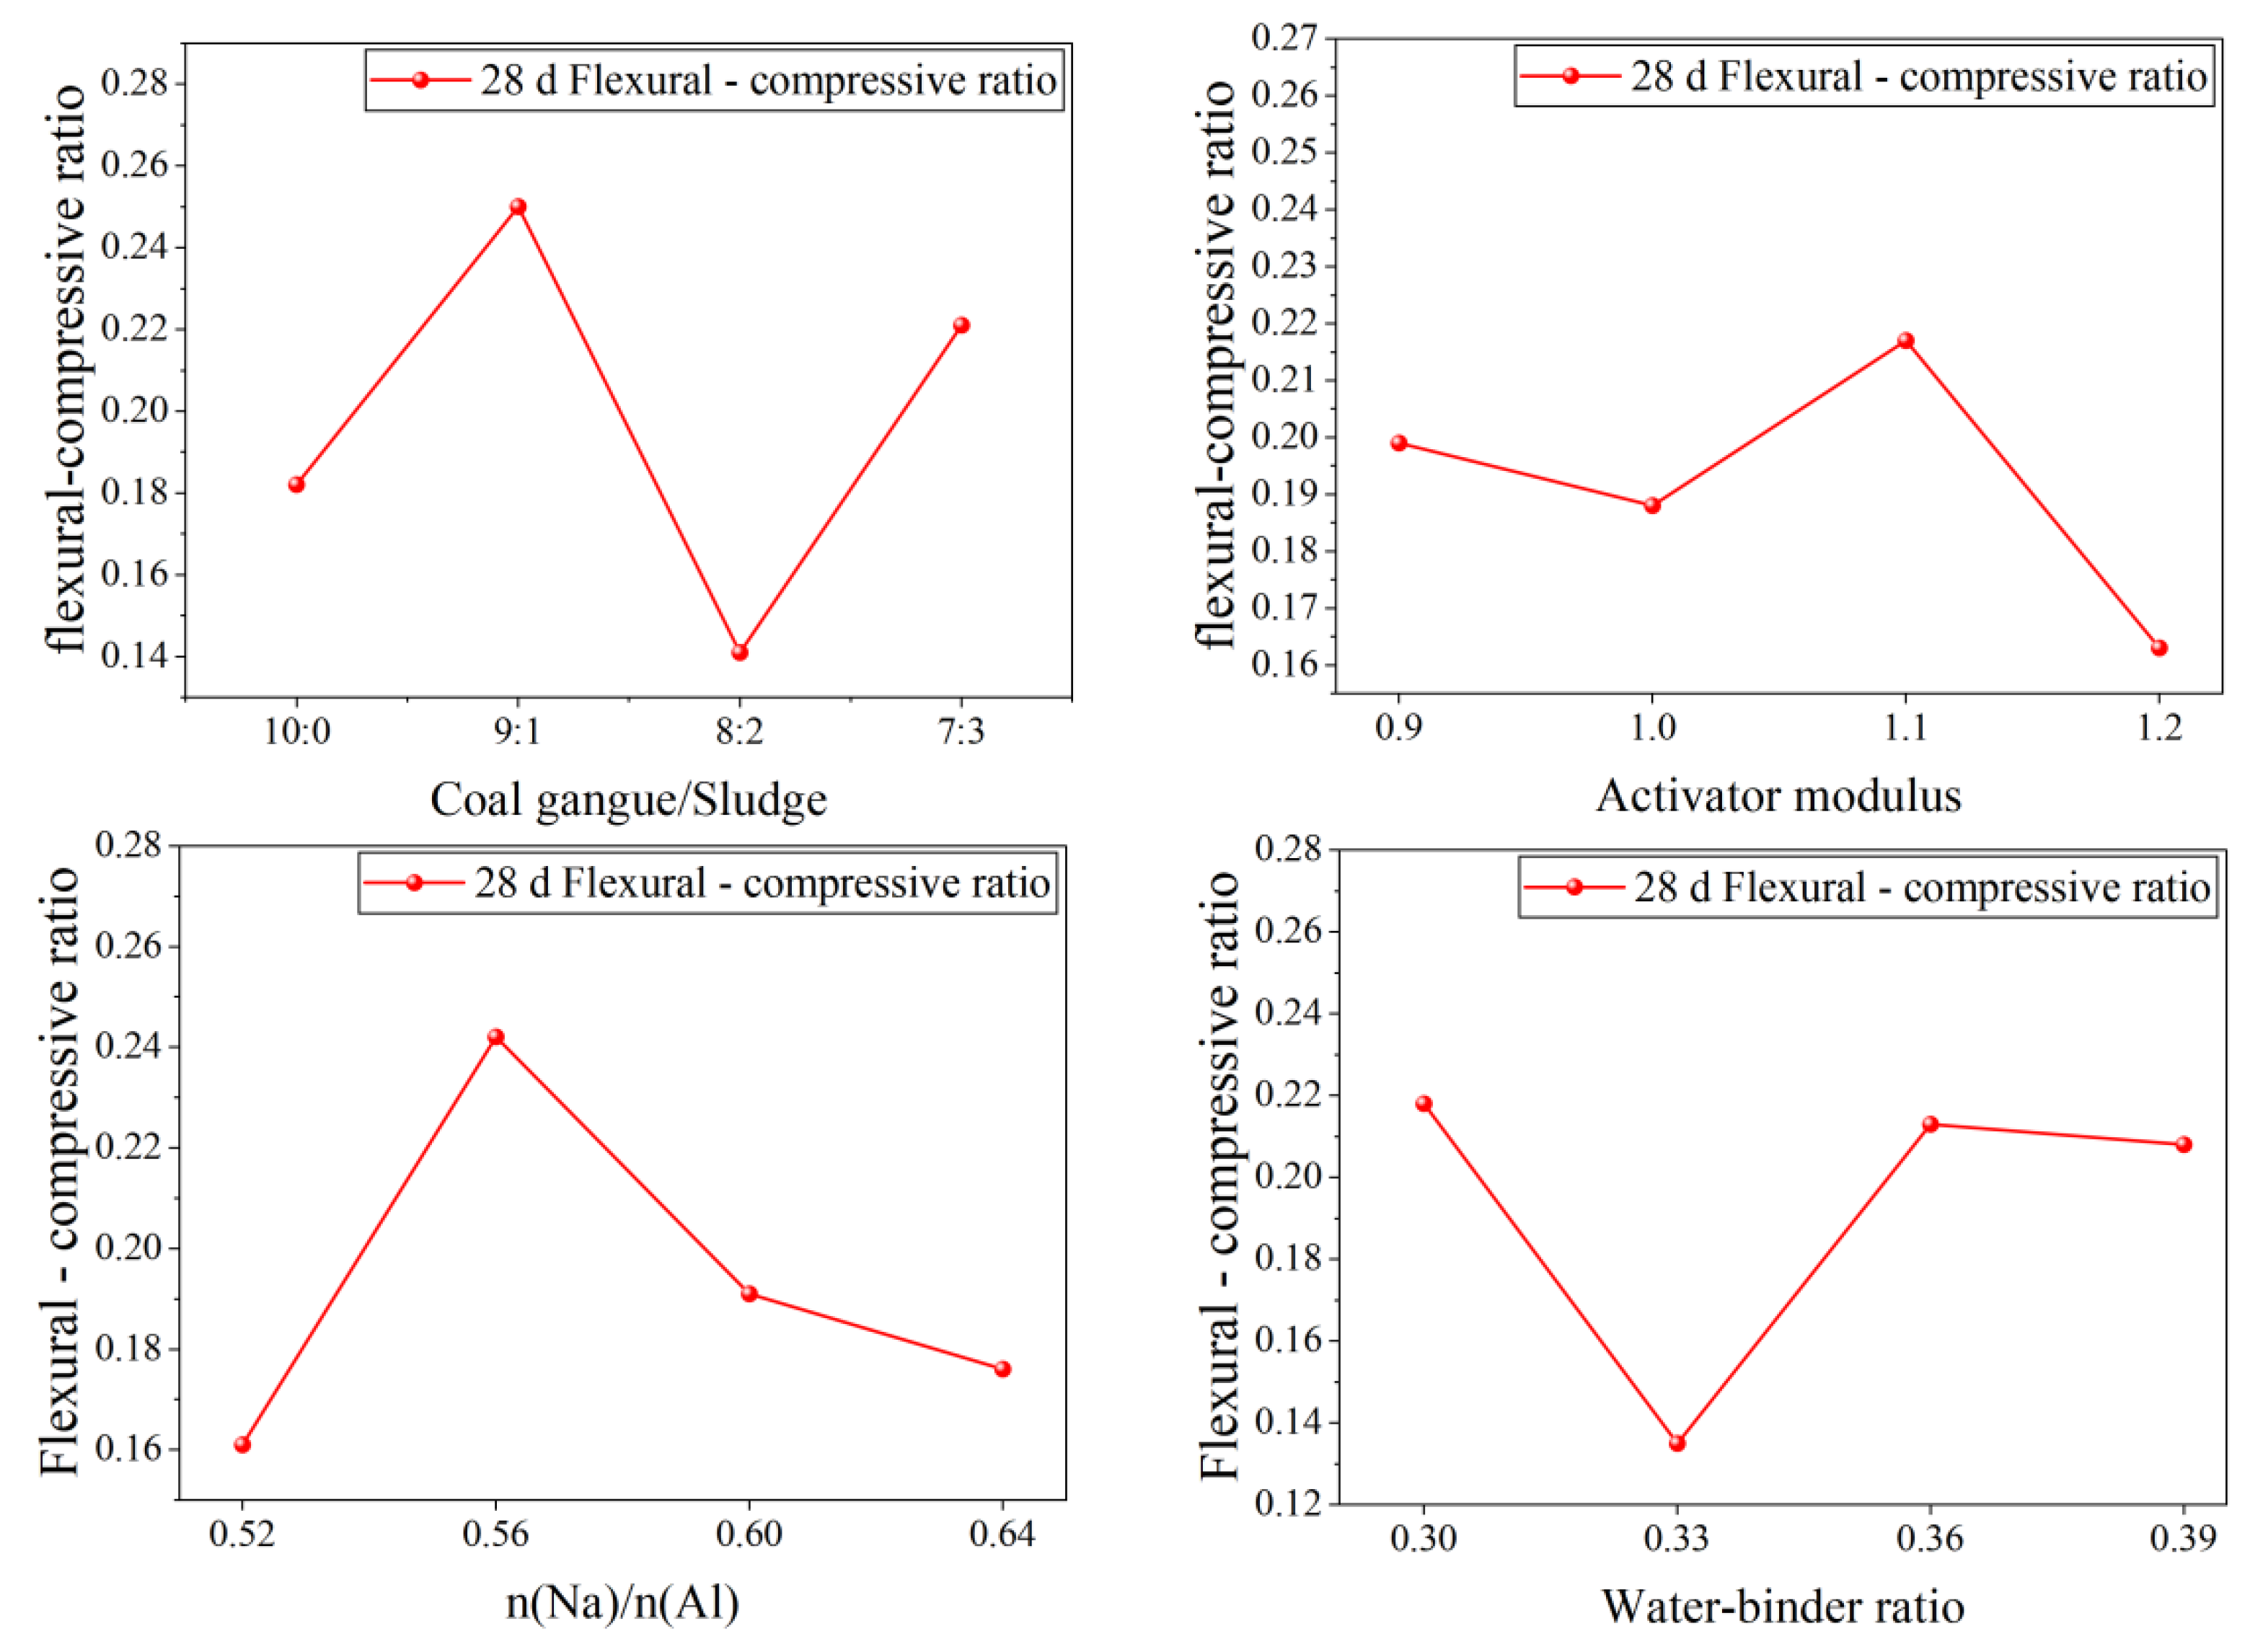
The ratio of FS to CS can indirectly reflect the crack resistance of cement mortar. The larger the ratio of FS to CS is, the better the crack resistance. The test results of the flexural–compressive ratio (ff/fc) of CSG under different influencing factors at 3 days and 28 days are shown in Figure 17 and Figure 18, respectively.
Based on the comprehensive analysis of both 3-day and 28-day flexural–compressive ratios, the crack resistance of the coal gangue/sludge geopolymer (CSG) is significantly influenced by all investigated mix parameters. The optimal formulation was critically determined by prioritizing early-age performance, which is crucial for grouting applications. With the increase in sludge content, the flexural–compressive ratio of the geopolymer exhibits a complex trend. While the 28-day ratio peaks at a coal gangue/sludge ratio of 9:1, the decisive 3-day ratio reaches its maximum at a coal gangue-to-sludge ratio of 7:3. This 3-day value is 7.0% higher than that of the sludge-free sample, establishing 7:3 as the optimal ratio for early-age performance. The effect of the activator modulus also shows a dependency on the curing age. The flexural–compressive ratio initially increases and then decreases with increasing modulus. The 28-day performance is optimal at a modulus of 1.1; however, the critical 3-day ratio peaks decisively at a modulus of 1.0. At this modulus, the 3-day flexural–compressive ratio is 41.6% higher than that of the sample with the lowest ratio, confirming 1.0 as the optimal choice for early strength. Similarly, the sodium-to-aluminum ratio demonstrates a consistent optimal value across both curing ages. The flexural–compressive ratio increases to a peak and then decreases with a further increase in the ratio. A sodium-to-aluminum ratio of 0.56 yields the largest flexural–compressive ratio for both the 3-day and 28-day tests, demonstrating that the sample prepared with this ratio possesses the best crack resistance. The water–binder ratio shows a non-linear relationship with the flexural–compressive ratio, which first decreases and then increases. The 28-day data indicates stable performance after a water–binder ratio of 0.36, but the essential 3-day crack resistance is found to be the best at a higher water–binder ratio of 0.39. In conclusion, the variations in different factors significantly affect the crack resistance of CSG. When the coal gangue/sludge ratio is 7:3, the activator modulus is 1.0, the sodium-to-aluminum ratio is 0.56, and the water–binder ratio is 0.39, the CSG possesses the best overall flexural–compressive ratio, optimized specifically for superior early-age crack resistance required in grouting materials.

4.4. Microscopic Mechanism Analysis

4.4.1. XRD

The XRD patterns of L-1 and L-13 geopolymer samples cured for 28 d are shown in Figure 12. Among them, L-1 is a pure coal gangue geopolymer. Quartz (SiO2), albite (NaAlSi3O8), calcite (CaCO3), and ettringite (3CaO·Al2O3·3CaSO4·32H2O) were identified in the map of L-1. Ettringite is the main reaction product of OPC, which is identified in geopolymer samples, indicating that the cementitious properties of pure coal gangue geopolymer are partially similar to those of Portland cement. However, in the case of calcium deficiency, a large amount of calcareous minerals will not be generated, which seriously affects the growth of strength. Therefore, one of the feasible methods is to supplement the materials with high-calcium minerals in the precursor, and the strength of the geopolymer can be improved by increasing the composition of the calcium minerals [20].
L-13 is a CSG. Quartz (SiO2), albite (NaAlSi3O8), calcite (CaCO3), ettringite (3CaO·Al2O3·3CaSO4·32H2O), anorthite (CaO·Al2O3·2SiO2), carbon calcium magnesium stone (Ca (OH)2), and Calcium Silicate Hydrate (Ca6Si3O12·xH2O) were identified in its spectrum. The addition of sludge provides an active calcium component for the geopolymer. Compared to the sample without sludge, it can be seen that the strength of the characteristic peaks of calcite and the apparent peaks of anorthite, hydrated calcium silicate, and calcium hydroxide increase. Therefore, it can be considered that anorthite, hydrated calcium silicate, and calcium hydroxide are new calcium-containing products formed during the hydration process of CSG. The formation of hydrated calcium silicate plays an important role in increasing the strength of CSG, which is the same as the research results of Huang et al. [10]. Another new calcium-containing product (anorthite) found in binary geopolymers is a major rock-forming mineral type, which also promotes the development of CS [21]. The increase in the calcite characteristic peak indicates that the increase in calcite mineral composition in coal gangue/sludge geopolymer also contributes to the improvement of its strength. In summary, the increase in the strength of coal gangue/sludge geopolymers is inseparable from the active calcium components provided by sludge. Due to the increase in calcium content, calcium-containing minerals react with the active silica generated by the activator from coal gangue through C-S-H and C-S-A-H gels. [22] Therefore, coal gangue and sludge can be mixed as complementary materials, significantly improving the CS, which is consistent with the experimental results of this study.

4.4.2. SEM

According to the SEM image, the cross-sectional morphology of the geopolymer sample can be determined, and the differences in the microstructure morphology under different ratios can be distinguished. Figure 13 is the SEM image of the numbered L-1 and L-13 geopolymers at different multiples of the 28 d age. At a magnification of 4000 times (Figure 13a), it can be seen that the pure coal gangue geopolymer (L-1) is mainly composed of N-A-S-H gel, aluminosilicate gel, and some unreacted coal gangue particles. A large number of unreacted coal gangue particles make its organizational structure loose and porous, and the strength of the geopolymer decreases. This may be due to the lack of calcium-containing minerals. The polymerization reaction is not complete, and there are unreacted coal gangue particles. In contrast, the overall hydration degree of the L-13 sample (Figure 13b) after adding sludge is significantly better than that of L-1, with a denser and more uniform structure. Even at a larger perspective (Figure 13c,d), the hydration degree and structural compactness of L-13 are better than those of L-1, which is consistent with the law observed at high multiples. The existence of hydrated calcium silicate, anorthite, and calcium hydroxide was also found, which are new types of calcium-containing mineral produced after adding sludge. Calcium silicate hydrate and anorthite play an important role in improving the strength of CSG [10]. The combination of the high alkaline environment and the large amount of calcium-containing minerals provided by the sludge may generate more calcium hydroxide. The free calcium oxide structure is dense and the hydration rate is slow. The volume expansion is about double when hydrated to form calcium hydroxide, which causes the hardened geopolymer to produce expansion stress, resulting in a decrease in the strength of the geopolymer [23].

4.5. Carbon Footprint Analysis of Geopolymer

Low carbon emissions are a major advantage of CSG, but regarding the advantages of CSG in terms of carbon emissions in this paper, a clear quantitative analysis is needed. Therefore, this section calculates the implied carbon dioxide of each mixture prepared by summarizing the carbon emissions released during the production of each ingredient used to prepare CSG. The coal gangue and sludge solid waste materials used in this paper do not produce a carbon emission footprint in the calculation of this study. The formula in this paper is based on the mixing ratio shown in Table 9. The amount of each ingredient of the geopolymer mix ratio is multiplied by its carbon coefficient, and the carbon emissions of each ingredient are added together to calculate the total carbon emissions of the entire mix ratio, as an indicator of its carbon emission footprint.
Furthermore, the utilization of solid wastes in cementitious systems has become a key strategy for reducing environmental impact. The research by Das and Xiao [24] on upcycling waste glass bottles in Engineered Cementitious Composites (ECCs) proposed a novel life cycle assessment framework that incorporates regional variations, including transportation emissions and energy mix. Their study confirmed that using waste glass powder as a supplementary cementitious material can achieve a notable reduction of 8–10% in CO2 emissions. The detailed transportation scheme and emission factors established in their study provide a methodological reference for the assessments conducted herein.
Table 9. Emission factors of carbon dioxide.
Materials and ProcessCarbon Emission Factor (kg CO2-e/kg)Data Sources
Coal gangue--
Sludge--
NaOH1.43[25]
Na2SiO30.78[25]
Portland cement0.91[26]
Water0.0002[26]
Agitation0.003[27]
The carbon emissions of geopolymer and cement paste production are determined by the product of material consumption (M) and carbon emission factor (CEF). The formula is as follows:
C = i = 1 n M C i · C E F i
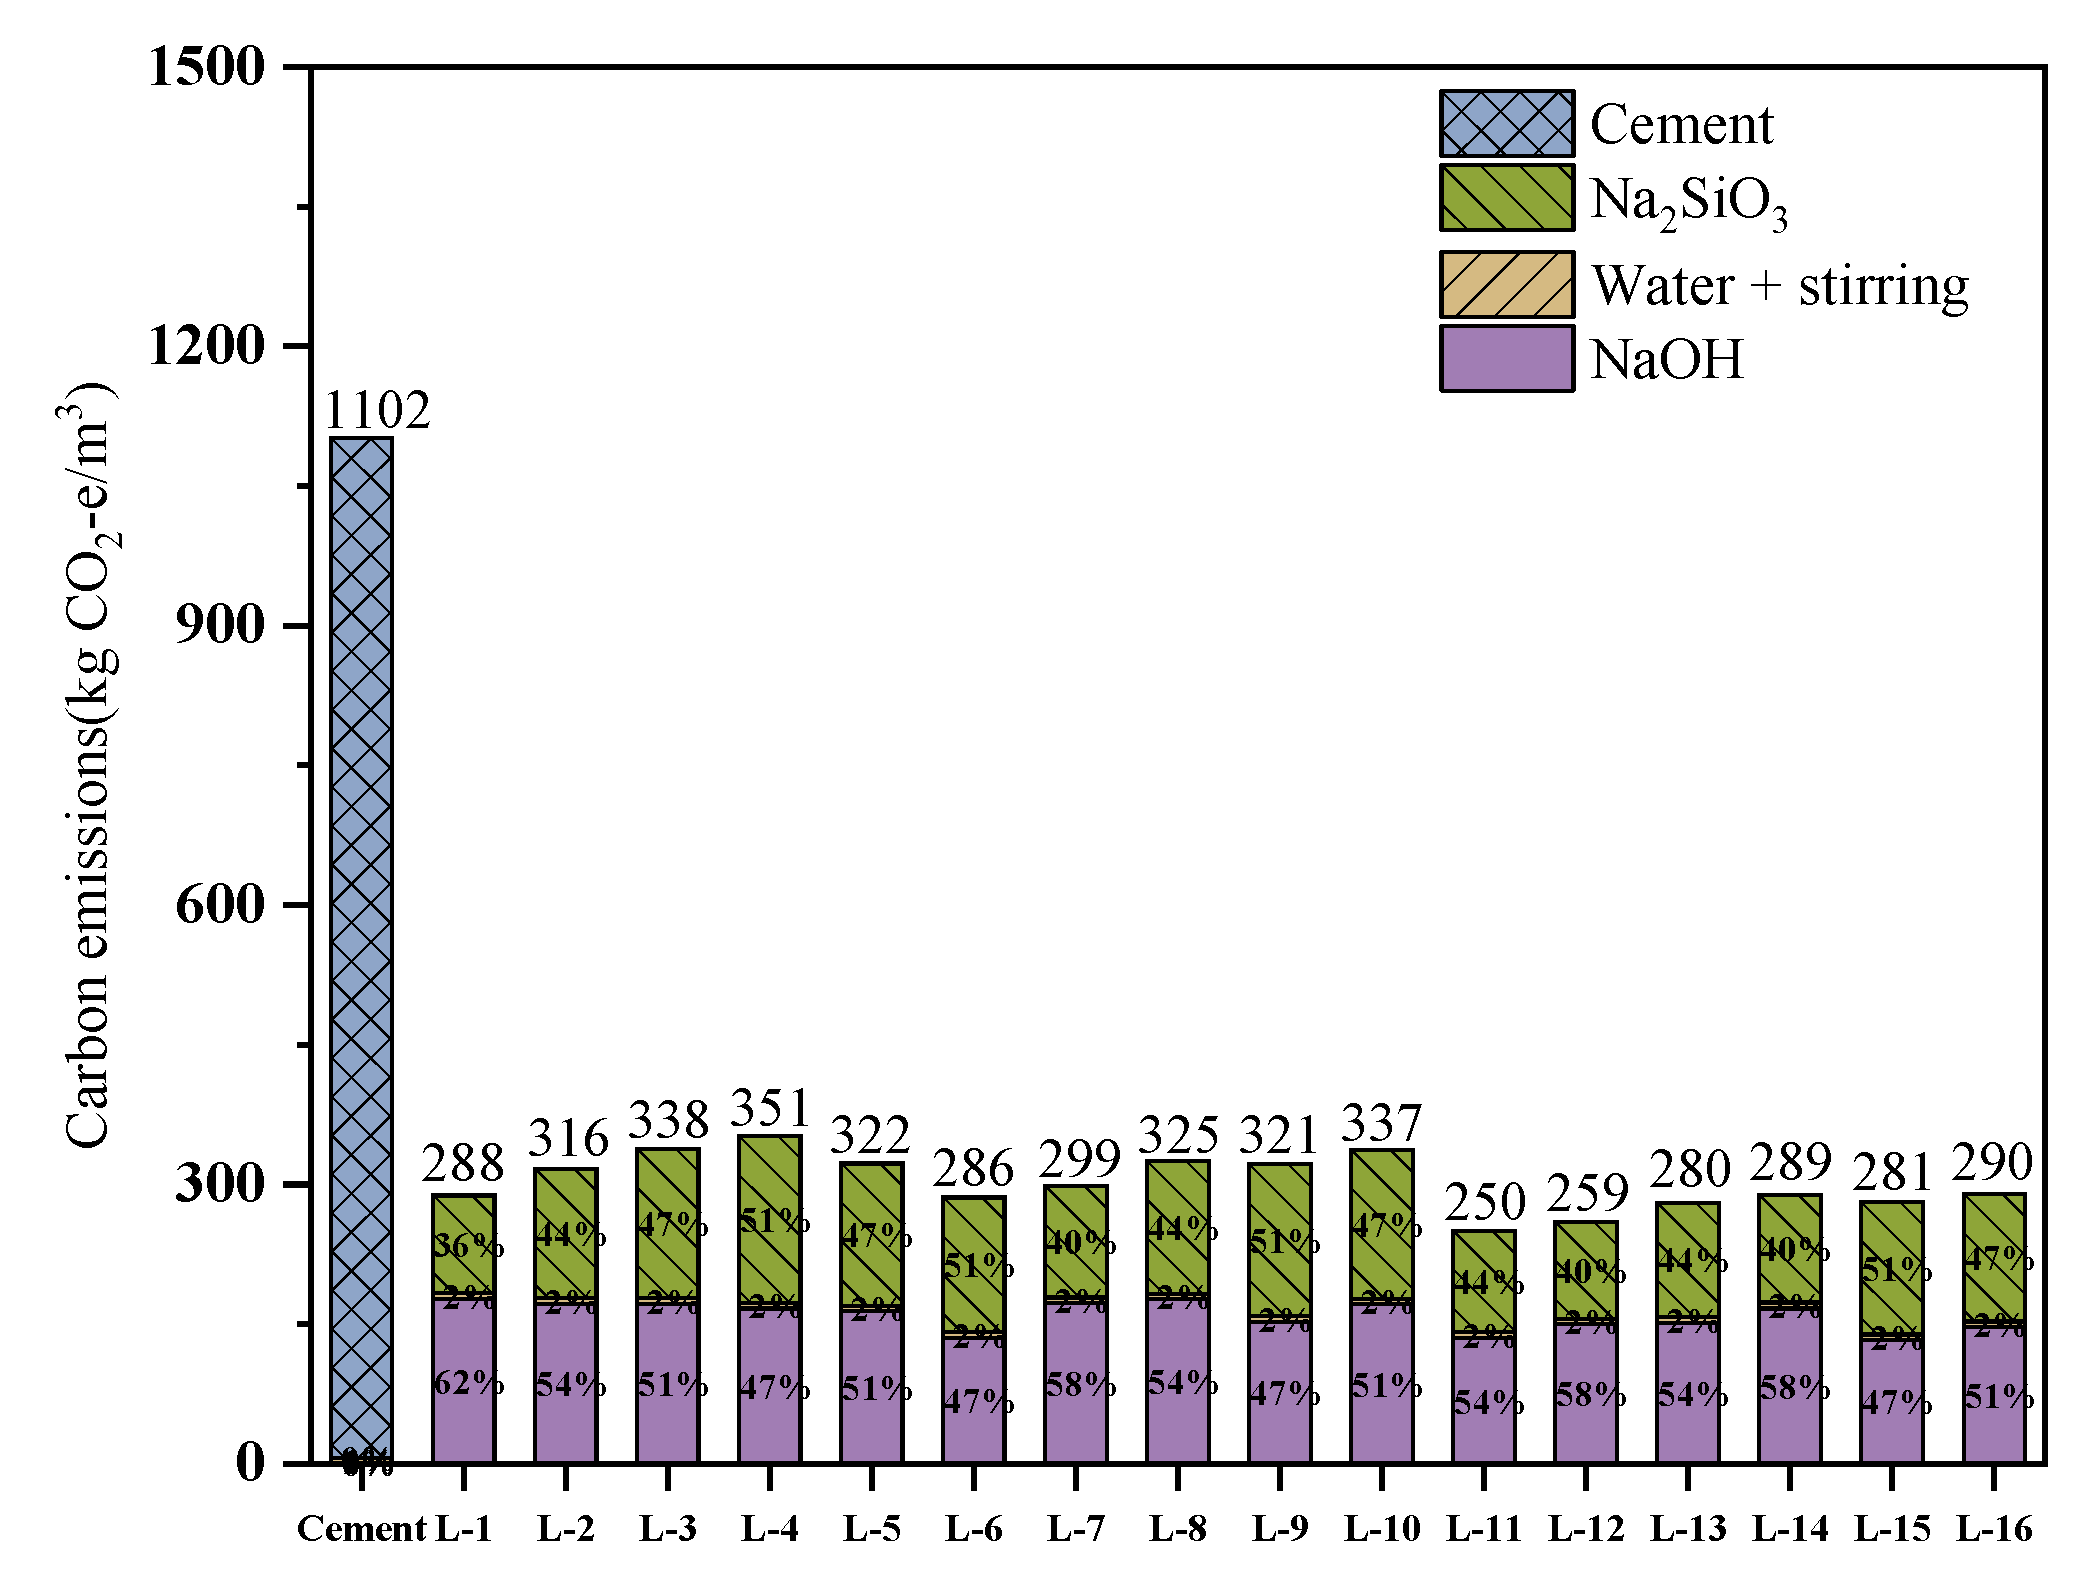
In this experiment, the carbon emission of geopolymer with different ratios is between 250~352 kg CO2-e/m3, and the carbon emission of cement paste is 1102 kg CO2-e/m3 (as shown in Figure 19). The carbon emissions of all geopolymer mix ratios are significantly lower than those of cement paste. The carbon emissions of L-13 geopolymer are 74.6% lower than those of cement paste, meaning that it can be used as a new sustainable cementitious material in green construction.
To further highlight the environmental efficiency of the optimal mixture, the strength-to-emission ratio (SER), defined as the compressive strength per unit of carbon emission (MPa per kg CO2-e/kg), was calculated for the L-13 specimen. With a 3-day compressive strength of 34.5 MPa and a carbon emission of 280 kg CO2-e/m3, the L-13 mixture achieves an SER of 0.123 MPa/(kg CO2-e/m3). In contrast, assuming a typical 28-day compressive strength of 30 MPa for cement paste, its SER is only 0.027 MPa/(kg CO2-e/m3). This comparison reveals that the L-13 geopolymer not only possesses superior early-age strength but also delivers 4.6 times the mechanical performance per unit of carbon emission in just 3 days compared to the final performance of conventional cement-based grouting materials. Even under identical 28-day curing conditions, the L-13 mixture, with a 28-day compressive strength of 31.9 MPa, achieves an SER of 0.114 MPa/(kg CO2-e/m3), which is still 4.2 times that of the cement paste as presented in Table 10. This further demonstrates the exceptional mechanical and environmental benefits of this geopolymer throughout its service life.

5. Conclusions and Future Work

In this paper, the influence of water–binder ratio, sodium-to-aluminum ratio, activator modulus, sludge and other mass substitutions of coal gangue on the mechanical properties of CSG was investigated using an orthogonal test, and the optimal mix ratio to meet the engineering needs was obtained. The reaction mechanism was analyzed by microscopic testing, which provided an experimental and theoretical basis for the development of coal gangue cementitious materials. The specific test conclusions are as follows:
  • When the coal gangue/sludge ratio is 7:3, the water–binder ratio is 0.3, the sodium-to-aluminum ratio is 0.64, and the activator modulus is 1.0, the geopolymer achieves a 3-day compressive strength (CS) of 34.5 MPa, a 3-day flexural strength (FS) of 7.85 MPa, and a final setting time of 90 min, demonstrating its suitability for use as a grouting material in engineering practice. However, the lower water–binder ratio may limit fluidity, requiring a balance between workability and early strength in practical grouting applications.
  • According to the analysis of variance and range analysis, the water–binder ratio, sodium-to-aluminum ratio, activator modulus, and the amount of coal gangue replaced by sludge have an effect on the mechanical properties of CSG, among which the water–binder ratio has the most significant effect. The CS of CSG increases with the decrease in the water–binder ratio, and the crack resistance decreases first and then increases with the increase in the water–binder ratio.
  • Sludge and coal gangue can be used as good complementary materials to prepare all-solid-waste geopolymer. The calcium-containing minerals in sludge supplement the deficiency of low calcium content in coal gangue and generate more calcium-containing minerals in the hydration process, which is helpful to improve the mechanical properties of geopolymer.
  • The carbon emissions of alkali-activated normal-temperature-solidified geopolymer are much lower than those of cement paste, and the carbon emissions of the optimal ratio L-13 specimen are 74.6% lower than those of cement paste. It can therefore be used as a new sustainable cementitious material in green construction.
  • Future research could explore the scalability of this all-solid-waste system and draw inspiration from other successful cases of alternative material utilization [11] to further enhance its field applicability in diverse harsh environments.

Author Contributions

Y.G.: Conceptualization, Supervision, Validation, Writing—review and editing. M.C.: Data curation, Writing—original draft, Formal analysis, Visualization. B.Z.: Data curation, Formal analysis, Visualization. X.Y.: Fund Providers, Supervision, Formal analysis, Writing—review and editing. S.L.: Supervision, Formal analysis. Y.C.: Supervision, Formal analysis. S.C.: Fund Providers, Supervision, Formal analysis. All authors have read and agreed to the published version of the manuscript.

Funding

This project was sponsored by Henan Province Science and Technology Research Project (No.252102321043) and the Joint Fund of Henan Province Science and Technology R&D Program (225200810056, 235200810044).

Data Availability Statement

All the relevant data and models used in the study have been provided in the form of figures and tables in the published article.

Conflicts of Interest

Author Borui Zhou was employed by the company China MCC5 Group Corp. Ltd. Author Shengqiang Chen was employed by the company Henan Building Materials Research and Design Institute Co., Ltd. The remaining authors declare that the research was conducted in the absence of any commercial or financial relationships that could be construed as a potential conflict of interest.

References

  1. Chang, Y.; Shi, C.J.; Yang, N.; Yang, J. Research Progresses on Durability of Magnesium Phosphate Cement Based Materials. J. Chin. Ceram. Soc. 2014, 42, 486–493. [Google Scholar]
  2. Davidovits, J. Properties of geopolymer cements. In Proceedings of the First International Conference on Alkaline Cements and Concretes, Scientific Research, Kiev, Ukraine, 11–14 October 1994; pp. 131–149. [Google Scholar]
  3. Zhou, M.; Bai, J.T.; Guo, L.Z.; Zhang, Y.Z. Optimization of Grouting Material Proportion of Coal Gangue Geopolymer Based on Response Surface Methodology. Mater. Rep. 2023, 37, 123–131. [Google Scholar]
  4. Sha, F.; Liu, R.T.; Li, S.C.; Lin, C.; Li, Z.; Liu, B.; Bai, J. Application on different types of cementitious grouts for water-leakage operational tunnels. J. Cent. South Univ. (Sci. Technol.) 2016, 47, 4163–4172. [Google Scholar]
  5. Guo, L.Z.; Zhou, M.; Wang, L.J.; Xie, P.; Zhang, X. Preparation and Properties of Coal-Based Solid Waste Geopolymer Grouting Materials. J. Build. Mater. 2022, 25, 1092–1100. [Google Scholar]
  6. Feng, H.; Zhang, X.M.; Ou, X.F.; Zhang, C.; Jiang, J.; Guo, T.F.; Zhou, X.S. Experimental Study on Geopolymer Grouting Material in Rapid Grouting Reinforcement of Fractured Rock. J. South China Univ. Technol. (Nat. Sci. Ed.) 2020, 48, 43–50. [Google Scholar]
  7. Li, Z.F.; Liu, C.; Wang, C.; Zhang, J.; Wang, Y.; Gao, Y. Experimental Study on Grouting Material of Red Mud–blast Furnace Slag–steel Slag Ternary System. Adv. Eng. Sci. 2021, 53, 203–211. [Google Scholar] [CrossRef]
  8. Guo, L.; Zhou, M.; Wang, X.; Li, C.; Jia, H. Preparation of coal gangue-slag-fly ash geopolymer grouting materials. Constr. Build. Mater. 2022, 328, 126997. [Google Scholar] [CrossRef]
  9. Guo, Y.; Huang, Y.; Li, J.; Ouyang, S.; Fan, B.; Liu, Y.; Hou, G. Preparation of the geopolymer grouting material by coal-based solid wastes for the aquiclude key strata and its application. Constr. Build. Mater. 2023, 408, 133539. [Google Scholar] [CrossRef]
  10. Huang, G.; Ji, Y.; Li, J.; Hou, Z.; Dong, Z. Improving strength of calcinated coal gangue geopolymer mortars via increasing calcium content. Constr. Build. Mater. 2018, 166, 760–768. [Google Scholar] [CrossRef]
  11. Das, A.K.; Qi, Y. High performance natural seawater coral sand ECC (HP-NSCS-ECC) in coastal conditions: Experimental characterization, microstructure, and sustainability. Constr. Build. Mater. 2025, 499, 143860. [Google Scholar] [CrossRef]
  12. Luo, X.; Xu, J.; Bai, E.; Li, W. Systematic study on the basic characteristics of alkali-activated slag-fly ash cementitious material system. Constr. Build. Mater. 2012, 29, 482–486. [Google Scholar] [CrossRef]
  13. Zhou, J.F.; Chen, S.K.; Das, A.K. Application of sludge as a sustainable material inbuilding materials: A comprehensive review. J. Build. Eng. 2025, 111, 113434. [Google Scholar] [CrossRef]
  14. Pan, Y.C.; Lv, X.B.; Tao, J.; Yu, H.J.; Yang, S.J.; Cui, J.G.; Ren, G.Q.; Xiong, J. Research progress of sludge pretreatment and resource recycling technology. Appl. Chem. Ind. 2024, 53, 900–905. [Google Scholar] [CrossRef]
  15. Xu, Z.F.; Zou, X.T.; Chen, J. Preparation of Thermal Activation Sludge and Coal Gangue Polymer. Integr. Ferroelectr. 2015, 160, 1–9. [Google Scholar] [CrossRef]
  16. Guo, L.; Zhao, W.H.; Guo, L.X.; Wang, Z. Study on mechanical properties and pore structurecharacteristics of alkali activation sludge-cement composites. Mater. Today Commun. 2023, 35, 105469. [Google Scholar] [CrossRef]
  17. Albitar, M.; Ali, M.S.M.; Visintin, P.; Drechsler, M. Effect of granulated lead smelter slag on strength of fly ash-based geopolymer concrete. Constr. Build. Mater. 2015, 83, 128–135. [Google Scholar] [CrossRef]
  18. Sadique, M.; Al-Nageim, H.; Atherton, W.; Seton, L.; Dempster, N. Mechano-chemical activation of high-Ca fly ash by cement free blending and gypsum aided grinding. Constr. Build. Mater. 2013, 43, 480–489. [Google Scholar] [CrossRef]
  19. GB/T 1346-2011; Test Methods for Water Requirement of Normal Consistency, Setting Time and Soundness of the Portland cement. Standard Press of China: Beijing, China, 2011.
  20. Wang, F.; Liu, Z.; Han, L.; Xie, F. Preparation and Properties of Activated Coal Gangue Geopolymer. Bull. Chin. Ceram. Soc. 2021, 40, 914–920. [Google Scholar] [CrossRef]
  21. Chindaprasirt, P.; Chareerat, T.; Sirivivatnanon, V. Workability and strength of coarse high calcium fly ash geopolymer. Cem. Concr. Compos. 2007, 29, 224–229. [Google Scholar] [CrossRef]
  22. Temuujin, J.; van Riessen, A.; Williams, R. Influence of calcium compounds on the mechanical properties of fly ash geopolymer pastes. J. Hazard. Mater. 2009, 167, 82–88. [Google Scholar] [CrossRef]
  23. Liu, J.H.; Zhou, M.; Li, K.; Xie, Y.G. Research Progress on Performance Degradation and Corrosion Failure of Cement-based Materials in Carbonate Environment. Mater. Rep. 2023, 37, 92–100. [Google Scholar]
  24. Das, A.K.; Xiao, J. Upcycling waste glass bottles as a binder within engineered cementitious composites (ECCs): Experimental investigation and environmental impact assessment. Clean. Mater. 2025, 16, 100311. [Google Scholar] [CrossRef]
  25. Liao, G.; Wang, D.; Wang, W.; He, Y. Microstructure, strength development mechanism, and CO2 emission analyses of alkali-activated fly ash-slag mortars. J. Clean. Prod. 2024, 442, 141116. [Google Scholar] [CrossRef]
  26. Shen, J.; Xiao, J.; Wen, G.; Xi, Z.; Li, S. Orthogonal test of alkali-activated slag solidified construction spoil, fluidity, compressive strength, water resistance and carbon emission. J. Clean. Prod. 2024, 434, 140201. [Google Scholar] [CrossRef]
  27. Zannerni, G.M.; Fattah, K.P.; Al-Tamimi, A.K. Ambient-cured geopolymer concrete with single alkali activator. Sustain. Mater. Technol. 2020, 23, e00131. [Google Scholar] [CrossRef]
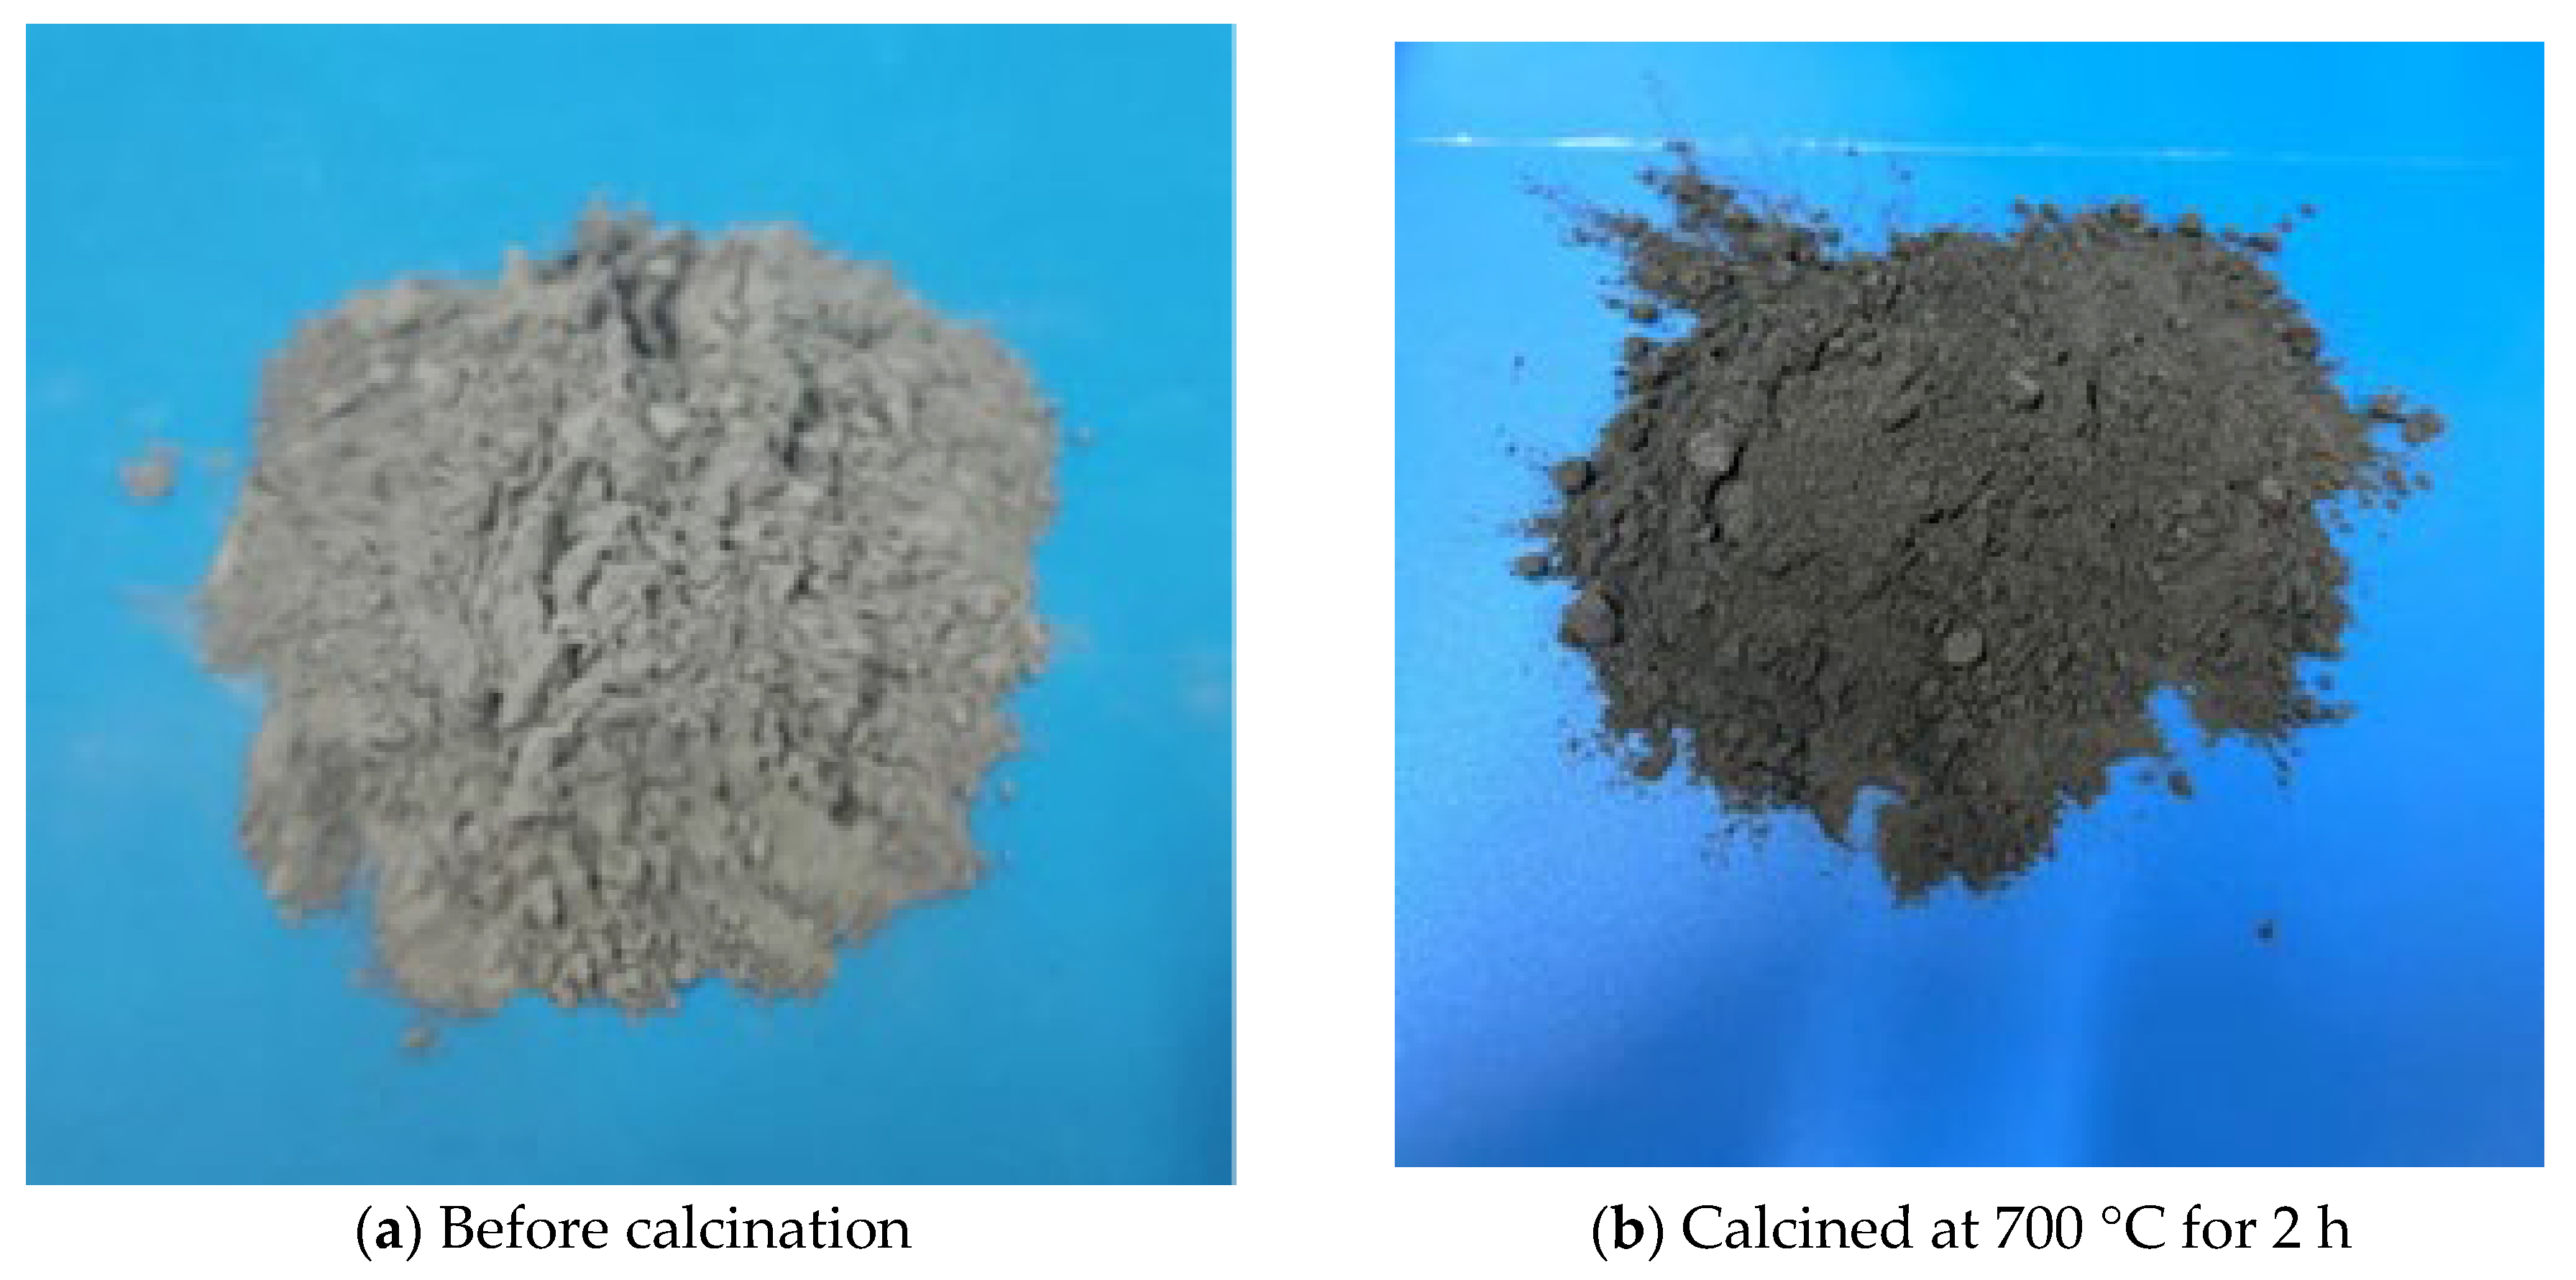
Figure 1. Coal gangue before and after calcination.
Buildings 15 04177 g001
Figure 2. Particle size distribution of coal gangue.
Buildings 15 04177 g002
Figure 3. XRD patterns of coal gangue before and after calcination at 700 °C for 2 h.
Buildings 15 04177 g003
Figure 4. SEM images of coal gangue before and after calcination.
Buildings 15 04177 g004
Figure 5. Appearance of sludge before and after calcination.
Buildings 15 04177 g005
Figure 6. XRD patterns of sludge before and after calcination at 900 °C for 2 h.
Buildings 15 04177 g006
Figure 7. SEM images of sludge before and after calcination.
Buildings 15 04177 g007
Figure 8. Sodium silicate solution.
Buildings 15 04177 g008
Figure 9. Sodium hydroxide (NaOH) particles.
Buildings 15 04177 g009
Figure 10. Flow chart illustrating the preparation process of CSG specimens.
Buildings 15 04177 g010
Figure 11. Compressive strength (CS) of CSG specimens at 3 and 28 days for different mix ratios.
Buildings 15 04177 g011
Figure 12. XRD patterns of L-1 and L-13 geopolymer specimens after 28 days of curing.
Buildings 15 04177 g012
Figure 13. SEM analysis of L-1 and L-13 specimens after 28 days of curing.
Buildings 15 04177 g013
Figure 14. Initial and final setting times of CSG paste for different mix ratios.
Buildings 15 04177 g014
Figure 15. Effect of factor levels on the compressive strength of CSG.
Buildings 15 04177 g015aBuildings 15 04177 g015b
Figure 16. Effect of factor levels on the flexural strength of CSG.
Buildings 15 04177 g016
Figure 17. Effect of different influencing factors on the flexural–compressive ratio of CSG at 3 days.
Buildings 15 04177 g017
Figure 18. Effect of different influencing factors on the flexural–compressive ratio of CSG at 28 days.
Buildings 15 04177 g018
Figure 19. Carbon emissions per unit volume of specimen.
Buildings 15 04177 g019
Table 1. Chemical composition of coal gangue (Wt%).
Chemical CompositionSiO2Al2O3Fe2O3CaOMgOK2ONa2OBurning Vector
Wt%50.828.16.23.71.20.61.27.9
Table 2. Chemical composition of sludge (Wt%).
Chemical CompositionCaOSiO2Al2O3MgOFe2O3SO3K2ONa2O
Wt%41.9532.6413.243.73.631.741.240.52
Table 3. L16(45) Orthogonal experimental design factors and levels for CSG.
FactorCoal Gangue/Sludge
A
Water–Binder Ratio
B
n (Na)/n (Al)
C
Activator Modulus
D
Vacant Column
Level
110:00.300.520.91
29:10.330.561.01
38:20.360.601.11
47:30.390.641.21
Table 4. Detailed mix proportions of the CSG specimens.
NumberingCoal Gangue/gSludge/gNaOH/gWater Glass/gWater/g
L-11400-147459.3420
L-21400-149.6640.1462
L-31400-155.8770.1504
L-41400-160.8912.8546
L-51260140143.8710.6420
L-61260140116.2659.3462
L-71260140151.3556.2504
L-81260140161.3690546
L-91120280137.7781.6420
L-101120280155766462
L-111120280115.3493.2504
L-121120280130.8480.9546
L-13980420140599.1420
L-14980420142.1522.3462
L-15980420116.2659.2504
L-16980420131.7651.1546
Table 5. Range analysis of compressive strength of geopolymer.
Test Number3 d28 d
ABCDABCD
Coal Gangue/SludgeWater–Binder Ration(Na)/n(Al)Activator ModulusCoal Gangue/SludgeWater–Binder Ration(Na)/n(Al)Activator Modulus
K113.1922.4514.3316.8118.8124.6220.7017.86
K212.2321.0413.2217.9725.6023.1222.7626.29
K317.9713.5218.5716.5119.2323.6321.7724.43
K423.469.8420.7315.5524.1616.4322.5619.22
Ri11.2212.617.512.426.808.192.068.43
Primary and secondary order of factorsB > A > C > DD > B > A > C
The optimum levelA4B1C4D2A2B1C2D2
Optimal combinationA4B1C4D2A2B1C2D2
Table 6. Analysis of variance of geopolymer compressive strength.
Influencing FactorsStandards of Significance3 d28 d
Degrees of Freedom Between GroupsWithin-Group Degrees of FreedomMean Square Between GroupsMean Square Within GroupFpSignificanceDegrees of Freedom Between GroupsWithin-Group Degrees of FreedomMean Square Between GroupsMean Square Within GroupFpSignificance
A(Coal gangue/sludge)F0.1(3, 28) = 2.9467328178.8752.383.41510.039**328195.2650.243.88630.025**
B(water–binder ratio)F0.05(3, 28) = 2.291328263.0543.366.06710.004***328177.1253.333.32120.043**
C(Sodium-to- aluminum ratio)F0.01(3, 28) = 4.56832880.6862.901.28270.292-32810.6167.850.15640.928-
D(activator modulus) 32819.9069.410.28680.828-328201.6750.573.98810.025**
Note: *** and ** denote significance at the 0.01 and 0.05 levels, respectively; ‘-‘ indicates no significance.
Table 7. Range analysis of flexural strength for CSG.
Test Number3d28d
ABCDABCD
Coal Gangue/SludgeWater–Binder Ration(Na)/n(Al)Activator ModulusCoal Gangue/SludgeWater–Binder Ration(Na)/n(Al)Activator Modulus
K12.684.552.832.724.155.373.343.56
K22.113.392.844.113.623.135.504.95
K33.142.263.112.974.805.034.155.30
K44.412.153.572.554.393.413.963.13
Ri2.312.400.741.561.182.252.172.18
Primary and secondary order of factorsB > A > D > CB > D > C > A
The optimum levelA4B1C4D2A3B1C2D3
Optimal combinationA4B1C4D2A3B1C2D3
Table 8. Analysis of variance of geopolymer flexural strength.
Influencing FactorsStandards of Significance3 d28 d
Degrees of Freedom Between GroupsWithin-Group Degrees of FreedomMean Square Between GroupsMean Square Within GroupFpSignificanceDegrees of Freedom Between GroupsWithin-Group Degrees of FreedomMean Square Between GroupsMean Square Within GroupFpSignificance
A(Coal gangue/sludge)F0.1(3, 28) = 2.94673286.711.604.20060.016***3280.701.740.40370.75-
B(water–binder ratio)F0.05(3, 28) = 2.2913289.441.376.88510.001***3286.131.175.24090.006***
C(sodium-to-aluminum ratio)F0.01(3, 28) = 4.5683281.382.230.61860.606-3283.751.432.63260.070*
D(activator modulus) 3283.312.031.63060.203-3284.791.313.64570.030**
Note: ***, **, and * denote significance at the 0.01, 0.05, and 0.1 levels, respectively; ‘-‘ indicates no significance.
Table 10. Comparison of carbon emissions and strength-to-emission ratio (SER) between L-13 geopolymer and cement paste.
Material Type3-day CS (MPa)28-day CS (MPa)Carbon Emission (kg CO2-e/m3)SER (MPa/(kg CO2-e/m3))
L-13 geopolymer34.531.92800.123
Cement paste (Reference)-30.0 *11020.027
Note: SER = strength-to-emission ratio; * typical 28-day strength assumed for cement paste.
Disclaimer/Publisher’s Note: The statements, opinions and data contained in all publications are solely those of the individual author(s) and contributor(s) and not of MDPI and/or the editor(s). MDPI and/or the editor(s) disclaim responsibility for any injury to people or property resulting from any ideas, methods, instructions or products referred to in the content.