Article

Design and Validation of an Integrated CAD-to-5D BIM Process for Underground Utilities

1
Department of Computer Science and Engineering, Korea University of Technology and Education, Cheonan 31253, Republic of Korea
2
Department of Artificial Intelligence, Dongyang Mirae University, Seoul 08221, Republic of Korea
*
Author to whom correspondence should be addressed.
Buildings 2025, 15(22), 4139; https://doi.org/10.3390/buildings15224139
Submission received: 4 October 2025 / Revised: 5 November 2025 / Accepted: 14 November 2025 / Published: 17 November 2025
(This article belongs to the Special Issue BIM Methodology and Tools Development/Implementation)

Abstract

Underground utility projects still rely on 2D drawings, which fragments geometry, process, and cost information and raises the barrier to BIM adoption. There is a need for a practical method that preserves existing CAD workflows while achieving integrated, higher-dimensional management. This study proposes a unified framework that converts 2D CAD into 3D BIM and automatically combines work and cost information to produce 5D outputs in a single, interoperable model. The approach aims to maintain data continuity from design to construction, reduce manual modeling effort, and lower adoption costs. A prototype system and viewer were developed to validate the end-to-end flow and to confirm that geometry, schedule, and cost can be reviewed together. The framework offers a feasible path for digital transformation in underground utilities and can be extended toward 6D and 7D for performance and operations management.

1. Introduction

Urban infrastructure includes transportation, energy, water resources, communication, social services, and disaster prevention systems. These interconnected components play a vital role in maintaining urban functionality and improving the quality of life for citizens [1,2,3].
In recent years, rapid urbanization, climate change, and technological advancement have increased the complexity of infrastructure systems. As a result, efficient and systematic infrastructure management has become essential for achieving sustainable development and social inclusiveness.
The advancement of information and communication technology (ICT) has brought fundamental changes to infrastructure management. The Internet of Things (IoT) enables continuous monitoring of infrastructure conditions through real-time sensor data, while artificial intelligence (AI) provides predictive and optimization models based on accumulated data to enhance operational efficiency.
Digital twin technology also strengthens the resilience of urban infrastructure by allowing predictive maintenance and disaster simulations through virtual modeling [4]. These technologies together improve both productivity and safety in urban systems and accelerate the transition toward smart infrastructure. However, several challenges remain in achieving efficient infrastructure management.
First, high initial investment costs often delay modernization in small cities and developing countries. Second, ICT-based infrastructure operation requires processing large volumes of data, which raises concerns about data security and privacy. Third, the lack of standardized data structures and interdepartmental collaboration limits integrated management. Finally, insufficient digital literacy among citizens reduces acceptance and utilization of new technologies.
Among various infrastructure sectors, underground utilities have been expanding rapidly due to urbanization, replacement of aging assets, and the adoption of smart technologies.
According to a 2023 report by MarketsandMarkets, the global water and wastewater management market is expected to grow at a compound annual growth rate (CAGR) of 7.3 percent through 2030 [5]. Similarly, the global utility infrastructure market, including electric and communication conduits, is projected to reach approximately 150 billion USD by 2027 [6]. Key growth drivers include increasing urban population density [7], the replacement of infrastructure built in the 1960s and 1970s [8], and government-led initiatives for integrated safety and management systems [9].
Underground utilities such as water, sewage, gas, electricity, and communication networks form the backbone of urban functionality. Accurate integration of location, geometry, and attribute data is essential for ensuring safety and sustainability.
To address this need, technologies that integrate Building Information Modeling (BIM) and Geographic Information Systems (GIS) have been actively studied [10,11,12]. Singapore’s Digital Underground project established a three-dimensional geospatial database for underground facilities [13]. In Europe and North America, the adoption of open formats such as Industry Foundation Classes (IFC) and CityGML has increased [14]. In Finland, the government introduced the InfraBIM standard and mandated its use in public infrastructure projects, promoting a more integrated management system for underground spaces.
Recent studies have also expanded the application of BIM to infrastructure inspection and maintenance. For example, Xia et al. proposed a complete-coverage path-planning method for surface inspection of cable-stayed bridge towers using climbing robots based on BIM data, demonstrating the potential of BIM for intelligent operation and safety monitoring [15].
Despite these developments, research on BIM automation based on 2D drawings remains in its early stages. Previous studies have attempted to convert BIM data into GIS formats [16] or integrate AI technologies to automate workflows [17].
In parallel, Ning et al. developed a dynamic clustering framework for 3D CAD models using an inertial feature encoder, enabling efficient and automated classification of complex geometric data [18]. Such approaches highlight the growing role of AI-driven model understanding and data management in the digital construction domain.
However, these approaches still face technical limitations such as the loss of temporal information, reduced geometric accuracy, and inconsistencies in attribute data. On the other hand, BIM supports data integration throughout the entire project lifecycle, improving productivity and safety through clash detection and simulation [19,20,21].
To overcome these limitations, this study proposes an integrated workflow that extracts spatial and attribute information from standardized 2D CAD drawings, converts it into three-dimensional GeoJSON (Geographic JavaScript Object Notation) data [22], and automatically generates BIM objects in IFC (Industry Foundation Classes) format.
In addition, process (WBS) and cost (CBS) data are defined in JavaScript Object Notation (JSON) format and integrated into the BIM model to achieve automated 5D BIM generation. This workflow allows designers to continue working in the conventional 2D CAD environment without using expensive 3D modeling software, while ensuring seamless integration of geometry, schedule, and cost information without data loss. The accuracy of the GeoJSON conversion process was verified through official software testing conducted by the Korea Testing and Research Institute (KTR) [23].
The proposed framework enables the digital transformation of underground utility management across the design, construction, and maintenance phases.
It provides a reliable technological foundation for BIM–GIS integrated smart infrastructure management and supports the broader transition toward data-driven construction environments.

2. Materials and Methods

2.1. Integrated Process for Automated BIM Generation Based on Standardized 2D CAD Drawing

In this study, an integrated process is proposed that extracts location, geometry, and attribute information from standardized underground utility 2D CAD drawings, refines them into three-dimensional spatial data, and subsequently converts them into 3D spatial data in the GeoJSON format. The processed data are then automatically transformed into BIM library data compliant with the IFC format. Furthermore, construction process information of underground utilities is structured in a JSON schema and integrated into the BIM library models, enabling the automatic generation of BIM deliverables according to utility types.
The proposed system allows design engineers to maintain their conventional 2D drawing-based workflows while efficiently generating and utilizing BIM data without the need for dedicated 3D modeling software. This approach facilitates digital transformation and promotes design automation in the field of underground utilities.

2.2. Input Data and Predefined Resource

2.2.1. Standardized 2D CAD Drawings

The CAD drawings used as input data were provided in DXF format, and underground utility information was systematically organized through an attribute-based hierarchical layer structure. Pipelines were represented as 3D Polyline CAD entities, while facilities were represented as Text CAD entities. This standardized input structure enables automated information extraction. By combining the attribute information contained in each layer with the geometric and symbolic information embedded in CAD entities, spatial and functional data of underground utilities can be effectively identified and classified.

2.2.2. GeoJSON Spatial Data Structure

To transform underground utility object information extracted from 2D CAD drawings into structured three-dimensional spatial data, the GeoJSON format was adopted. GeoJSON is a lightweight spatial data format based on JSON, where each dataset is organized as a FeatureCollection. Each Feature consists of a geometry attribute that defines spatial shape and a properties attribute that contains associated attribute information. The geometry element represents spatial forms such as Point and LineString through coordinate arrays, while the properties element stores diverse facility attributes in key-value pairs.
Underground utility objects are mapped to appropriate geometry types according to their characteristics. For instance, pipelines are represented as LineString geometries, whereas point-based facilities such as manholes and valves are represented as Point geometries. Each geometry contains three-dimensional positional data (X, Y, Z coordinates), and properties include attributes such as kind of utility, common_type, specific_type, diameter, material, depth, azimuth, material specifications, and connectivity. These attributes serve as essential data in subsequent BIM conversion and maintenance management processes.
In addition, the GeoJSON structure was extended to express topological and connectivity relationships among objects through the definition of reference values and connection attributes. Each object is identified by unique coordinates and includes attributes such as object_key, start_point_connected_pipe, and end_point_connected_pipe, which represent pipeline connectivity, branch locations, and other relationships that ensure construction relevance and data extensibility.

2.2.3. Roles of WBS and CBS in BIM-Based Project Management

In BIM-based project management, the Work Breakdown Structure (WBS) and Cost Breakdown Structure (CBS) are essential tools for systematically managing project scope and cost. WBS is a hierarchical structure that progressively decomposes the entire scope of a project into manageable work packages, focusing on defining “what must be accomplished.” This provides clarity regarding deliverables and activities and allows for systematic scheduling and resource allocation. In contrast, CBS is a hierarchical framework that decomposes project costs into detailed elements, focusing on “how much cost is required.” CBS categorizes cost items such as labor, materials, and equipment, and it is applied to budget estimation and cost control.
WBS and CBS are complementary and interconnected structures. Work packages defined in WBS are linked to CBS, enabling cost estimation and control for each task. Together, they provide an integrated framework for managing both project scope and cost, thereby supporting efficient and transparent project execution. Table 1 presents a comparative summary of WBS and CBS.
In this study, a JSON-based template was designed to implement the WBS and CBS management framework. The template enables the standardized definition of project work structures and cost structures, allowing WBS and CBS data to be systematically processed and utilized. Furthermore, a process was developed to automatically generate final deliverables from the JSON template files, thereby streamlining repetitive and labor-intensive management tasks through automation. In particular, the JSON data can be modified and applied to each underground utility construction project according to its specific characteristics, providing flexibility to accommodate diverse site conditions and project requirements.

2.3. Steps of Integrated BIM Generation Process

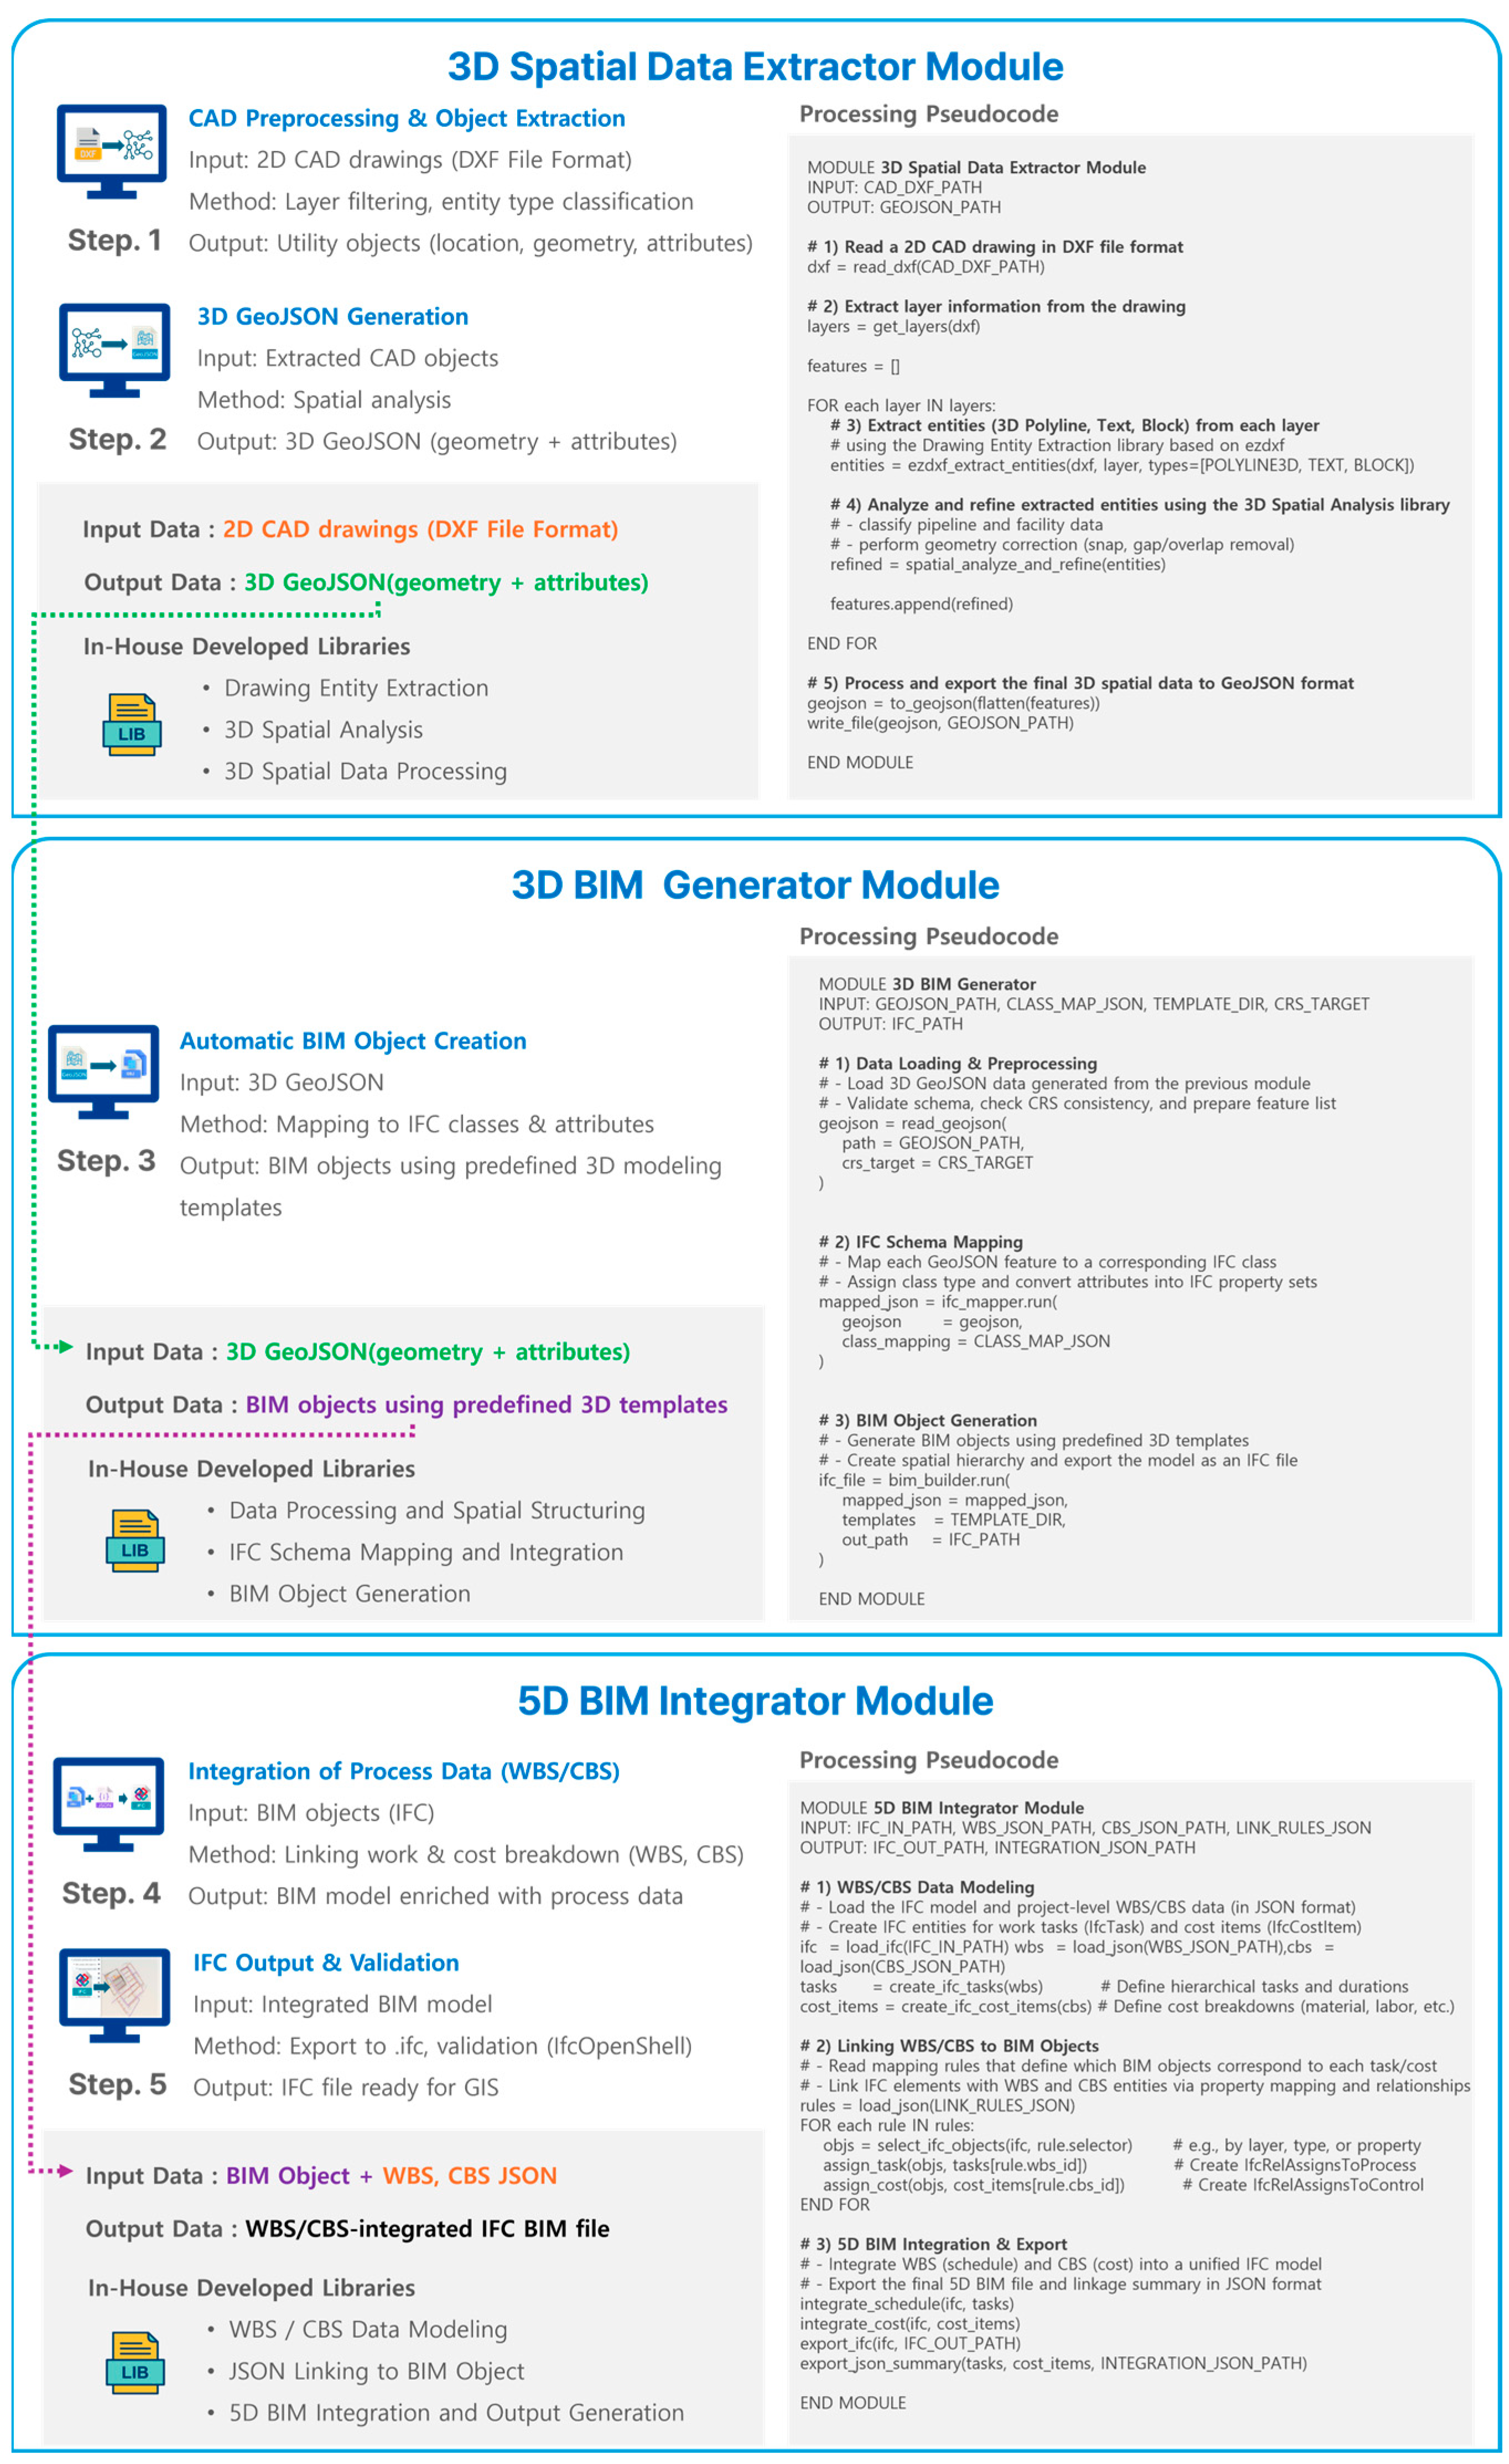
Figure 1 illustrates the overall processing workflow of the proposed system, which consists of five sequential stages.
In the first stage (CAD preprocessing and object extraction), the CAD drawings are analyzed to automatically extract the location, geometry, and attribute information of underground utility objects. This process is performed through layer-based filtering and classification of CAD entity types.
The second stage (3D GeoJSON generation) processes the extracted utility data through spatial analysis to generate 3D spatial data. The resulting GeoJSON file contains both geometric and attribute information and serves as the input for the subsequent BIM mapping stage.
The third stage (automatic BIM object creation) maps the generated GeoJSON data to corresponding IFC classes and attributes to automatically create BIM objects. Each object is generated by applying predefined 3D modeling templates stored in the BIM library and is converted into an IFC-based model.
In the fourth stage (process data integration), the generated IFC objects are linked with work (WBS) and cost (CBS) breakdown data to incorporate construction process information into the BIM model.
Finally, the fifth stage (IFC output and validation) exports the completed BIM model in IFC format and verifies it using open-source viewers such as IfcOpenShell and BIMvision.
The resulting files can be integrated with GIS platforms or digital twin systems, significantly enhancing the interoperability and practical usability of underground utility management. The proposed workflow does not involve coordinate system transformation, and all geometric calculations are performed through spatial analysis within the original CAD coordinate domain.
As a result, no geometric tolerance or distortion occurs, since the process does not generate any new pipeline geometry beyond what exists in the original data. Therefore, the proposed CAD-to-5D BIM conversion process preserves the original geometry and attributes with complete accuracy.

3. Limitations of Underground Utility Management and ICT-Based Countermeasures

3.1. Challenges in Underground Utility Management Systems

Various countries have introduced advanced technologies and systems to ensure the efficient and safe management of underground utility infrastructure. However, several structural, technical, and institutional limitations remain.
First, the accuracy of digital transformation is often reduced due to poor data quality and a lack of standardization. Historical data stored in paper drawings, PDF, or CAD formats are unstructured and incomplete. Furthermore, there is no globally standardized format for underground utilities, which causes low interoperability and data inconsistency among countries and institutions [11,24].
Second, information fragmentation between organizations and security constraints restrict data sharing and collaboration. Insufficient legal and institutional frameworks hinder effective inter-agency cooperation, limiting responsiveness in urban planning and disaster management [24].
Third, the immaturity of 3D model automation and the technical complexity of BIM–GIS integration make it difficult to utilize digital data effectively. In addition, delays in adopting real-time monitoring technologies hinder the transition toward fully smart infrastructure.
Fourth, many current systems suffer from outdated or inconsistent facility information. Newly installed, decommissioned, or maintained assets are often not updated in the system, leading to discrepancies between actual and digital data. Moreover, insufficient maintenance budgets and lack of dedicated personnel reduce the frequency of system updates and verification, further degrading reliability [11,24].
Fifth, there is a shortage of professionals capable of integrating BIM, GIS, IoT, and AI technologies. Gaps between field operations and system management lead to delays in feedback and updates, reducing both the accuracy and usability of information [25].
Sixth, the introduction of smart infrastructure systems faces financial and policy constraints. High implementation costs for 3D scanning, sensing, and data integration make adoption difficult for small cities or organizations. Frequent policy changes and administrative restructuring also disrupt continuity in system development [11,25].

3.2. Applications of Smart Technologies for Efficient Underground Utility Management

To overcome these challenges, many countries have been applying ICT-based smart technologies to underground utility management.
First, GNSS (Global Navigation Satellite System) and LiDAR (Light Detection and Ranging) technologies are increasingly used to acquire precise location, geometry, and attribute data, while AI-based recognition algorithms are being developed to extract object information automatically from PDF or CAD drawings [26,27]. These technologies significantly improve data quality and reduce manual workload.
Second, efforts are underway to build integrated BIM–GIS platforms that combine the geometric precision of BIM with the spatial analysis capabilities of GIS. Such platforms utilize international open standards such as IFC, CityGML, and LandInfra to enhance data exchange and interoperability. Representative cases include Finland’s InfraBIM initiative and Germany’s IFC-Alignment project [28]. Similarly, the UNUM (Unification for Underground Resilience Measure) project in New York integrates and publishes underground utility data such as water, power, and communication networks through an API-based cloud platform adopting the OGC MUDDI (Model for Underground Data Definition and Integration) standard, thereby strengthening urban resilience [29].
Third, IoT-based real-time monitoring systems are being actively implemented. Sensors installed on underground pipelines collect data on leakage, settlement, vibration, and temperature, which enables AI-based predictive maintenance. Recent studies have demonstrated long-term reliability of battery-free, energy-harvesting IoT sensors for underground applications [8]. Hybrid models using acoustic emission (AE) signals with CNN–LSTM architectures have also been proposed for leak detection in smart pipeline systems, supporting cost-efficient maintenance scheduling [30].
Fourth, digital twin technology is being used to create 3D virtual models that replicate real underground utilities for visualization, simulation, risk prediction, and maintenance planning. Web-based 3D viewers and AR (Augmented Reality) collaboration environments allow designers, field engineers, and managers to access and update data in real time. Representative solutions include Trimble SiteVision [31] and Bentley OpenCities Planner [32], both of which enhance the precision and safety of underground operations.

3.3. Strategies for Underground Utility Management Using the Proposed Technology

The automated BIM generation technology proposed in this study provides a practical alternative to address the structural and technical limitations identified above. The framework automatically converts 2D CAD drawings into GeoJSON- and IFC-based 3D BIM data through an integrated processing pipeline.
First, it addresses the problem of data quality and standardization. By extracting object information and attributes automatically from standardized CAD templates and converting them into GeoJSON structures, the system ensures data consistency. As both GeoJSON and IFC are open international formats, interoperability among different organizations and countries is greatly improved.
Second, it resolves the issue of fragmented information and inefficient collaboration. The generated BIM data links with WBS and CBS information within the IFC schema, enabling real-time information sharing and collaboration across departments for urban planning, maintenance, and disaster response.
Third, it enhances 3D model automation and BIM–GIS interoperability. The process automatically generates 3D models with Z-values from 2D CAD drawings and converts them into GeoJSON and IFC formats, allowing direct use within GIS platforms. This effectively strengthens interoperability between BIM and GIS environments.
Fourth, it improves data currency and maintenance efficiency.
When updated CAD drawings reflecting new installations, modifications, or repairs are input, the corresponding BIM data are regenerated automatically, maintaining consistency and reliability of facility information.
Fifth, it alleviates the shortage of skilled personnel and the high cost of BIM adoption. By using open-source libraries such as GeoPandas and IfcOpenShell, the system eliminates the need for expensive 3D modeling software. Non-experts can automatically generate BIM files from 2D drawings, making this a viable solution for small cities or organizations with limited budgets.
In summary, the proposed 2D-based automated BIM generation framework offers a realistic and scalable process that directly addresses the existing limitations in underground utility management.
Table 2 summarizes how the proposed technology responds to each of the identified issues and demonstrates its applicability as a key enabling technology for digital transformation and smart infrastructure implementation.

4. Summary of Existing Research and Linkage to the Proposed Method

4.1. Background and Overview of Existing Research

Recent studies have emphasized the importance of constructing high-precision spatial data to support the digital transformation of urban infrastructure. In particular, in the field of underground utilities, accurate three-dimensional (3D) spatial information within design data is essential across all stages of design, construction, and maintenance.
However, most underground utility designs still rely on two-dimensional (2D) CAD drawings, where positional, geometric, and depth information of facilities are often separated or omitted, leading to degradation of data quality. In addition, fragmented data management across different organizations hinders the identification of spatial conflicts during construction and prevents timely updates after field modifications, resulting in inaccurate data for maintenance operations.
To address these limitations, previous research [23] proposed a standardized 2D CAD-based processing framework that automatically extracts the position (X, Y, Z), geometry, and attribute information of underground utilities and converts them into 3D structured spatial data through spatial analysis.
That study integrated various types of drawings, such as plan views, profile views, and detailed cross-sections, into a single object-based data structure compatible with the GeoJSON format. Specifically, it established drawing rules for CAD entities and layer naming conventions, as well as block- and text-based attribute extraction methods, enabling automated generation of standardized 3D spatial data.
The final outcome of the previous research was a GeoJSON-formatted 3D spatial dataset, which enabled the conversion of conventional 2D CAD drawings into interoperable data structures suitable for integration across different systems. Building upon this technical foundation, the present study extends the approach by developing an automated BIM generation process that converts GeoJSON data into IFC-based BIM objects.

4.2. Structure and Data Composition of Standardized 2D Drawings

Underground utility design drawings generally consist of a plan view, profile view, and detailed section view, each providing complementary spatial information.
The plan view represents the horizontal alignment and connections of pipelines, the profile view illustrates depth (Z-coordinate) and elevation differences, and the detailed section presents specifications such as diameter and material. Because these drawings are managed independently, it is difficult to integrate and interpret the full 3D spatial relationships of underground facilities.
The previous study proposed a standardized drawing structure that embeds Z-values into 3D polylines within the plan view, enabling vertical positioning without requiring a separate profile drawing. In addition, a layer naming convention was defined to include key attribute information such as object type, sub-type, diameter, material, and height.
This information is automatically parsed and converted into structured attributes during data extraction, ensuring consistency regardless of individual drafting practices.
This standardized structure provides a technical foundation for mechanically extracting 3D spatial and attribute data from CAD drawings. It serves as a prerequisite for automated conversion into GeoJSON and BIM formats and plays a crucial role in transforming 2D design drawings into structured digital assets.

4.3. Procedure for Generating 3D Spatial Data Based on the GeoJSON Format

To construct 3D digital models of underground utilities, precise extraction and structuring of positional, geometric, and attribute information from CAD drawings are required.
The previous study adopted GeoJSON, an open format proposed by the IETF, which represents spatial objects through two main components: geometry and properties. The geometry component defines spatial coordinates as points, lines, or polygons, while the properties component stores semantic information in key-value pairs. This lightweight structure is highly compatible with GIS software and web-based visualization tools.
The generation process can be summarized as follows.
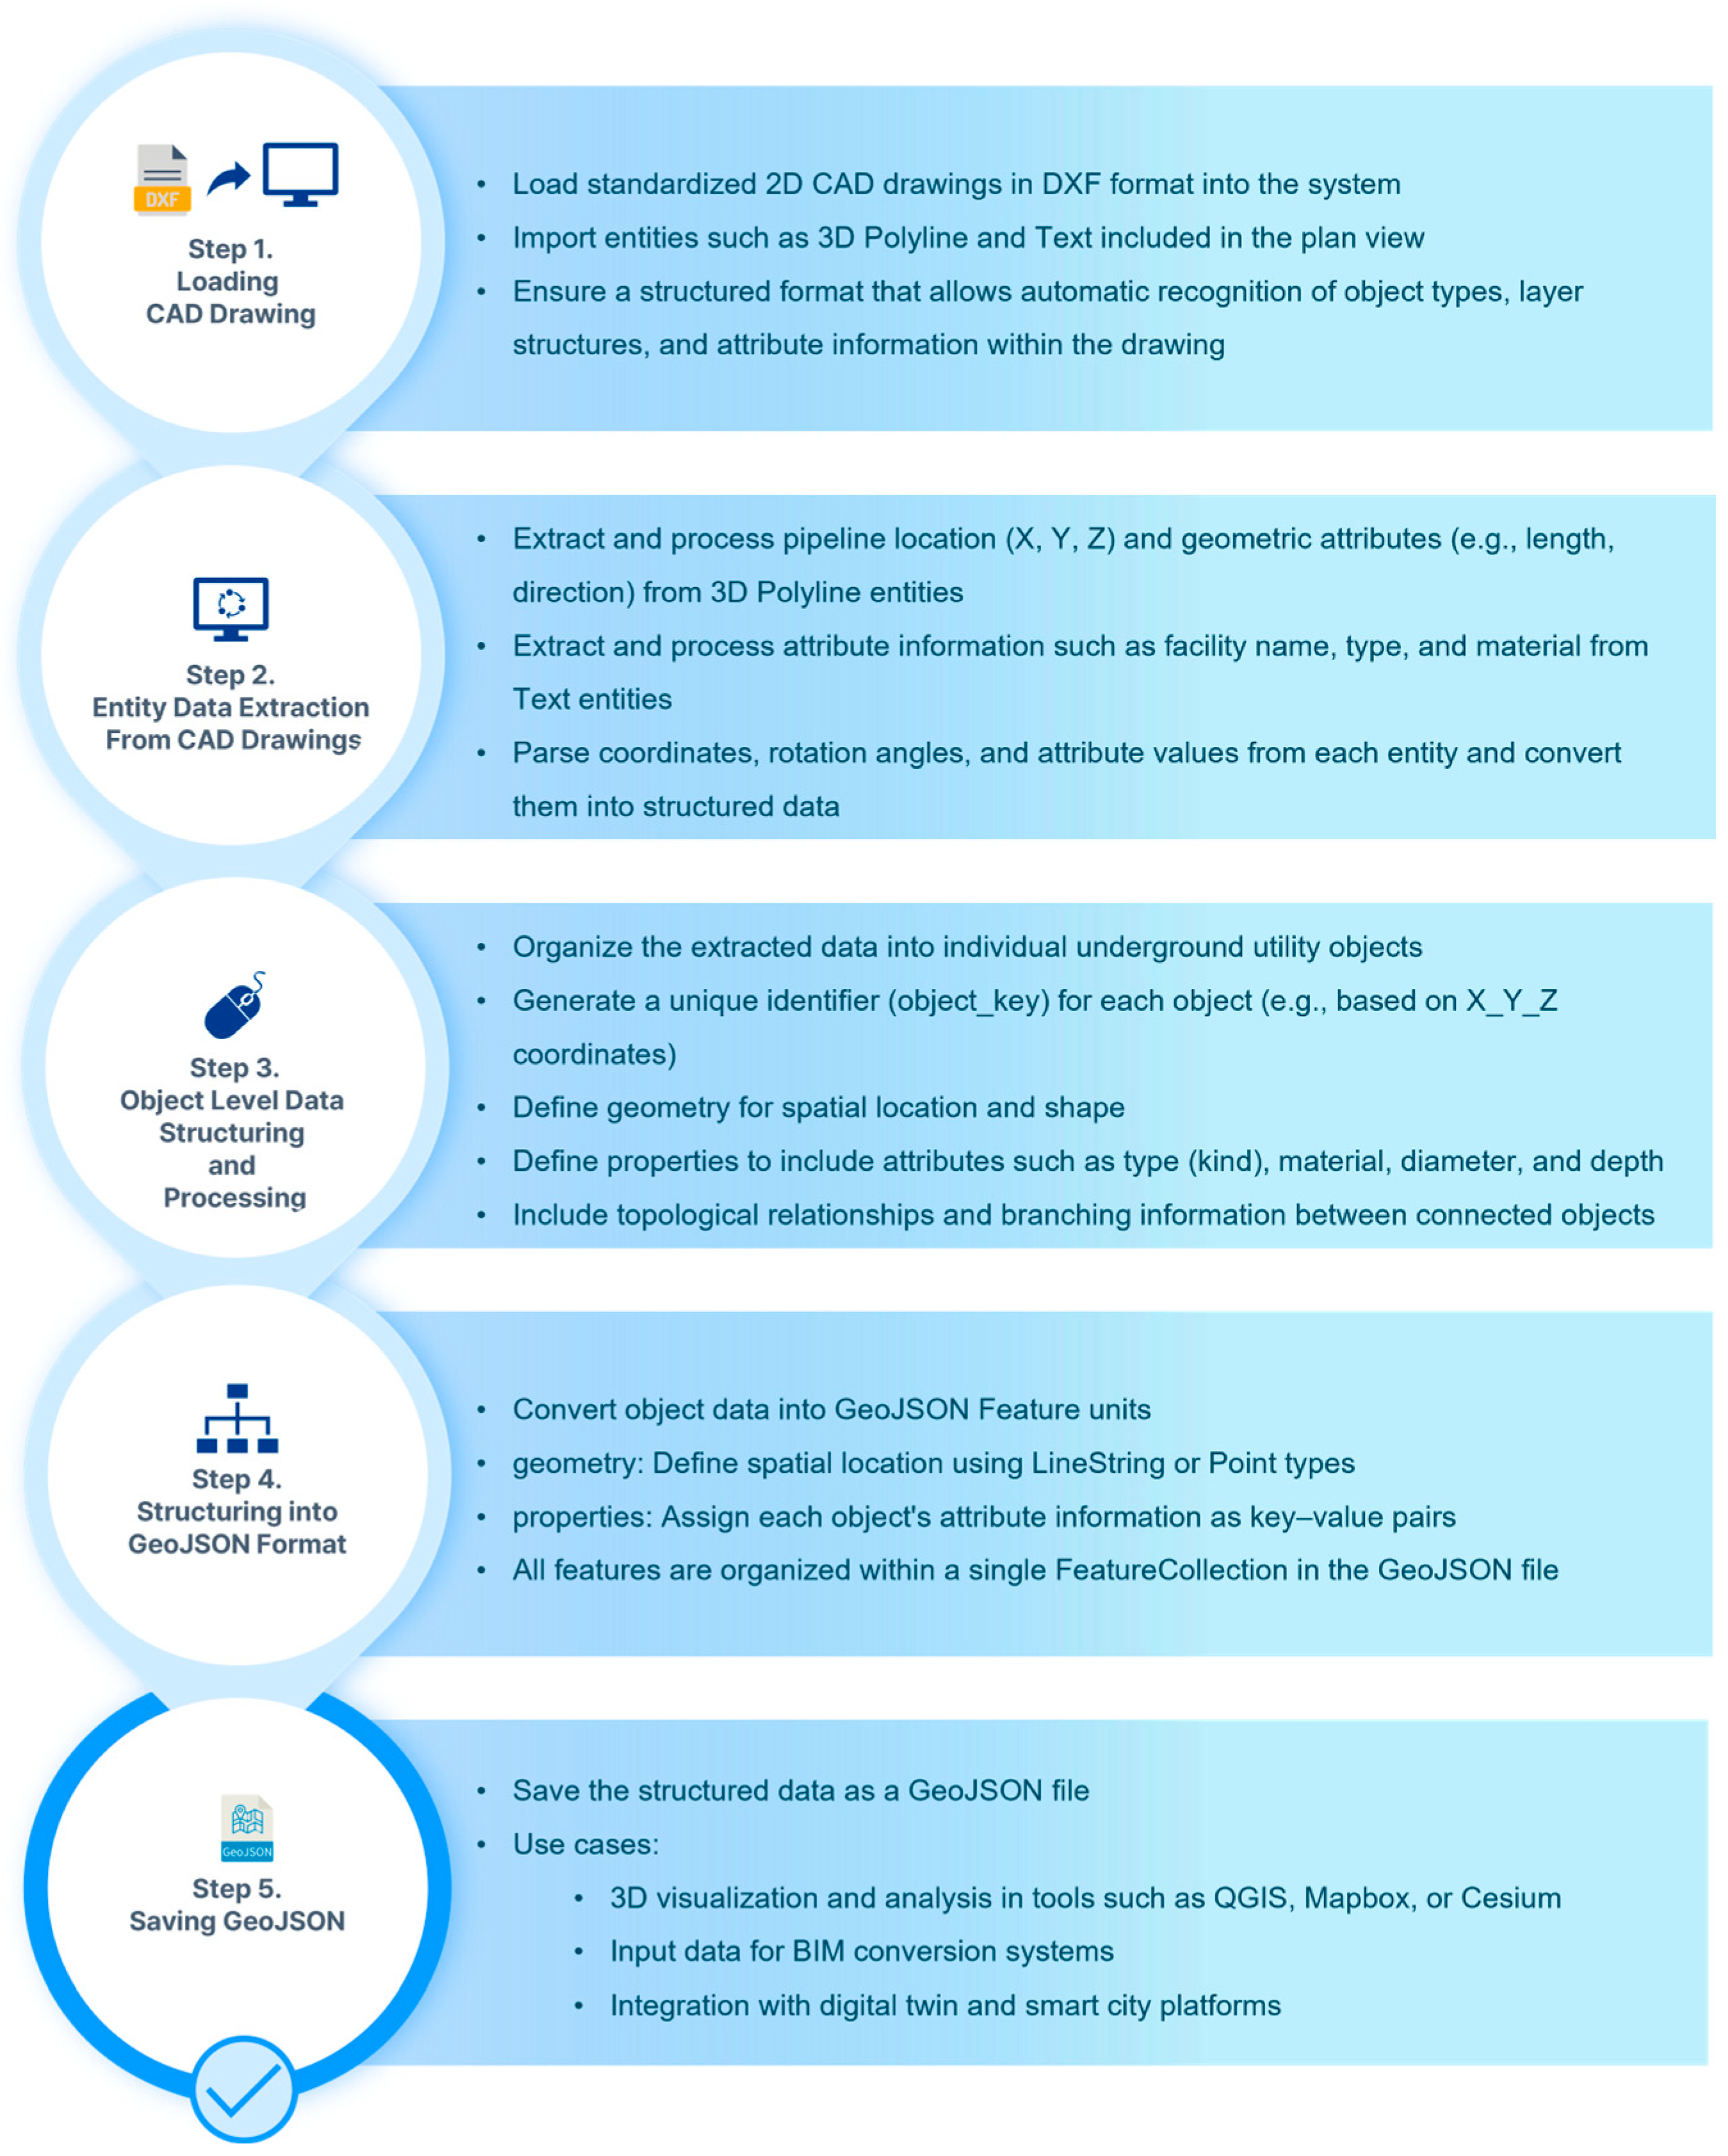
First, CAD entities such as 3D polylines and text annotations are analyzed to extract corresponding object information.
Second, linear entities are converted into 3D coordinates with Z-values to represent pipeline routes.
Third, point entities define the positions of facilities, and their attributes are derived from text annotations that describe the type or specification.
Finally, the extracted information is organized as a GeoJSON FeatureCollection, where each feature includes identifiers, geometry, and attributes such as pipe type, material, diameter, installation year, and connection data.
Figure 2 illustrates the complete workflow from CAD drawing input to the generation of the final GeoJSON dataset. Through this automated process, complex CAD data can be systematically transformed into structured and interoperable 3D spatial datasets.
This approach significantly simplifies manual interpretation and provides a solid foundation for subsequent BIM generation and digital twin applications.

4.4. Accuracy Assessment and Technical Significance

For the proposed CAD-based spatial data conversion framework to be reliable in practice, accuracy and consistency must be verified. The previous study conducted quantitative validation using actual underground utility drawings to assess how accurately positional, geometric, and attribute data were reproduced during automatic processing.
The test dataset included real urban utility drawings covering seven facility types (water, sewage, power, communication, etc.), and object information was extracted from DXF drawings and converted into 3D GeoJSON format. The validation showed 100% consistency between the geometric and attribute data of the original CAD drawings and the automatically generated GeoJSON outputs. Spatial overlay analysis using QGIS and Google Maps confirmed perfect alignment without any data loss or distortion.
These results demonstrate that the proposed method can reliably convert 2D CAD drawings into structured 3D spatial datasets in a standardized and repeatable manner. Furthermore, the defined drawing rules and extraction algorithms were proven to work robustly under real-world design conditions, minimizing potential human errors and improving both accuracy and productivity.
This technical foundation was extended in the present study to include GeoJSON-to-IFC conversion and WBS/CBS integration for 5D BIM generation, quantitatively verified through experiments presented in Section 6.4.3.
The results confirm that the proposed framework advances previous 3D data conversion research into a fully integrated BIM automation process.

5. GeoJSON-Based IFC Conversion Technology for Underground Utilities

5.1. Limitations of the GeoJSON Format and the Need for IFC Conversion

This study proposes a GeoJSON-to-IFC conversion technology that automatically transforms three-dimensional spatial data, extracted from standardized drawings and structured in the GeoJSON format, into IFC files compliant with the open BIM standard.
The GeoJSON format has the advantage of intuitively representing attribute and spatial information and, due to its lightweight structure, provides excellent compatibility with various GIS systems and web-based visualization tools. However, GeoJSON also has inherent limitations. As a coordinate-based format, it lacks visual intuitiveness for three-dimensional shapes and cannot fully represent complex structural details. In particular, real underground utilities are three-dimensional in nature and encompass geometry, attributes, location, and process-related information. Nevertheless, GeoJSON is typically limited to Point and LineString geometries, which makes it difficult to reproduce utility structures in a spatially complete manner.
To overcome these limitations, an automated conversion method was applied to transform GeoJSON-based three-dimensional spatial data into the IFC format. IFC is an open standard capable of representing construction and infrastructure objects as three-dimensional entities. It integrates geometry, attributes, lifecycle data, and process information into a unified structure. In the GeoJSON dataset, pipelines are represented by LineString geometries and facilities by Point geometries, while detailed object attributes are stored in the properties field.
The converted IFC files allow three-dimensional geometry-based visualization, enabling users to intuitively examine objects and query attribute information through IFC viewers in a manner similar to interpreting 2D CAD drawings. This transformation eliminates issues of inconsistency and redundancy that arise in conventional 2D drawings and establishes a unified representation of 3D object-based information. As a result, the proposed approach enhances efficiency and accuracy across the entire project lifecycle, including drawing preparation, design review, construction planning, and maintenance.

5.2. Mapping of Underground Utilities Structures Based on IFC Spatial and Placement Structure

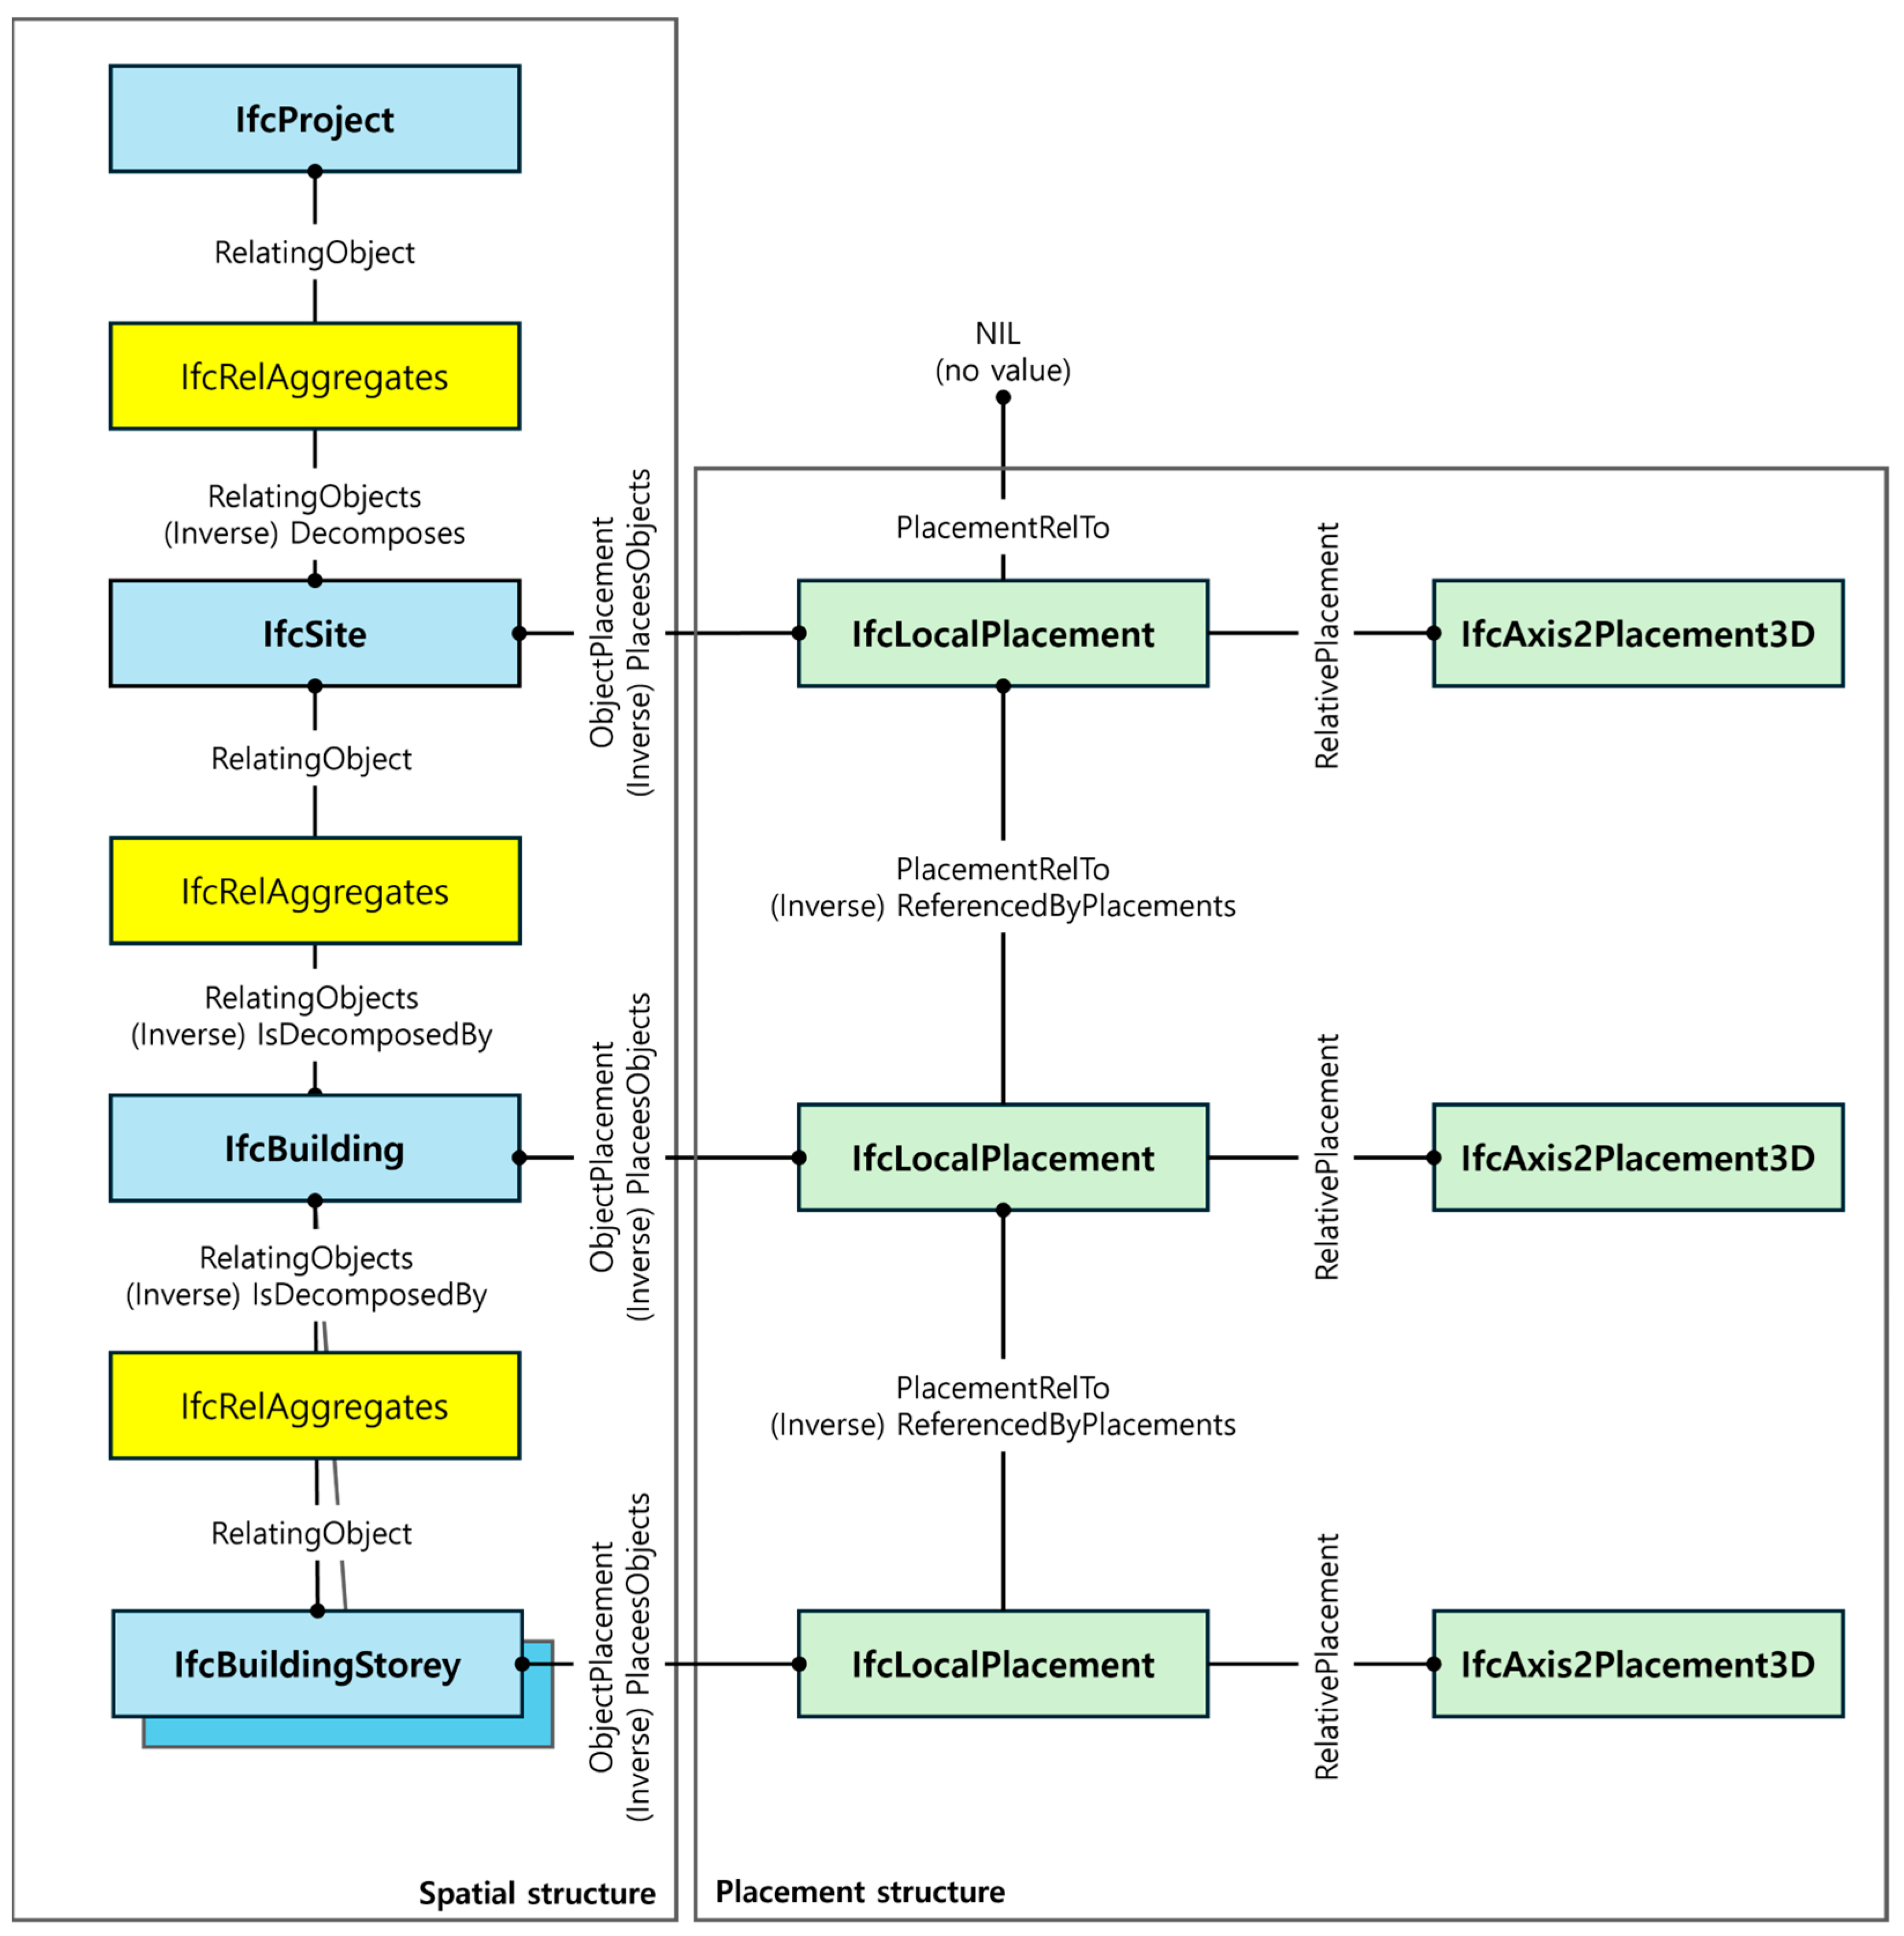
The IFC file format employs two primary hierarchical structures, the spatial structure and the placement structure, to systematically organize information [33]. The spatial structure is responsible for the logical classification and organization of data, while the placement structure defines the position and orientation of each object within the IFC 3D model. These two structures are independent concepts: the spatial structure describes the logical grouping of objects and the space to which an object belongs, whereas the placement structure specifies how and where the object is located within the three-dimensional coordinate system. Figure 3 illustrates the relationship between the spatial and placement structures.
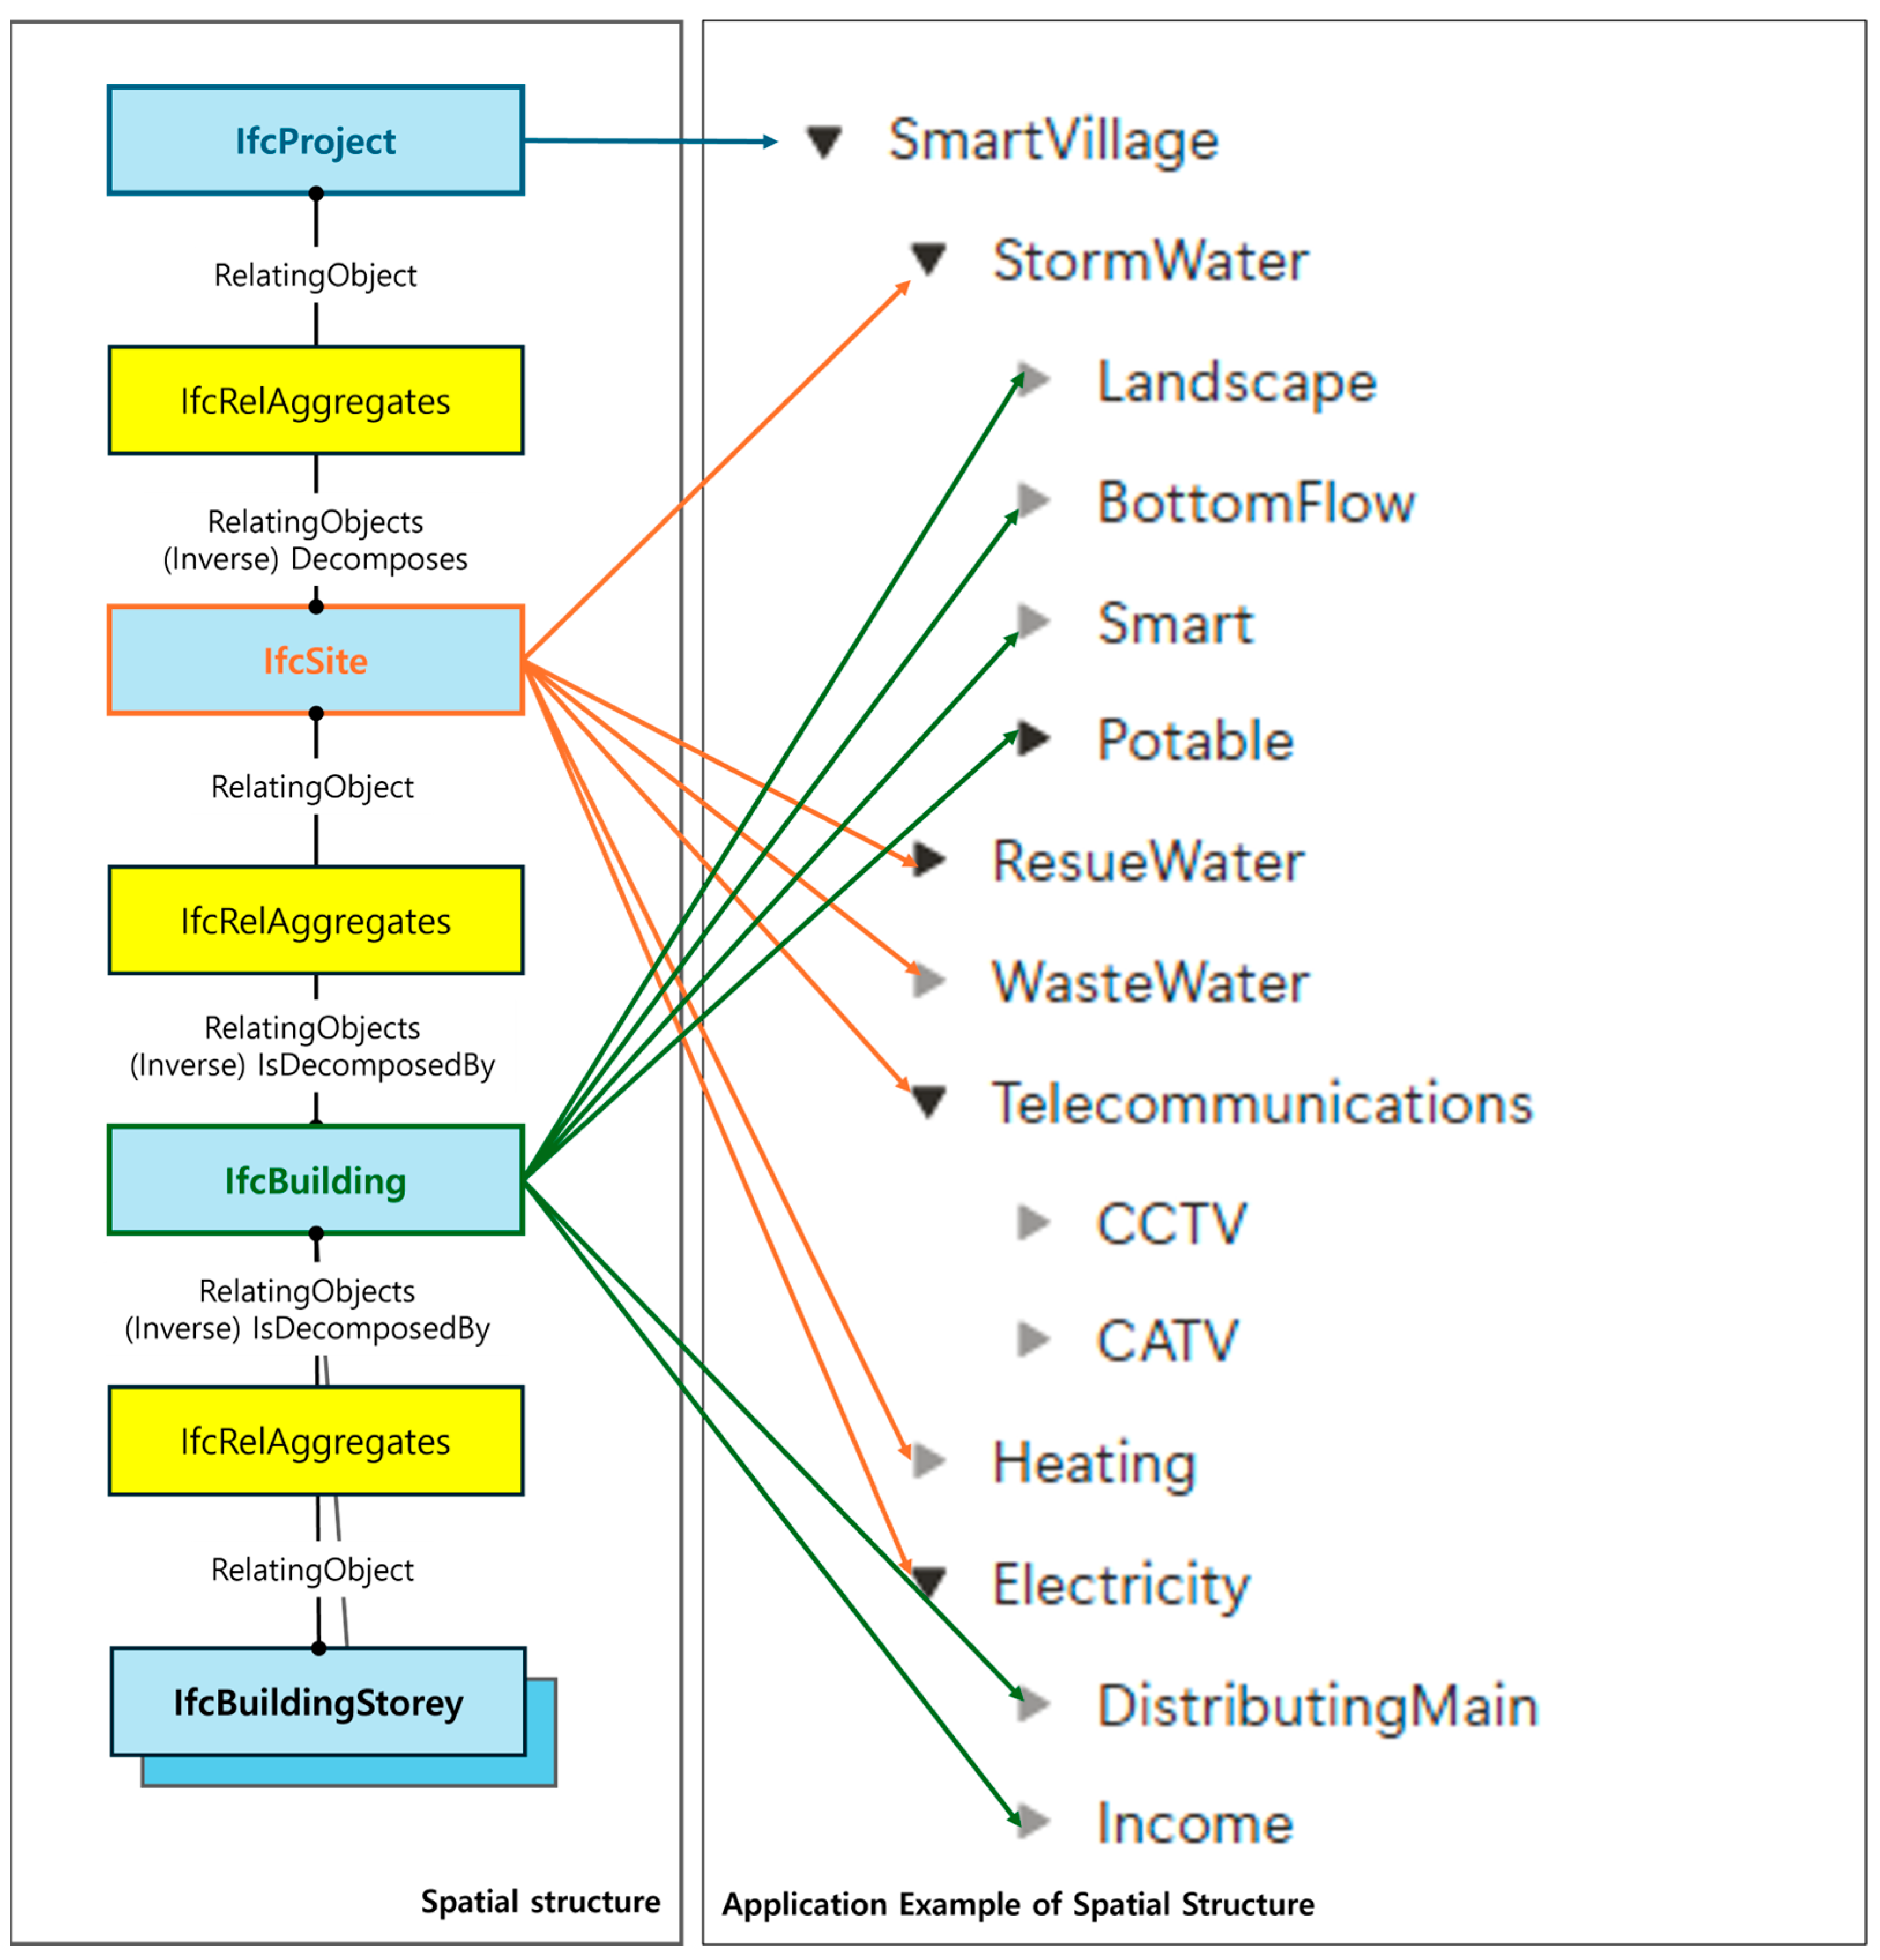
The spatial structure in IFC follows a hierarchical order consisting of IfcProject, IfcSite, IfcBuilding, and IfcBuildingStorey. IfcProject serves as the top-level container of an IFC file and includes fundamental information such as the project name, measurement units, and ownership details. IfcSite represents the physical land or site where the project is located, while IfcBuilding denotes the facility constructed on that site. IfcBuildingStorey expresses vertical spatial subdivisions such as the floors of a building. These containers can include multiple objects within higher-level structures, thereby forming a hierarchical organization. Figure 4 illustrates an example of the spatial hierarchy applied to underground utilities.
In this study, the utilized underground utility drawings were defined as IfcProject, and the types of pipelines included in the drawings were mapped to IfcSite. Furthermore, the detailed categories of each pipeline were connected to IfcBuilding, enabling hierarchical structuring of the data according to the spatial structure.
The placement structure is based on the global coordinate system and local coordinate systems. The global coordinate system provides the absolute reference point for the entire project, while each object is positioned using its own local coordinate system defined by an origin and orientation.
In an IFC 3D model, all objects are derived from the IfcProduct class. IfcProduct is the superclass that encompasses every type of object in a project, including physical elements such as IfcWall, IfcDoor, and IfcWindow, facility components such as IfcPump and IfcPipeSegment, and spatial elements such as IfcSpace, IfcBuildingStorey, and IfcSite. Each IfcProduct object defines its position and orientation through the IfcLocalPlacement attribute, which specifies its placement relative to the parent object.

5.3. Processing of BIM Object Geometry

To generate BIM objects in IFC format, the properties and geometry items of the GeoJSON-structured underground utility data are utilized.
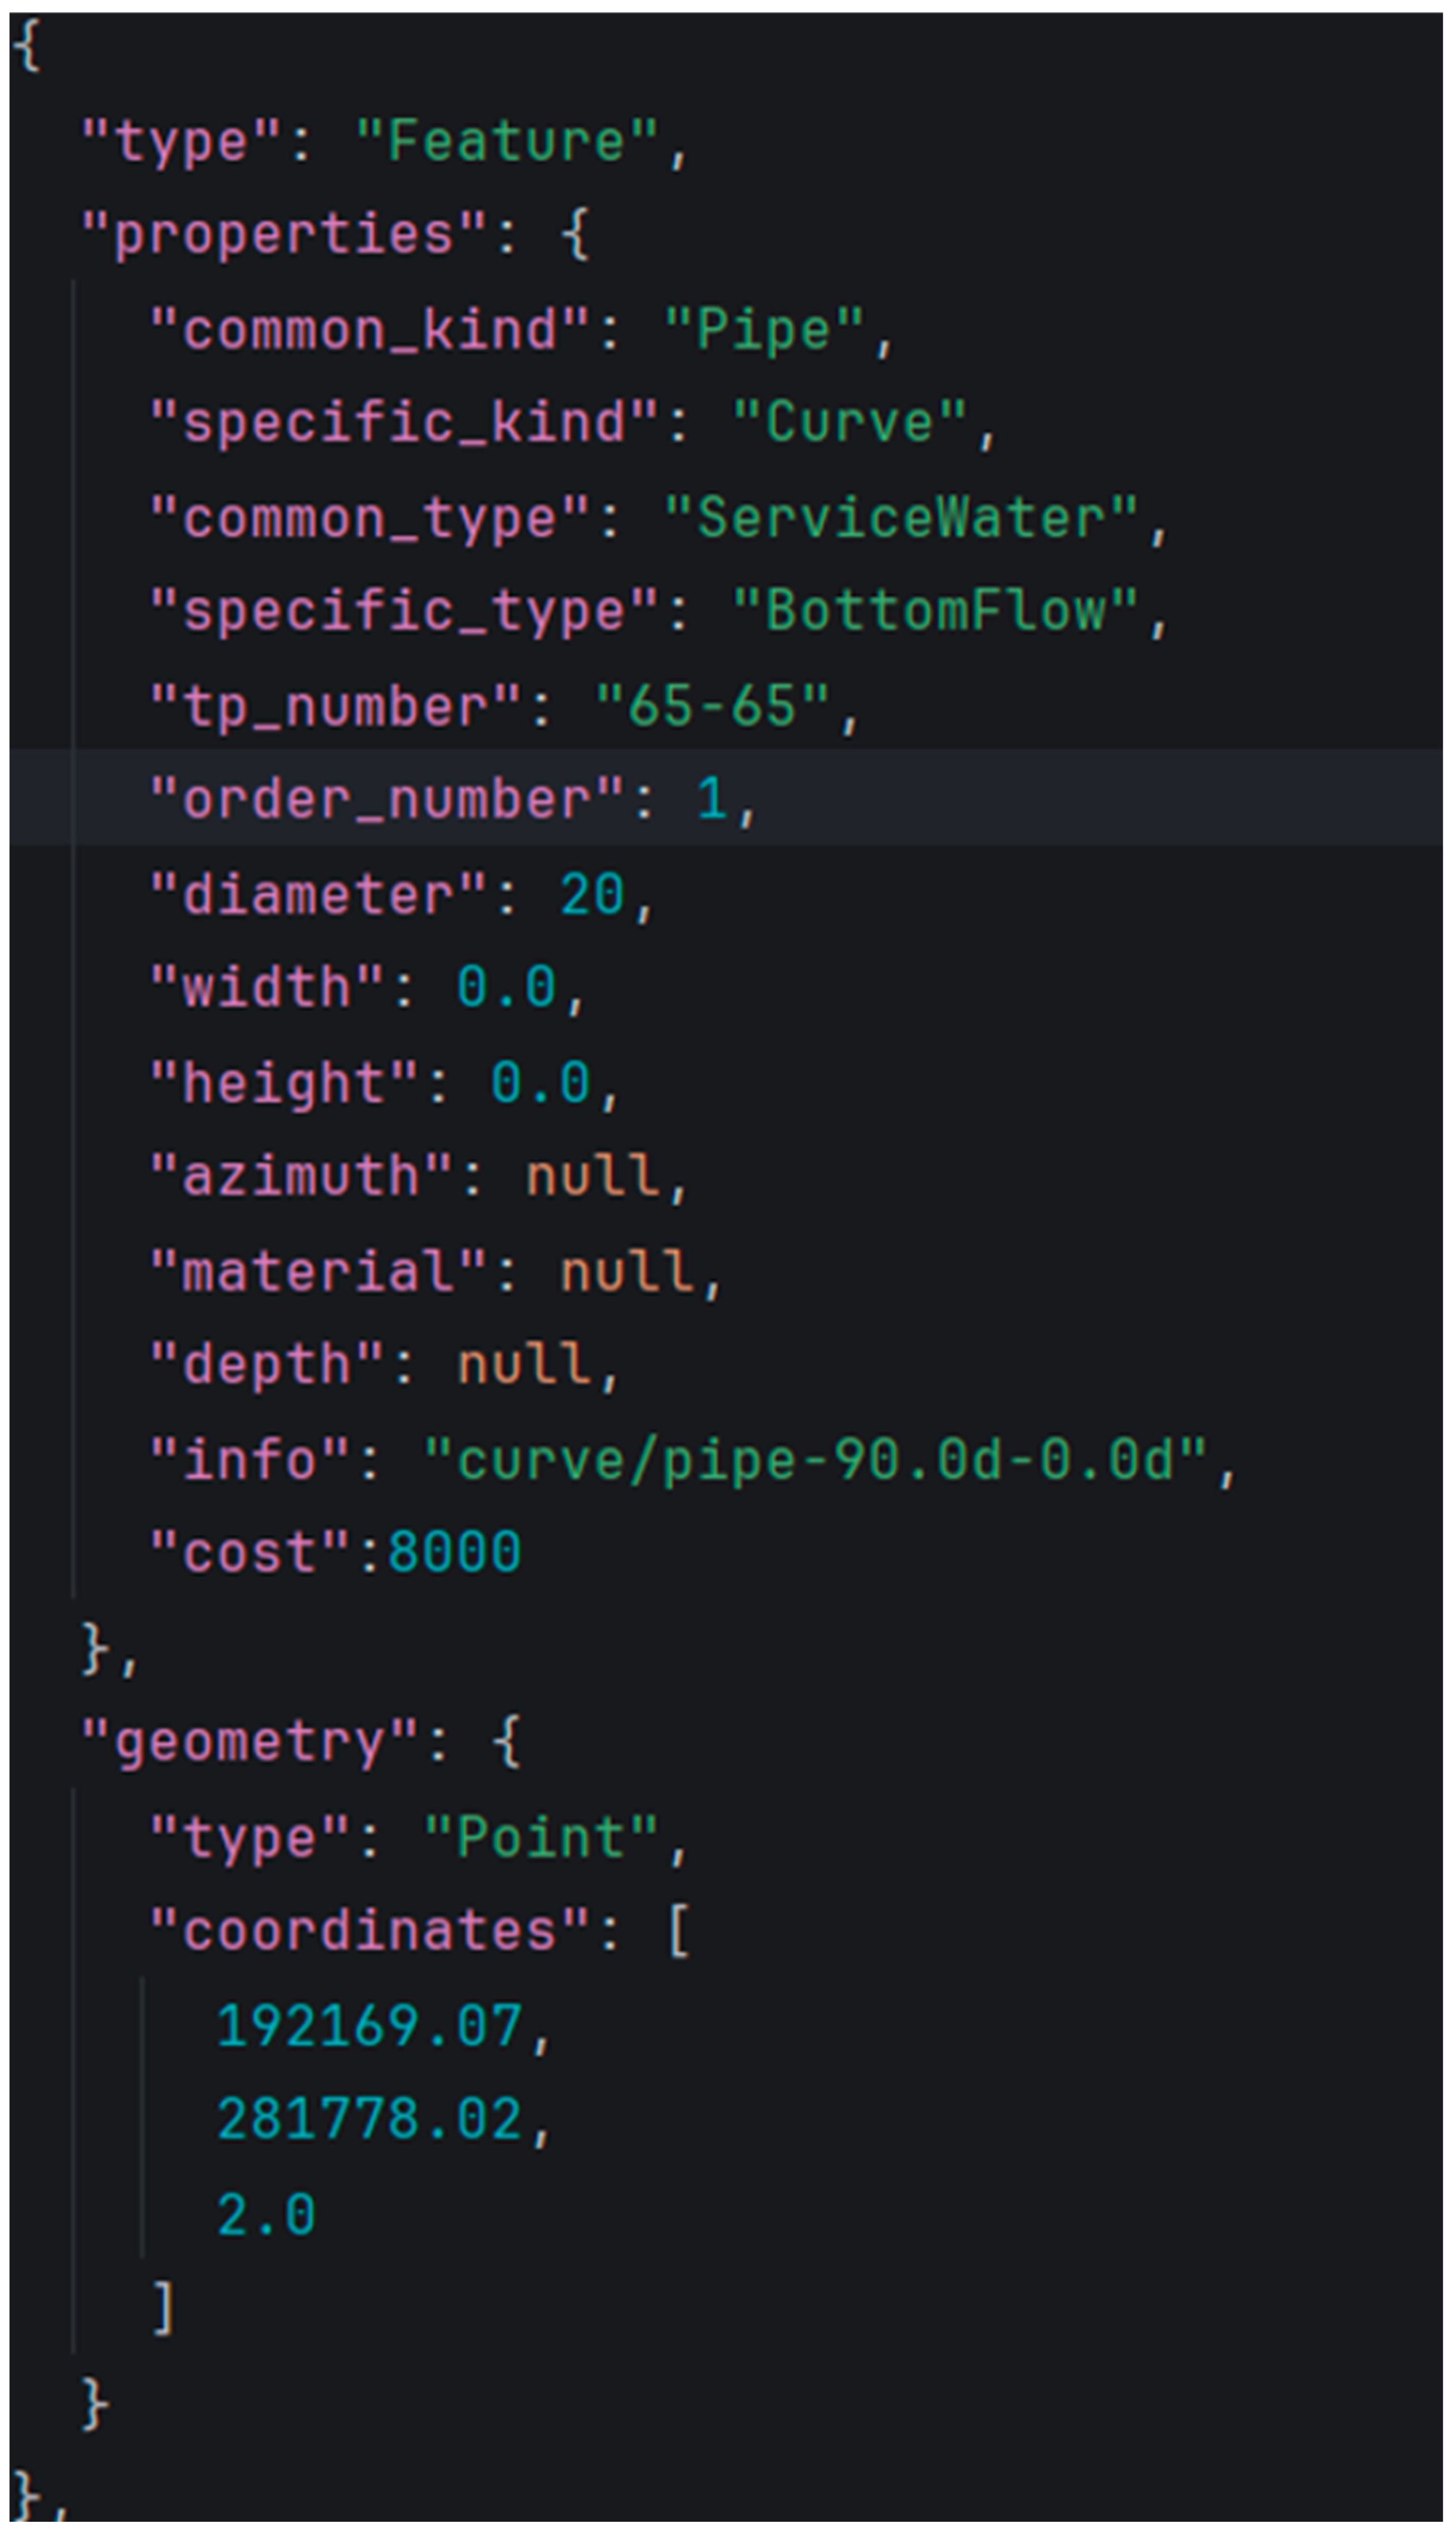
Figure 5 shows the three-dimensional (3D) spatial data in GeoJSON format extracted from standardized 2D CAD drawings, containing the spatial position and attribute information of each object.
The common_type attribute represents the general type of the pipeline (e.g., water supply), while the specific_type attribute provides more detailed classification information.
The common_kind and specific_kind attributes distinguish whether the object is a pipeline or a point-based facility such as a manhole, and the specific_type value specifies the geometric characteristics of the pipeline (e.g., straight pipe, curved pipe).
In addition, the tp_number attribute stores the unique pipeline ID, and order_number records the creation order of underground utilities during CAD drafting. Geometric parameters such as diameter, width, and height define the main dimensions of each object, and additional information, including orientation, material, and burial depth, is also defined in the properties item. If an attribute value is not available, a “null” value is assigned so that the data can later be updated when new information is acquired. This structure provides high flexibility in terms of data scalability and maintenance.
To generate the 3D geometry of pipelines and facilities, the object type is first determined based on the common_kind and specific_kind attributes in the properties item, and then the geometry is constructed using an appropriate method.
For straight pipelines, the geometry coordinates and the diameter, width, and height values are directly used to create the shape.
For more complex geometries, such as curved pipes or manholes, pre-modeled 3D reference objects are loaded through the file path defined in the info attribute.
This approach enables accurate and consistent 3D modeling of various types of underground utilities.
The process of creating the 3D geometry proceeds as follows.
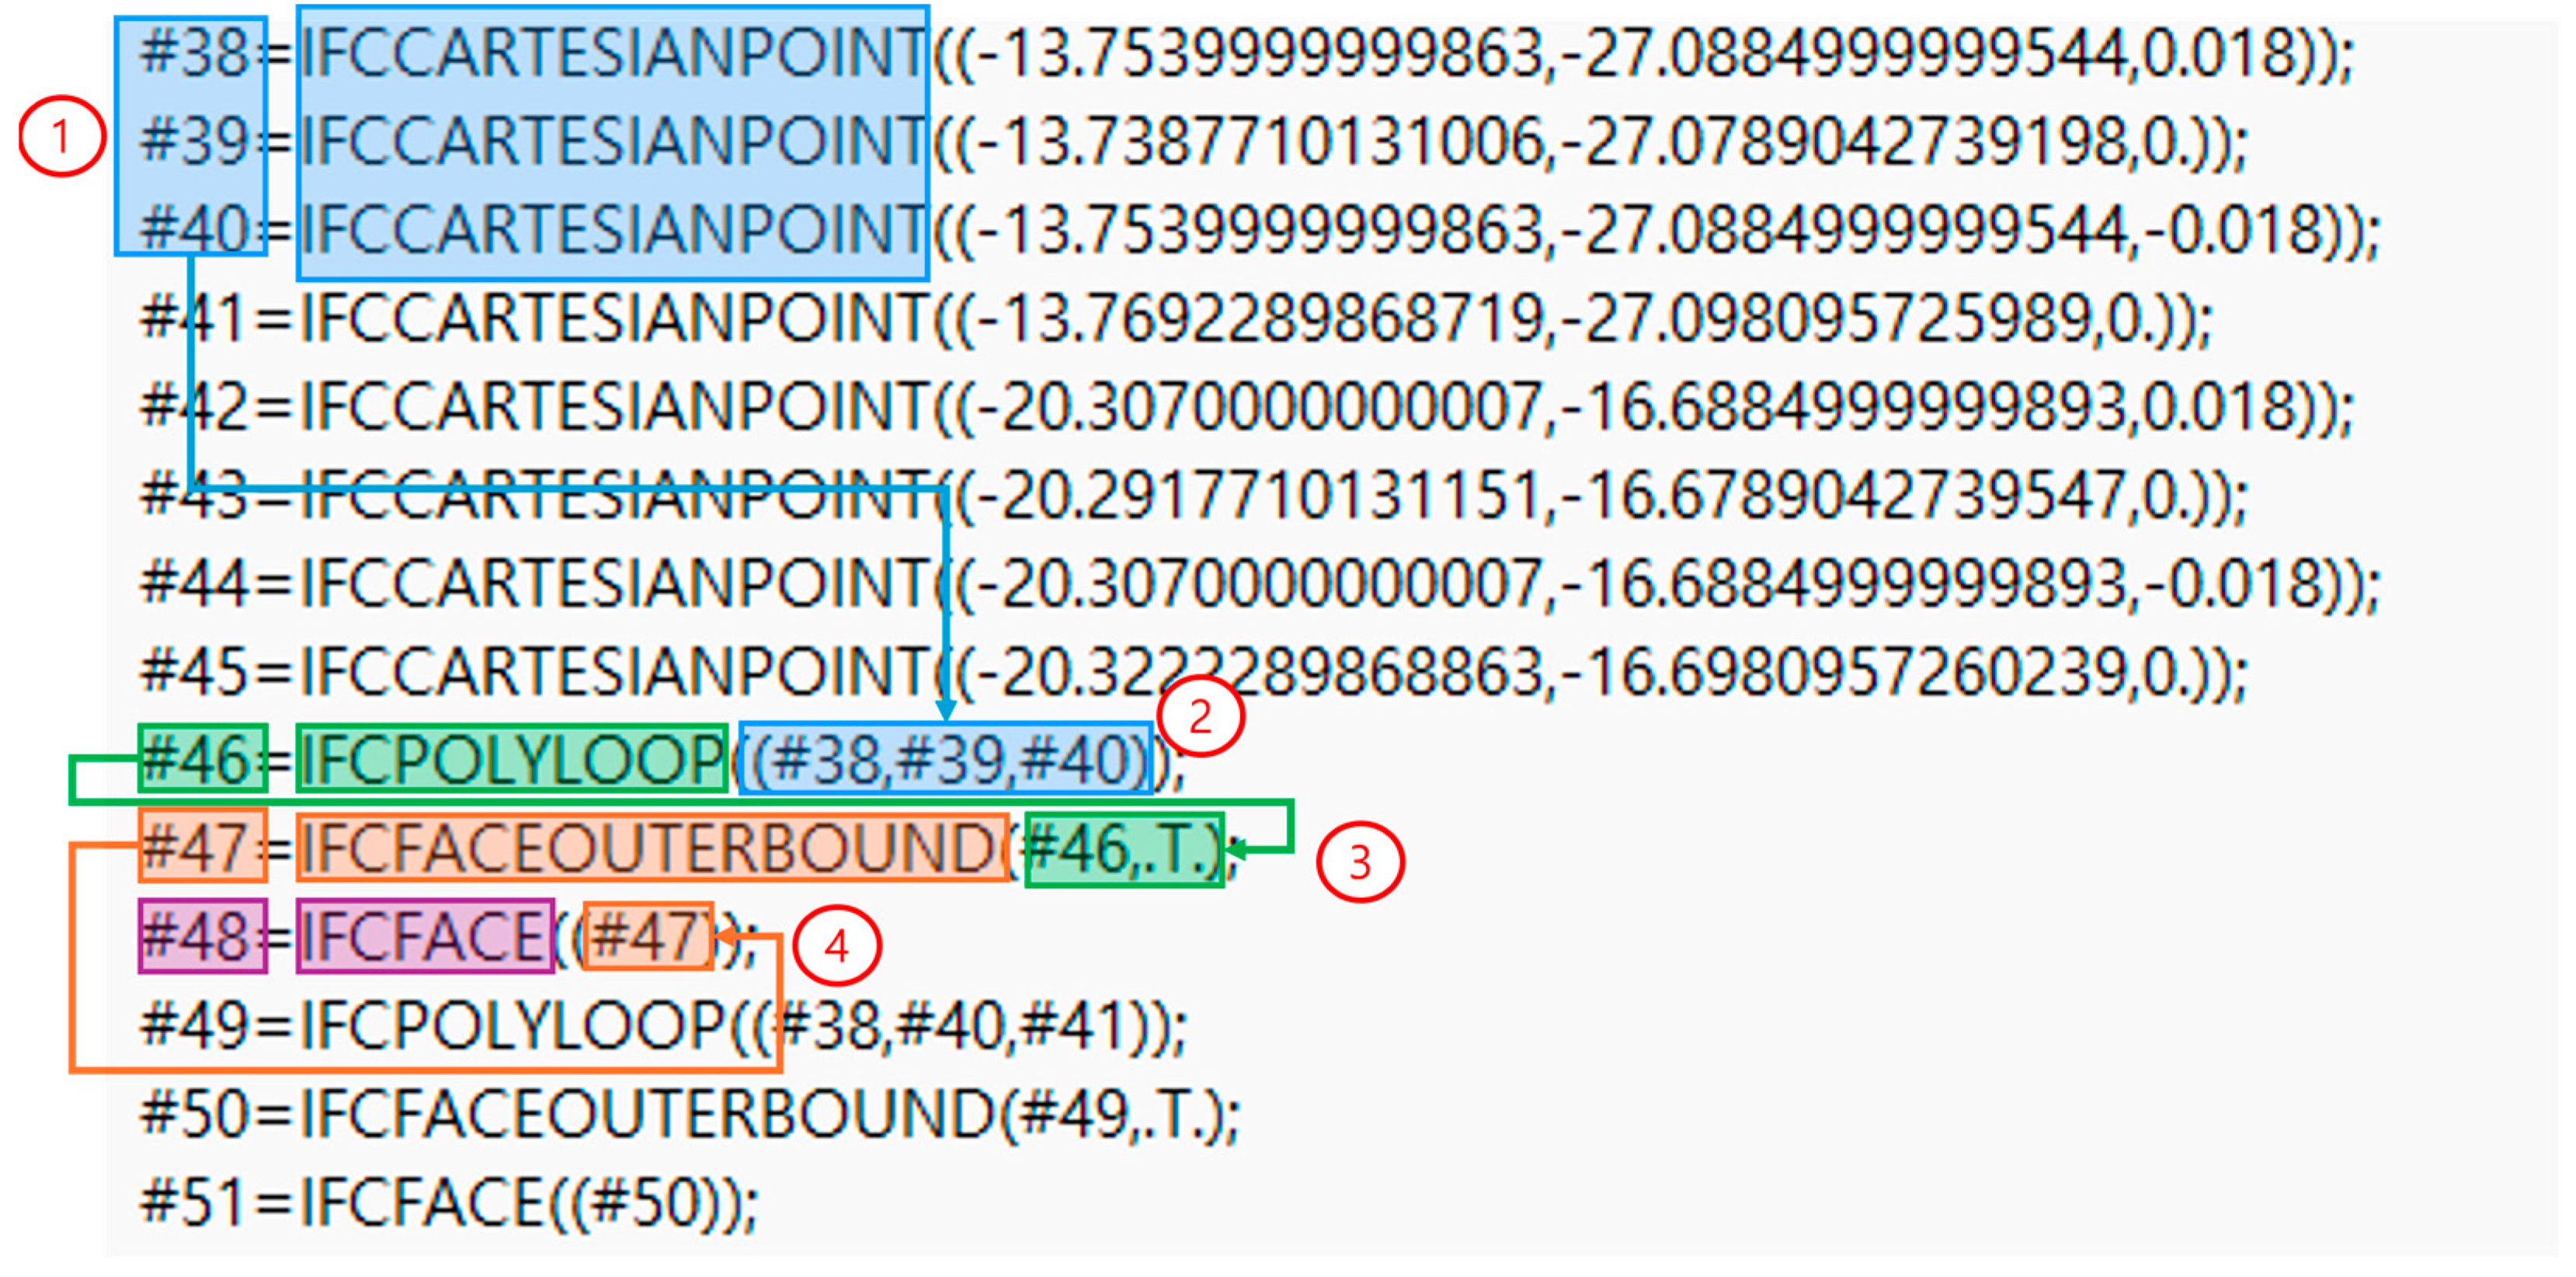
  • The positional data in the geometry item are mapped to IfcCartesianPoint objects to generate point data.
  • The IfcCartesianPoints are connected to form a closed polyloop using IfcPolyLoop.
  • Before generating a face, the outer boundary and normal direction are aligned and defined as IfcFaceOuterBound.
  • A surface is then created by incorporating IfcFaceOuterBound to form the geometry of the underground utility.
Figure 6 illustrates the IFC data structure for constructing a single face from point data.
However, the geometry data alone are insufficient to construct a complete pipeline model. Therefore, the radius is calculated based on the diameter value, and rotation transformation is applied. To prevent the gimbal lock problem, a quaternion-based rotation method was adopted [34].
5.
The surfaces generated as IfcFace are combined into a 3D solid object using the IfcClosedShell class, which is represented as IfcFacetedBrep.
6.
The generated BRep geometry is mapped through IfcShapeRepresentation to define the representation type.
7.
The coordinate system and units are defined by IfcGeometricRepresentationContext.
8.
Finally, the geometric information is integrated into IfcProductDefinitionShape, and the resulting objects are classified as IfcPipeSegment for pipelines and IfcDiscreteAccessory for facilities. Through this process, the objects become complete BIM entities with semantic attributes.
Figure 7 presents the step-by-step procedure for processing the BIM object geometry.
Classifying each object according to its type-specific IFC entity ensures correct recognition when importing the IFC file into widely used BIM software such as Autodesk Revit or Civil 3D. This enables users to edit object properties individually through the standard BIM interfaces.
In this study, the schema-level compatibility between the GeoJSON data structure and the IFC schema was examined. The properties structure in GeoJSON is conceptually equivalent to the IfcPropertySet structure in IFC, and each field is designed to be mapped to a corresponding IFC entity and attribute.
For example, the GeoJSON attributes type, diameter, and material correspond to IfcPipeSegmentType, IfcPropertySingleValue, and IfcRelAssociatesMaterial, respectively.
Through this mapping, both geometric and attribute information are represented in the IFC model with structural consistency. Furthermore, the geometry item of GeoJSON corresponds one-to-one with the Spatial Structure Hierarchy of IFC. Each object is converted into an IfcProduct subclass, such as IfcPipeSegment or IfcManhole, while preserving its position, orientation, and property information.
The comparison of data types, property structures, and hierarchical relationships confirmed that all elements were either directly representable in or compatible with the IFC4 schema, and that no data loss or structural inconsistency occurred during the transformation process.
These findings demonstrate that the proposed GeoJSON-to-IFC conversion process is structurally compatible with the IFC standard schema and contributes to achieving standardized data exchange and interoperability in underground utility management.

5.4. Processing of Material Information for BIM Objects

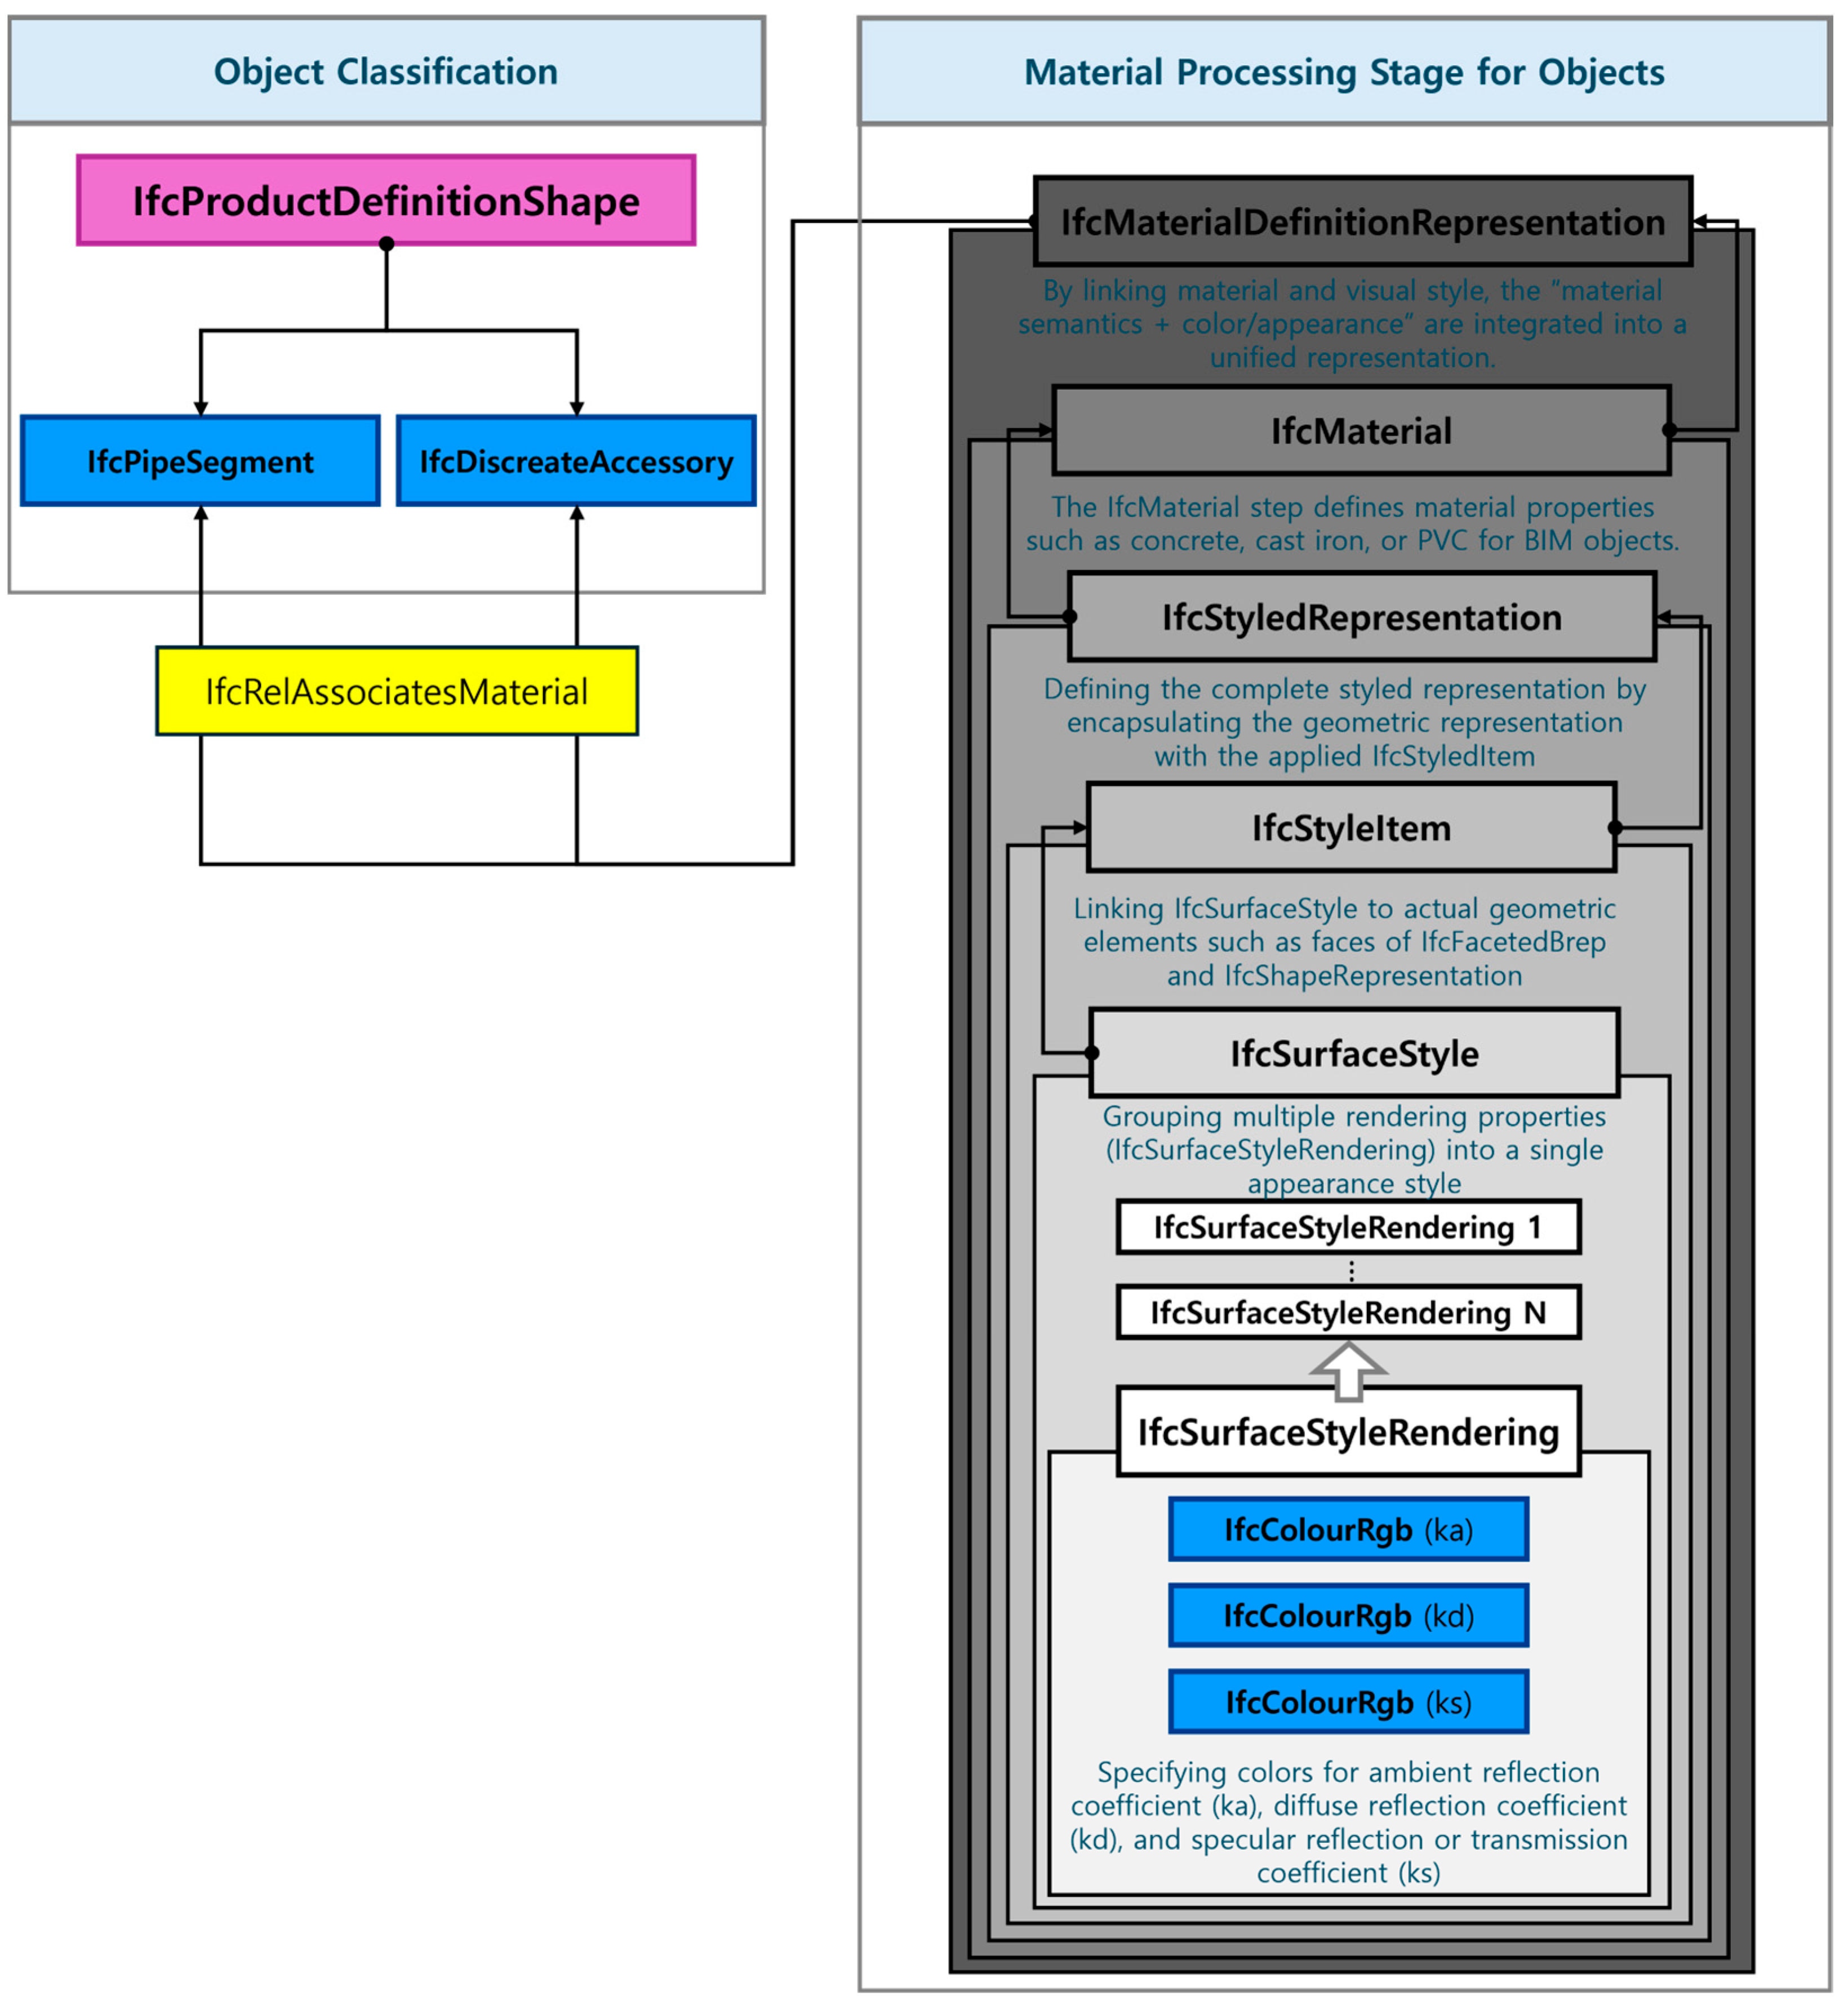
The processing and integration of material information in IFC-based BIM objects are carried out in the following steps. First, general material information is defined for each type of underground utility, and detailed material information is subsequently processed for each BIM object based on these definitions. Second, visual attributes are generated for the BIM object geometry, and these visual attributes are linked to the corresponding material information of the BIM objects.
For the visualization of underground utilities, it is common practice to apply color coding systems defined by national standards. Table 3 presents examples of the designated color schemes adopted in major countries.
In this study, the material information of BIM objects was expressed using colors. For each type of underground utility, designated color information was defined in RGB (Red–Green–Blue) values using the IfcColourRgb class. In the BIM and AEC (Architecture, Engineering, and Construction) domains, it is standard practice to represent color values as floating-point numbers within the range of 0 to 1 rather than the conventional 0 to 255 range, and this convention was also adopted in this study.
The IfcSurfaceStyleRendering class defines rendering attributes and references the previously created IfcColourRgb objects to set color information. In addition to color, this class can specify various optional visual properties such as transparency, reflectance, and glossiness. The generated rendering properties are integrated into a surface style through the IfcSurfaceStyle class. The IfcSurfaceStyle object is linked as an internal element of IfcStyledRepresentation, which assigns surface-level styles during the generation of IfcFacetedBrep geometry.
The IfcStyledRepresentation class constructs style-based shape representations, which are concretely defined by IfcStyledItem objects. These styled representations are visualized by BIM viewers or through Model View Definitions (MVD), enabling both material and geometry to be represented together for users.
To further specify the physical properties of materials, the IfcMaterial class was used to define major underground utility materials such as concrete, PVC, cast iron, and polyethylene (PE). The IfcMaterialDefinitionRepresentation class was then applied to connect IfcMaterial objects with IfcStyledRepresentation objects, thereby integrating visual representation with semantic information.
Finally, the IfcRelAssociatesMaterial class was employed to link the generated BIM objects (e.g., IfcPipeSegment, IfcDiscreteAccessory) with their material information. This process achieves a complete integration of geometry and material attributes within the BIM objects. Figure 8 illustrates the step-by-step procedure of processing and integrating material information for BIM objects.

5.5. Processing of Attribute Information for BIM Objects

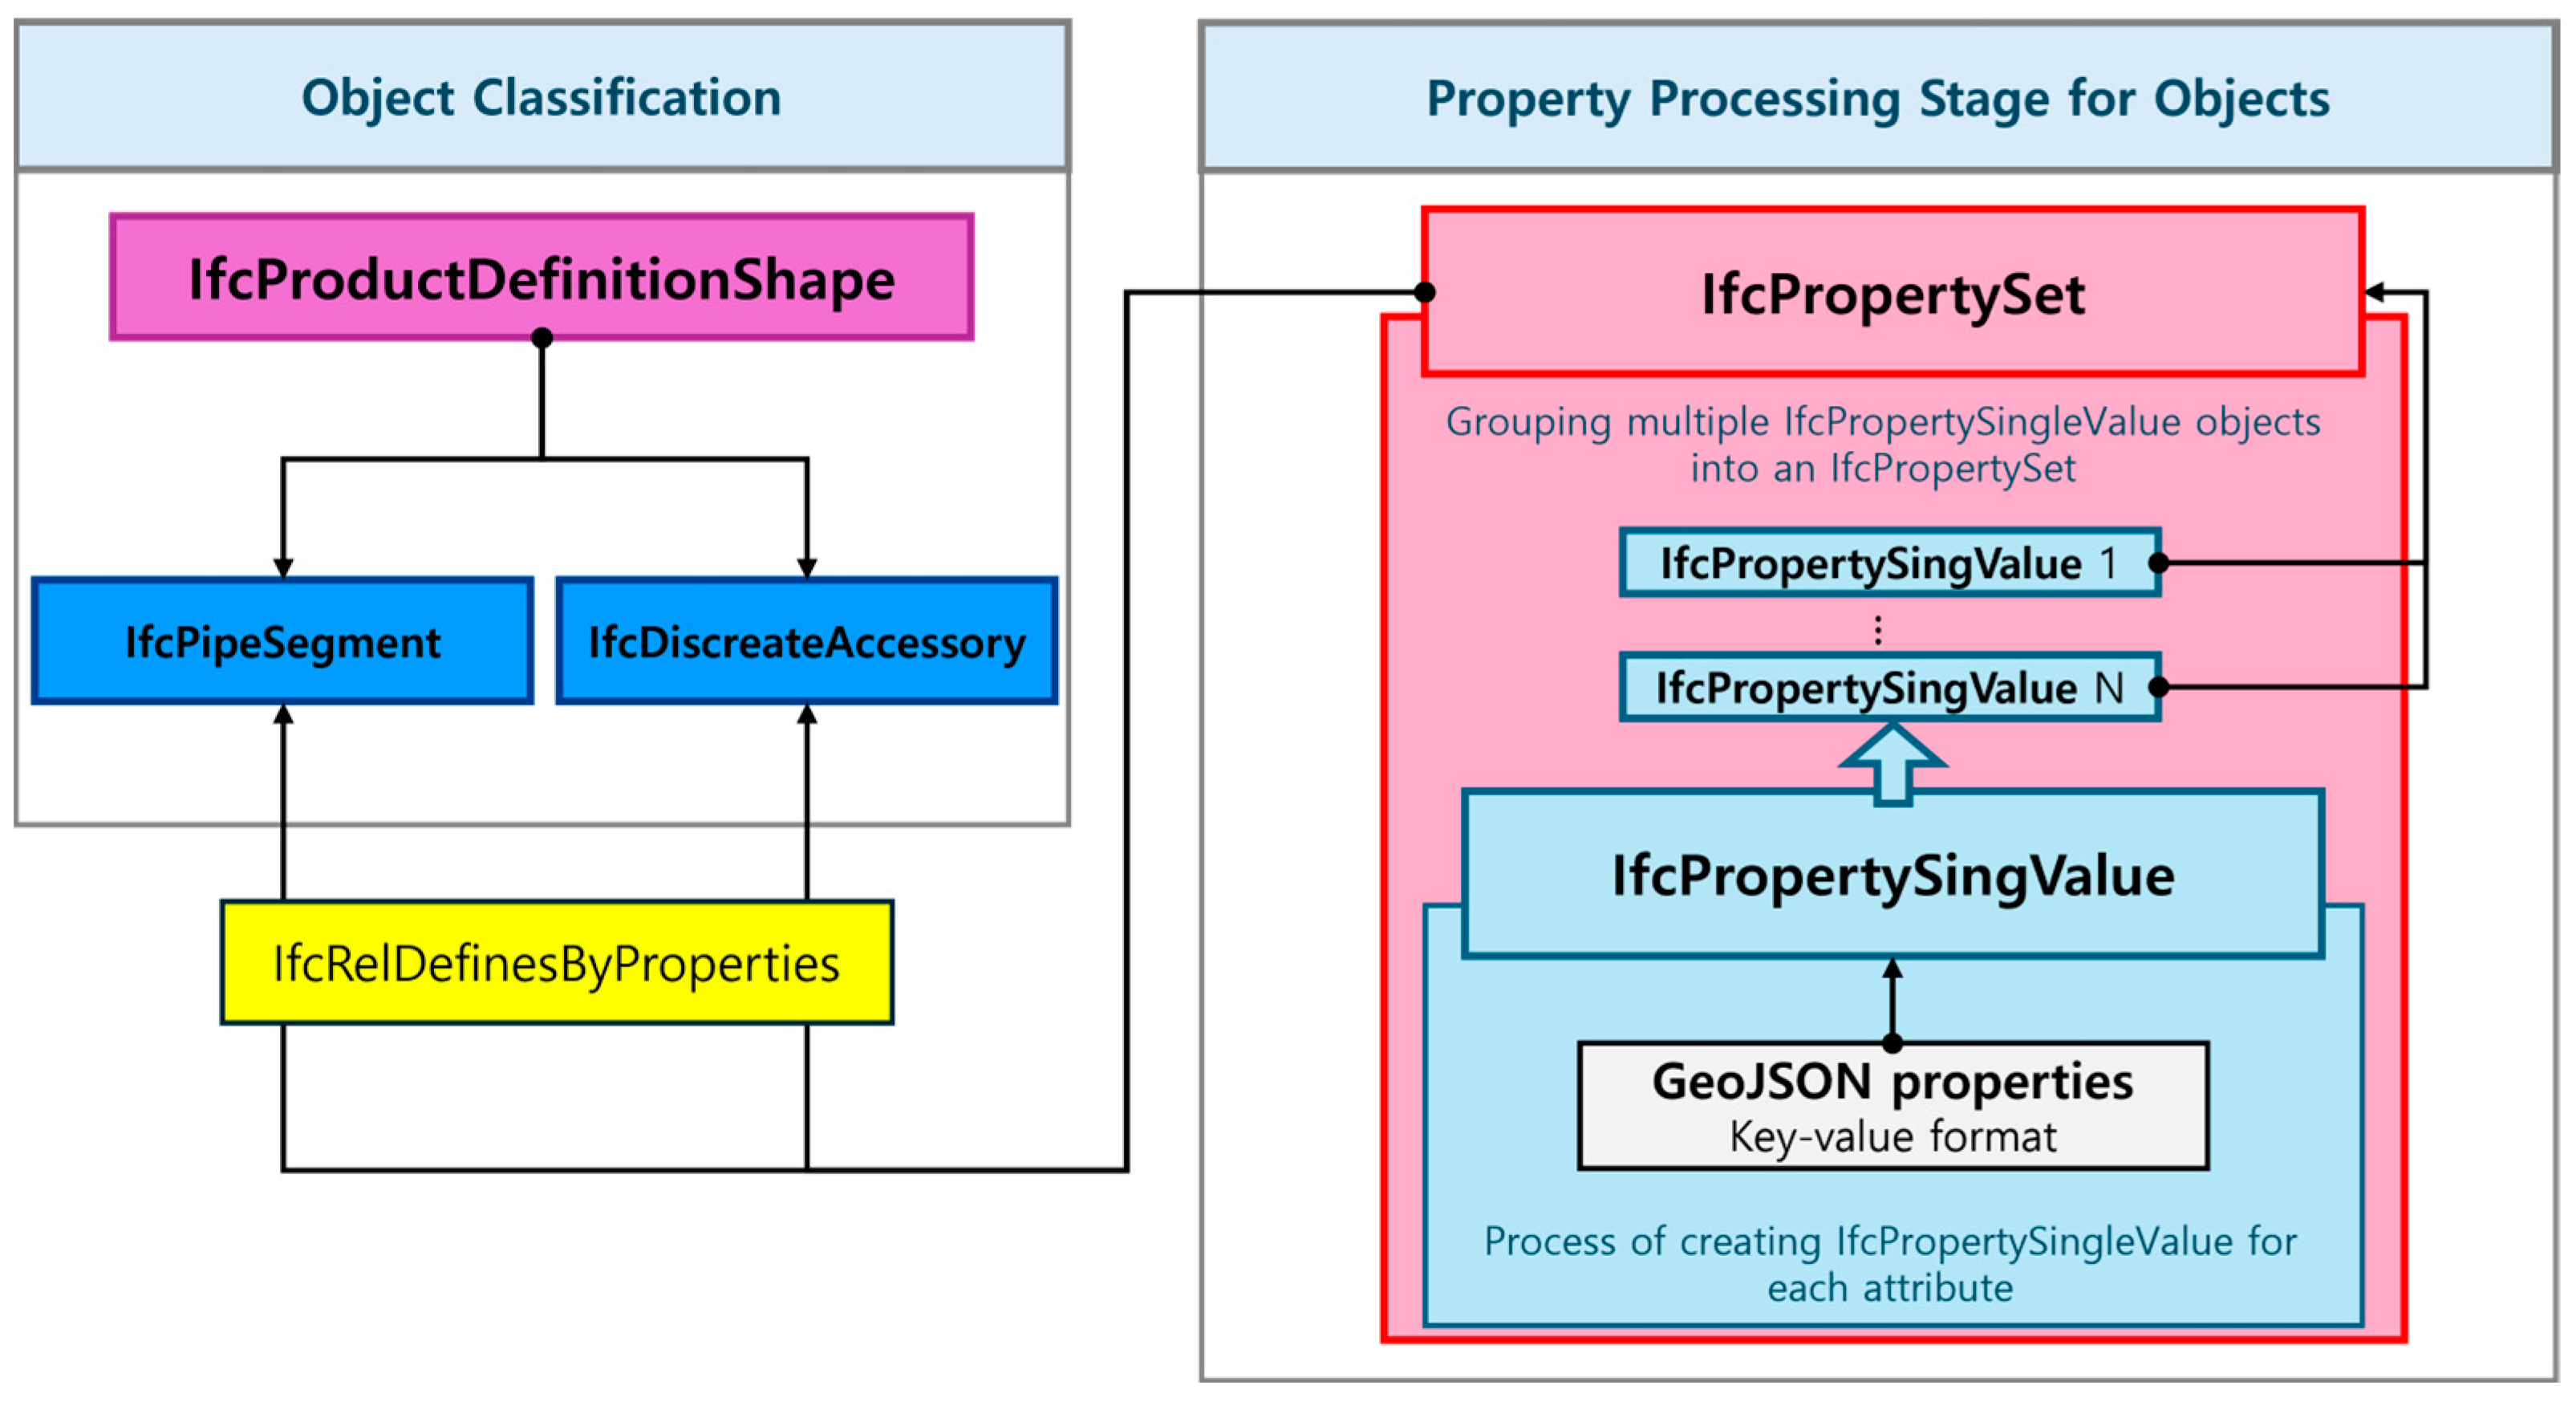
The attribute data stored in the properties field of the GeoJSON-based three-dimensional spatial dataset are processed and integrated as attribute information within BIM objects. Through this procedure, the attribute information of underground utilities can be systematically managed as object-level properties within the BIM model. Figure 9 illustrates the step-by-step process of processing and integrating attribute information into BIM objects.
The attribute information extracted from the properties field of GeoJSON is structured in a key-value format and converted into property data within the IFC schema. Specifically, each attribute is represented as an object using the IfcPropertySingleValue class. The converted attributes are then aggregated and managed as a single property set using the IfcPropertySet class. The resulting IfcPropertySet object is integrated with BIM objects (IfcPipeSegment or IfcDiscreteAccessory) through the pset.add_pset() API provided by IfcOpenShell.
Maintaining attributes at the level of individual IfcPropertySingleValue objects ensures flexibility for adding, modifying, or deleting properties in the future. Since attributes defined at the design stage are continuously updated due to design revisions or construction requirements, managing them as individual elements rather than as a single bundled object guarantees maintainability and extensibility of the attribute data.
The generated IfcPropertySet is linked to the corresponding BIM object (IfcPipeSegment or IfcDiscreteAccessory) through the IfcRelDefinesByProperties relationship class. As a result, all metadata defined in GeoJSON is systematically managed within the IFC structure and transformed into a format that supports editing and querying of properties in BIM software. In addition, material information is associated with objects through IfcRelAssociatesMaterial, resulting in BIM objects where geometry, material, and properties are fully integrated.
Finally, the conversion module merges all generated objects into a single integrated IFC file. In this process, geometric, material, and property information are combined without loss, producing a high-quality 3D IFC model that can be effectively utilized in construction planning and maintenance phases.

6. Data Integration of WBS and CBS for Project Management in BIM

6.1. Necessity of Establishing an Integrated Data Management Framework

Traditional construction project management methods have primarily relied on 2D CAD drawings, which has led to fragmented management of schedule and cost information. In the case of underground utility projects, drawing-based information generated during the design stage has not been directly linked to process management in the construction stage. As a result, discrepancies between work schedules and cost estimation, data loss, and delays in decision-making frequently occur. In addition, conventional cost estimation systems have been operated independently of work planning, which causes inefficiencies by relying on segmented information at each construction stage.
To address these challenges, a new approach is required that enables the integrated management of schedule, cost, and geometry data in a cohesive manner. Table 4 presents a structural framework for establishing an integrated information system within BIM. Since BIM offers extensibility by combining three-dimensional geometry (3D BIM) with scheduling (4D BIM) and cost data (5D BIM), it significantly enhances data connectivity and management efficiency across the entire lifecycle of a construction project. Therefore, establishing a system that integrates schedule management based on WBS, cost management based on CBS, and geometry management based on BIM objects is essential.
In particular, structuring WBS and CBS in a JSON format facilitates parsing and transformation of the data, while also supporting expansion into international standard formats such as IFC. This approach ensures interoperability with various BIM software platforms and enables the unified management of schedule, cost, and geometry data within a single framework. Furthermore, by integrating this structure with GeoJSON-based spatial data extraction, location, attribute, and geometry information of underground utilities can be directly linked to WBS and CBS. This provides a practical implementation of an integrated WBS–CBS–BIM object-based data management framework that can be effectively applied in construction sites.

6.2. JSON-Based WBS Modeling and BIM Integration

6.2.1. Method of Collecting Process Information for WBS Modeling

In this study, the WBS (refined to the Task level) is constructed by combining representative processes (representative stages) derived from standard specifications and field procedures with actual construction objects (underground utility sections or components) identified from drawings or three-dimensional spatial data. The representative processes are defined in accordance with the Standard Specifications for Waterworks Construction (2022), which consist of six stages: planning and construction preparation, excavation, pipeline installation, water supply facility installation, backfilling and road restoration, and cleaning, testing, and completion. These stages align with the practical workflow and quality management guidelines (KCS 57 series) [35].
The collection of process information is carried out through two key approaches. First, the six representative processes based on the standard specifications are adopted as the top-level classification (WorkSchedule). Subsequently, project-specific details are incorporated to derive candidate tasks for each stage. Second, actual underground utility objects (e.g., pipe type, diameter, length, and section) extracted and refined from drawings or GeoJSON data are collected as candidate Products to be assigned to tasks. These objects are later converted into IFC classes and linked with corresponding tasks. In other words, the WBS structure is established in a top-down manner based on the representative processes, while actual buried objects identified from drawings or GeoJSON are allocated to tasks in a bottom-up manner. The WBS dataset is therefore organized using a combined top-down and bottom-up approach.

6.2.2. Design of a JSON-Based WBS Modeling

To model the collected process data, the WBS was defined in a hierarchical JSON structure. The WBS model adopts a four-level JSON schema. The top-level Project manages metadata such as project type and duration, serving as the foundation for consistently grouping multiple construction units. The subordinate WorkPlan represents the plan and key milestones of individual construction units, providing a basis for resource allocation and progress monitoring in large-scale projects. The WorkSchedule serves as the higher-level classification of representative processes, including attributes such as process name, duration, and status, and manages the logical connections between stages. At the lowest level, Task represents the actual execution unit, containing information on task name, start and end dates, duration, status, personnel, equipment, and material input. When tasks are linked with underground utilities in the drawings, the products attribute specifies the path to the corresponding IFC file, thereby directly connecting three-dimensional objects with the associated task.
This hierarchical design was carefully devised to ensure interoperability, based on an in-depth analysis of the roles and parameter structures of IfcWorkPlan, IfcWorkSchedule, and IfcTask. In particular, the connection of products at the Task level enables the integration of time information for 4D simulation with 3D models, supporting resource management and progress tracking at the smallest executable unit of work. Table 5 presents the hierarchical structure of the WBS model and its description.
The preparation of WBS JSON data combines both bottom-up and top-down procedures. Representative processes based on standard specifications are initialized at the WorkSchedule level, after which underground utility objects extracted from drawings or GeoJSON data are assigned to Tasks according to section- or process-specific rules. Each task is assigned a planned schedule and anticipated resource information, while the products attribute records the path to the corresponding BIM object. The generated JSON is then validated for parent–child hierarchy integrity, temporal consistency, and duplication of object assignments before being stored.
This procedure was designed to reflect actual construction workflows and quality management guidelines, ensuring its applicability in practice. Figure 10 presents an example of the construction processes for a water supply pipeline represented in JSON and CSV formats, based on the WBS modeling approach.
Users can create complete process information by modifying and supplementing the proposed WBS modeling JSON structure based on the process data defined in the standard construction specifications. In addition, for users who are less familiar with the JSON format, a supporting function is provided to allow editing of CSV data within the Microsoft Excel environment while maintaining the same hierarchical structure.

6.2.3. Integration of WBS Modeling with BIM Objects

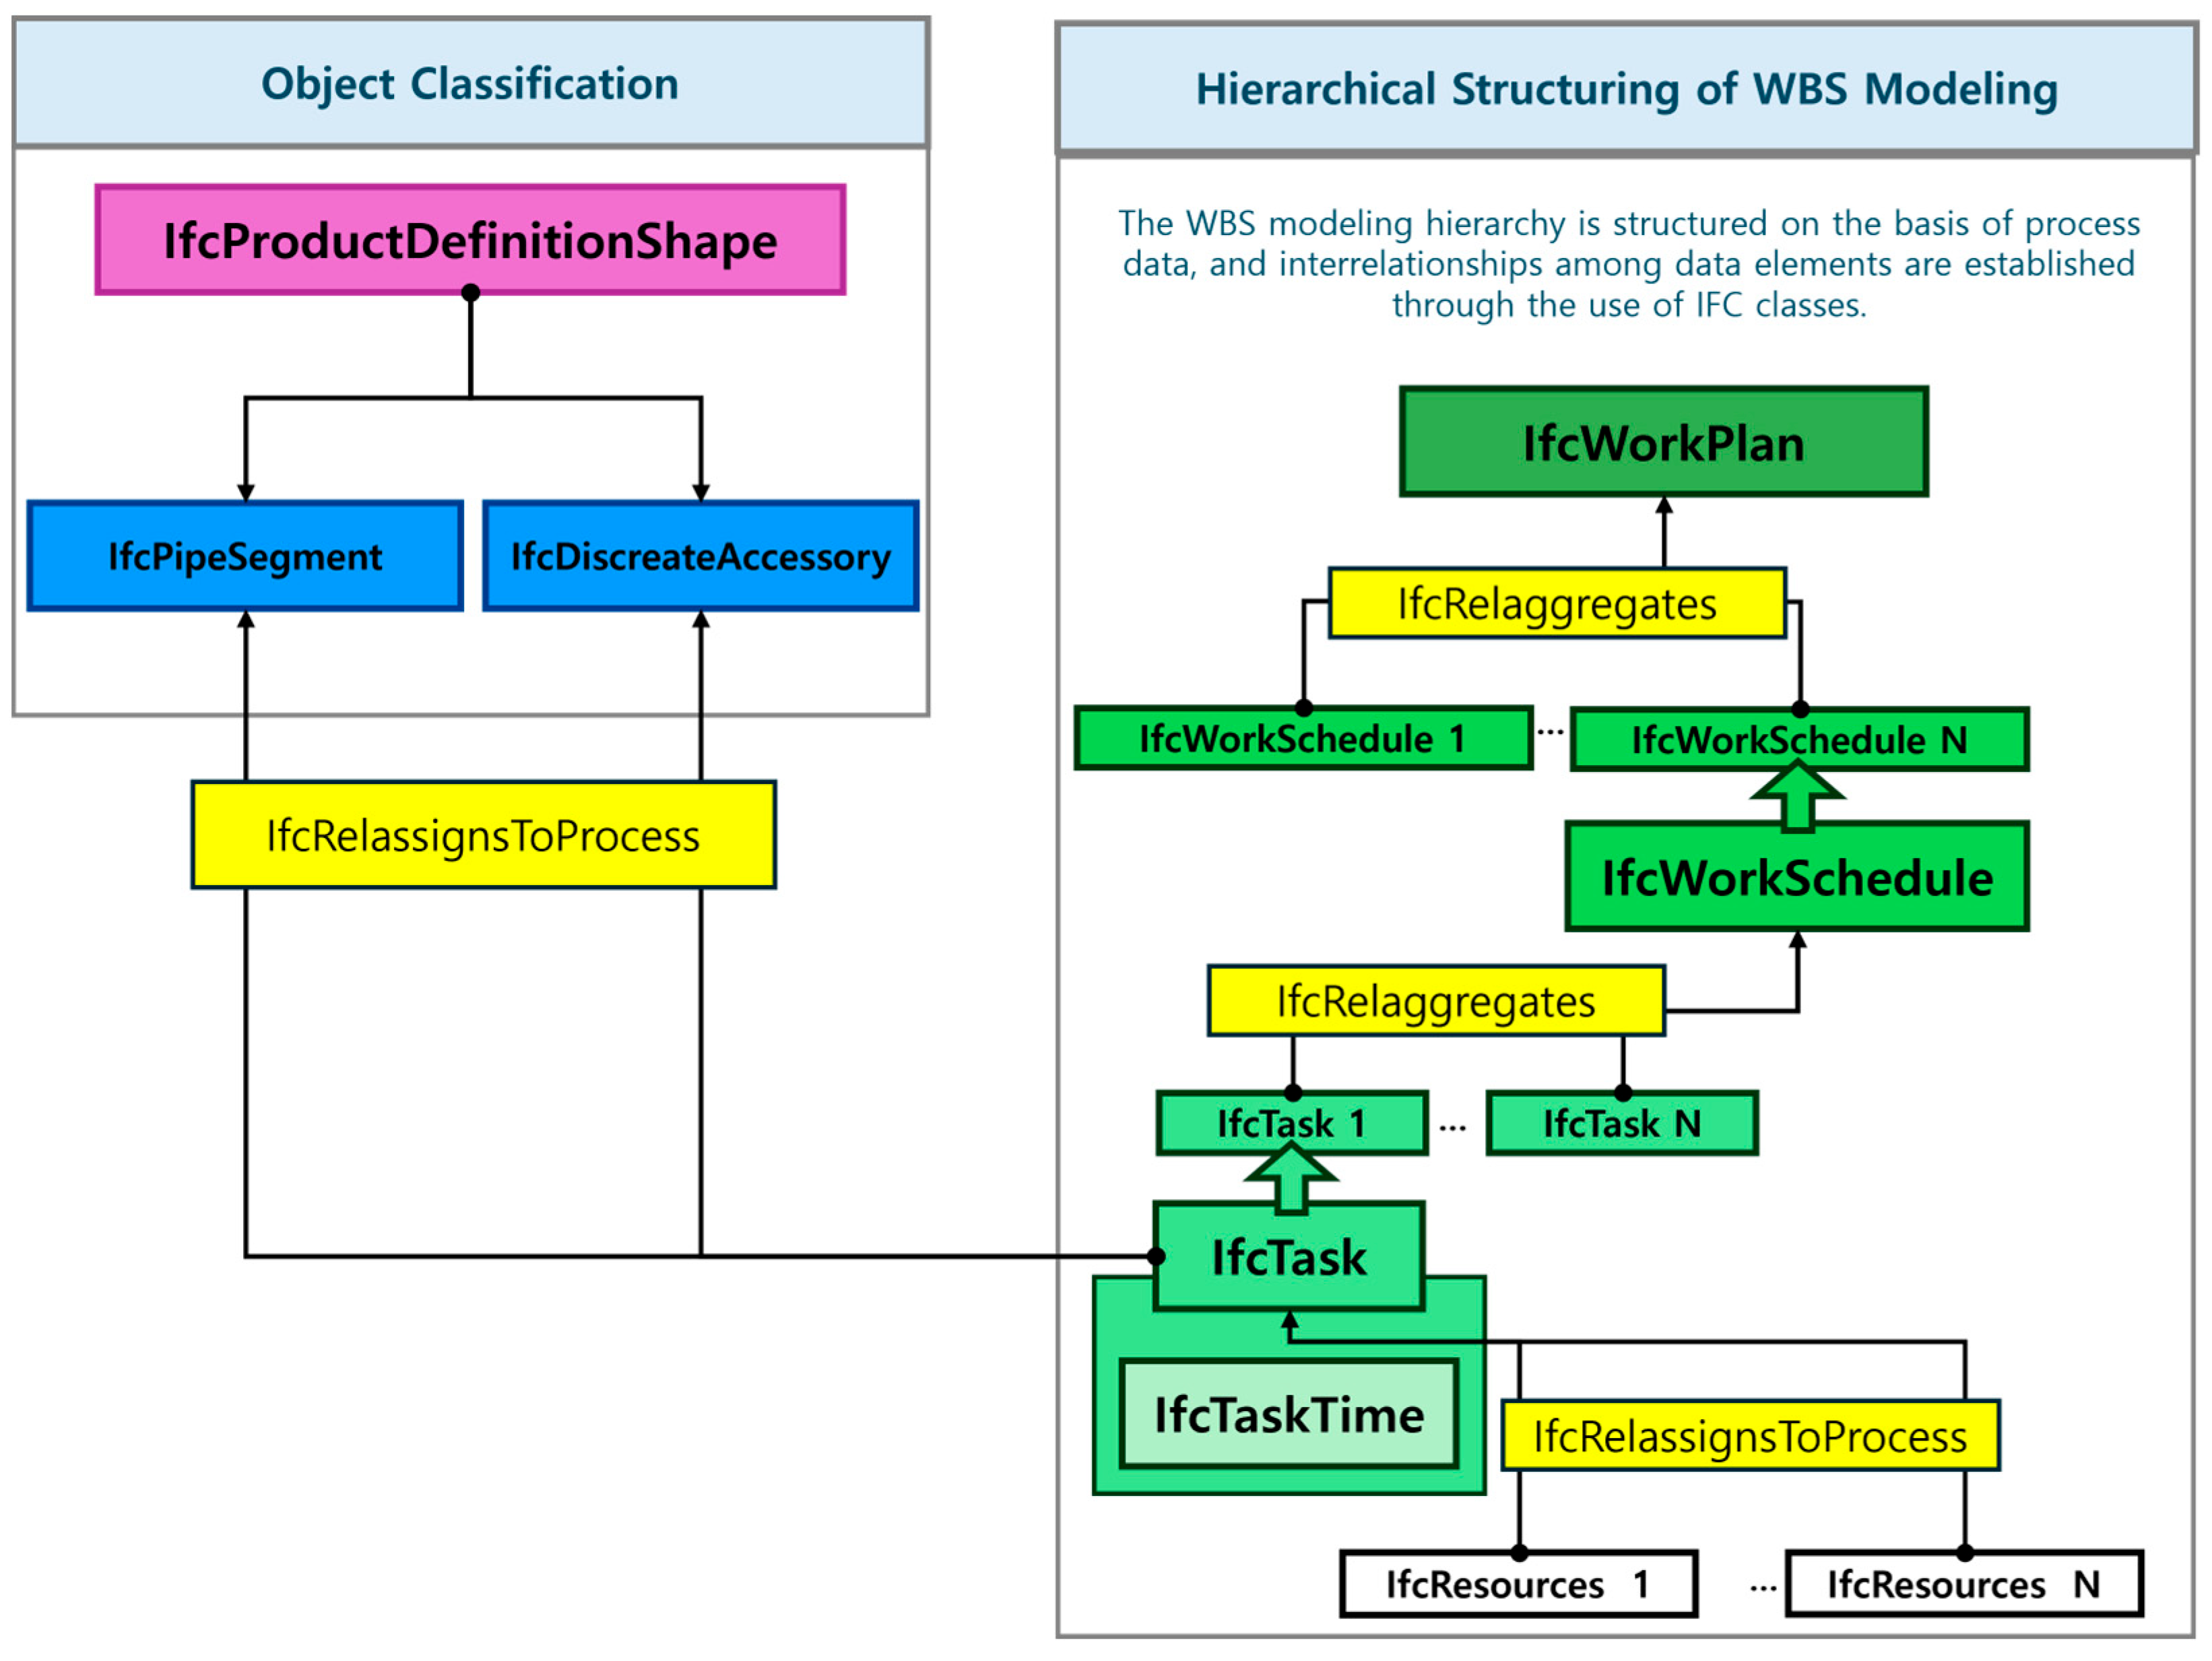
The WBS data structured in JSON format are converted into and linked with the task-planning object hierarchy of IFC. During the conversion process, the JSON WBS data are first parsed so that the top-level Project hierarchy is created as an IfcProject object, and the subordinate WorkPlan hierarchy is mapped to an IfcWorkPlan object. The WorkSchedule information included under the WorkPlan hierarchy is then generated as an IfcWorkSchedule object and hierarchically connected.
For each Task item under WorkSchedule, an IfcTask object is generated, and schedule-related information is specified using the IfcTaskTime class, including start date, end date, and duration. In cases where the products field of a Task contains a valid BIM object path, the corresponding IFC file is referenced, and relevant Geometry, Material, and PropertySet information is selectively extracted and inserted into the integrated IFC model. The linkage between Task and BIM object is defined through IfcRelAssignsToProcess.
Figure 11 illustrates the process of structuring WBS modeling information and integrating it with BIM objects. This class mapping and selective merging procedure ensures structural integrity while minimizing file size and improving the performance of IFC viewers.
The resulting IFC file conforms to the ISO 10303-21 specification and consists of a HEADER and a DATA section. The HEADER contains FILE_DESCRIPTION, FILE_NAME, and FILE_SCHEMA, which specify metadata such as schema version, author, and application. This ensures clear identification of provenance and creation environment, thereby enhancing traceability. Subsequently, WorkPlan, WorkSchedule, Task, and their associated relationship objects are sequentially generated, and the product information linked to each task is merged. This procedure is designed to minimize conversion errors and guarantee consistency.
Such integration extends beyond simple data linkage and provides the foundation for 4D BIM implementation. For example, a 3D model of a specific pipeline installation task can be displayed in a simulation at the start of the work or updated to reflect completion status, enabling real-time verification of progress in a virtual environment. The incorporation of resource information further supports expansion into the cost dimension, thereby paving the way for integrated management at the 5D level.

6.2.4. Considerations for Applying Process Data to WBS Modeling

For practical application in construction projects, identifiers and naming conventions must be managed consistently to enhance searchability and traceability. It is advisable to establish a standardized coding system for tasks, sections, and objects, and to align calendar units and holiday schedules across both JSON and IFC formats to prevent conversion errors. During product merging, only the essential entities required for task execution should be selectively included in the integrated IFC model to minimize file size and ensure viewer performance.
Furthermore, the consistency among WBS, products, and schedules should be regularly validated using tools such as tree-structure visualization, parallel display of attributes, and Gantt chart-based schedule views. These approaches ensure both accuracy and visibility of the conversion process. Such visualization methods are particularly effective in clearly presenting schedule information defined by IfcTaskTime and in intuitively verifying the linkage between IfcProduct and IfcTask.

6.3. JSON-Based CBS Modeling and IFC Integration

This section describes a cost breakdown structure (CBS) modeling schema based on JSON and the procedure for linking it with WBS and IFC cost objects. The proposed approach automatically calculates task-specific costs such as labor and equipment expenses by referencing standard cost norms and wage rates. The computed results are then merged into the WBS and mapped to IFC cost classes, thereby enabling the implementation of 5D BIM with integrated cost management.

6.3.1. CBS Modeling and Acquisition of Process Cost Data

The CBS modeling is designed as a hierarchical structure using three key elements: “work type” (e.g., pipeline installation), “pipe material,” and “pipe diameter.” Each lowest-level node contains information on labor and equipment, with attributes defined as type, cost, and count. The type attribute specifies the job category or equipment type, the cost attribute denotes the corresponding wage rate or equipment unit cost, and the count attribute represents the number of workers or equipment units allocated to the task. This structure formalizes detailed resource input information at the task level, thereby improving the accuracy of cost estimation and resource planning.
The primary data sources for CBS modeling are the 2025 Standard Construction Cost Norms and the 2025 First Half Construction Wage Survey Results [36,37]. Based on the labor and equipment input standards for each process defined in the cost norms, a JSON structure was implemented in conjunction with wage rates that include daily unit costs by job type. This allows automatic calculation of required labor and equipment quantities and daily costs for each process once the basic information, such as pipeline type, diameter, number of units, and task name, is entered.

6.3.2. Detailed Cost Generation Through WBS–CBS Integration

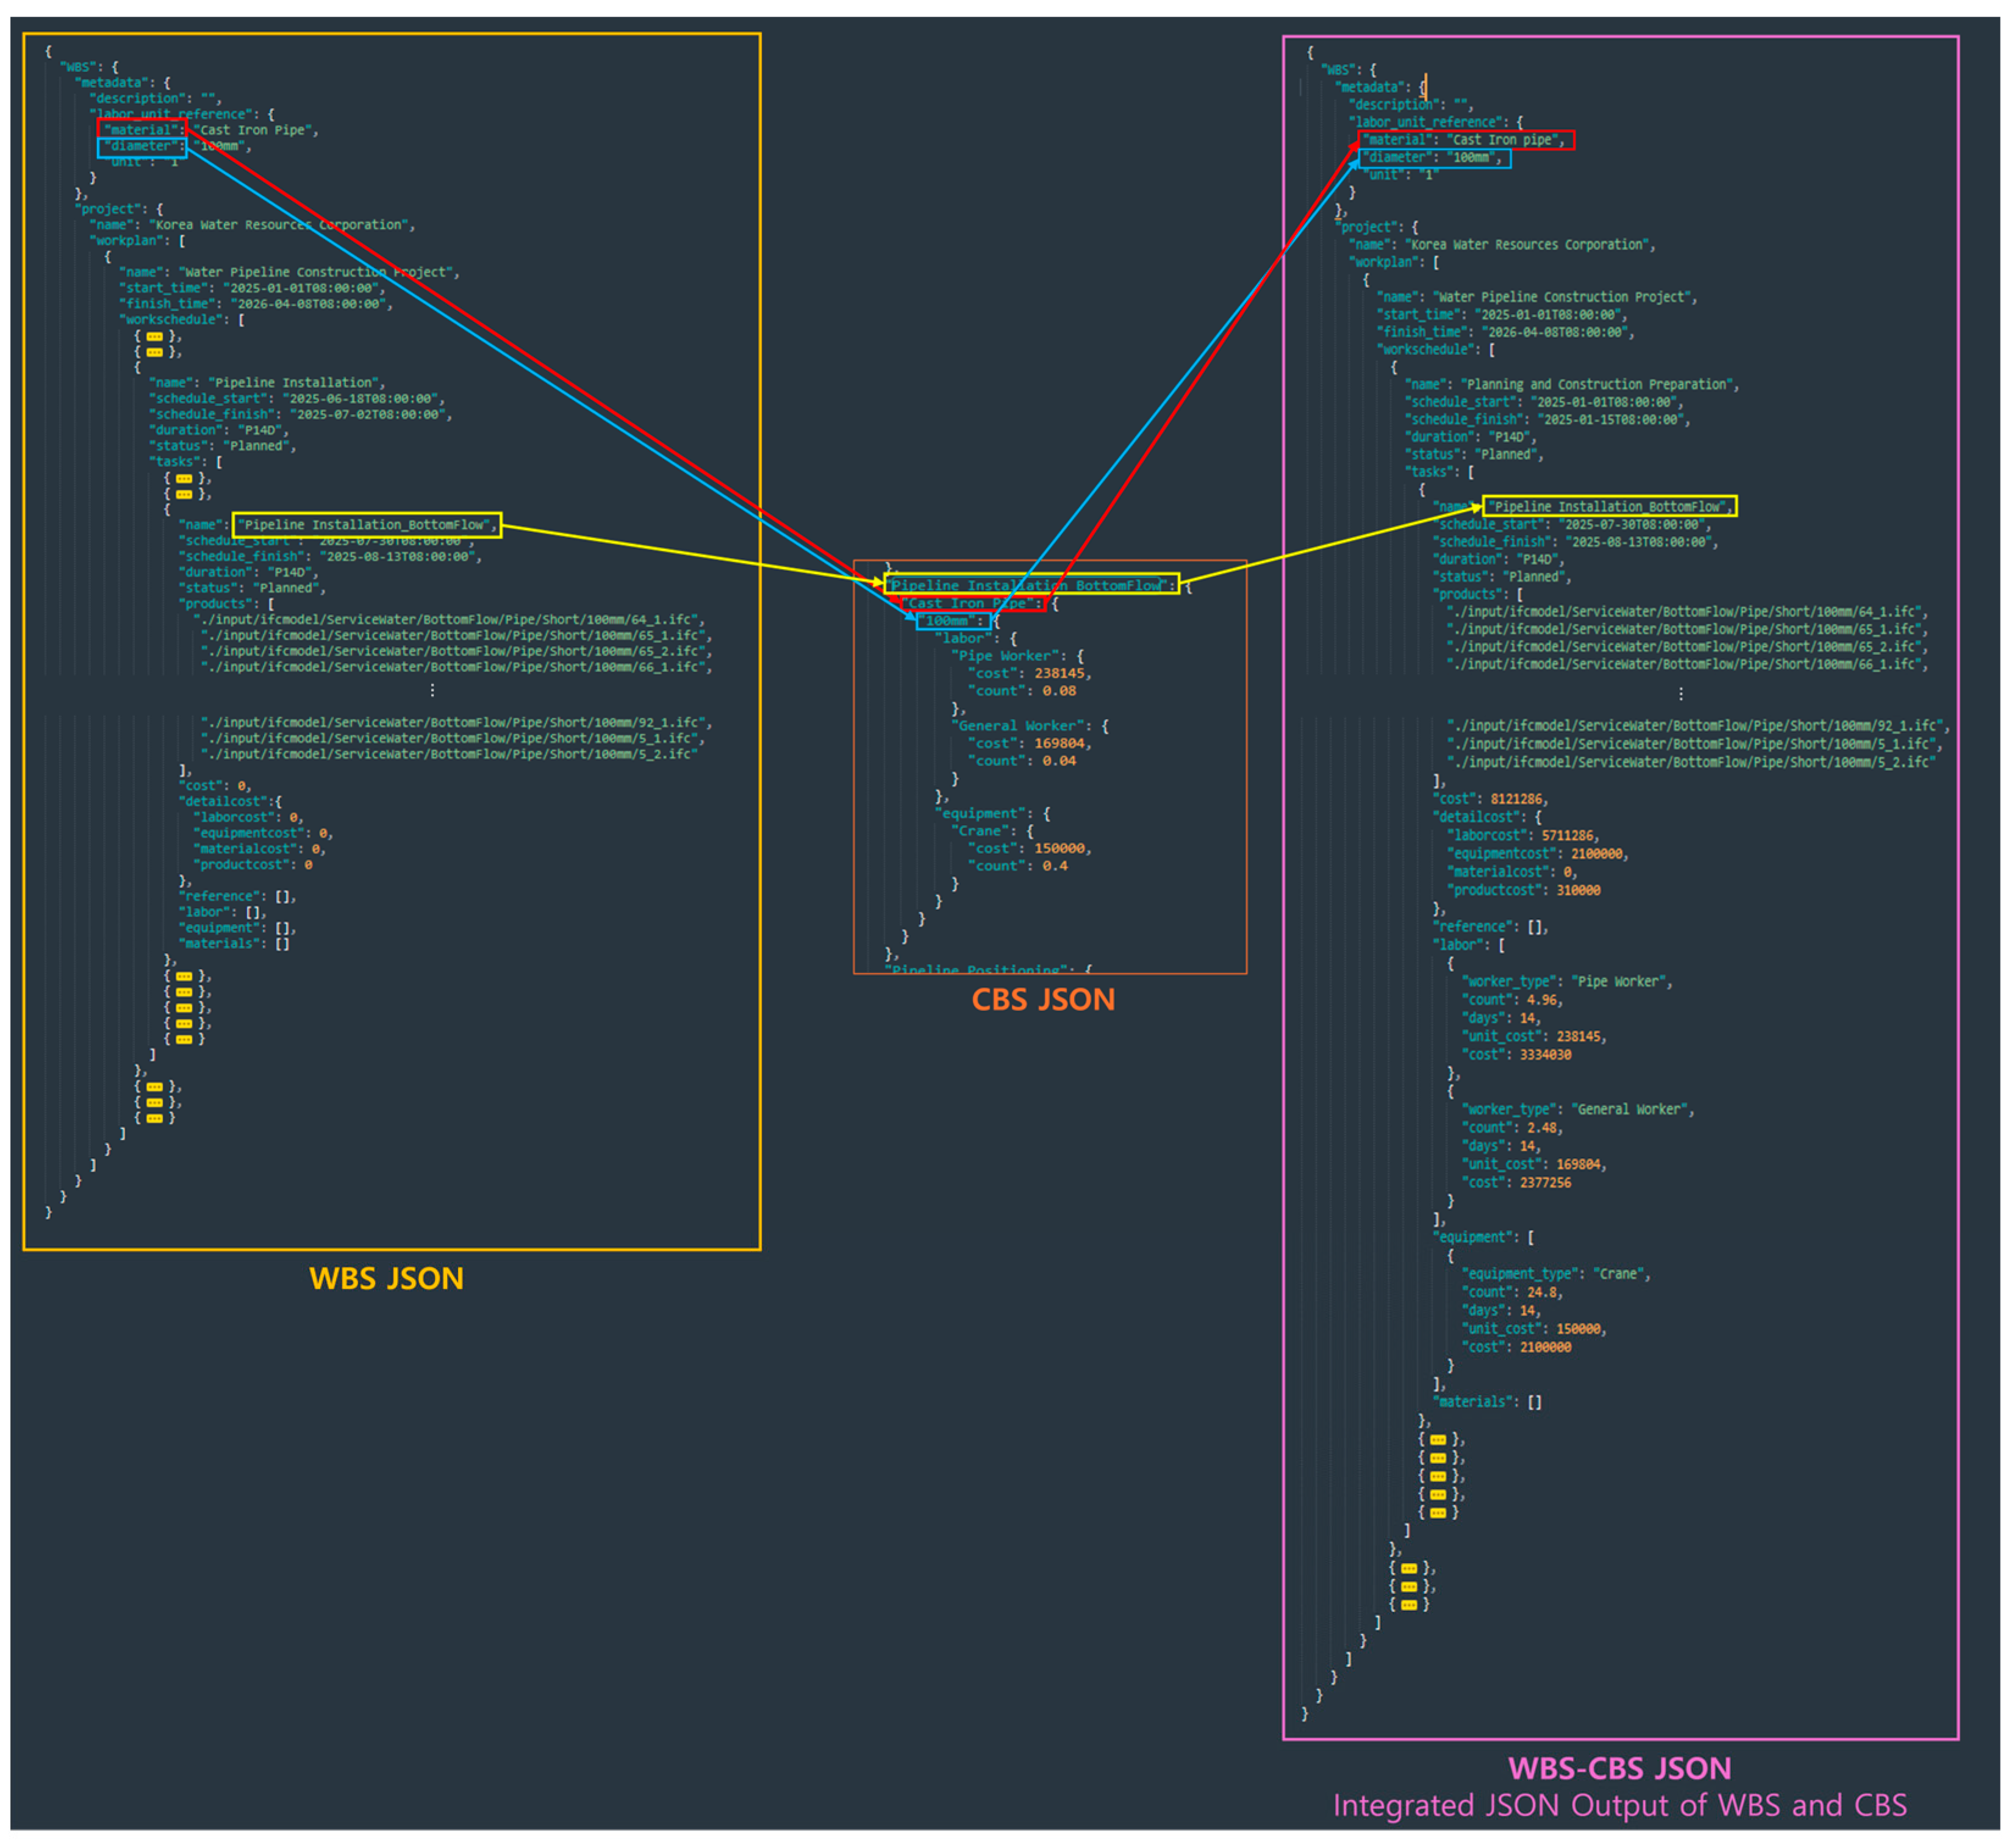
The integration of WBS and CBS is performed by matching tasks using common keys such as task name, pipe material, and pipe diameter across the two JSON datasets. The procedure is carried out as follows. First, each Task in the WBS extracts task name, material, and diameter data to generate a matching key, which is then used to locate the corresponding node in the CBS. Second, the labor and equipment items of the matched CBS node are retrieved, and their type, count, and cost attributes are added to the WBS Task. Third, the number of working days, calculated from Task.start and Task.finish, is multiplied by the resource data to compute the cost of each item.
The final cost is calculated using example 1 of an equation:
Final cost = unit quantity per pipeline × number of pipelines × unit price × number of working days
The resulting values are reflected in the WBS under cost and detailCost fields, which include total values as well as breakdowns such as labor, equipment, material, and supply costs. Figure 12 shows an example of how WBS and CBS modeling data are integrated using matching keys to calculate detailed costs and extract unified data.
The cost-integrated WBS–CBS JSON is formally linked to each task during IFC conversion. The IfcRelAssignsToControl relationship is used to associate IfcCostSchedule objects with IfcTask. Under the IfcCostSchedule, IfcCostItem objects (e.g., labor, equipment, material, and product categories) are generated, and the actual monetary values of each item are stored in IfcCostValue as processed cost data. Through this process, schedule information (e.g., IfcTask and IfcTaskTime) and cost information (e.g., IfcCostSchedule, IfcCostItem, and IfcCostValue) are consistently integrated within the IFC structure. Figure 13 illustrates the process of linking JSON-based WBS and CBS modeling data and integrating them with BIM objects.
In addition, when costs calculated at the facility level (e.g., pipelines, manholes) are aggregated at the task level, the total task cost is computed by summing the cost values of multiple products and reflecting the result in IfcCostItem and IfcCostValue. This approach provides the advantage of allowing estimated costs to be immediately reviewed during the design stage simply by adding new facilities, and it can be used in conjunction with automated calculation logic based on standard cost norms and wage rates.
Through the above procedure, a single IFC file integrating WBS, CBS, and IFC is generated, enabling unified access and management of geometry, attributes, progress status, and detailed costs (detailCost) for each task. This ensures continuity across schedule, cost, and geometry data, thereby improving project transparency and decision-making efficiency, and ultimately enabling practical implementation of 5D BIM as an extension of 4D BIM.

6.4. IFC Viewer Prototype Implementation and Accuracy Verification of the Proposed Technology

6.4.1. Prototype Implementation

The prototype developed in this study includes an automated function that generates 3D BIM objects by utilizing the location, geometry, and attribute information of underground utilities extracted from 2D CAD drawings and structured in GeoJSON format. This system integrates JSON-based process (WBS) and cost (CBS) modeling data, ultimately implementing a unified conversion technology that expands the model into 5D BIM objects. Furthermore, the generated 5D BIM objects are stored in IFC format and visualized through a dedicated IFC viewer developed in parallel, thereby enabling validation and assessment of the applicability of the proposed technology. Table 6 presents the libraries used for the development of the 5D BIM object conversion module and the IFC viewer.
The 5D BIM object conversion technology was implemented as a Python-based module (Python Version 3.13.2.), while the IFC viewer was developed in C#. The three-dimensional visualization functionality of the viewer was implemented using XBIM, an open-source BIM library. The IFC viewer was employed to visualize IFC files generated by the 5D object conversion module developed in this study and to verify the applicability and validity of the proposed conversion technology.
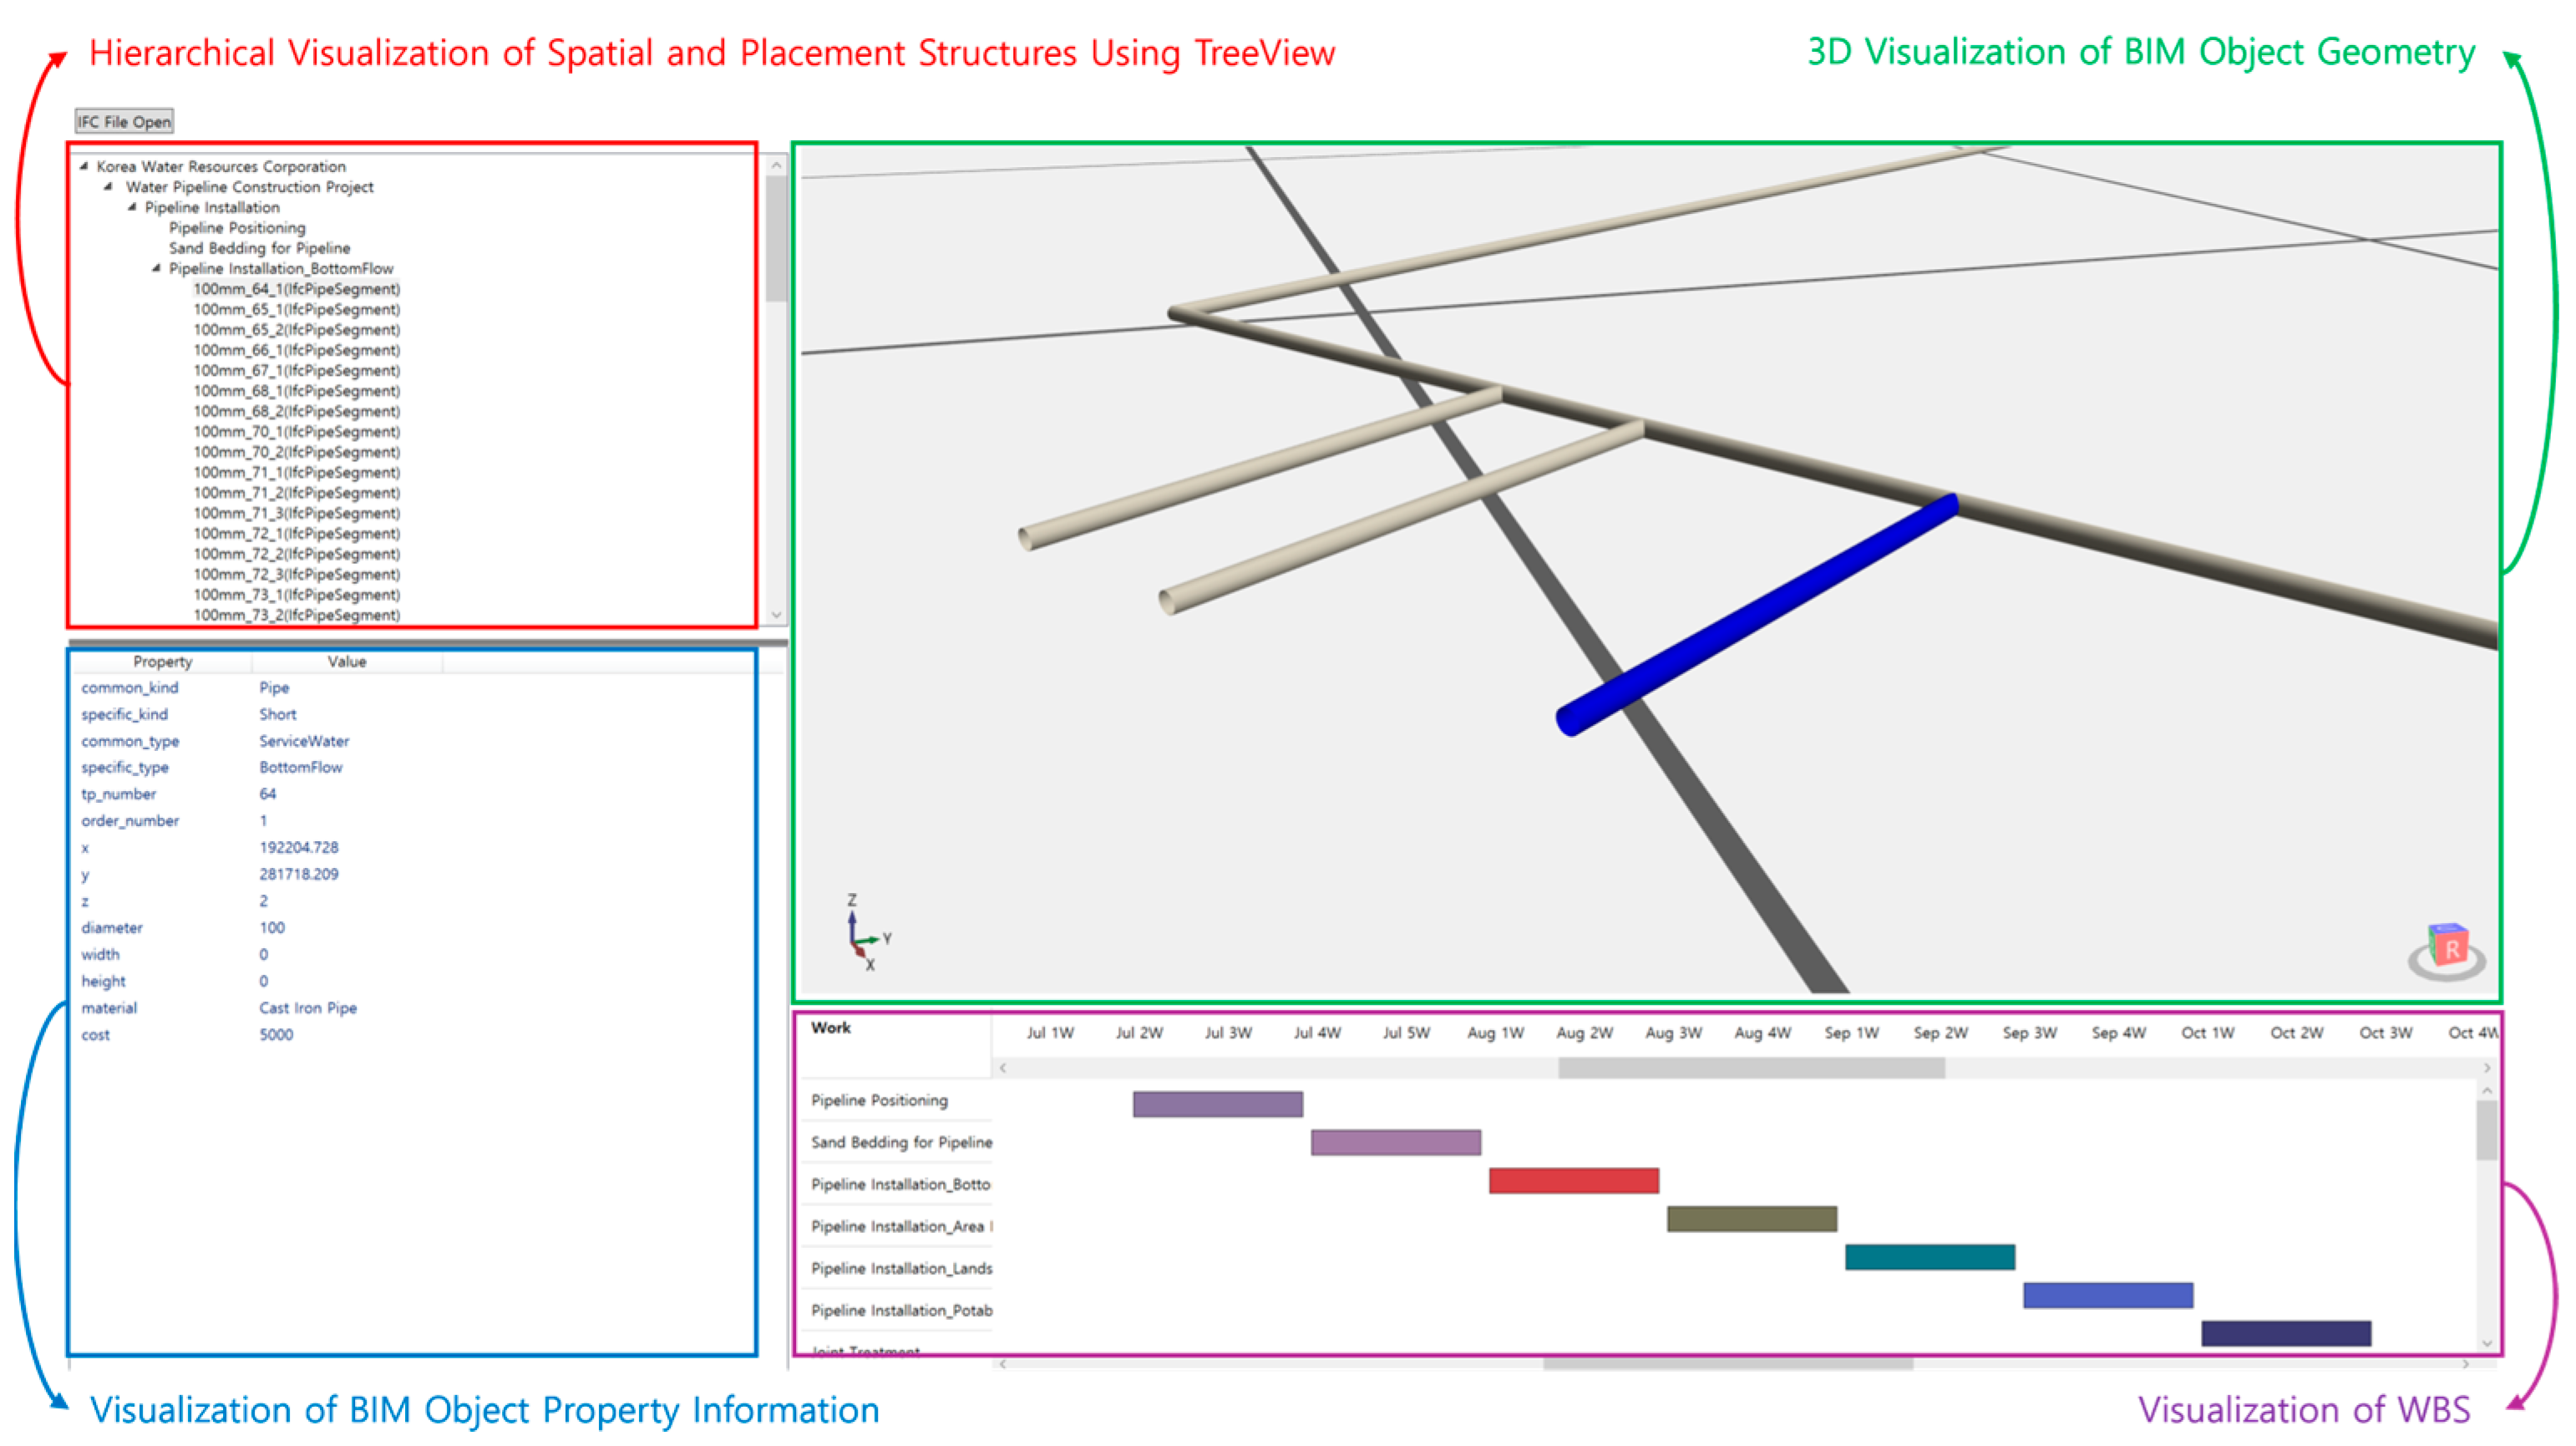
Figure 14 shows the overall interface layout of the IFC viewer, which consists of four main areas. The upper-left area provides a TreeView interface that enables users to structurally navigate IFC file information based on spatial and placement structures, with hierarchical organization aligned with WBS process sequences. The upper-right area displays BIM objects in three-dimensional space, allowing users to intuitively explore the model. The lower-left area presents geometry and attribute data of selected BIM objects, which are automatically updated when an object is selected in either the tree structure or the 3D model view. The lower-right area visualizes WBS modeling information, specifically task and schedule start and end dates, in a Gantt chart format, enabling users to quickly review the overall process flow.

6.4.2. Validation Method

For validation, Sublime Text editor was used to inspect the JSON-based input data. The IFC files of BIM model were reviewed using both the commercial Autodesk Viewer and the dedicated IFC viewer developed in this study. The Autodesk Viewer was employed to examine the visual consistency between the 3D BIM objects generated by the proposed method and the original 2D CAD drawings. However, since Autodesk Viewer has functional limitations in representing 4D and 5D BIM information, a custom IFC viewer was implemented using the C#-based WPF framework and the xBIM Toolkit. This enabled effective inspection and validation of 5D BIM data that included both WBS and CBS information.
For underground utility data structure validation, the basic IFC hierarchy (IfcProject–IfcSite–IfcBuilding) was checked to ensure that objects were correctly linked through the IfcRelAggregates class. Initial reviews were performed using Autodesk Web Viewer, followed by verification through the TreeView function of the dedicated IFC viewer to confirm accurate visualization of the hierarchy.
For attribute validation, it was confirmed that attribute information extracted from GeoJSON or original drawings was mapped without loss into IfcPropertySet and IfcPropertySingleValue. The outputs generated during the 5D BIM object creation process (GeoJSON, WBS JSON, CBS, WBS–CBS JSON) were displayed in parallel with the data shown in Autodesk Viewer and the IFC viewer to compare consistency with the source data.
For schedule validation, time information such as task start date, end date, and duration defined in IfcTaskTime objects was compared against the schedule data in WBS JSON through timeline visualizations similar to Gantt charts.
For task–object mapping validation, it was verified that IfcTask objects and their corresponding BIM objects were accurately linked via the IfcRelAssignsToProcess class. The connected objects were checked in the 3D viewer to confirm correct visualization and consistent display of geometry and attribute information.
Finally, for cost validation, it was confirmed that IfcCostSchedule, IfcCostItem, and IfcCostValue objects assigned to tasks were correctly created and referenced, thereby ensuring proper implementation of the integrated structure between tasks and costs.

6.4.3. Validation Results

The most critical factor in digital transformation technology is the accuracy of data conversion. When design data are transformed into different formats, no loss or omission of information should occur; thus, precise and reliable data conversion serves as a key indicator of technological credibility. Accordingly, this study set the accuracy of the data conversion process as a primary validation target.
To verify the reliability of attribute transformation, the accuracy of attribute data entered during the automated generation of 5D BIM objects was evaluated. In particular, the quantitative accuracy of GeoJSON data extraction from CAD drawings was previously verified through a certified software test conducted by the Korea Testing & Research Institute (KTR) [23]. In that test, 20 random pipeline objects were selected from a 2D CAD drawing (BIM_sample.dxf), and their coordinate and attribute consistency were examined. The results demonstrated a 100% data match rate, and overlay verification using QGIS confirmed complete alignment between the CAD and GeoJSON layers. These certified test results provide objective evidence supporting the accuracy and reliability of the GeoJSON conversion technology adopted in this study.
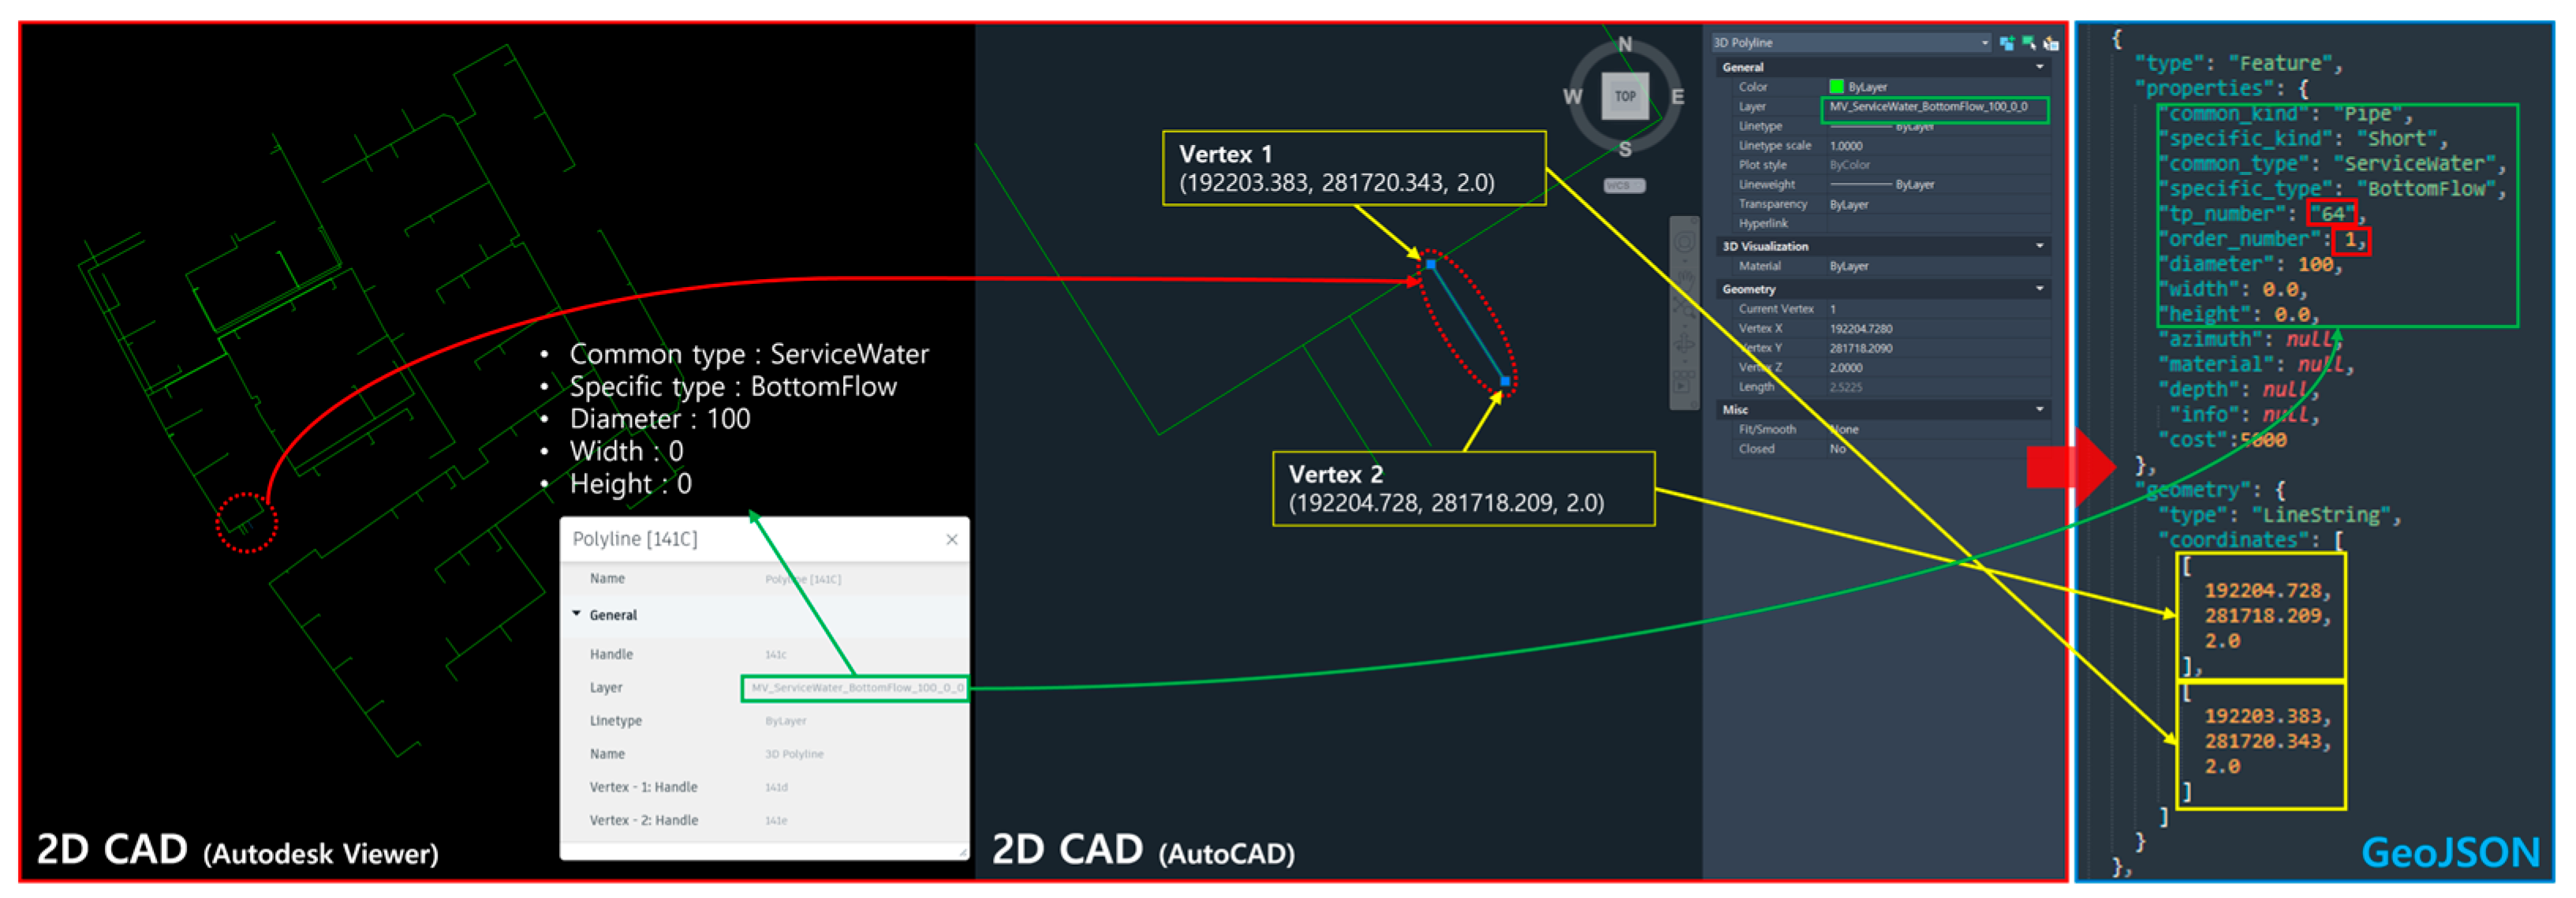
Furthermore, the underground utility information depicted in the drawings was compared with the corresponding GeoJSON data generated from them, as shown in Figure 15. The comparison confirmed that the location, geometry, and attribute information in the drawings were fully and correctly reflected in the properties and geometry fields of the GeoJSON data. This further demonstrates the reliability of the GeoJSON-based attribute transformation process.
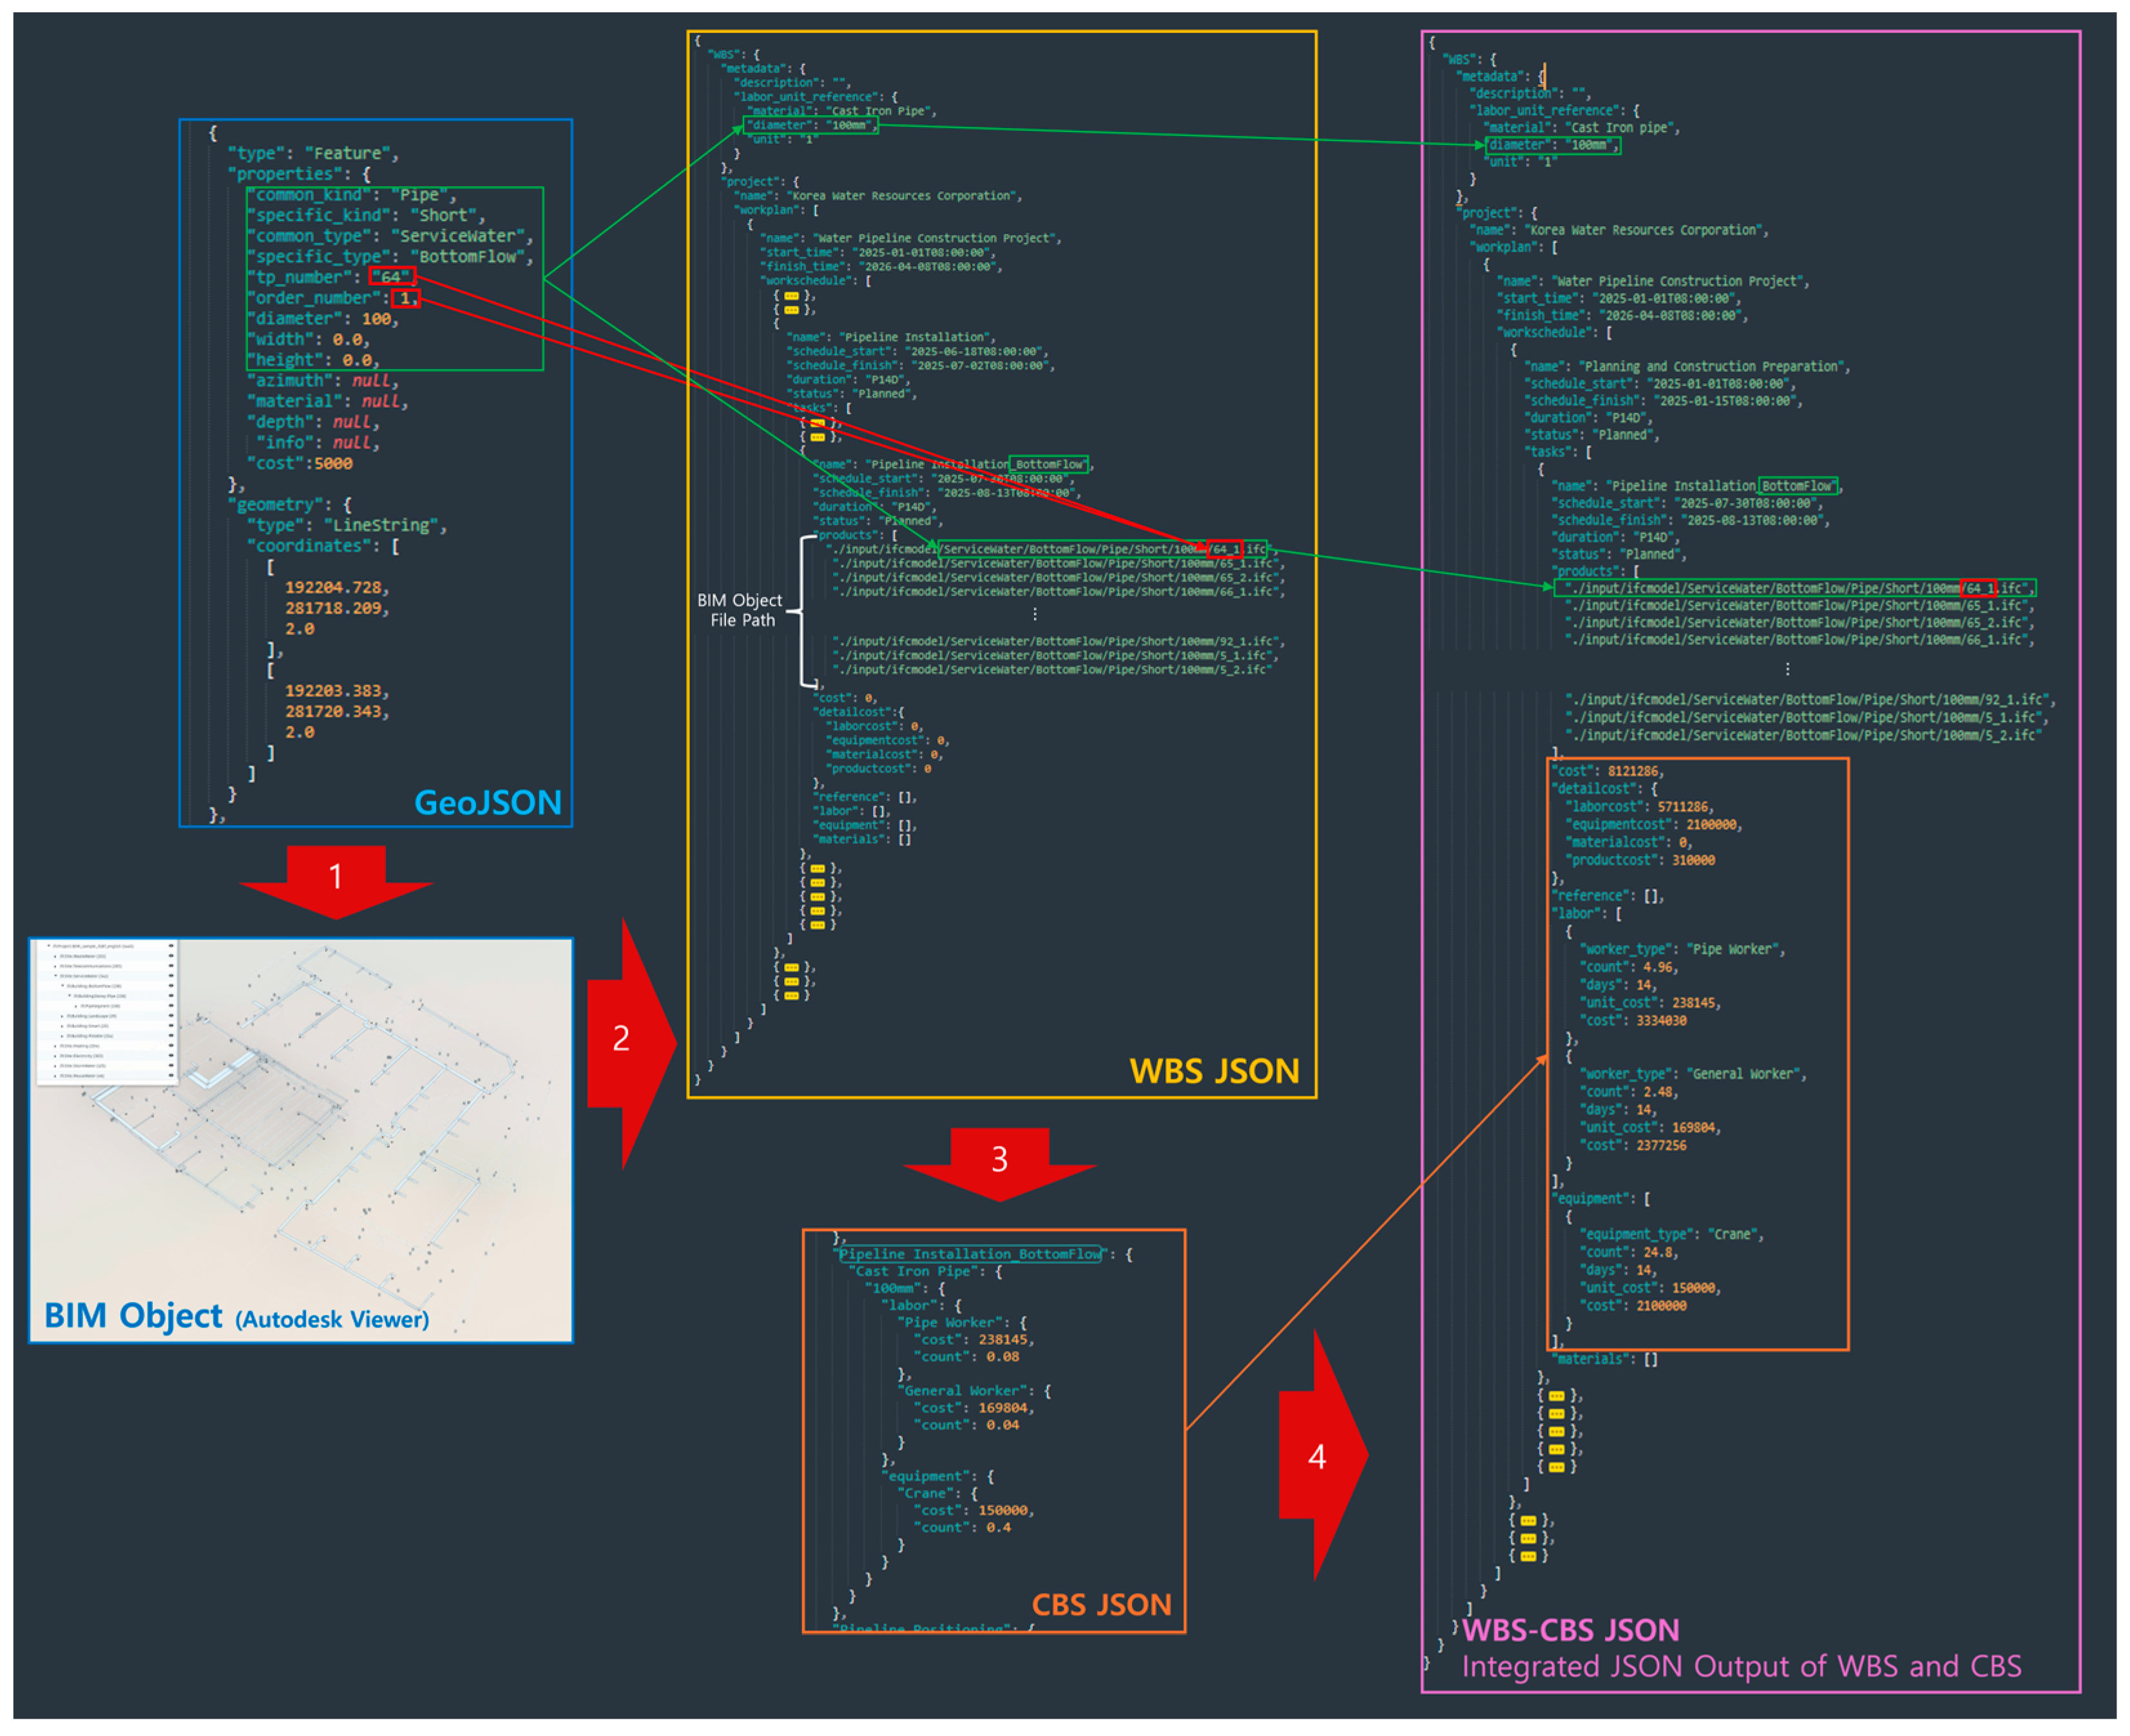
Subsequently, the accuracy of the intermediate JSON data generated during the BIM object creation process based on GeoJSON was verified. Figure 16 illustrates the verification results of the process that converts the processed GeoJSON data from CAD drawings into 3D BIM objects in IFC format (Step ①) and simultaneously depicts the integration procedure of WBS and CBS JSON data.
Through this verification, the integration process of geometry and attribute information for underground utility objects based on JSON data was visually confirmed, and it was verified that all attribute information was completely and correctly generated without any omission.
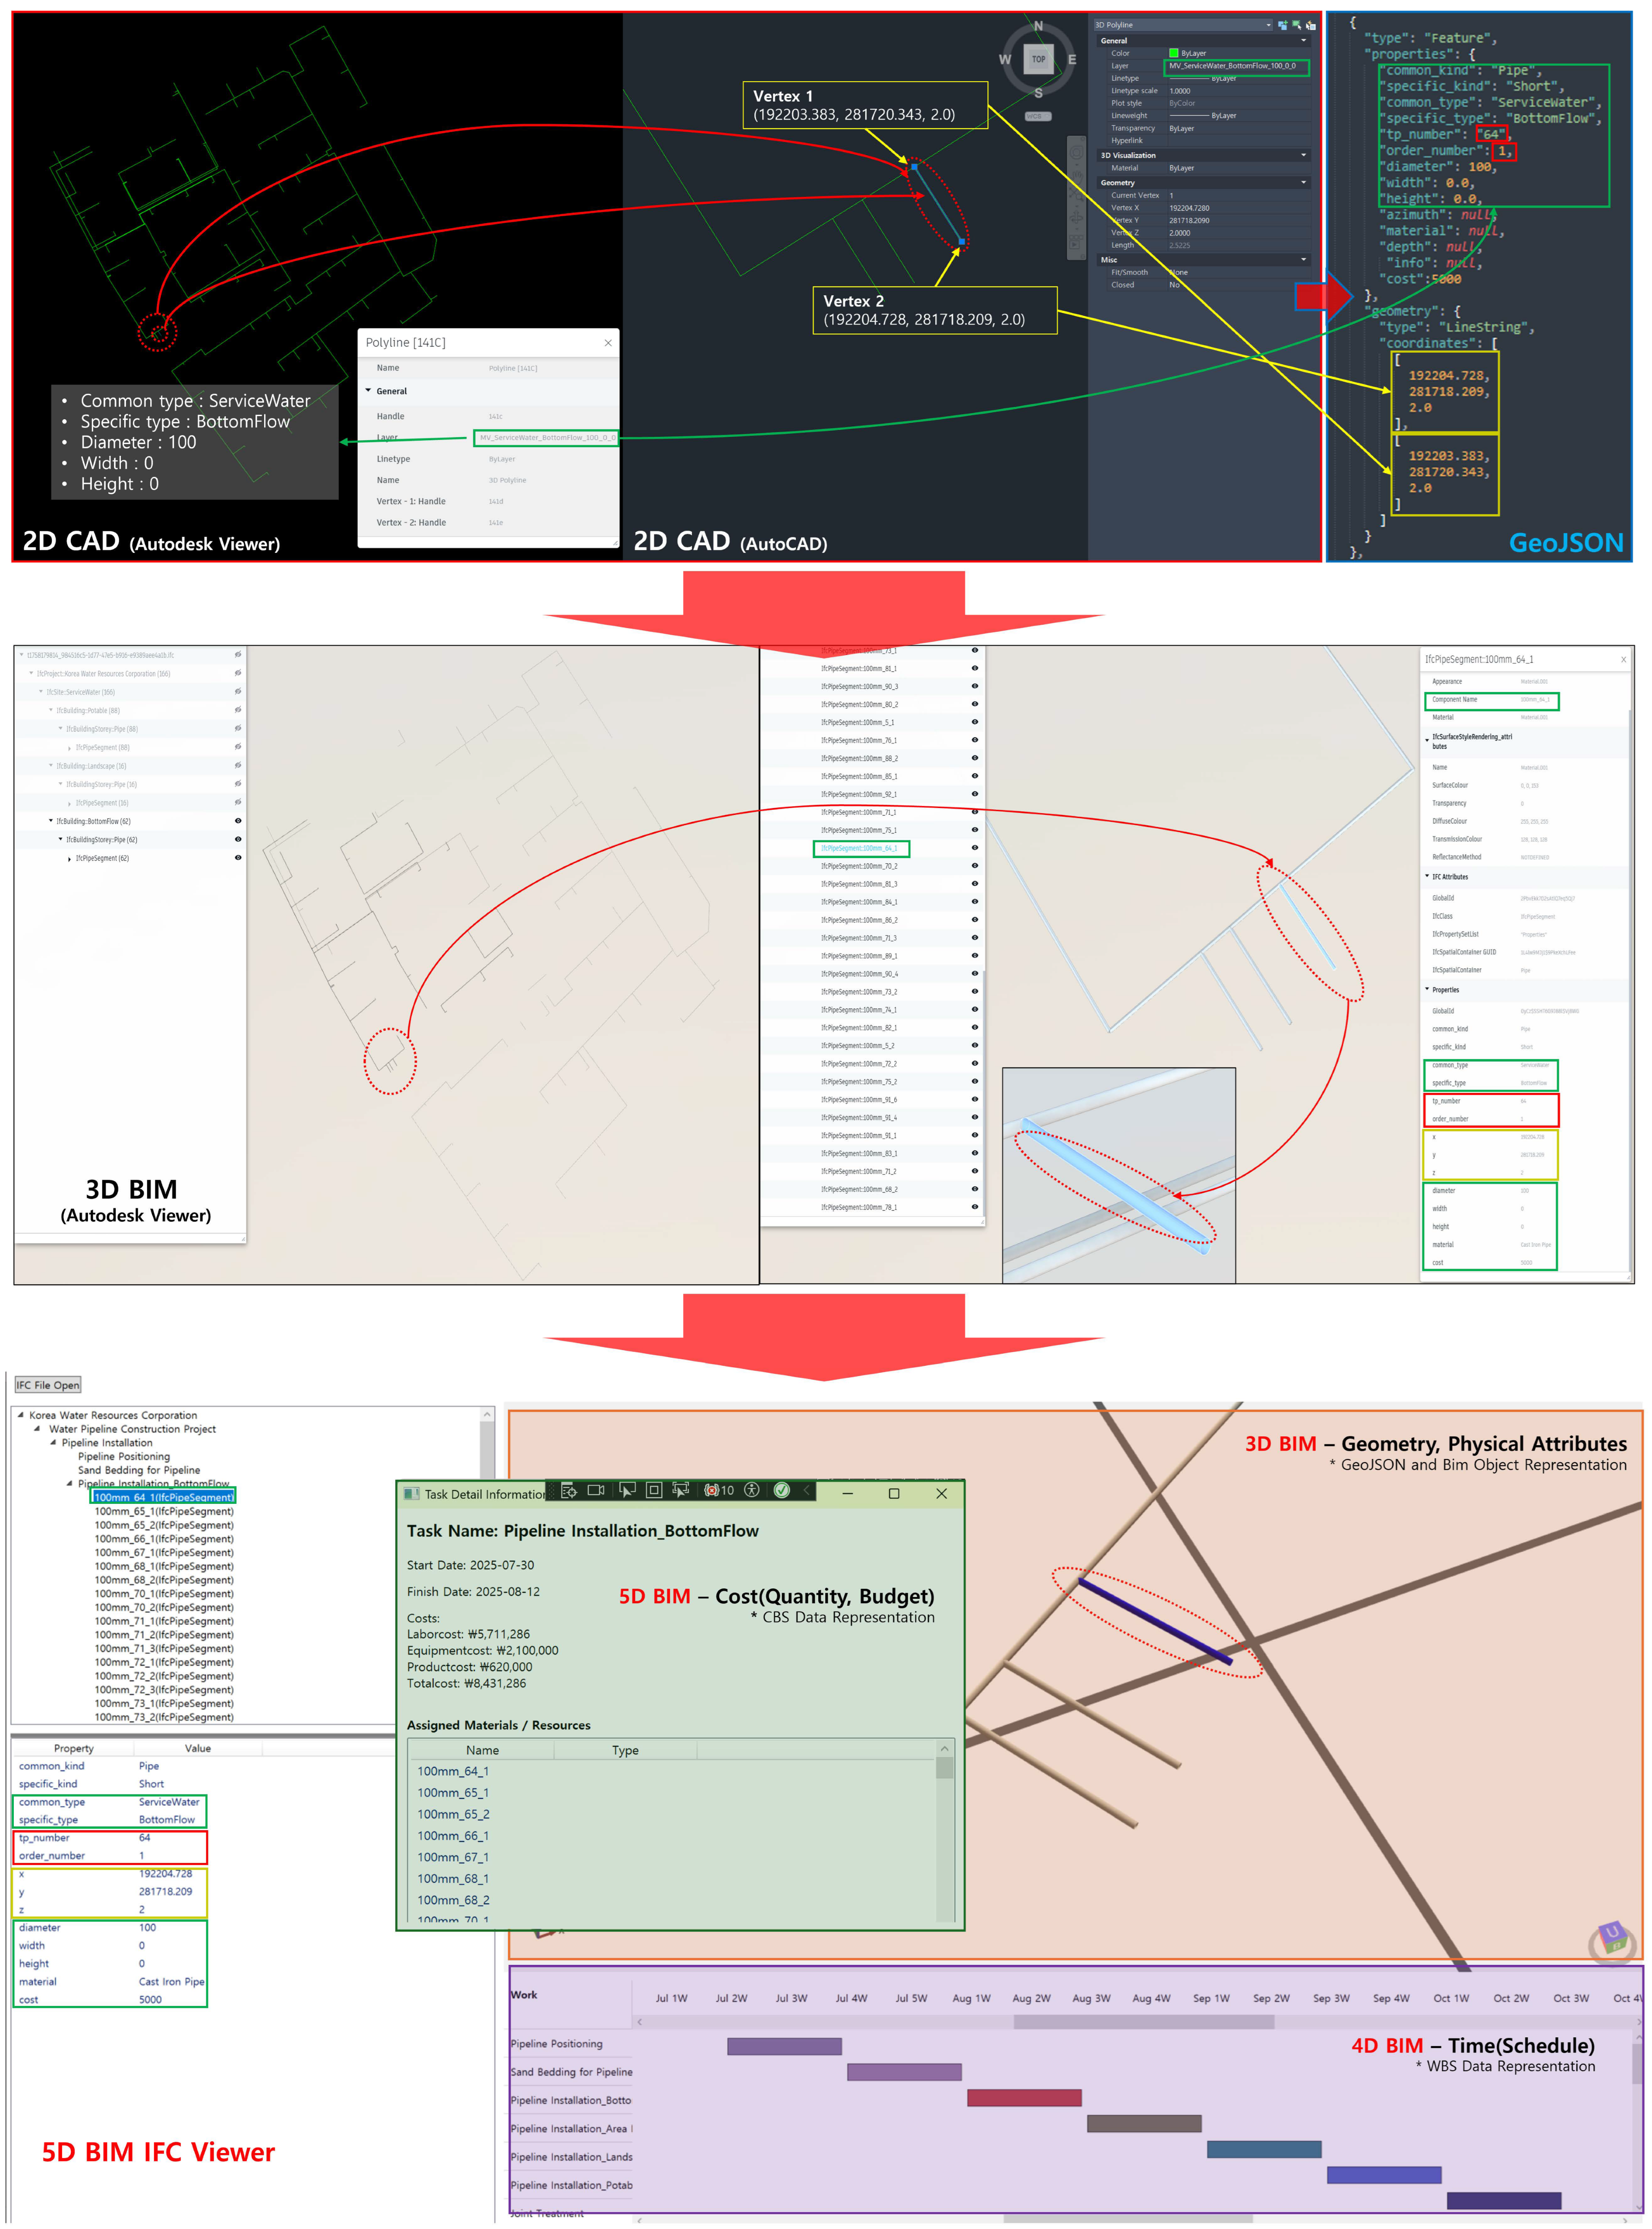
Finally, a comprehensive validation was conducted on the 5D BIM objects generated through the integration of WBS and CBS JSON data. Using Autodesk Viewer and the IFC Viewer developed in this study, it was verified that the structure hierarchy, tasks, schedules, and linkages among BIM objects were accurately represented, as shown in Figure 17.
In particular, a comparison between the original 2D CAD drawings and the WBS–CBS JSON data confirmed that the geometry, construction schedule, and cost information of underground utilities were consistently reflected and traceable within the BIM model.
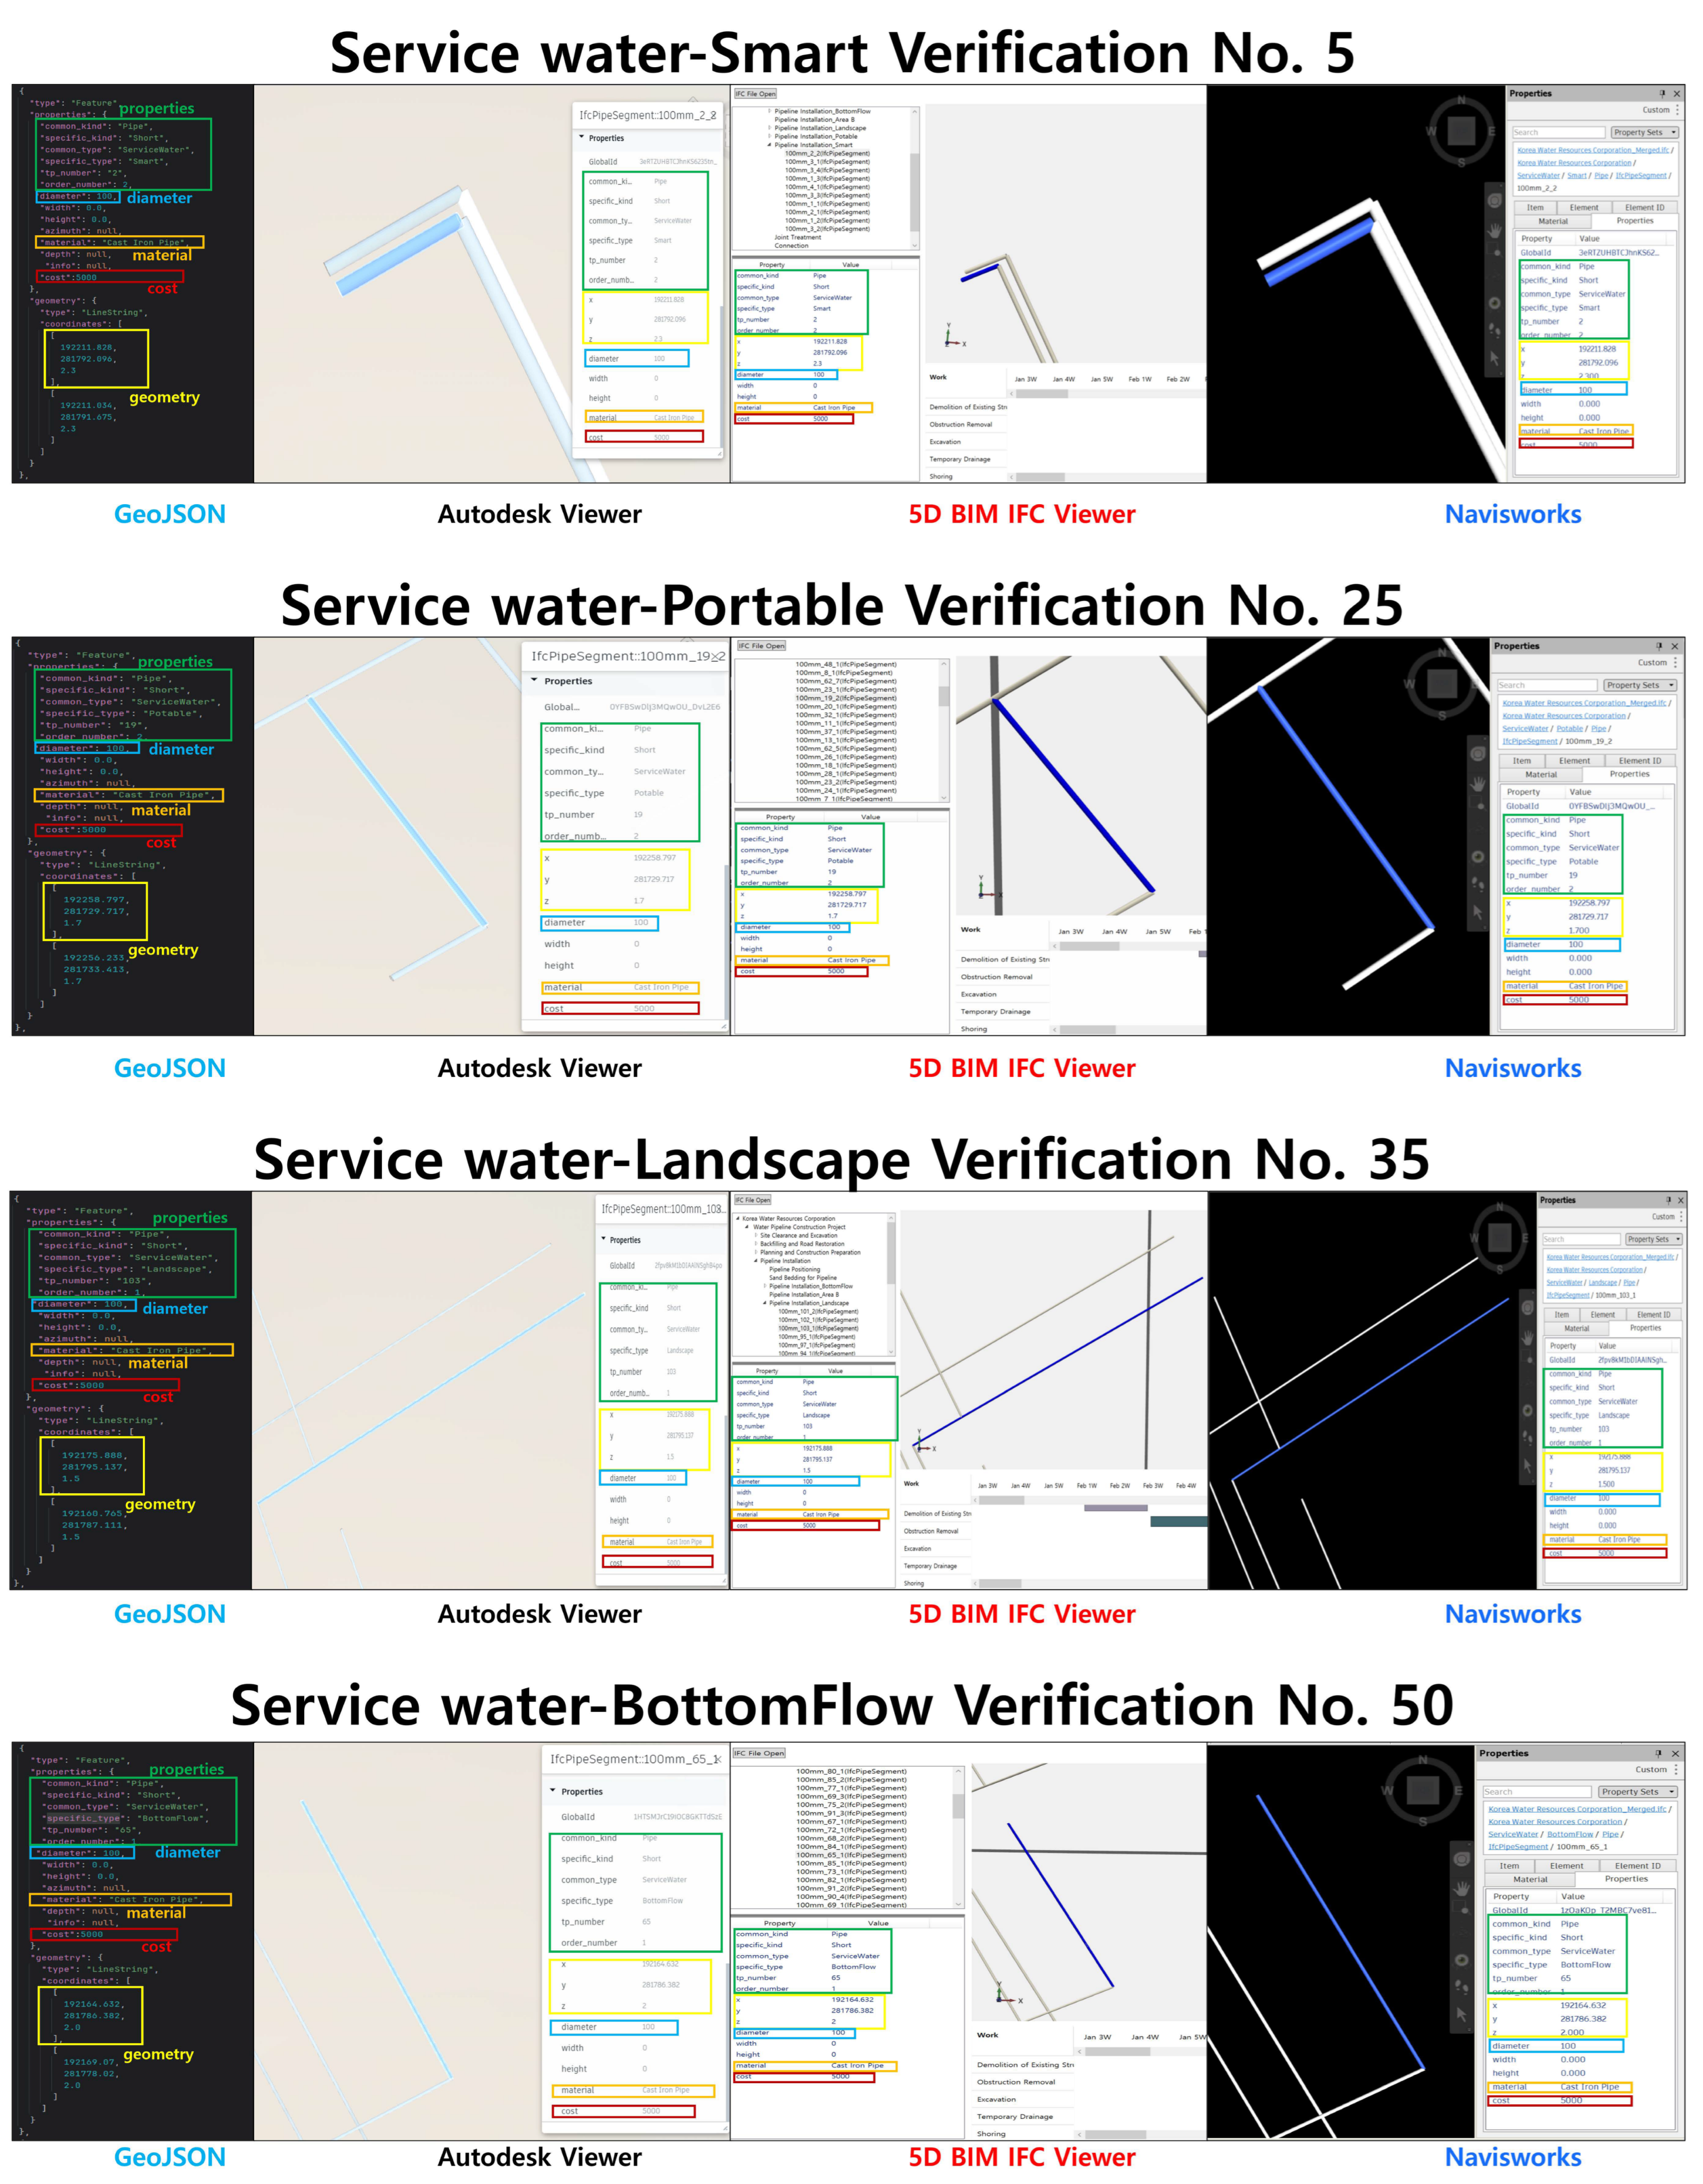
Figure 18 illustrates the validation process conducted to verify whether any data loss occurred during the data conversion and processing stages. A total of 50 sample objects were randomly selected from the final processed dataset to examine potential information loss during transformation. The validation focused on four specific types of service-water pipelines (SMART, Portable, Landscape, and BottomFlow) and compared five data attributes: properties, diameter, material, geometry, and cost. The converted BIM data were evaluated against the GeoJSON dataset as the reference, using Autodesk Web Viewer, Navisworks, and the custom-developed 5D BIM IFC Viewer to compare coordinate and attribute information.
The figure presents a subset of representative samples among the 50 validation objects to visually demonstrate the comparison process. The results showed 100% consistency with no data omission or distortion across all viewers, confirming the accuracy and data integrity of the proposed data conversion and integration process.
Table 7 summarizes the validation procedure and results.
The validation results demonstrate that the proposed CAD-to-5D BIM automation process inherits the proven accuracy of existing 3D conversion techniques, while extending the workflow to the 5D level through the integration of WBS and CBS data. This approach goes beyond simple process improvement and contributes to enhancing practical data interoperability between BIM and GIS, providing a significant engineering advancement for the digital transformation of underground utility management.

6.4.4. Computational Performance Evaluation

The overall data conversion process consists of three sequential modules: the 3D Spatial Data Extractor Module, the 3D BIM Generator Module, and the 5D BIM Integrator Module. Each module is executed in order, generating output files in GeoJSON, 3D IFC, and 5D IFC formats, respectively. The detailed workflow of each stage is illustrated in Figure 1.
To evaluate the computational performance of the proposed framework, the execution time for each conversion stage was measured ten times using the same drawing dataset. The results are summarized in Table 8. All experiments were conducted on a system equipped with an Intel® Core™ Ultra 7 155H (3.80 GHz) processor, 32.0 GB RAM, and a 64-bit operating system.
The evaluation results demonstrate that the proposed technology achieved stable and reproducible computational performance across all ten trials. The total average processing time was approximately 227,123 ms (≈227.1 s), with a standard deviation below 3%, indicating that the process operates deterministically with minimal variation between executions.
Among the three stages, Step 2 (GeoJSON → 3D IFC conversion) accounted for approximately 98.6% of the total processing time, confirming that this phase represents the primary computational bottleneck. This is attributed to the complex operations involved in IFC object generation, including geometric reconstruction, topological structuring, and schema validation.
In contrast, Step 1 (DXF → GeoJSON) and Step 3 (5D IFC integration) consumed only about 0.5% and 0.9% of the total time, respectively, indicating that these are relatively lightweight processes.
These results demonstrate that the overall transformation process achieves practical computational efficiency, enabling automatic conversion of real-world-scale design datasets within four minutes.
Furthermore, the minimal variation between repeated executions confirms that the proposed system is designed as a stable and scalable automated conversion engine suitable for large-scale or batch-processing environments.

7. Conclusions

This study proposed an automated process that extracts location, geometry, and attribute information from standardized 2D CAD drawings, converts them into 3D BIM objects in IFC format through GeoJSON, and integrates WBS (work) and CBS (cost) data to construct a unified 5D BIM.
The proposed framework resolves data fragmentation between the design and construction phases and enables consistent management of the entire process—from drawing-based design to schedule planning and cost estimation—within a single IFC file. In particular, by adopting IfcWorkPlan, IfcTaskTime, IfcCostSchedule, and IfcProduct entities, a practical data management structure was established to integrate geometry, schedule, cost, and time information.
Validation confirmed that GeoJSON data were accurately converted and processed into IFC format without any omission or distortion. For fifty sample objects, positional, geometric, attribute, and cost data were compared, showing a 100% consistency rate. Cross-validation using Autodesk Web Viewer, Navisworks, and a custom IFC viewer also verified that all data precisely matched the original drawings. These results demonstrate that the proposed conversion and integration process ensures complete data integrity.
The engineering contributions of this study are as follows.
First, it provides a practical transition path that allows designers to continue working in a familiar 2D CAD environment while automatically generating 3D, 4D, and 5D deliverables. This reduces dependence on specialized BIM modeling skills and enables designers and field engineers to produce BIM-based outputs without costly software licenses or extensive training.
Second, as BIM technology becomes increasingly widespread across industries, many organizations face high costs for system adoption and retraining. The proposed approach serves as an efficient alternative that minimizes both system implementation and training costs by automatically generating BIM results while maintaining existing 2D design workflows.
Third, by adopting open standard formats such as GeoJSON and IFC, along with open-source tools, the framework reduces implementation costs and allows BIM data to be automatically updated whenever drawings are revised. This approach ensures consistency and currency between drawings and BIM model, while maintaining interoperability between BIM and GIS environments.
Lastly, by integrating geometric, schedule, and cost information within a single IFC model, the framework enhances project transparency and supports efficient data-driven decision-making in practical applications.
The limitations and applicability (Threats to Validity) of this study are as follows. The proposed process assumes standardized 2D CAD drawings; therefore, the accuracy of conversion may be reduced when using irregular or incomplete drawings. In addition, the current GeoJSON schema has limited capability to fully represent complex fittings or multi-geometry objects, and the WBS–CBS integration model operates on a static calendar basis. These limitations will be addressed in future studies through automated data preprocessing, enhanced object representation, and dynamic schedule–cost modeling extensions.
Future research will extend the proposed 5D BIM framework toward 6D (performance) and 7D (operation and maintenance) dimensions, incorporating lifecycle management capabilities that integrate long-term deformation monitoring, maintenance records, and sensor data. In addition, interoperability validation will be expanded through multi-project and multi-asset performance testing.
To advance the framework, additional functions will be implemented. The IFC4.3 Alignment and LinearPlacement entities will be applied to extend the approach to linear infrastructures such as roads and tunnels. A rule-based topological quality assurance (QA) layer will be introduced to detect spatial inconsistencies such as gaps, overlaps, and disconnections in advance. Furthermore, BCF (BIM Collaboration Format)–based issue management functions will be added to support collaborative design review and transparent version tracking.
These advancements will serve as a technical foundation for evolving the proposed CAD-to-IFC approach into a comprehensive and highly interoperable smart infrastructure management framework.
In conclusion, this study demonstrated a practical transition from 2D design to automated 3D, 4D, and 5D generation, presenting a quantitatively validated CAD-to-5D BIM pipeline that integrates geometry, schedule, and cost data without loss. The proposed approach accelerates the digital transformation of underground utilities and proves its practical applicability as a data-centric management framework characterized by low cost, high accuracy, and strong interoperability.
Author Contributions

Conceptualization, J.L.; methodology, J.L. and S.L.; software, J.L. and S.L.; validation, J.L. and S.L.; formal analysis, Y.K.; investigation, J.L. and S.L.; resources, Y.K.; data curation, Y.K. and S.L.; writing—original draft preparation, J.L. and S.L.; writing—review and editing, I.-Y.M.; visualization, J.L. and S.L.; supervision, I.-Y.M.; project administration, I.-Y.M.; funding acquisition, J.L. All authors have read and agreed to the published version of the manuscript.

Funding

This research was supported by the Korea Industrial Technology Association (KOITA), grant funded by the Ministry of Science and ICT (MSIT), Republic of Korea, under the project “Program for Fostering Cooperative and Convergent Commercialization of Science and Technology.”.

Data Availability Statement

The data presented in this study are available from the corresponding author upon reasonable request.

Acknowledgments

The authors would like to acknowledge the support of the Ministry of Science and ICT (MSIT) of the Republic of Korea and the Korea Industrial Technology Association (KOITA) through the project “Program for Fostering Cooperative and Convergent Commercialization of Science and Technology.” Their administrative and institutional support greatly facilitated this research.

Conflicts of Interest

The authors declare no conflicts of interest. The funders had no role in the design of the study; in the collection, analyses, or interpretation of data; in the writing of the manuscript; or in the decision to publish the results.

References

  1. Wikipedia Contributors. Infrastructure. Wikipedia, The Free Encyclopedia. 2025. Available online: https://en.wikipedia.org/wiki/Infrastructure (accessed on 21 July 2025).
  2. Wikipedia Contributors. Hard Infrastructure. Wikipedia, The Free Encyclopedia. 2025. Available online: https://en.wikipedia.org/wiki/Hard_infrastructure (accessed on 21 July 2025).
  3. Unger, J.; Cirolia, L.; Rode, P. Urban Infrastructure and Development: Sectoral Classification (Water, Energy, Transport, Communication, Waste). LSE Cities Working Paper. 2019. Available online: https://www.lse.ac.uk/cities/Assets/Documents/Working-Papers/Urban-infrastructure-and-development-Jan2019.pdf (accessed on 21 July 2025).
  4. Elbasha, A.M.; Abdellatif, M.M. Smart Road Traffic Monitoring: Unveiling the Synergy of IoT and AI. 2025. Available online: https://dl.acm.org/doi/full/10.1145/3729217 (accessed on 21 July 2025).
  5. MarketsandMarkets. Smart Water and Wastewater Management Market Size, Share & Industry Analysis, 2023–2030; MarketsandMarkets: Pune, India, 2023; Available online: https://www.marketsandmarkets.com/Market-Reports/smart-water-management-market-1265.html (accessed on 21 July 2025).
  6. Grand View Research. Utility Infrastructure Market Size, Share & Trends Analysis Report, 2023–2030; Grand View Research: San Francisco, CA, USA, 2023; Available online: https://www.grandviewresearch.com/industry-analysis/utility-asset-management-market-report (accessed on 21 July 2025).
  7. United Nations. World Population Prospects 2022; Department of Economic and Social Affairs, Population Division, United Nations: New York, NY, USA, 2022; Available online: https://www.un.org/development/desa/pd/sites/www.un.org.development.desa.pd/files/wpp2022_summary_of_results.pdf (accessed on 21 July 2025).
  8. Boebel, M.; Frei, F.; Blumensaat, F.; Ebi, C.; Meli, M.L.; Rüst, A. Batteryless sensor devices for underground infrastructure—A long-term experiment on urban water pipes. J. Low Power Electron. Appl. 2023, 13, 31. [Google Scholar] [CrossRef]
  9. Ministry of Land, Infrastructure and Transport (MOLIT). Press Release: Launch of the 2nd National Underground Safety Management Master Plan (2025–2029); Ministry of Land, Infrastructure and Transport: Sejong, Republic of Korea, 2024; Available online: https://www.molit.go.kr/USR/NEWS/m_71/dtl.jsp?id=95090544 (accessed on 21 July 2025).
  10. Cepa, J.J.; Alberti, M.G.; Pavón, R.M.; Calvo, J.A. Integrating BIM and GIS for an existing infrastructure. Appl. Sci. 2024, 14, 10962. [Google Scholar] [CrossRef]
  11. Sharafat, A.; Khan, M.S.; Latif, K.; Tanoli, W.A.; Park, W.; Seo, J. BIM–GIS-based integrated framework for underground utility management system for earthwork operations. Appl. Sci. 2021, 11, 5721. [Google Scholar] [CrossRef]
  12. Tan, Y.; Liang, Y.; Zhu, J. CityGML in the integration of BIM and the GIS: Challenges and opportunities. Buildings 2023, 13, 1758. [Google Scholar] [CrossRef]
  13. Singapore-ETH Centre. Digital Underground. Singapore-ETH Centre, (n.d.). Available online: https://sec.ethz.ch/research/digital-underground.html (accessed on 21 July 2025).
  14. Aksenova, G.; Kiviniemi, A.; Kocaturk, T.; Lejeune, A. From Finnish AEC Knowledge Ecosystem to Business Ecosystem: Lessons Learned from the National Deployment of BIM. 2019. Available online: https://www.researchgate.net/publication/326542264_From_Finnish_AEC_knowledge_ecosystem_to_business_ecosystem_lessons_learned_from_the_national_deployment_of_BIM (accessed on 21 July 2025).
  15. Xia, Z.; Shu, J.; Ding, W.; Gao, Y.; Duan, Y.; Debono, C.J.; Prakash, V.; Seychell, D.; Borg, R.P. Complete-coverage path planning for surface inspection of cable-stayed bridge tower based on building information models and climbing robots. Comput.-Aided Civ. Infrastruct. Eng. 2025, 40, 4149–4171. [Google Scholar] [CrossRef]
  16. Zhu, J.; Wu, P. Towards effective BIM/GIS data integration for smart city by integrating computer graphics technique. Remote Sens. 2021, 13, 1889. [Google Scholar] [CrossRef]
  17. Du, S.; Hou, L.; Zhang, G.; Tan, Y.; Mao, P. BIM and IFC data readiness for AI integration in the construction industry: A review approach. Buildings 2024, 14, 3305. [Google Scholar] [CrossRef]
  18. Ning, F.; Li, Z.; Lu, J.; Wang, Y.; Niu, Y.; Shi, Y. 3D CAD model dynamic clustering based on inertial feature encoder. Appl. Soft Comput. 2025, 182, 113627. [Google Scholar] [CrossRef]
  19. Numan, M. BIM and risk management: A review of strategies for identifying, analysing and mitigating project risks. J. Eng. Res. Sci. 2024, 3, 20–26. [Google Scholar] [CrossRef]
  20. Abugu, C. Integrating building information modelling (BIM) for effective construction planning, execution, and lifecycle management. Int. J. Res. Publ. Rev. 2025, 6, 4347–4364. [Google Scholar] [CrossRef]
  21. Rostamiasl, V.; Jrade, A. Integrating building information modeling (BIM) and life cycle cost analysis (LCCA) to evaluate the economic benefits of designing aging-in-place homes at the conceptual stage. Sustainability 2024, 16, 5743. [Google Scholar] [CrossRef]
  22. GeoJSON. The GeoJSON Format. Available online: https://geojson.org (accessed on 3 August 2025).
  23. Lee, J.; Kim, Y.; Moon, I.-Y. Standardization of CAD drawing formats and GeoJSON-based processing for 3D spatial data extraction of underground utilities. Buildings 2024, 14, 3980. [Google Scholar] [CrossRef]
  24. American Society of Civil Engineers. Standard Guideline for the Collection and Depiction of Existing Subsurface Utility Data (CI/ASCE 38-02); ASCE: Reston, VA, USA, 2002. [Google Scholar]
  25. Alsofiani, M.A. Digitalization in infrastructure construction projects: A PRISMA-based review of benefits and obstacles. arXiv 2024, arXiv:2405.16875. [Google Scholar] [CrossRef]
  26. Tan, L.; Shojaei, D.; Kalantari, M.; Soon, K.H.; Krishnaswamy, S. Digital Underground: Mapping the Subsurface for a Better Tomorrow; Future Cities Laboratory, ETH Zurich: Singapore, 2019; Available online: https://ethz.ch/content/dam/ethz/special-interest/dual/sec-dam/documents/Digital-Underground-1.pdf (accessed on 20 July 2025).
  27. Zhao, Y.; Deng, X.; Lai, H. A deep learning-based method to detect components from scanned structural drawings for reconstructing 3D models. Appl. Sci. 2020, 10, 2066. [Google Scholar] [CrossRef]
  28. Heikkilä, R.; Kolli, T.; Rauhala, T. Benefits of open InfraBIM—Finland experience. In Proceedings of the 39th International Symposium on Automation and Robotics in Construction (ISARC 2022), Bogotá, Colombia, 13–15 July 2022; IAARC: Bogota, Colombia, 2022; p. 96. [Google Scholar] [CrossRef]
  29. Gbadamosi, E. NYC Project Builds Resilience via Utility Data Sharing. GovTech, 2022. Available online: https://www.govtech.com/analytics/nyc-project-builds-resilience-via-utility-data-sharing (accessed on 27 July 2025).
  30. Ullah, S.; Ullah, N.; Siddique, M.F.; Ahmad, Z.; Kim, J.-M. Spatio-temporal feature extraction for pipeline leak detection in smart cities using acoustic emission signals: A one-dimensional hybrid convolutional neural network–long short-term memory approach. Appl. Sci. 2024, 14, 10339. [Google Scholar] [CrossRef]
  31. Trimble Inc. Trimble SiteVision—Outdoor Augmented Reality System. Available online: https://sitevision.trimble.com (accessed on 20 July 2025).
  32. Bentley Systems. OpenCities Planner—3D Urban Planning and Visualization. Available online: https://www.bentley.com/software/opencities-planner/ (accessed on 20 July 2025).
  33. BIM ME UP. IFC Structure. Available online: https://bim-me-up.com/en/ifc-structure/ (accessed on 4 September 2025).
  34. Kim, K.T.; Kim, Y.C.; Cho, I.P.; Lee, S.Y. The study on camera control for improvement of gimbal lock in digital-twin environment. In Proceedings of the Korea Information and Communications Society Conference, Jeju, Republic of Korea, 25–27 May 2022; KICS: Seoul, Republic of Korea, 2022; pp. 476–477. [Google Scholar]
  35. Korea Water and Wastewater Works Association (KWWA). Standard Specifications for Waterworks Construction; KWWA: Seoul, Republic of Korea, 2023; Available online: https://www.codil.or.kr/detailAnwGuide.do?nserialno=3238 (accessed on 16 September 2025).
  36. Korean Institute of Construction Technology (KICT). 2025 Standard Construction Work Unit Prices; Korean Institute of Construction Technology: Goyang, Republic of Korea, 2025; Available online: https://www.codil.or.kr/helpdesk/read.do?bbsId=BBSMSTR_900000000202&nttId=13104 (accessed on 16 September 2025).
  37. Construction Association of Korea (CAK). Announcement of 2025 First Half Construction Wage Survey Results; CAK: Seoul, Republic of Korea, 2024; Available online: https://www.cak.or.kr/lay1/bbs/S1T9C12/A/2/view.do?article_seq=117504 (accessed on 16 September 2025).
Figure 1. Overall workflow and modular architecture of the proposed CAD-to-5D BIM automation process.
Buildings 15 04139 g001
Figure 2. Workflow for GeoJSON-based 3D Spatial Data Generation.
Buildings 15 04139 g002
Figure 3. Relationship between Spatial Structure and Placement Structure.
Buildings 15 04139 g003
Figure 4. Application of Spatial Structure to Underground Utility Data.
Buildings 15 04139 g004
Figure 5. Case Study: GeoJSON-Formatted Three-dimensional Spatial Data Extracted from Standardized Drawings.
Buildings 15 04139 g005
Figure 6. Geometric Information Generation Process for BIM Object Creation.
Buildings 15 04139 g006
Figure 7. The stage of processing the geometry of a BIM object.
Buildings 15 04139 g007
Figure 8. Processing BIM object material information and integrating it with geometric representation.
Buildings 15 04139 g008
Figure 9. Processing and Integration of BIM Object Property Information with Geometric Data.
Buildings 15 04139 g009
Figure 10. Example of JSON and CSV Data Structure Based on WBS Modeling.
Buildings 15 04139 g010
Figure 11. Structured Representation of JSON-Based WBS Modeling and Its Integration with BIM Objects.
Buildings 15 04139 g011
Figure 12. Example Result of Detailed Cost Generation through WBS and CBS Modeling Data Matching.
Buildings 15 04139 g012
Figure 13. Structured Integration of WBS and CBS Modeling with BIM Object Association.
Buildings 15 04139 g013
Figure 14. IFC Viewer Interface Layout.
Buildings 15 04139 g014
Figure 15. Verification of 3D Spatial Data Processed from Drawing Data Based on GeoJSON.
Buildings 15 04139 g015
Figure 16. Verification of BIM Integration Results of GeoJSON-Based Underground Utility Objects with WBS and CBS.
Buildings 15 04139 g016
Figure 17. Verification of Processed 5D BIM Data in IFC Format.
Buildings 15 04139 g017
Figure 18. Data integrity verification of GeoJSON and BIM models across Autodesk Web Viewer, IFC Viewer, and Navisworks.
Buildings 15 04139 g018
Table 1. Comparison of WBS and CBS.
CategoryWBS (Work Breakdown Structure)CBS (Cost Breakdown Structure)
FocusProject scope and tasksProject expenditures and resources
PurposeThe project is decomposed into work packages to define deliverables and activitiesThe costs are broken down by category to enable budget estimation and cost control
StructureA hierarchical structure based on work packagesHierarchical structure based on cost elements
ApplicationSchedule management, resource allocation, risk managementBudgeting, cost management, expense tracking
Table 2. Challenges in Underground Utility Management and Corresponding Technical Responses Proposed in This Study.
IndexIdentified ChallengeProposed Technical Response
1Poor data quality and lack of standardizationAutomatically extracts data from standardized CAD drawings and converts it to open formats (GeoJSON and IFC) to enhance consistency and interoperability
2Fragmented information and inefficient collaborationIntegrates WBS, CBS, and OBS into BIMs and enables real-time information sharing via cloud-based platforms
3Lack of automated 3D modeling and BIM–GIS integrationGenerates 3D models automatically from 2D CAD data and converts to both GeoJSON and IFC for enhanced interoperability between BIM and GIS
4Outdated facility information and poor maintenance feedbackAllows automated updates of BIM data based on modified design drawings, ensuring up-to-date information and reducing manual errors
5Shortage of cross-domain technical expertsEnables BIM creation from 2D inputs without requiring advanced 3D modeling skills, allowing broader accessibility by general designers or field staff
6High cost of adopting smart infrastructure systemsUtilizes open-source tools and existing 2D assets to minimize implementation costs and offer scalable solutions for smaller municipalities or agencies
Table 3. Underground Utility Color Codes by Country.
Utility TypeSouth KoreaUSA/Canada
(APWA Standard)
UKAustralia
(AS5488 Standard)
ElectricityRedRedRed/BlackOrange
Gas/OilYellowYellowYellowYellow
TelecommunicationsGreenOrangeOrangeWhite
Portable WaterBlueBlueBlueBlue
WastewaterYellowGreenGreenCream
Reclaimed WaterPurplePurplePurplePurple
HeatingOrangeYellowOrangeBrown
Oil PileBrownYellowYellowBrown
Table 4. BIM Dimensions Breakdown.
DimensionAdded InformationKey Feature and Description
3D BIM
  • Geometry
  • Physical Attributes
  • Core 3D model representing the building
  • Captures physical characteristics
  • Defines spatial relationships among components
4D BIM
  • Time(Schedule)
  • Integration with project schedule data
  • Enables visualization of construction phases
  • Supports progress tracking
  • Facilitates conflict detection related to time
5D BIM
  • Cost(Quantity, Budget)
  • Adds cost information to the 4D model
  • Facilitates quantity take-offs
  • Supports cost estimation
  • Enables budget management
  • Assists in financial planning throughout the project lifecycle
6D BIM
  • Sustainability
  • Energy Analysis
  • Focuses on life cycle management, energy performance, and environmental sustainability
  • Includes data for energy simulations
  • Supports material analysis
  • Enables carbon footprint assessment
7D BIM
  • Facility Management
  • Operation & Maintenance
  • Incorporates operational and maintenance (O&M) data for post-construction phases
  • Supports asset management
  • Enables maintenance scheduling
  • Facilitates facility upkeep throughout the building’s lifespan
Table 5. Hierarchical JSON Structure for WBS Modeling.
WBS HierarchyDefined RoleExamples of Key Field Data
ProjectManagement of project and contract-level metadata
  • Project Name
  • Type
  • Duration
  • Client
  • Project ID
WorkPlanDefinition of overall construction-level planning
  • Construction Name
  • Planned Start Date
  • Planned End Date
  • Milestone
  • WorkPlan ID
WorkScheduleManagement of major process categories
  • Process Name
  • Start Date
  • End Date
  • Duration
  • Status
  • WorkSchedule ID
TaskDefinition of executable work units and resource linking
  • Task Name
  • Start Date
  • End Date
  • Duration
  • Status
  • Manager
  • Labor
  • Equipment
  • Material
  • Products (Target BIM Object Paths)
  • Task ID
Table 6. Libraries for 5D BIM Conversion and IFC Viewer Development.
LibraryVersionPurpose
ifcopenshell0.8.3.post1Read/Write IFC files and parse model structure
ezdxf1.4.2Handle DXF format data
shapely2.1.1Geometric object operations (coordinates, polygons, etc.)
pyproj3.7.1Coordinate system transformation
pyogrio0.11.0GIS file input/output
numpy2.3.1Numerical calculations and array processing
pandas2.3.1Data processing based on Data Frames
scipy1.16.0Numerical analysis and scientific computation
openpyxl3.1.5Excel file input/output
Xbim.Ifc6.0.521Read/Write IFC model, handle attributes and structure
Xbim.Ifc46.0.521Support for IFC4 model
Xbim.Ifc2 × 36.0.521Support for IFC2 × 3 model
Xbim.Essentials6.0.521Basic API for IFC mode
HelixToolkit.Wpf2015.1.7153D viewer rendering and interaction based on WPF
Table 7. Summary of Validation for GeoJSON–BIM Conversion.
ItemDetails
Sample size50 objects randomly selected
Data typesService-water pipelines
(4 types: SMART, Portable, Landscape, BottomFlow)
Compared attributesproperties, diameter, material, geometry, cost (5 items)
ToolsAutodesk Web Viewer, Navisworks,
in-house 5D BIM IFC Viewer
ReferenceGeoJSON (used as baseline)
Result100% match, no data loss
Table 8. Execution time measurements for each conversion stage (unit: ms).
TrialStep1. DXF →
GeoJSON
Step2. GeoJSON →
3D IFC
Step3. 3D IFC →
5D IFC Integration
Total Process
11242.17219,705.832081.18223,547.80
21285.93238,800.612226.73242,948.51
31218.61230,018.902135.12233,973.54
41247.24225,476.792079.48229,384.23
51224.08218,094.502113.94222,013.11
61229.00222,485.682050.62226,309.44
71231.36221,912.152089.03225,777.94
81230.91218,267.632108.42222,152.54
91262.71220,518.822079.76224,399.21
101283.79220,758.622117.06224,720.29
Average1245.58223,903.552108.13227,122.86
Standard Deviation22.386278.7451.626381.43
Disclaimer/Publisher’s Note: The statements, opinions and data contained in all publications are solely those of the individual author(s) and contributor(s) and not of MDPI and/or the editor(s). MDPI and/or the editor(s) disclaim responsibility for any injury to people or property resulting from any ideas, methods, instructions or products referred to in the content.