Article

A Two-Stage Support Load Convergence Method for Rock–Support Interaction in Tunnels

1
Yellow River Engineering Consulting Co., Ltd., Zhengzhou 450003, China
2
Key Laboratory of Water Management and Water Security for Yellow River Basin (Under Construction), Zhengzhou 450003, China
*
Author to whom correspondence should be addressed.
Buildings 2025, 15(22), 4136; https://doi.org/10.3390/buildings15224136
Submission received: 25 September 2025 / Revised: 7 November 2025 / Accepted: 13 November 2025 / Published: 17 November 2025
(This article belongs to the Special Issue Solid Mechanics as Applied to Civil Engineering)

Abstract

Understanding the dynamic interaction between surrounding rock and support systems is crucial for tunnel design and safety assessment. This study introduces the Support Load Convergence Method (SLCM), which is an innovative analytical approach that efficiently and accurately captures load distribution and deformation in various rock types, including the consideration of elastic, elastoplastic, and post-peak softening conditions. Validation against FLAC3D simulations demonstrates that the SLCM significantly improves computational efficiency while maintaining high accuracy. The method provides a reliable tool for evaluating rock–support interaction, optimizing support schemes, and ensuring the stability and safety of underground structures.

1. Introduction

During underground projects like those in tunnels and mines, the stability of excavations largely depends on the evolving and interactive forces between the encompassing rock and artificial support arrangements [1,2]. Studies have revealed that a sophisticated coupling occurs between the encasing rock mass and the support framework, in which the encasing rock mass not only exerts forces upon the support but also engages in load distribution [3,4,5]. Hence, precisely measuring the proportion of load distribution between the encasing rock mass and the support framework holds substantial practical value in refining support schemes, safeguarding construction security, and curbing project expenditures [6,7,8]. Consequently, analytical methods such as the convergence–confinement method (CCM) have been developed to quantify this interaction.
The CCM stands as a core theoretical framework for examining the interplay among surrounding rock and support systems, deriving its theoretical underpinnings from classical elastic–plastic mechanics [9,10,11]. The CCM comprises three key components [12,13]: (1) LDP—the longitudinal displacement profile of the tunnel, which describes the deformation pattern along the tunnel’s axis; (2) GRC—the ground reaction curve, reflecting the dynamic response of the surrounding soil; and (3) SCC—the support characteristic curve, depicting the behavior of the support system. Once the junction of the GRC and SCC is found, the load-sharing ratio of the surrounding rock and support structure can be accurately calculated [14,15]. Over the years, various studies have sought to improve the CCM to overcome its limitations in practical applications.
Numerous efforts have been made to enhance the applicability of the conventional CCM and overcome its inherent limitations. Dang et al. [16] successfully implemented the GRC and CCM in the design of tunnel supports for the Nam Mau coal mine in Vietnam, selecting support schemes tailored to specific geological conditions and demonstrating the method’s potential for broader application in deep mines, as well as its dependency on available data. On the methodological front, Lee et al. [17] developed an inverse algorithm based on the CCM, utilizing a Newton–Raphson iterative procedure to determine the intersection points between the surrounding rock characteristic curve and the support characteristic curve [18,19]. Building upon the complexity of support behavior, Ranjbarnia et al. [20] introduced a nonlinear support characteristic curve (SCC) model by incorporating qualitative load distributions on arched umbrella support elements, thus enabling a more precise simulation of complex support system responses. Extending the CCM to a higher spatial dimension, Chang et al. [21] further advanced its application to three-dimensional tunnel analyses, proposing a method suitable for 3D environments and specifying its applicable conditions and limitations. To incorporate the effects of construction-induced disturbances, González Cao et al. [22] accounted for blasting-induced rock damage in GRC analyses by applying various disturbance factors. Additionally, Bour and Goshtasbi [23] investigated the influence of groundwater on the surrounding rock characteristic curve and tunnel stability, demonstrating that in saturated rock masses, strain softening models predict substantially larger tunnel displacements than ideal elastic–plastic models.
Though the conventional convergence–confinement method (CCM) surpasses traditional analytical techniques in terms of providing a more accurate portrayal of how rock masses and support systems interact mechanically, notable shortcomings persist. Specifically, the final load-sharing state is determined solely by the GRC and SCC, thus making it incapable of capturing the dynamic evolution of loading during tunnel excavation. Furthermore, owing to the distinct expression of the GRC, existing approaches relying on intersection analysis are solely suitable for rock materials exhibiting either purely elastic–plastic deformation or elastic–brittle–plastic deformation characteristics, thus lacking effective strategies for strain-weakening scenarios.
Despite these improvements, conventional CCM approaches still face inherent limitations under dynamic excavation and complex geological conditions. To address this, Ren et al. [24] proposed the Incremental Support Load Method (ISLM) (Figure 1). In this approach, the yellow and blue regions in Figure 1a represent the theoretical support and rock loads, respectively, while the goal of the calculation is to make the calculated support load (purple region) approach the theoretical value. In this method, the stress release process is divided into discrete steps, in which the support load is applied incrementally in equal portions (incr − i) until convergence is achieved. At each step, the stress, strain, and displacement of the surrounding rock are iteratively updated, and accuracy is evaluated by comparing the displacements of the rock and the support (Figure 1a,d). However, the ISLM involves a trade-off between efficiency and accuracy: smaller increments yield higher precision but increase computational cost (Figure 1b), whereas larger increments improve efficiency but reduce accuracy (Figure 1c). Therefore, there is an urgent need for a new analytical approach that can accurately simulate the interaction between the surrounding rock and the support system while maintaining computational efficiency and practical applicability in modern tunnel engineering.
Based on the concepts of the ISLM, this study introduces a two-stage Support Load Convergence Method (SLCM) to analyze rock–support interactions. This method consists of an approximate convergence stage for the rapid estimation of the support load and an accurate convergence stage that further refines the result using a bisection-based iterative procedure. Key parameters, including tolerance and step size, influence both computational efficiency and accuracy. Validation against FLAC3D simulations shows that the SLCM offers significantly improved efficiency while maintaining high accuracy. The method tracks time-dependent load changes and deformation features (e.g., stress variations, shape deformation, and displacements) in the rock and support systems. It is applicable to a range of rock deformation behaviors, including elastic, elastoplastic with hardening to softening transitions, and post-peak strength reduction. This approach provides a robust tool for quantifying load distribution, optimizing support design, and enhancing tunnel stability under complex geological conditions.

2. Problem Statement

2.1. Basic Assumptions

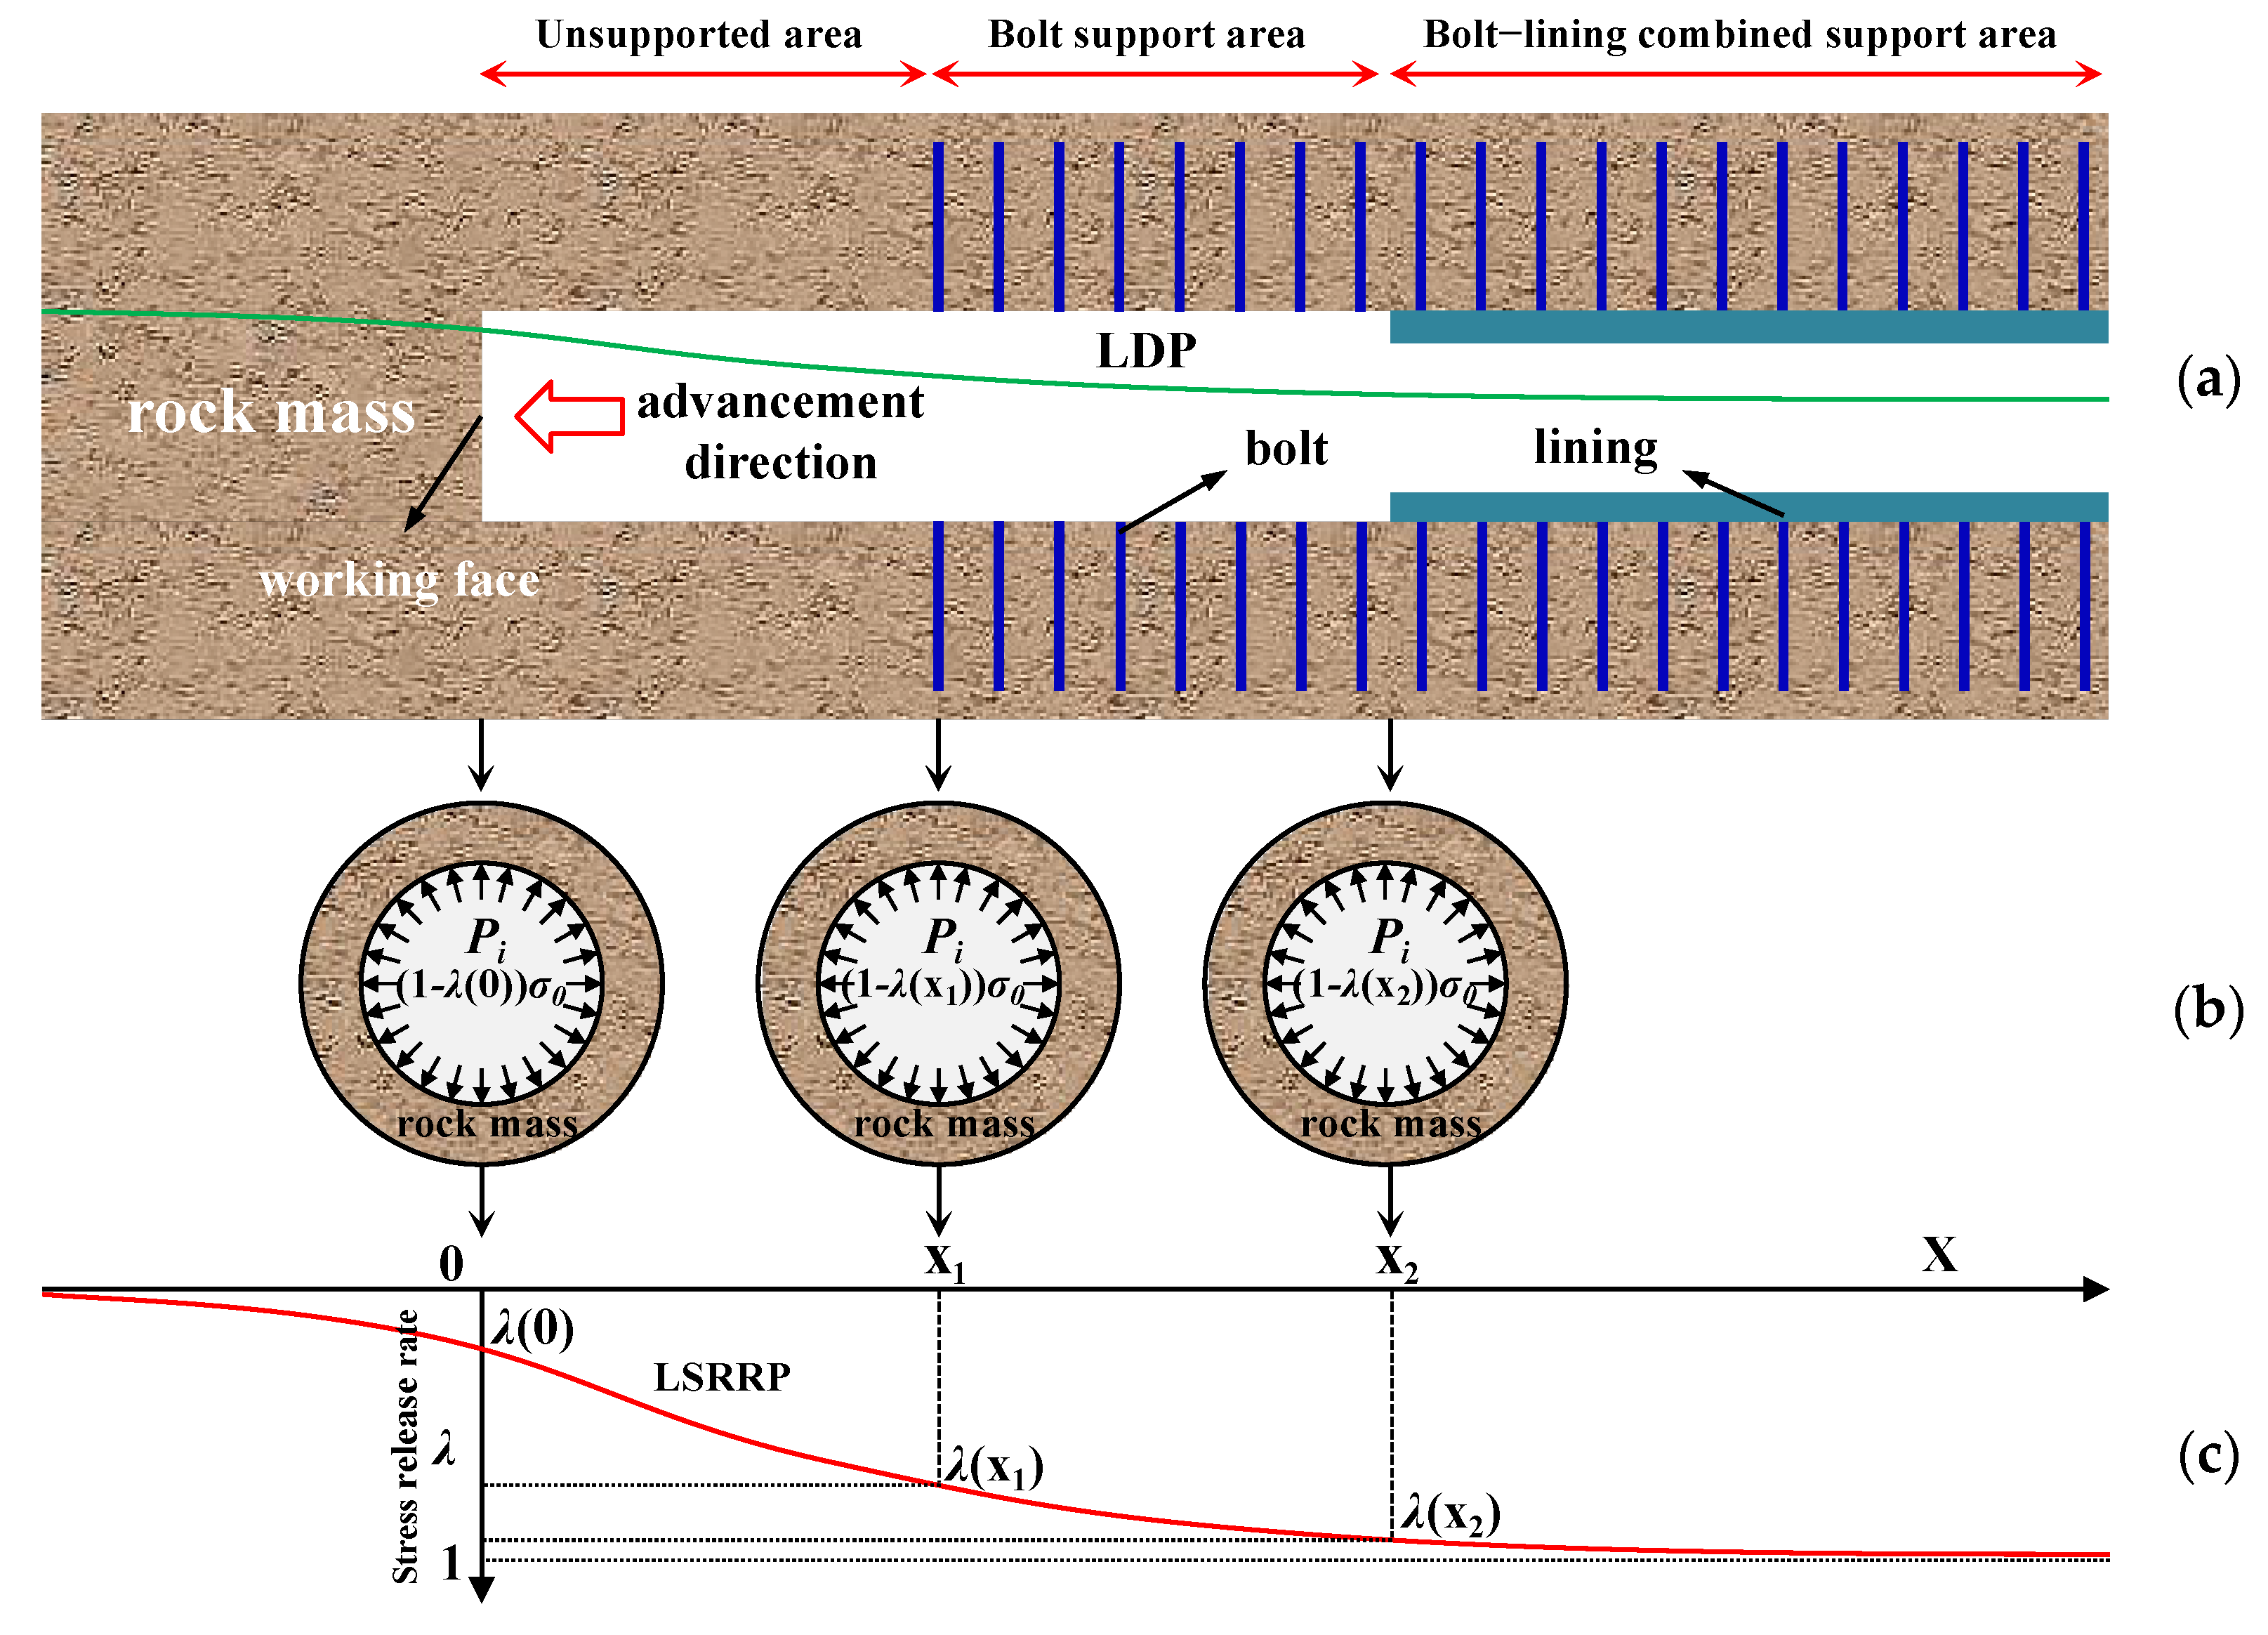
Figure 2a showcases the step-by-step 3D construction procedure of a tunnel, utilizing a combined bolt and lining support method [9,25]. Owing to the limited spatial availability at the tunnel working front, stress in the surrounding rock mass does not fully dissipate during the excavation stage. As excavation progresses, stress gradually dissipates, thus causing a reduction in the virtual support force P i on the excavation surface (Figure 2b). Figure 2c shows the variation in the longitudinal stress release ratio with distance (x) from the tunnel face. The stress release ratios during excavation, bolt installation, and lining construction are denoted as λ 0 , λ x 1 , and λ x 2 (Figure 2c), respectively, while the corresponding virtual support forces are 1 λ 0 σ 0 , 1 λ x 1 σ 0 , and 1 λ x 2 σ 0 (Figure 2b), with σ 0 representing in situ stress.
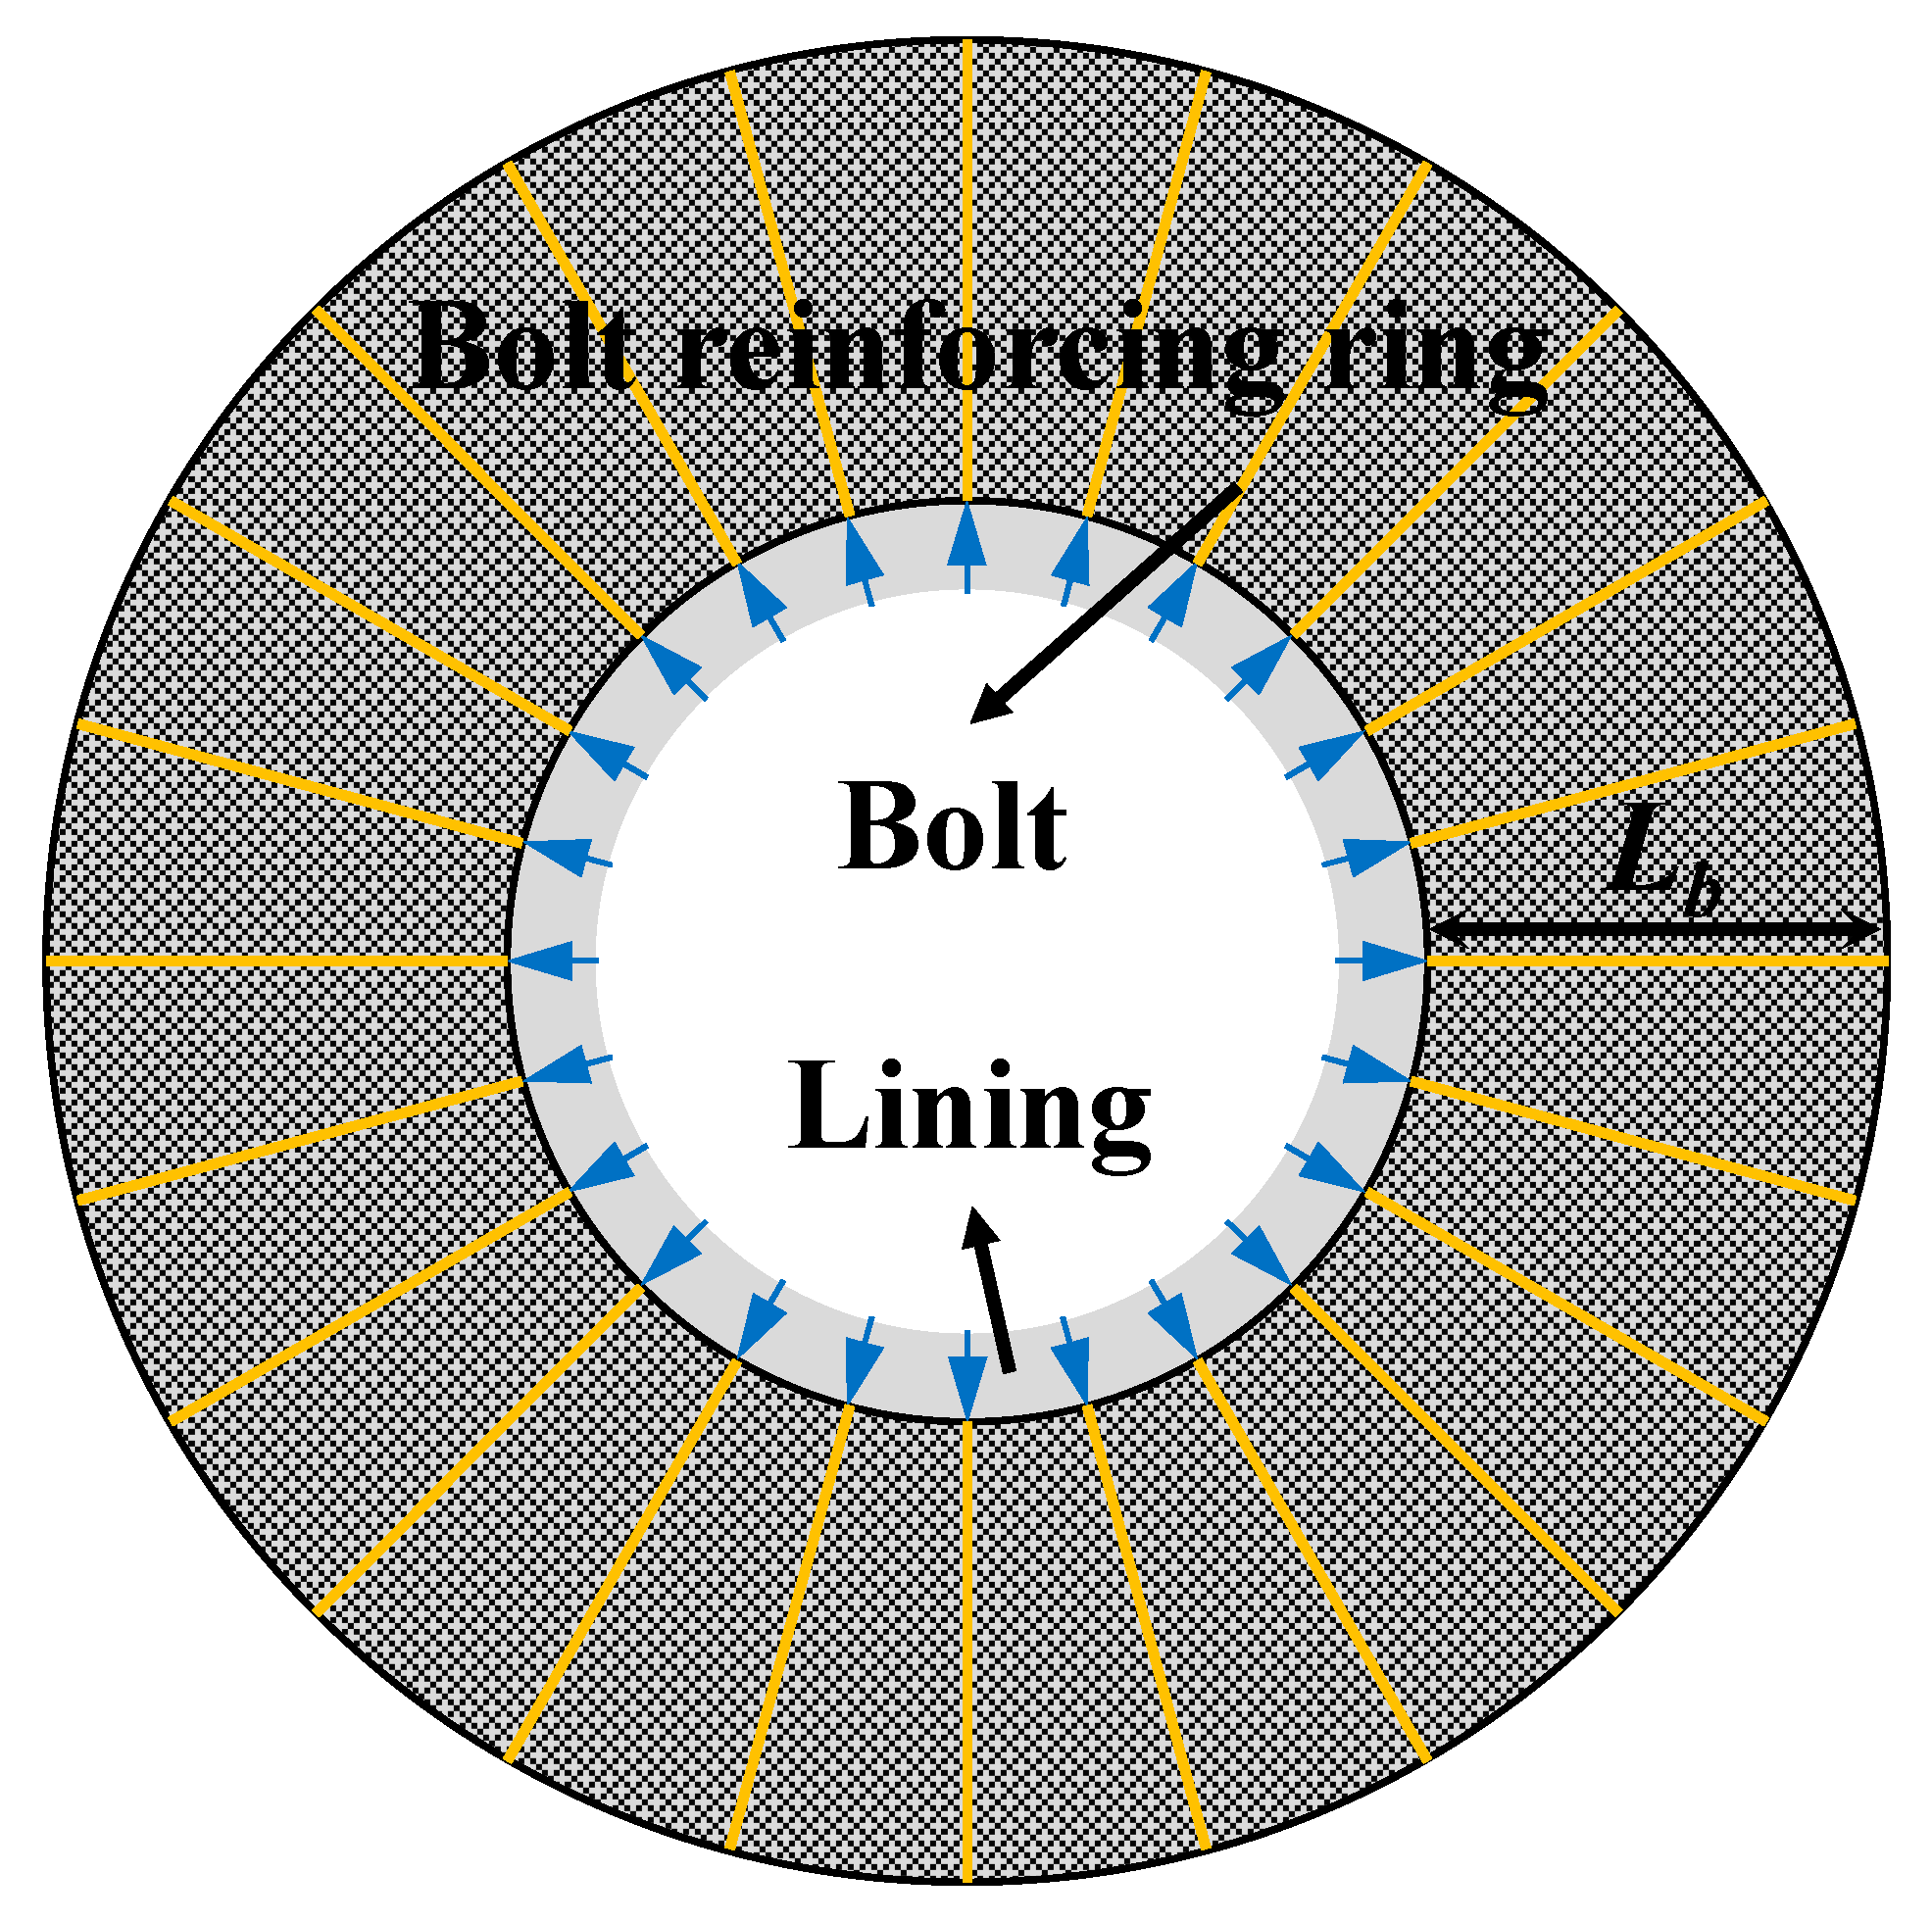
A pseudo-support pressure model is adopted to approximate the three-dimensional restraint of the tunnel lining, thus converting the problem into one under a two-dimensional plane strain condition (Figure 3). In Figure 3, L b denotes the bolt-reinforced zone of the surrounding rock (bolt length). The longitudinal strain is assumed to be negligible, and the pressure is uniformly distributed along the tunnel axis.
To analyze the rock–support interaction during tunnel construction, the following assumptions are adopted:
(1)
The surrounding rock is considered an isotropic, homogeneous, and intact medium with strain softening behavior, following the generalized Mohr–Coulomb criterion, while the lining and bolts are linearly elastic.
(2)
The in situ stress is assumed to be isotropic, and the stress–strain distribution of both the rock and lining is axially symmetric.
(3)
A perfect bond is assumed between the rock mass and bolts, which share the load and enhance the strength of the reinforced zone.

2.2. Governing Equations

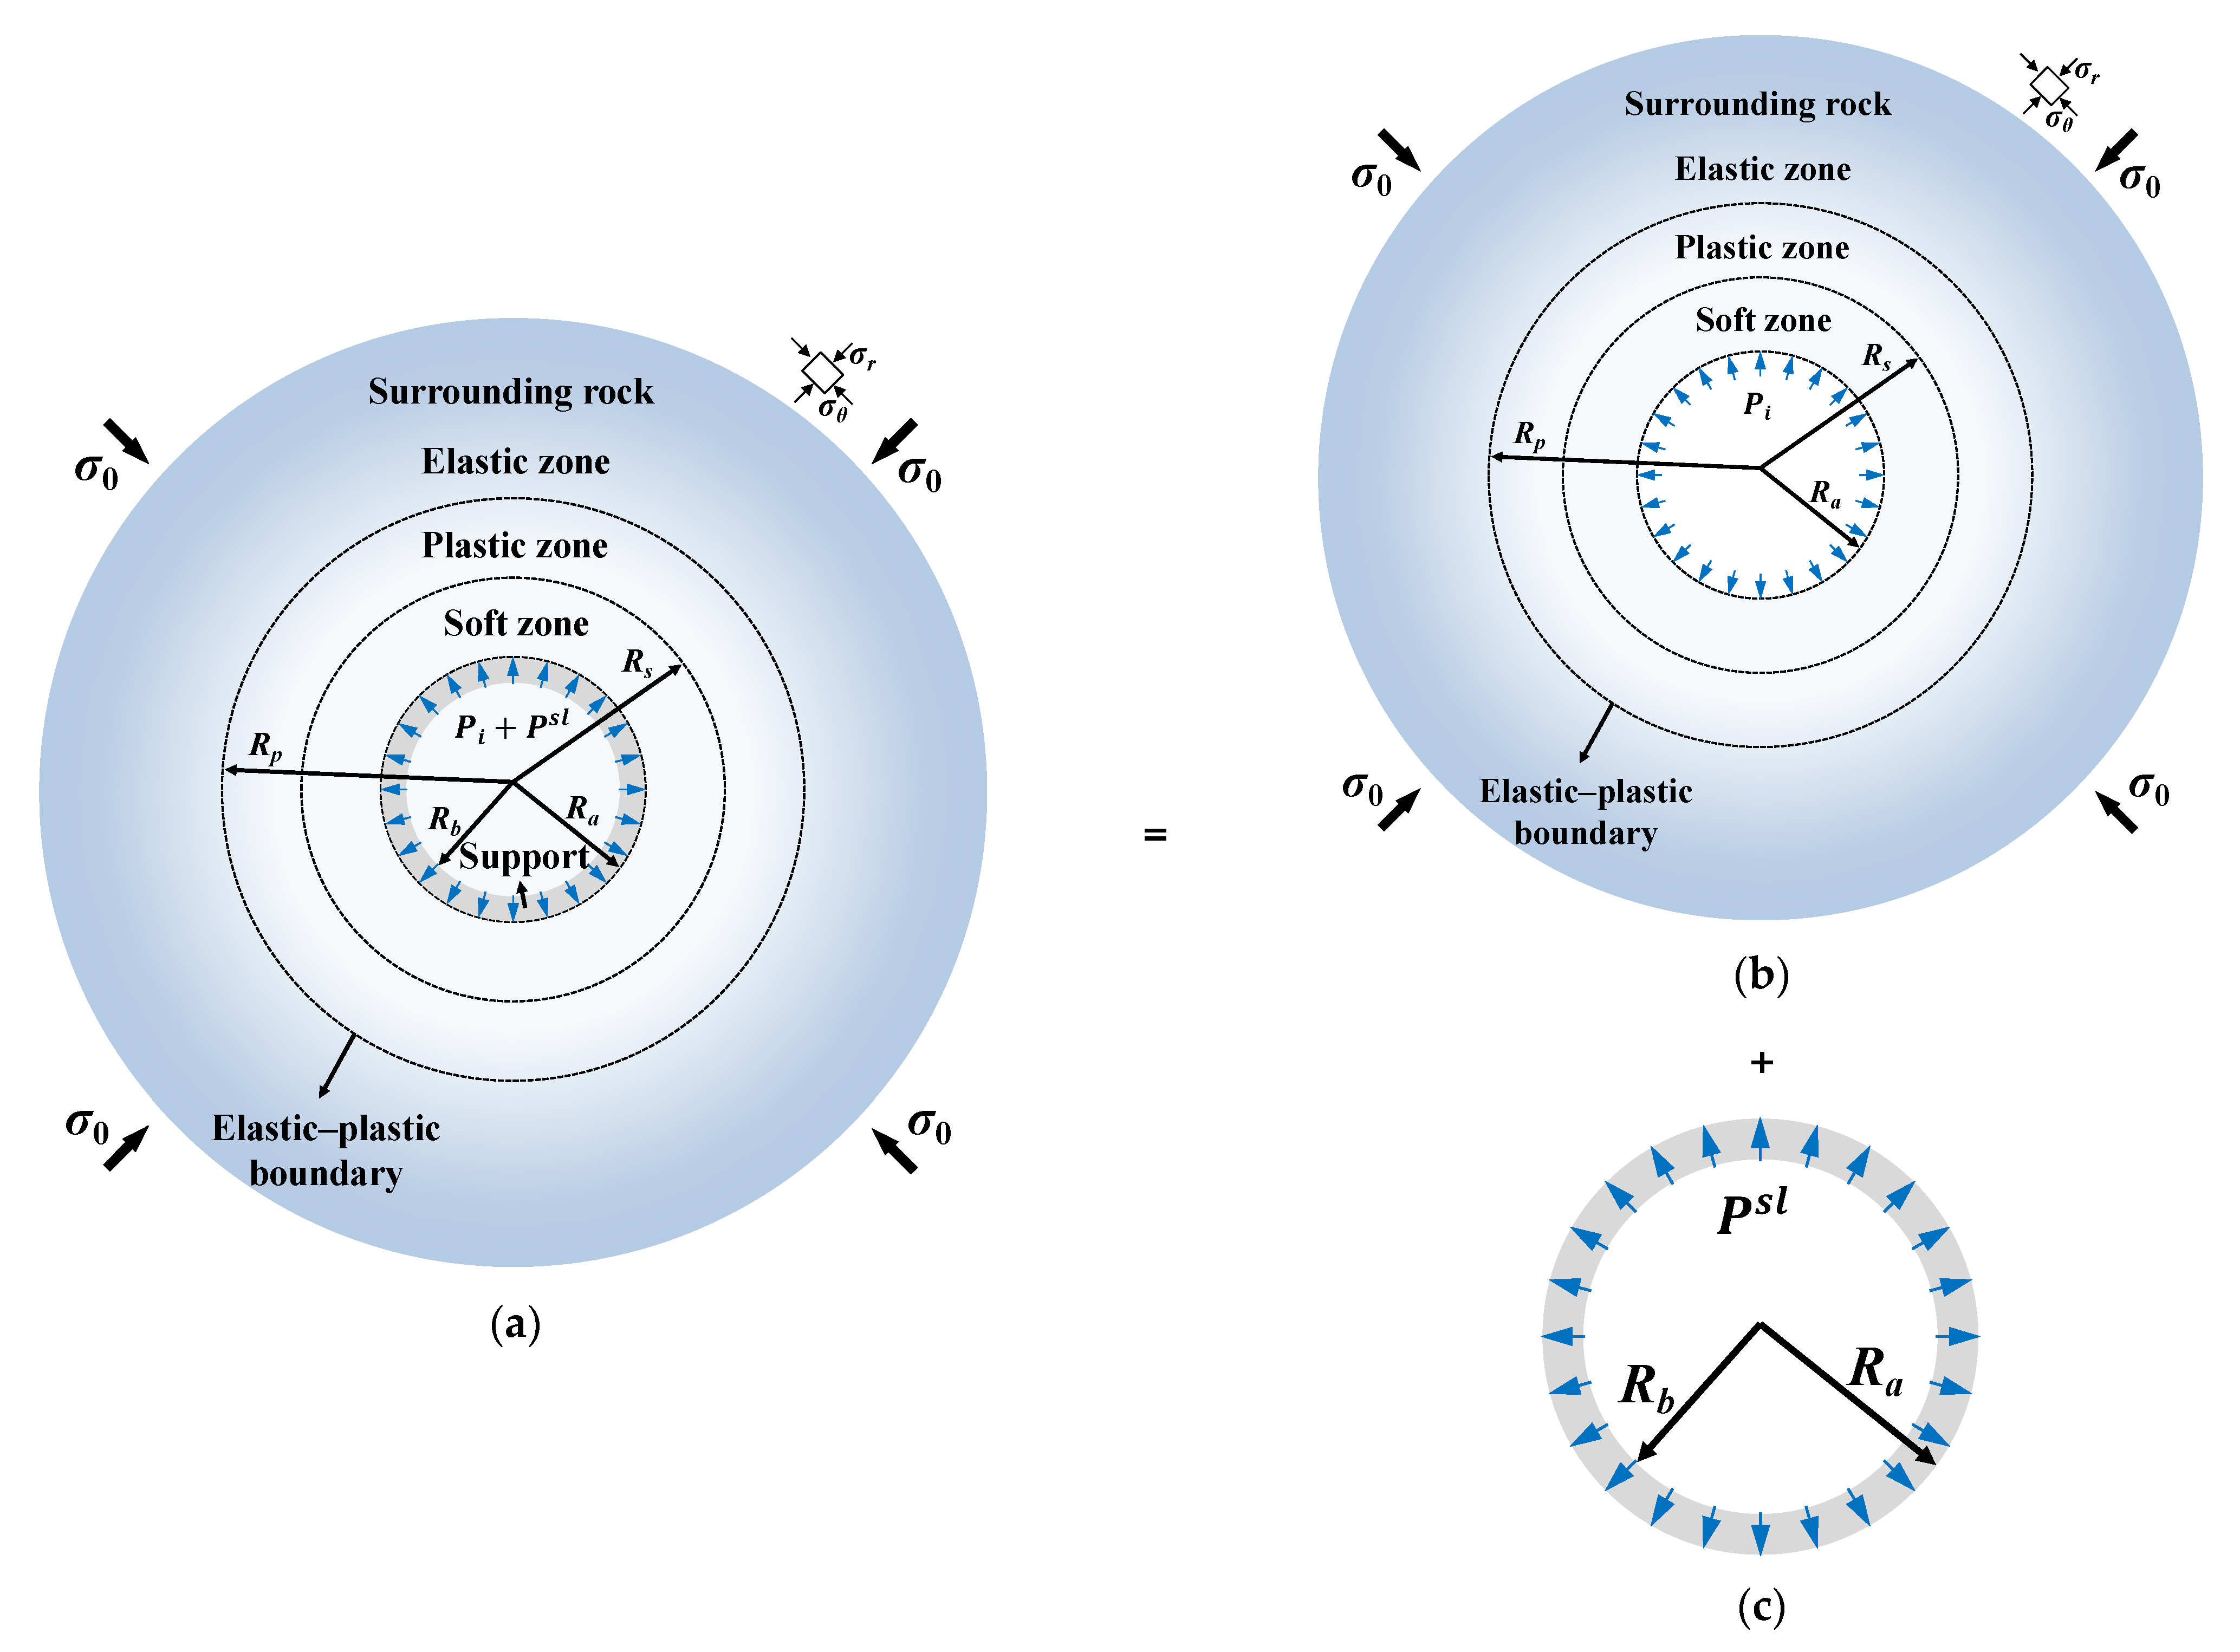
Based on the above assumptions, an axisymmetric plane strain model is developed for a circular tunnel supported by a bolt–lining system, as illustrated in Figure 4a. The model consists of two subsystems: (1) the surrounding rock (Figure 4b) and (2) the support (Figure 4c). Before excavation, the rock mass is under a hydrostatic stress of magnitude σ 0 . Bolts form a reinforced annulus of thickness L b around the tunnel (Figure 3). A uniform virtual support force is applied along the excavation boundary, representing the restraint from the tunnel face. Compressive stress and inward radial displacement are taken as positive.
In Figure 4, σ 0 represents in situ stress; σ r and σ θ are the radial and circumferential stresses of the surrounding rock, respectively; R a is the tunnel radius; R b the lined tunnel radius; R s is the residual rock radius; R p is the plastic zone radius; P i is the virtual support force; and P s l is the lining support force.
Under the circular coordinate scheme, the equations describing stress balance, how strain and displacement are related, and the material’s built-in behavior for an axisymmetric planar strain case are shown below [26,27]:
d σ r d r + σ r σ θ r = 0
ε r = d u d r ε θ = u r
ε r e = 1 μ σ r μ σ θ 2 G ε r = ε r e + ε r p ε θ e = 1 μ σ θ μ σ r 2 G ε θ = ε θ e + ε θ p
The variables ε r , ε r e , and ε r p are associated with the total, elastic, and plastic strains in the radial direction, while ε θ , ε θ e , and ε θ p represent the same for the circumferential direction. u signifies the radial displacement; G and μ are the shear modulus and Poisson’s ratio of the surrounding rock, respectively; and r indicates the radial distance measured from the tunnel’s center.
According to Equation (2), the strain-matching equation is as follows:
d ε θ d r + ε θ ε r r = 0
Regarding the plastic surrounding rock mass, the often used generalized Mohr–Coulomb yield criterion for the strain softening model is shown in Equation (5).
f σ θ , σ r , η = σ θ σ r N η 1 σ r + Y η N η = 1 + sin φ η 1 sin φ η Y η = 2 c η cos φ η 1 sin φ η
The Mohr–Coulomb strength parameters, namely cohesion ( φ η ) and the internal friction angle ( c η ), are dependent on the softening factor ( η ). In this study, the softening factor is defined as follows:
η = ε θ p ε r p
Considering how the systematic bolt arrangement impacts the strength characteristics of the adjacent rock mass, the strength values specified in Equation (5) for the rock within the reinforcement zone are adjusted, as presented below:
η = η p η p η r γ p γ p 0 < γ p < γ p η r γ p γ p
In this equation, parameter η can stand for any strength-related variable, like the internal friction angle or cohesion. Parameter γ p indicates the plastic shear strain of the surrounding rock mass; γ p pertains to the critical plastic shear strain when the surrounding rock reaches its residual state; and η p and η r signify the peak and residual magnitudes of η , respectively.
The Mohr–Coulomb criterion serves as the plastic potential function for depicting plastic deformation in the plastic region. Its mathematical expression is presented below:
G σ 1 , σ 3 , η = σ θ K ψ η σ r
K ψ η = 1 + sin ψ η 1 sin ψ η
In this context, K ψ η denotes the dilation coefficient, while ψ corresponds to the dilation angle, which also varies as a function of the softening index η .
In light of the plastic flow theory, the equation below delineates the connection between radial and circumferential plastic strains:
ε r p + K ψ η ε θ p = 0
By merging Equations (1) and (5), we obtain the stress equilibrium equation for the surrounding rock in the plastic region, which is given by the following:
d σ r d r H σ r , η r = 0
H σ r , η = σ θ σ r
Upon replacing the terms in Equation (4) with those from Equation (3), the strain compatibility equation takes on the following form:
d ε θ p d r + ε θ p ε r p r = d ε θ e d r H σ r , η 2 G r
With Equation (10) factored in, Equation (13) can be recast as follows:
d ε θ p d r + 1 + k η ε θ p r = d ε θ e d r H σ r , η 2 G r

2.3. Boundary Conditions

Regarding the surrounding rock depicted in Figure 4b, apart from the far-field hydrostatic stress, the stress exerted on the inner boundary comprises the pseudo-supporting pressure from the tunnel face and the reaction force provided by the support structures. In other words, for the outer boundary of the surrounding rock,
r ,                 σ r = σ 0
For the inner edge R a of the surrounding rock,
r R a ,                 σ r = P i + P s = P i + P s b + P s l
In this equation, P i represents the virtual support force exerted by the tunnel face; P s represents the loads carried by the support structures, which include the support load P s l carried by the lining and P s b carried by the bolt, respectively. Based on the above, P s l and P s b can be determined based on Ren et al. [24].
P s l = K c u c s = E c R a 2 R b 2 u l s 1 + μ c R b 1 2 μ c R a 2 + R b 2
P s b = K b u b s = π D 2 E b u b s 2 S L S T L b
In the above, K c denotes the stiffness of the lining support, which is determined by the Poisson’s ratio ( μ c ), elastic modulus ( E c ), and outer and inner radii ( R a and R b ) of the lining. K b represents the stiffness of the bolts, which is governed by the bolt diameter ( D ), elastic modulus ( E b ), longitudinal and circumferential spacings ( S L and S T ), and bolt length ( L b ).
Regarding the lining depicted in Figure 4, the support force on the inner and outer interfaces is presented below:
Exterior facet of the lining R a :
r R a , P s l
Interior facet of the lining R b :
r R b , 0
During the interaction between the surrounding rock and the lining, the normal stress at contact σ n equals the lining’s reaction stress. After lining installation, the radial displacements of the surrounding rock and lining are identical, as shown below:
σ n = P s l
u u 0 u l s = 0
u denotes the total radial displacement of the tunnel wall, u 0 the displacement before lining installation, and u l s the displacement of the lining.

3. Model Solution

To determine the loads sustained by the surrounding rock and support structures, the rock–support system shown in Figure 4 is segmented into two subsystems, the rock and support subsystems, as presented in Figure 4b,c.

3.1. Solution of Rock Subsystem

As illustrated in Figure 2, the longitudinal section behind the tunnel face can be divided into three zones: the unsupported zone, the bolt-supported zone, and the bolt–lining combined support zone. The stress and displacement in the elastic zone are calculated using Lame’s solution [11,28], while those in the plastic zone are obtained by using the differential method proposed by Lee and Pietruszczak [9], which is briefly described below.
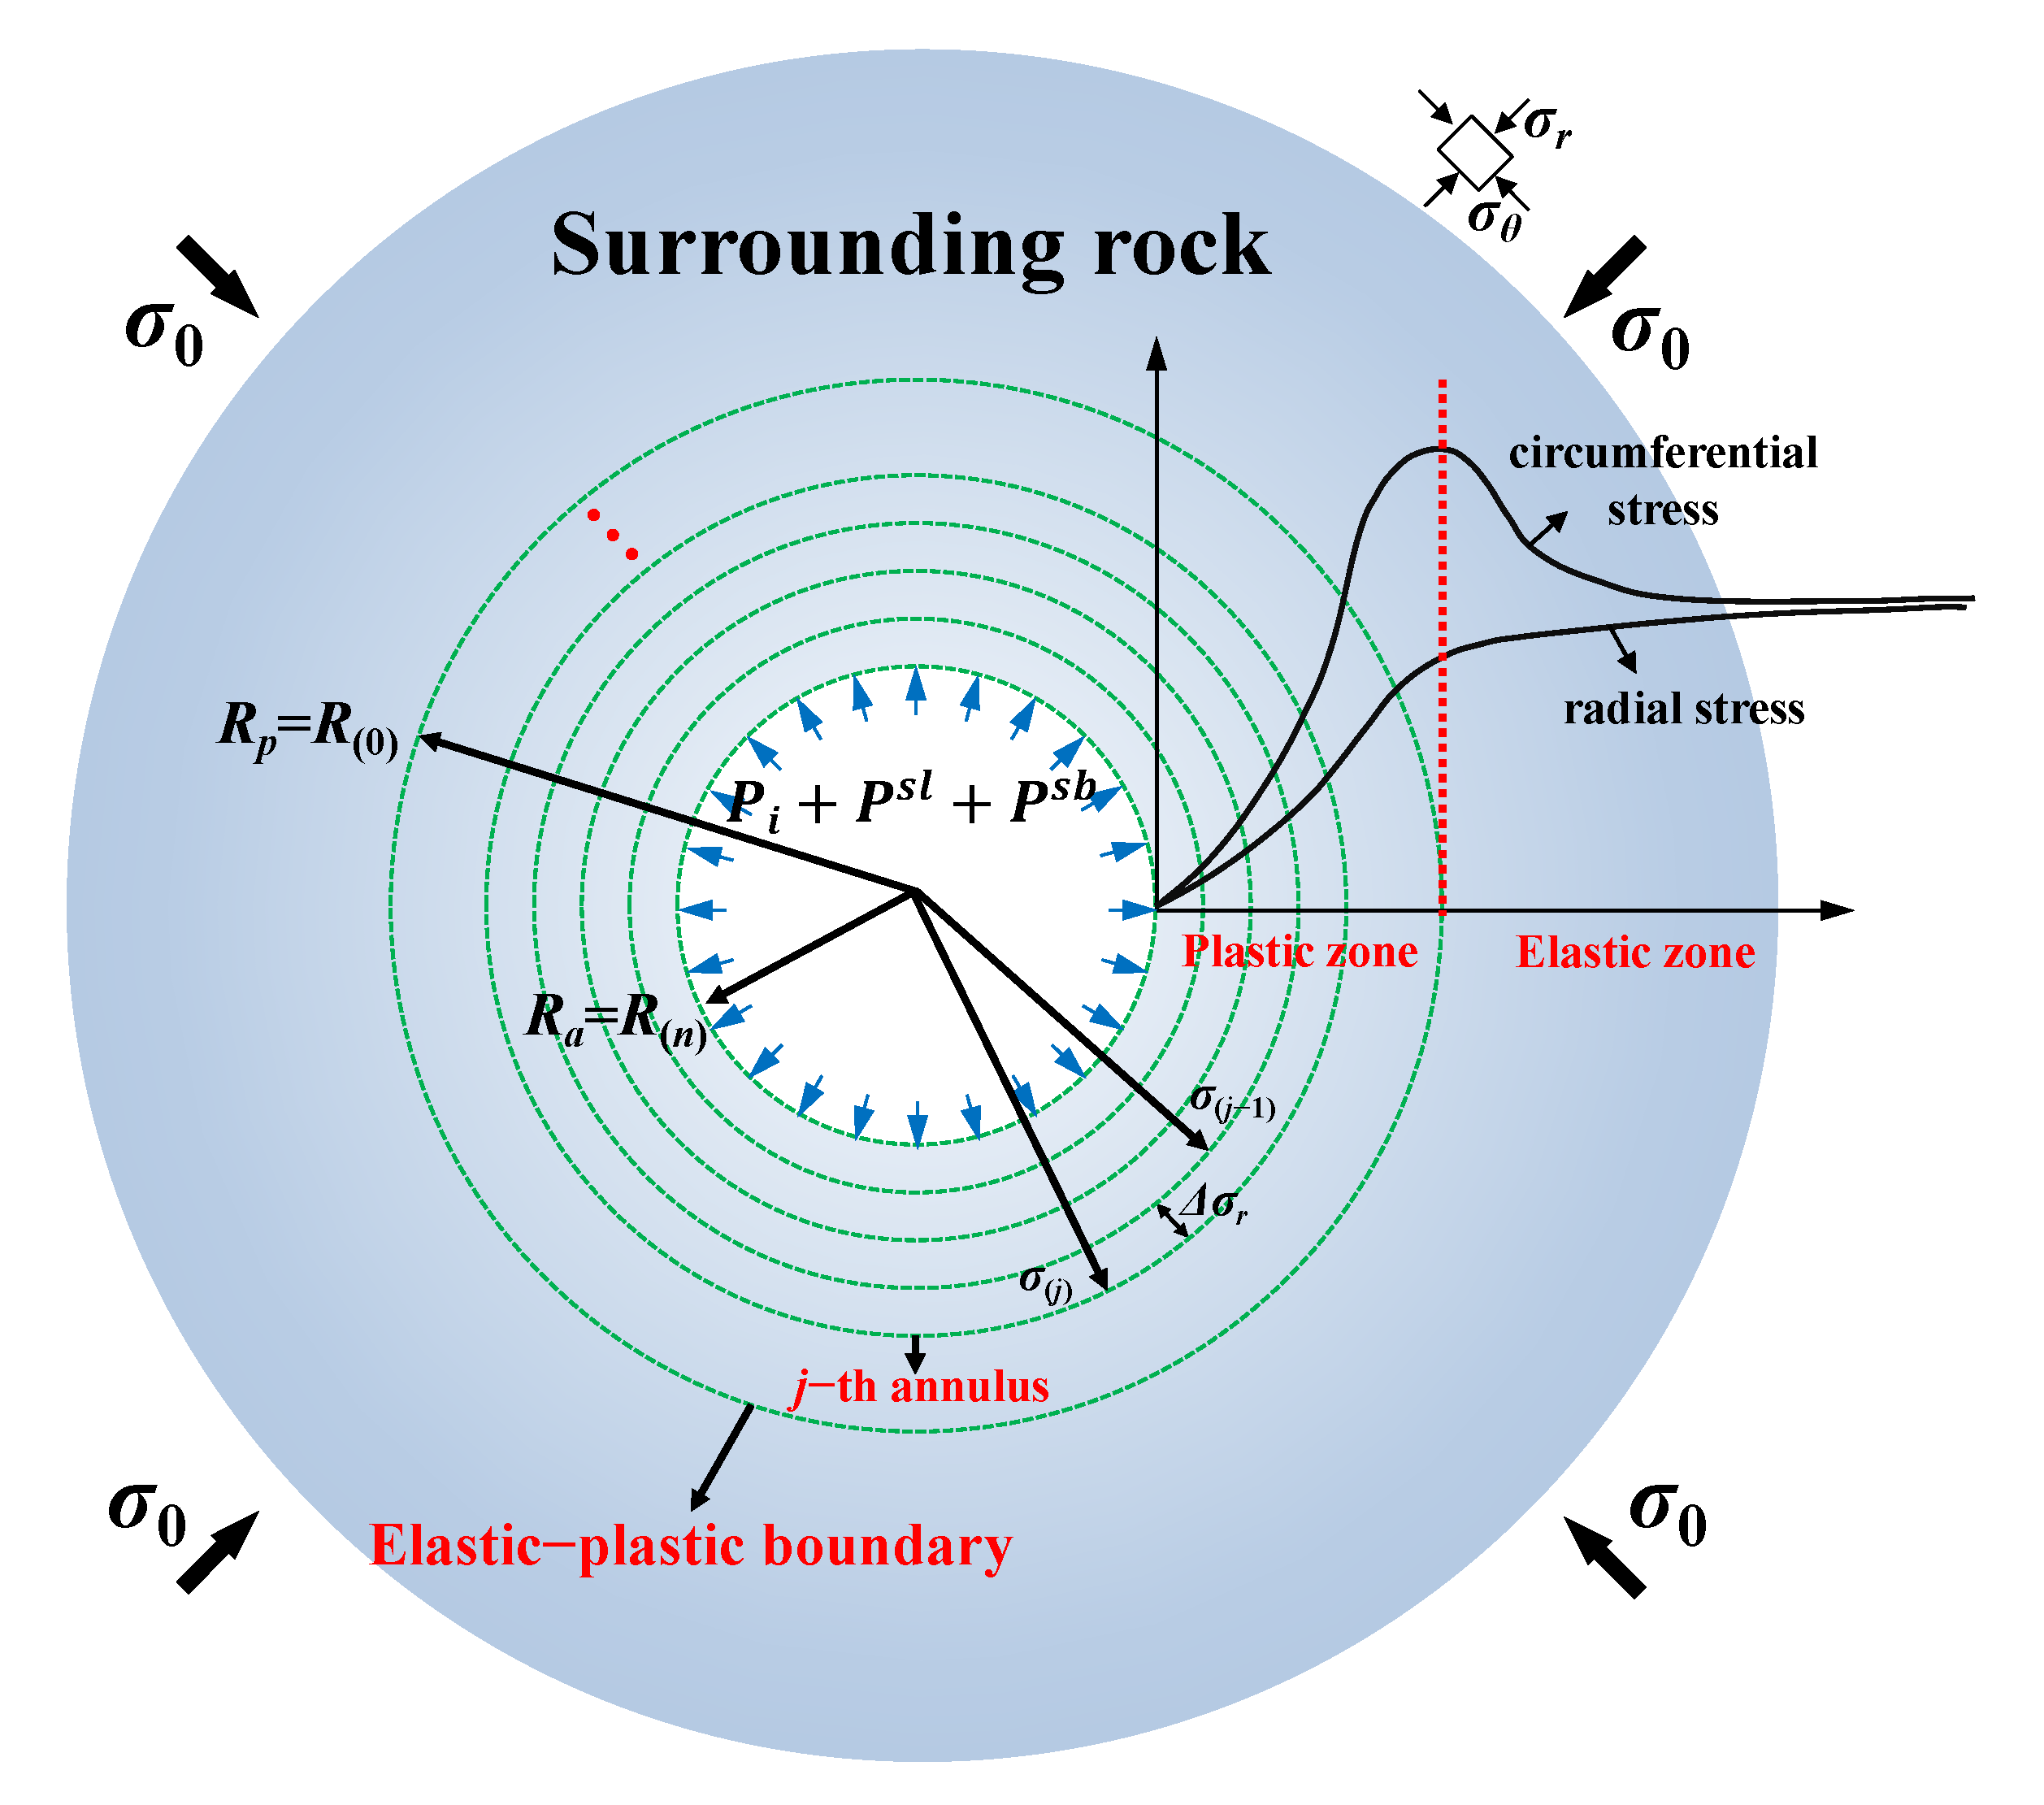
As shown in Figure 5, the plastic zone is divided into n + 1 rings, with the elastoplastic boundary as the 0-th ring and the tunnel inner wall as the n-th ring. By solving ring by ring, the stress and displacement of the surrounding rock can be obtained. The j-th ring denotes any intermediate ring, where j ranges from 0 to n.
σ j is the radial stress at the j-th ring, σ r the radial stress difference between adjacent rings, and R 0 and R n the outermost and innermost radii, respectively. The remaining mechanical parameters were introduced previously.
The difference in radial stress between adjacent annuli is as follows:
σ r = P i + P s l + P s b P i c n
The radial displacement pertaining to each annulus, u j , can be determined as follows:
u j = ε θ j ρ j R p = ε θ j ρ j R a ρ n
u j denotes the radial displacement of the j-th ring, ε θ j the tangential strain of the j-th ring, and ρ j and ρ n the normalized radii of the j-th ring and the n-th ring, respectively.

3.2. Solution of Rock–Support System

During the construction process, the collaborative bearing system of the surrounding rock and support is solved through n computational steps. Suppose that after the i-th step (1 ≤ in), the virtual support force acting on the tunnel face is P i , the load borne by the support structure is P i s , and that borne by the surrounding rock is P i r , where P i = P i s + P i r . The displacements of the support and surrounding rock are denoted as u i s and u i r , respectively. When the support is applied, the displacement of the surrounding rock is u 0 , and thus, u i s = u i r u 0 . The calculation subsequently proceeds to the (i + 1)-th step.
In the (i + 1)-th step, the virtual support force acting on the tunnel face decreases from P i to P i + 1 , with a reduction amount of P i + 1 . This reduced pressure is jointly carried by the surrounding rock and the support structure. The primary objective of the (i + 1)-th step is to analyze the distribution of the load P i + 1 . Let P i + 1 s a and P i + 1 P i + 1 s a denote the incremental load borne by the support and surrounding rock, respectively. The parameter a represents the number of iterations, initialized as 1 and increased by 1 after each iteration until a reasonable solution is achieved. Throughout the computation process, the virtual support force at the tunnel face gradually decreases from the initial in situ stress σ 0 to zero.
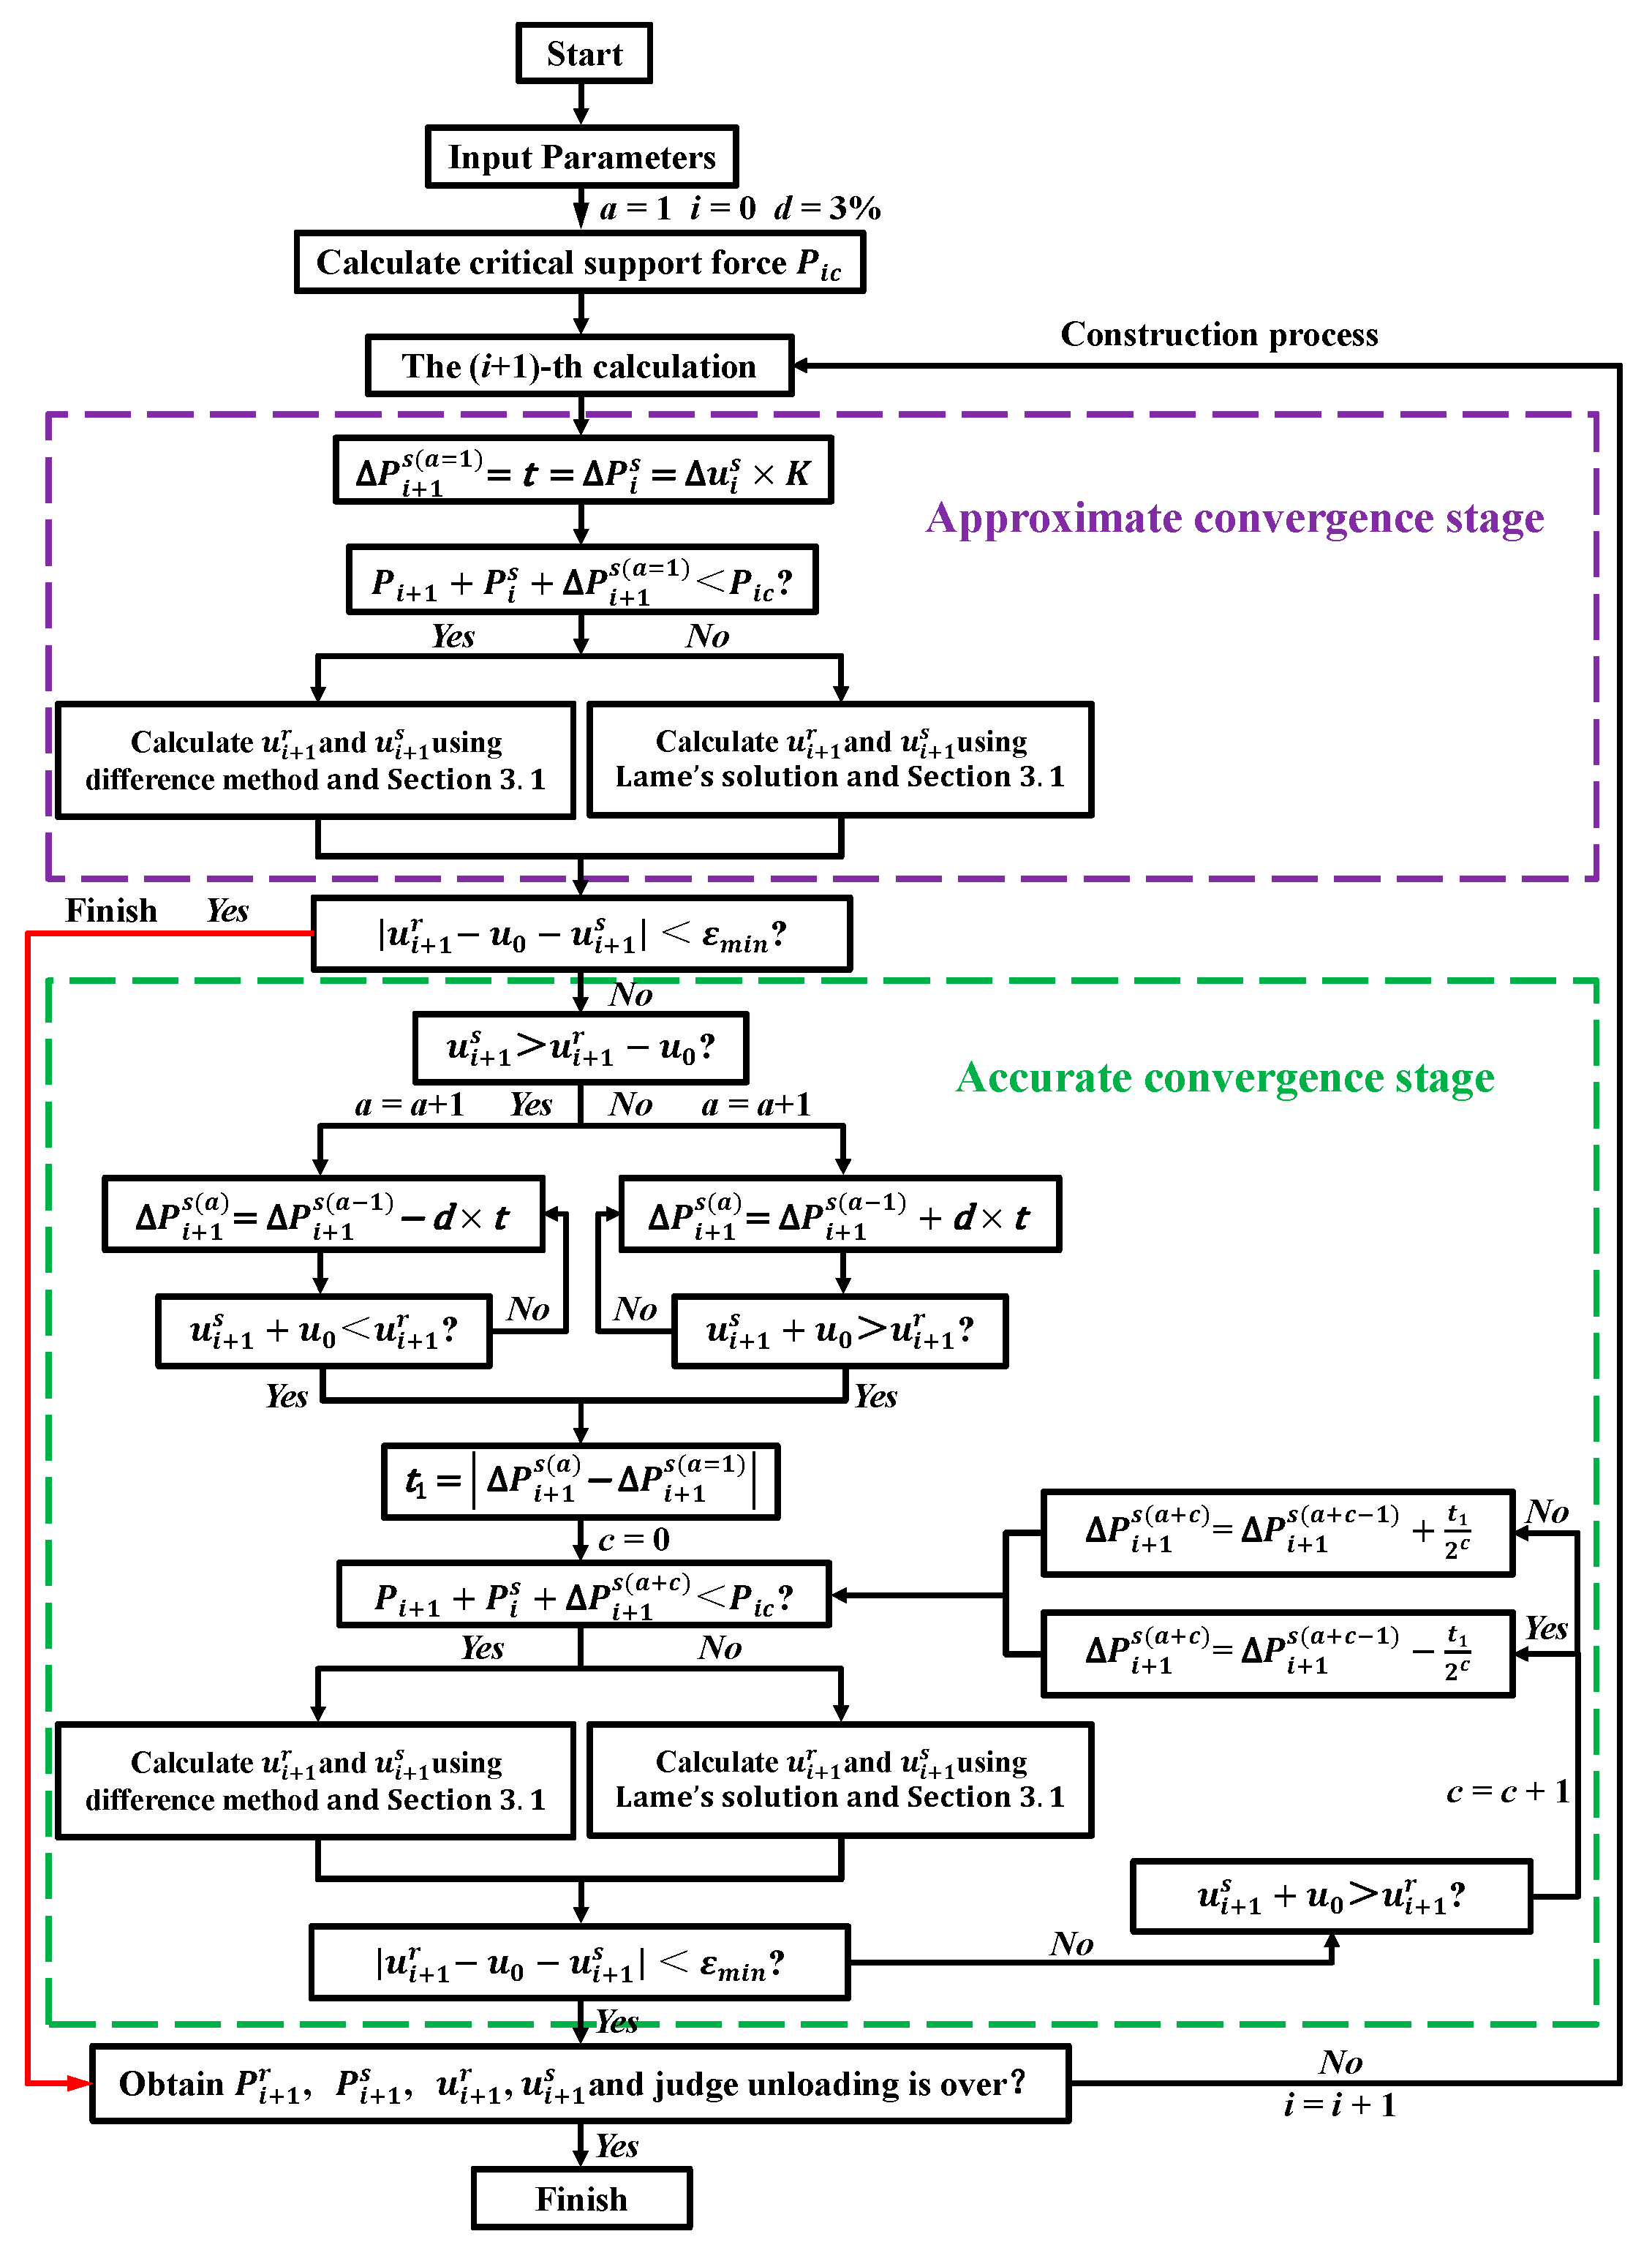
Based on the above characteristics of the surrounding rock–support interaction system, a Support Load Convergence Method (SLCM) is proposed to progressively determine the distribution of the load P i + 1 in each computational step (Figure 6 and Figure 7). The method comprises two stages: the approximate convergence and accurate convergence stages. The approximate convergence stage draws on the advantages of the ISLM, yielding a near-approximate result with a single calculation. The accurate convergence stage, inspired by the bisection method, further refines the result based on the output from the approximate convergence stage. Generally, satisfactory results can be obtained with the approximate convergence stage alone.
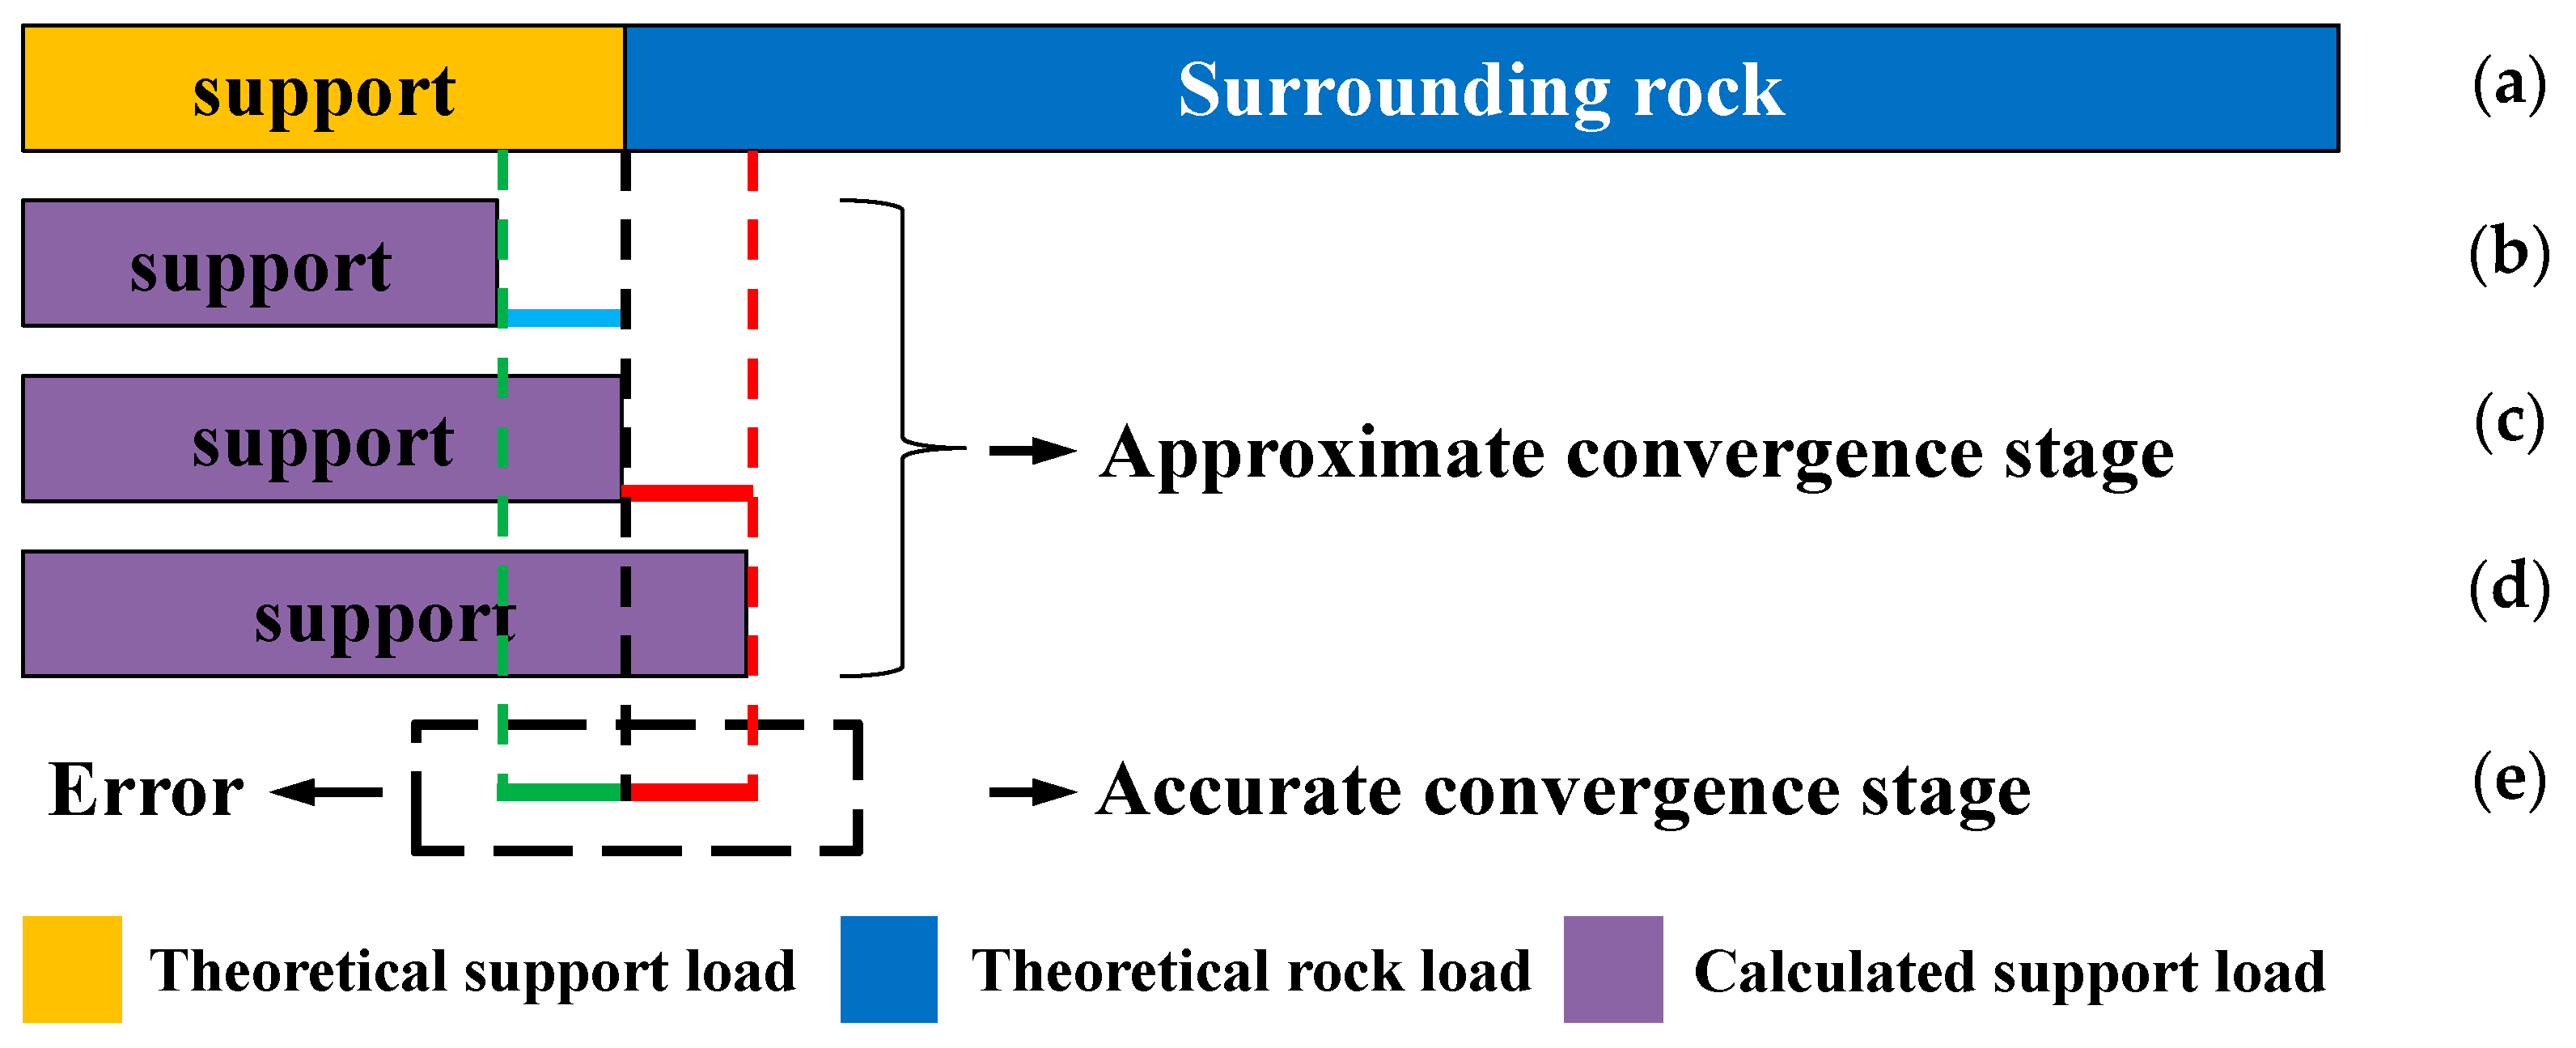
The fundamental principle of the SLCM is illustrated in Figure 6 and Figure 7 and briefly described as follows (Figure 6). In the (i + 1)-th computation, the theoretical loads of the surrounding rock and support are shown in Figure 6a, in which the blue region represents the theoretical load of the surrounding rock, and the yellow region represents that of the support. To make the calculated results gradually approach the theoretical values, the approximate convergence stage first takes place (Figure 6b–d), thus allowing the calculated support load to rapidly approach the theoretical load through a single iteration. The calculated support load is illustrated as the purple region, which may result in three scenarios: smaller than (Figure 6b), approximately equal to (Figure 6d), or greater than (Figure 6c) the theoretical load. The error is then evaluated according to Figure 6e. When the error is within the allowable range (as shown in Figure 6c, the error is negligible and therefore not displayed), the (i + 1)-th calculation is complete; otherwise, the process enters the accurate convergence stage for further adjustment.
During the accurate convergence stage, the error shown in Figure 6e is progressively refined using the bisection method until the required calculation accuracy is achieved, thus yielding the final reasonable support load.
In the (i + 1)-th computational step, the specific solution procedure of the SLCM is as illustrated in Figure 7.
Approximate Convergence Stage (shown in the purple box in Figure 7): Since the virtual support force released by the surrounding rock in two adjacent steps (e.g., steps i and i + 1) is identical, the incremental displacements of the support, u i s and u i + 1 s , are approximately equal. According to Equations (17) and (18), the incremental support load P i + 1 s exhibits a linear relationship with the displacement increment u i + 1 s . Consequently, the incremental support loads between adjacent computational steps ( P i s and P i + 1 s ) remain nearly constant. Based on this, the incremental support load in the (i + 1)-th step can be estimated using the displacement increment from the i-th step, which is expressed as P i + 1 s u i s × K . Subsequently, the mechanical parameters of the surrounding rock and support are obtained according to Section 3.1. The difference between the displacement of the surrounding rock ( u i + 1 r u 0 ) and that of the support ( u i + 1 s ) is then compared with the allowable error EMBED Equation.DSMT4, i.e., determining whether u i + 1 r u 0 u i + 1 s   <   ε min is satisfied.
If the computational error falls within the allowable range (Figure 6c), the (i + 1)-th step is complete (as shown by the red solid line in Figure 7). If the error exceeds the allowable range (Figure 6b,d), the process proceeds to the accurate convergence stage for the further refinement of the support load.
Accurate convergence stage (shown in the green box in Figure 7): First, the magnitudes of the support displacement ( u i + 1 s ) and surrounding rock displacement ( u i + 1 r u 0 ) are compared to determine whether the support load increment ( P i + 1 s a = 1 ) is overestimated or underestimated. If the support displacement exceeds that of the surrounding rock ( u i + 1 s > u i + 1 r u 0 ), it indicates that the support load increment P i + 1 s a = 1 is overestimated. In this case, P i + 1 s a = 1 should be gradually reduced to P i + 1 s a , ensuring that the support displacement ( u i + 1 s ) becomes smaller than the surrounding rock displacement ( u i + 1 r u 0 ), thereby defining the dynamic adjustment interval of the support load increment as [ P i + 1 s a = 1 , P i + 1 s a ]. The reduction from P i + 1 s a = 1 to P i + 1 s a can be achieved through one or several trial computations, with each decrement set to d × P i s (3% in this study).
Subsequently, a bisection method is applied within the interval [ P i + 1 s a = 1 , P i + 1 s a ] for fine-tuning. After each adjustment, the stress, strain, and displacement of both the surrounding rock and the support are recalculated until the computational error meets the specified criterion, i.e., u i + 1 r u 0 u i + 1 s   <   ε min , At this point, the final support load increment P i + 1 s is obtained.
If the support displacement is smaller than that of the surrounding rock, a similar iterative procedure is adopted.
At the end of the (i + 1)-th calculation step, the load P i + 1 r and displacement u i + 1 r borne by the surrounding rock, as well as the load P i + 1 s and displacement u i + 1 s carried by the support, can be obtained.

4. Model Verification

4.1. Accuracy Verification of Model 1

To validate model 1’s performance in analyzing rock–support systems, the finite difference software FLAC3D 6.0 is employed. The input parameters are adopted from a study by Lee and Pietruszczak [9], as shown in Table 1. The numerical model comprises a total of 4840 zones. Normal constraints are applied on the front and back boundaries, while a radial stress of 7.5 MPa is imposed on the lateral and top–bottom boundaries to simulate a hydrostatic stress field analogous to that considered in the theoretical analysis. The tunnel lining is modeled as a linear elastic material with an elastic modulus of 25 GPa, a Poisson’s ratio of 0.2, and a thickness of 0.5 m.
Table 2 presents the dimensional and material attributes of the systematic bolts. The excavated cavity has a 3.75 m radius. It is postulated that the stress dissipation percentages of the surrounding rock during bolt placement and lining erection are 0.55 and 0.85, respectively. Through multiple calculations, it was found that setting the calculation step n to 2000 not only meets the required computational accuracy but also ensures relatively high efficiency. Therefore, n was fixed at 2000, and the tolerance ε min was preset to 1/300.
Parameters c and φ correspond to the cohesive force and the angle of internal friction, respectively. These two values are used to characterize the shear strength properties within the framework of the Mohr–Coulomb failure criterion.
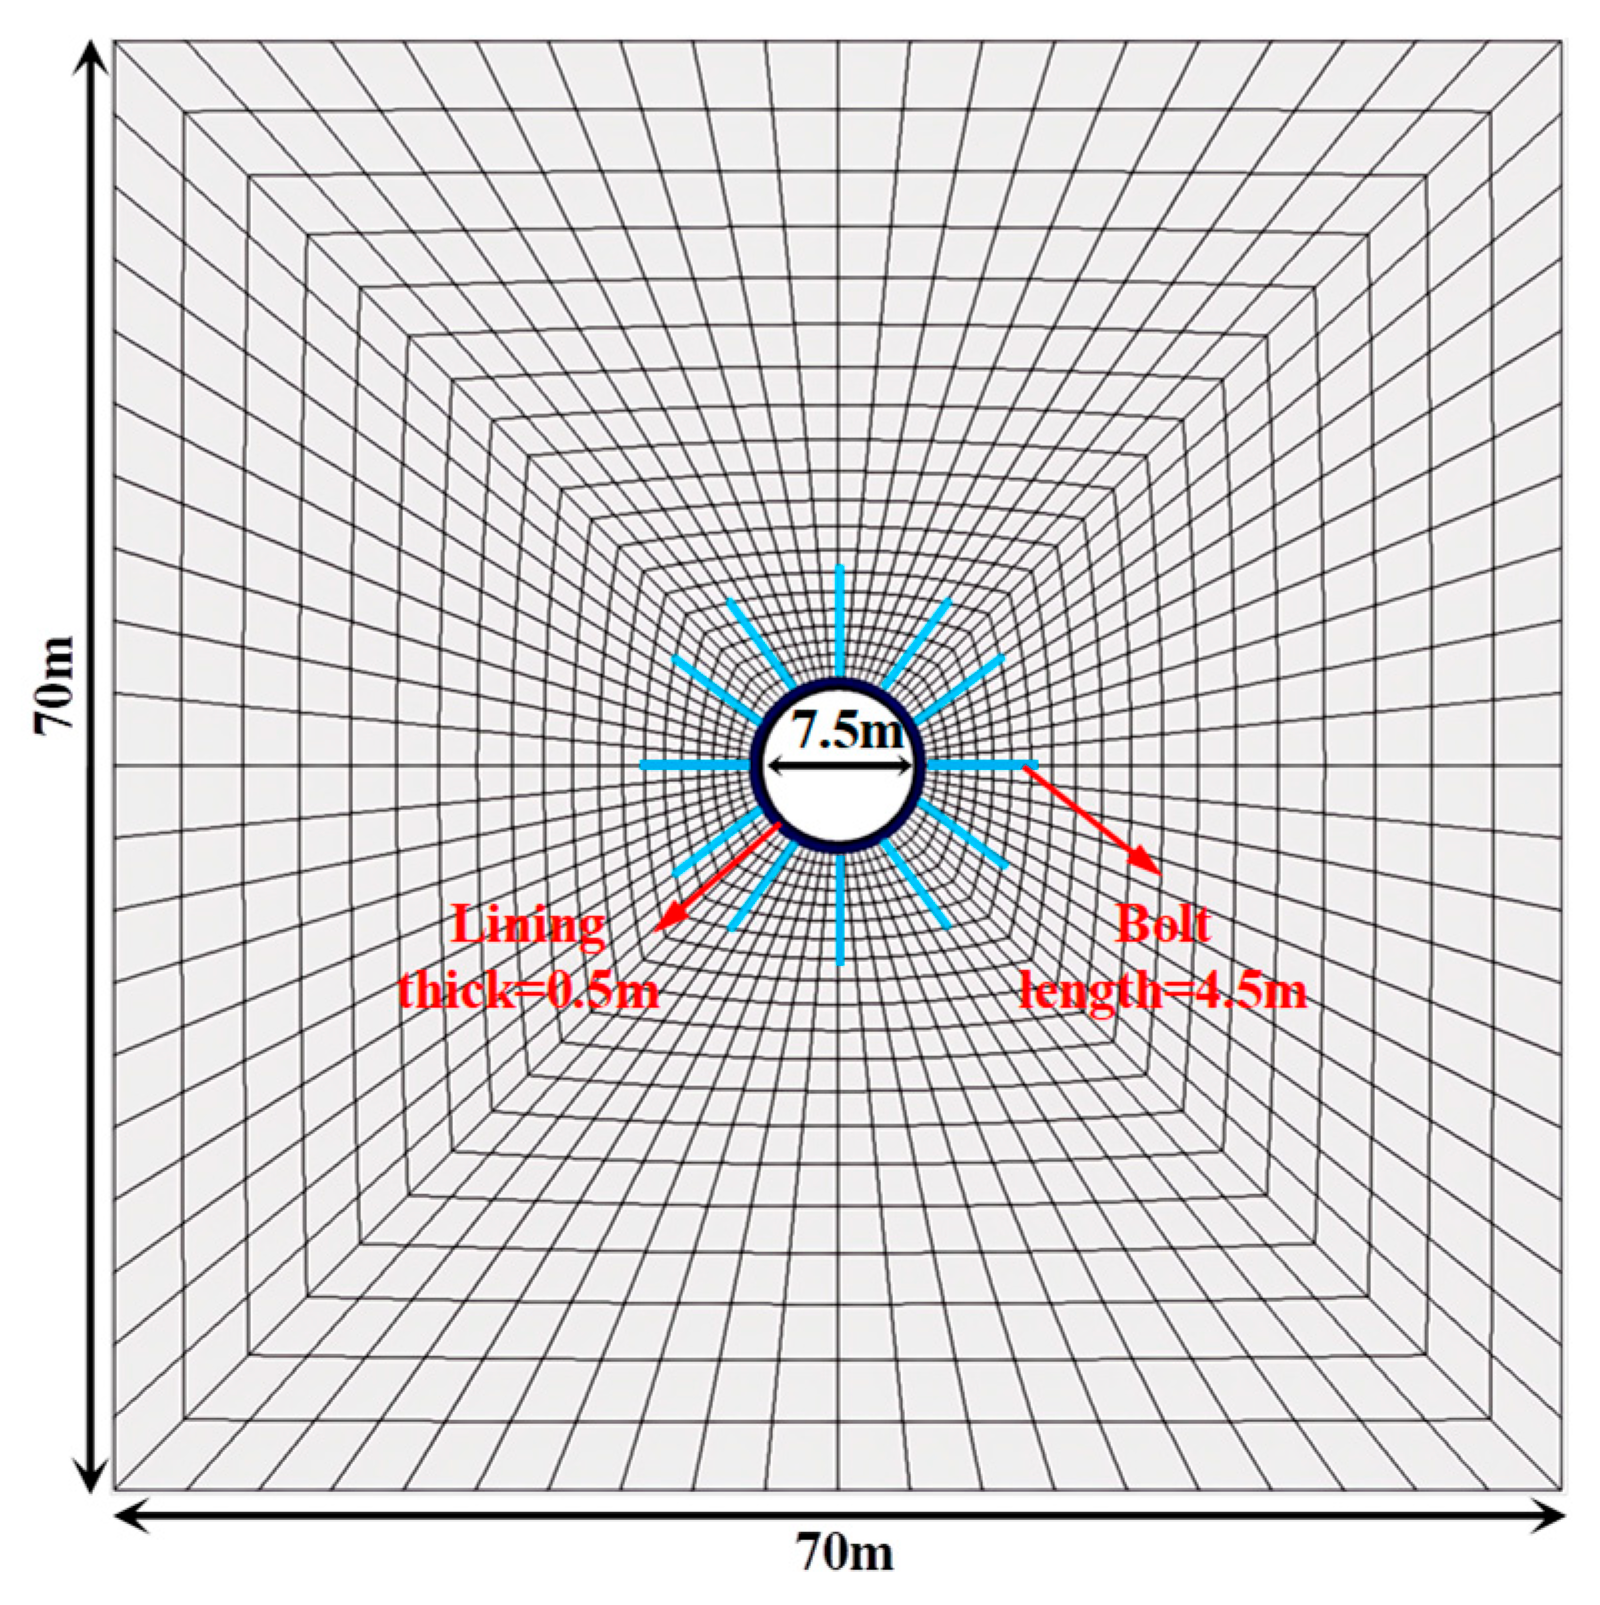
Figure 8 shows a 5 m thick numerical model in the tunnel’s lengthwise direction. The front and back sides have normal limits, so the problem can be seen as a plane strain case.
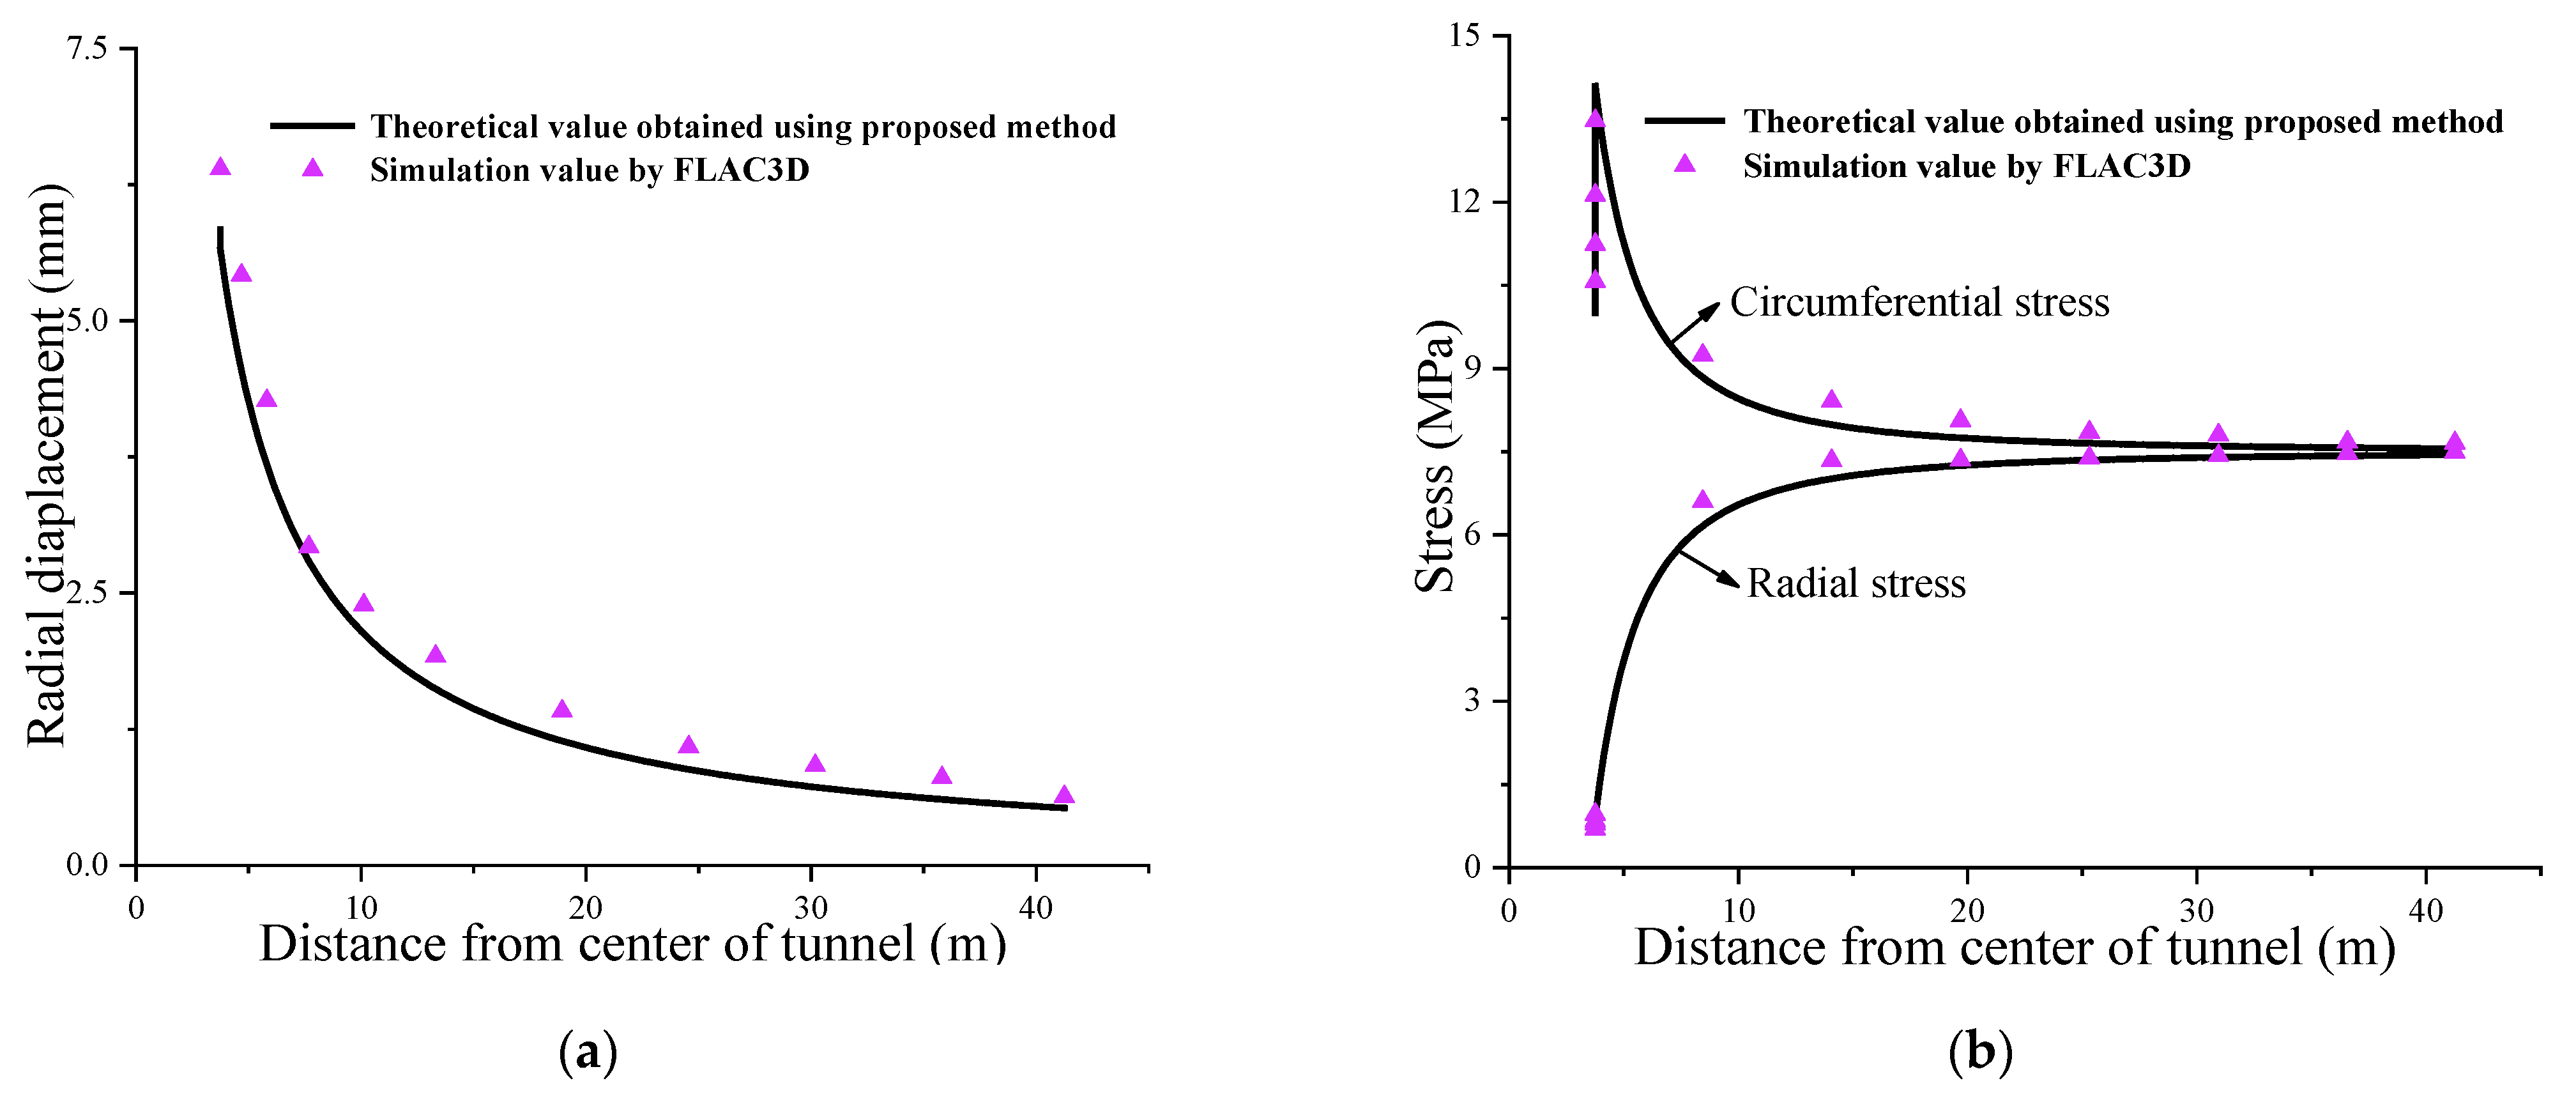
Figure 9 presents a side-by-side comparison of the theoretical estimates and numerical simulation results for surrounding rock deformation and stress distribution after tunnel excavation. The radial displacement and stress values obtained using the new method closely match those from the numerical simulation, with the maximum difference remaining below ±5%. The overall comparison shows a relative error ranging from 5% to 15%. The root mean square error remains within 13%; for example, the root mean square error of the surrounding rock displacement, as shown in Figure 9a, is 0.08 MPa, corresponding to approximately 13% of the characteristic support load, thus indicating that the numerical model is in good agreement with the theoretical predictions.
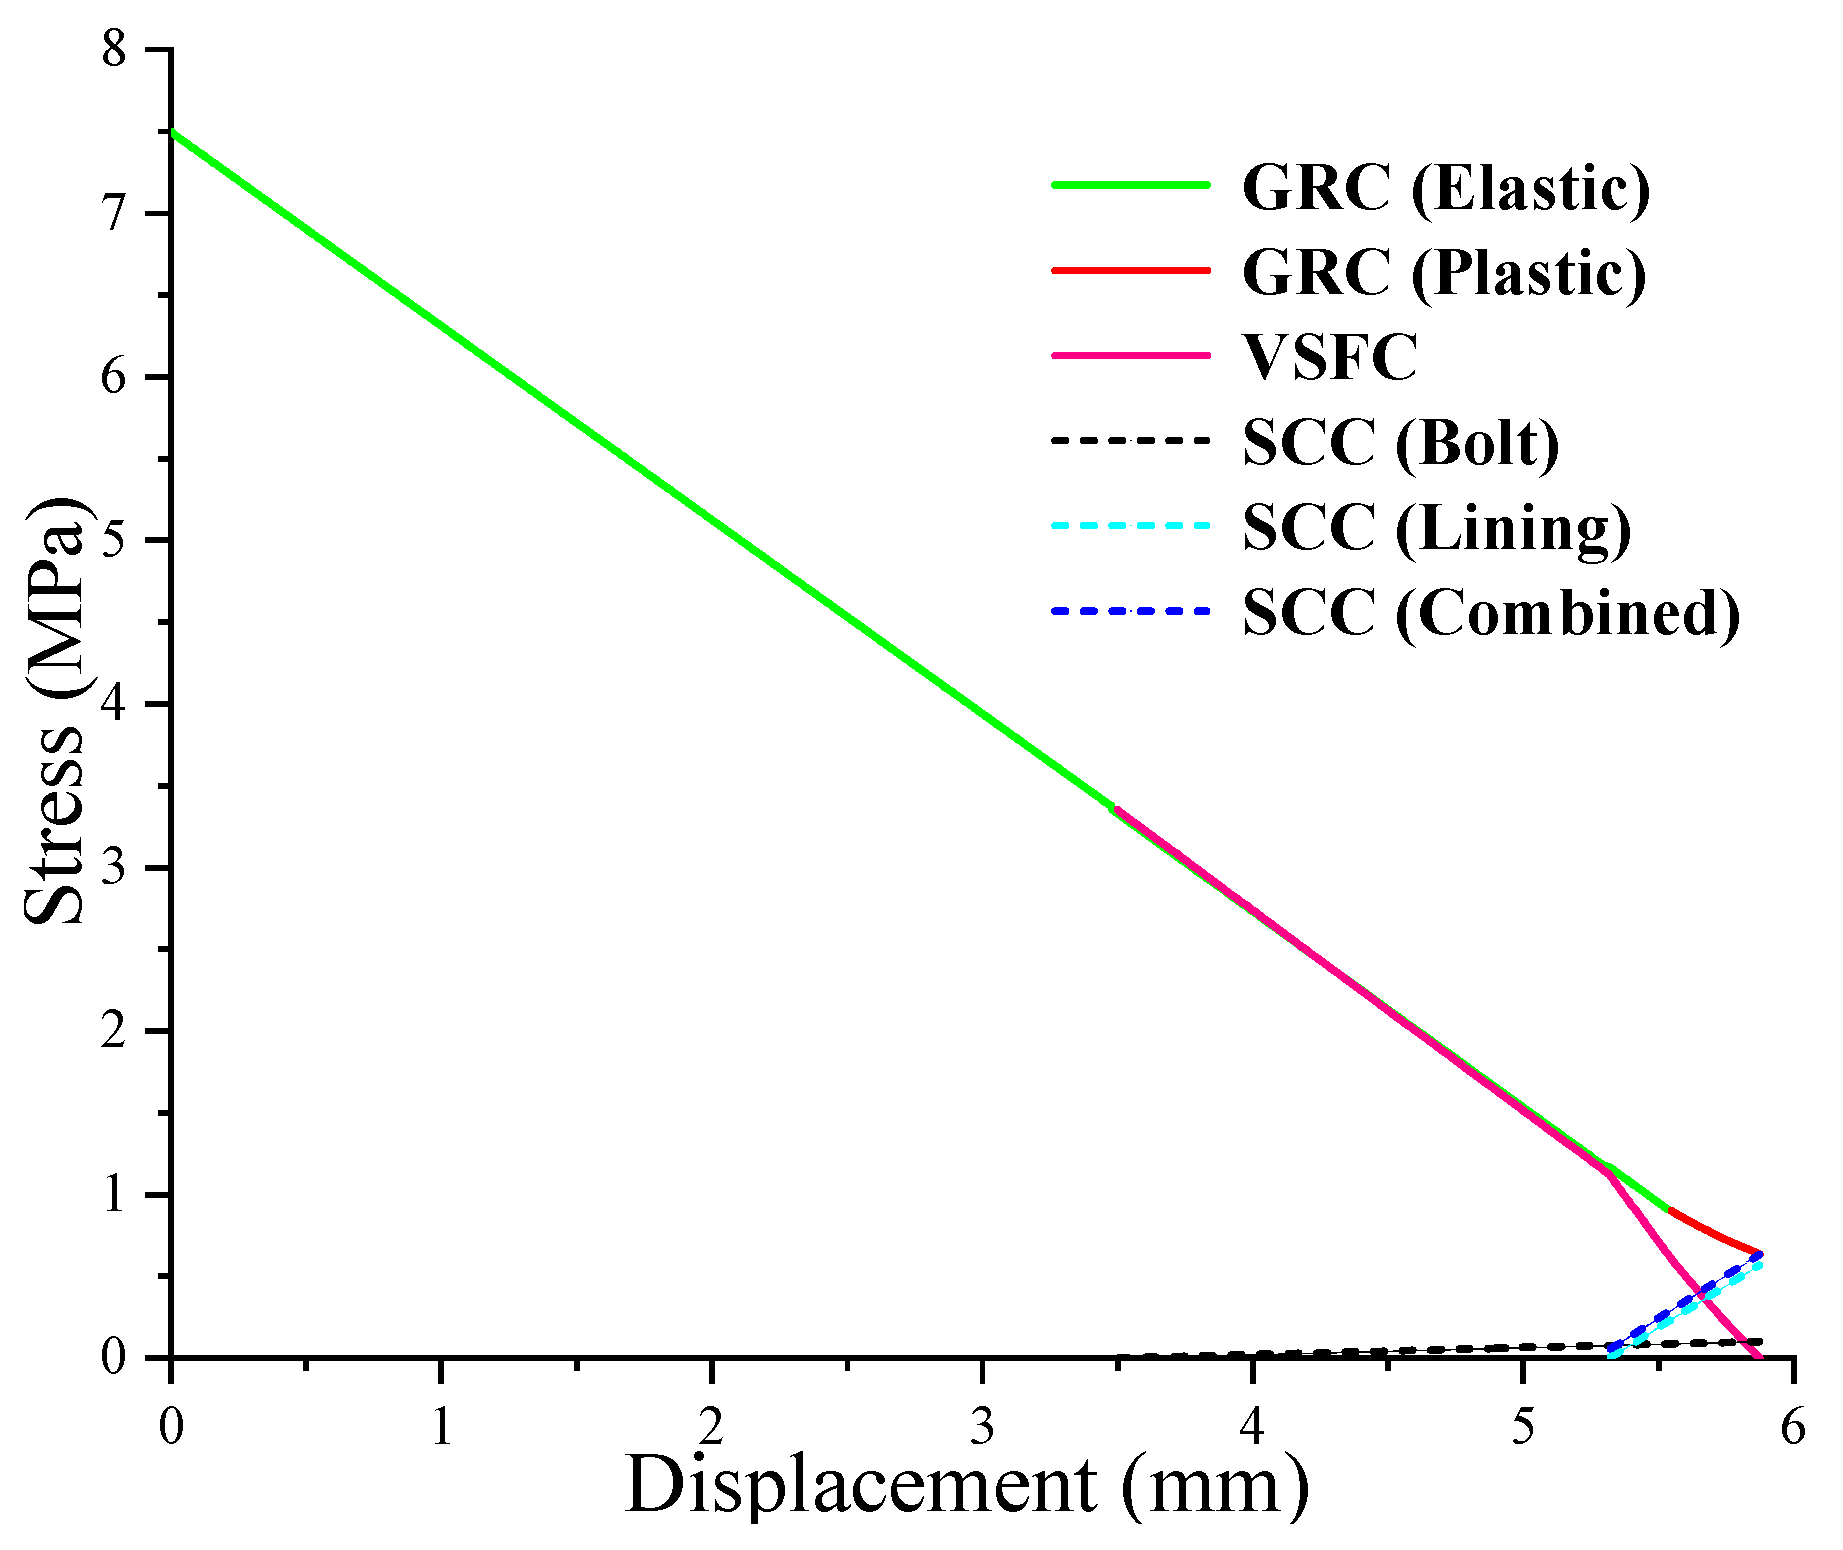
Upon reaching equilibrium between the surrounding rock and support system, the theoretically estimated support loads carried by the systematic bolts and the lining are 0.1 MPa and 0.57 MPa, respectively (Figure 10). Numerical simulations (Figure 11) show that the normal stress on the lining is nearly uniform, measuring 0.59 MPa, which closely matches the theoretical value with an error of 3.5%. The maximum axial force in the systematic bolts is 233 kN, thus corresponding to a support load of 0.1 MPa, with an error less than 3% relative to theory [3,24].
In conclusion, the results obtained from both the theoretical calculations and numerical simulations show a high degree of consistency. The theoretical predictions align closely with the outcomes from the numerical model, thus confirming the reliability of the proposed method. This match shows that the theoretical model can correctly reflect the operational features of the surrounding rock–support entity under the stated conditions.

4.2. Accuracy Verification of Model 2

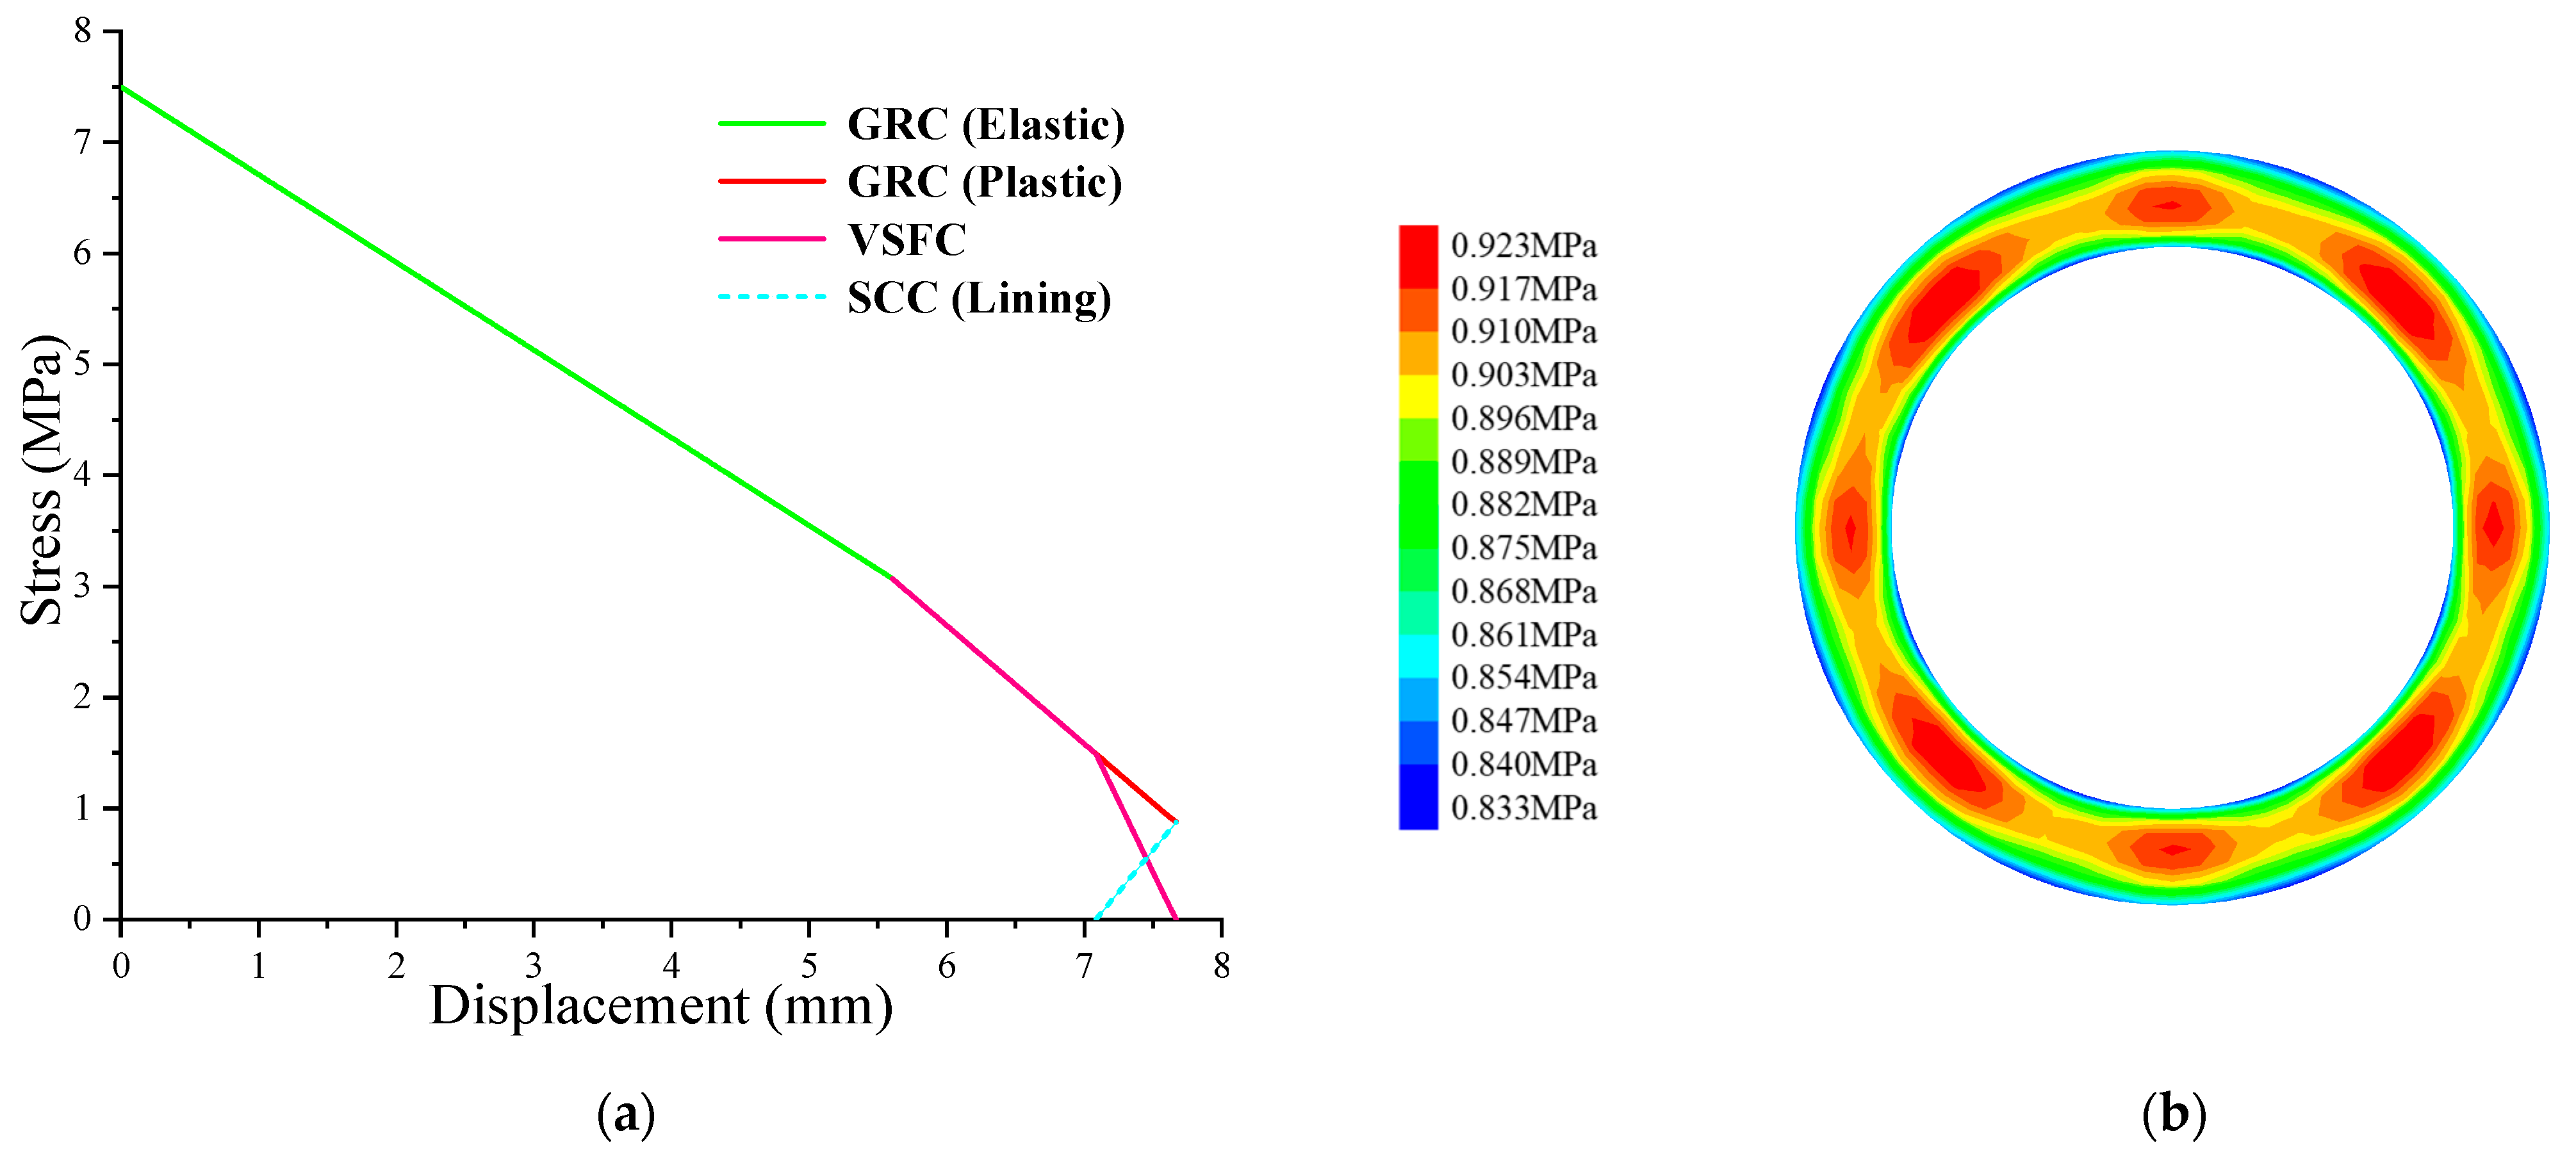
To verify the applicability of the proposed algorithm under different geological and support conditions, model 2 adopts a combined form of grouting reinforcement and lining support. The numerical and theoretical models are generally consistent with those of model 1 outlined in Section 4.1. Specifically, the grouting reinforcement thickness is equal to the tunnel diameter; the elastic modulus of the surrounding rock is 4 GPa, and that of the grouted zone is 5 GPa; and the lining modulus is 30 GPa with a thickness of 0.6 m. All other parameters remain unchanged. The numerical and theoretical results of the lining support load are shown in Figure 12.
When the surrounding rock and support system reach equilibrium, the theoretically calculated lining support load is 0.8773 MPa. The numerical simulation results show that the normal stress on the lining is uniformly distributed, with a measured value of 0.895 MPa, thus exhibiting a high level of agreement with the theoretical value and a deviation of approximately 2%. The maximum discrepancies in radial displacement and stress are within ±4%, and the root mean square error remains below 10%.
In conclusion, the theoretical calculations and numerical simulations show a high degree of consistency, thus demonstrating the reliability of the proposed method. The theoretical model can accurately reflect the load-bearing characteristics of the surrounding rock–support system under the specified conditions.

4.3. Verification of Computational Efficiency

Computational tasks were performed on a desktop equipped with an i7-6700 CPU @ 3.4 GHz, with the calculation step n set to 2000. Taking model 1 as an example, the key results were automatically output at the completion of each step, including the GRC of the surrounding rock, the variation in radial displacement, the evolution of surrounding rock stresses (radial and tangential), and the SCC of the lining and bolt. While maintaining computational accuracy, the performance of three methods was sequentially compared: the Incremental Support Load Method (ISLM) proposed by Ren et al. [24], the bisection method, and the Support Load Convergence Method (SLCM) developed in this study. The corresponding computation times are summarized in Table 3.
The computational efficiency of the ISLM is primarily governed by the support load increment (incr − i) applied at each step. When incr − i exceeded 200 Pa, the accuracy of the results was adversely affected. Therefore, in this study, incr − i was set to 10, 20, 50, 100, and 200 Pa, corresponding to computation times of 5537 s, 3981 s, 2397 s, 1473 s, and 936 s, respectively. Compared with the baseline case (incr − i = 10 Pa), the computational efficiency increased by 28.1%, 56.7%, 73.4%, and 83.1%, respectively. The results indicate that increasing incr − i significantly reduces computation time; however, since the ISLM requires iterative load increments and repeated recalculations of the rock–support responses at each step, the procedure remains complex and time-consuming. Even when incr − i reached 200 Pa, the computation still required 936 s, thus suggesting that the improvement in overall efficiency remains limited.
The computation time of the bisection method was 283 s, thus representing an efficiency improvement of approximately 69.8–94.9% compared with the ISLM, depending on the applied support load increment. This substantial enhancement in computational efficiency can be attributed to the simplified logic of the bisection method, which eliminates the need for complex matrix operations and reduces the number of intermediate variables, thereby minimizing computational resource consumption.
In the SLCM, the calculation error is constrained to remain below the prescribed tolerance, ensuring that the choice of d does not affect computational accuracy. When d was set to 3%, the corresponding computation time was only 66 s. Compared with the ISLM, the SLCM demonstrated a striking improvement in efficiency—reducing computation time by 92.9% to 98.8% (approximately 13 to 84 times faster). Even when compared with the bisection method, the SLCM still shortened computation time by 76.7%, representing a 3.3-fold improvement in efficiency.
In summary, for the present computational task, the ISLM exhibited the lowest efficiency due to its complex iterative process; the bisection method achieved a moderate level of efficiency owing to its classical convergence logic; and the SLCM, with its highly efficient and stable performance, outperformed both methods, achieving the fastest computational efficiency while maintaining excellent accuracy.

5. Discussion

The convergence–confinement method provides a clear representation of the dynamic relationship among rock mass deformation, stress release, and support reaction. It intuitively illustrates the influence of different parameters on both the surrounding rock and the support, thereby offering a basis for determining the appropriate timing of support installation and facilitating the optimization of support parameter design. In practical computations, however, an efficient and accurate method is required to obtain the relevant data supporting such analyses. The SLCM integrates the strengths of both the ISLM and the bisection method: its approximate convergence stage resembles the ISLM in that it rapidly identifies a narrow dynamic adjustment range for the support load within a very short time, while its accurate convergence stage employs the bisection method to ensure high precision. Consequently, the SLCM not only guarantees computational accuracy but also achieves a remarkable improvement in efficiency.

5.1. Effect of Surrounding Rock Mechanical Properties

As the stress released by the geological formation remains constant during each calculation stage, Equations (17) and (18) demonstrate that the displacement of the support structure and the force exerted on it present a linear-like deformation tendency. If the surrounding rock mass is in its elastic deformation condition, typically only a single computation in the approximate convergence stage is sufficient to achieve the required computational accuracy, with the calculation error being smaller than the prescribed tolerance ε min , thus making the accurate convergence stage unnecessary and ensuring very high computational efficiency. If the surrounding rock mass is in its plastic deformation condition, the incremental reduction in P i + 1 s is set to d = 3% (i.e., P i s × 3%). In some calculation steps, only one computation in the approximate convergence stage is needed to meet the required accuracy. For the remaining steps, one to two computations in the approximate convergence stage are sufficient to determine the narrow dynamic adjustment range of the support load, after which the accurate convergence stage is conducted until the absolute difference between the surrounding rock displacement ( u i + 1 r u 0 ) and the support displacement ( u i + 1 s ) falls below the preset tolerance ( ε min ).
Through multiple computational observations, it was found that the differences in both the displacement increments of the surrounding rock and the support load increments between adjacent calculation steps are generally small, with the error between P i s and P i + 1 s typically remaining within 3% and not exceeding 7% even during the softening stage. Hence, in cases where the surrounding rock exhibits favorable strength and deformation characteristics, setting d to 3% during the approximate convergence stage can markedly reduce computation time. When the surrounding rock exhibits poorer mechanical performance, d can be flexibly chosen within the range of 3% to 7%.

5.2. Influence of Step Reduction (d) on Computational Efficiency

The computational efficiency of the SLCM is affected by the step reduction factor d during the approximate convergence stage. Based on preliminary computational experiments, d was set in the range of 3% to 7% to achieve a reasonable balance between convergence speed and computational stability. Since the computational error in the SLCM is constrained within the prescribed tolerance, the value of d does not influence calculation accuracy. The corresponding computation times for d values ranging from 3% to 7% are presented in Table 4.
The underlying mechanism of this is that d determines the step size in the approximate convergence stage, which in turn affects the subsequent adjustment process in the accurate convergence stage. Specifically, a larger d allows the approximate convergence stage to be completed more rapidly. However, a larger step size also increases the error between the results obtained in the approximate convergence stage and the exact solution, necessitating more iterations in the accurate convergence stage via the bisection method, thereby increasing the total computation time. For example, when d = 7%, the total computation time is 77 s.
Conversely, a smaller d requires more computational steps in the approximate convergence stage, thus slightly increasing the time spent in this stage. However, the derived results exhibit a higher degree of approximation to the precise solution. This subsequently reduces the number of splitting operations and the duration needed during the accurate convergence stage. For example, with d set at 3%, the overall computation time amounts to 66 s. Notably, when d = 5%, the computation time reaches a minimum of 41 s, indicating the existence of an optimal d that balances the step size in the approximate convergence stage with the number of iterations in the accurate convergence stage, thereby maximizing computational efficiency while maintaining the desired accuracy.

5.3. Impact of Preset Tolerance on Accuracy and Efficiency

The prescribed tolerance ε min is also a significant factor affecting both computational accuracy and efficiency. A larger ε min leads to higher computational efficiency but lower accuracy, whereas a smaller ε min improves accuracy at the expense of efficiency.
To balance computational accuracy and efficiency, preliminary tests determined a tolerance range of 1/100–1/2000 of the displacement difference between adjacent steps, representing convergence criteria from loose to strict. With n = 2000 and d = 3%, the corresponding computation times are as listed in Table 5.
This behavior can be attributed to the close relationship between the prescribed tolerance and the number of iterations and convergence criteria during the calculation. When the tolerance is relatively large, such as 1/100, the convergence criterion can often be satisfied within the approximate convergence stage alone, or only a minimal computation in the accurate convergence stage is required, resulting in a short total computation time of 29 s, albeit with reduced accuracy. Conversely, when the tolerance is very small, such as 1/2000, the requirement for computational precision is extremely stringent. In this case, the approximate convergence stage alone is typically insufficient, necessitating extensive iterations and fine adjustments in the accurate convergence stage to meet the prescribed tolerance. Consequently, the computational process becomes highly complex and time-consuming, with the total computation time reaching 286 s, although the results are very close to the theoretical values, thus achieving high computational accuracy. It should be noted that, for the present example, to ensure accurate results, it is recommended to set ε min to 1/200 of u i + 1 r u i r or smaller.

5.4. Engineering Applicability and Limitations

Although the SLCM demonstrates significant computational efficiency and accuracy under controlled numerical simulations, its applicability in practical engineering projects still has certain limitations. First, this method is based on idealized surrounding rock conditions, including homogeneous, isotropic, and non-layered rock, with initial stresses in a hydrostatic state, which are rarely fully met in actual underground projects. Second, the SLCM assumes full-face excavation, which is difficult to achieve in mechanically complex or partially excavated sections. Third, for circular tunnels constructed using tunnel boring machines, support such as bolts or frame structures are usually not applied immediately, thus limiting the direct applicability of the SLCM in such environments. Fourth, the current method does not account for the additional load on the support generated by the weight of the rock within the excavation damage zone, which may underestimate support requirements in severely damaged areas. Finally, although the SLCM improves computational efficiency, the time saved—on the order of tens of minutes—is relatively limited in the context of long-term tunnel design projects.
Nevertheless, the SLCM remains valuable for theoretical studies, parametric analyses, and numerical validation. Compared with the traditional convergence–confinement method, the SLCM can rapidly and accurately predict the loads carried by the surrounding rock and support system prior to tunnel construction, thus achieving high efficiency while maintaining high accuracy and providing a reliable reference for optimizing support schemes.

6. Conclusions

A two-stage Support Load Convergence Method (SLCM) was developed in this study to efficiently simulate the interaction between the surrounding rock and the support system during tunnel excavation. This method combines the rapid estimation capability of the ISLM with the precision of the bisection algorithm, thus achieving high computational accuracy while substantially reducing computation time.
Parameter sensitivity analyses revealed optimal computational settings: a prescribed tolerance of ≤1/200 ensures accuracy without excessive iterations, while a step reduction factor d ≤ 3% provides efficient convergence. These findings offer explicit guidance for parameter selection in practical SLCM applications.
The SLCM effectively captures the evolution of load, stress, strain, and displacement in both elastic and elastoplastic rock masses, including post-peak softening behavior. Its adaptability enables application to a wide range of underground structures, such as tunnels, chambers, and mine roadways, thus underscoring its practical engineering utility.
Despite its advantages, the SLCM remains limited by idealized assumptions—such as homogeneous, isotropic rock masses; full-face excavation; and the neglect of gravity-induced loads within the excavation damage zone. Future work should extend the method to account for layered geological conditions, partial-face excavation, and time-dependent deformation to enhance its applicability in complex engineering environments.

Author Contributions

Conceptualization, Z.X. and Y.G.; methodology, Z.X., Y.G. and X.S.; formal analysis, Y.G. and Z.L.; investigation, Z.L. and X.C.; writing—original draft preparation, Y.G.; writing—review and editing, Z.X. and Z.B.; supervision, Z.X. All authors have read and agreed to the published version of the manuscript.

Funding

This work was supported by the China Postdoctoral Science Foundation under Grant No. 2023M731260, which is funded by the China Postdoctoral Science Foundation; and by the National Key Research and Development Program of China under Grant No. 2023YFC3208605, which is funded by the Ministry of Science and Technology of the People’s Republic of China.

Data Availability Statement

The original contributions presented in this study are included in the article. Further inquiries can be directed to the corresponding author.

Conflicts of Interest

Authors Zundang Xie, Yiwei Gao, Xiuchang Song, Xiaonian Chen, Zhengxiong Bai and Zhen Li were employed by the company Yellow River Engineering Consulting Co., Ltd. All authors declare that the research was conducted in the absence of any commercial or financial relationships that could be construed as a potential conflict of interest.

Abbreviations

The following abbreviations are used in this manuscript:
SLCMSupport load convergence method
ISLMIncremental support load method
CCMConvergence–confinement method
LDPLongitudinal displacement profile of the tunnel
GRCGround reaction curve
SCCSupport characteristic curve
RMRRock mass rating
GSIGeological strength index
incr − iIncremental load
The following symbols are used in this manuscript:
λ x Stress release ratio of surrounding rock
P i Virtual support force
P s Support force/Support load
P s l Support load carried by lining
P s b Support load carried by bolt
P i s Support force/Support load (i-th step)
P i r Rock load (i-th step)
P i c Critical support force of surrounding rock
P i + 1 Virtual support force reduction (i-th → i + 1-th step)
P i + 1 s a Support load increment, a = 1, 2, … (i + 1-th step)
P i s Support force increment (i-th step)
σ 0 In situ stress
σ r Radial stress of surrounding rock
σ r j j-th annulus radial stress
σ θ Circumferential stress of surrounding rock
σ θ j j-th annulus circumferential stress
σ n Contact force between surrounding rock and lining
σ r Difference in radial stress between adjacent annuli
ε r Radial strain of surrounding rock
ε r e Radial elastic strain of surrounding rock
ε r p Radial plastic strain of surrounding rock
ε θ Circumferential strain of surrounding rock
ε θ e Circumferential elastic strain of surrounding rock
ε θ p Circumferential plastic strain of surrounding rock
ε θ j j-th annulus circumferential strain
R a Tunnel radius
R b Radius of tunnel after lining
R s Residual radius of surrounding rock
R p Plastic radius of surrounding rock
R 0 Outermost radii
R n Innermost radii
r Radial distance from tunnel center
u Radial displacement of tunnel wall
u i s Support displacement (i-th step)
u i r Surrounding rock displacement (i-th step)
u j j-th annulus radial displacement
u 0 Radial displacement of tunnel before support
u l s Radial displacement of lining
u i s Support displacement increment (i-th step)
η Softening factor
η j j-th annulus softening factor
η p Peak magnitudes of η
η r Residual magnitudes of η
γ p Plastic shear strain of surrounding rock
γ p Critical plastic shear strain of surrounding rock
φ η Cohesion of surrounding rock
c η Internal friction angle of surrounding rock
K ψ η Dilation coefficient of surrounding rock
ψ Dilation angle of surrounding rock
G Shear modulus of surrounding rock
μ Poisson’s ratio of surrounding rock
μ c Poisson’s ratio of lining
K c Stiffness of lining
K b Stiffness of bolt
K Stiffness
E c Elastic modulus of lining
E b Elastic modulus of bolt
D Bolt diameter
L b Bolt-reinforced zone of surrounding rock/bolt length
S L Longitudinal spacings of bolt
S T Circumferential spacings of bolt
ρ Normalized radius
ρ j j-th annulus normalized radius
ε min Allowable tolerance
dIncremental reduction in approximate convergence stage

References

  1. Aygar, E.B. Evaluation of new Austrian tunnelling method applied to Bolu tunnel’s weak rocks. J. Rock Mech. Geotech. Eng. 2020, 12, 541–556. [Google Scholar] [CrossRef]
  2. Zhang, Z.; Pan, Q.; Yang, Z.; Yang, X. Physics-informed deep learning method for predicting tunnelling-induced ground deformations. Acta Geotech. 2023, 18, 4957–4972. [Google Scholar] [CrossRef]
  3. Zhang, Q.Y.; Ren, M.Y.; Duan, K.; Wang, W.S.; Gao, Q.; Lin, H.X.; Xiang, W.; Jiao, Y.Y. Geo mechanical model test on the collaborative bearing effect of rock-support system for deep tunnel in complicated rock strata. Tunn. Undergr. Space Technol. 2019, 91, 103001. [Google Scholar] [CrossRef]
  4. Li, Y.; Wang, X.; Wei, G.; Lin, Z.; Wei, X.; Yan, Z.; Yan, J.; Shen, X. Numerical study of excavation face active instability in upward shield tunneling. Buildings 2025, 15, 3371. [Google Scholar] [CrossRef]
  5. Li, Z.W.; Yang, X.L. Pseudodynamic estimation of 3D active earth pressures with a nonlinear strength criterion. Int. J. Geomech. 2023, 23, 06023013. [Google Scholar] [CrossRef]
  6. Frenelus, W.; Peng, H.; Zhang, J. Seepage actions and their consequences on the support scheme of deep-buried tunnels constructed in soft rock strata. Infrastructures 2024, 9, 13. [Google Scholar] [CrossRef]
  7. Liu, K.; Zhao, W.; Li, J.; Ding, W. Design of tunnel initial support in silty clay stratum based on the convergence-confinement method. Sustainability 2023, 15, 2386. [Google Scholar] [CrossRef]
  8. Zhang, L.; Chen, L.; Chen, J.; Luo, Y.; Guo, H.; Zhai, Y.; Wang, P. Load calculation method for deep-buried layered soft rock tunnel based on back-analysis of structural deformation. Symmetry 2024, 16, 383. [Google Scholar] [CrossRef]
  9. Lee, Y.K.; Pietruszczak, S. A new numerical procedure for elasto-plastic analysis of a circular opening excavated in a strain-softening rock mass. Tunn. Undergr. Space Technol. 2008, 23, 588–599. [Google Scholar] [CrossRef]
  10. Nie, X.; Yu, H.; Lu, J.; Zhang, P.; Fan, T. Correlation analysis and dynamic evolution research on safety risks of TBM construction in hydraulic tunnels. Buildings 2025, 15, 3359. [Google Scholar] [CrossRef]
  11. Carranza Torres, C.; Rysdahl, B.; Kasim, M. On the elastic analysis of a circular lined tunnel considering the delayed installation of the support. Int. J. Rock Mech. Min. Sci. 2013, 61, 57–85. [Google Scholar] [CrossRef]
  12. El Naggar, H.; Hinchberger, S.D.; Lo, K.Y. A closed-form solution for composite tunnel linings in a homogeneous infinite isotropic elastic medium. Can. Geotech. J. 2008, 45, 266–287. [Google Scholar] [CrossRef]
  13. Oreste, P.P. A procedure for determining the reaction curve of shotcrete lining considering transient conditions. Rock Mech. Rock Eng. 2003, 36, 209–236. [Google Scholar] [CrossRef]
  14. Kamiński, P.; Otto, A.; Dawidziuk, P.; Malinowski, L.; Stecuła, K.; Dyczko, A. Determination of the ground reaction curve for an elasto-plasto-fractured rock mass. Appl. Sci. 2024, 14, 5409. [Google Scholar] [CrossRef]
  15. Zhong, Z.; Tang, T.; Li, Y. Determination of supporting time of tunnels in the Xigeda stratum based on the convergence-confinement method. Appl. Sci. 2023, 13, 13235. [Google Scholar] [CrossRef]
  16. Dang, T.T.; Tran, M.T.; Nguyen, H.H. Ground characteristic curve and convergence confinement method—A case study. J. Min. Earth Sci. 2022, 63, 68–77. [Google Scholar] [CrossRef]
  17. Lee, Y.-L.; Kao, W.-C.; Chen, C.-S.; Ma, C.-H.; Hsieh, P.-W.; Lee, C.-M. Inverse analysis for the convergence-confinement method in tunneling. Mathematics 2022, 10, 1223. [Google Scholar] [CrossRef]
  18. Oreste, P.P. Analysis of structural interaction in tunnels using the covergence–confinement approach. Tunn. Undergr. Space Technol. 2003, 18, 347–363. [Google Scholar] [CrossRef]
  19. González Nicieza, C.; Álvarez Vigil, A.E.; Menéndez Díaz, A.; González Palacio, C. Influence of the depth and shape of a tunnel in the application of the convergence–confinement method. Tunn. Undergr. Space Technol. 2008, 23, 25–37. [Google Scholar] [CrossRef]
  20. Ranjbarnia, M.; Rahimpour, N.; Oreste, P. A simple analytical approach to simulate the arch umbrella supporting system in deep tunnels based on convergence confinement method. Tunn. Undergr. Space Technol. 2018, 82, 39–49. [Google Scholar] [CrossRef]
  21. Chang, L.; Alejano, L.R.; Cui, L.; Sheng, Q.; Xie, M. Limitation of convergence-confinement method on three-dimensional tunnelling effect. Sci. Rep. 2023, 13, 1988. [Google Scholar] [CrossRef] [PubMed]
  22. González Cao, J.; Alejano, L.R.; Alonso, E.; Bastante, F.G. Convergence-confinement curve analysis of excavation stress and strain resulting from blast-induced damage. Tunn. Undergr. Space Technol. 2018, 73, 162–169. [Google Scholar] [CrossRef]
  23. Bour, K.; Goshtasbi, K. Study of convergence confinement method curves considering pore-pressure effect. J. Min. Environ. 2019, 10, 479–492. [Google Scholar]
  24. Ren, M.; Wu, X.; Pan, J.; Liu, H.; Li, N. Theoretical and numerical studies of rock-support interaction by considering imperfect rock-lining interface. Geotech. Geol. Eng. 2023, 41, 1741–1762. [Google Scholar] [CrossRef]
  25. Zhang, Z.; Zhang, T.; Li, X.; Dias, D. Bayesian ensemble methods for predicting ground deformation due to tunnelling with sparse monitoring data. Undergr. Space 2024, 16, 79–93. [Google Scholar] [CrossRef]
  26. Zareifard, M.R.; Fahimifar, A. Analytical solutions for the stresses and deformations of deep tunnels in an elastic-brittle-plastic rock mass considering the damaged zone. Tunn. Undergr. Space Technol. 2016, 58, 186–196. [Google Scholar] [CrossRef]
  27. Paraskevopoulou, C.; Diederichs, M. Analysis of time-dependent deformation in tunnels using the Convergence-Confinement Method. Tunn. Undergr. Space Technol. 2018, 71, 62–80. [Google Scholar] [CrossRef]
  28. Guan, Z.; Jiang, Y.; Tanabasi, Y. Ground reaction analyses in conventional tunnelling excavation. Tunn. Undergr. Space Technol. 2007, 22, 230–237. [Google Scholar] [CrossRef]
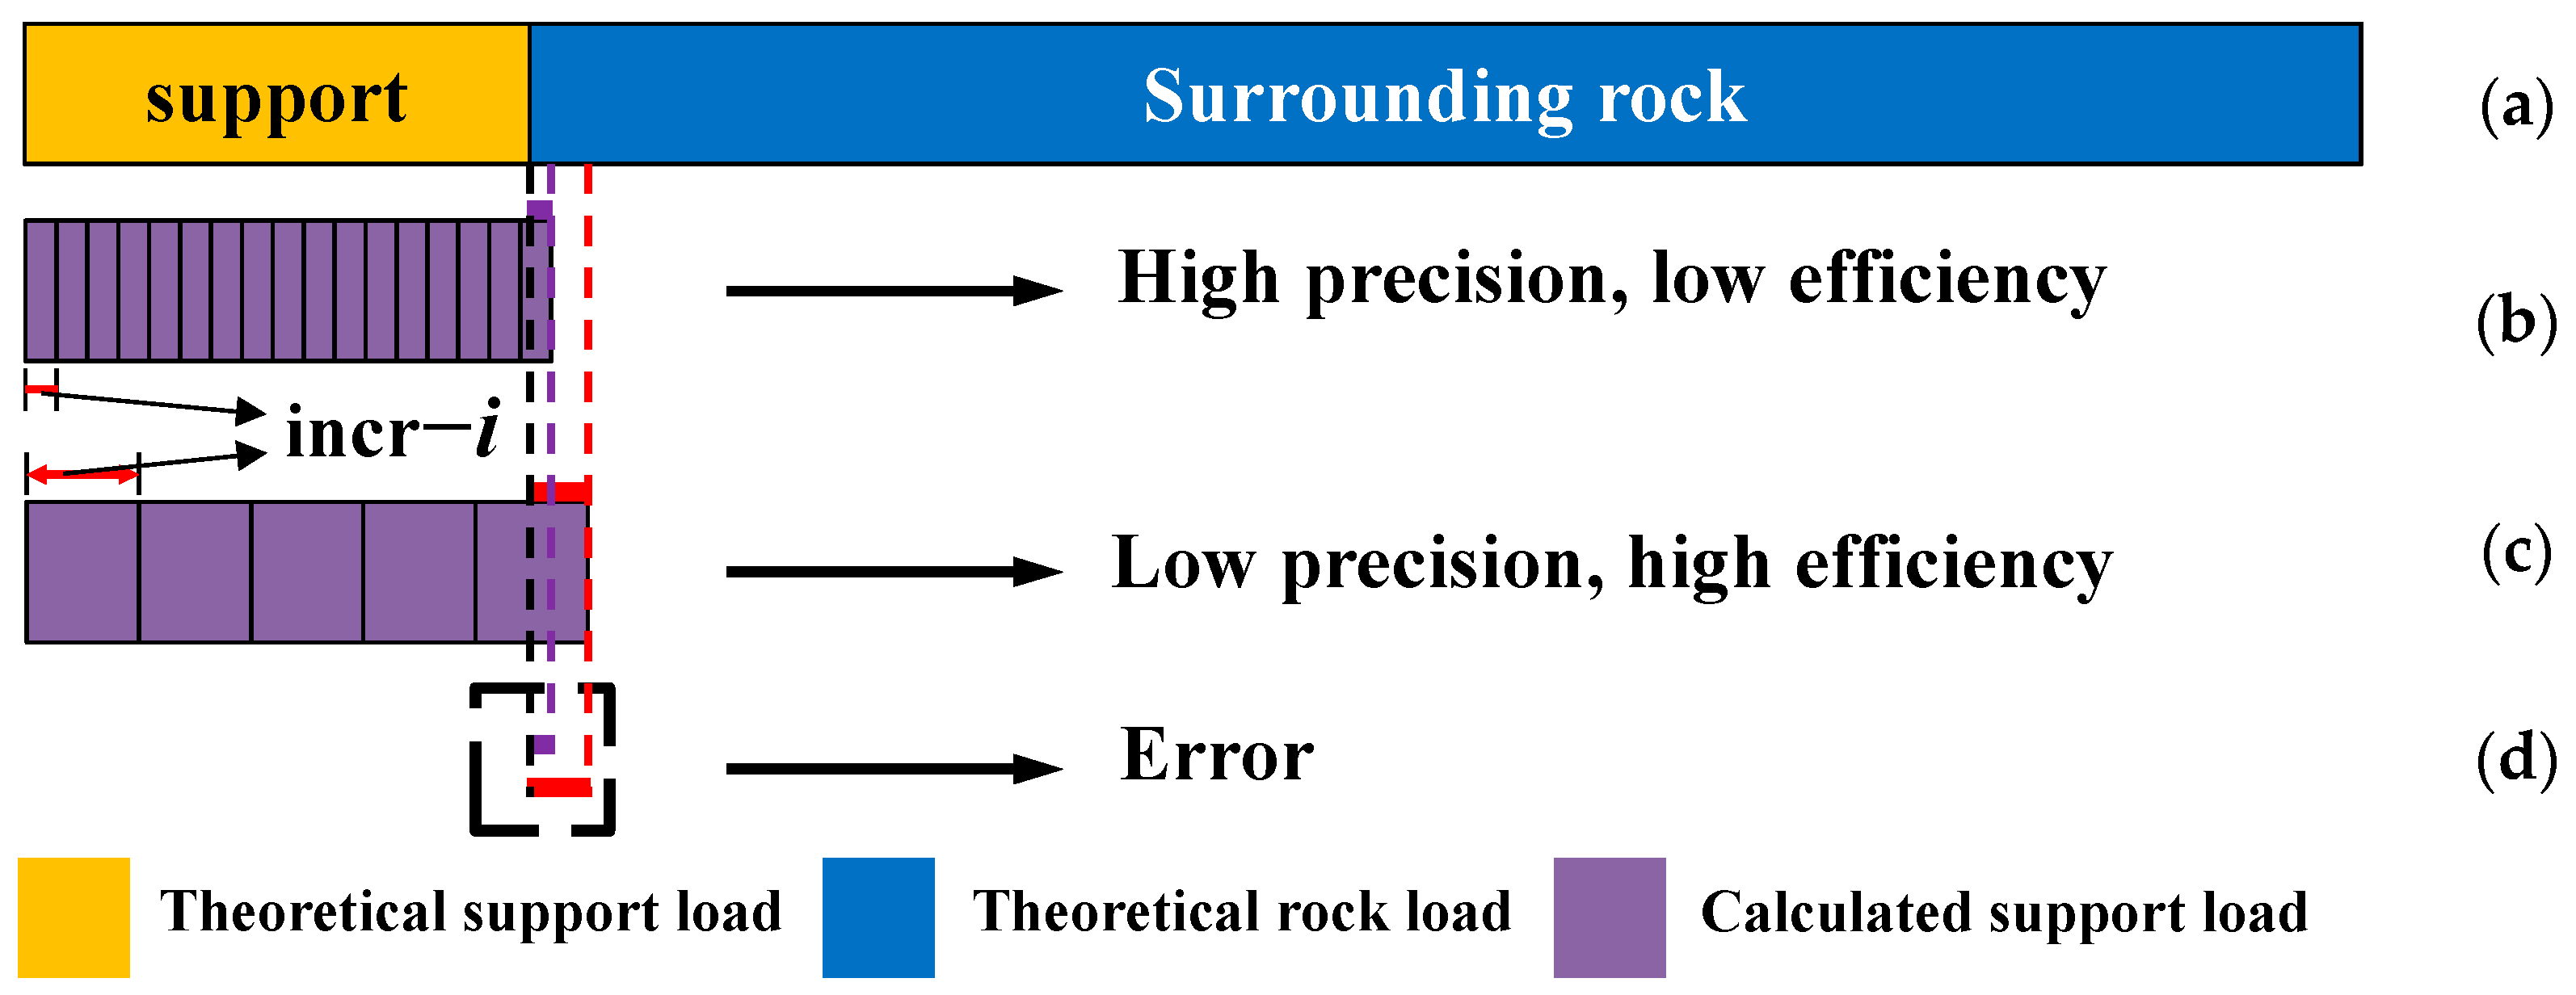
Figure 1. A diagram of the Incremental Support Load Method (ISLM): (a) Actual loads on the surrounding rock and support at the i-th calculation stage. (b) Improved precision but higher computational cost with smaller load increments. (c) Enhanced computational efficiency but reduced precision with larger load increment. (d) The error between calculated and actual support loads (The difference between the red/purple lines and the black line represents the error).
Buildings 15 04136 g001
Figure 2. This figure illustrates the spatial constraint effect at the tunnel face (The green curve corresponds to the Longitudinal Displacement Profile (LDP) of the tunnel, and the red curve to the Load Stress Release Rate Profile (LSRRP)): (a) the 3D construction sequence of a tunnel supported by bolts and lining; (b) progressive reduction in imaginary support pressure due to the tunnel face; (c) the longitudinal stress relaxation process of the surrounding rock.
Buildings 15 04136 g002
Figure 3. A schematic of the tunnel with bolt–lining combined support.
Buildings 15 04136 g003
Figure 4. The axisymmetric issue concerning the joint load-carrying capacity of the surrounding rock–support assembly (using the lining as an illustrative case): (a) the surrounding rock–support system collaborative bearing system; (b) the surrounding rock subsystem; (c) the support subsystem (lining).
Buildings 15 04136 g004
Figure 5. An analysis model of the plastic zone consisting of several concentric annuli.
Buildings 15 04136 g005
Figure 6. Diagram of Support Load Convergence Method (SLCM): (a) Actual and theoretical loads on surrounding rock and support at (i + 1)-th stage. (b) Underestimated support load—below actual value, error beyond tolerance. (c) Support load approaching actual value—error within tolerance. (d) Overestimated support load—above actual value, error beyond tolerance. (e) Error assessment and decision regarding transition to accurate convergence stage (The difference between the red/green lines and the black line represents the error).
Buildings 15 04136 g006
Figure 7. Computational flowchart of Support Load Convergence Method (SLCM).
Buildings 15 04136 g007
Figure 8. FLAC3D simulation model used for numerical analysis.
Buildings 15 04136 g008
Figure 9. A comparison of radial displacement and stress in the surrounding rock: (a) Variation in radial displacement with distance from the tunnel center (mm). (b) Variation in surrounding rock stress with distance from the tunnel center (MPa).
Buildings 15 04136 g009
Figure 10. Synergistic load-bearing mechanism of surrounding rock and support (MPa).
Buildings 15 04136 g010
Figure 11. The Flac3d simulation results—normal stress distribution on the lining and axial force variation in the bolt: (a) The axial force of the bolt (KN). (b) Normal stress on the lining (MPa).
Buildings 15 04136 g011
Figure 12. Numerical and theoretical results of model 2: (a) Synergistic load-bearing mechanism between surrounding rock and support in model 2 (MPa). (b) Normal stress on lining (MPa).
Buildings 15 04136 g012
Table 1. The mechanical characteristics of the rock mass surrounding the excavation.
Elastic ModulusPoisson’s RatiocφDilation Angle η *
(GPa) (MPa)°°
Peak value5.80.352.240150.01
Residual value5.00.350.7225
Table 2. The dimensional and mechanical characteristics of the fastening bolt.
DiameterLengthLongitudinal SpacingCircumferential SpacingElastic ModulusPoisson’s Ratio
(m)(m)(m)(m)(GPa)
0.034.51.151.962000.2
Table 3. Computational efficiency and accuracy of ISLM, bisection method, and SLCM.
MethodParameter (Pa or %)Time (s)Efficiency Improvement (%)Accuracy
ISLMincr − i = 10 Pa55370.0Moderate
incr − i = 20 Pa398128.1Moderate
incr − i = 50 Pa239756.7Moderate
incr − i = 100 Pa147373.4Moderate
incr − i = 200 Pa93683.1Moderate
Bisection Method 28369.8–94.9High
SLCMd = 3%6692.9–98.8Very High
Table 4. Effect of step reduction d on SLCM computational time.
Step reduction d (%)34567
Computation time (s)6652416177
Table 5. Effect of prescribed tolerance on computational efficiency and accuracy.
Prescribed ToleranceTime (s)Accuracy/Remarks
1/10029Fast computation, lower accuracy
1/20053Recommended minimum for accurate results
1/30066Higher accuracy, moderate computation time
1/50097Accuracy further improves; computation time increases
1/1000159High accuracy, long computation time
1/2000286Very high accuracy, very time-consuming
Disclaimer/Publisher’s Note: The statements, opinions and data contained in all publications are solely those of the individual author(s) and contributor(s) and not of MDPI and/or the editor(s). MDPI and/or the editor(s) disclaim responsibility for any injury to people or property resulting from any ideas, methods, instructions or products referred to in the content.