Article

Revealing the Mismatch Between Residents’ SWB and Residential Environment Quality in Old and New Urban Areas: Community-Level Evidence from Two Historic Cities in China

School of Architecture, Southeast University, Nanjing 210096, China
*
Author to whom correspondence should be addressed.
Buildings 2025, 15(22), 4135; https://doi.org/10.3390/buildings15224135
Submission received: 23 October 2025 / Revised: 8 November 2025 / Accepted: 13 November 2025 / Published: 17 November 2025
(This article belongs to the Section Architectural Design, Urban Science, and Real Estate)

Abstract

Rapid urbanization in developing countries has produced a marked mismatch between residents’ subjective well-being (SWB) and residential environment quality (REQ). Visually appealing new urban areas do not necessarily yield higher well-being, while dense old districts do not always exhibit low well-being. To explain the emergence of this perceptual bias (PB), this study advances a dual-pathway perspective that links the visual dimension of REQ to the psychological dimension of SWB. We develop an interpretable, spatially explicit machine-learning framework that integrates social-media-derived SWB, street-view-based perceptual metrics, and multi-scale built-environment and socioeconomic indicators at the community level. Using Beijing and Nanjing—two historic Chinese cities—as contrasting cases, we examine how facility density, greenness, accessibility, and housing market conditions jointly shape PB across old cores and newly developed districts. The framework identifies nonlinear responses and planning-relevant thresholds, providing a transferable approach for diagnosing REQ–SWB divergences and prioritizing regeneration strategies. Moving beyond a single “environment → well-being” logic toward a social–spatial interaction perspective, this study offers evidence-informed guidance for well-being-oriented and context-sensitive urban renewal in historic cities and other rapidly urbanizing settings.

1. Introduction

Subjective well-being (SWB) reflects the extent to which individuals perceive their overall quality of life as favorable [1]. It serves not only as an indicator of personal subjective welfare and utility but also as a key measure for assessing social welfare at a collective level [2]. In contemporary urban life, rising daily stress has led to a growing prevalence of mental and psychological problems. Consequently, fostering healthy communities and promoting positive subjective well-being among citizens have become a global challenge. This topic has long attracted interdisciplinary attention from psychology, sociology, and economics. In recent years, with the acceleration of urbanization, scholars in urban studies, transportation, and geography have increasingly explored the relationship between well-being and the built environment [3,4,5,6]. However, most existing studies on the spatial variation of SWB have focused on national or regional scales, with relatively limited attention to intra-urban differences. Little is known about how the developmental trajectory within cities shapes the spatial patterns of SWB. Given that China’s rapid urbanization in recent years has profoundly reshaped both the macro-scale urban structure and the micro-scale neighborhood environment, examining the intra-urban disparities in SWB and identifying corresponding strategies for urban renewal under the national paradigm of incremental planning and regeneration is of significant importance.
What impact do material environmental changes driven by urban development disparities have on residents’ SWB? In other words, if urban planners improve the physical environment of a neighborhood, will residents’ well-being increase correspondingly? Numerous studies have shown that residents’ SWB is indeed influenced by their subjective perceptions of the urban environment [7,8]. Safe transportation, abundant greenery, accessible street facilities, harmonious visual composition, and vibrant commercial interfaces can all provide pedestrians with positive visual experiences, thereby enhancing feelings of safety, sociability, pleasure, and comfort that contribute to greater well-being. According to conventional thinking in urban studies, areas with higher perceived environmental quality are expected to exhibit higher levels of well-being. However, growing evidence suggests that the effects of physical environmental changes induced by urban development on SWB are far more complex. Compared with visual improvements alone, SWB differences may be more strongly shaped by broader socioeconomic and planning factors such as income inequality and mobility systems. For instance, in low-density Western cities, newly developed suburban communities with high-quality environmental amenities often suffer from low residential satisfaction, weak attractiveness, and limited vitality [9]. Conversely, in informal settlements with poor living conditions, strong social ties may compensate for diminished residential satisfaction [10]. In developing countries, the convenience and comprehensive services of old urban centers may generate greater well-being than the aesthetically pleasing but less functional new districts [4]. These findings reveal a mismatch between improvements in the visual environment and residents’ SWB. Consequently, planners and architects may achieve less than expected when focusing solely on visual design enhancements.
Environmental psychology provides a theoretical explanation through the Person–Environment Fit framework: subjective well-being is not determined by environmental quality per se but by the match between environmental demands (e.g., accessibility, complexity, and stimulus intensity) and individuals’ abilities and needs (e.g., mobility capacity, time budget, travel purpose) [11]. When urban renewal projects enhance streetscape aesthetics, spatial density, or design sophistication without ensuring that walkability, legibility, inclusiveness, and maintenance correspond to residents’ everyday capabilities, such improvements may increase “use costs,” thereby diminishing perceived pleasure, control, and safety. From the perspective of place attachment and social embeddedness, emotional bonds to place, local acquaintance networks, and collective efficacy act as crucial mediating and moderating factors linking environment and SWB [12]. In well-serviced and accessible historic districts, strong social ties and everyday convenience can sustain high levels of well-being despite modest physical conditions. Conversely, in visually appealing but socially fragmented new developments with longer commutes, well-being may be suppressed by expectation–reality gaps and daily stress [13,14]. Together, these mechanisms suggest that the enhancement of visual environmental quality does not automatically translate into proportional gains in well-being. Its effect is systematically conditioned by environmental fit and social embedding, explaining the diverse configurations of “strong environment–weak SWB” or “weak environment–strong SWB” observed across different urban contexts [4,9,10]. This mechanistic insight underscores that, without identifying and quantifying such perceptual discrepancies, urban renewal policies risk misallocating resources and failing to achieve genuine improvements in residents’ well-being.
In addition, spatial studies on SWB have predominantly relied on linear regression methods, which often overlook the complex nonlinear effects of urban factors. For example, hierarchical linear modeling [7], ordinary least squares regression [15], structural equation modeling [15,16], and geographically weighted regression [17] have been widely used to examine the spatial effects of urban environments on well-being. However, such linear assumptions may not hold for all urban variables. Sole reliance on linear models can produce biased conclusions and limit the effectiveness of planning interventions [18]. To simultaneously capture spatial dependencies and nonlinear relationships, recent geographic studies have integrated spatial attributes into machine learning frameworks by incorporating geographic covariates, spatial autoregressive terms, and eigenvectors derived from distance matrices [19,20,21]. For instance, Credit [22] compared traditional spatial statistical models with machine learning in analyzing employment density around Los Angeles transit stations, finding that machine learning models with spatial lag features achieved the highest predictive performance.
Against this backdrop, this study selects Beijing and Nanjing—two historically representative cities with distinct developmental trajectories—as comparative cases. Leveraging large-scale social media data and street-view imagery, we employ natural language processing and a support vector machine algorithm to assess the spatial distribution of residents’ SWB and REQ. After computing the standardized deviation between the two measures, we use the variance inflation factor method to mitigate multicollinearity and identify key physical and socioeconomic variables significantly influencing perception bias. These variables are then incorporated into an XGBoost regression model (version 2.1.0) with spatial lag features, and SHAP main-effect analysis is applied to interpret the nonlinear relationships between urban factors and perception bias.
The main contributions of this study are as follows: (1) it provides the integrated analysis of the mismatch between visual environmental perception and residential well-being, using standardized deviation to obtain precise regression results; (2) it offers comparative evidence from two regionally representative Chinese cities of different scales and full historical cycles, providing empirical references for urban studies in China and other developing countries; and (3) it combines machine learning with spatial features to construct an interpretable analytical framework that reveals the nonlinear effects of physical and socioeconomic environments on perception bias. These findings contribute to more targeted and effective policy interventions in urban regeneration and well-being improvement.

2. Literature Review

2.1. The Impact of Urban Environment on SWB

Over the past three decades, China has experienced remarkable economic growth accompanied by dramatic urban expansion and regeneration, resulting in profound transformations of both the macro urban structure and the micro neighborhood environment [23]. In sharp contrast to economic prosperity and improved living conditions, public SWB and life satisfaction have shown a persistent decline [24]. Although changes in SWB across regional and urban–rural scales have been extensively discussed in China [5,24], intra-urban disparities have received far less attention. For instance, Zhang [25] explored a Kuznets curve for SWB and found that regional inequalities in SWB first increased and then declined with economic growth. Huang [5] further examined SWB differences between urban and rural environments from a multilevel perspective, showing that spatial context plays a more significant role in rural areas. However, with the ongoing processes of urbanization and city expansion, comparisons within cities—rather than between urban and rural areas—have become increasingly meaningful.
For most Chinese cities, internal differentiation is primarily reflected among old urban cores, newly developed districts, and suburban areas. Compared with ordinary urban regions, historic city centers present more complex issues of efficiency and equity [26]. As the traditional urban core, these areas often face decline yet hold a strong demand for functional renewal. Planners, however, tend to assume that “old and crowded districts” correspond to lower SWB, whereas “well-designed new towns” signify higher SWB. This assumption has led to a wave of urban regeneration projects focusing solely on physical renovation, which improves environmental quality but often diminishes social vitality and residents’ sense of SWB. Recent studies have challenged this perception. Jiang [26] found that residents in Beijing’s historic core, supported by close neighborhood ties and a strong sense of cultural pride, reported higher levels of SWB. Similarly, Wang [27] observed that residents in Beijing’s peripheral suburbs exhibit significantly lower life satisfaction than those in the central and inner suburban areas. These findings suggest that intra-urban differences in SWB are more complex than they appear and that their associations with urban environmental factors require further investigation.
Meanwhile, debates persist regarding how specific urban environmental elements affect SWB. Taking urban density as an example, Rodger [28] argued that excessive crowding leads to lower SWB, whereas others have suggested that residents of high-density neighborhoods may experience higher life or social satisfaction because greater density enhances accessibility and encourages participation in urban activities [29]. Kyttä [30] further demonstrated that the relationship between density and SWB varies across spatial contexts, indicating the need for more nuanced analysis. These findings imply that the impact of the urban environment on well-being is not linear but potentially moderated by other factors, with varying trends and threshold effects.
To address these gaps, this study focuses on Beijing and Nanjing—two representative Chinese cities with distinct urban development trajectories—and innovatively integrates spatial features with machine learning to examine the effects of physical and socioeconomic variables on well-being disparities. The findings have important policy implications, highlighting the necessity of considering the combined influence of geographic and environmental factors in SWB research.

2.2. Measurement of Residents’ SWB

Subjective well-being, encompassing both cognitive and affective components, reflects how individuals evaluate their own lives [31] and serves as an important indicator for assessing policy outcomes. Over the past decades, various approaches have been developed in the social sciences to measure well-being. Among them, self-reported measures have been widely adopted in cross-cultural comparisons due to their accuracy in capturing life satisfaction and their temporal stability [32]. In addition, questionnaire-based and demographic surveys have often been used to explore the influence of living environments on respondents’ well-being [17,23]. However, traditional data collection methods have been criticized for several limitations, including high time costs, sensitivity to respondents’ current emotional states [33], and question-order bias [34], which limits their applicability for large-scale assessment of public emotional perceptions.
In recent years, with the widespread use of social media, more individuals have begun sharing their emotional responses to living environments online. Coupled with advancements in data crawling and text-mining techniques—such as sentiment analysis—large-scale assessments of residents’ SWB and satisfaction using geotagged social media data have become an emerging trend. From social media platforms such as Weibo and Twitter, researchers can obtain time-sensitive and georeferenced textual information containing genuine emotional expressions—such as joy, sadness, fear, disgust, anger, and surprise [35,36,37]—which offers valuable insights for large-scale well-being assessment. For instance, Li [38] quantified an emotion index ranging from 0 to 1 using Weibo text data and Tencent’s NLP platform to evaluate how regional SWB affects corporate green innovation. Similarly, Lin [39] employed Twitter sentiment scores and the VADER model to reveal the relationship between land use and subjective well-being. Accordingly, this study collects long-term (April–November) Weibo check-in data and applies Tencent Cloud’s NLP sentiment analysis functions to evaluate residents’ SWB scores in Beijing and Nanjing.

2.3. Measurement of Environmental Perception Quality

Perceptions of the urban environment are vital to human well-being, as individuals often rely on the abiotic elements of cities to meet their functional and emotional needs, such as safety and aesthetic satisfaction [8]. With the rise of geographic big data, street-view imagery has become a major means of assessing perceived urban environments. Compared with traditional survey-based methods, it offers broader spatial coverage, lower collection costs [40,41], and a more human-centered perspective on street-level experiences. Much of the existing research builds upon the Place Pulse projects (1.0 and 2.0) developed at MIT, which use pairwise comparisons of Google Street View images to evaluate six perceptual qualities of urban environments: beauty, safety, liveliness, wealth, boredom, and depression [42]. With advances in machine learning, Zhang [43] was the first to apply a support vector machine (SVM) model and Tuern’s image-ranking method to train predictive models on the Place Pulse dataset, successfully mapping the spatial distribution of perceived urban qualities in Beijing and Shanghai. Subsequently, numerous scholars have utilized or referenced the Place Pulse 2.0 dataset to explore the relationships between visual perception and other urban indicators [44,45,46]. For instance, Kang [47] investigated perception bias by comparing visual perception qualities with locally collected survey data—an approach similar to this study’s comparative analysis based on geotagged Weibo data.

2.4. Theoretical Framework

As a key spatial carrier of human well-being, the urban environment influences residents’ quality of life not only through its material conditions but also through individuals’ subjective experiences. Processes of urban renewal, spatial restructuring, and social transformation have made the relationship between residents and their environments increasingly complex. This study conceptualizes the impact of the urban environment on well-being as the outcome of two intertwined experiential pathways. The first is the subjective well-being pathway, which reflects residents’ evaluative and emotional assessments of urban life shaped by overall life satisfaction, social relationships, and psychological states [33]. The second is the visual environmental perception pathway, capturing immediate sensory experiences of spatial features such as street form, greenery, aesthetics, and safety [48]. Together, these represent the long-term reflective and short-term perceptual responses of individuals to urban environments.
However, these two perceptual dimensions do not always align. When urban renewal prioritizes visual improvement while neglecting residents’ daily rhythms, mobility capacities, or social relations, a mismatch often emerges—manifested as “high perception but low well-being.” Conversely, in communities characterized by strong social ties and deep place attachment, a “low perception but high well-being” paradox may occur. This phenomenon, conceptualized as perceptual bias, reveals the asymmetry between spatial quality and subjective well-being, highlighting the potential imbalance in the mechanisms of person–environment fit [49] and place attachment [12]. Accordingly, this study proposes a conceptual framework that interprets the process of environmental influence on well-being as a sequential and interactive system: objective urban environment → dual perceptual pathways (visual and psychological) → formation and explanation of perceptual bias. This framework moves beyond the traditional linear assumption of “environment → well-being,” reframing the relationship among urban space, equity, and well-being from the perspective of structural mismatches. Ultimately, it aims to uncover why visual enhancement does not necessarily lead to well-being improvement, offering a theoretical foundation for building inclusive, equitable, and human-centered cities.
At the empirical level, the historical lesson of the Pruitt–Igoe housing complex in St. Louis underscores the mechanism of perceptual bias: despite modernist design and large-scale visual remodeling, the project failed to improve well-being because support for everyday capabilities and social embedding (mobility and accessibility, neighborhood safety and networks, operations and governance) was insufficient. Consequently, the dual-pathway perspective naturally yields a comparative expectation for old vs. new/center vs. periphery: where the visual and psychological pathways are decoupled, one should observe systematic differences between historic inner-city neighborhoods and newly developed suburban areas. We formulate this proposition and test it with community-level evidence from Beijing and Nanjing.

3. Data and Methodology

3.1. Study Area

Beijing and Nanjing, serving, respectively, as the political and cultural centers of northern and southern China, provide diverse urban environments suitable for the objectives of this study. Most importantly, both cities represent full life-cycle urban systems, preserving the two largest and most intact historic city cores in China and exhibiting clear outward expansion patterns centered on these ancient districts. Considering their differences in regional climate, urban scale, and developmental trajectories, comparative analysis of Beijing and Nanjing offers valuable insights for understanding cities of varying regions and sizes across China. This study focuses on the main urban areas of Beijing (Figure 1)—including Dongcheng, Xicheng, Haidian, Chaoyang, Fengtai, and Shijingshan Districts—and Nanjing—including Xuanwu, Gulou, Jianye, Yuhuatai, Qixia, Qinhuai, and Pukou Districts. The main urban area of Beijing covers 1378 km2 with a permanent population of approximately 10.93 million, comprising 2131 communities, among which the historic core occupies 62.5 km2. In contrast, Nanjing’s main urban area spans 1701.2 km2 with a resident population of 5.58 million, consisting of 698 communities, with the historic core covering 49.75 km2. In this study, the community serves as the basic analytical unit, as it represents not only the smallest administrative division in Chinese cities but also the fundamental platform for residents’ daily social interactions [50], which exert a significant influence on individual well-being.

3.2. Research Framework

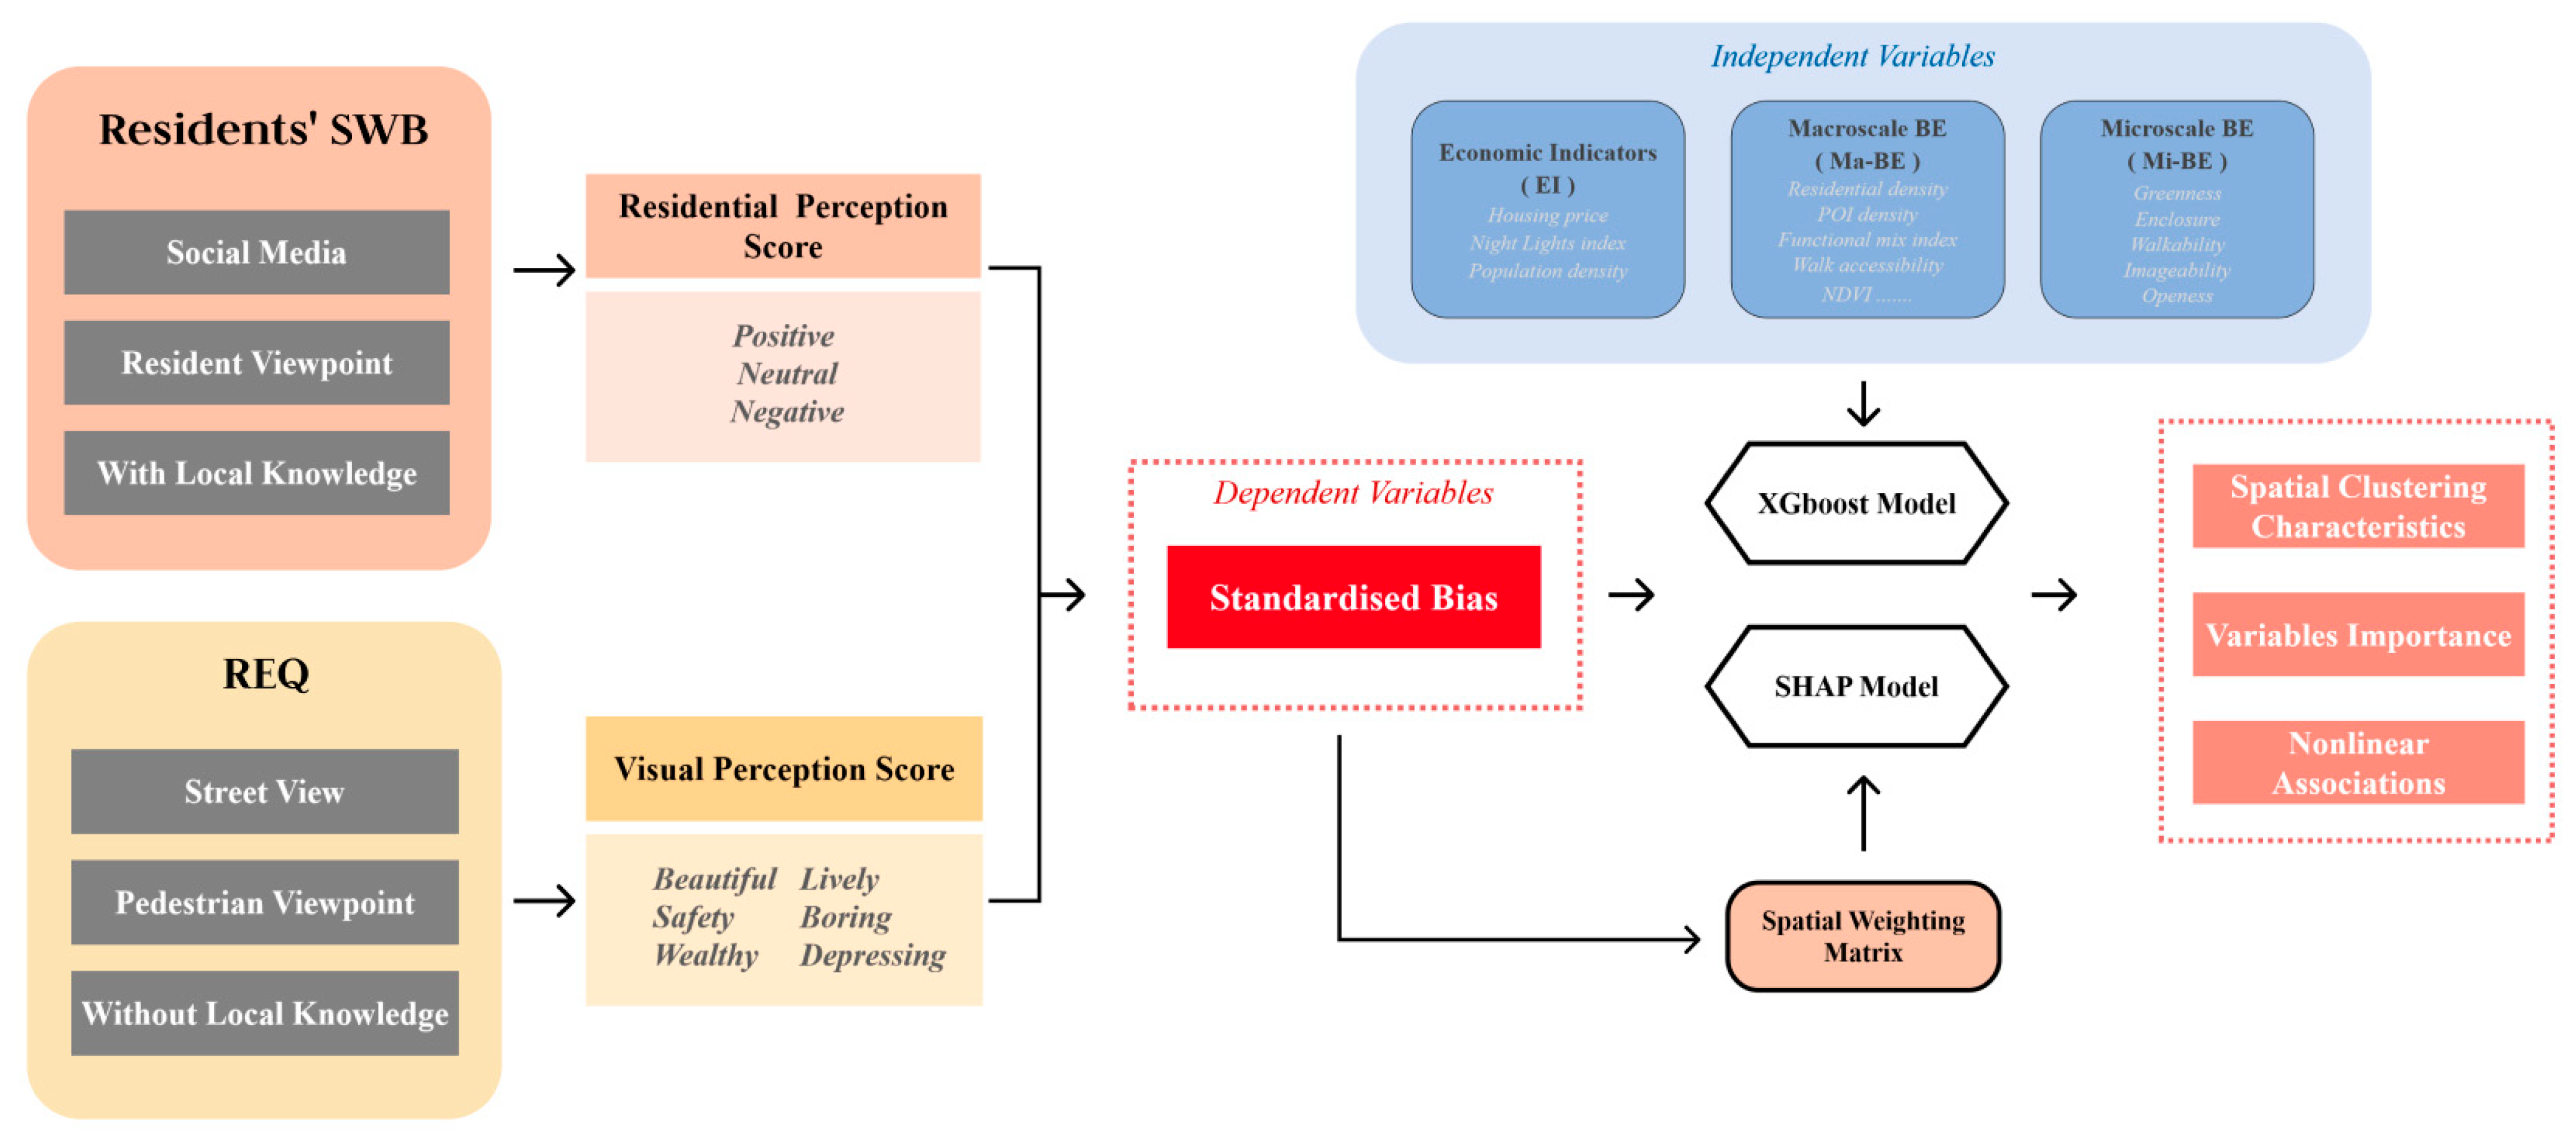
To uncover how multi-level urban environmental factors influence perception bias, we developed a comprehensive analytical framework, as illustrated in Figure 2. First, the study begins by examining the relationship between residents’ SWB and REQ. Second, to quantify the differences between these two dimensions, we employ both SVM modeling and natural language processing (NLP) techniques. Third, we calculate the standardized perception bias and its spatial lag variable based on a Queen contiguity spatial weights matrix, which serves as the dependent variable in subsequent regression analyses. Macro-environmental, micro-environmental, and socioeconomic factors are incorporated as independent variables, and an XGBoost model combined with SHAP analysis is applied to conduct an integrated regression. Finally, by interpreting feature importance and the nonlinear main-effect curves derived from SHAP, we further identify the influence patterns of urban variables on perception bias and propose targeted strategies for improving residents’ well-being.
This study aims to address three key questions: (1) Do perception biases exist between residents’ SWB and the quality of the residential environment in Chinese cities? (2) Which factors contribute to perception bias, and how do they shape it? (3) How can insights from perception bias research guide effective strategies for enhancing urban well-being?

3.3. Data Collection

Previous studies have primarily focused on examining linear relationships between selected environmental factors and subjective well-being, such as the presence of shops, recreational facilities, street connectivity, parks, and open spaces [51,52]. However, the impact of the urban environment on well-being disparities is likely the result of complex interactions among multiple layers of factors. Therefore, following prior research [3,18,53], this study categorizes the main environmental characteristics into three dimensions—macro-environment, micro-environment, and socioeconomic context—and employs a spatially informed machine learning model to reveal their nonlinear relationships. At the macro level, environmental factors serve as the physical setting for residents’ daily lives, providing locations and pathways for human activities. These include indicators such as land-use types, normalized difference vegetation index (NDVI), functional mix, street density, and walking accessibility. Considering that human-scale perspectives better capture the quality of urban experience, micro-scale environmental features—such as visual greenness and openness—are also incorporated. In addition, socioeconomic variables, including population density, nighttime light intensity, and housing prices, are included, as they have been shown to significantly influence disparities in residents’ well-being.
As shown in Table 1, this study constructs a cross-sectional dataset for the main urban areas of Beijing and Nanjing for the years 2023–2024 using openly accessible data sources.
Weibo Data: We obtained geotagged Weibo check-in posts from the Sina Weibo platform https://weibo.com (accessed on 13 July 2024) covering the main urban areas of Beijing and Nanjing between April and November 2023. Each record includes geographic coordinates, textual content, user ID, and the number of reposts. In total, 432,644 valid records were collected for Beijing and 312,564 for Nanjing. To ensure the reliability and semantic validity of the text data, several preprocessing steps were conducted: (1) removal of posts containing only images, videos, or duplicate content; (2) cleaning of irrelevant elements such as special characters, spaces, emojis, and hashtags; (3) exclusion of posts from non-individual users, including real estate advertisements, government media, and institutional accounts.
DMSP-OLS Nighttime Light Data: Annual nighttime light data for 2020 with a spatial resolution of 500 m were obtained from the National Tibetan Plateau Data Center http://data.tpdc.ac.cn (accessed on 8 September 2024). Compared with conventional DMSP/OLS datasets, these data exhibit stronger correlations with socioeconomic indicators such as built-up area, GDP, and population.
POI Data: Point-of-interest (POI) data for Beijing and Nanjing in 2024 were collected from the Amap open platform https://lbs.amap.com/api (accessed on 28 July 2024), containing detailed information on geographic locations and functional categories. The average kernel density of POIs within each community was calculated to measure facility clustering and functional diversity.
Housing Price Data: Housing price data for Beijing and Nanjing in 2024 were retrieved from China’s largest real estate website https://www1.fang.com/ (accessed on 5 July 2024). Using empirical Bayesian kriging interpolation, the point data were converted into continuous raster surfaces, under the assumption that spatially adjacent housing prices tend to exhibit similarity [54].
Normalized Difference Vegetation Index (NDVI): The spatial distribution of China’s 2020 annual NDVI was obtained from the GeoRS Environmental Remote Sensing Network http://www.gisrs.cn/ (accessed on 8 September 2024). The dataset represents the maximum monthly NDVI values for all twelve months of 2020.
Population Density Data: Population density data were derived from the 7th National Population Census. Based on machine learning downscaling methods developed in [55], 100 m-resolution population grid data for China were generated and shared on the open platform Figshare https://figshare.com/s/d9dd5f9bb1a7f4fd3734 (accessed on 20 July 2024).
Road Network Data: Road network data were downloaded from the OpenStreetMap (OSM) platform https://www.openstreetmap.org (accessed on 5 June 2024). After preprocessing and centralization in GIS, the data were imported into DepthmapX for accessibility analysis.
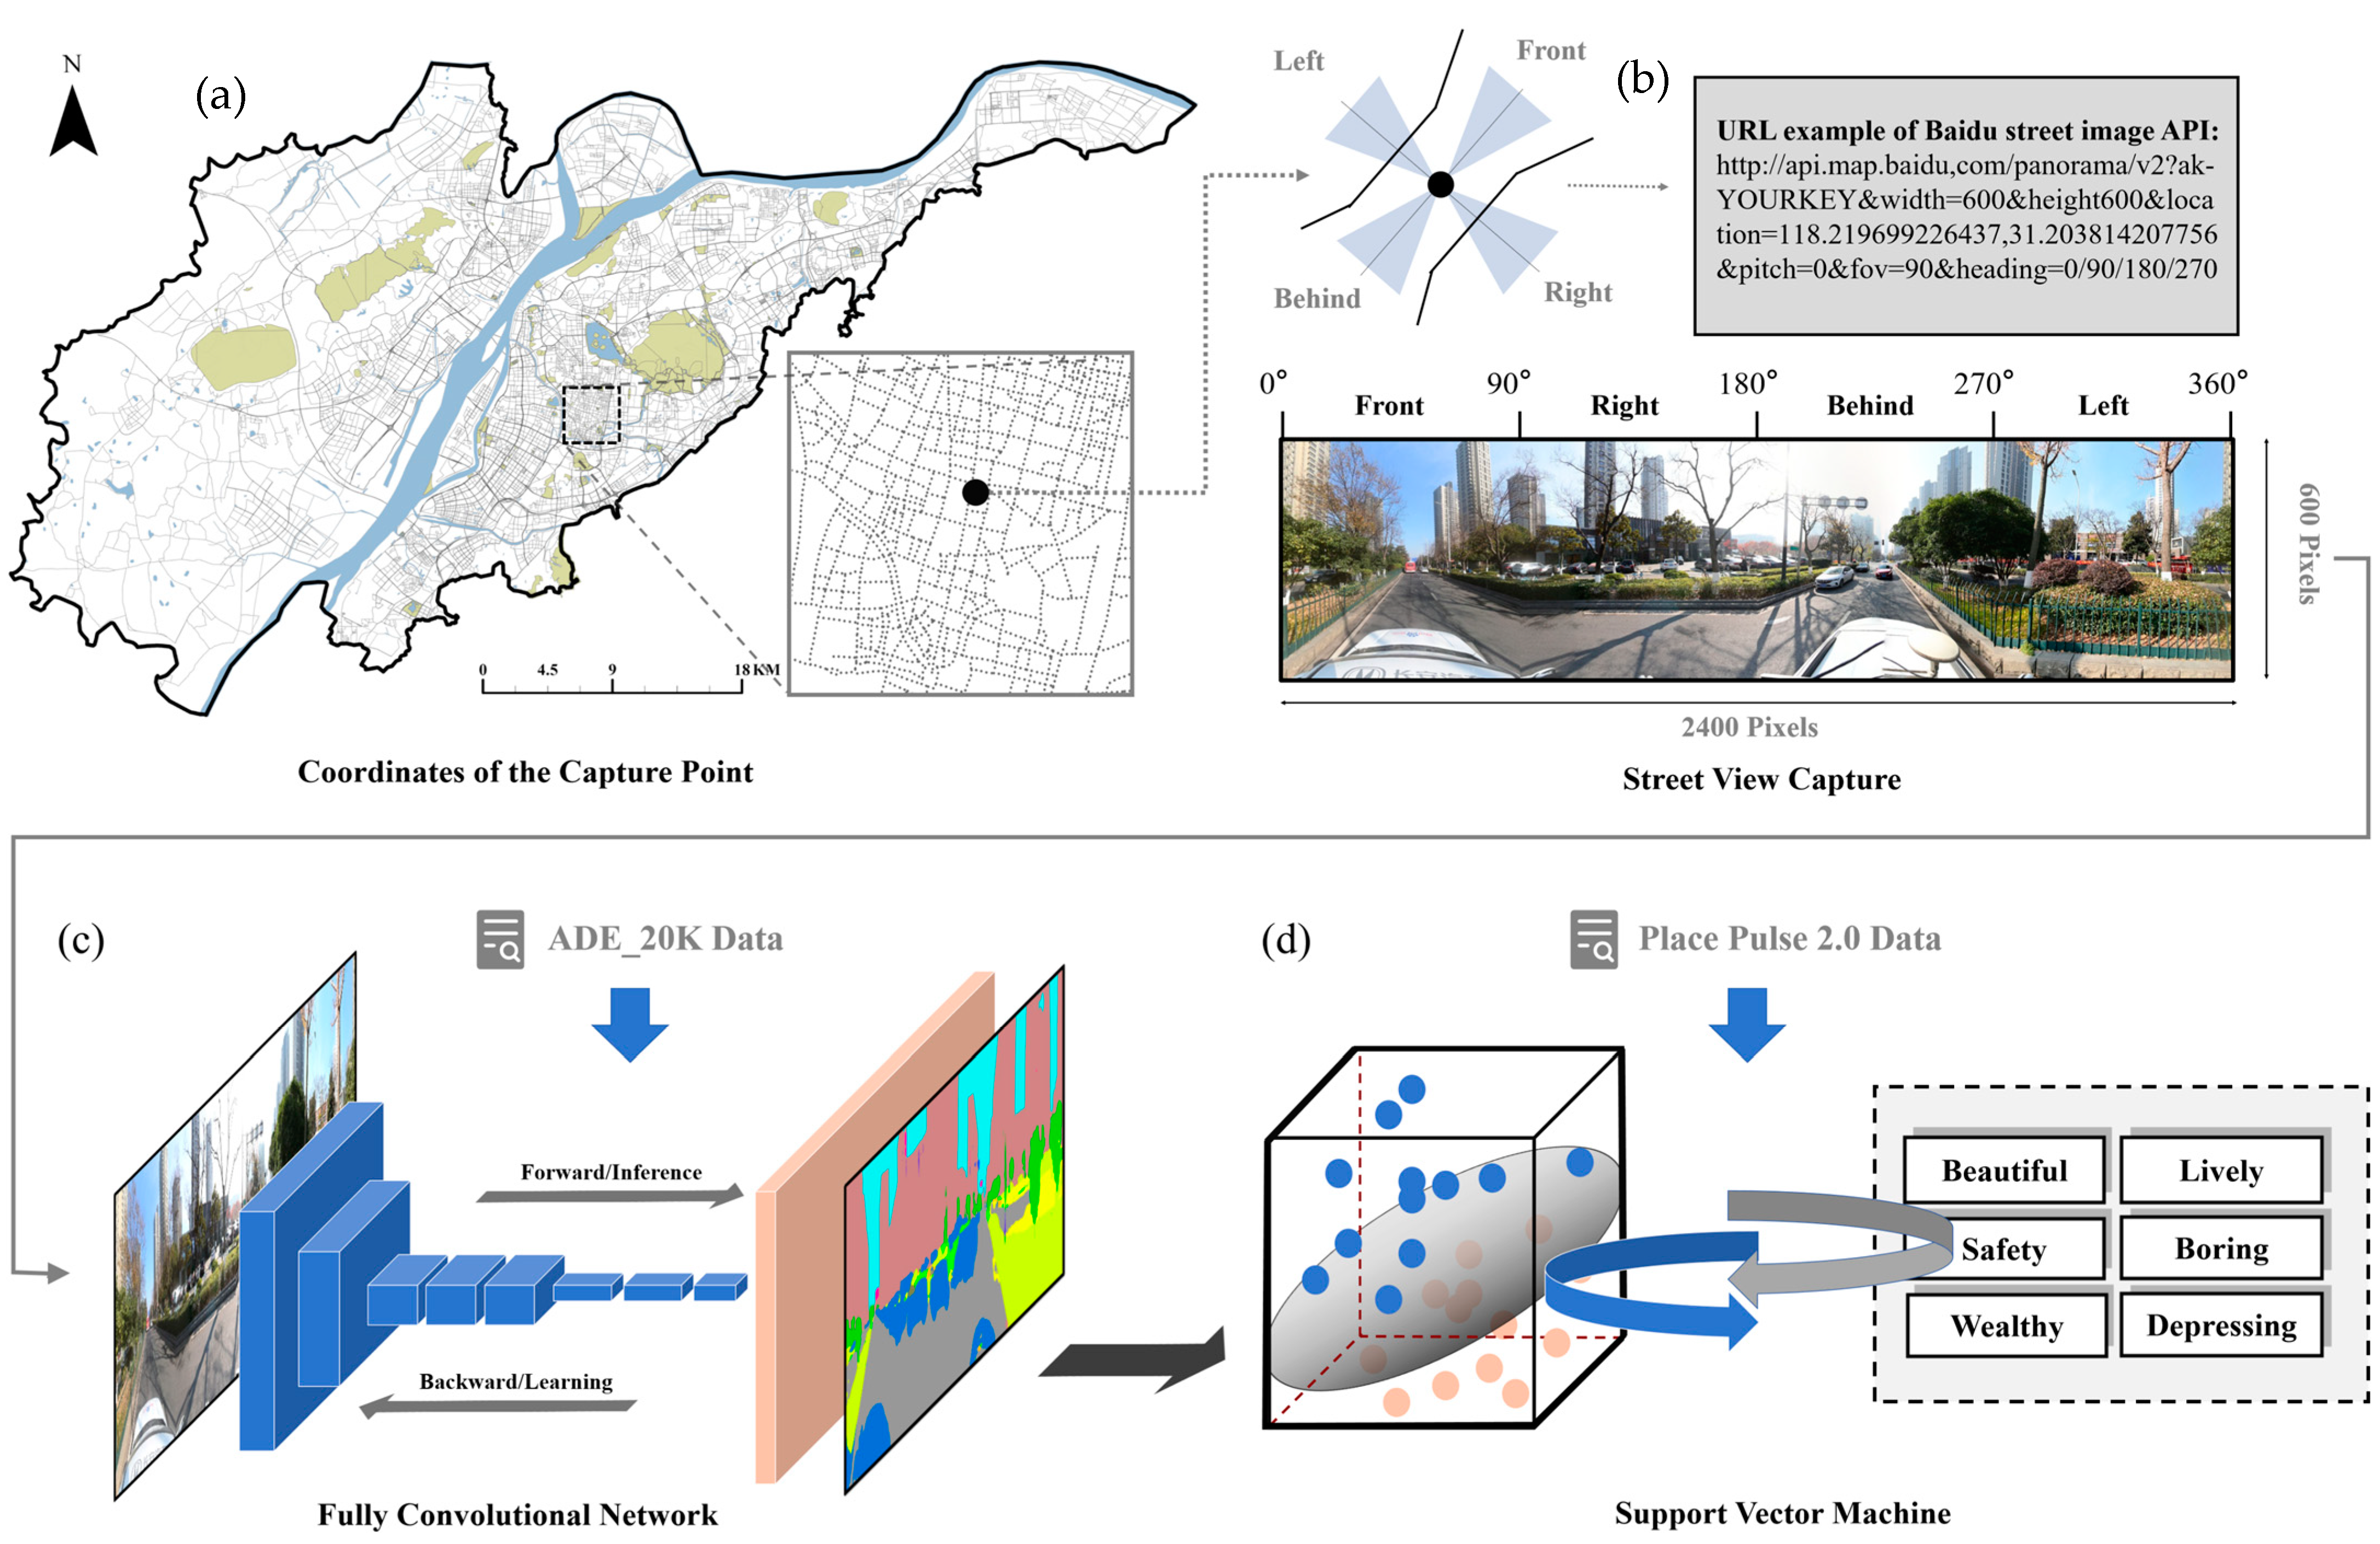
Street-View Imagery: Based on the road network, we generated sampling points at approximately 70 m intervals and used Python 3.12 to access the Baidu Maps API https://lbsyun.baidu.com/ (accessed on 12 March 2024) to collect street-view images. A total of 190,216 images for Beijing and 117,265 for Nanjing, captured in 2021, were obtained (see Figure 3a,b). The parameters were set as follows: vertical pitch = 0°, horizontal field of view (fov) = 0°, 90°, 180°, and 270°, and maximum image resolution = 600 × 600 pixels. For each sampling point, four directional images were seamlessly stitched to form a complete 360° panoramic street view.

4. Methodology

4.1. NLP Sentiment Analysis

Sentiment analysis of Weibo posts was performed using the Tencent Cloud NLP service. The platform provides sentiment scores for positive, negative, and neutral emotions within a continuous range of 0.00–1.00. The Tencent NLP model is specifically optimized for Chinese language processing, trained on a large corpus of approximately 8 million Chinese word vectors, and has been extensively applied in large-scale sentiment and affective computing studies. Its analytical framework incorporates advanced deep learning architectures such as long short-term memory networks and Bidirectional Encoder Representations from Transformers (BERT), allowing for contextual understanding of word relationships and fine-tuning across multiple natural language processing tasks. Previous studies have confirmed the reliability and accuracy of this model for sentiment evaluation [18,38]. In this research, the standardized positive sentiment score was adopted as an indicator of residents’ SWB [18]. These scores were spatially aggregated to the community level, generating high-resolution maps of subjective well-being for the main urban areas of Beijing and Nanjing.

4.2. FCN Semantic Segmentation

We employed a Fully Convolutional Network (FCN) approach to perform pixel-level recognition of street-view imagery (SVI). As one of the earliest end-to-end convolutional neural network architectures, the FCN utilizes an encoder–decoder structure that enables semantic segmentation at the pixel level (Figure 3c). Specifically, we trained the FCN model using the ADE20K dataset released by MIT [56], which classifies street-view scenes into multiple subcategories, including vehicles, roads, trees, and other natural or built elements, covering a total of 151 classes. Based on the segmentation results, we calculated the proportional coverage of each visual element and derived several micro-scale physical environmental indicators for each SVI, including greenness, enclosure, walkability, imageability, and openness.

4.3. SVM Perception Prediction

This study applied the MIT open-source dataset Place Pulse 2.0 and a Support Vector Machine (SVM) model to predict perceptual attributes of street-view images in Beijing and Nanjing (Figure 3d). The Place Pulse 2.0 dataset was designed to map perceptions of which areas within cities appear safer, livelier, wealthier, more active, more beautiful, and more friendly. It consists of more than 10 million paired image comparisons across over 400 unique urban scene categories, where users were asked to choose between two images according to specific perceptual criteria. Each category contains approximately 5000 to 30,000 training images, with distributions reflecting real-world urban scene frequencies. Following the approach of previous research [43], we trained predictive models for six perceptual dimensions—safety, liveliness, boredom, wealth, depression, and beauty—using a kernel SVM with a radial basis function kernel to capture high-dimensional deep visual features.

4.4. Calculation of Perception Bias

In previous studies, perception differences have frequently been divided into several categories (higher, similar, lower) for research [18,46], which may not accurately quantify the effect of environmental variables on perception bias (PB). Therefore, we refer to the approach proposed by Kang [47] to quantify bias by calculating the standardized difference between the REQ of the residential environment and the SWB of the residents:
P B ¯ i = s t a n d a r d i s e d R E Q ¯ i s t a n d a r d i s e d S W B ¯ i
where i is the community unit number. A high value of PB means ‘Visually appealing but less happy’ and a low value of PB means ‘Visually ordinary but happier’.

4.5. Spatial Autocorrelation

We employed spatial autocorrelation analysis (Moran’s I) to examine whether perception bias exhibits spatial heterogeneity, providing a basis for incorporating spatial features into the subsequent XGBoost model. According to the first law of geography, areas that are spatially adjacent or geographically close tend to be more strongly correlated. The Global Moran’s I statistic is used to characterize the overall spatial association of geographic attributes within the study area, measuring the degree of similarity or dissimilarity among spatial units and identifying whether the observed phenomenon demonstrates significant spatial clustering or dispersion:
I = n i = 1 n j = 1 n w i j y i y ¯ y j y ¯ / i = 1 n j = 1 n w i j i = 1 n y i y ¯ 2
where y i and y j are the observed values of the i th and j th points, respectively; y ¯ is the mean value of the observed values of all the points; and w i j is the queen-based spatial weight matrix of each point. After identifying significant spatial dependence, we further applied Local Moran’s I analysis to explore the spatial clustering patterns of perception bias, specifically the distribution of high-value and low-value clusters:
I i = n y i y ¯ j = 1 n w i j y j y ¯ / i = 1 n y i y ¯ 2
I i for each community unit i is an indicator that describes the degree of spatial agglomeration between significant similar-valued units around that community unit.

4.6. XGBoost Regression Model Combining Spatial Features

Credit [22] proposed a method for constructing spatially explicit machine learning models by incorporating spatial autoregressive variables to account for spatial econometric specifications. Accordingly, this study employed a Queen contiguity spatial weights matrix to calculate the spatially lagged dependent variable and developed a machine learning model with spatial autoregressive features to capture the significant spatial dependence of perception bias. The spatial lag of perception bias is formulated as follows:
W y i = i = 1 n w i j · y i
where W y i is the spatial lag variable of community unit i , w i j is the spatial weight between unit i and j , determined by the Queen neighbour matrix W , and y i is the original variable of unit i . Subsequently, we employed the XGBoost model to train and test the spatially lagged perception bias data, obtaining the model’s fitting and prediction accuracy. XGBoost is an efficient extension of the Gradient Boosting Decision Tree algorithm and is widely applied in both classification and regression tasks. The algorithm constructs an additive ensemble of decision trees, where each successive tree is built to fit the residuals of the previous one, using a gradient-based optimization approach to determine the optimal structure of new trees. Through iterative optimization of both model structure and parameters, XGBoost minimizes an objective function that consists of a loss term and a regularization term representing structural risk, defined as follows:
O y i , y ^ i = L y i , y ^ i + Ω y i , y ^ i
where O , L , and Ω are the objective function, loss function, and structural risk function, respectively. y is the label, and y ^ is the estimated output of the gradient boosting tree.

4.7. Shapley Explanatory Model

The SHAP model, proposed by Lundberg and Lee [57], is inspired by cooperative game theory and provides a unified framework for interpreting predictions generated by complex machine learning models. By enhancing model interpretability, SHAP improves both the generalizability and credibility of machine learning applications. For each prediction instance, the model generates a SHAP value, which represents the sum of the contributions assigned to individual features. These values quantify the extent to which each feature contributes to the final prediction outcome. The SHAP framework is formally defined by Equation:
g z = ϕ 0 + j = 1 M ϕ j z   j
where g are one or two features analyzed in the next section, z′ ∈ {0, 1}M is the coalition vector, M is the maximum coalition size and ϕjR is the feature attribution for a feature j, the Shapley values.

5. Results and Analysis

5.1. Spatial Distribution and Clustering Characteristics of Perception Bias

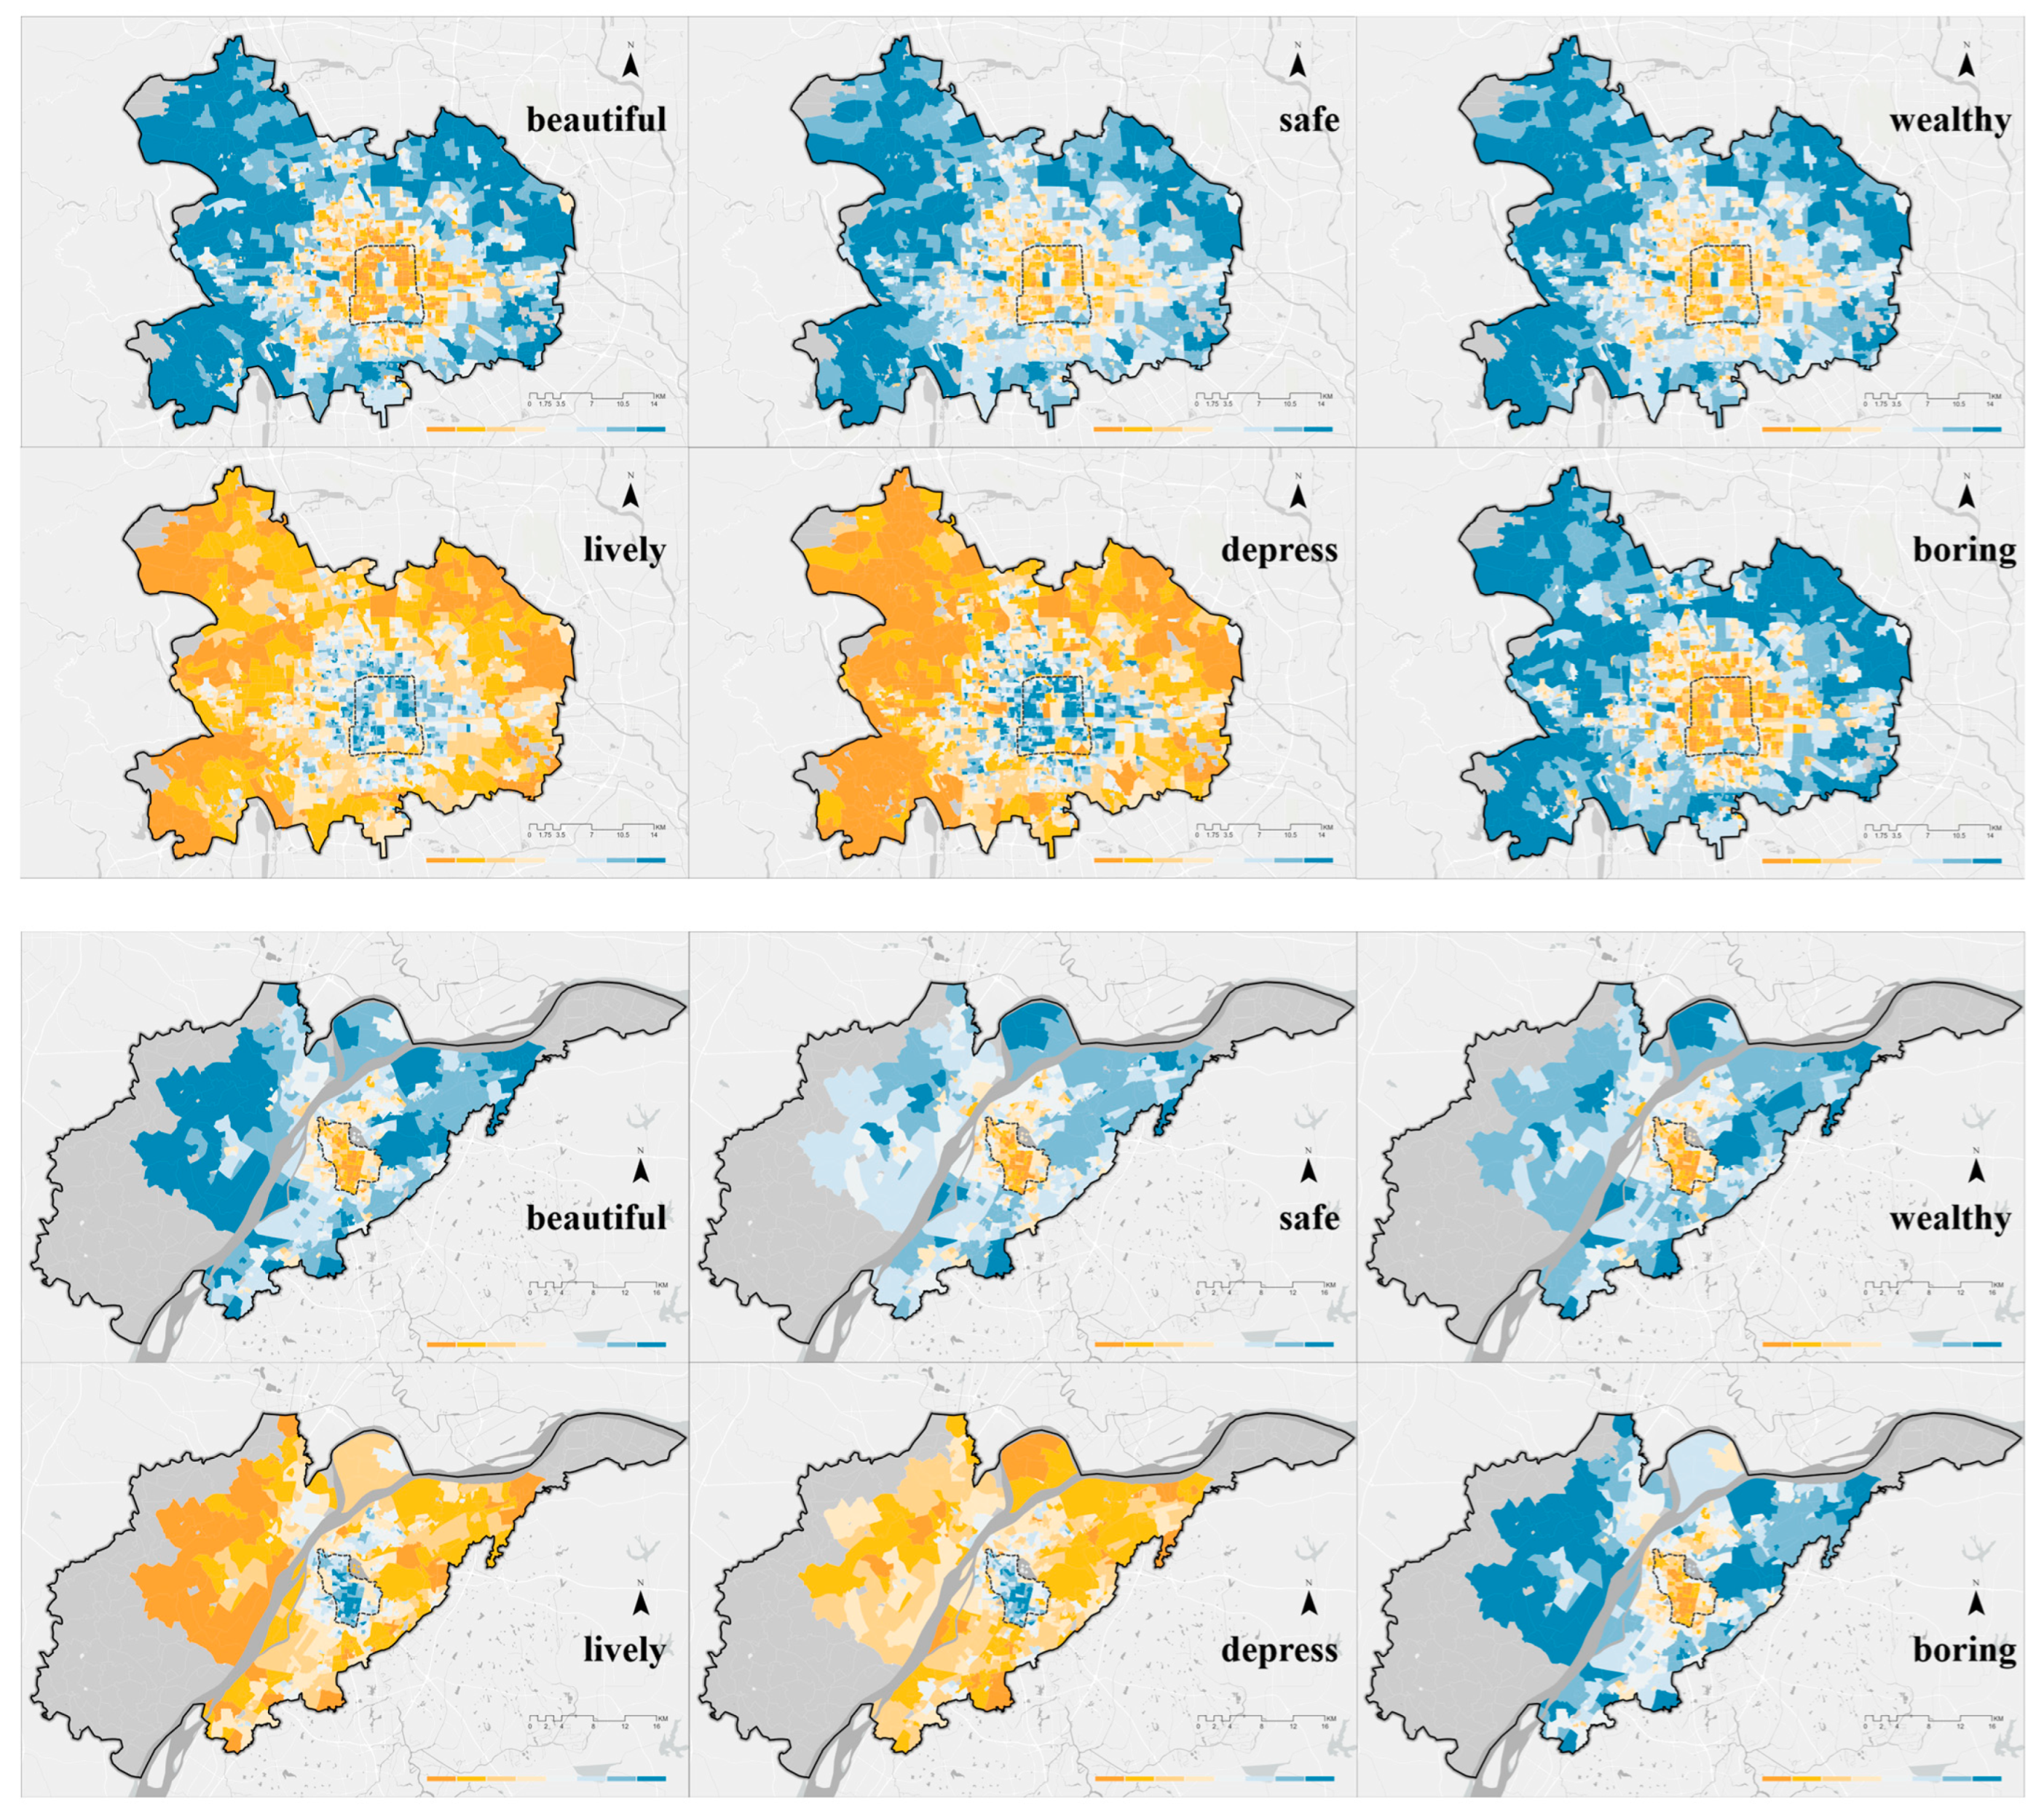
Figure 4 presents the spatial distribution of perceptual indicators in Beijing and Nanjing, revealing several distinct spatial patterns. Positive perceptions such as beauty, safety, and wealth exhibit lower values within the old urban cores, while the negative indicator depression shows pronounced peaks in the same areas. This finding is consistent with previous research and theoretical expectations: under rapid urbanization, the street spaces of historic cores often lack adequate renewal, resulting in overcrowded and oppressive environments [26]. However, an interesting contrast emerges for liveliness and boredom, which display opposite clustering effects in the old cities. This suggests that despite relatively poor physical environments, older urban areas maintain high levels of social vitality and offer visually engaging urban experiences. Moreover, given Beijing’s larger scale and longer development history, these clustering patterns extend more widely around its historic center. Additionally, beauty, liveliness, and boredom exhibit the highest standard deviations, indicating that people are more sensitive to variations in these perceptual dimensions.
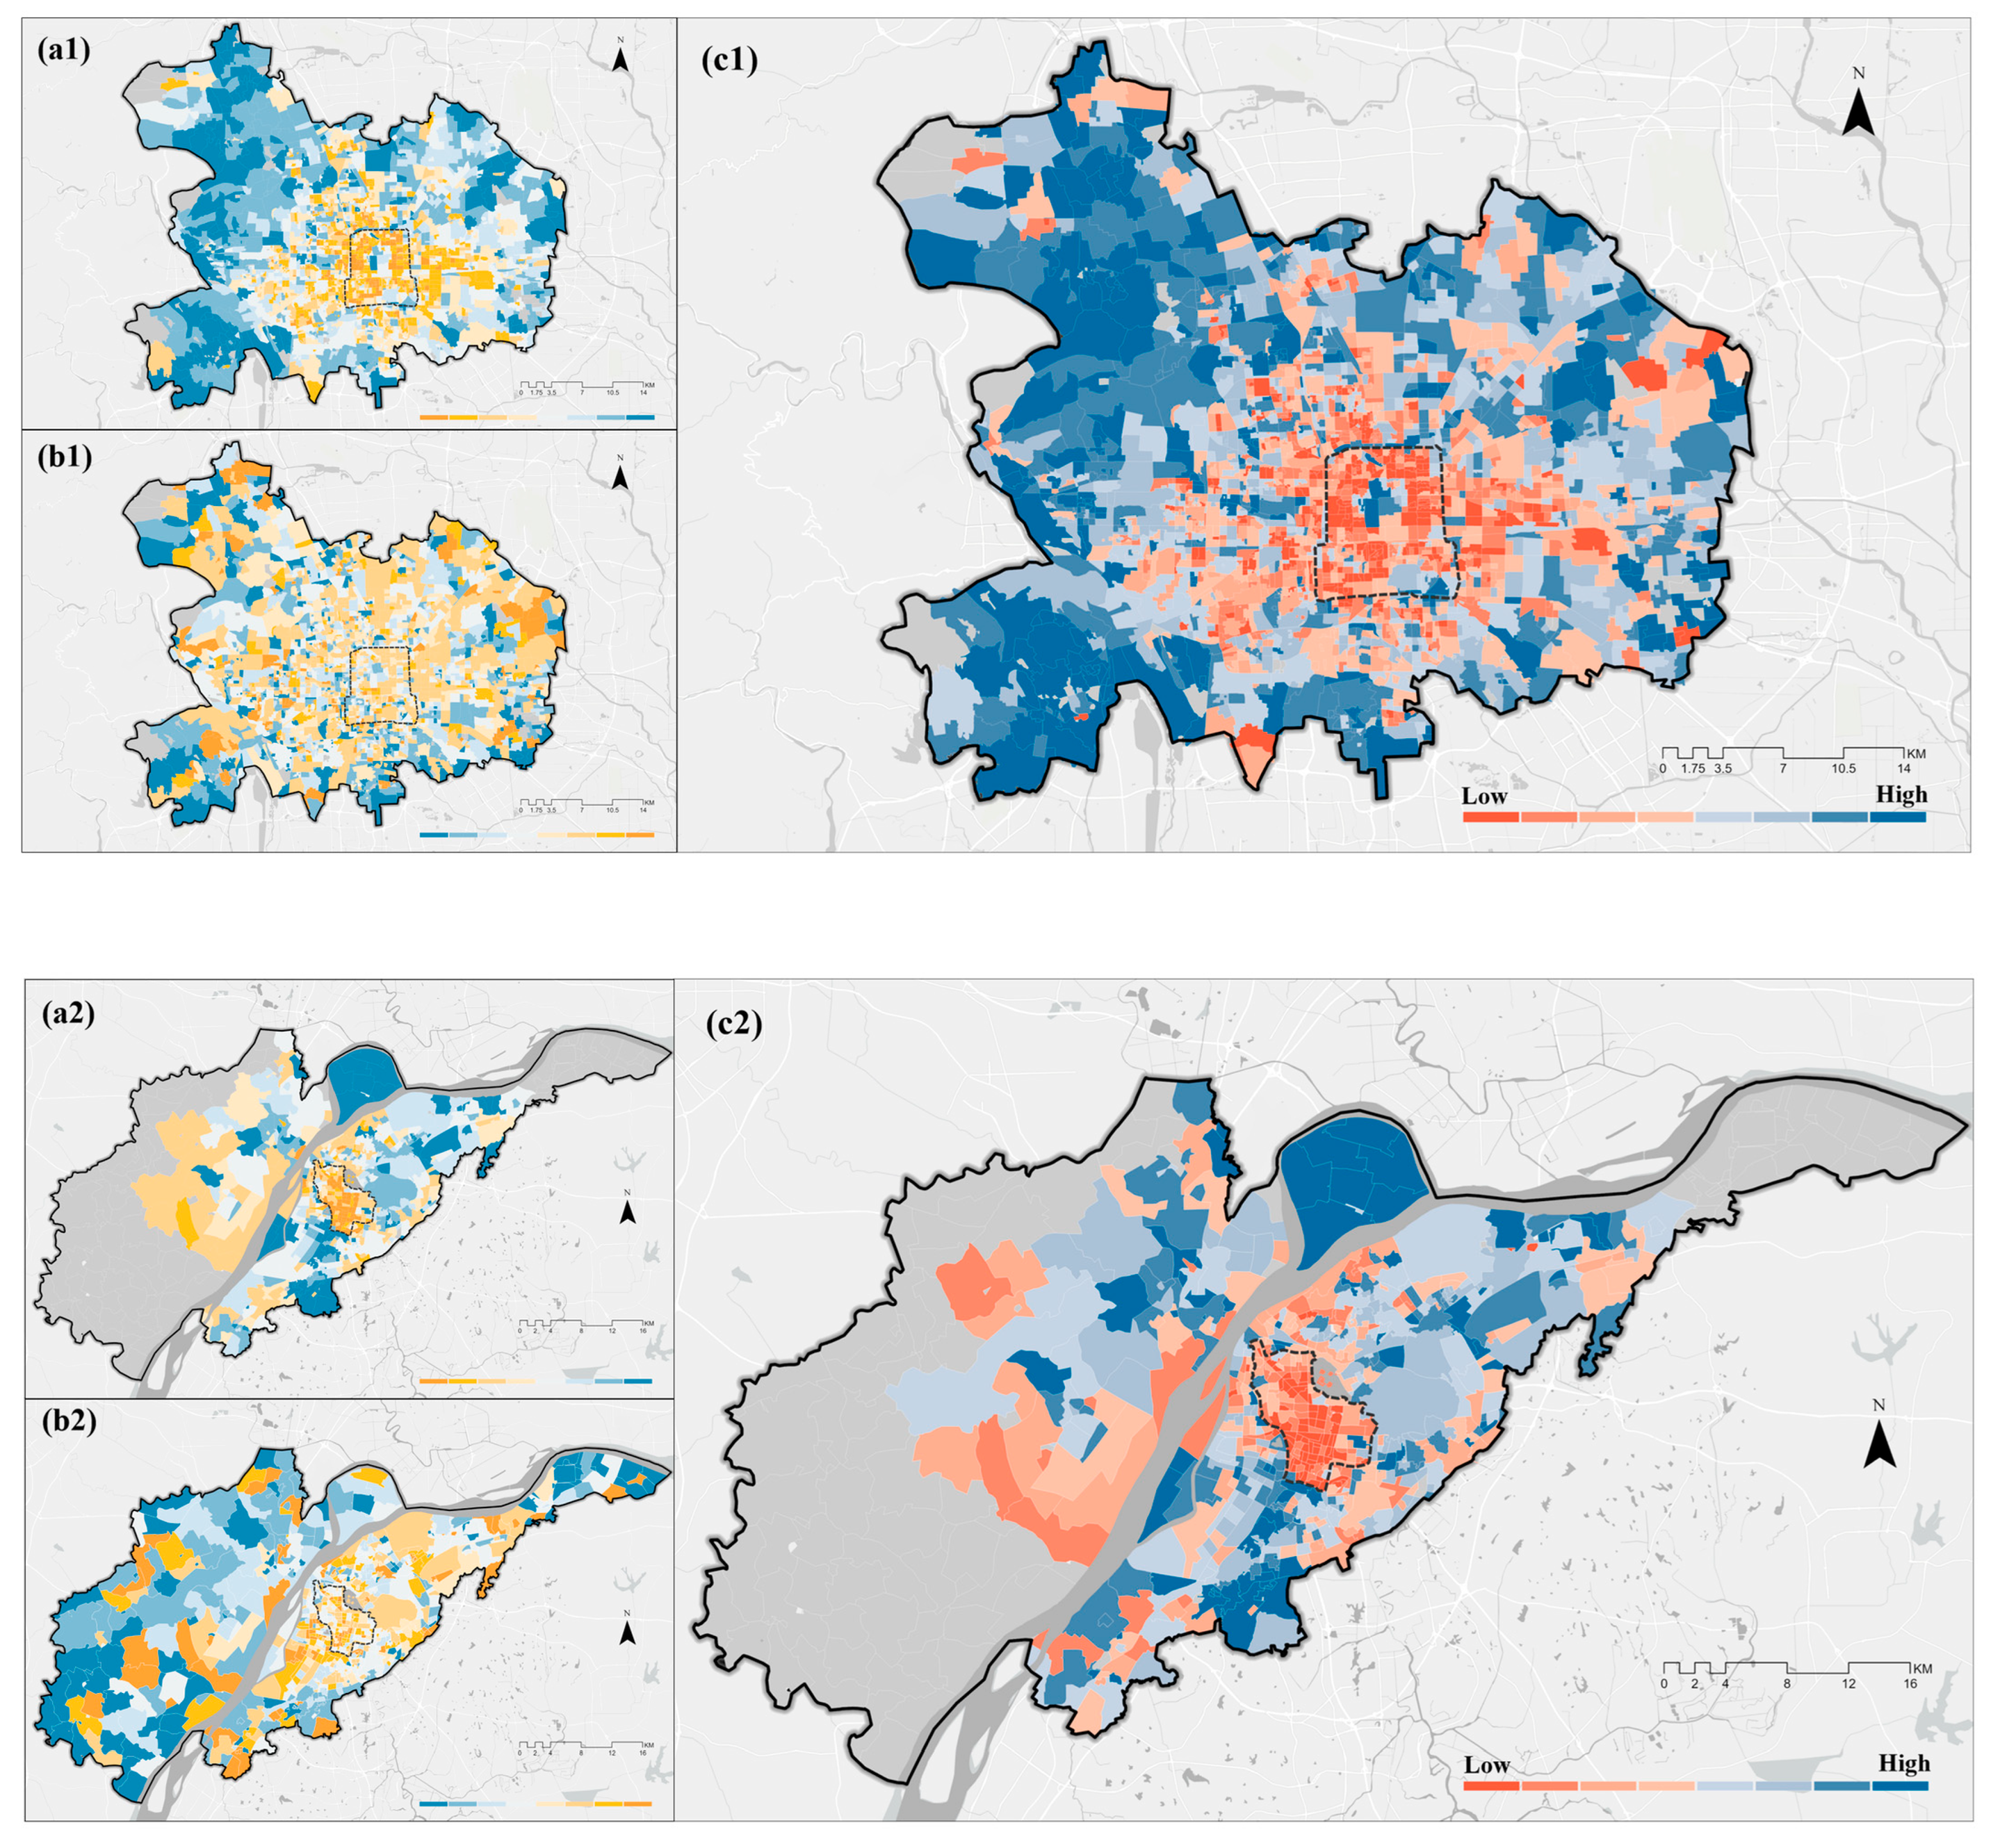
Figure 5a1,a2 display the composite perception maps generated through standardized mean calculations, which show a strong spatial correlation with the individual perception indicators—forming perceptual “depressions” within the old city cores. In contrast, Figure 5b1,b2 illustrate the spatial distribution of residents’ SWB across Beijing and Nanjing. The results show relatively even distributions of well-being across both cities, consistent with the findings of McCrea [58]. Notably, however, the old urban cores predominantly appear as high-SWB areas, which is inversely related to the perceptual depressions, confirming the existence of a mismatch between visual perception and residential SWB. As shown in Figure 5c1,c2, the standardized differences between the average perception scores and average SWB scores for each community reveal low-value clusters of perception bias in the old urban cores. This occurs because perception scores are generally higher than SWB scores; hence, lower bias values indicate that residents in old urban areas report higher SWB relative to the visual quality of their environments, with some areas even exhibiting negative bias values.
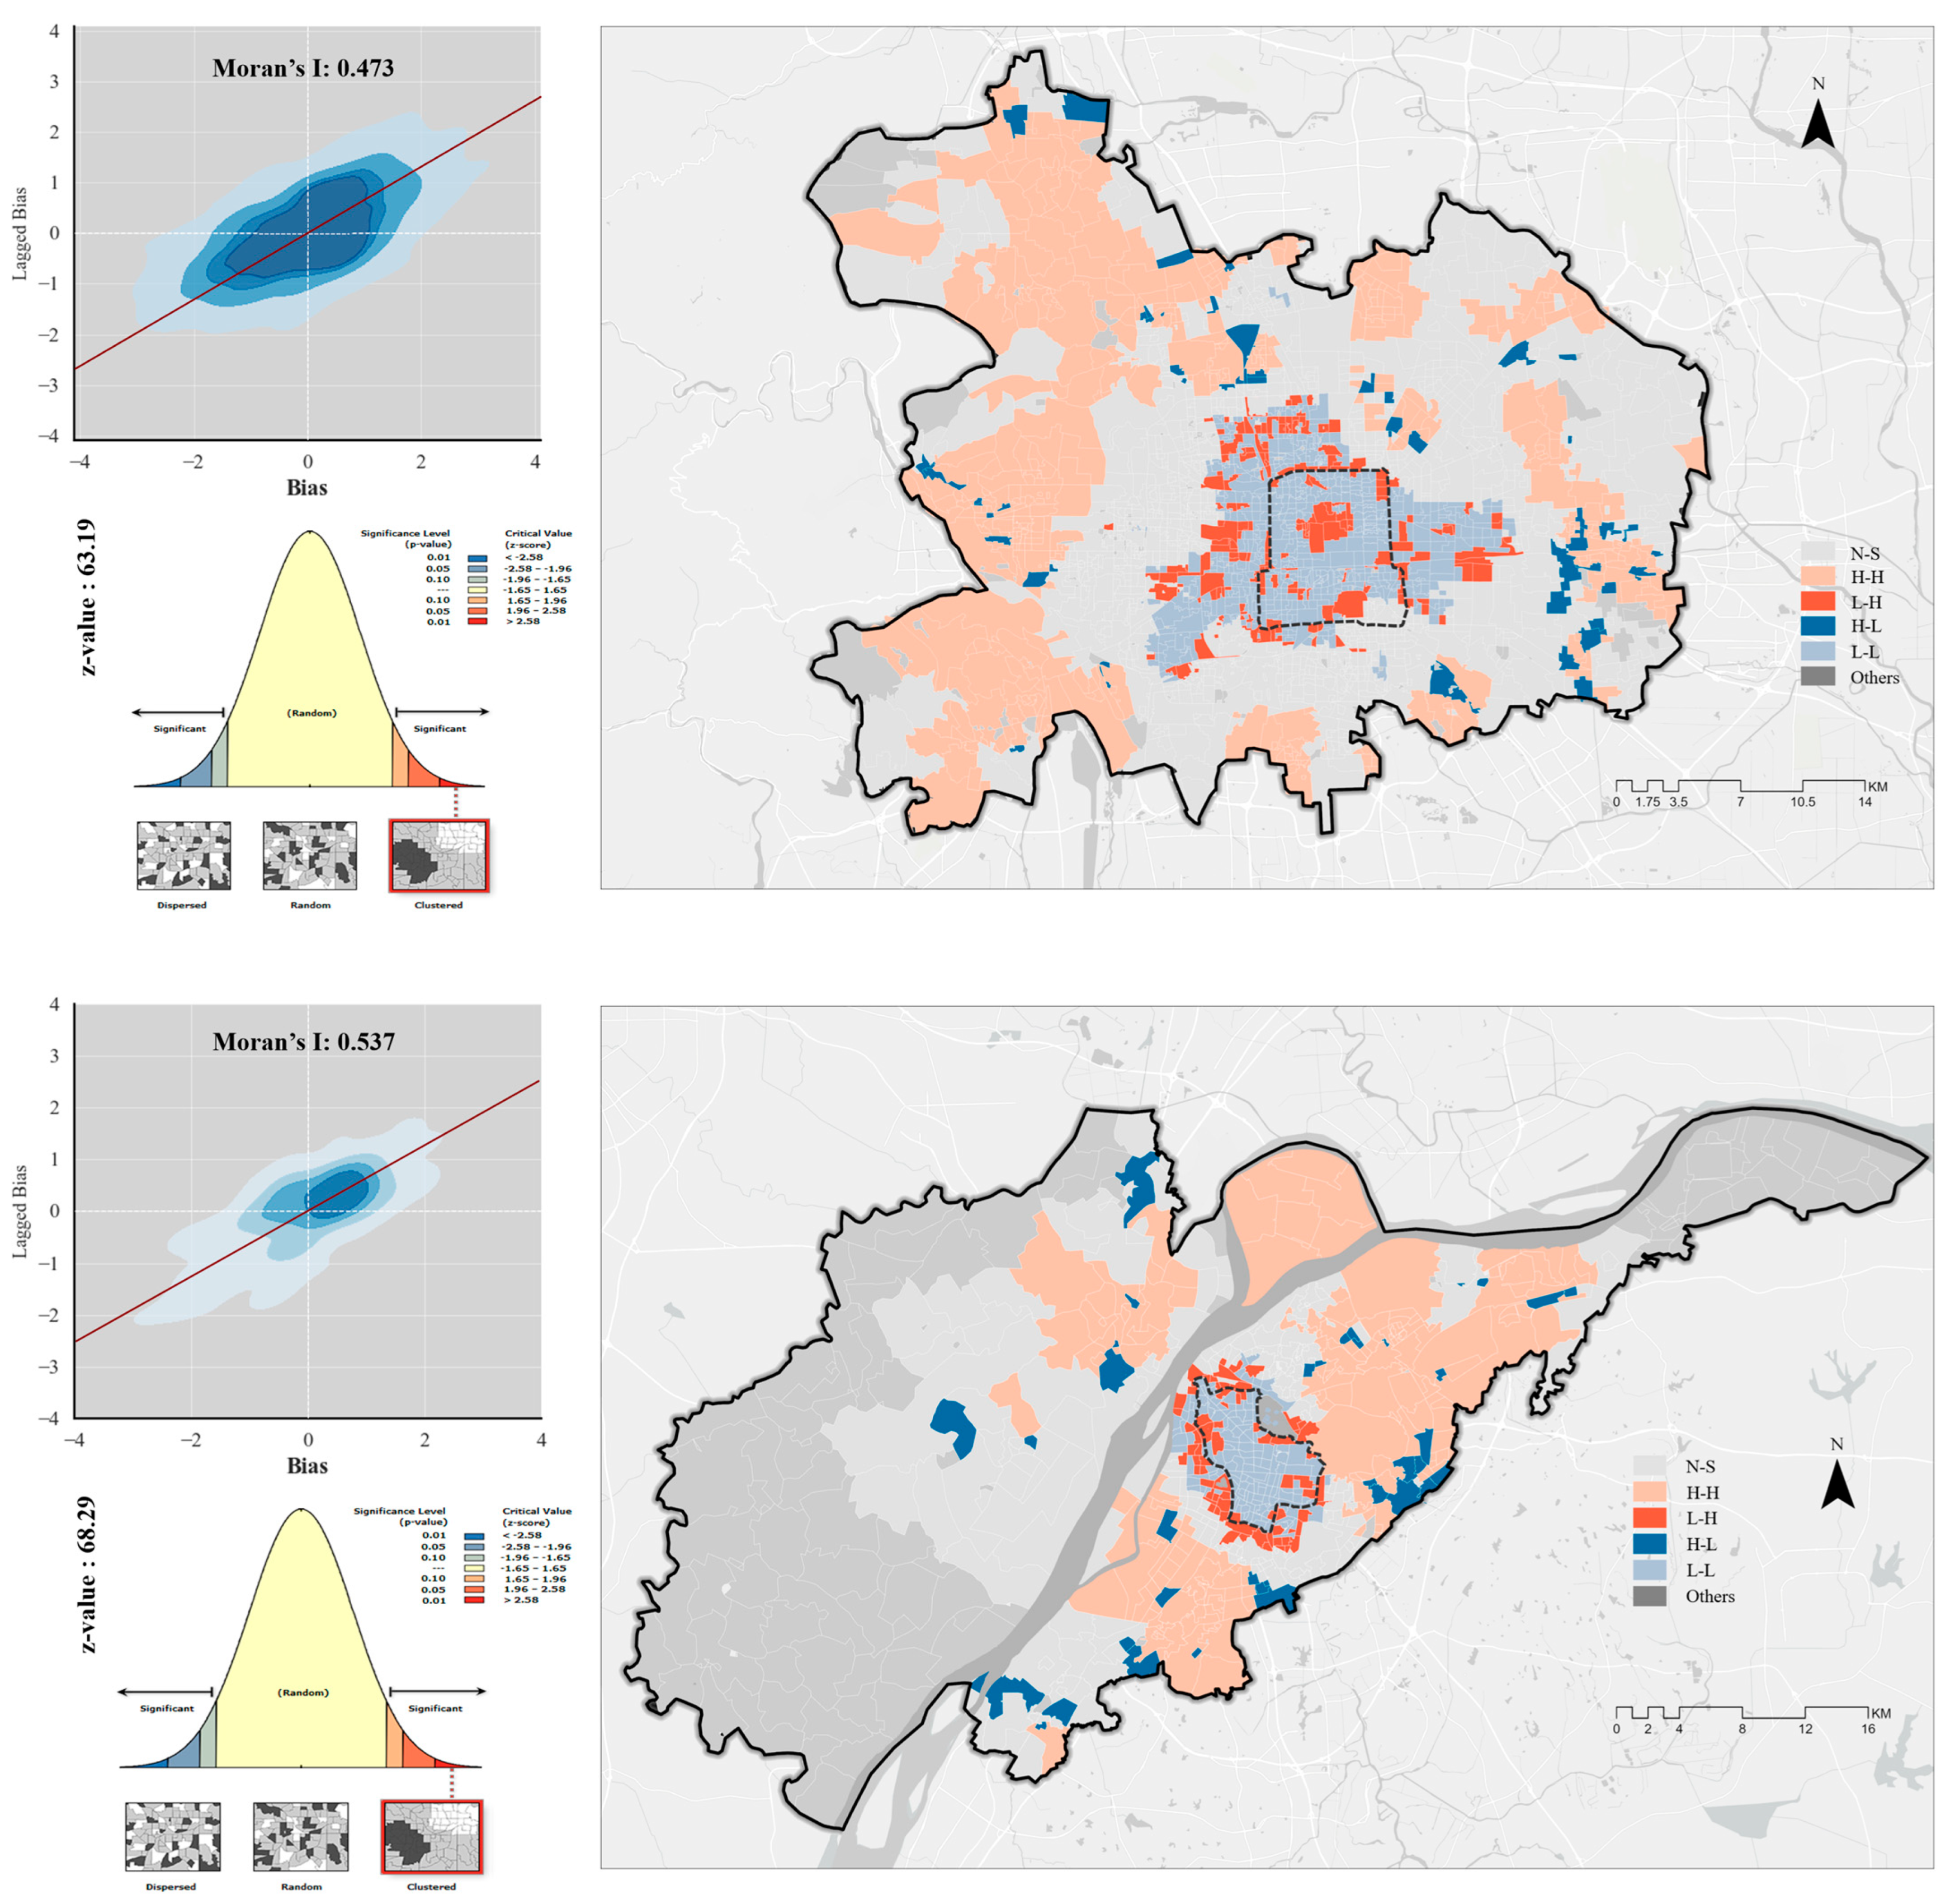
To further investigate whether perception bias exhibits spatial dependence, both global and local spatial autocorrelation analyses were performed. Figure 6 demonstrates that perception bias shows strong spatial dependence in both Beijing (Moran’s I = 0.473, z = 63.19) and Nanjing (Moran’s I = 0.537, z = 68.29), confirming the necessity of incorporating spatial attributes into subsequent regression analyses. The local Moran’s I results further reveal a pattern of low-value clustering surrounding the old city cores, gradually weakening with increasing geographic distance. A ring of high-value clustering forms around these cores, delineating a clear perceptual boundary. In contrast, high-value clusters appear in the outer suburban areas, while transitional zones between urban and suburban areas show no significant spatial clustering. These findings indicate that proximity to the old urban cores corresponds to higher SWB relative to visual perception, whereas proximity to suburban areas corresponds to higher visual perception relative to SWB—highlighting a distinct spatial boundary between the two.

5.2. Feature Selection and Model Training

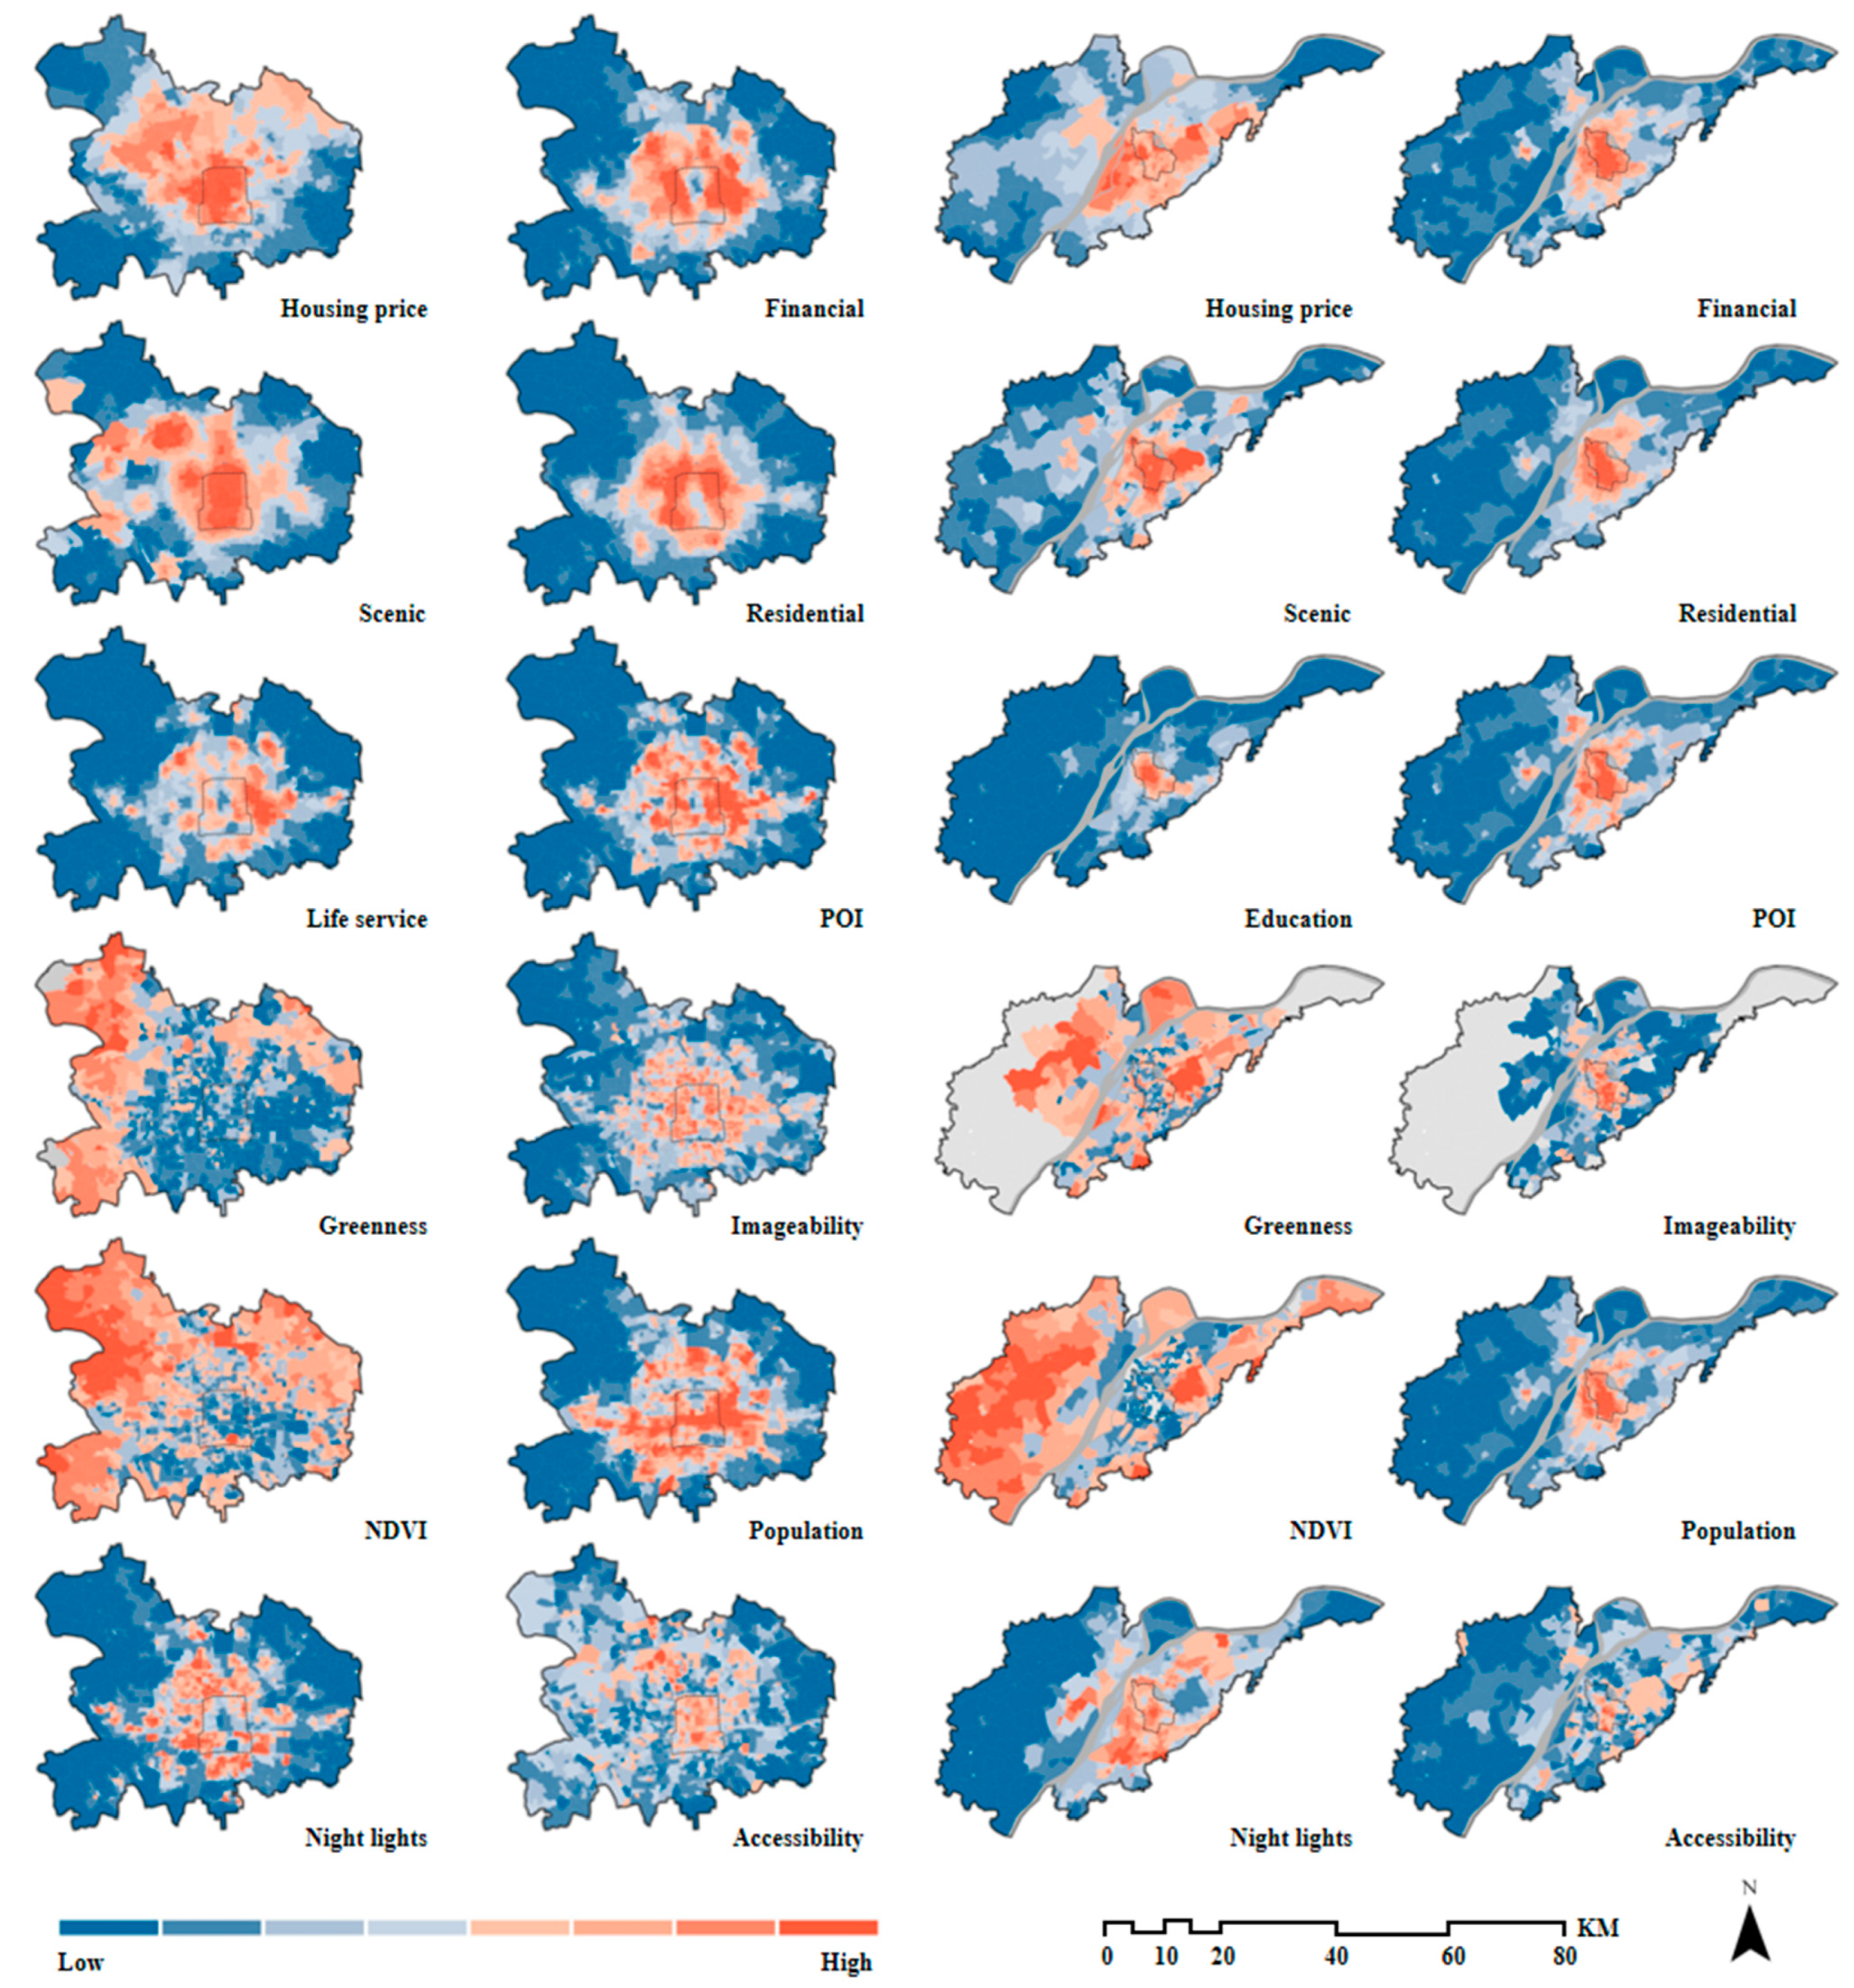
Figure 7 depicts the spatial distribution of selected environmental and socioeconomic variables in Beijing and Nanjing. Variables such as financial services, residential and life-service facilities, POI density, population density, accessibility, and imageability exhibit similar spatial patterns: high values are concentrated around the historic urban cores and gradually decline toward the suburban peripheries. In contrast, greenness-related indicators—including greenness, NDVI, and openness—display an opposite gradient, increasing outward from the old city centers.
Several key observations can be drawn. First, as both Beijing and Nanjing are historic cities with rich cultural and heritage resources, scenic spot density peaks within their old urban areas. This pattern closely resembles that of many European cities, yet contrasts sharply with younger, rapidly developed cities such as Shenzhen. Second, nighttime light intensity is highest in the newly developed districts encircling the historic cores, suggesting that the physical constraints of older built environments may partially limit contemporary economic activities. Third, NDVI values are generally higher than visual greenness scores. While visual greenness better captures human-scale perception, whether NDVI serves as a more appropriate indicator for intra-community vegetation coverage remains open for further analysis.
Lastly, Beijing and Nanjing show distinct spatial characteristics in housing prices and educational facility density. In Nanjing, educational facilities are highly concentrated within the old city, explaining the variable’s strong predictive influence in subsequent modeling. Conversely, Beijing’s educational density peaks in the northwestern “university town” area. Housing price distributions also differ: high-value clusters are primarily located within the historic core of Beijing, while in Nanjing, elevated housing prices are observed both in the old city and in emerging southern districts. These variations help explain the distinct shapes of housing price influence curves observed between the two cities.
To enhance the accuracy of the regression models and reduce the risk of overfitting, we examined multicollinearity among the independent variables and excluded those with a variance inflation factor (VIF) greater than 5. The final analytical datasets comprised 16 variables for Beijing and 12 variables for Nanjing, as listed in Table 2. All variables were then incorporated into the regression framework to compare the performance of several models (Table 3), including Ordinary Least Squares, Spatial Error Model, Random Forest, Gradient Boosted Decision Tree, and XGBoost. The results indicate that the XGBoost model achieved the highest fitting accuracy (R2 = 0.73 for Beijing; R2 = 0.81 for Nanjing) and was further validated through five-fold cross-validation.

5.3. Variables Importance

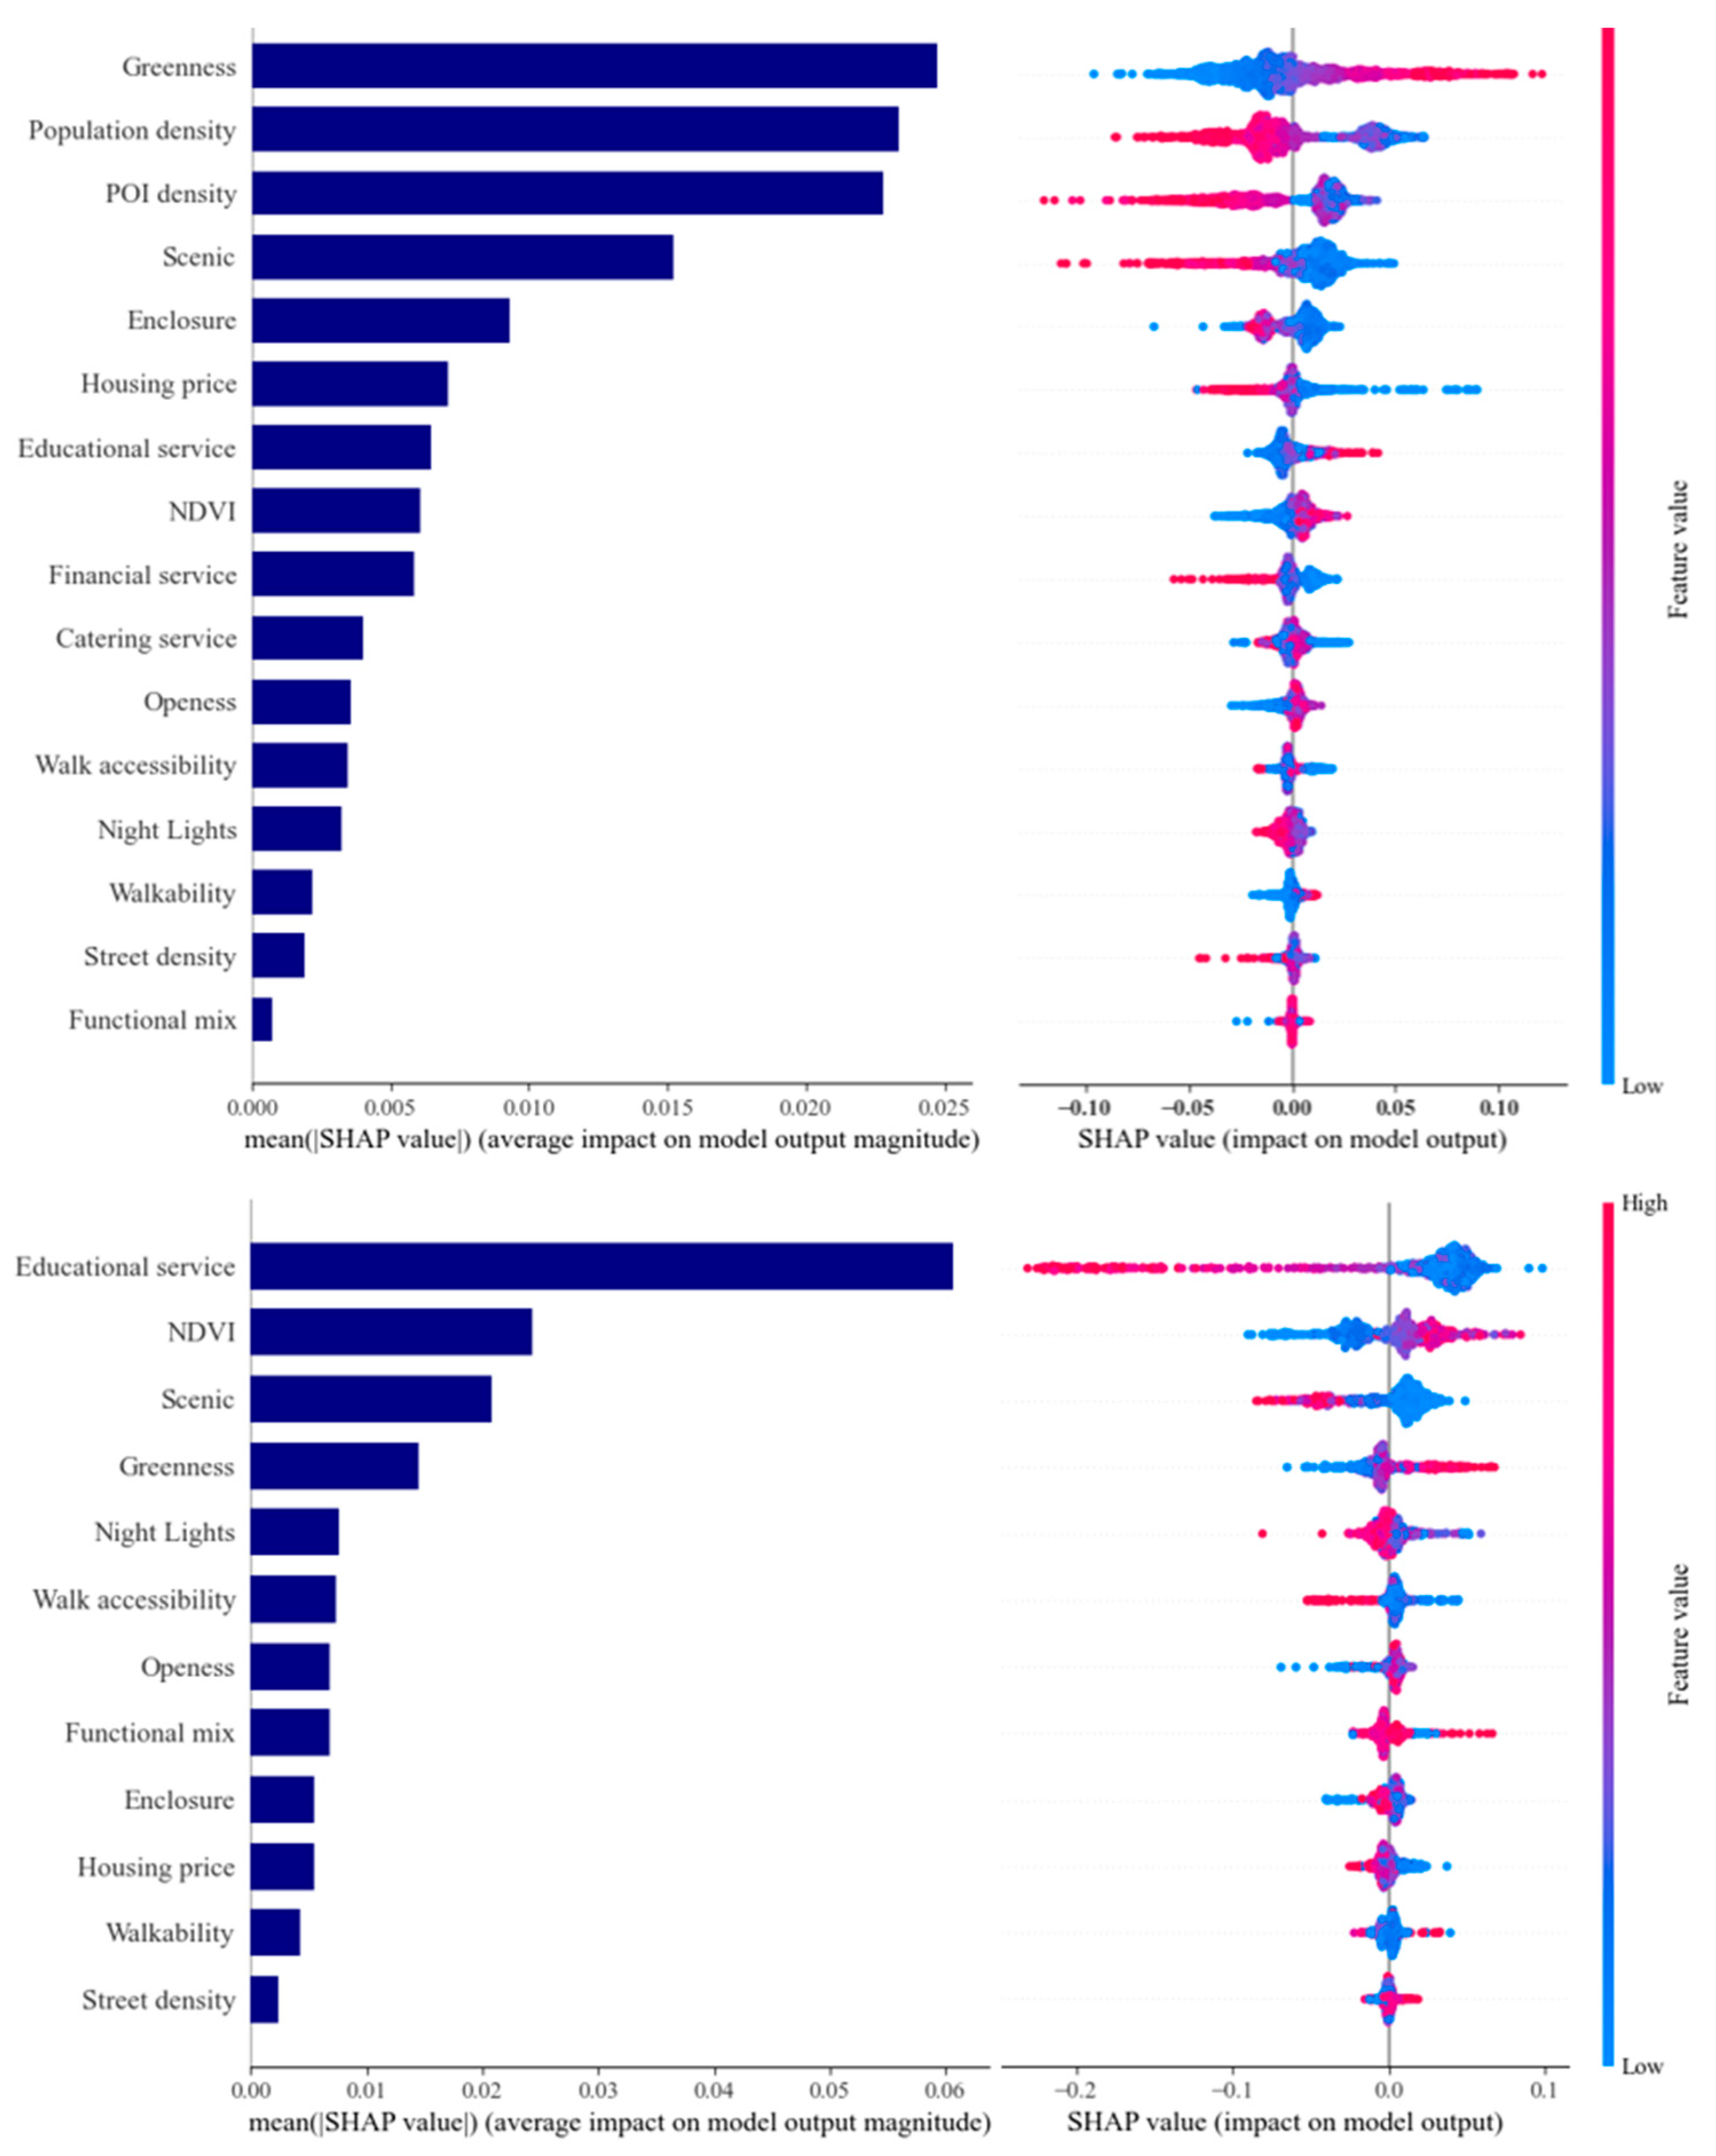
The contributions of different variables to perception bias were evaluated using their mean SHAP values. As shown in Figure 8, the most influential factors for perception bias in Beijing are greenness (0.026), population density (0.024), POI density (0.022), and scenic spot density (0.016). In contrast, the key determinants in Nanjing are educational facility density (0.062), NDVI (0.025), scenic spot density (0.024), and greenness (0.018). Notably, these variables are all closely related to urban development intensity, indicating that variations in green distribution and built density play a crucial role in shaping perception bias.
Figure 8 display the point plots of SHAP values, illustrating both the direction and magnitude of each variable’s effect. In the plots, color represents the relative magnitude of each variable (high or low values), while the horizontal position indicates whether the effect on perception bias is positive (SHAP > 0) or negative (SHAP < 0). The results show that population density, POI density, scenic spot density, housing price, financial service density, nighttime light intensity, and street density all exert significant negative effects on perception bias (i.e., increasing relative SWB). Conversely, greenness, NDVI, and openness exhibit pronounced positive effects (i.e., reducing relative SWB). These findings align with Dong [4], who demonstrated that higher accessibility to public services and facilities within urban areas enhances residents’ internal well-being, whereas SWB levels tend to be lower in suburban and rural areas.

5.4. Nonlinear Association Analys

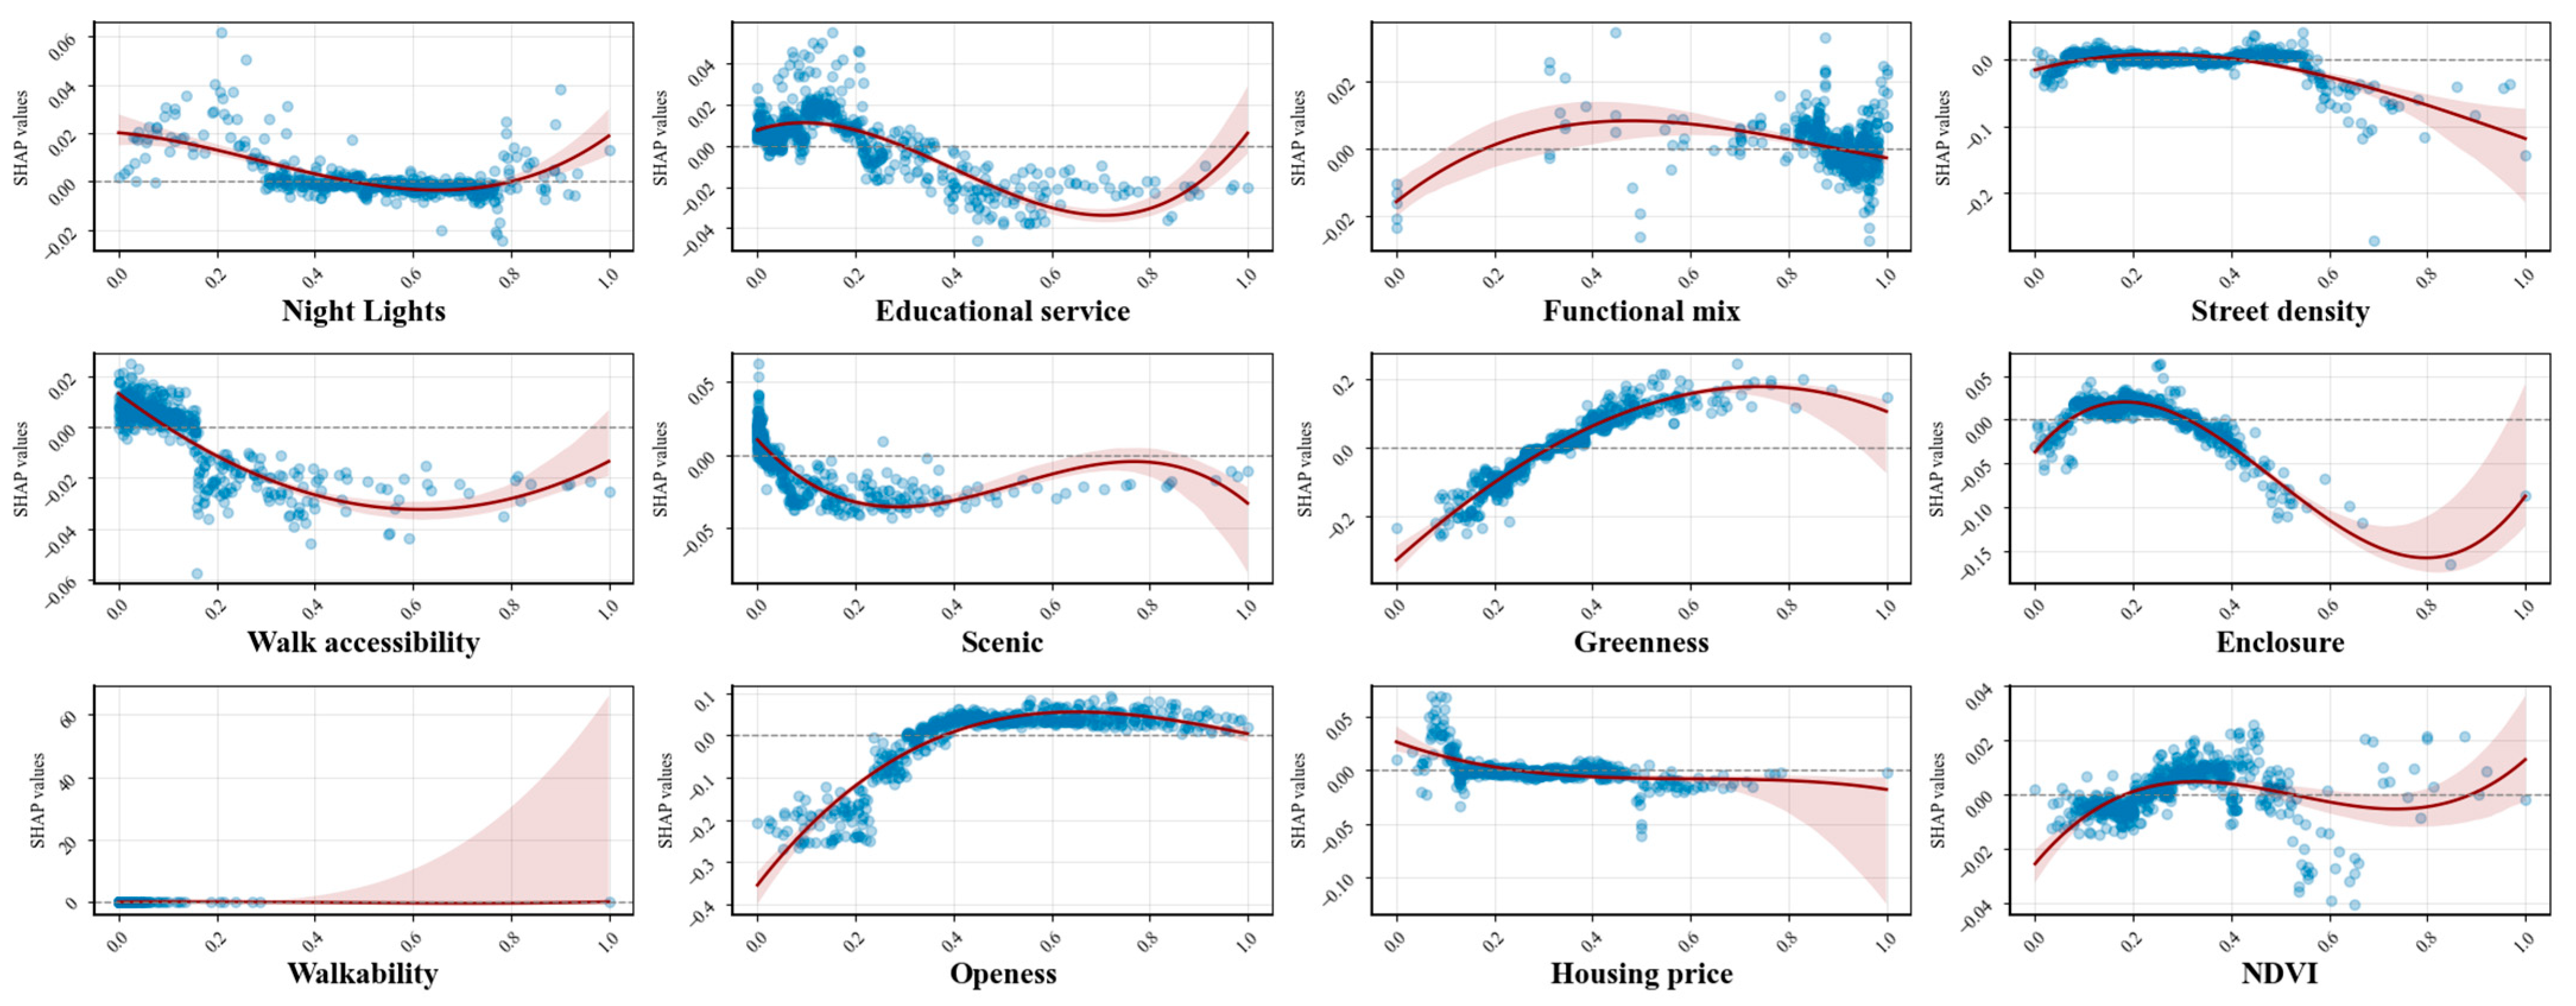
While global SHAP importance scores identify which variables most strongly influence perception bias, they do not reveal how these variables exert their effects. To further explore the directional and nonlinear relationships between explanatory variables and perception bias, we employed Local Dependence Plots to visualize the fitted nonlinear associations between SHAP values and each variable. As illustrated in Figure 9 and Figure 10, the color intensity of the scatter points represents the concentration of variable values, while the fitted curves indicate the overall influence trends and confidence intervals. Negative SHAP values denote a reducing effect on perception bias—that is, a relative increase in subjective well-being.
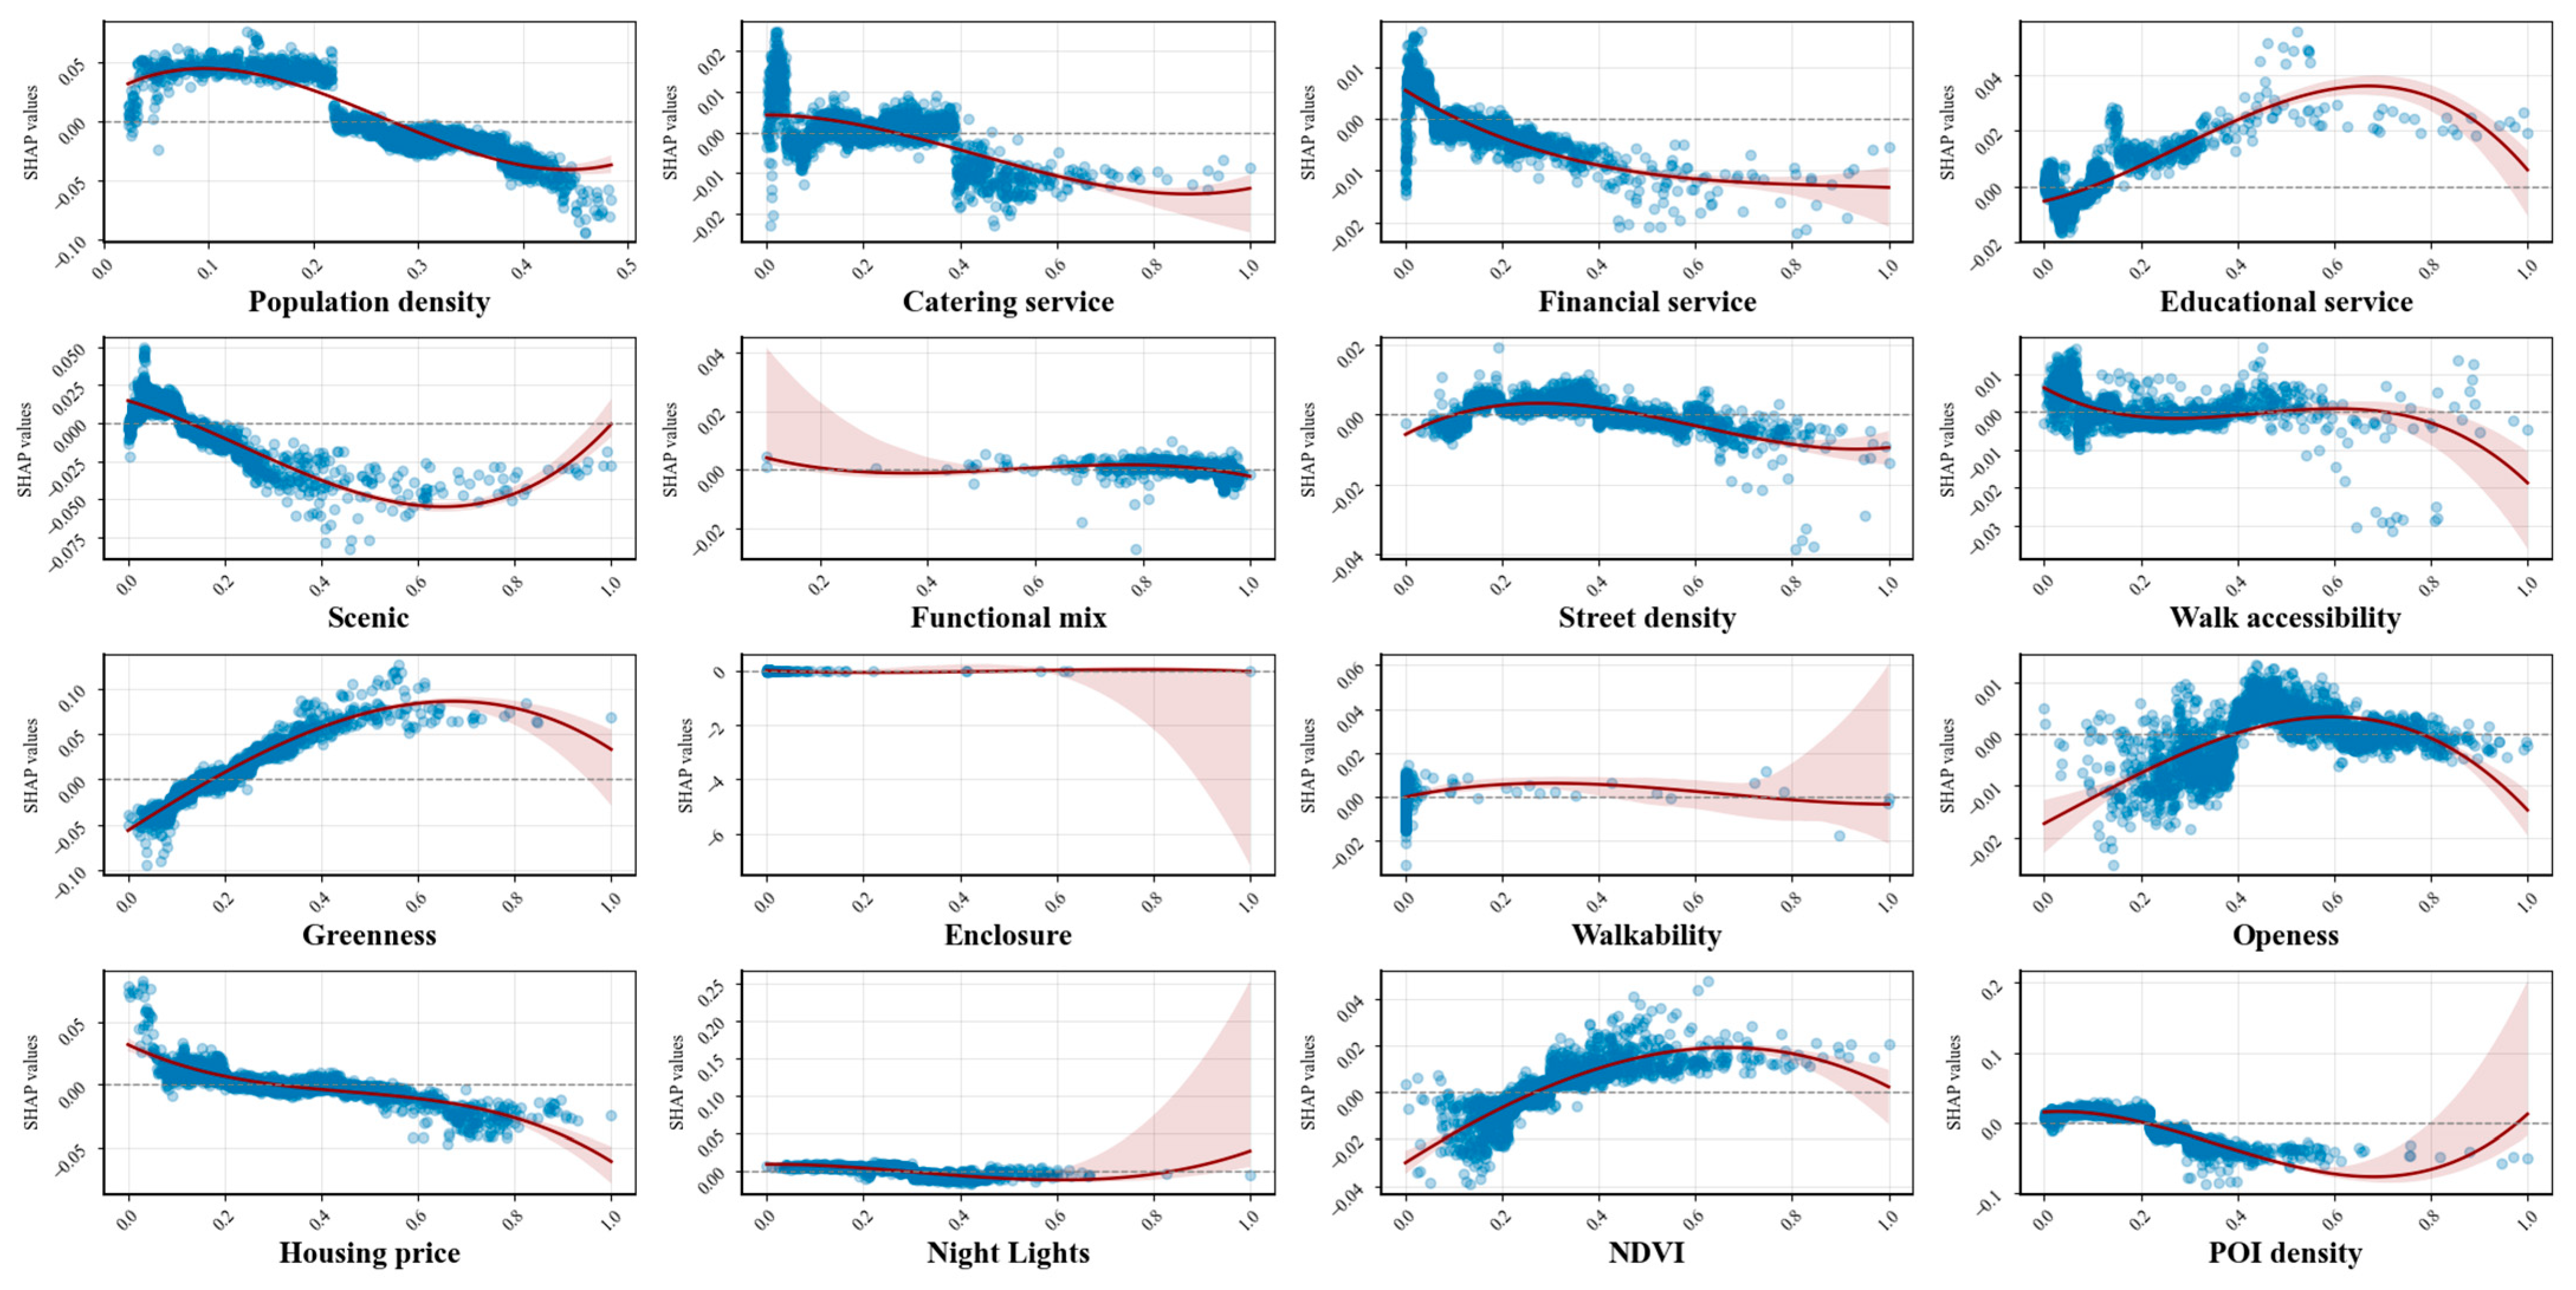
Figure 9 presents the fitted relationships for Beijing. Population density shows an overall negative effect, with the influence shifting from positive to negative beyond 0.22 and turning upward again after 0.45. This suggests that moderate population clustering enhances social networks and perceived SWB, whereas excessive density compresses public resources and reduces well-being [28]. Restaurant and financial service densities display similar nonlinear trends: for example, when restaurant density exceeds 0.12, SHAP values sharply decline, turning negative and remaining stable between 0.12–0.40, before dropping steeply beyond 0.40. This indicates that insufficient commercial and financial amenities may lower well-being, while moderate levels contribute positively but with diminishing returns. Educational facility density follows a U-shaped pattern—declining and then rising—implying that increases in educational resources (0.00–0.16) initially enhance SWB [5], but excessive clustering (above 0.16) generates the opposite effect. This may be attributed to the concentration of universities in Beijing’s northwestern “college town,” where high educational density coincides with distinct land-use conditions. Scenic-spot density exhibits an overall negative relationship, suggesting that higher concentrations of parks and cultural attractions stimulate local activity and improve well-being. However, beyond 0.66, the relationship becomes positive, indicating that overly dense scenic areas can disrupt daily life. Street density demonstrates a dual-threshold pattern—turning from negative to positive at 0.17 and back to negative above 0.58. Higher street density implies well-connected communities that facilitate mobility and convenience [52], whereas low-density networks represent open suburban areas that can also foster positive emotions; in most zones, however, street density has limited impact on perception bias. Walk accessibility exhibits a strong decline above 0.55, confirming that enhanced pedestrian access increases life satisfaction [16]. Greenness indicators, including green coverage and NDVI, follow an inverted U-shaped trend: SHAP values turn from positive to negative when green coverage exceeds 0.20 or NDVI exceeds 0.22, then gradually decrease beyond 0.60 and 0.65, respectively. Because greenness increases from the old city to the suburbs, this pattern suggests that reduced built density at the urban edge may correspond to lower perceived SWB. Openness shows a similar pattern, producing negative effects when below 0.40 or above 0.60—indicating that both highly enclosed and highly open environments enhance relative SWB, an important insight for determining optimal spatial thresholds. Housing price exerts a generally negative effect, with SHAP values turning from positive to negative beyond 0.42. As noted by [18], higher housing prices typically coincide with better street environments and services, and also reflect higher household income, which is positively associated with SWB [24]. Finally, POI density shifts from positive to negative around 0.20, implying that moderate facility density enhances well-being [16], whereas excessive concentration (above 0.80) generates the opposite outcome.
As shown in Figure 10, most variables in Nanjing exhibit patterns similar to those in Beijing, though several notable differences emerge. Night light index exerts a stronger influence, showing a downward trend—positive below 0.40 and negative above 0.80—reflecting the well-established link between economic activity and well-being [3]. Educational density becomes negative beyond 0.32 and turns upward again after 0.75. Given that educational and construction densities are highly correlated in Nanjing, this indicates that moderate urban compactness enhances SWB [29], while excessive concentration produces diminishing returns—consistent with the Beijing results. Functional mix remains positive between 0.12–0.92, suggesting that appropriate land-use diversity supports residents’ daily needs and social interactions, thereby improving well-being [29]. However, due to the Shannon diversity index used in its calculation, extremely high values (approaching 1) may paradoxically reflect functional homogeneity, reversing the trend. Street density in Nanjing exhibits an opposite curve to Beijing’s results, largely due to differences in sample size and development intensity; in essence, the Nanjing curve represents a localized magnification of Beijing’s pattern. The walk-accessibility curve also reflects urban scale differences: Beijing’s larger spatial extent and wider transition zones between the old core and suburbs produce a smoother gradient, whereas Nanjing’s smaller scale results in sharper transitions between compact and open urban forms.

6. Discussion

6.1. Perceptual Bias and the Well-Being Paradox

This study reveals a clear spatial gradient of perceptual bias across Beijing and Nanjing: values increase outward from the historic cores, where perceptual bias is low and SWB is high, toward suburban and newly developed zones, where bias is high and SWB comparatively low. In other words, residents of historic districts report well-being levels that exceed what their physical environmental quality would predict, whereas residents of newer or suburban areas experience the opposite—appealing environments but lower SWB. This pattern challenges the conventional linear assumption that environmental improvement necessarily enhances well-being [33], and exposes a “density–well-being paradox” common in developing-country cities: high density is not inevitably a burden but can, through socio-cultural embeddedness, become a source of psychological stability [10,29]. Long-term residents in old neighborhoods often cultivate dense social networks, shared rhythms of daily life, and deep historical memory, forming strong place attachment and social capital that sustain high well-being even amid physical decay. Meanwhile, the compact distribution of services and cultural facilities enhances accessibility and interaction, reinforcing a sense of belonging and meaning. By contrast, newly built districts—though greener and visually superior—often lack the emotional compensation and social cohesion found in historic cores due to high residential turnover and lagging services. In addition, longer car-dependent commutes, weaker public-transport frequency and coverage, and first–last-mile frictions further depress SWB [13,14]. Hence, the phenomenon of “high SWB amid low environmental quality” in historic cities is not anomalous but represents a stable SWB mechanism sustained by cultural identity, social capital, and everyday convenience. These findings empirically challenge the environmental-stress hypothesis and the Campbell-type linear model of “objective environment → well-being,” urging future research to integrate visual quality, functional accessibility, and place identity within a unified explanatory framework for understanding nonlinear relationships between urban form and subjective well-being.

6.2. Spatial Mechanisms of Density and Well-Being

The analysis further uncovers pronounced nonlinear and threshold effects among environmental variables, indicating that urban SWB does not rise monotonically with environmental improvement but is jointly moderated by physical and social mechanisms.
  • Population and facility density: Population, street, and commercial/tourism facility densities exhibit inverted-U or bimodal curves. Moderate density enhances convenience and social interaction, reducing perceptual bias; once beyond a threshold, congestion and noise diminish SWB, while very low density (e.g., in peripheral zones) equally suppresses SWB due to weak accessibility.
  • Greenness and openness: Both visual greenness (street-level vegetation) and NDVI show positive associations with well-being at low levels but diminishing or negative effects when excessive, reflecting a “rise-then-fall” pattern as maintenance costs and facility scarcity offset comfort gains.
  • Housing price and socioeconomic burden: Housing price correlates negatively with well-being beyond a critical point, suggesting that cost stress mediates the benefit of visually improved environments.
  • Road network and transport accessibility: Street density, accessibility, and walkability exhibit nonlinear returns: improvements from low to moderate levels generate substantial gains in SWB—via better network connectivity and expanded pedestrian provision—whereas excessive capacity expansion can induce congestion and overconcentration.
Collectively, these nonlinearities point to an “optimal zone” of urban livability, where SWB gains depend on balanced—not extreme—environmental conditions. The density–well-being relationship exemplifies this threshold mechanism. At the scale of historic neighborhoods, moderate to moderately high density strengthens social interaction and neighborhood support. Consistent with the studies of Avtar [59] and Mouratidis [29], density effects plateau beyond the optimal threshold, after which socioeconomic stress outweighs accessibility benefits. Our results suggest that historic cities may possess a higher “SWB-density ceiling,” whose spatial and social carrying capacity is jointly sustained by community networks and cultural capital. Consequently, well-being research should move beyond a unidirectional “environmental-improvement logic” toward a social–spatial interaction framework, identifying nonlinear inflection points and livability thresholds to guide differentiated planning strategies for old cores, new districts, and peripheral areas.

6.3. Inter-City Differences and Policy Implications

Building on these theoretical and empirical insights, urban regeneration in historic cities should seek a dynamic balance between cultural preservation, resident well-being, and spatial efficiency—yet this balance is inherently context-specific. Compared with Beijing’s strong-center, monocentric structure, Nanjing demonstrates a dual-core configuration: high housing prices, facility concentration, and well-being levels occur both in the historic core and the emerging southern districts. With shorter commuting distances and a compact urban scale, Nanjing reflects a more multi-node, tightly knit spatial form. Accordingly, Beijing and Nanjing require distinct strategic emphases.
  • Beijing should focus on alleviating the well-being gap between the core and periphery. This entails extending rail transit and public services to suburban areas to mitigate commuting burdens while avoiding over-aestheticized, capital-driven redevelopment that displaces long-standing communities. Preserving everyday life functions and neighborhood networks in the old city supports a “cultural-continuity” renewal path.
  • Nanjing, by contrast, must coordinate functional and cultural integration between its old and new districts. Policy efforts should maintain the social vitality of historic neighborhoods—preventing over-tourism and commodification that erode place attachment—while ensuring the new southern districts achieve full provision of education, health, and commercial services. Such measures will avert “high-quality environment but low social identity” hollow growth and promote a “culture–function co-evolution” model.
Together, these differentiated strategies embody distinct well-being regulation logics shaped by each city’s spatial structure and socio-cultural mechanisms: Beijing’s priority lies in rebalancing core–periphery inequities, whereas Nanjing’s lies in fostering multi-node synergy between heritage and modernization. Overall, sustainable regeneration in historic cities should evolve from landscape-oriented to well-being-oriented planning, and from uniform standards to contextualized strategies. The contrasting trajectories of Beijing and Nanjing demonstrate that only renewal models integrating cultural heritage conservation with the enhancement of residents’ lived SWB can achieve inclusive revitalization and the “reproduction of well-being” in the modernization of historic urban spaces.

6.4. Limitation

This study also has several limitations. First, social media users are predominantly young people, which may lead to sample bias and limit the representativeness of emotional patterns for the entire population—particularly for older adults and children [60]. Younger populations exhibit distinctive lifestyle patterns and activity preferences, making them more sensitive to environmental attributes such as commercial vitality, nighttime illumination, and the density of social venues, while less responsive to factors like community safety, accessibility of public facilities, or neighborhood cohesion. Consequently, SWB indicators derived from social media data are more likely to capture “vibrant” or “consumption-oriented” spatial characteristics, potentially underrepresenting environmental dimensions that are equally crucial for other age groups—such as tranquility, accessibility, and social support. Second, the simple normalization and aggregation of different perceptual scores—such as beauty, liveliness, wealth, boredom, depression, and safety—can only provide a general perception trend. A more accurate composite index should consider the varying weights and preferences different demographic groups assign to these perceptual dimensions. Third, substantial inter-city differences exist, and the cases of Beijing and Nanjing represent only a subset of China’s urban diversity. Further research involving a wider range of cities—such as Chongqing (mountainous) and Qingdao (coastal)—is necessary to validate the findings across different geographical and environmental contexts. Future studies should integrate large-scale longitudinal tracking with big-data analysis to develop localized datasets that incorporate individual attributes, thereby enhancing the robustness and generalizability of urban well-being research in China. Finally, in the contemporary context of automobility, this study does not explicitly account for mode-specific mobility. Our analysis centers on built-environment and perceptual variables and therefore does not quantify how car dependence and public transport service quality mediate the relationship between urban form and SWB—especially in suburban settings and along center–periphery linkages. Future work should incorporate a mobility dimension, including intercity long-distance commuting and even international migration-related mobility, which may also shape well-being.

7. Conclusions

This study integrates social media and street-view data to construct a framework capturing the bias between residents’ subjective well-being and perceived residential environment. Using an XGBoost model enhanced with spatial features and the SHAP interpretability method, we explored the underlying mechanisms driving this perception bias. The results reveal that in both Beijing and Nanjing, perception bias exhibits a concentric spatial clustering pattern, decreasing from the old city core toward the suburban periphery. Moreover, multi-level environmental variables demonstrate pronounced nonlinear associations with perception bias. From the perspective of urban renewal, the findings suggest that identifying clustered patterns of perception bias can serve as an effective approach for prioritizing renovation areas and adopting differentiated intervention strategies. Such data-driven targeting promotes rational resource allocation and efficient implementation. Furthermore, urban renewal efforts should coordinate both physical and socioeconomic dimensions to ensure that variables with strong main effects remain within optimal threshold ranges. For example, in historic districts, maintaining neighborhood convenience and social cohesion is essential to prevent declines in well-being that may result from purely physical upgrades. In contrast, the planning of new urban districts should emphasize the provision of public amenities and improved transportation accessibility to avoid the emergence of underutilized or “hollow” developments. Overall, this study underscores the importance of fine-grained analysis of intra-urban SWB bias as a basis for spatially adaptive policy design—offering valuable insights for Chinese cities undergoing large-scale urban regeneration.

Author Contributions

Conceptualization, Y.Z. and J.L.; methodology, Y.Z.; software, Y.Z.; validation, Y.Z.; formal analysis, Y.Z.; investigation, Y.Z.; resources, Y.Z.; data curation, Y.Z.; writing—original draft preparation, Y.Z. and J.L.; writing—review and editing, Y.Z. and J.L.; visualization, Y.Z.; supervision, J.L.; project administration, J.L.; funding acquisition, J.L. All authors have read and agreed to the published version of the manuscript.

Funding

This research was funded by National Natural Science Foundation of China (Grant No. 51878138).

Data Availability Statement

The data presented in this study are available on request from the corresponding author.

Conflicts of Interest

The authors declare no conflicts of interest.

Abbreviations

The following abbreviations are used in this manuscript:
SWB Subjective Well-Being
REQ Residential Environment Quality
PB Perceptual Bias
BE Built Environment
NDVI Normalized Difference Vegetation Index
POI Point of Interest
NLP Natural Language Processing
SVM Support Vector Machine
FCN Fully Convolutional Network
SHAP SHapley Additive exPlanations
OLS Ordinary Least Squares
SEM Spatial Error Model
GBDTGradient Boosted Decision Tree

References

  1. Veenhoven, R. Is Happiness Relative? Soc. Indic. Res. 1991, 24, 1–34. [Google Scholar] [CrossRef]
  2. Diener, E.; Inglehart, R.; Tay, L. Theory and Validity of Life Satisfaction Scales. Soc. Indic. Res. 2013, 112, 497–527. [Google Scholar] [CrossRef]
  3. Dong, G.; Zhang, Z.; Zhang, H.; Wu, L. Geographical Match of Objective and Subjective Measures of Well-Being at an Intra-City Scale. Appl. Geogr. 2024, 167, 103290. [Google Scholar] [CrossRef]
  4. Dong, Y.; Li, F.; Cao, J.; Dong, W. What Neighborhood Factors Are Critical to Resident Satisfaction with Old Neighborhoods? An Integration of Ground Theory and Impact Asymmetry Analysis. Cities 2023, 141, 104460. [Google Scholar] [CrossRef]
  5. Huang, Y.; Yi, D.; Clark, W.A.V. Subjective Wellbeing in 21st Century China: A Multi-Level Multi-Dimensional Perspective on Urban-Rural Disparities. Appl. Geogr. 2023, 159, 103071. [Google Scholar] [CrossRef]
  6. Millward, H.; Spinney, J. Urban–Rural Variation in Satisfaction with Life: Demographic, Health, and Geographic Predictors in Halifax, Canada. Appl. Res. Qual. Life 2013, 8, 279–297. [Google Scholar] [CrossRef]
  7. Ettema, D.; Schekkerman, M. How Do Spatial Characteristics Influence Well-Being and Mental Health? Comparing the Effect of Objective and Subjective Characteristics at Different Spatial Scales. Travel Behav. Soc. 2016, 5, 56–67. [Google Scholar] [CrossRef]
  8. Kent, J.L.; Ma, L.; Mulley, C. The Objective and Perceived Built Environment: What Matters for Happiness? Cities Health 2017, 1, 59–71. [Google Scholar] [CrossRef]
  9. Lovejoy, K.; Handy, S.; Mokhtarian, P. Neighborhood Satisfaction in Suburban versus Traditional Environments: An Evaluation of Contributing Characteristics in Eight California Neighborhoods. Landsc. Urban Plan. 2010, 97, 37–48. [Google Scholar] [CrossRef]
  10. Biswas-Diener, R.; Diener, E. Making the Best of a Bad Situation: Satisfaction in the Slums of Calcutta. Soc. Indic. Res. 2001, 55, 329–352. [Google Scholar] [CrossRef]
  11. Phillips, D.R.; Cheng, K.H.C.; Yeh, A.G.O.; Siu, O.-L. Person—Environment (P—E) Fit Models and Psychological Well-Being Among Older Persons in Hong Kong. Environ. Behav. 2010, 42, 221–242. [Google Scholar] [CrossRef]
  12. Scannell, L.; Gifford, R. Defining Place Attachment: A Tripartite Organizing Framework. J. Environ. Psychol. 2010, 30, 1–10. [Google Scholar] [CrossRef]
  13. Mokhtarian, P.L.; Cao, X. Examining the Impacts of Residential Self-Selection on Travel Behavior: A Focus on Methodologies. Transp. Res. Part B Methodol. 2008, 42, 204–228. [Google Scholar] [CrossRef]
  14. Stutzer, A.; Frey, B.S. Stress That Doesn’t Pay: The Commuting Paradox*. Scand. J. Econ. 2008, 110, 339–366. [Google Scholar] [CrossRef]
  15. Deb, S.; Okulicz-Kozaryn, A. Exploring the Association of Urbanisation and Subjective Well-Being in India. Cities 2023, 132, 104068. [Google Scholar] [CrossRef]
  16. Ozbilen, B.; Akar, G. Designing Pandemic Resilient Cities: Exploring the Impacts of the Built Environment on Infection Risk Perception and Subjective Well-Being. Travel Behav. Soc. 2023, 30, 105–117. [Google Scholar] [CrossRef] [PubMed]
  17. Kubiszewski, I.; Jarvis, D.; Zakariyya, N. Spatial Variations in Contributors to Life Satisfaction: An Australian Case Study. Ecol. Econ. 2019, 164, 106345. [Google Scholar] [CrossRef]
  18. Ma, S.; Wang, B.; Liu, W.; Zhou, H.; Wang, Y.; Li, S. Assessment of Street Space Quality and Subjective Well-Being Mismatch and Its Impact, Using Multi-Source Big Data. Cities 2024, 147, 104797. [Google Scholar] [CrossRef]
  19. Credit, K.; Lehnert, M. A Structured Comparison of Causal Machine Learning Methods to Assess Heterogeneous Treatment Effects in Spatial Data. J. Geogr. Syst. 2023, 26, 483–510. [Google Scholar] [CrossRef]
  20. Liu, X.; Kounadi, O.; Zurita-Milla, R. Incorporating Spatial Autocorrelation in Machine Learning Models Using Spatial Lag and Eigenvector Spatial Filtering Features. Int. J. Geo-Inf. 2022, 11, 242. [Google Scholar] [CrossRef]
  21. Yoshida, T.; Murakami, D.; Seya, H. Spatial Prediction of Apartment Rent Using Regression-Based and Machine Learning-Based Approaches with a Large Dataset. J. Real Estate Financ. Econ. 2024, 69, 1–28. [Google Scholar] [CrossRef]
  22. Credit, K. Spatial Models or Random Forest? Evaluating the Use of Spatially Explicit Machine Learning Methods to Predict Employment Density around New Transit Stations in Los Angeles. Geogr. Anal. 2022, 54, 58–83. [Google Scholar] [CrossRef]
  23. Chen, J.; Chen, S. Mental Health Effects of Perceived Living Environment and Neighborhood Safety in Urbanizing China. Habitat. Int. 2015, 46, 101–110. [Google Scholar] [CrossRef]
  24. Appleton, S.; Song, L. Life Satisfaction in Urban China: Components and Determinants. World Dev. 2008, 36, 2325–2340. [Google Scholar] [CrossRef]
  25. Zhang, P. Happiness Inequality Has a Kuznets-Style Relation with Economic Growth in China. Sci. Rep. 2022, 12, 15712. [Google Scholar] [CrossRef]
  26. Jiang, Y.; Chen, L.; Xie, Y.; Li, Y.; Li, T. Subjective Well-Being of Historical Neighborhood Residents in Beijing: The Impact on the Residential Environment. Sustainability 2023, 15, 1847. [Google Scholar] [CrossRef]
  27. Wang, F.; Wang, D. Geography of Urban Life Satisfaction: An Empirical Study of Beijing. Travel Behav. Soc. 2016, 5, 14–22. [Google Scholar] [CrossRef]
  28. Rodgers, W.L. Density, Crowding, and Satisfaction with the Residential Environment. Soc. Indic. Res. 1982, 10, 75–102. [Google Scholar] [CrossRef]
  29. Mouratidis, K. Compact City, Urban Sprawl, and Subjective Well-Being. Cities 2019, 92, 261–272. [Google Scholar] [CrossRef]
  30. Kyttä, M.; Broberg, A.; Haybatollahi, M.; Schmidt-Thomé, K. Urban Happiness: Context-Sensitive Study of the Social Sustainability of Urban Settings. Environ. Plan. B-Plan. Des. 2016, 43, 34–57. [Google Scholar] [CrossRef]
  31. Diener, E. Subjective Well-Being. Psychol. Bull. 1984, 95, 542–575. [Google Scholar] [CrossRef]
  32. Voukelatou, V.; Gabrielli, L.; Miliou, I.; Cresci, S.; Sharma, R.; Tesconi, M.; Pappalardo, L. Measuring Objective and Subjective Well-Being: Dimensions and Data Sources. Int. J. Data Sci. Anal. 2021, 11, 279–309. [Google Scholar] [CrossRef]
  33. Pavot, W.; Diener, E. The Affective and Cognitive Context of Self-Reported Measures of Subjective Well-Being. Soc. Indic. Res. 1993, 28, 1–20. [Google Scholar] [CrossRef]
  34. Bowman, N.A.; Schuldt, J.P. Effects of Item Order and Response Options in College Student Surveys. New Dir. Institutional Res. 2014, 2014, 99–109. [Google Scholar] [CrossRef]
  35. Ghermandi, A.; Sinclair, M. Passive Crowdsourcing of Social Media in Environmental Research: A Systematic Map. Glob. Environ. Change 2019, 55, 36–47. [Google Scholar] [CrossRef]
  36. Huai, S.; Van De Voorde, T. Which Environmental Features Contribute to Positive and Negative Perceptions of Urban Parks? A Cross-Cultural Comparison Using Online Reviews and Natural Language Processing Methods. Landsc. Urban Plan. 2022, 218, 104307. [Google Scholar] [CrossRef]
  37. Wang, R.; Browning, M.H.E.M.; Qin, X.; He, J.; Wu, W.; Yao, Y.; Liu, Y. Visible Green Space Predicts Emotion: Evidence from Social Media and Street View Data. Appl. Geogr. 2022, 148, 102803. [Google Scholar] [CrossRef]
  38. Li, D.; Shen, W. Regional Happiness and Corporate Green Innovation: A Financing Constraints Perspective. Sustainability 2022, 14, 2263. [Google Scholar] [CrossRef]
  39. Lin, Y.; Wood, S.A.; Lawler, J.J. The Relationship between Natural Environments and Subjective Well-Being as Measured by Sentiment Expressed on Twitter. Landsc. Urban Plan. 2022, 227, 104539. [Google Scholar] [CrossRef]
  40. Li, S.; Ma, S.; Tong, D.; Jia, Z.; Li, P.; Long, Y. Associations between the Quality of Street Space and the Attributes of the Built Environment Using Large Volumes of Street View Pictures. Environ. Plan. B Urban Anal. City Sci. 2022, 49, 1197–1211. [Google Scholar] [CrossRef]
  41. Zhu, Y.; Su, F.; Han, X.; Fu, Q.; Liu, J. Uncovering the Drivers of Gender Inequality in Perceptions of Safety: An Interdisciplinary Approach Combining Street View Imagery, Socio-Economic Data and Spatial Statistical Modelling. Int. J. Appl. Earth Obs. Geoinf. 2024, 134, 104230. [Google Scholar] [CrossRef]
  42. Dubey, A.; Naik, N.; Parikh, D.; Raskar, R.; Hidalgo, C.A. Deep Learning the City: Quantifying Urban Perception at a Global Scale. In Computer Vision—ECCV 2016; Leibe, B., Matas, J., Sebe, N., Welling, M., Eds.; Lecture Notes in Computer Science; Springer International Publishing: Cham, Switzerland, 2016; Volume 9905, pp. 196–212. ISBN 978-3-319-46447-3. [Google Scholar]
  43. Zhang, F.; Zhou, B.; Liu, L.; Liu, Y.; Fung, H.H.; Lin, H.; Ratti, C. Measuring Human Perceptions of a Large-Scale Urban Region Using Machine Learning. Landsc. Urban Plan. 2018, 180, 148–160. [Google Scholar] [CrossRef]
  44. Wei, J.; Yue, W.; Li, M.; Gao, J. Mapping Human Perception of Urban Landscape from Street-View Images: A Deep-Learning Approach. Int. J. Appl. Earth Obs. Geoinf. 2022, 112, 102886. [Google Scholar] [CrossRef]
  45. Yao, Y.; Liang, Z.; Yuan, Z.; Liu, P.; Bie, Y.; Zhang, J.; Wang, R.; Wang, J.; Guan, Q. A Human-Machine Adversarial Scoring Framework for Urban Perception Assessment Using Street-View Images. Int. J. Geogr. Inf. Sci. 2019, 33, 2363–2384. [Google Scholar] [CrossRef]
  46. Zhang, F.; Fan, Z.; Kang, Y.; Hu, Y.; Ratti, C. “Perception Bias”: Deciphering a Mismatch between Urban Crime and Perception of Safety. Landsc. Urban Plan. 2021, 207, 104003. [Google Scholar] [CrossRef]
  47. Kang, Y.; Abraham, J.; Ceccato, V.; Duarte, F.; Gao, S.; Ljungqvist, L.; Zhang, F.; Näsman, P.; Ratti, C. Assessing Differences in Safety Perceptions Using GeoAI and Survey across Neighbourhoods in Stockholm, Sweden. Landsc. Urban Plan. 2023, 236, 104768. [Google Scholar] [CrossRef]
  48. Kaplan, R.; Kaplan, S. The Experience of Nature: A Psychological Perspective; Cambridge University Press: Cambridge, UK; New York, NY, USA, 1989; ISBN 978-0-521-34139-4. [Google Scholar]
  49. Lawton, M.P.; Nahemow, L. Ecology and the Aging Process. In The Psychology of Adult Development and Aging; Eisdorfer, C., Lawton, M.P., Eds.; American Psychological Association: Washington, DC, USA, 1973; pp. 619–674. [Google Scholar]
  50. Leyden, K.M.; Goldberg, A.; Michelbach, P. Understanding the Pursuit of Happiness in Ten Major Cities. Urban Aff. Rev. 2011, 47, 861–888. [Google Scholar] [CrossRef]
  51. Benita, F.; Bansal, G.; Tunçer, B. Public Spaces and Happiness: Evidence from a Large-Scale Field Experiment. Health Place 2019, 56, 9–18. [Google Scholar] [CrossRef]
  52. Cloutier, S.; Pfeiffer, D. Sustainability Through Happiness: A Framework for Sustainable Development. Sustain. Dev. 2015, 23, 317–327. [Google Scholar] [CrossRef]
  53. Ma, J.; Dong, G.; Chen, Y.; Zhang, W. Does Satisfactory Neighbourhood Environment Lead to a Satisfying Life? An Investigation of the Association between Neighbourhood Environment and Life Satisfaction in Beijing. Cities 2018, 74, 229–239. [Google Scholar] [CrossRef]
  54. Kim, J.; Lee, Y.; Lee, M.-H.; Hong, S.-Y. A Comparative Study of Machine Learning and Spatial Interpolation Methods for Predicting House Prices. Sustainability 2022, 14, 9056. [Google Scholar] [CrossRef]
  55. Chen, Y.; Xu, C.; Ge, Y.; Zhang, X.; Zhou, Y. A 100-m Gridded Population Dataset of China’s Seventh Census Using Ensemble Learning and Geospatial Big Data. Earth Syst. Sci. Data 2024, 16, 3705–3718. [Google Scholar] [CrossRef]
  56. Zhou, B.; Zhao, H.; Puig, X.; Fidler, S.; Barriuso, A.; Torralba, A. Scene Parsing through ADE20K Dataset. In Proceedings of the IEEE Conference on Computer Vision and Pattern Recognition (CVPR), Nashville, TN, USA, 11–15 June 2017; pp. 633–641. [Google Scholar]
  57. Lundberg, S.M.; Lee, S.-I. Consistent Feature Attribution for Tree Ensembles. arXiv 2017, arXiv:1802.03888. [Google Scholar]
  58. McCrea, R.; Shyy, T.-K.; Stimson, R.J. Satisfied Residents in Different Types of Local Areas: Measuring What’s Most Important. Soc. Indic. Res. 2014, 118, 87–101. [Google Scholar] [CrossRef]
  59. Avtar, R.; Ahmad, S.; Rahman, M.M.; Alsulamy, S.; Meraj, G.; Sethi, M.; Singh, C.K.; Kharrazi, A. Impact of Urban Density on Human Well-Being and Sustainable Development in Delhi, India. Sci. Rep. 2025, 15, 33717. [Google Scholar] [CrossRef]
  60. Ilieva, R.T.; McPhearson, T. Social-Media Data for Urban Sustainability. Nat. Sustain. 2018, 1, 553–565. [Google Scholar] [CrossRef]
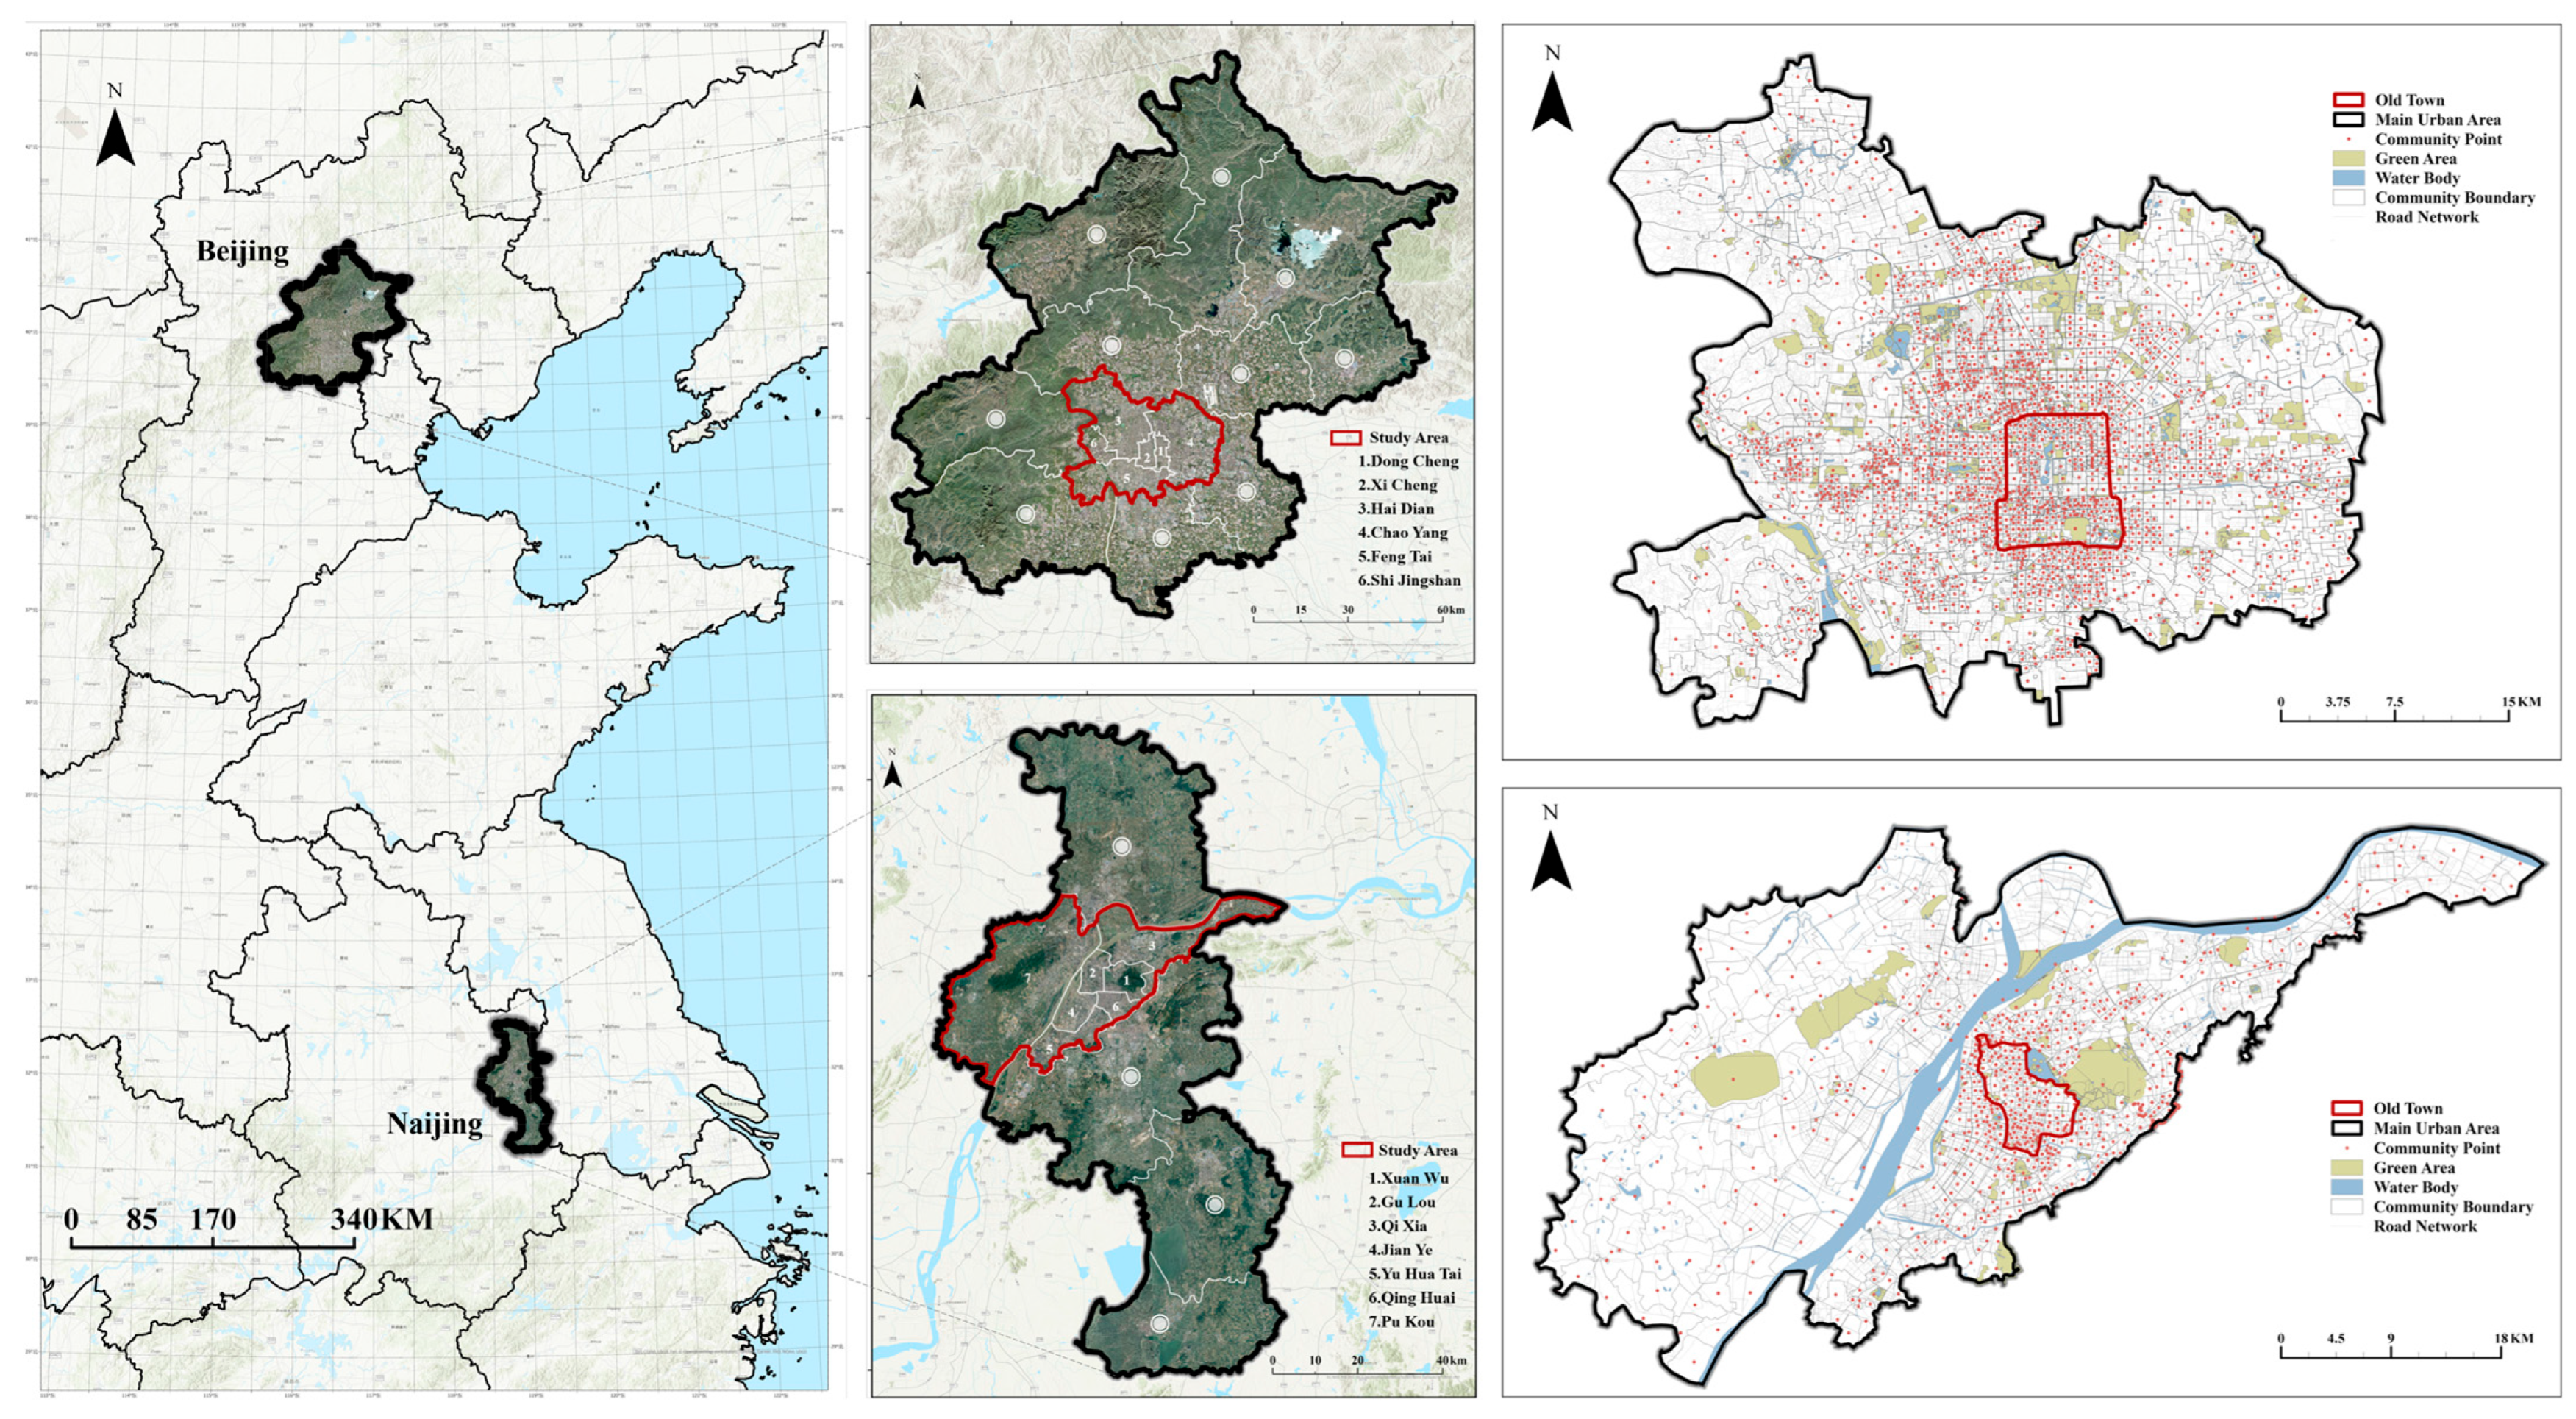
Figure 1. Location of the study area.
Buildings 15 04135 g001
Figure 2. Workflow of the research framework.
Buildings 15 04135 g002
Figure 3. Acquisition and Processing of Street View Images. (a) Sampling point distribution; (b) Street view image crawling; (c) Semantic segmentation; (d) Subjective perception prediction.
Buildings 15 04135 g003
Figure 4. Visual perception maps of the residential environment in Beijing and Nanjing.
Buildings 15 04135 g004
Figure 5. Maps of Perceived Bias in Beijing and Nanjing. (a1,a2) the spatial distribution of visual perception; (b1,b2) the spatial distribution of SWB; (c1,c2) the spatial distribution of perception bias.
Buildings 15 04135 g005
Figure 6. Maps of high and low value clusters of ‘perceptual bias’ in Beijing and Nanjing.
Buildings 15 04135 g006
Figure 7. Geographical distribution of partial urban variables in Beijing and Nanjing.
Buildings 15 04135 g007
Figure 8. Characteristic importance of shap values.
Buildings 15 04135 g008
Figure 9. Nonlinear Fitting of Urban Variables in Beijing. Blue scatter points represent the distribution of the variable, while the red fitted curve indicates the overall trend and confidence interval.
Buildings 15 04135 g009
Figure 10. Nonlinear Fitting of Urban Variables in Nanjing. Blue scatter points represent the distribution of the variable, while the red fitted curve indicates the overall trend and confidence interval.
Buildings 15 04135 g010
Table 1. Calculation approaches and data sources.
DomainsVariablesDefinition and Formula
Macroscale BE
Street densityDstreet = Lroad/Scommunity
Walk accessibility 500 m road accessibility for segment modelling in DepthmapX
Residential densityKernel density of residences in GIS
Life service densityKernel density of life services in GIS
Traffic station densityKernel density of traffic stations in GIS
Scenic densityKernel density of scenic areas in GIS
Financial service densityKernel density of financial services in GIS
Educational service densityKernel density of educational services in GIS
Medical service densityKernel density of medical services in GIS
Government agency densityKernel density of government agencies in GIS
Catering service densityKernel density of catering services in GIS
POI densityKernel density of poi facilities in GIS
Functional mix index H p o i = i = 1 n p i l o g p i
NDVI N D V I ¯ = N D V I i / n
Economic Indicators
Housing priceEmpirical Bayesian chriskin interpolation in GIS
Night Lights index N L I ¯ = N L I i / n
Population densityKernel density of population in GIS
Microscale BE
Greenness G r e e n n e s s ¯ = 1 n i = 1 n ( T n + G n + P n )
Enclosure E n c l o s u r e ¯ = 1 n i = 1 n W n + B n + T n + C n R n
Walkability W a l k a b i l i t y ¯ = 1 n i = 1 n P n + F n R n
Imageability I m a g e a b i l i t y ¯ = 1 n i = 1 n ( B n + S n + P n )
Openness o p e n e s s ¯ = 1 n i = 1 n S n
Table 2. Descriptive statistics and VIF values for urban variables in the study.
Beijing Nanjing
VariablesMeanStd. DevVIFVariablesMeanStd. DevVIF
Street density0.3620.1712.02Street density0.2990.1812.13
Walk accessibility 0.1900.1461.77Walk accessibility 0.1250.1553.62
Scenic density0.1160.0432.84Scenic density0.0080.1532.19
Financial service density0.1330.1342.87----
Educational service density0.0920.1161.57Educational service density0.1930.2052.58
Catering service density0.2360.1504.53----
POI density0.1970.1244.97----
Functional mix index0.9020.0701.05Functional mix index0.8840.1341.14
NDVI0.3020.1323.34NDVI0.2880.1503.96
Housing price0.3330.1833.40Housing price0.2940.1381.57
Night Lights index0.2960.1032.35Night Lights index0.5310.1832.22
Population density0.2730.1032.80----
Greenness0.1870.1212.50Greenness0.3370.1371.67
Enclosure0.0080.3611.01Enclosure0.2290.1243.21
Walkability0.0050.0531.03Walkability0.0160.0491.09
Openness0.4700.1722.56Openness0.4770.2164.26
Table 3. Values of regression models accuracy in the study.
Model
CityOLSSEMRFGBDTXGBoost
Beijing-R20.500.610.710.710.73
Nanjing-R20.580.670.750.780.81
Disclaimer/Publisher’s Note: The statements, opinions and data contained in all publications are solely those of the individual author(s) and contributor(s) and not of MDPI and/or the editor(s). MDPI and/or the editor(s) disclaim responsibility for any injury to people or property resulting from any ideas, methods, instructions or products referred to in the content.