1. Introduction
Transmission lines form the backbone network of the power system, undertaking the task of large-scale and long-distance transmission of electrical energy. They are the energy lifeline that modern society relies on for development, providing fundamental guarantees for the stable operation of key areas such as healthcare, information and communication. The construction of a cross regional power resource allocation system for ultra-high voltage transmission networks is accelerating [
1,
2]. Transmission lines are widely distributed with large spatial spans, and their installation paths are difficult to avoid crossing over many areas with relatively harsh climates. If they encounter heavy rain, snow, and freezing weather, transmission lines are prone to icing. Ice cover can cause wire sag and internal tension increase. Its cross-sectional shape will change and it is prone to gallop under wind excitation [
3,
4,
5,
6]. The wire will jump during de-icing. These phenomena may lead to short circuits between wires, damage to towers, and even collapse accidents [
7,
8,
9]. Machine learning can also be used to guide mechanism research [
10,
11]. Therefore, it is necessary to conduct icing research on transmission lines and explore how to reduce freezing damage under extreme rain and snow weather conditions.
Recently, many scholars have conducted extensive analyses on the response, failure, and collapse of transmission towers under icing disasters [
12,
13]. Ju et al. [
14] established a finite element model of transmission lines and conducted response analysis of transmission towers under ice loads, obtaining the mechanical behavior of transmission towers. Yang et al. [
15] established a three-dimensional finite element model of the wire-ground-insulator system in ANSYS and analyzed the response of transmission lines to de-icing during icing disasters. Yang et al. [
16] established a finite element model of ultra-high voltage transmission lines in areas with severe icing, considering multiple influencing factors and analyzing the dynamic response under de-icing conditions. Xie et al. [
17] established a practical model with a scale ratio of 1:20 based on an actual transmission tower, and conducted transient displacement analysis of the transmission line under different ice shedding conditions after icing and de-icing conditions. The response changes of the transmission line under the influence of various parameters were obtained. Guo et al. [
18] analyzed the failure mechanism of transmission towers under icing conditions and studied the failure modes of transmission towers through numerical simulations. Li et al. [
19] established an ANSYS finite element model of a 500 kV transmission tower and systematically studied the impact of ice shedding on tower collapse. Zhang et al. [
20] established a regression model for the thickness of ice cover on transmission lines based on microclimate conditions, which can be used for risk assessment of transmission line failure.
Under extreme rainy and snowy weather, icing on transmission lines may lead to serious consequences such as wire breakage and tower collapse, therefore corresponding protective measures are needed. A large number of scholars have conducted relevant research on anti-icing measures for transmission lines. For example, Solangi et al. [
21] discussed the impact of atmospheric icing on transmission lines around the world, summarized the current de-icing methods used, and revealed the advantages and disadvantages of the de-icing technology currently used in maintenance operations. Zhang et al. [
22] evaluated the impact of local line de-icing on the structural stability of transmission tower-line systems by integrating orthogonal experimental design with finite element mechanical analysis, thereby providing practical guidance for the formulation of transmission line de-icing strategies. Cheng et al. [
23] proposed a new de-icing method based on resonance theory, which can cause deformation and fragmentation of ice under the action of excitation load and ultimately detach the ice from the conductor without affecting the normal operation of the transmission line. Ji et al. [
24] summarized the characteristics and requirements of de-icing of low-voltage transmission lines, and proposed an overall design concept for a new type of electromagnetic impact mechanical de-icing equipment. Zhou et al. [
25] proposed a novel online anti-icing/de-icing method based on external excitation resonance. This method integrates detection, analysis, and de-icing functions, enabling effective anti-icing and de-icing during the initial ice accretion phase on transmission lines. Wang et al. [
26] designed a de-icing robot that can avoid various accessories on the line and can pass through the tension tower of the phase line for jumper, greatly improving its practicality. You et al. [
27] introduced an online transmission line de-icing device that integrates energy harvesting, monitoring, and de-icing technologies. The device has significant advantages in safety, efficiency, and environmental adaptability, and is expected to be widely used in the future. Feng et al. [
28] studied the topology structure of ice melting devices for 110 kV wind power transmission lines, designed anti freezing and thawing schemes for both conductors and ground wires, and successfully applied them in engineering. Zhou et al. [
29] summarized the principles, applications, and related research of existing anti icing and de-icing technologies for overhead transmission lines, and obtained relevant conclusions: the existing anti-icing and de-icing technologies for overhead transmission lines are not perfect. Although they have achieved the goal of de-icing, each technology cannot simultaneously meet the requirements of operability, economy, and durability. In summary, there are various ways to prevent icing, but in extreme rainy and snowy weather, existing icing prevention technologies may have insufficient efficiency in de-icing, resulting in ice thickness exceeding the safety threshold. At the same time, the installation and application of icing prevention devices are complex and not widely applicable. Therefore, more efficient preventive measures need to be proposed.
In response to this challenge, this paper proposes a protective strategy that involves the installation of additional insulator strings designed to fracture under predetermined icing conditions. First, a finite element model of the transmission line system is established, and the methodology for calculating the ice load on the conductors is presented. Subsequently, nonlinear dynamic analyses are conducted to investigate the system’s response to insulator string fracture under ice loading. Furthermore, the effectiveness of this approach in enhancing the safety performance of transmission lines in severe weather conditions is thoroughly evaluated.
3. Analysis of Structural Responses
In order to study the effect of additional insulator strings on the structural response of ice-covered transmission lines, this paper selected three cases: (1) intact insulator string; (2) insulator string fracture after the application of ice load; and (3) insulator string fracture before the application of ice load. For each case, eight different conductor ice thicknesses were considered, ranging from 5 mm to 40 mm in 5 mm increments. The ice thickness on the transmission tower and ground wire was set at 10 mm.
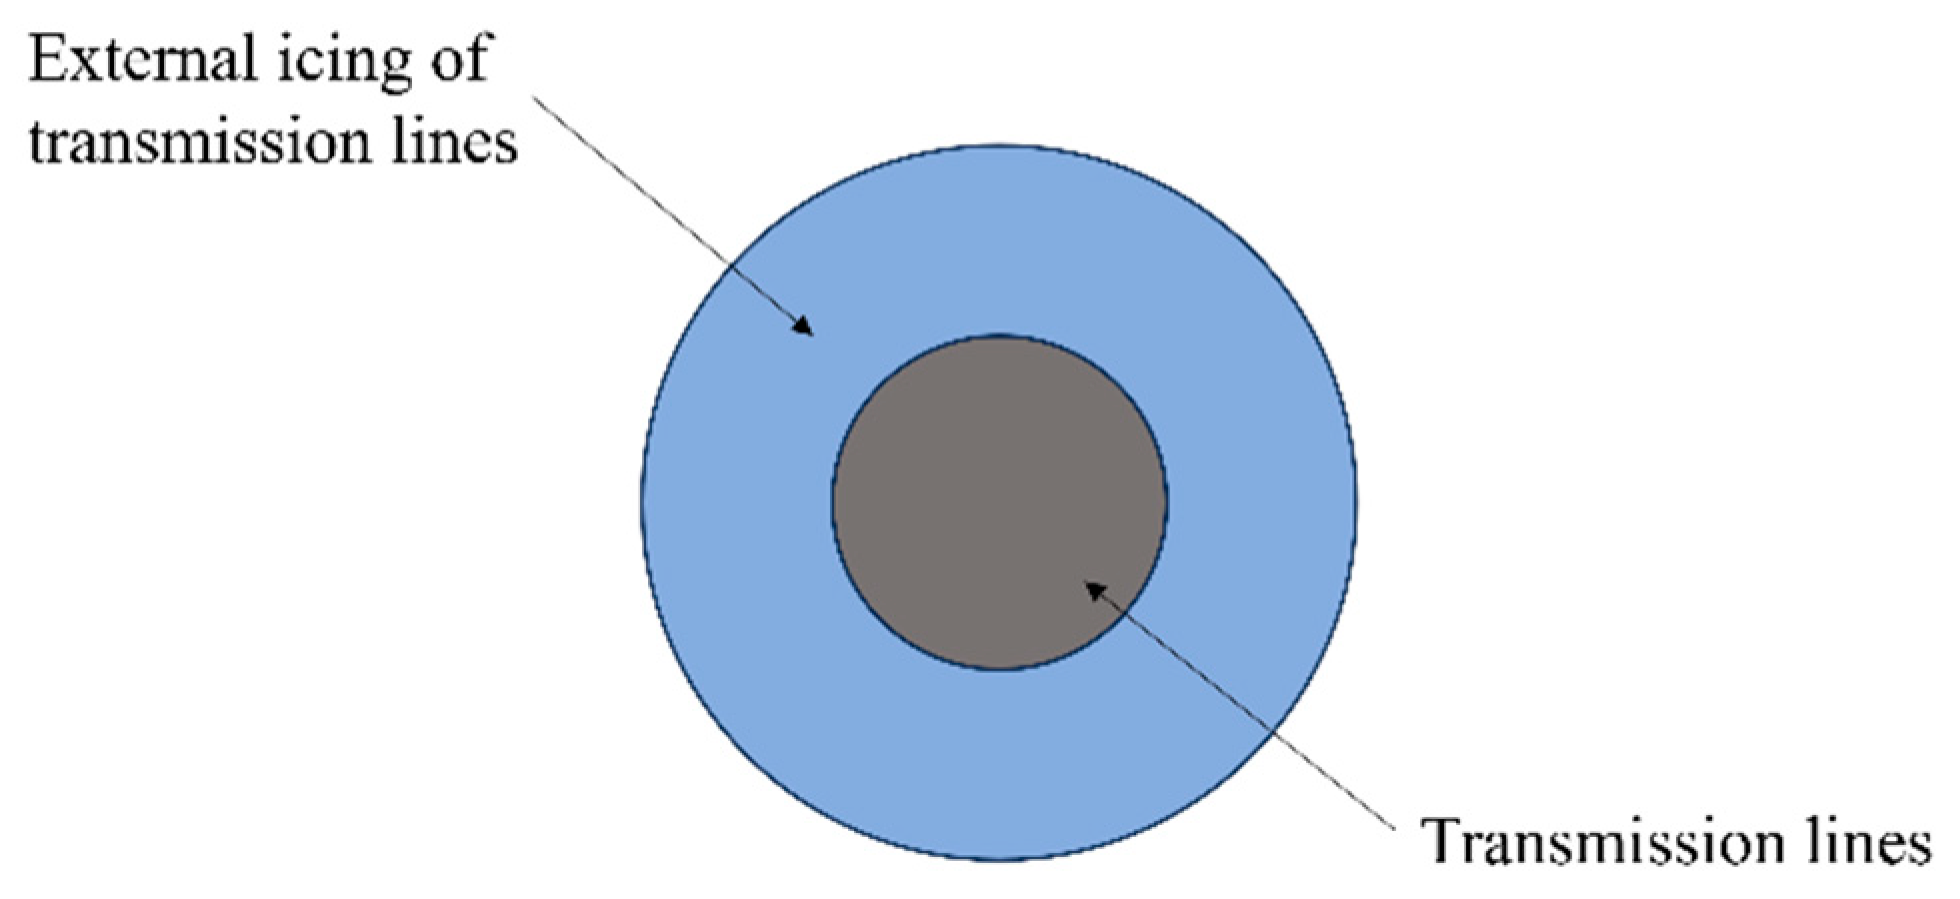
The ice load on the tower was simulated by modifying the material density in the ABAQUS material property definition, while the ice load on the conductors was applied as an equivalent gravity load in the ABAQUS load module. The ABAQUS/Explicit solver was used for the dynamic analysis. Taking the load corresponding to a 10 mm ice thickness on the conductor (hereinafter referred to as the ice load) as an example, the analysis procedure was as follows: (1) At the start of the analysis, the self-weight and ice load were applied to both the tower and the conductor, with the insulator string remaining intact. The analysis was run for 30 s, with the transmission line’s response data recorded every 0.1 s. (2) At the start of the analysis, the self-weight and ice load were applied to the tower and conductor, while the insulator string was modeled as fractured. The analysis duration was 30 s, with response data extracted every 0.1 s. (3) The analysis began by applying the self-weight and ice load to the tower and ground wire, along with the self-weight of the conductor. The insulator string was fractured simultaneously. This initial phase was calculated for 30 s. Subsequently, the ice load was applied to the conductor, and the analysis continued for another 30 s, resulting in a total analysis time of 60 s. Response data were extracted every 0.1 s throughout. The simulation results indicate that as the ice load increased, cross-arm failure occurred in Case 2 at a 30 mm ice load and in Case 1 at a 40 mm ice load.
3.1. Displacement Response
Extracting the displacement response of the wire, the results show that the displacement response curves of the wire under different ice loads are similar under the same case (except for the ice load case corresponding to the cross-arm failure).
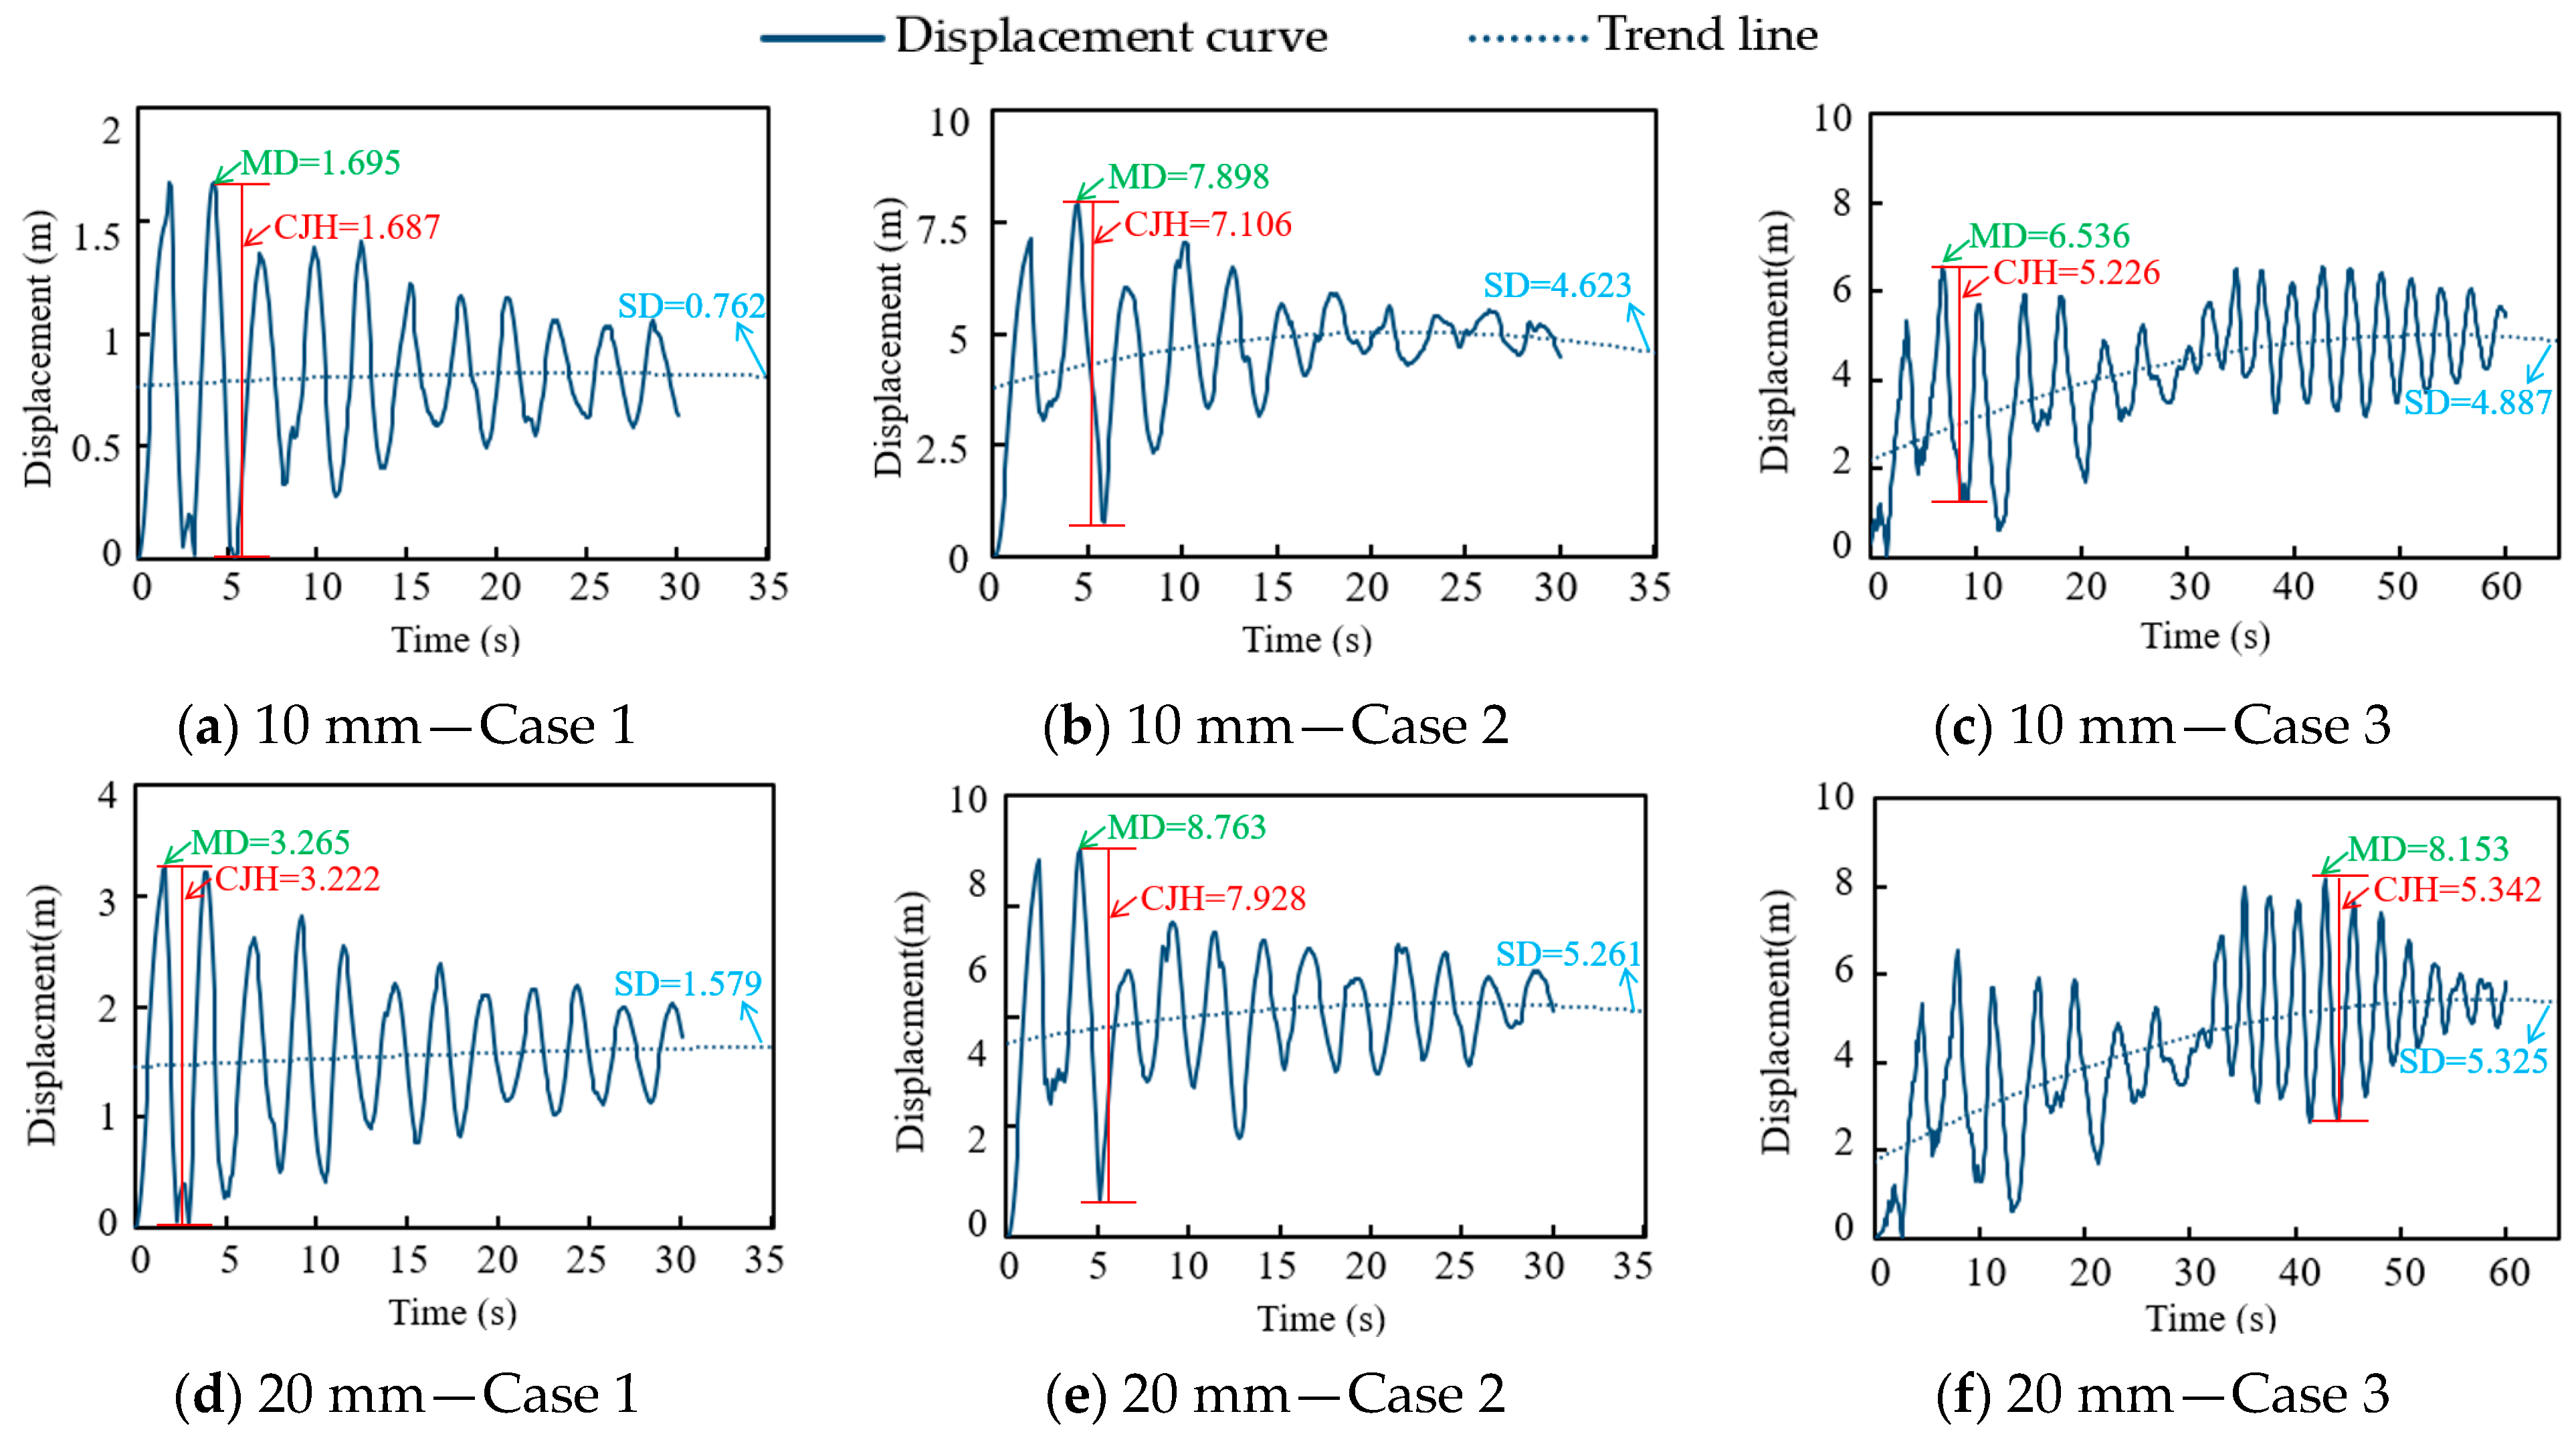
Figure 4 shows the displacement-time response curves of the conductor under three cases, taking the 10 mm and the 20 mm ice load as examples. It can be seen that after the load is applied, the displacement time curve of the wire exhibits a damping vibration, with the initial vibration amplitude being the largest, gradually decreasing over time, and stabilizing at a constant value. The pattern of Case 1 is most obvious, and its displacement curve is similar to a sine curve with decreasing amplitude. Case 2 has a larger fluctuation amplitude of wire displacement, which is most obvious when the insulator string is just broken. With the passage of time, the wire gradually tends to stabilize. The characteristic of the conductor displacement curve in Case 3 is the combination of Case 1 and Case 2. In order to further analyze the characteristics of the displacement curve of the conductor, the maximum displacement (MD) of the conductor, the conductor jump height of the conductor (CJH), and the stable displacement (SD) are extracted for analysis.
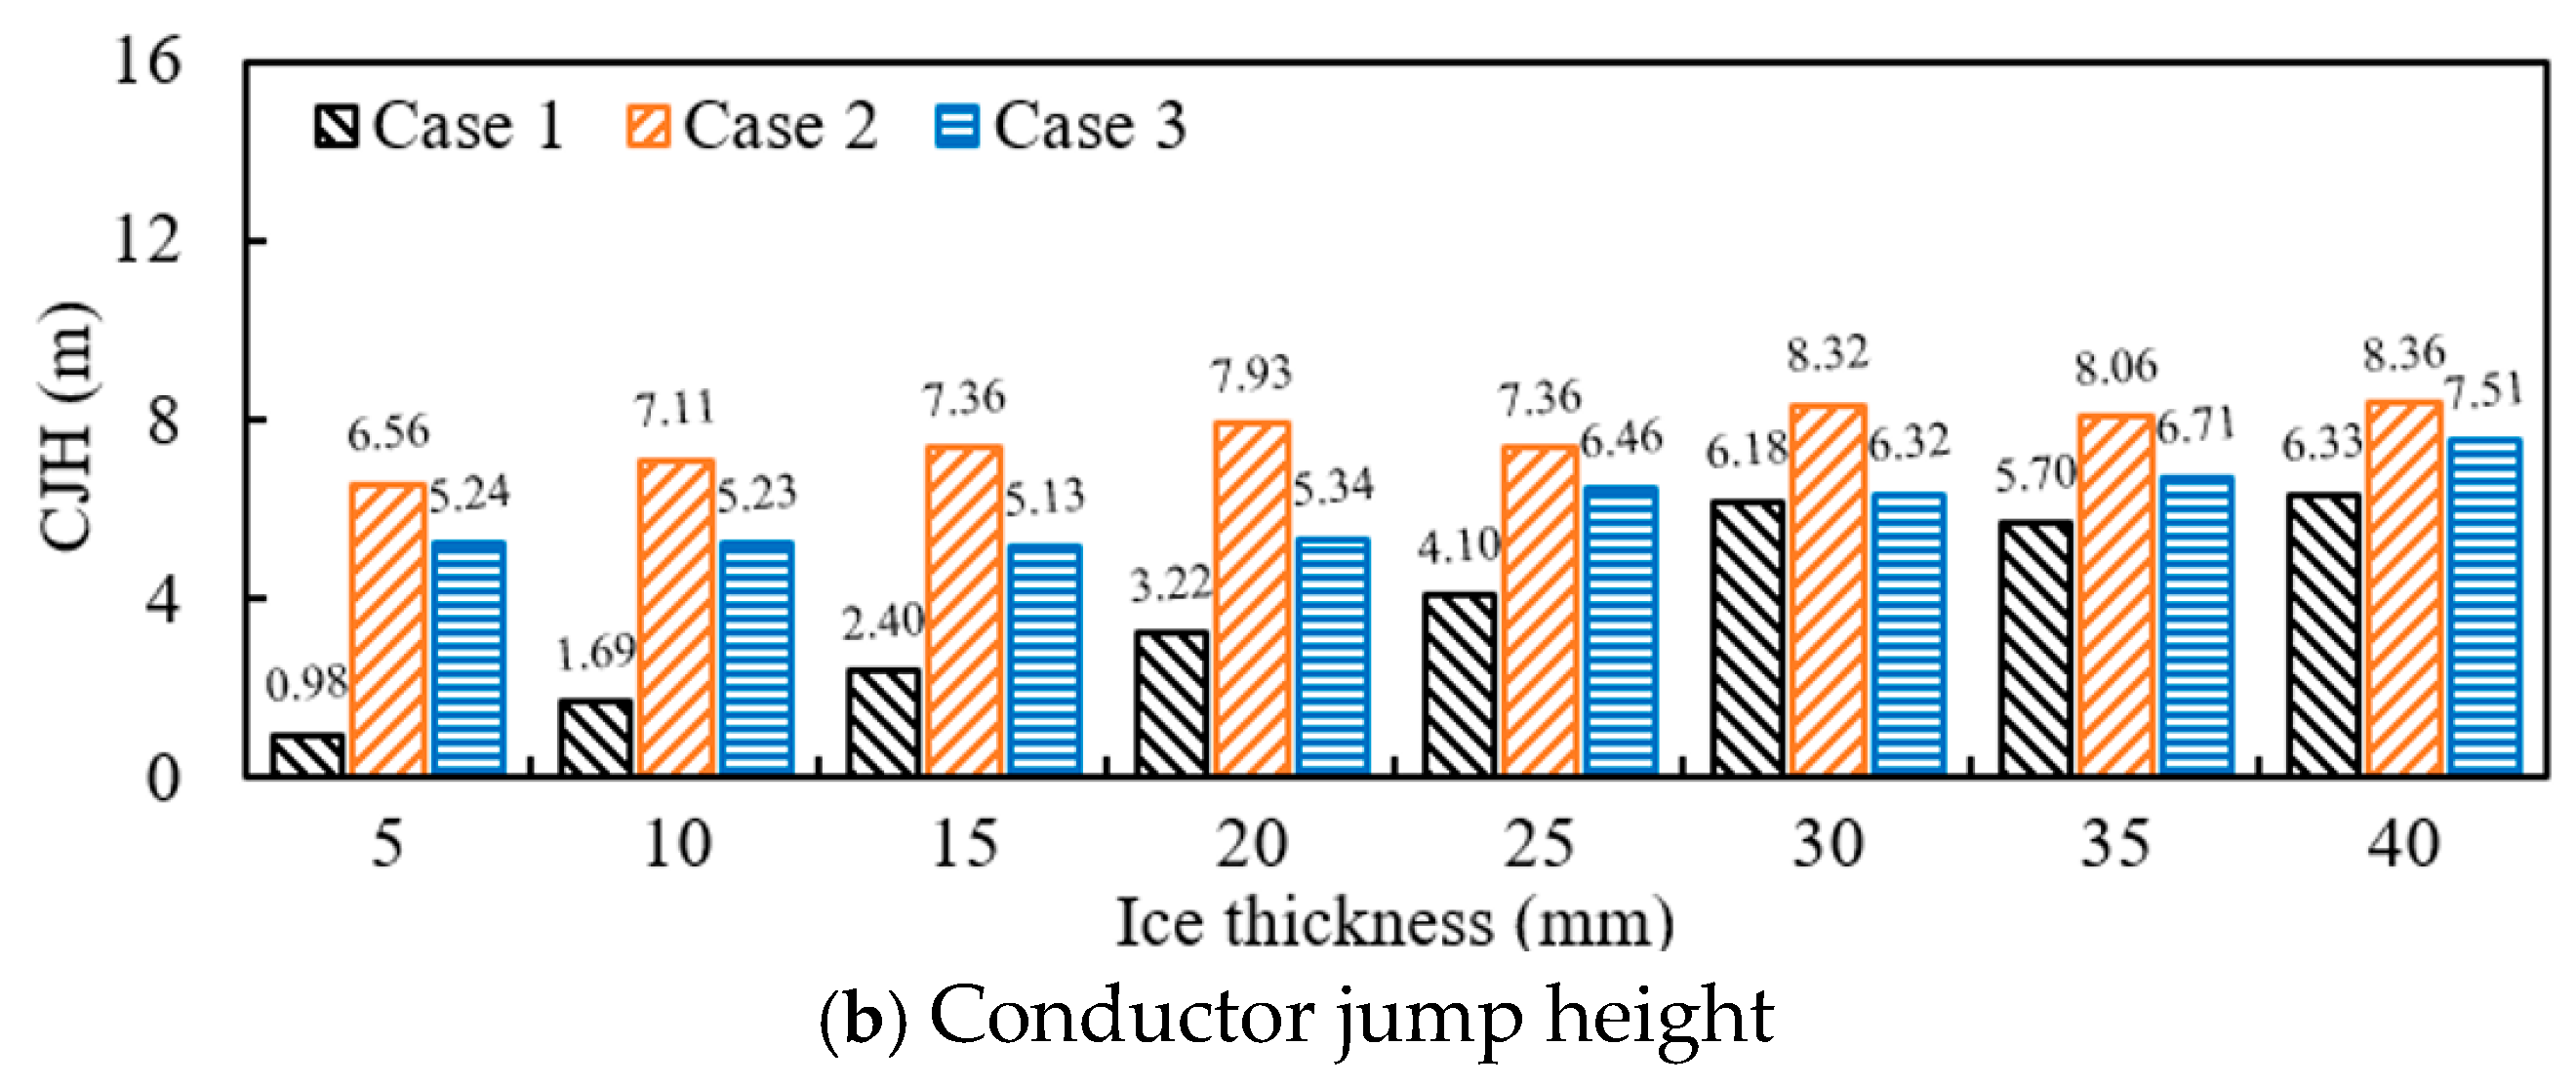
Figure 5 shows the maximum displacement of the conductor and the difference between the maximum adjacent displacement of the conductor under different ice loads for three different cases. It can be seen that with the increase in ice load, the maximum displacement of the conductor and the difference between the maximum displacement of the conductor in the three cases all show an upward trend. Under the same ice load, the maximum displacement and conductor jump height of the conductor in Case 2 are greater than those in Case 3 and Case 1. The difference between Case 2 and Case 3 and Case 1 gradually decreases with the increase in ice load. For example, under a 5 mm ice load, the maximum displacement of the conductor in the three cases is 1.07 m, 7.42 m, and 6.54 m, respectively. The difference between Case 2 and Case 3 and Case 1 is 6.35 m and 5.38 m, respectively. Under a 25 mm ice load, the maximum displacement of the conductor in the three cases is 4.2 m, 9.35 m, and 9.12 m, respectively. The difference between Case 2, Case 3, and Case 1 is 5.15 m and 4.92 m, respectively.
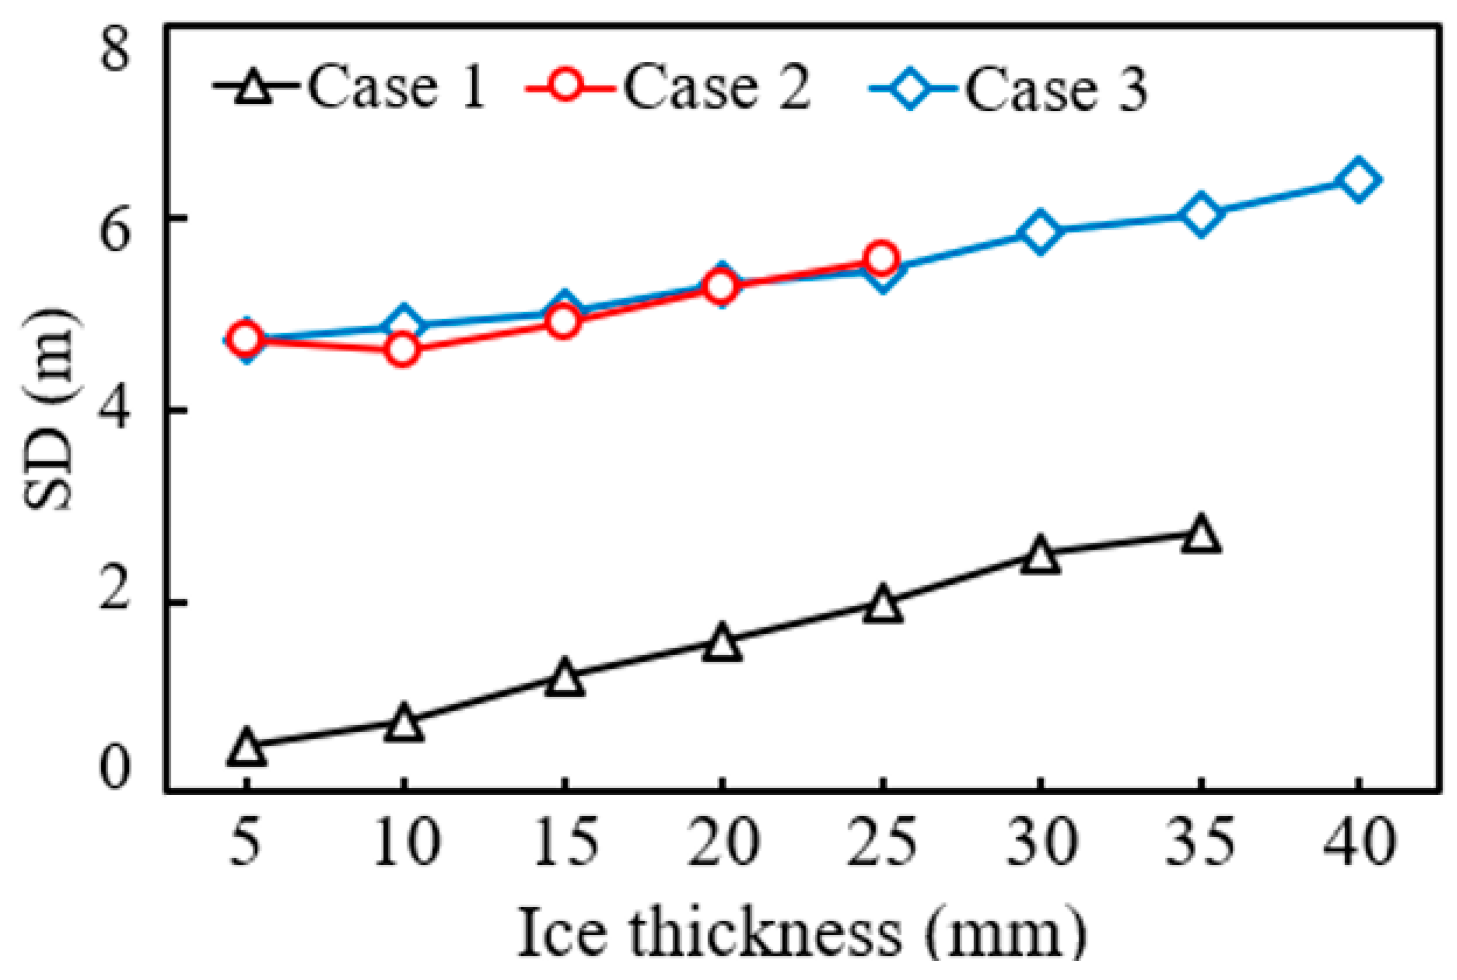
Figure 6 shows the stable displacement curves of the conductor under different ice loads, where the displacement of the conductor is unstable under cross-arm failure and will not be statistically analyzed here. It can be seen that with the increase in ice load, the stable displacement of the conductor gradually increases under the three cases. Among them, the stable displacement of the conductor in Cases 2 and 3 is greater than that in Case 1, and the difference in stable displacement between Cases 2 and 3 is not significant, indicating that the moment of insulator string breaking will not affect the final displacement of the conductor.
The displacement responses of the tower top and the cross-arm end under different ice loads are similar to those of the conductor, exhibiting an overall damped oscillation. The initial amplitude of vibration is larger in the case with a fractured insulator string, then decreases and gradually stabilizes.
Table 4 and
Table 5 present the steady-state values of the tower top and cross-arm end displacements, respectively, under different ice loads. It can be observed that these steady-state displacements gradually increase with the ice load. The responses in Cases 2 and 3 are essentially identical and greater than that in Case 1.
3.2. Stress Response
Based on the previous analysis, the overall displacement responses of the conductors in Cases 2 and 3 are greater than in Case 1. The substantial swing of the conductors generates significant dynamic loads. To investigate the impact of this large-amplitude conductor swing following insulator string fracture on the transmission tower stress, the stress distribution within the tower was extracted and analyzed.
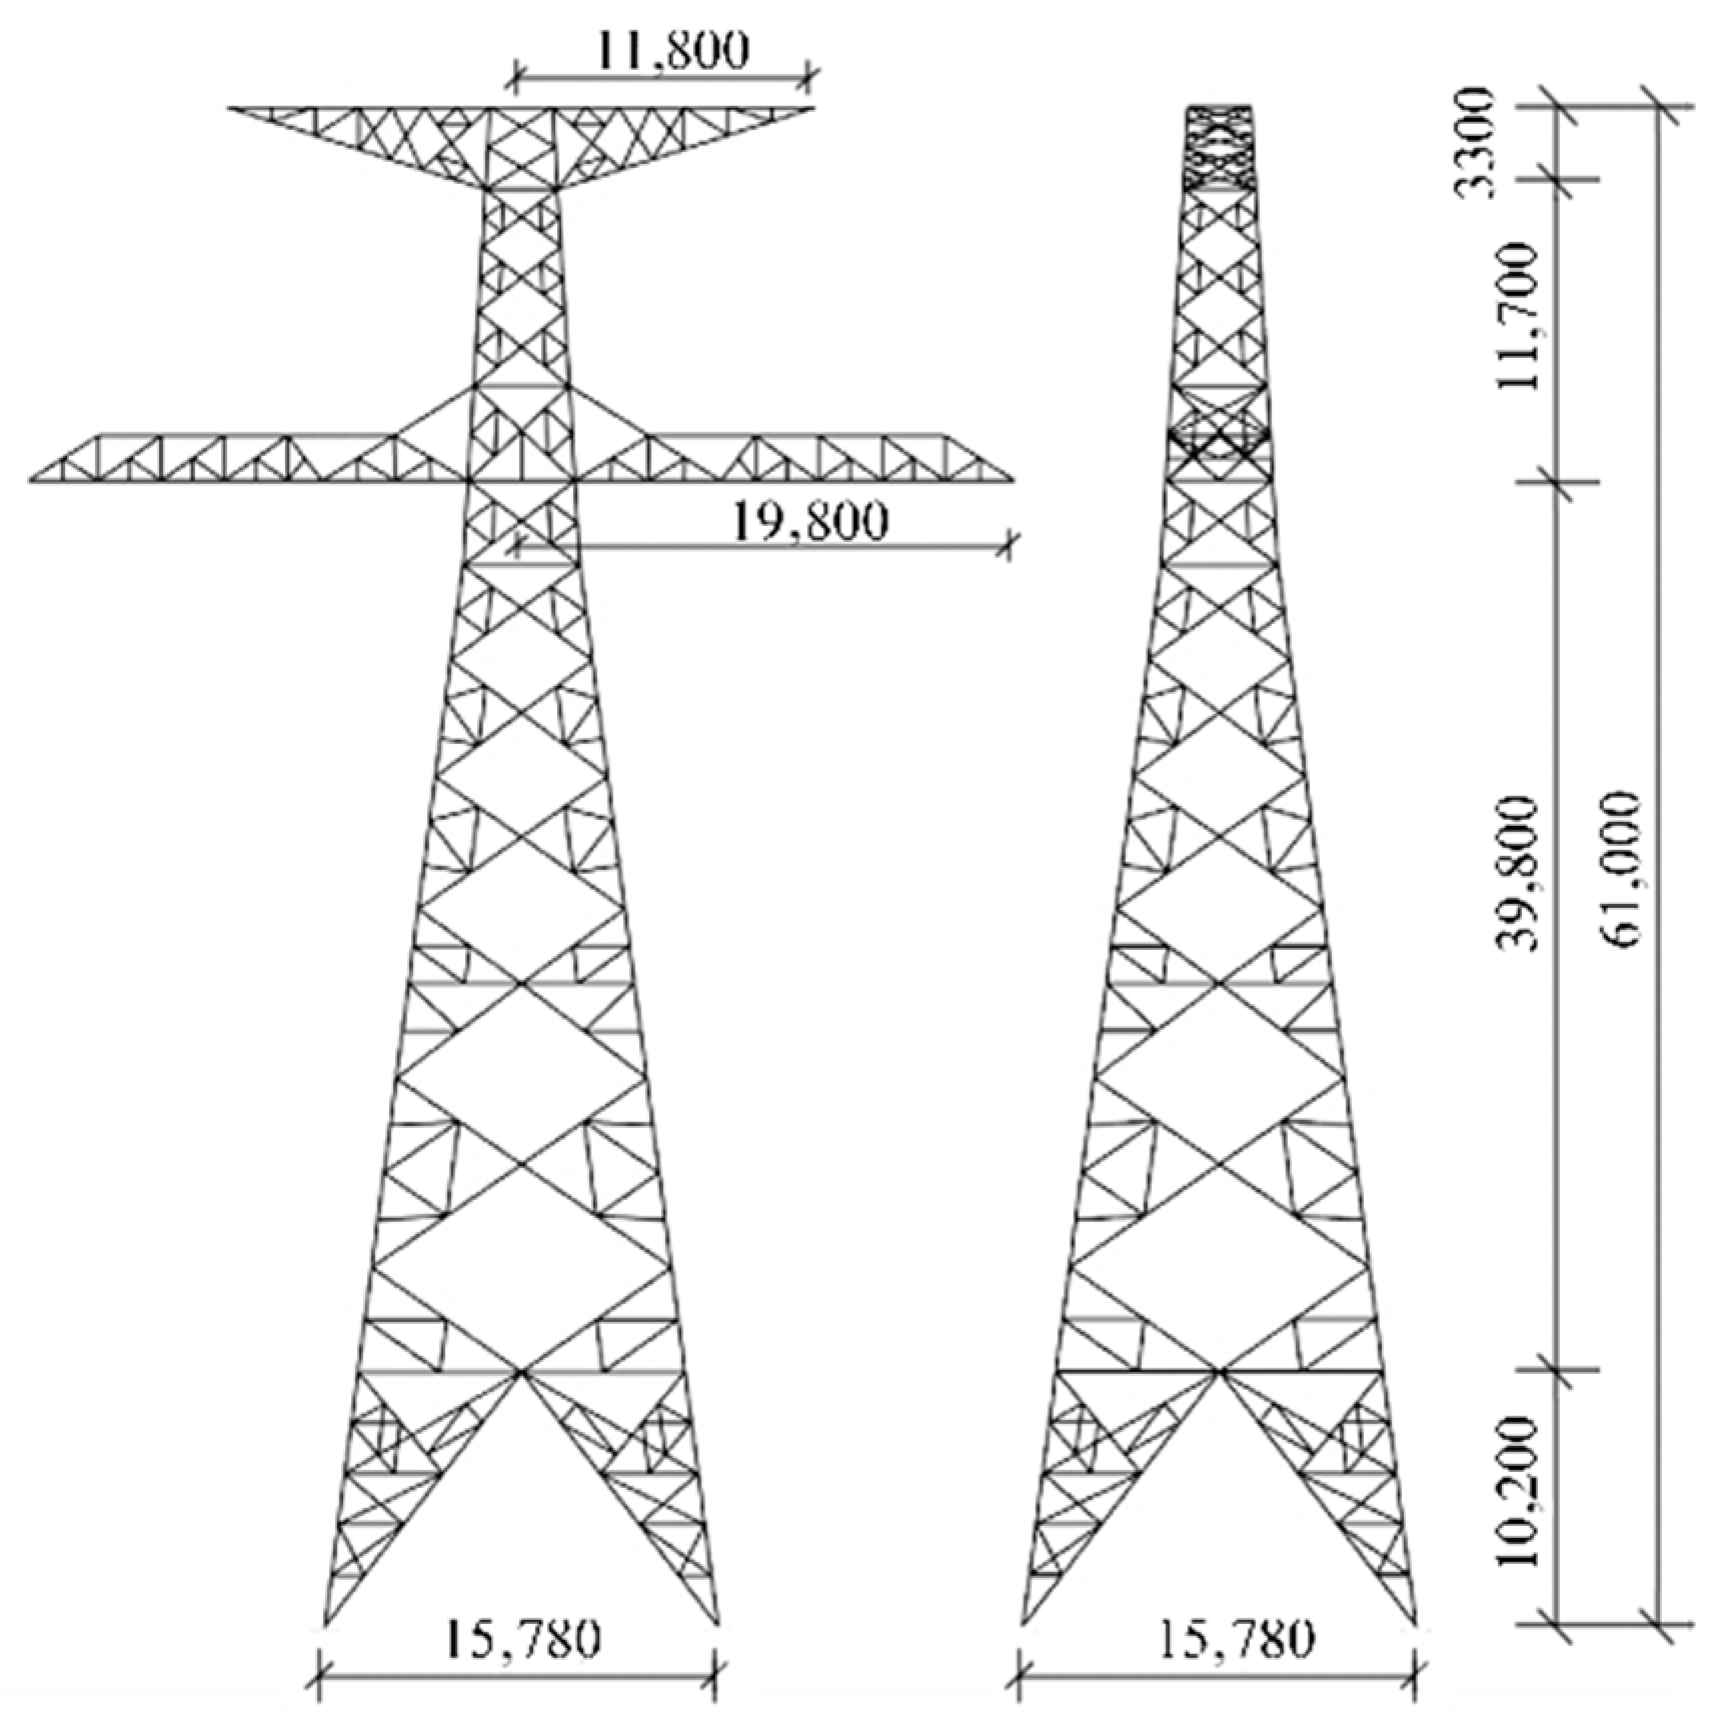
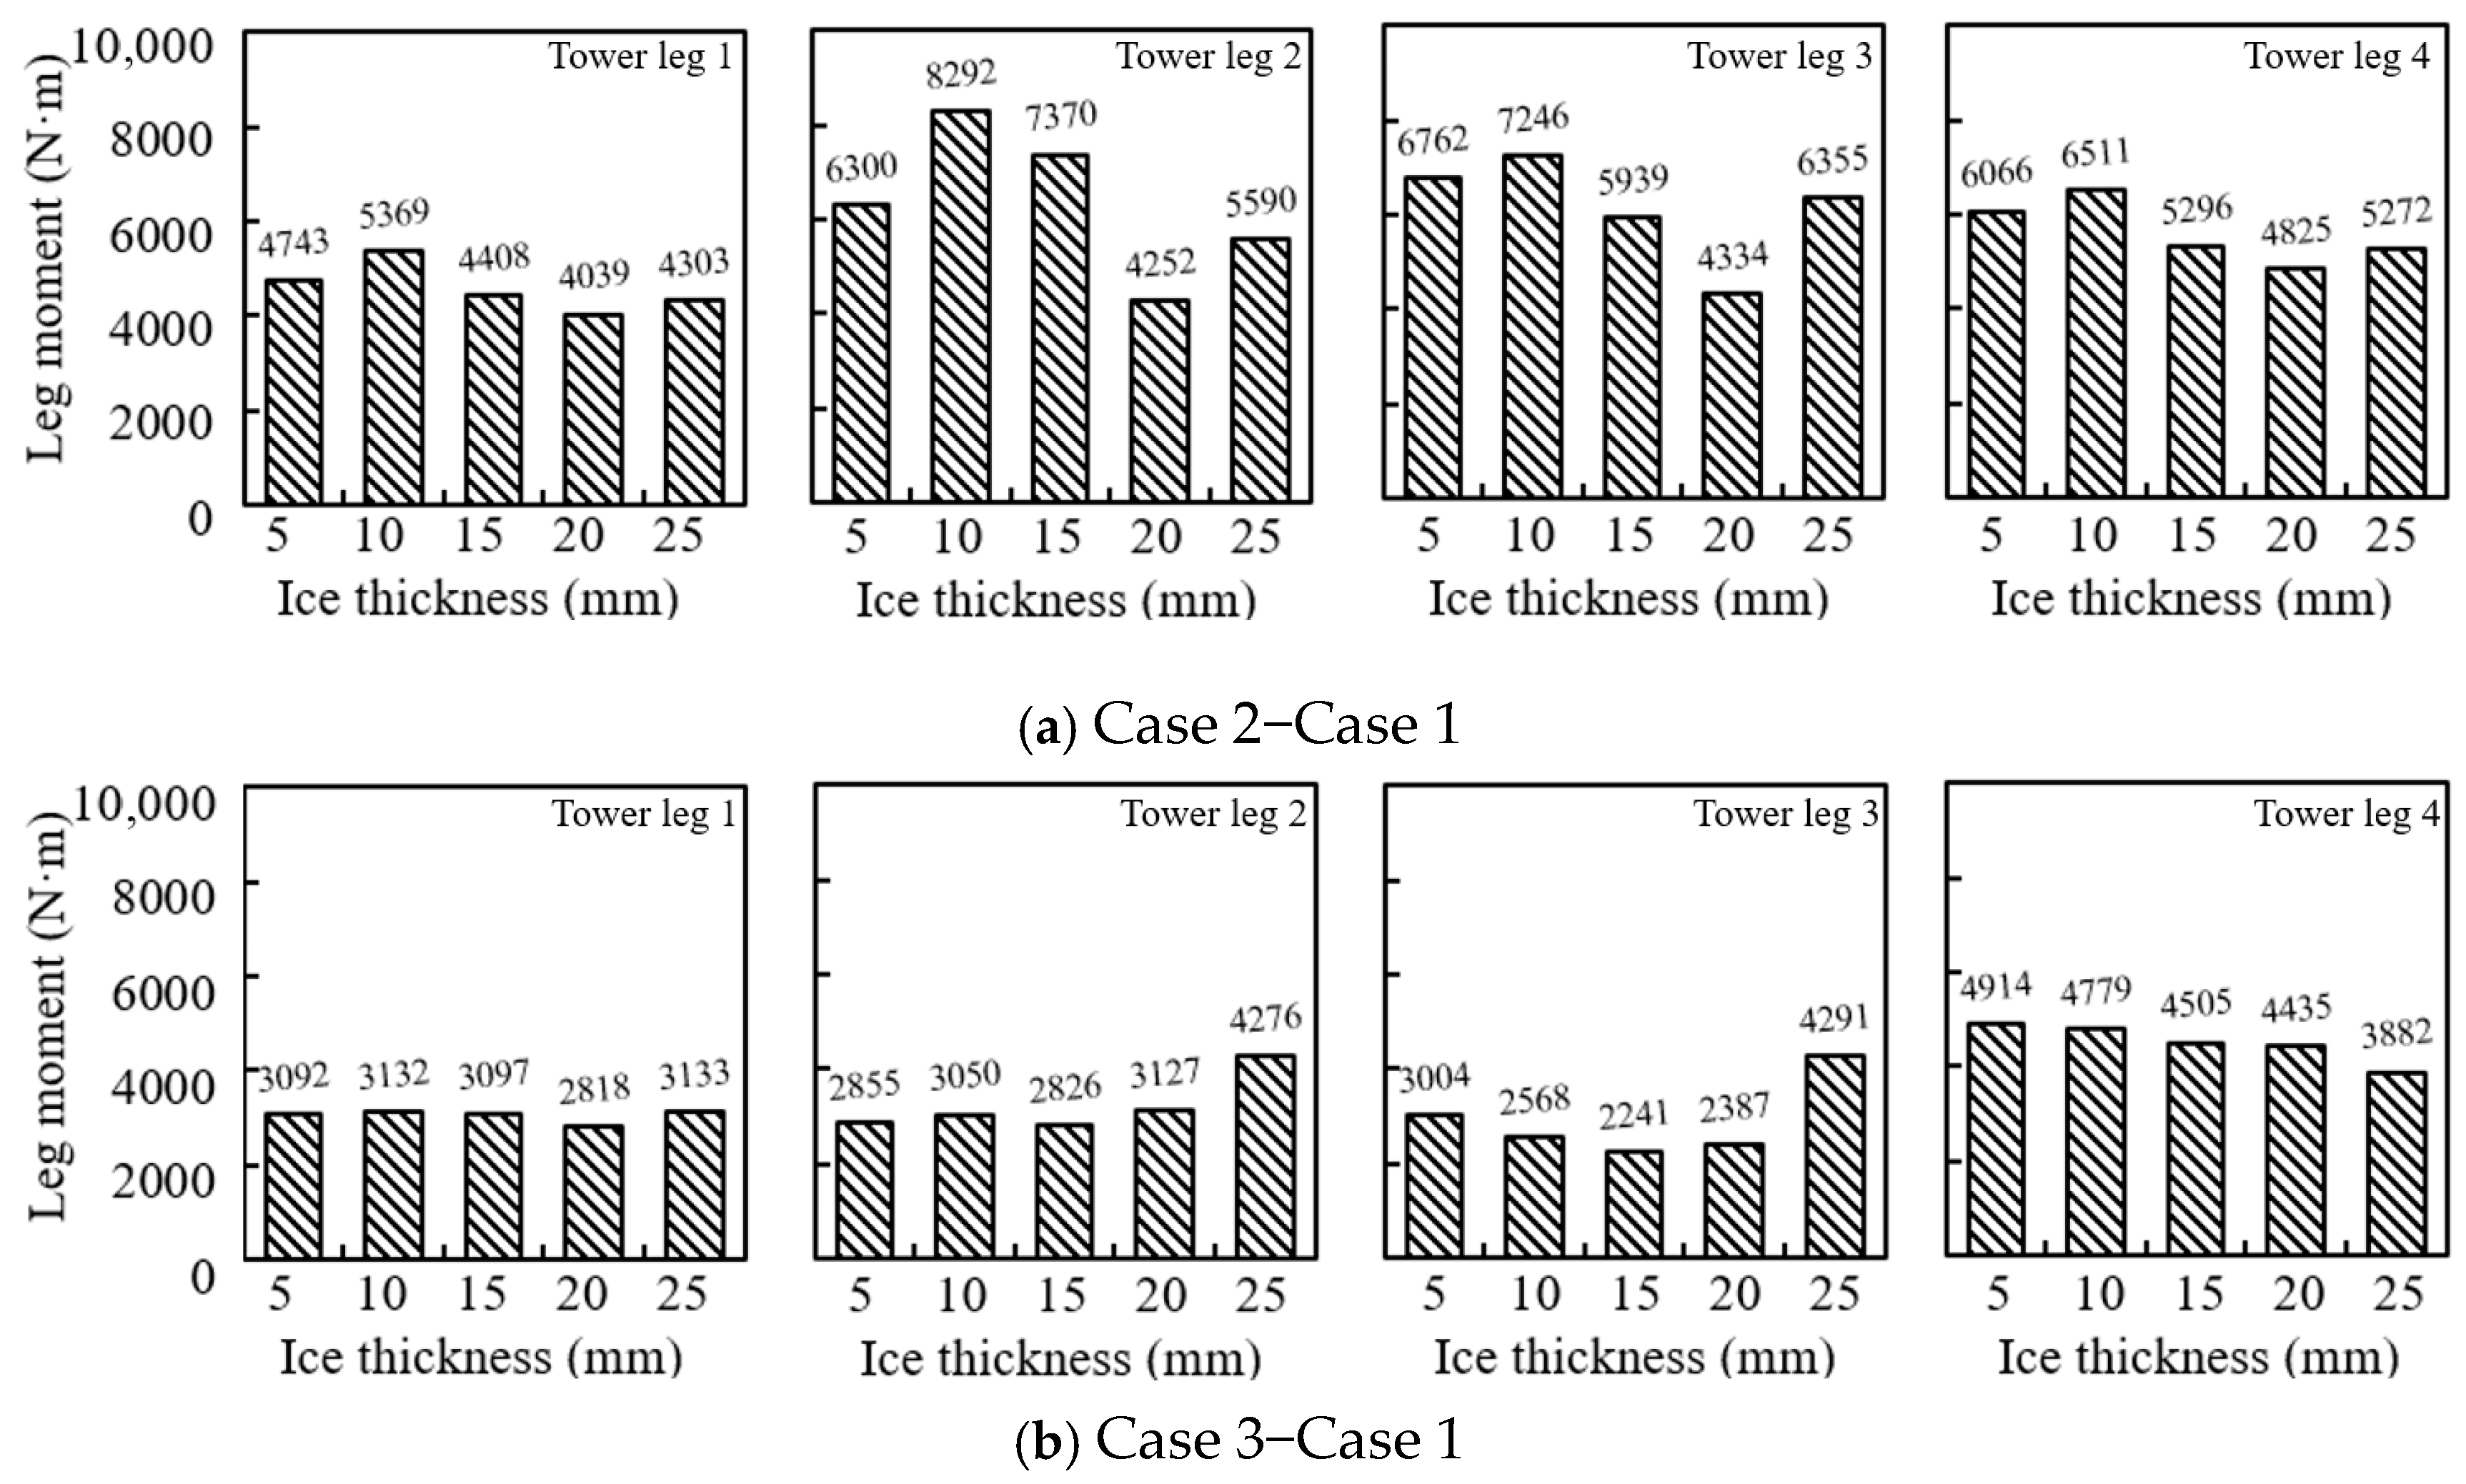
Table 6 presents the maximum leg moment at the bottom of the transmission tower under ice loads ranging from 5 mm to 25 mm. The locations of the tower bottom measurement members (Numbers 1–4) are identified in
Figure 2. The results indicate that the maximum base bending moment in Case 1 exhibits an overall increasing trend with the rise in ice load. In contrast, the value for Case 2 fluctuates within a certain range. For Case 3, when the ice load is relatively small, the resulting maximum base bending moment is less than that induced by the insulator string breakage, manifesting as a constant value. However, under larger ice loads, the maximum base bending moment also increases accordingly. For a given case, the maximum leg moment at members 2 and 3 are greater than those at members 1 and 4.
The difference in the maximum leg moment between Cases 2/3 and Case 1 was calculated. This difference was then divided by the value from Case 1 to determine the percentage increase. The summarized results are shown in
Figure 7. It can be observed that the difference between Case 2 and Case 1 is larger than that between Case 3 and Case 1. As the ice load increases, this difference tends to decrease. The overall percentage increase shows a declining trend, with significant variations among the different measurement members. For example, under a 10 mm ice load, the value at member 1 in Case 2 increased by 122% compared to Case 1, while at member 3, the increase was 67%. The percentage increases at members 1 and 4 are generally higher than those at members 2 and 3.
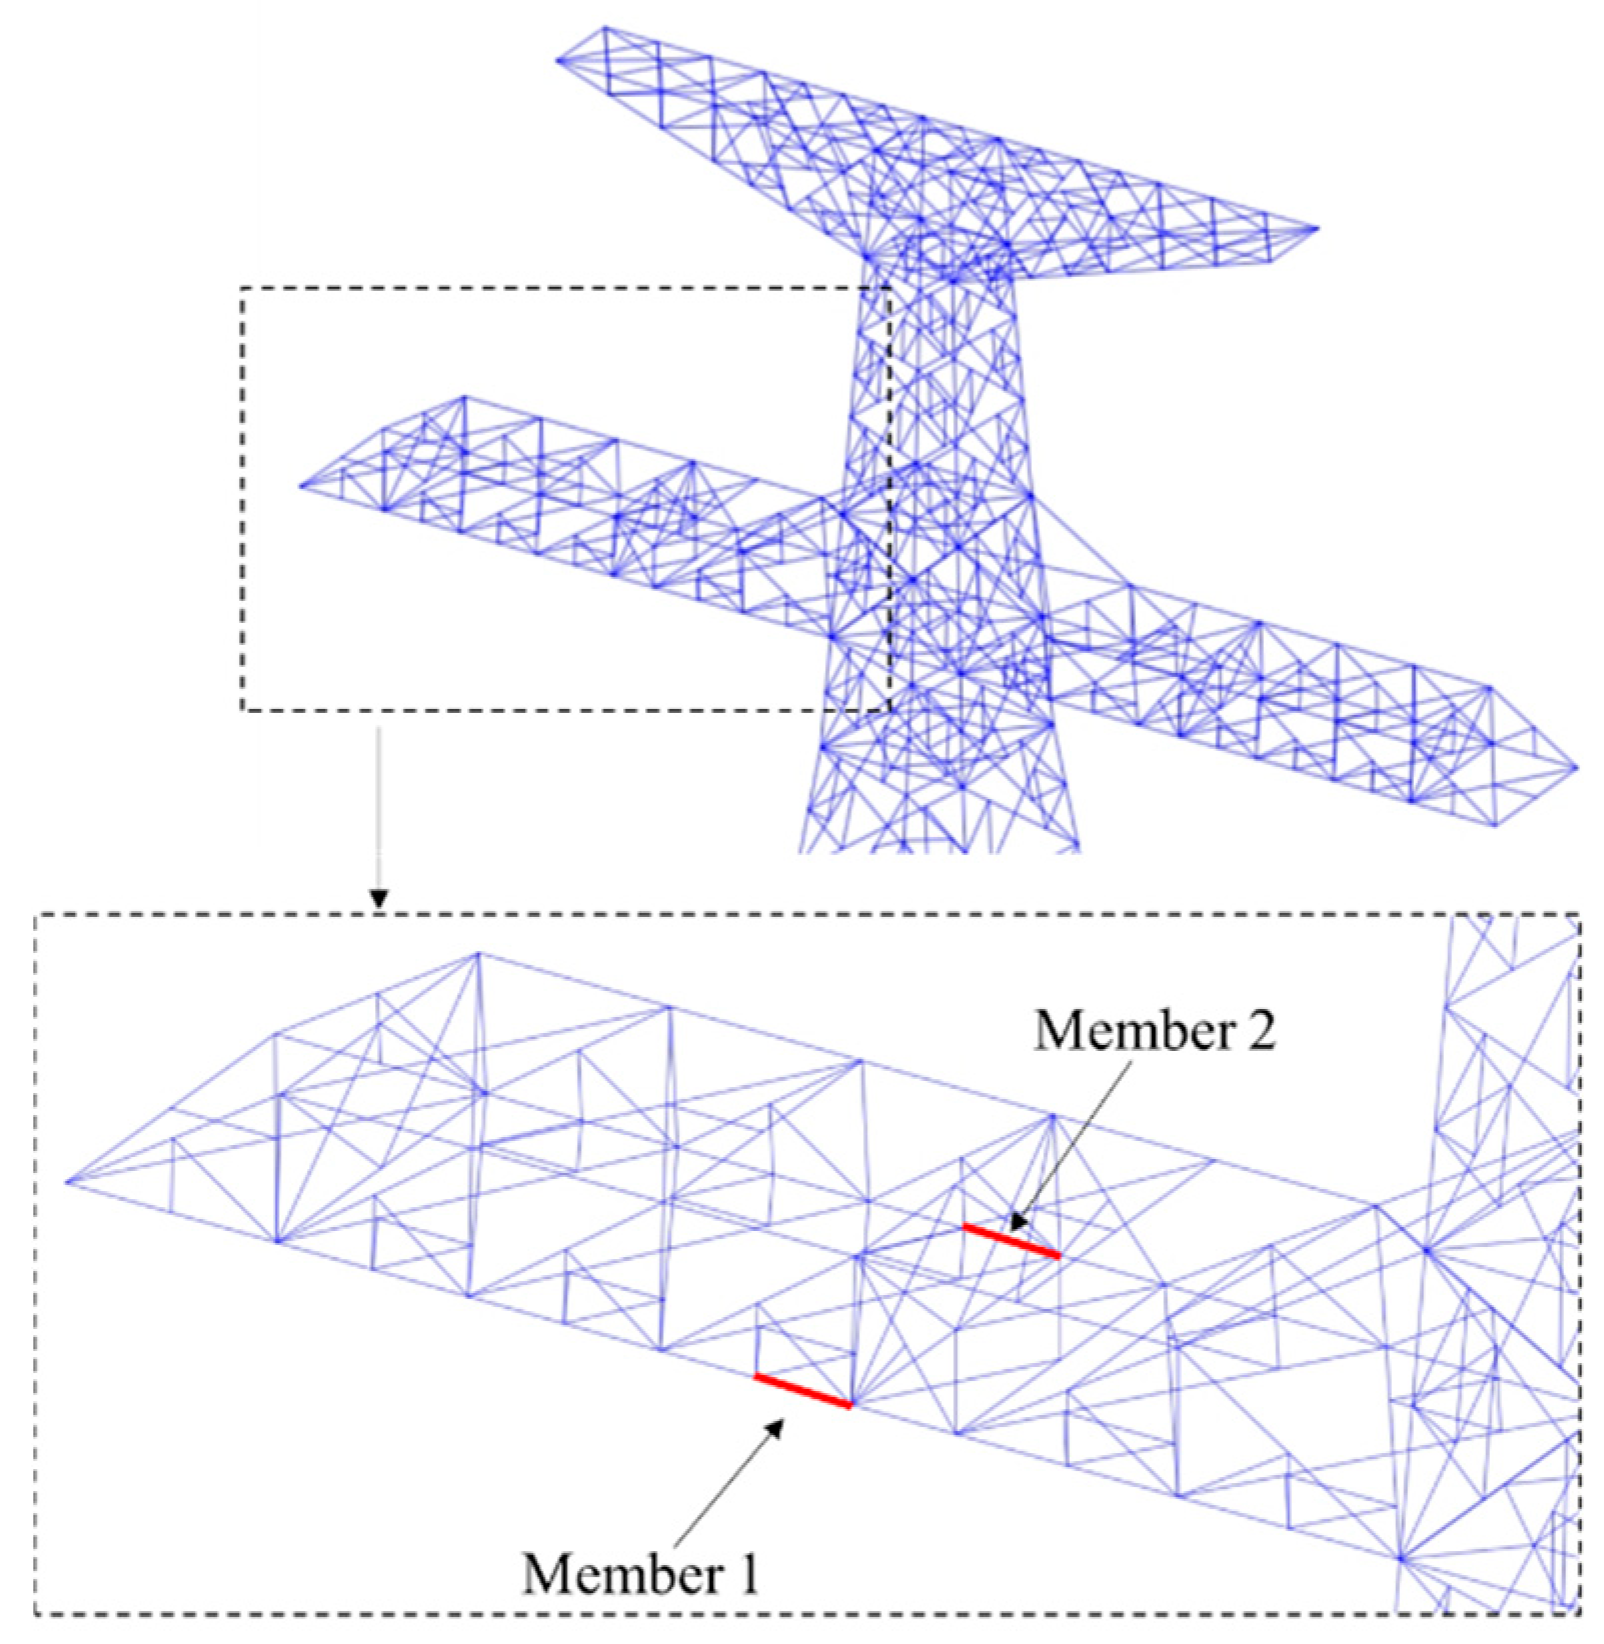
Two members located in the middle of one side of the transmission tower’s cross-arm were selected for stress analysis, with their positions illustrated in
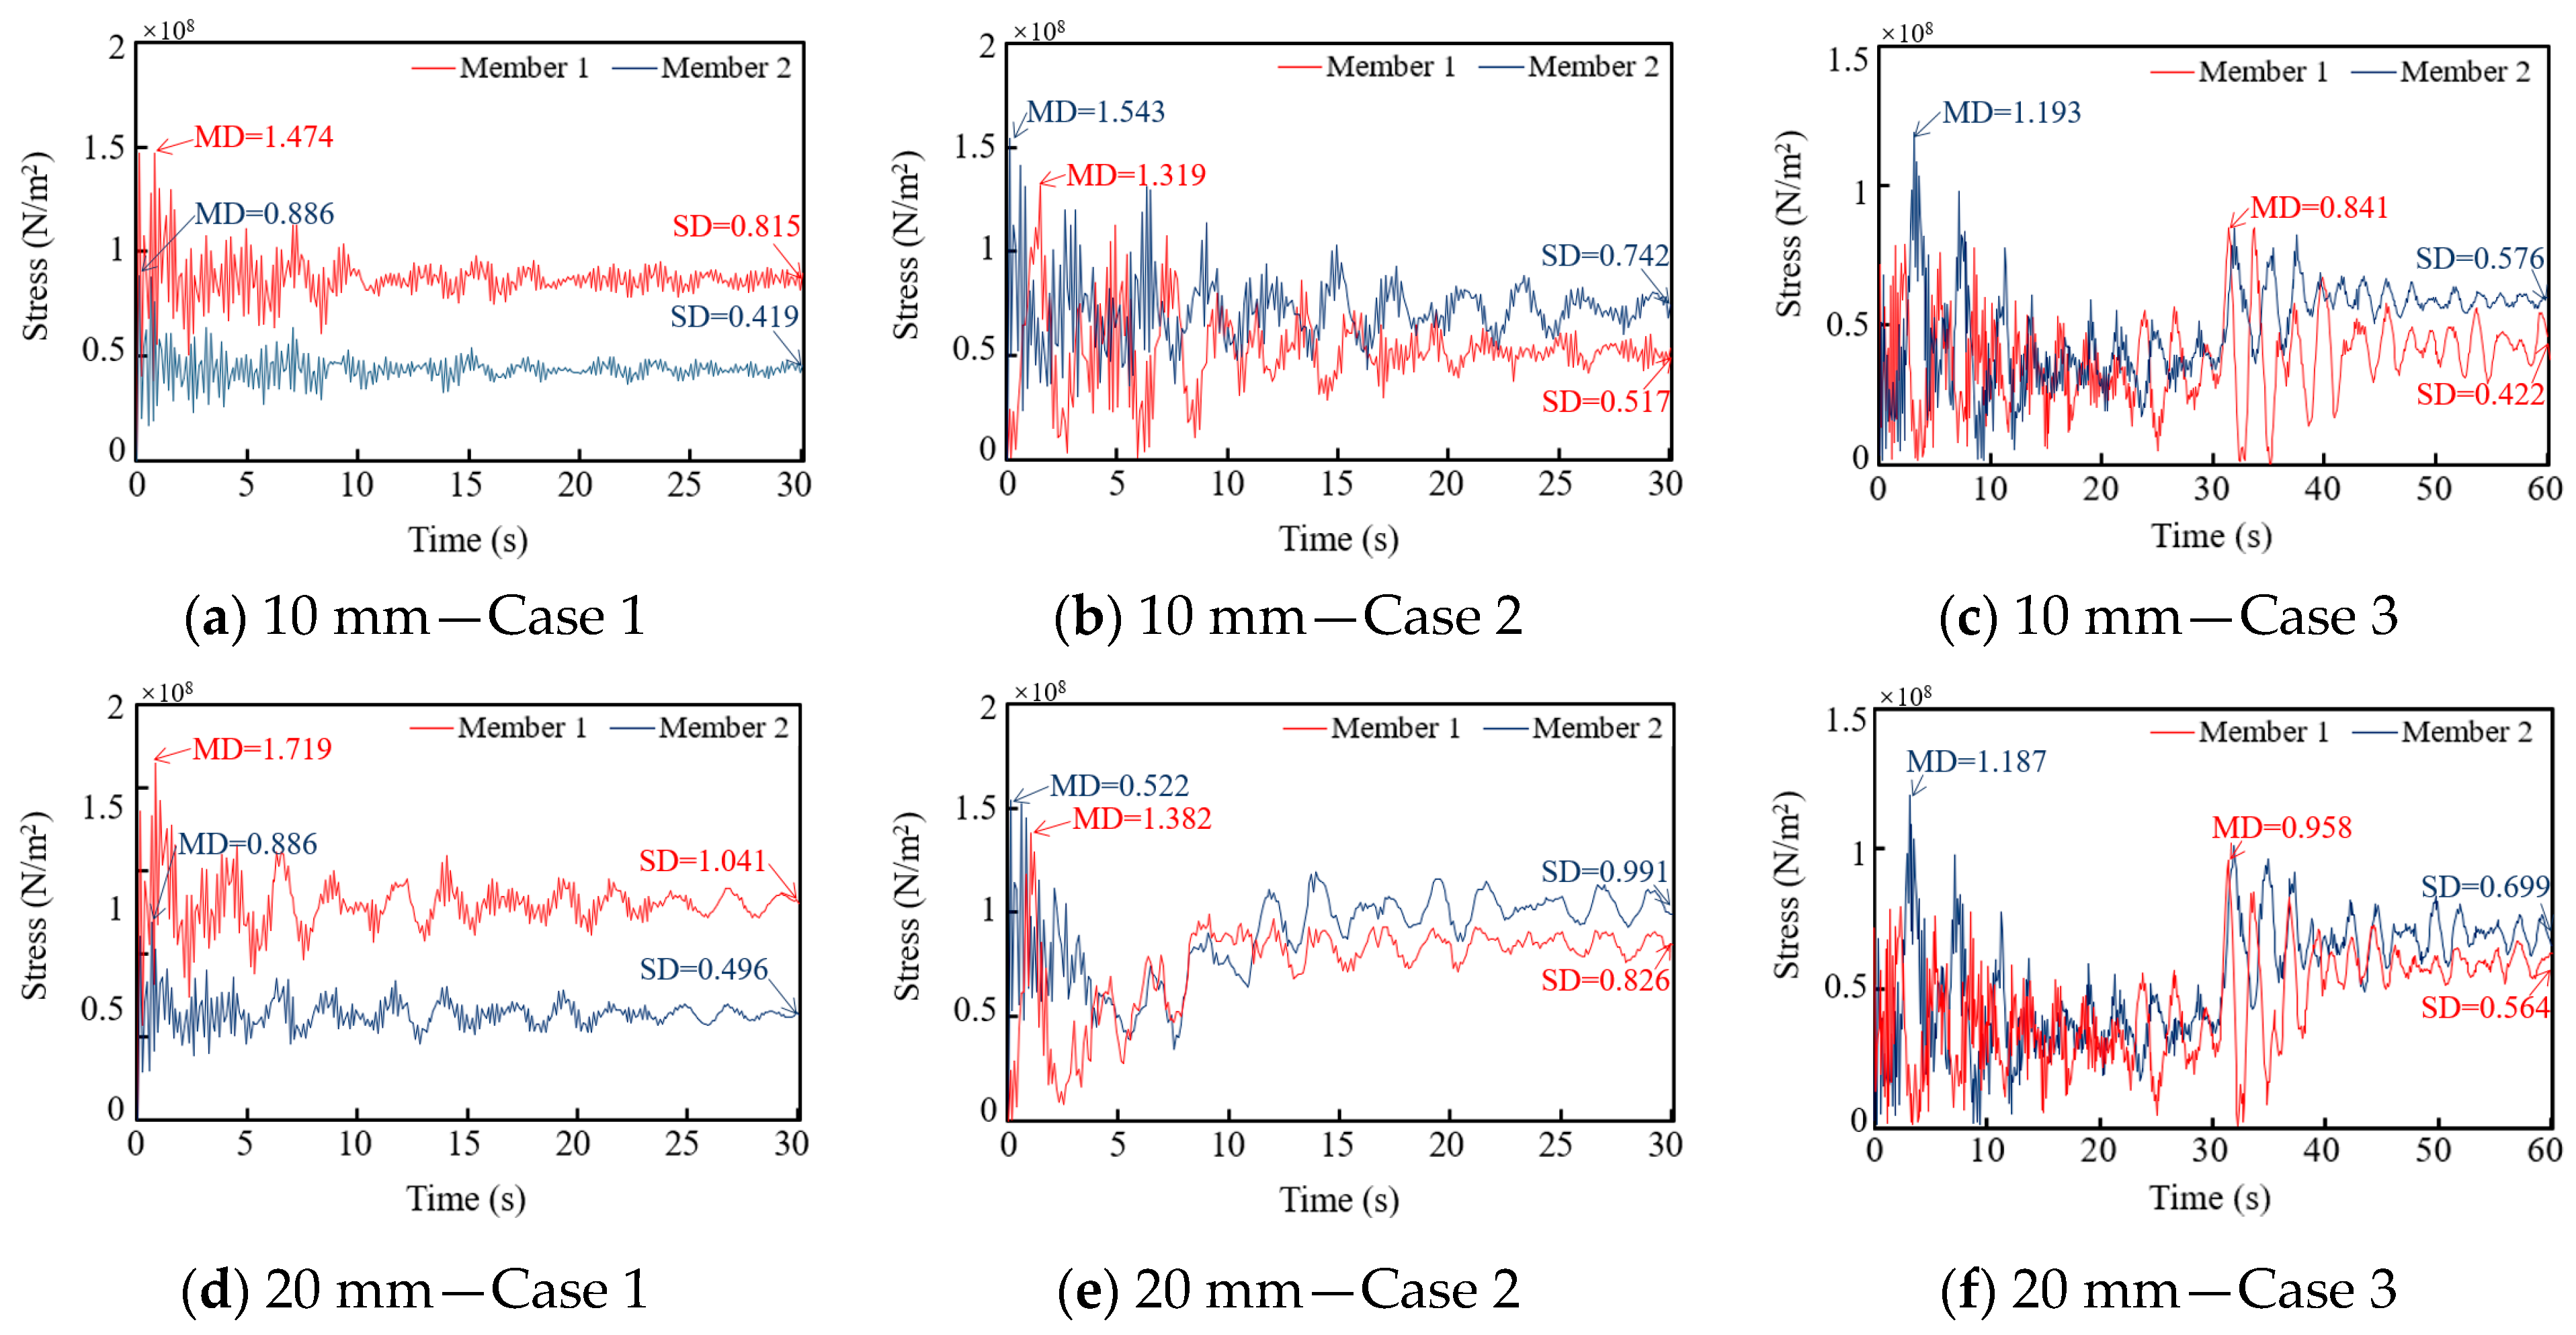
Figure 8. The stress response patterns of these two members under different ice loads were found to be similar, except in cases where cross-arm failure occurred. Using the 10 mm and the 20 mm ice load as examples,
Figure 9 shows the stress-time curves for both members. It can be observed that the stress curves for both members in Case 1 and Case 2 exhibit a damped vibration, characterized by a gradual decrease in amplitude over time, with the stress eventually approaching a stable value. In Case 3, the stress curve demonstrates a two-stage damped response. A distinct transition occurs at the 30-s mark when an additional load is applied, after which the stress gradually decreases again and stabilizes. The steady-state stress values of the members were extracted across all load cases, with the results summarized in
Table 7. The data shows that as the ice load increases, the steady-state stress values for both member 1 and member 2 exhibit an upward trend across all three cases. Furthermore, the steady-state stress of member 1 in Case 3 is lower than in Case 1, whereas for member 2, it is higher than in Case 1.
4. Impact of Additional Insulator String Fracture
To evaluate the impact of additional insulator string fracture on the safety performance of transmission lines, SDV3 (a user-defined state variable in ABAQUS, which here represents the degree of material damage) contour plots were extracted to assess the severity of tower damage. Based on the previous analysis, structural failure first occurred in Case 2 under a 30 mm ice load. Consequently, this section presents the SDV3 contour plots for all three cases under ice loads of 30 mm, 35 mm, and 40 mm.
Figure 10 displays the SDV3 contour plots at the termination of the analysis for the three cases under different ice loads (where the analysis was interrupted due to cross-arm failure). The results indicate that under the same ice load, the overall damage level of the transmission tower in Case 2 is significantly higher than in Case 1. This occurs because when an insulator string breaks, the conductor will sag. As it descends to the lowest point, a significant impact load is generated. Subsequent swinging of the conductor produces oscillatory loads with progressively diminishing amplitude. If ice load is simultaneously applied, the combination of these two loads will inflict greater damage on the transmission line. This demonstrates that the combined effect of the dynamic impact from the insulator string fracture and the static ice load severely compromises the structural safety of the tower and substantially reduces its load-bearing capacity. Notably, under the 40 mm ice load, cross-arm failure occurred in Case 1 but not in Case 3. This suggests that the fracture of the insulator string reduces the conductor tension, which in turn decreases the force exerted on the cross-arm. This load redistribution enhances the overall load-bearing capacity of the transmission tower, thereby validating the potential feasibility of a controlled insulator string fracture strategy. To obtain a more precise failure load value for Case 1, an incremental analysis was conducted starting from 35 mm with 1 mm increments. By varying the ice load, it was found that failure first occurred in Case 1 at an ice load of 37 mm. By comparing the converted ice loads of 37 mm and 40 mm, it can be concluded that the load-bearing capacity of Case 3 is improved by at least approximately 10% compared to Case 1.
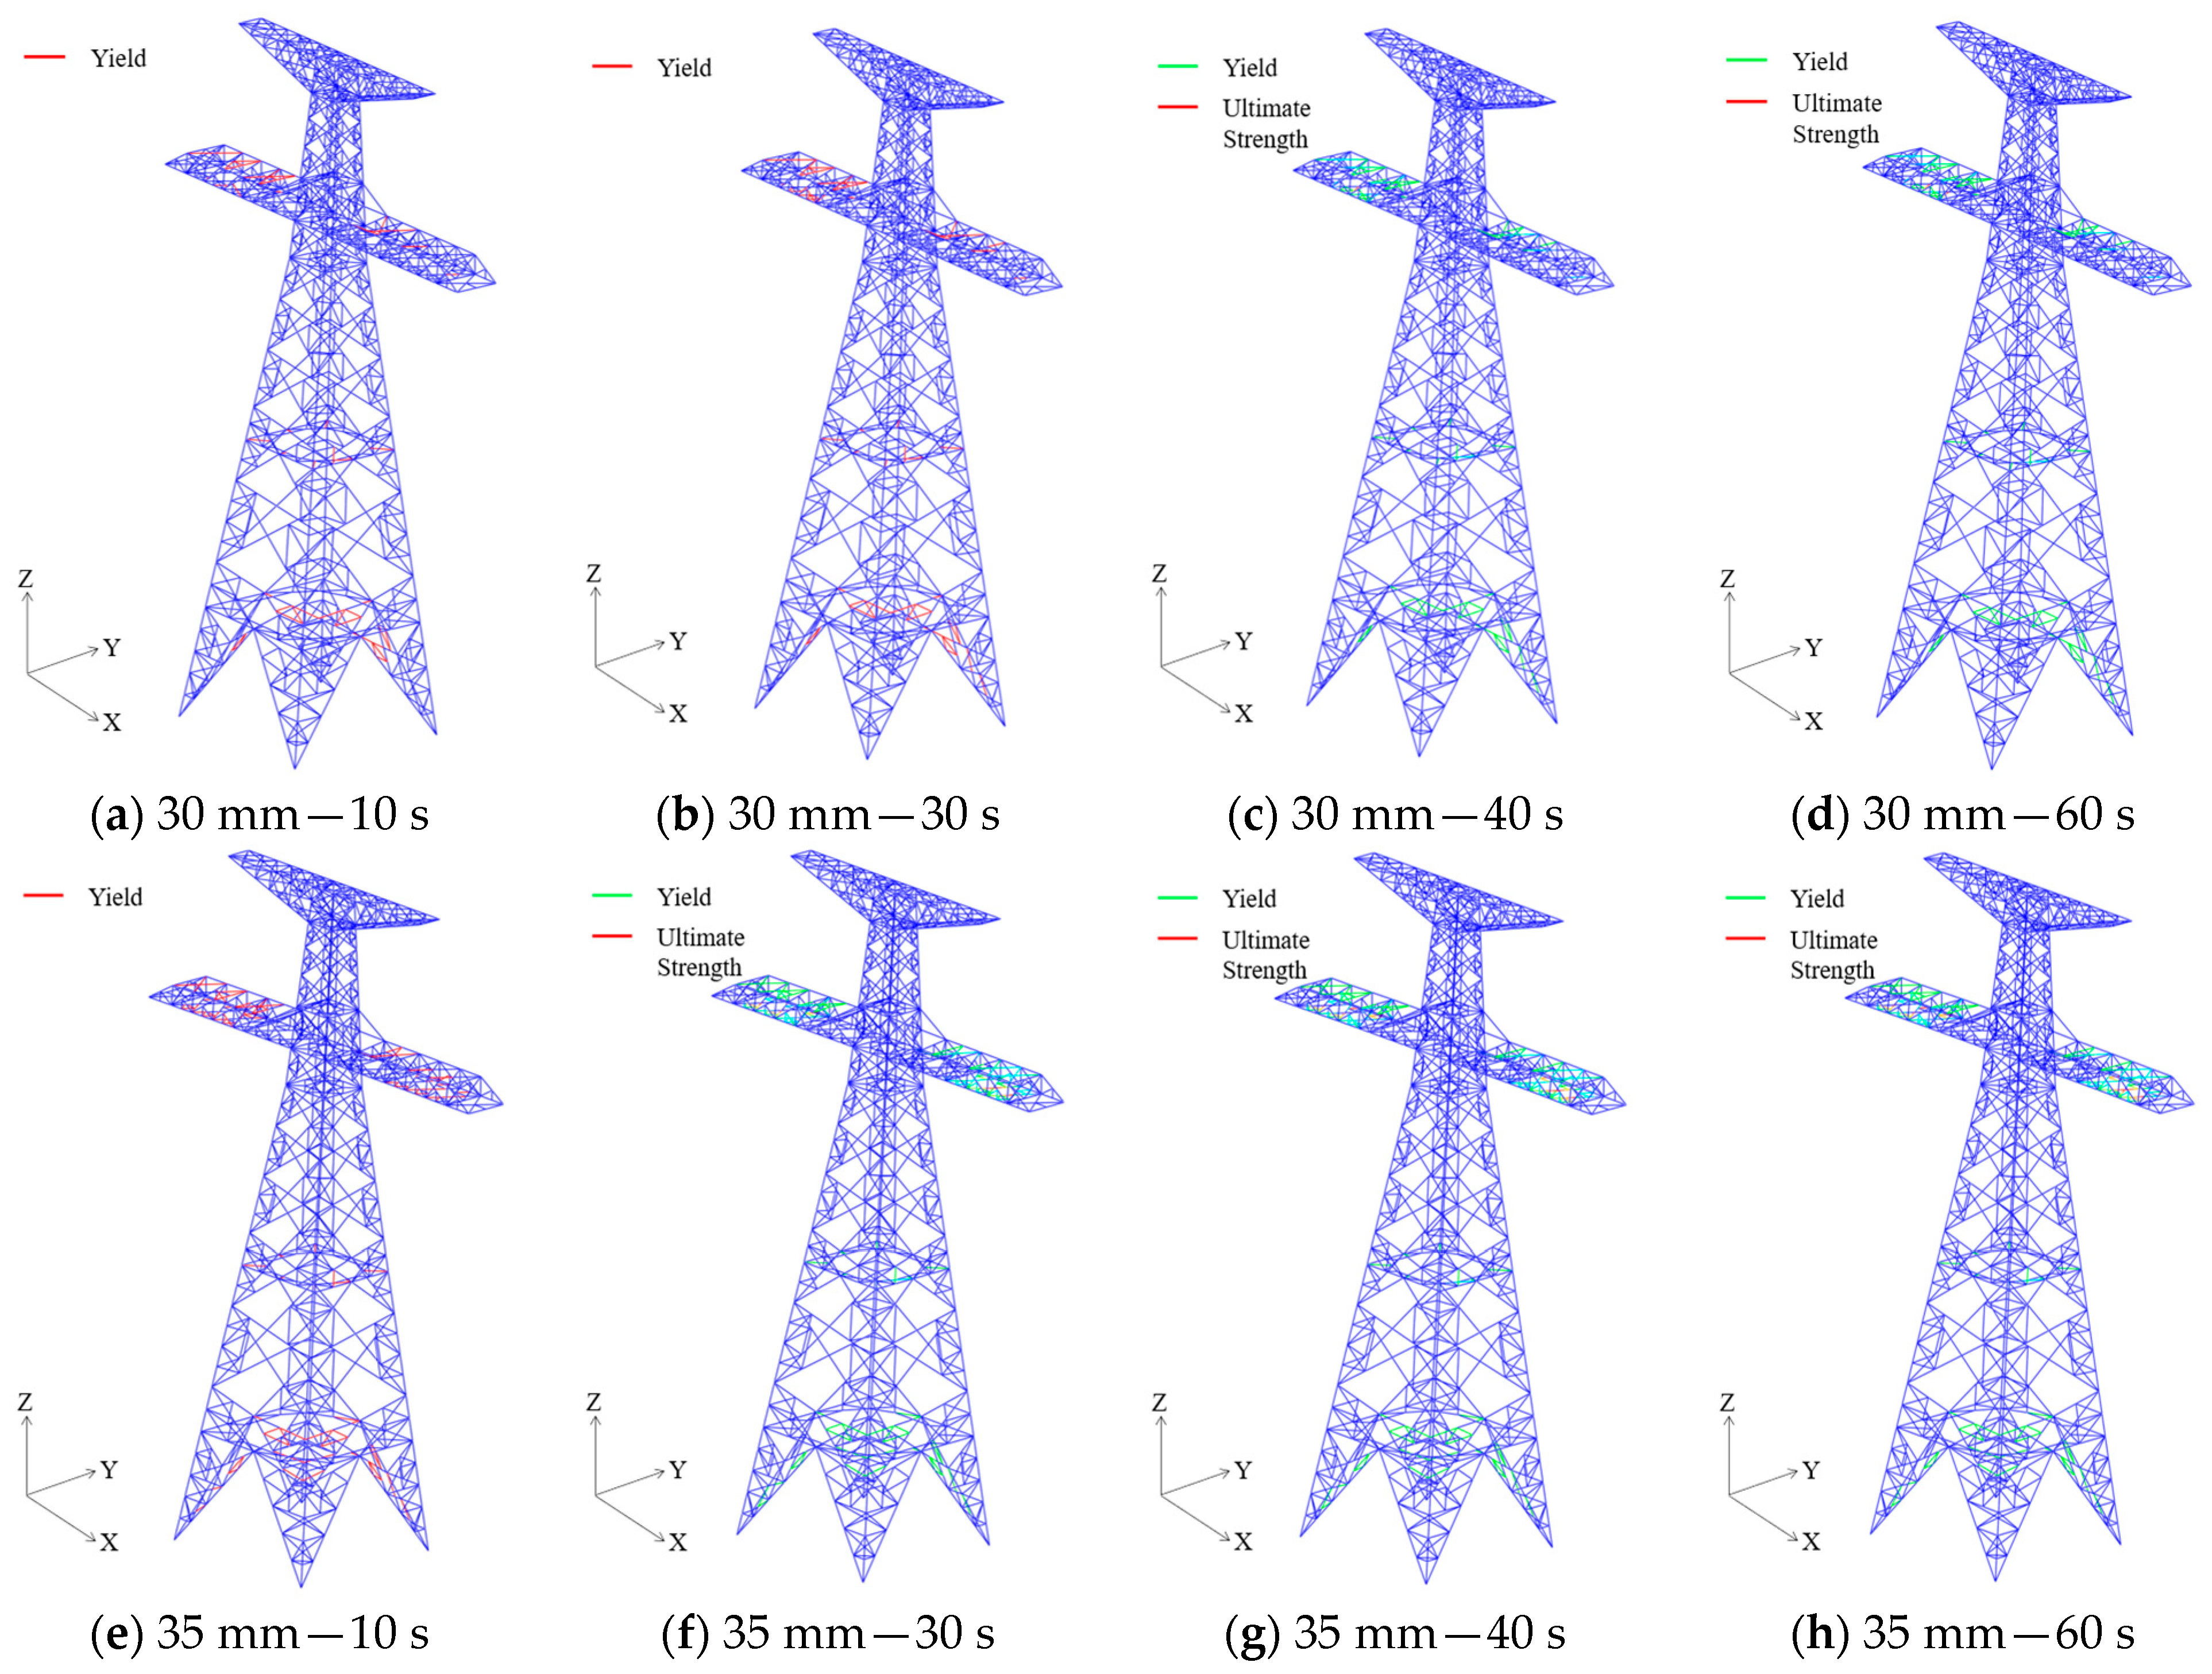
Furthermore, the analysis indicates that under ice loads of 30 mm and 35 mm, structural damage to the transmission tower in Case 3 is moderately higher than in Case 1. For example, at 30 mm ice load, more members in Case 3 reached the material yield strength compared to Case 1. At 35 mm ice load, certain cross-arm members in Case 3 attained the ultimate strength, which was not observed in Case 1. To better understand the damage progression in the transmission tower members under 30 mm and 35 mm ice loads, SDV3 contour plots for Case 3 were extracted at four time intervals: 10 s, 30 s, 40 s, and 60 s.
Figure 11 shows the SDV3 contour plots of Case 3 at these four time points under 30 mm and 35 mm ice loads. The results reveal that most of the damage development occurs within the first 10 s. Between 10 s and 30 s, damage progression is minimal. Although an additional ice load is applied at 30 s, only limited damage evolution is observed between 30 s and 40 s, with only a few additional members yielding or reaching ultimate strength. From 40 s to 60 s, the damage development essentially ceases, and the structure gradually stabilizes. For instance, under the 35 mm ice load, several cross-arm members had already yielded within the first 10 s. By 30 s, some of these members reached the ultimate strength, though the number of yielded members increased only slightly compared to that at 10 s. By 40 s, damage had progressed further, with additional members reaching yield and ultimate strength. However, by 60 s, the set of members that had yielded or reached ultimate strength remained unchanged from that at 40 s, indicating that damage progression had effectively stopped.
