Article

Evaluation of Ground Parameters Influenced by Pile Driving

1
Department of Geotechnics, Faculty of Civil Engineering, University of Zilina, Univerzitna 8215, 010 26 Žilina, Slovakia
2
Faculty of Materials, Civil and Environmental Engineering, University of Bielsko-Biala, Willowa 2, 43-309 Bielsko-Biala, Poland
3
Faculty of Civil Engineering, Wrocław University of Science and Technology, Wyb. Wyspiańskiego 27, 50-370 Wrocław, Poland
*
Author to whom correspondence should be addressed.
Buildings 2025, 15(22), 4127; https://doi.org/10.3390/buildings15224127 (registering DOI)
Submission received: 3 October 2025 / Revised: 13 November 2025 / Accepted: 14 November 2025 / Published: 16 November 2025

Abstract

Geological surveys provide important information for many sectors, from construction project planning to mineral exploration and environmental protection. The seismic cone penetration test with pore water pressure measurement (SCPTu) is a truly valuable tool in geological surveys. It provides detailed information on the subsurface conditions and geological characteristics of the area. The manuscript describes the methodology used to characterize the geological layers at the construction site and quantify the characteristics obtained from SCPT probing. The aim of the scientific study was to identify soft layers in the subsoil and to focus on the impact of pile driving technology on the foundation environment and SCPT probing results. The driving technology involved the implementation of 4.0 m long pyramidal precast concrete piles with pile head dimensions of 0.5 × 0.5 m and tip dimensions of 0.12 × 0.12 m. Probing of the SCPT before and after driving showed that the pile driving led to a significant increase in the velocity of shear waves in the soil at a distance of 0.5 m from the edge of the pile head, which was also reflected in the evaluation of the shear modulus Gmax derived directly from shear wave velocity.

1. Introduction

Analyzing the CPT data helps in understanding the geological stratigraphy of the site, including the thickness, sequence, and properties of different strata [1,2]. This is crucial for engineering design and construction projects, as these factors influence the stability, settlement, and behavior of structures built on or in the ground [3]. Mapping geological features can be used to create maps and cross-sections of faults, fractures, bedrock, and groundwater levels. This helps in understanding the geological setting of the area and identifying potential geological hazards or constraints for development projects [4,5]. Assessment of geohazards can help identify potential geohazards such as landslides, liquefaction, subsidence, and sinkholes by detecting unstable or weak soil layers and assessing their properties [6]. This information is crucial for land-use planning and mitigating risks associated with geological hazards [7,8,9]. The survey results from field testing can be used for the same analyses as presented in static load interaction studies between bridge structures and the geological environment [10,11]. The results of tests can be used equally in the evaluation of the economic efficiency and sustainability of traffic constructions such as roadway designs [12].
To obtain a proper design in the ultimate limit state as well as the serviceability limit state, various properties of the soil must be known, including the strength of the soil and the deformation properties of large and small strain magnitudes. Recently, attention has also been focused on near-surface seismic testing methods used to assess soil stiffness. Of particular interest is the small-strain shear modulus (G0), which is proportional to the squares of the primary compression (P) and secondary shear (S) wave velocity. Small-strain modulus values anchor the development of complete nonlinear modulus relationships, which are required for both static and dynamic analyses related to settlement, seismic response, and machine vibrations. In situ seismic testing requires a source of stress wave energy, whether actively generated or passively- observed, as well as receivers with transducers (e.g., geophones or accelerometers) to sense the propagation of the stress waves. Generally, testing methods aimed at measuring P-wave velocity (vp) and S-wave velocity (vs) are broken into two distinct groups: (1) non-invasive surface-based methods (e.g., seismic refraction and surface wave testing) and (2) invasive/borehole-based methods (e.g., downhole and crosshole testing). Results from a thorough study documenting uncertainties within, and variability between, invasive and noninvasive methods at three blind study sites are presented in [13,14]. Noninvasive seismic methods are those that involve placement of the source and receivers along the ground surface, such as seismic refraction and surface wave testing. Invasive seismic geophysical testing involves the placement of instrumented receivers or seismic sources, or both, below the ground surface. The sensors or energy sources, or both, are either lowered into predrilled boreholes or directly pushed into the ground. Methods of this type of testing were used in [15]. Invasive seismic testing methods are generally considered to be more reliable/less uncertain than non-invasive methods. Invasive methods also include the SCPT test, which is presented in the article.
The seismic piezocone penetration test (SCPTu), which provides multipoint simultaneous measurement of cone resistance (qc), shaft friction (fs), pore pressure (u2), and shear wave velocity (vs), appears to be a reliable tool in the estimation of geotechnical parameters [16,17,18,19]. During the test, a geophone integrated in a cone measures the waves generated by a shock between a hammer and a steel plate on the ground surface as a down-hole test. When the shear wave is generated, the time is measured for the shear wave to travel a known distance to the geophone in the borehole. Determination of shear wave velocity (vs) can be crucial in obtaining information regarding the soil properties. The vs parameter is used in geotechnical seismic design methods for piles, combining the analytical elastic method in a closed form, with suitable stiffness reduction dependent on stress or models dependent on elastoplasticity [20,21]. SCPTu has been widely used in soil classification and the evaluation of soil properties. In addition, some scholars performed a series of experimental studies to evaluate Gmax based on SCPTu test results [22]. For example, one study proposed a correlation between shear wave velocity and cone penetration tip resistance (qt) and void ratio (e) [23]. Lin et al. established the quantitative relationships between electrical and geotechnical properties [24]. The authors of [25] collected continuous shear wave velocity measurements by the continuous-interval seismic piezocone test (CiSCPTu). Ref. [26] uses a seismic piezocone device (SCPTu) together with resonant column and cyclic triaxial test apparatus to measure the small-strain shear modulus (Gmax) of carbonate sandy and clayey soils. Wang et al. applied testing to reclaimed land and proposed improved SCPT-based interpretation methods to determine the unit weight and preconsolidation stress of cohesive soils [27].
Construction activities and processes create technical seismicity of varying intensity, from fine tremors to more significant shocks that can affect the stability of buildings or the mechanical properties of the soil itself [28]. One such process is the installation of piles, which was addressed by the authors of [29,30,31,32,33]. They pointed out the change in wave propagation velocity in the environment and its impact on buildings as well as the subsequent influence on the foundation soil in the vicinity of the pile driving process. Lin et al. conducted model tests on driven piles. The mechanism between the soil plug formation stage and the pile-soil dynamic response in sandy soil was studied. Lin et al. stated that there is a certain correlation between the peak acceleration and the peak lateral earth pressure during the hammering procedure [24].
The authors of [34] proposed graphs that indicated that after pile driving, the soil displacement in the zone two to three times the diameter of the pile significantly increased the horizontal effective stress. It is assumed that the vertical stress remains approximately constant, resulting in an increase in the soil pressure coefficient. Additionally, the density in this zone increases. These phenomena positively affect the point and shaft bearing capacity of the pile in the soil. For piles with minimal soil displacement, the stress and density do not change significantly due to the insertion. The soil pressure coefficient remains approximately the same as the original value. For piles that cause soil removal, the density and horizontal effective stress decrease. Since most bearing capacity calculation rules are empirical and were developed using load tests on piles that displace soil and on penetration testing (test piles), reduction factors must be applied when determining the bearing capacity of piles with soil removal. Ref. [35] reported an increase in the shear modulus value after pile driving but presented the results briefly, with few details about the SCPT implementation.
This study presents a description of the performed SCPTu tests with the aim of analyzing and comparing the differences in values determined from empirical correlations. The SCPT tests take place in an environment exposed to compaction caused by pile driving technology. The change in shear wave propagation velocity in the environment before and after pile driving is observed, which is related to further evaluation of the deformation characteristics of foundation soils.

2. Materials and Methods

To evaluate the shear modulus, SCPTu measurements were performed in the selected location where the foundation of the building structure originated. The construction objective of the project was a storage silo with a diameter of 17 m. A detailed description of the investigated geological conditions at the site and the SCPTu testing is given in the following sections.

2.1. Testing Site

The area of interest is located between road E50 and the railway line, near the town of Zvolen. The Hron river flows around the site from the south side The geographical coordinates of the investigated location are 48°33′57.2″ N 19°03′59.1″ E (Figure 1).
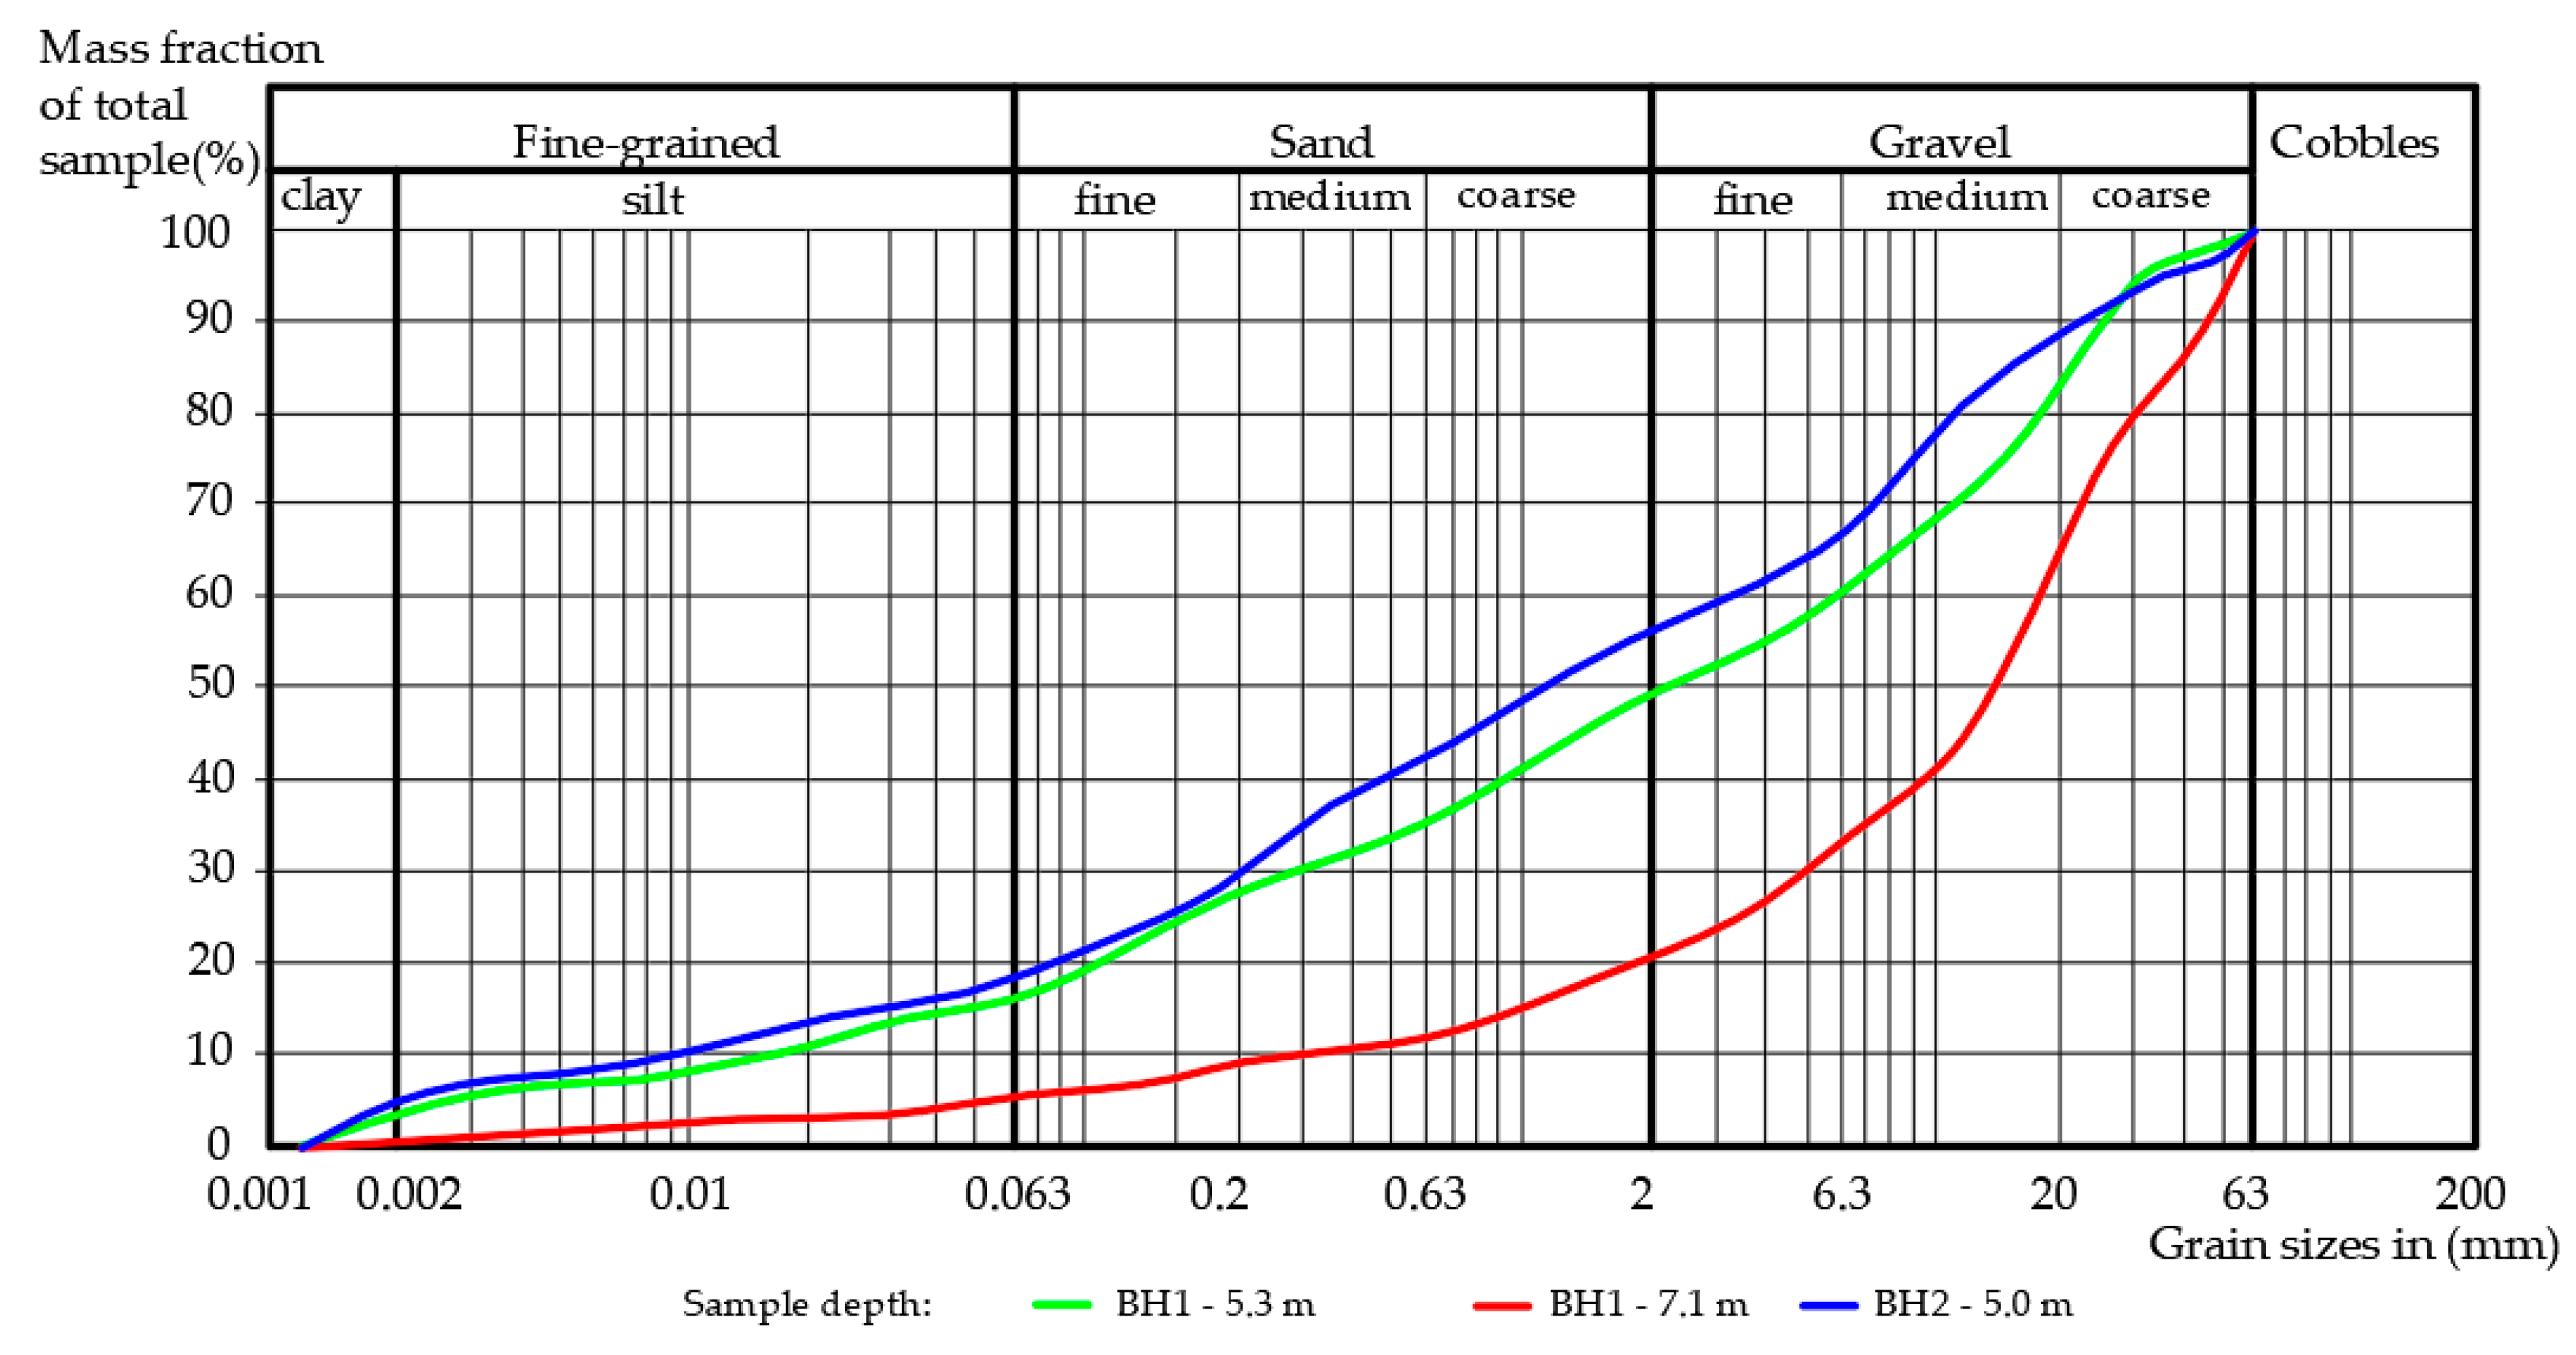
The morphology of the terrain indicates that a large amount of earth was deposited on the given territory from excavation works; the terrain generally exhibits an anthropogenic thickness of 3.5 m. The original geological structure of the land consists of Quaternary sediments and is made up mostly of fluvial sediments of the nearby Hron river. It is represented by predominantly heterogeneous gravels, sandy clay to clay, with the occurrence of medium to coarse grains diameter of 2 to 10 cm in diameter. In the petrographic composition, granitoid rocks predominate, while crystalline shale and andesite are less represented. The surface of the gravel formation forms a cover of final loam, with a capacity of about 2–3.5 m. They are represented in the development of medium-plastic loams and clay soils. Neogene volcanic rocks are discordant and deposited on an older Mesozoic bedrock. Hydrogeological conditions are a reflection of the geological structure of the territory, and their determining factor is the power and permeability of Quaternary gravel sediments. The groundwater pressure level in the area is 5 m below the surface of the ground. The main horizon of the aquifer is gravel, which is fed by surface flows, further from the slopes and from precipitation. The free groundwater level is 3.0 m below the surface of the ground. As part of the geological survey of the site, two boreholes (BH-1, BH-2) were drilled to a depth of 8 and 9 m, from which soil samples were taken for grain size analysis; see Figure 2.
Based on the geological composition, the foundation solution was implemented using driven trapezoidal piles. The geological cross-section illustrates the stratification of the subsurface layers in relation to the foundation structure, showing the depth and distribution of soil types as well as the positioning of the piles within the layers (Figure 3).

2.2. Deep Foundation Parameters

For the structural design, a foundation approach was chosen that combines shallow and deep foundations. Prefabricated concrete piles with a length of 4.0 m were used, featuring a head dimension of 0.5 × 0.5 m and a tip dimension of 0.12 × 0.12 m. The installation was carried out using Fambo HR 1000 equipment manufactured by Bauer Groups, Sweden. The total weight of the impact device was 2900 kg and the weight of the ram was 1000 kg. The maximum possible energy of the fall was 11.77 kNm at a ram fall height of 1.2 m.
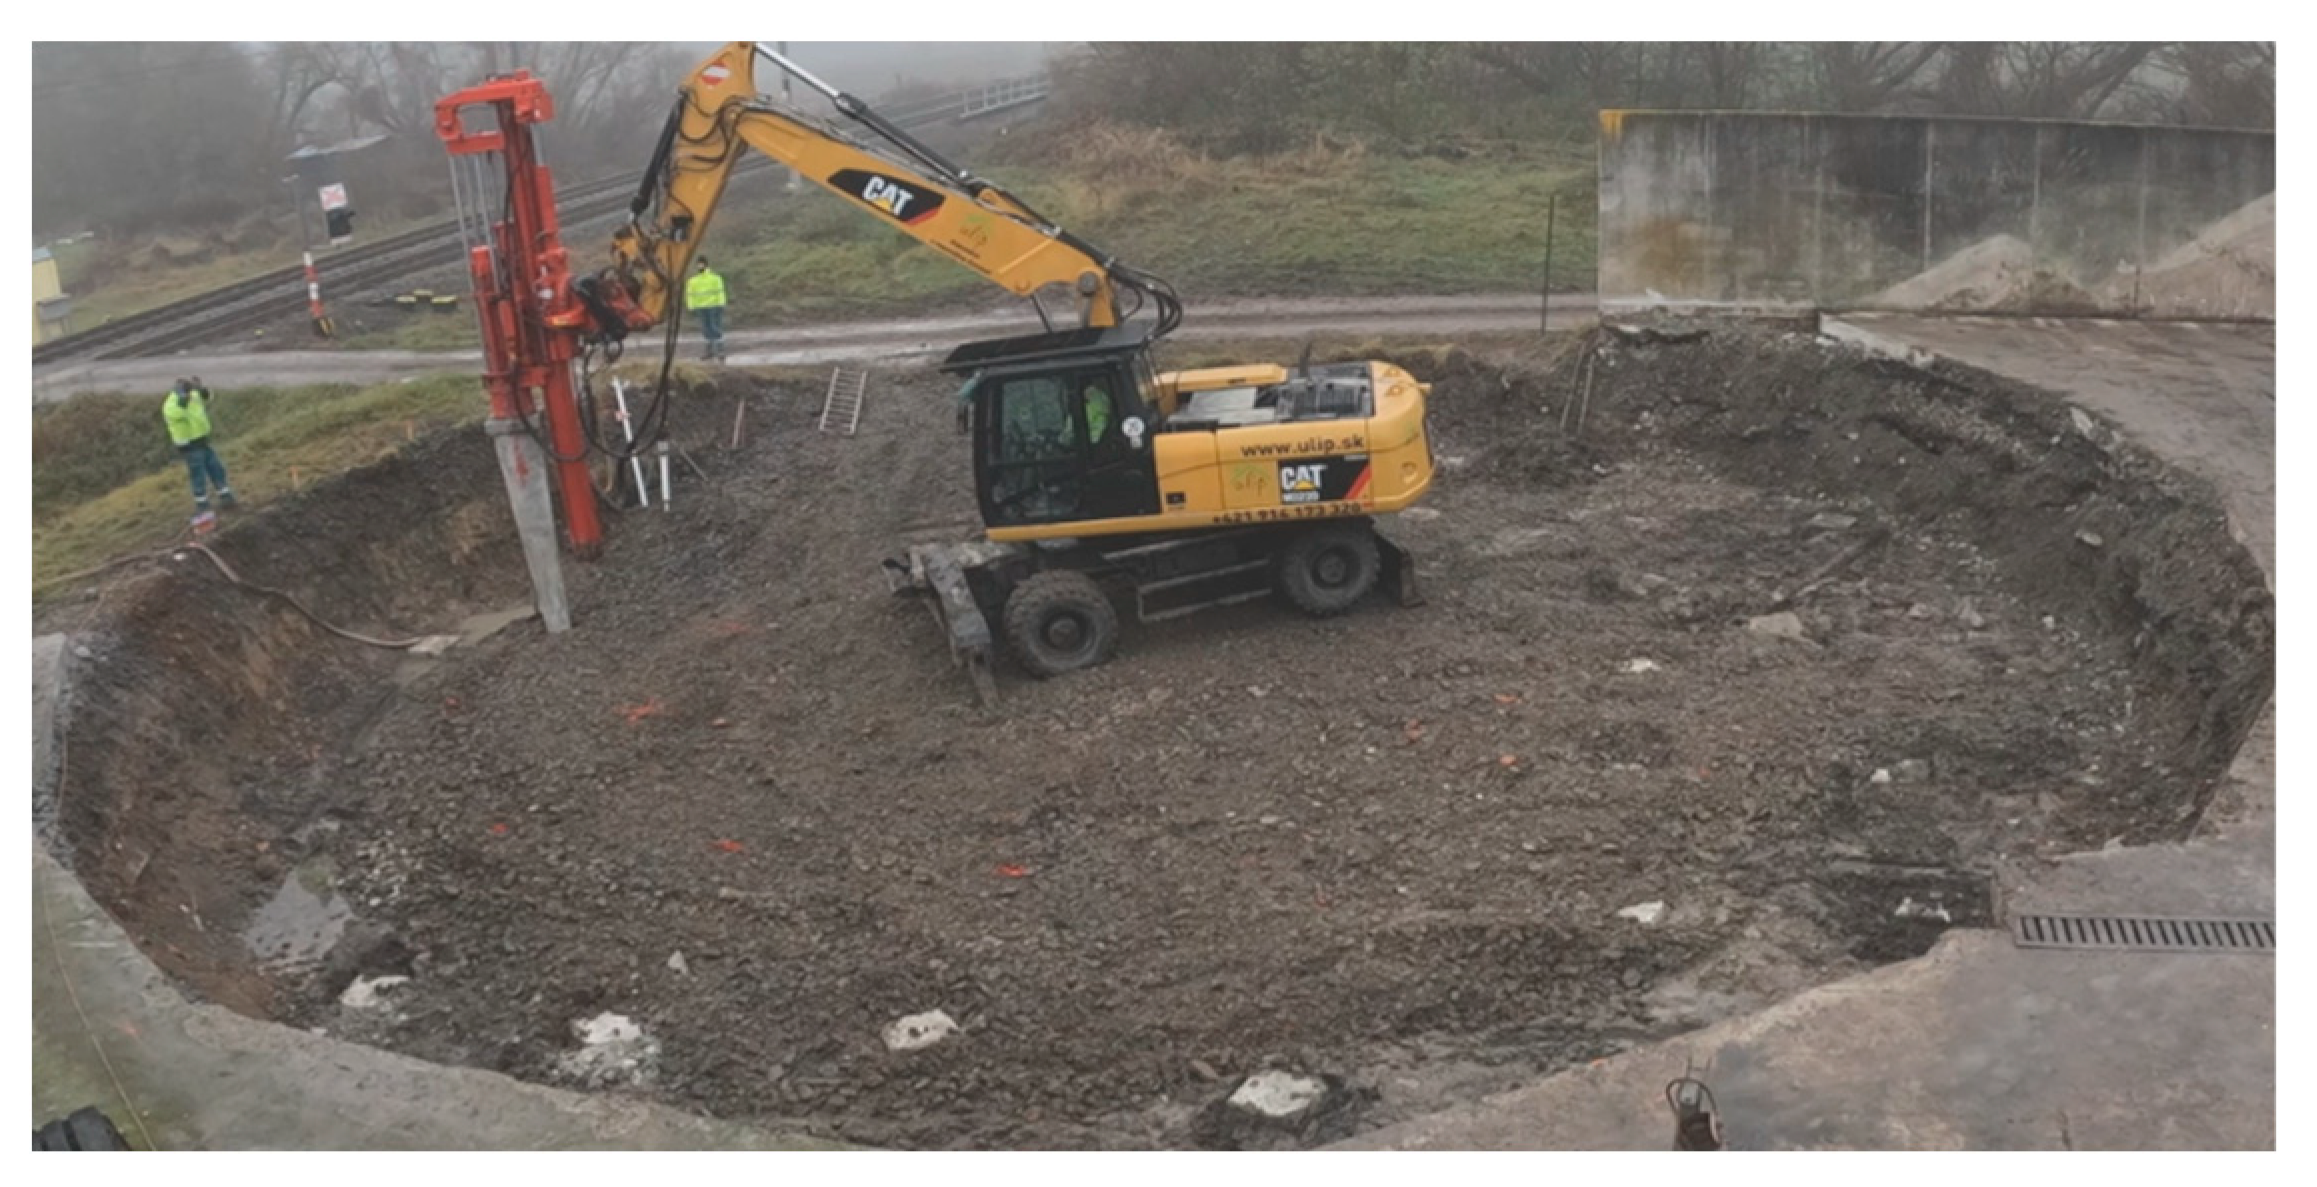
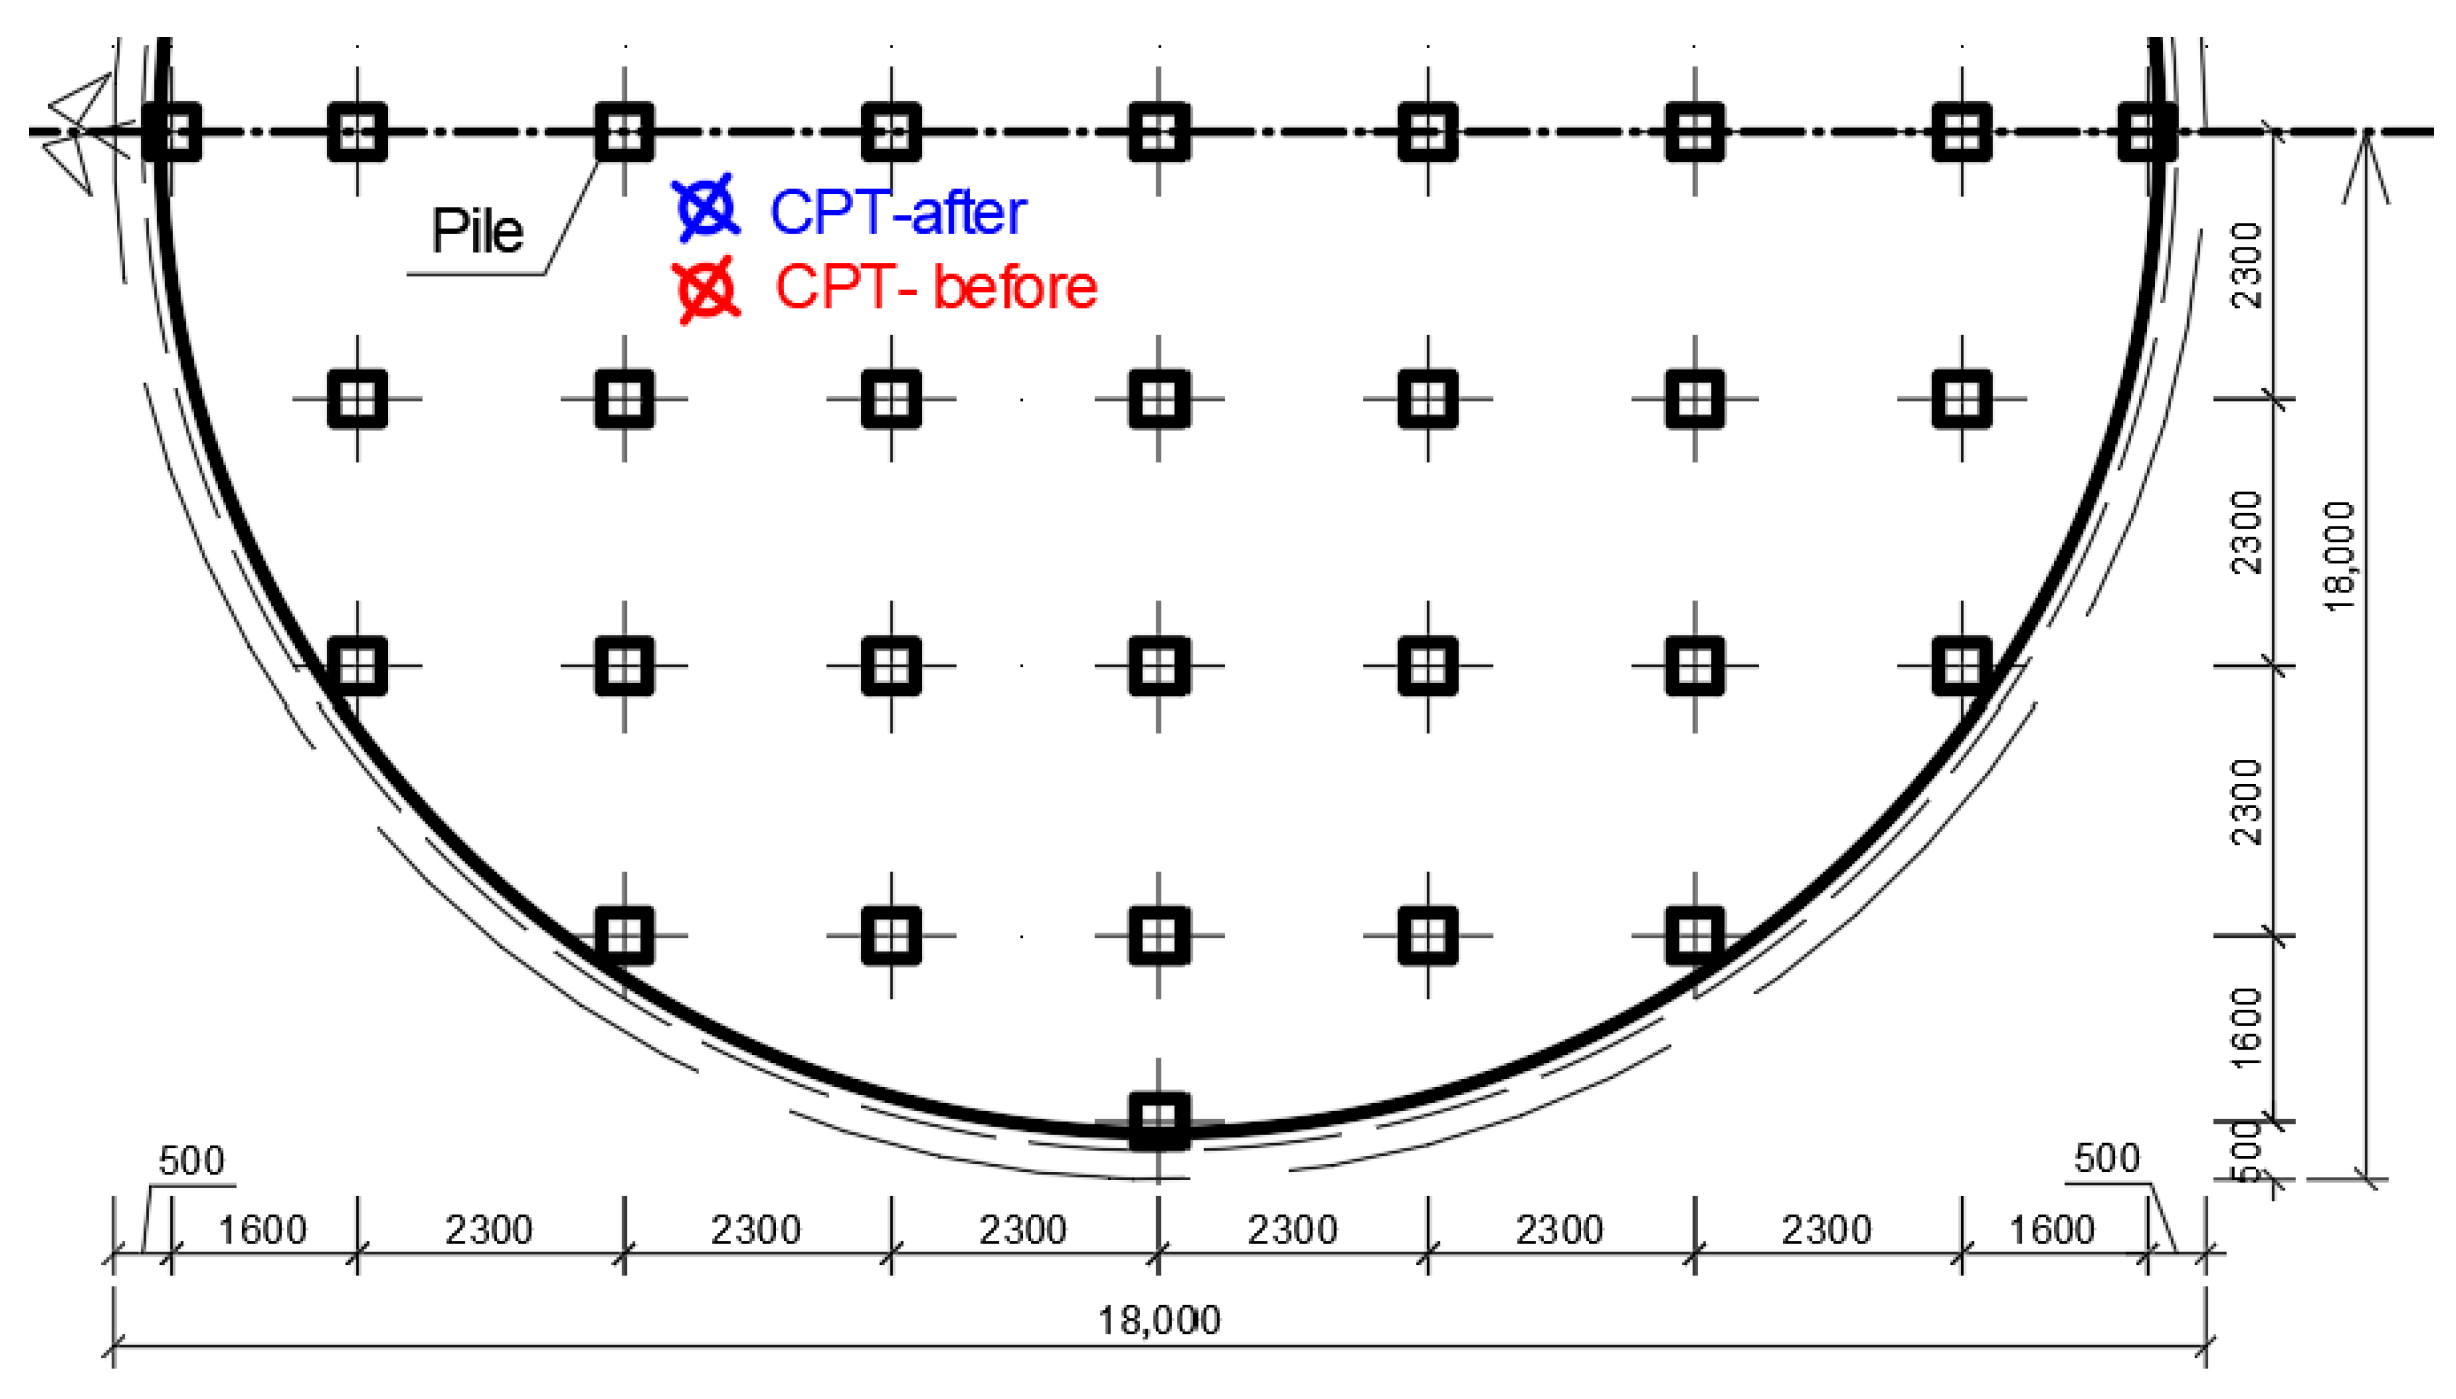
After the preparatory and excavation works on the construction site, initial SCPTu tests were conducted at the tank installation location, specifically in the space between the piles at a distance of 0.5 m from the pile head edge. SCPTu-1 testing was performed before pile driving, while SCPTu-2 was conducted after the pile installation. These tests were analyzed using software tools, focusing on the evaluation of shear wave propagation velocity and shear modulus of the geological environment. The pile driving process and pile configuration are illustrated in Figure 4.

2.3. SCPTu Methodology

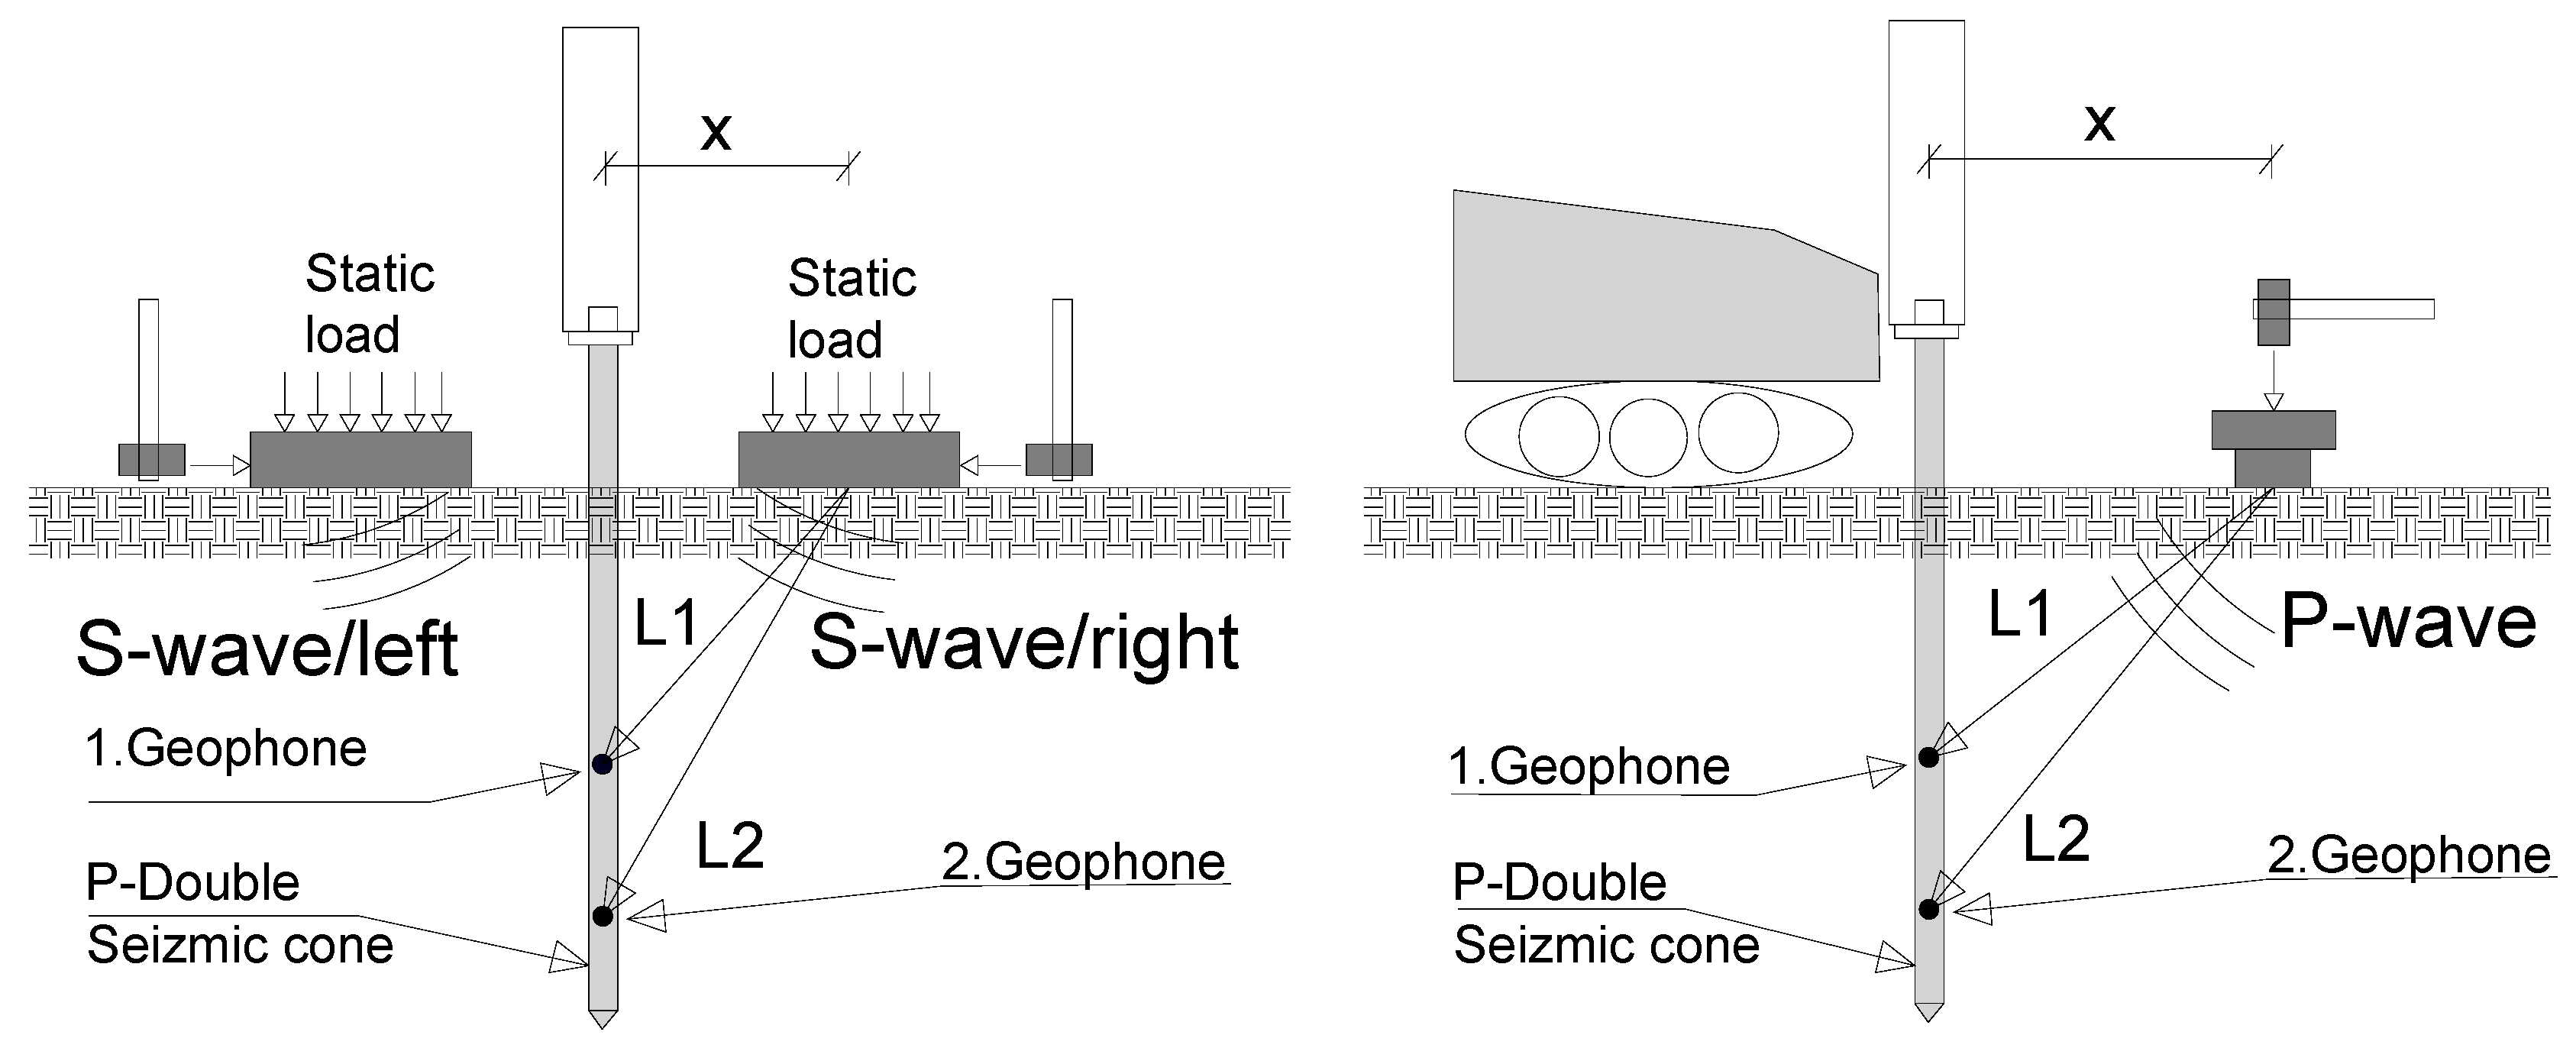
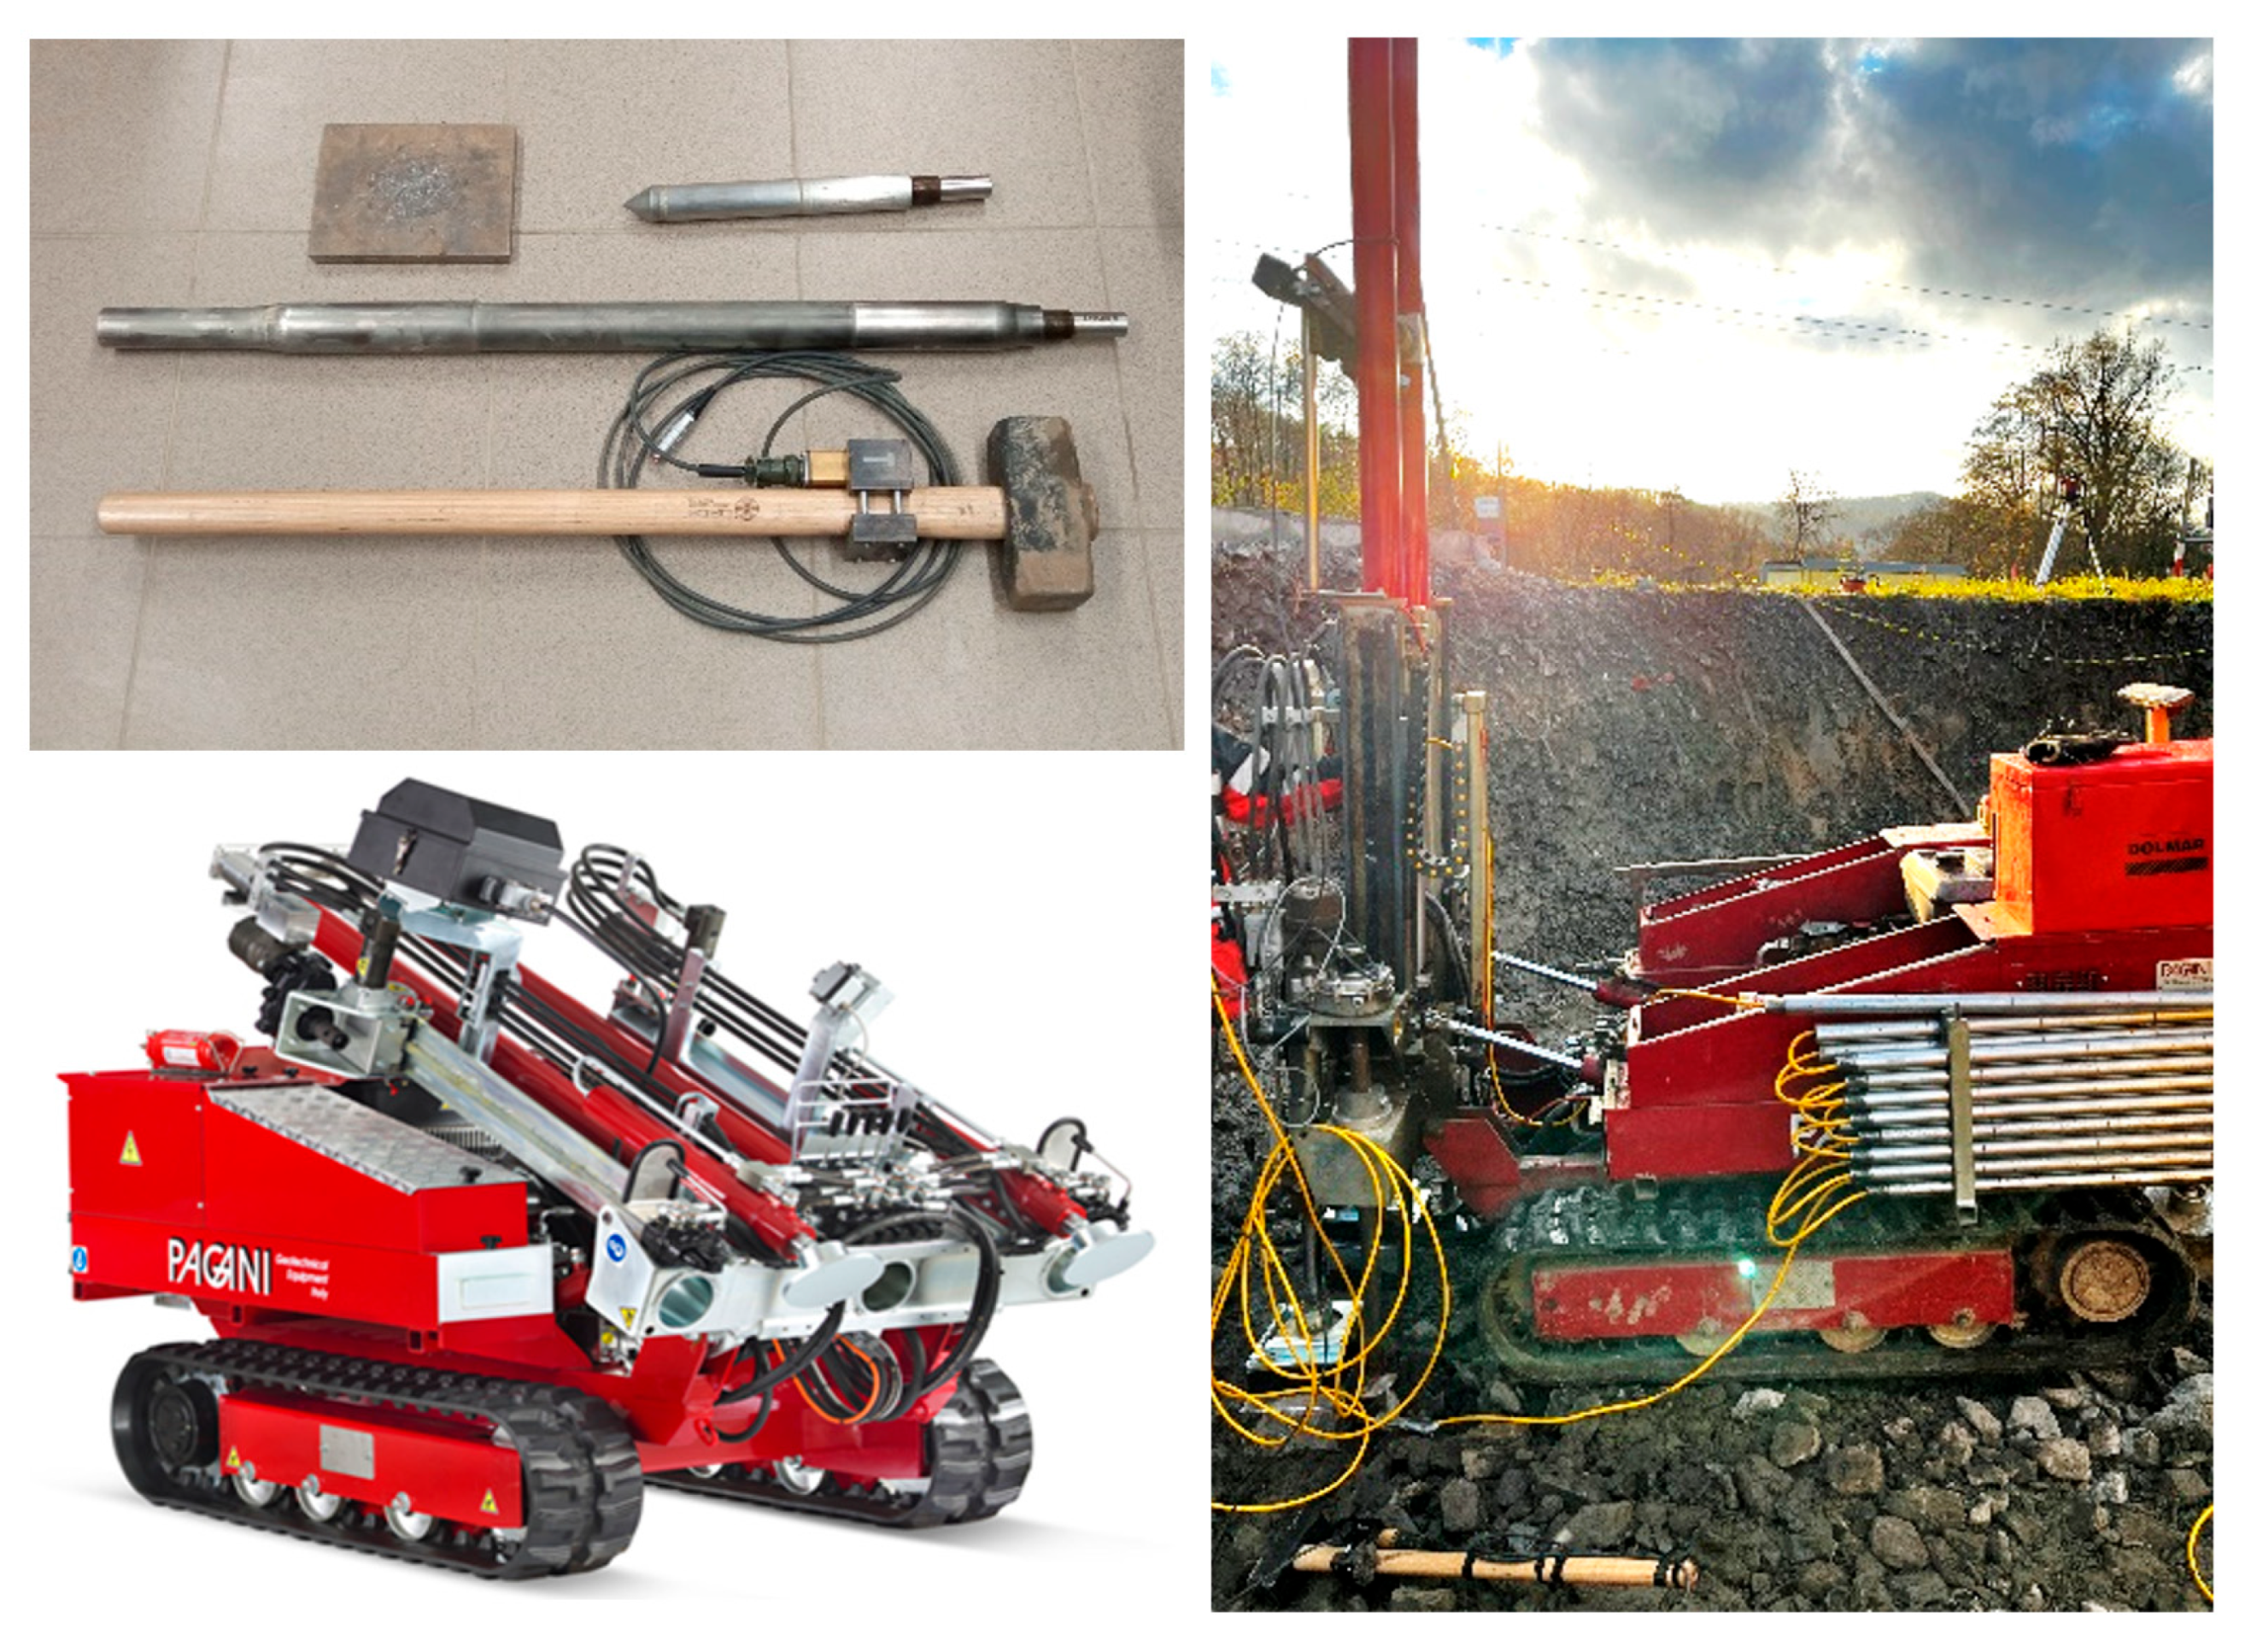
The seismic cone penetration test, SCPTu, is one of the in situ probing methods. The principle of the static penetration test consists of the gradual pressing of a sounding rod into the soil, ending with a penetration cone. The penetration process takes place at a constant rate of 20 mm∙s−1. During penetration, continuous recording captures values of cone resistance qc, shaft friction fs, and pore pressures u2. In the conducted probe (Pagani-double seismic cone) manufactured by Pagani Geotechnical s.r.l., Italy, the seismic module is located directly above the measuring cone. Inside the module, there are two 3-axis geophones arranged in two levels, perpendicular to each other. Two of them are horizontal (X, Y), and one is vertical (Z). During measurement, the geophones register time-dependent changes in the velocity amplitude of soil particles that have been disturbed after being set in motion by a seismic wave induced on the ground surface. The geophones are positioned at 0.5 m one from the other, which allows for the collection of more seismic data in a simpler fashion as well as the time difference in the arrival of a seismic wave between one set and the other (true interval). The geophones for collecting the data on the seismic waves are positioned inside the piezocone unit, one for gathering data on the P waves and two for gathering data on the S waves, allowing for the data to be received from any angle. The tests are carried out at regular depth intervals, most often every 1 m, with the seismic wave being induced in two ways, referred to as the S-wave and P-wave. The first test (S-wave) focuses on recording shear waves by striking horizontally with a hammer on a steel anvil that is statically loaded. Two identical steel anvils were used in this test. They were positioned symmetrically to the sounding rod. The tests were conducted at specific depths by generating shear waves through impacts on the anvil on its left and right sides. The velocity amplitude measurements were graphically represented as a function of time. The second test (P-wave) relies on the induction of a primary wave by a vertical hammer impact on a steel base embedded in the soil at a given distance from the rod. The authors used machinery similar to that used in [36,37].
A schematic representation of the test setup is shown in Figure 5.
It is necessary to establish good contact between the ground and the source, to orient the source towards the receivers to maximize the signal amplitude in one direction, and to place the source horizontally. In addition, key system characteristics (sampling frequency, trigger repeatability) play an important role in the accuracy of the measured shear wave velocity [38,39]. The SCPTu setup and equipment are shown in Figure 6.
The steel anvil was horizontally offset (x in Figure 5) 0.5 m from the cone rod and held in place by one of the cone rig leveling jacks. The waveforms were digitized at a 30.3 kHz sampling rate (time interval of 0.033 ms). Data acquisition was triggered when the contact between the hammer and steel anvil closed the triggering circuit. At each measurement depth, the S- waves were reversed by striking both sides of the shear plank. Measurements of P-waves were attempted using vertical downward hammer strikes, but the recorded waveforms were of insufficient quality to process due to early rod wave arrivals; the authors had the same problem in [40].
With the goal of developing profiles of vs (and less frequently vp), the first step in SCPT data reduction is travel time evaluation of the seismic waves, either the direct travel time from the source to the receiver or the relative travel time between two measurement depths. These travel times are determined by several methods. In this article, the peak-trough (PT) (or also peak-to-peak) method is used. In this method, the wave arrival time is determined as the first peak, and the time between the second measurement is determined as Δt. If a dual receiver cone is used to simultaneously record a pair of waveforms from a common source excitation, the resulting velocity is considered a true-interval (TI) velocity. Otherwise, if a single receiver cone is used to incrementally record waveforms at two different depths using different source excitations, the resulting velocity is considered a pseudo-interval (PI) velocity. After determining Δt, the shear wave vs is determined using Equation (1).
v s = ρ t L i L i 1 t i t i 1 = Δ L Δ t
where i is the current, deeper measurement, i − 1 is the previous, shallower measurement, L is the travel path length, and t is the picked wave arrival time.
The determination of shear moduli is based on the assumption that soil behaves as an elastic body within the range of small deformations. Based on the predetermined propagation velocity of elastic shear and primary waves in the soil, it is possible to determine the values of soil deformation parameters [41,42,43,44].
The initial value of the shear modulus can be determined based on the shear wave velocity and soil density using Equations (2)–(4):
G m a x = ρ t × ( v s ) 2 ,
where Gmax is the small-strain shear modulus [MPa], ρt is the soil density [kg/m3], and vs is the shear wave velocity [m/s].
ρ t = γ t / g a
where γt is the soil total unit weight [kN/m3] and ga is the gravitational constant, 9.8 m/s2.
γ t = γ w × 1.22 + 0.15 × l n ( 100 × f s σ a t m + 0.01 )
where γw is the unit weight of water [kN/m3], σatm represents 1 atmosphere ≈ 1 bar = 100 kPa, the exponent n varies with soil type, and fs is the shaft friction [kPa].

3. Results

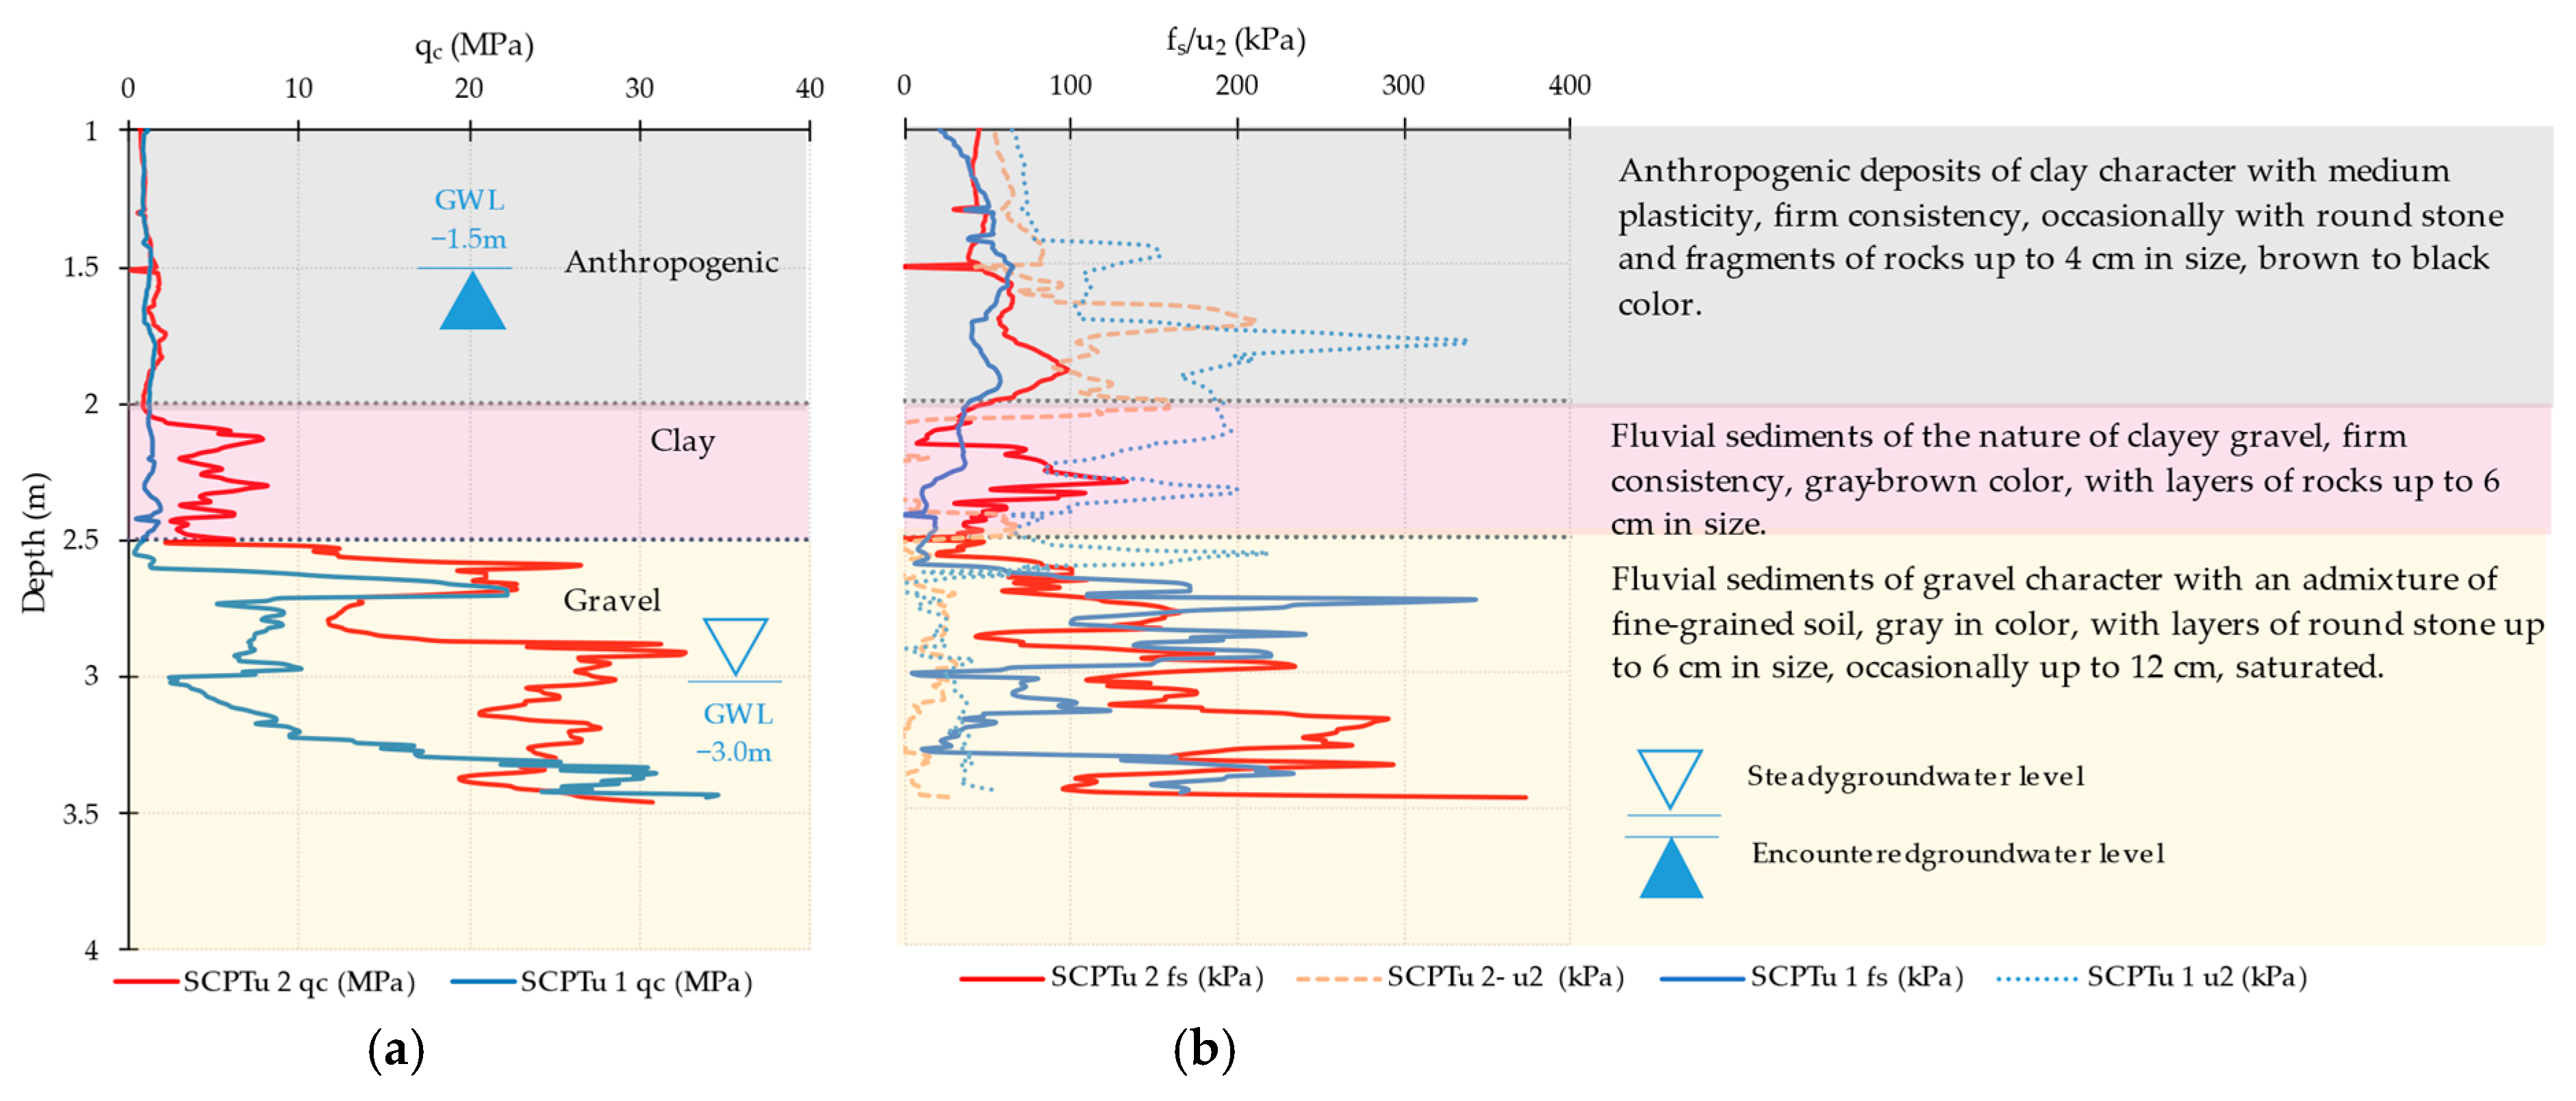
The processing of the test results consisted of three phases. First, the results for penetration resistance and friction on the tip sleeve were evaluated, from which the geological zones were precisely determined. In the second step, the shear seismic wave velocities were evaluated for the determined zones. In the third step, the shear modulus was determined for the isolated geological zones. The results for penetration resistance, shaft friction, and pore pressure from the SCPTu-1 and SCPTu-2 tests are shown in Figure 7. The SCPTu-2 probe was conducted two days after the pile driving process. No pore pressure dissipation tests were conducted during the probe. The absence of such measurements is supported by the claim that seismic measurements are unaffected by the dissipation process [45].
From the results shown in Figure 7, a change in cone resistance qc is visible, where the values increase in the layers of clay and gravel. In anthropogenic material, no clear trend is observable, and the variation in values can be attributed to the heterogeneity of the anthropogenic fill layer. As to shaft friction fs, the diagrams suggest that the shaft friction measured in the clay before pile driving is smaller than after the driving.
From the SCPTu results, the bulk densities of the soils for the given layers were determined using the empirical Equations (3) and (4), which depend on the measured qc and fs. The results are summarized in Table 1.
As part of the seismic measurements, tests were conducted before and after the installation of piles. From the in situ measurements, the parameter vs and the deformation parameter Gmax were evaluated. To calculate the shear wave velocity (vs), measurements from the S-wave test recorded along the X and Y axes were analyzed. The wave velocity was determined by recording the time difference in the arrival of the wave front, as detected by accelerometers at adjacent depths, and dividing it by the distance between the measurement points. To determine the time difference, specific characteristic points derived from the acceleration measurements can be considered. This includes the lower and upper peaks S-wave tests (see Figure 4). A more detailed evaluation procedure is provided in [45,46,47]. Shear wave measurements were carried out at six depth intervals; see Figure 8. The points represent the acceleration amplitudes recorded at different depths by the accelerometer (X) in the S-wave test as a function of time.
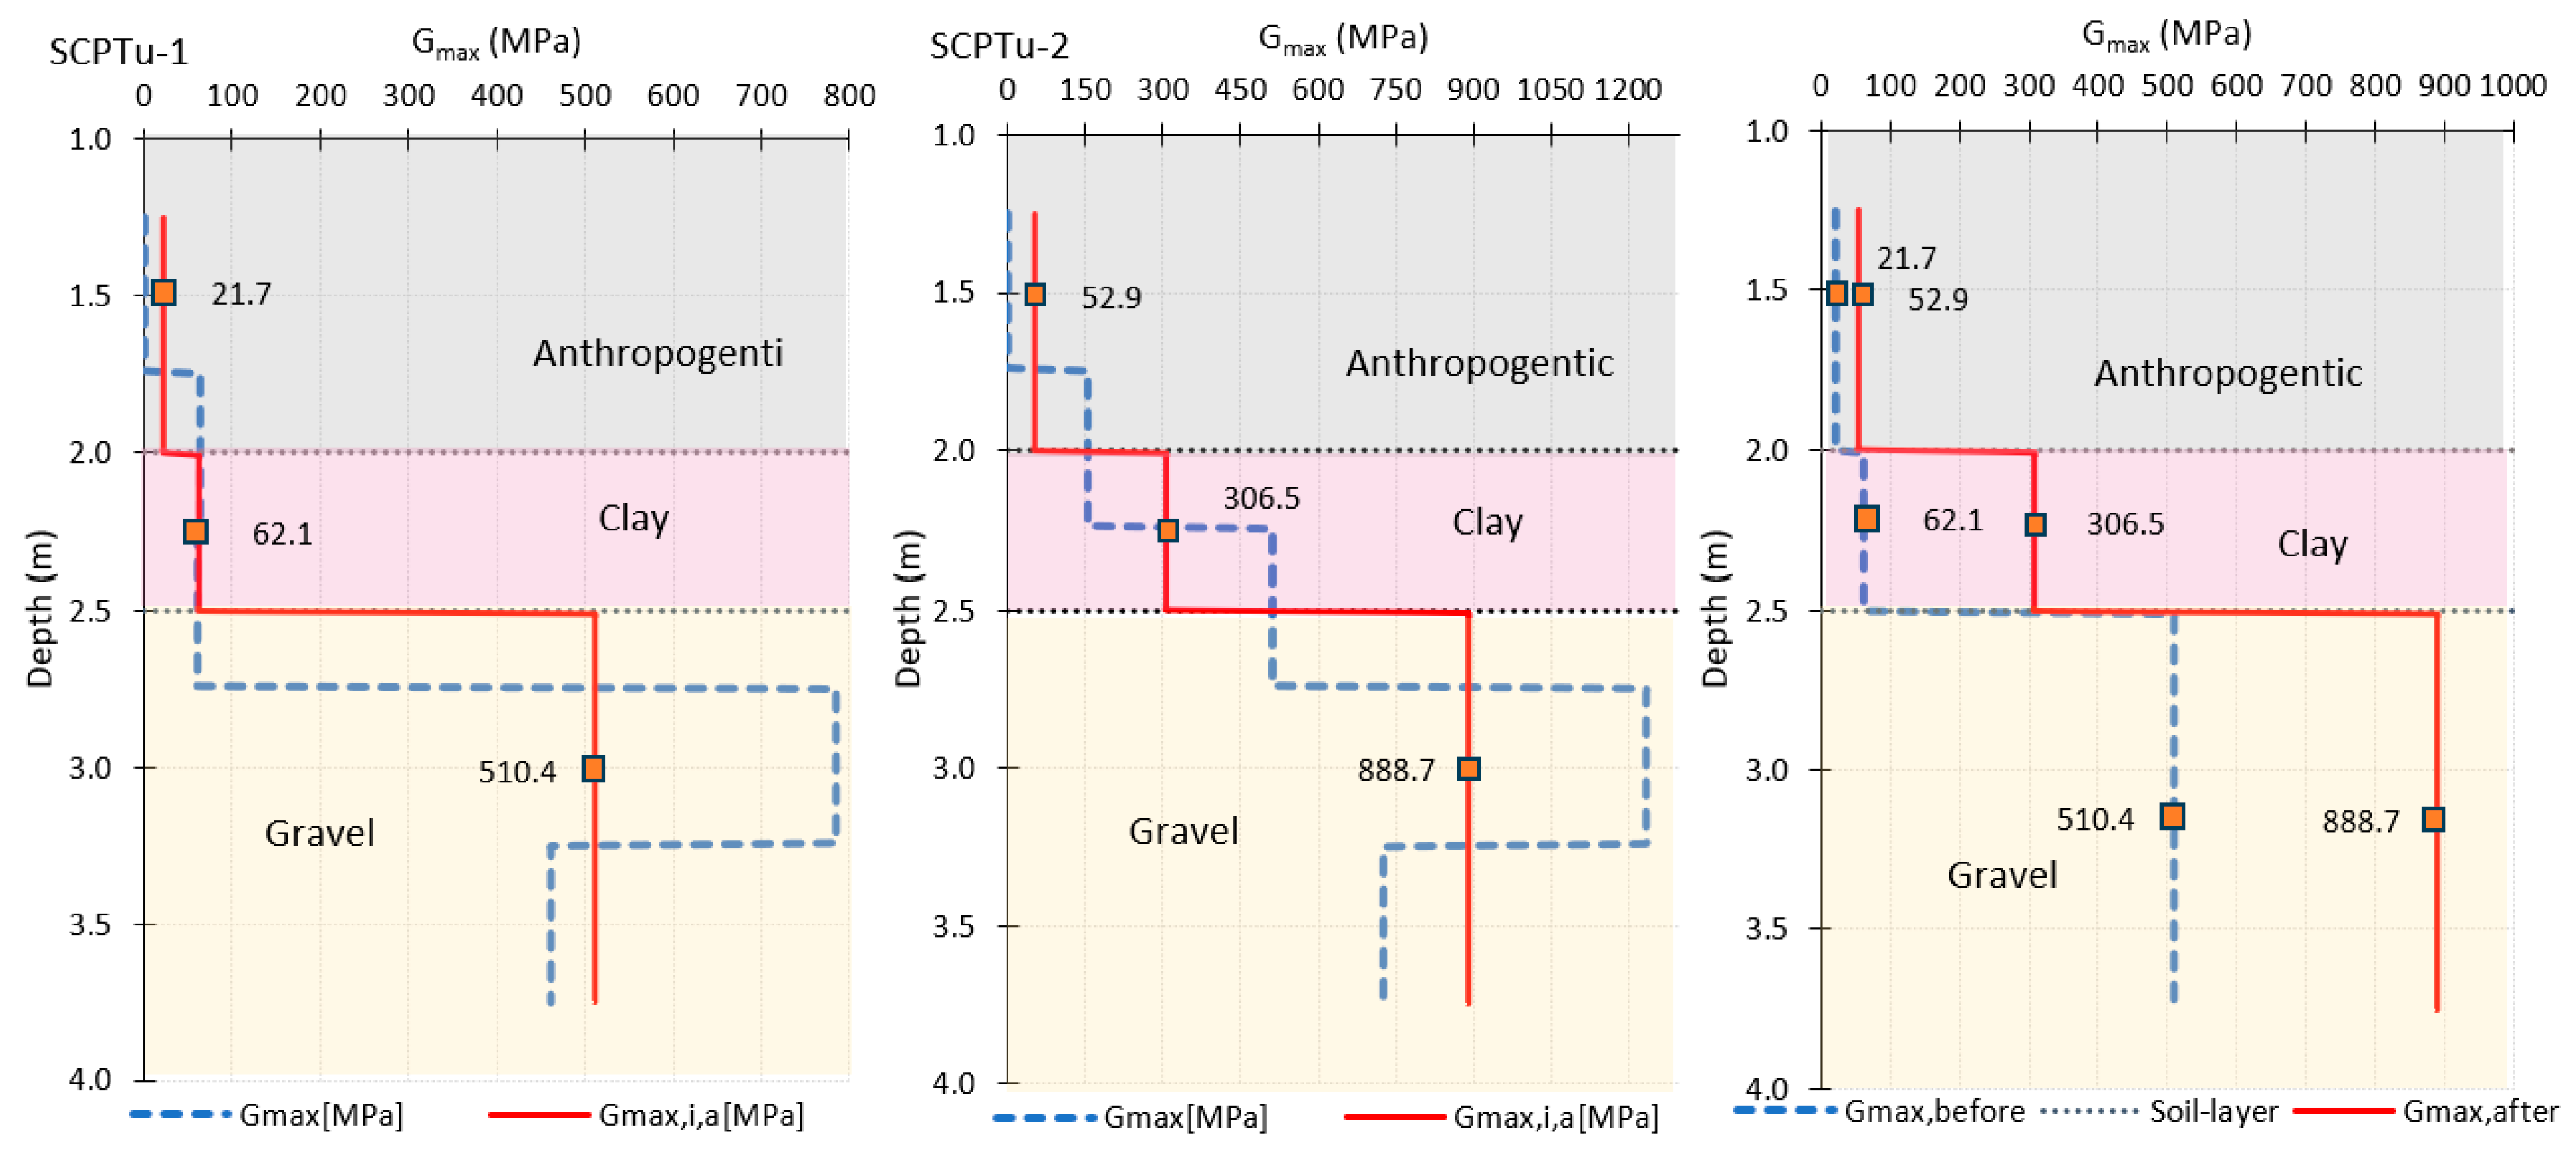
From the results in Figure 8, Gmax was determined using Equation (1) for the individual depth intervals at which S-wave measurements were carried out. The Gmax value is considered as a representative value for the depth interval of the distance between the two seismic sensors located in the tip (in our case, it is 0.5 m); these values are given in Table 2. The comparison of the differences in Gmax values was interpreted for the soil layers, i.e., the Gmax values were adjusted by the weighted average for each layer. The results can be seen in Figure 9, which shows the increase in the shear modulus of the geological environment after the application of pyramidal piles. The dashed line shows the results in the measurement intervals, and the solid line shows the values for the soil layer. The results are summarized in Table 3.

4. Discussion

The change in the Gmax value for individual soil layers was not constant for the soil layers. In general, pile driving caused an increase in the Gmax of the soils. The largest increase was in the clay soil layer, where it reached a value 4.9 times greater than the original. For the more relaxed position of the gravels, the increase was 1.7 times greater. The smaller increase compared to the clay soil can be attributed to the position of the gravels. The change in the value for the anthropogenic layer was 2.4 times greater.
Two SCPTu probes, even on a small area—one “before” and one “after” the installation of the pile—are not sufficient for a detailed statistical analysis. For this reason, it is not possible to exclude or account for the variability of values, which may influence the interpretation of the results.
Therefore, some of the observed increases in tip resistance and shaft friction may be purely random. Adding a few additional CPT measurements could yield different averages—either lower or higher. However, from a qualitative perspective, the records indicate that the installation of individual driven piles increased the shear modulus Gmax of the gravel and clay soil layers.
While the observed effect raises little concern, it does qualify applying in situ tests to analysis of pile response, as mentioned in [48]. It would be of interest to see the results of similar measurements on installation effect—for driven piles as well as for other types of piles and in different types of soils. In [32], it was demonstrated that the intensity of ground vibrations is strongly affected by soil resistance along the pile shaft and at the pile toe.
In the analysis of P-waves, it is very difficult to distinguish whether the P-wave reaches the accelerometers directly through the soil, which is preferred, or if it enters the probe rod at some distance above the geophones. In the latter case, the wave would travel through the rods at a higher velocity, leading to errors in picking the first arrival. This issue has been observed and described by [18]. For this reason, the evaluation of P-waves was not included in the results.
During the pile driving, a slight uplift of the adjacent terrain occurred. This effect would be interesting to observe and measure using the laser scan method as specified in [49]; subsequently, these results could be used and validated with numerical simulations.

5. Conclusions

The results of the SCPT investigations conducted at the given site appear to be valid, yielding relatively good outcomes based on the comparison of shear wave velocities at different intervals. However, since the analyses in this study were based on investigations from a single location, it cannot be stated that the results are equally valid and accurate for all soil types and various conditions. To thoroughly examine how well SCPT measures the specified parameters, a setup similar to this study could be used while incorporating a greater variety of soil types. It would also be interesting to see the results of a similar measurement of the installation effect for other types of pile technology and in different types of soil.
SCPTu is a faster and less invasive method than traditional laboratory tests. It provides continuous measurements with high resolution compared to traditional point sampling. It helps in the analysis of seismic wave propagation in the subsoil, from which it is possible to obtain deformation characteristics of the soil, necessary for innovative methods of assessing structures, and appears to be a suitable method for controlling the quality of earthworks.
Some calculation methods include precise constants in the CPT-based pile response calculation. Often, much of this precision is not justified and supported by measurements. It would be interesting to compare the results of determining the bearing capacity or settlement of the pile using the results before and after the driving process.
The disadvantage of this study is the limited number of tests performed, and it would be appropriate to support these data with more measurements and then subject the data to statistical analysis, which would make the study more robust.

Author Contributions

Conceptualization, F.G. and J.M. (Ján Mihálik); methodology, J.V. and M.D.; software, J.M. (Ján Mihálik); validation, J.V., F.G. and J.M. (Jarosław Michałek); formal analysis, G.N. and M.D.; investigation, G.N. and J.M. (Ján Mihálik); resources, F.G.; data curation, J.M. (Jarosław Michałek); writing—original draft preparation, J.V.; writing—review and editing, M.D.; visualization, J.V.; supervision, M.D.; project administration, F.G.; funding acquisition, F.G. All authors have read and agreed to the published version of the manuscript.

Funding

This research was funded by Operational Programme Integrated Infrastructure: Application of Innovative Technologies Focused on the Interaction of Engineering Constructions of Transport Infrastructure and the Geological Environment, ITMS2014+ code 313011BWS1. The project is co-funded by the European Regional Development Fund. This work was supported by the Grant National Agency VEGA of the Slovak Republic under Grant No. 1/0009/2023.

Data Availability Statement

Due to the nature of this research, participants in this study did not agree to their data being shared publicly; data are only available upon reasonable request.

Conflicts of Interest

The authors declare no conflict of interest.

References

  1. Škvarka, J.; Bednárová, E.; Slávik, I. Analysis of Soil Susceptibility to Internal Suffusion in Selected Sites for Impoundment Objects. IOP Conf. Ser. Earth Environ. Sci. 2019, 221, 012011. [Google Scholar] [CrossRef]
  2. Muzik, J.; Sitányiová, D.; Vondráčková, T.; Škoda, S. Hydrogeological Survey Data Analysis of Landslide Area by GIS Tools. Procedia Earth Planet. Sci. 2015, 15, 376–381. [Google Scholar] [CrossRef]
  3. Stacho, J.; Súlovska, M.; Slavik, I. Analysis of the Shear Strength of a Soil-Geosynthetic Interface. Civ. Environ. Eng. 2023, 19, 452–463. [Google Scholar] [CrossRef]
  4. Putiška, R.; Marschalko, M.; Yilmaz, I.; Niemiec, D.; Cheng, X.; Dostal, I.; Kubáč, J. Surface Geophysical Methods Used to Verify the Karst Geological Structure in the Built-up Area: A Case Study of Specific Engineering-Geological Conditions. Acta Geol. Sin. 2021, 95, 1763–1770. [Google Scholar] [CrossRef]
  5. Kovářík, K.; Mužík, J.; Sitányiová, D. A Fractional Step Local Boundary Integral Element Method for Unsteady Two-Dimensional Incompressible Flow. Eng. Anal. Bound. Elem. 2014, 44, 55–63. [Google Scholar] [CrossRef]
  6. Liao, T.; Mayne, P.W. Post Processing of Cone Penetration to Assess Seismic Ground Hazards, with Specific Application to the New Madrid Seismic Zone; MAE Center Report 07–09; Mid-America Earthquake Center: Urbana, IL, USA, 2007. [Google Scholar]
  7. Bulko, R.; Mužík, J.; Cigáň, F. Slope Stability Using Self-Drilling Anchor Rods. Civ. Environ. Eng. 2024, 20, 1267–1275. [Google Scholar] [CrossRef]
  8. Muszyński, Z.; Rybak, J. Horizontal Displacement Control in Course of Lateral Loading of a Pile in a Slope. IOP Conf. Ser. Mater. Sci. Eng. 2017, 245, 032002. [Google Scholar] [CrossRef]
  9. Wistuba, M.; Malik, I.; Gorczyca, E.; Ślęzak, A. Establishing Regimes of Landslide Activity—Analysis of Landslide Triggers over the Previous Seven Decades (Western Carpathians, Poland). CATENA 2021, 196, 104888. [Google Scholar] [CrossRef]
  10. Bujňaková, P.; Kraľovanec, J.; Perkowski, Z.; Bouchair, A. Verification of Precast Concrete Girder Bridge Under Static Load. Civ. Environ. Eng. 2022, 18, 760–767. [Google Scholar] [CrossRef]
  11. Ižvolt, L.; Dobeš, P.; Mečár, M. Diagnostics of the Deformation Resistance of the Track Bed in the Inter-Station Section Palárikovo-Nové Zámky-Track No. 1. Civ. Environ. Eng. 2023, 19, 280–287. [Google Scholar] [CrossRef]
  12. Kozel, M.; Remek, Ľ.; Ďurínová, M.; Šedivý, Š.; Šrámek, J.; Danišovič, P.; Hostačná, V. Economic Impact Analysis of the Application of Different Pavement Performance Models on First-Class Roads with Selected Repair Technology. Appl. Sci. 2021, 11, 10409. [Google Scholar] [CrossRef]
  13. Garofalo, F.; Foti, S.; Hollender, F.; Bard, P.Y.; Cornou, C.; Cox, B.R.; Dechamp, A.; Ohrnberger, M.; Perron, V.; Sicilia, D.; et al. InterPACIFIC Project: Comparison of Invasive and Non-Invasive Methods for Seismic Site Characterization. Part II: Inter-Comparison between Surface-Wave and Borehole Methods. Soil Dyn. Earthq. Eng. 2016, 82, 241–254. [Google Scholar] [CrossRef]
  14. Garofalo, F.; Foti, S.; Hollender, F.; Bard, P.Y.; Cornou, C.; Cox, B.R.; Ohrnberger, M.; Sicilia, D.; Asten, M.; Di Giulio, G.; et al. InterPACIFIC Project: Comparison of Invasive and Non-Invasive Methods for Seismic Site Characterization. Part I: Intra-Comparison of Surface Wave Methods. Soil Dyn. Earthq. Eng. 2016, 82, 222–240. [Google Scholar] [CrossRef]
  15. Cox, B.R.; Stolte, A.C.; Stokoe, K.H.; Wotherspoon, L.M. A Direct-Push Crosshole (DPCH) Test Method for the in Situ Evaluation of High-Resolution P- and S-Wave Velocities. Geotech. Test. J. 2019, 42, 1101–1132. [Google Scholar] [CrossRef]
  16. Agaiby, S. Advancements in the Interpretation of Seismic Piezocone Tests in Clays and Other Geomaterials. Ph.D. Thesis, School of Civil and Environmental Engineering, Georgia Institute of Technology, Atlanta, GA, USA, 2018. [Google Scholar]
  17. Şahin, A. The Assessment of Seismic Liquefaction Triggering of Gravelly Soils. Master’s Thesis, School of Natural and Applied Sciences of Middle East Technical University, Ankara, Turkey, 2023. [Google Scholar]
  18. Granskär, J. Evaluation of SCPT-Surveys as Method for Accessing Dynamic Modulus. Master’s Thesis, Department of Civil, Environmental and Natural Resources Engineering, University of Technology, Lulea, Sweden, 2018. [Google Scholar]
  19. Jedrysiak, N.; Bagińska, I. Rozpoznanie Podłoża Gruntowego Sondą SCPTU. Górnictwo Geoinżynieria 2010, 33, 341–349. [Google Scholar]
  20. Niazi, F.S. Static Axial Pile Foundation Response Using Seismic Piezocone Data. Ph.D. Thesis, School of Civil and Environmental Engineering, Georgia Institute of Technology, Atlanta, GA, USA, 2014. [Google Scholar]
  21. Randolph, M.F.; Wroth, C.P. A Simple Approach to Pile Design and the Evaluation of Pile Tests; ASTM Special Technical Publications: West Conshohocken, PA, USA, 1979; pp. 484–499. [Google Scholar]
  22. Wang, Z.; Zhang, N.; Cai, G.; Li, Q.; Wang, J. Field Investigation of Maximum Dynamic Shear Modulus of Clay Deposit Using Seismic Piezocone. Int. J. Civ. Eng. 2019, 17, 699–708. [Google Scholar] [CrossRef]
  23. Mayne, P.W.; Rix, G.J. Correlations Between Shear Wave Velocity and Cone Tip Resistance in Natural Clays. Soils Found. 1995, 35, 107–110. [Google Scholar] [CrossRef] [PubMed]
  24. Lin, S.; Lu, Y.; Zhao, C. Influence of Soil Plugging on Dynamic Soil Response During Simulated Pipe Pile Driving Model Test in Sands. Appl. Sci. 2024, 14, 10425. [Google Scholar] [CrossRef]
  25. Ku, T.; Mayne, P.W.; Cargill, E. Continuous-Interval Shear Wave Velocity Profiling by Auto-Source and Seismic Piezocone Tests. Can. Geotech. J. 2013, 50, 382–390. [Google Scholar] [CrossRef]
  26. Mir Mohammad Hosseini, S.M.; Hajimohammadi, A.; Hajimohammadi, A. The Validity Assesment of Laboratory Shear Modolus Using In-Situ Seismic Piezocone Test Results. Int. J. Civ. Eng. 2010, 8, 134–142. [Google Scholar]
  27. Wang, H.; Wu, S.; Qi, X.; Chu, J. Site Characterization of Reclaimed Lands Based on Seismic Cone Penetration Test. Eng. Geol. 2021, 280, 105953. [Google Scholar] [CrossRef]
  28. Liu, P.; Li, X.; Wang, Y.; Wang, L.; Song, Z. Statistical Characteristics of Soil Dynamics in the Beijing-Tianjin-Hebei Region and Their Impacts on Structural Seismic Analyses. Buildings 2025, 15, 3382. [Google Scholar] [CrossRef]
  29. Grizi, A.; Athanasopoulos-Zekkos, A.; Woods, R.D. Ground Vibration Measurements near Impact Pile Driving. J. Geotech. Geoenviron. Eng. 2016, 142, 04016035. [Google Scholar] [CrossRef]
  30. Fellenius, B. Increase of CPT Cone Resistance in Sand Due to Installation of Press-in Piles. DFI J. 2022, 16, 1–7. [Google Scholar] [CrossRef]
  31. Massarsch, K.R.; Fellenius, B.H. Engineering Assessment of Ground Vibrations Caused by Impact Pile Driving. Geotech. Eng. J. SEAGS AGSSEA 2015, 46, 54–63. [Google Scholar]
  32. Massarsch, K.R. Ground Vibrations Caused by Impact Pile Driving. In Environmental Vibrations: Prediction, Monitoring, Mitigation and Evaluation (ISEV 2005); CRC Press: London, UK, 2021; pp. 369–379. ISBN 978-1-00-320937-9. [Google Scholar]
  33. Bekbasarov, I.; Shanshabayev, N.; Atenov, Y. Impact-Driven Penetration of Multi-Strength Fiber Concrete Pyramid-Prismatic Piles. Buildings 2024, 14, 3595. [Google Scholar] [CrossRef]
  34. Tol Van, A.F. Funderingstechnieken, Faculteit der Civiele Techniek Vakgroep Waterbouwkunde Sectie Geotechniek. 1994; pp. 24–42. Available online: https://repository.tudelft.nl/record/uuid:828b5167-0d9c-4ccb-b595-55a75d3f3c3c (accessed on 2 October 2025).
  35. Duan, W.; Cai, G.; Yuan, J.; Liu, S. Evaluation of the Variation of Deformation Parameters Before and After Pile Driving Using SCPTU Data. In Proceedings of China-Europe Conference on Geotechnical Engineering; Wu, W., Yu, H.-S., Eds.; Springer Series in Geomechanics and Geoengineering; Springer International Publishing: Cham, Switzerland, 2018; pp. 689–693. ISBN 978-3-319-97111-7. [Google Scholar]
  36. Stacul, S.; Fiera, F.; Perini, M.; Pagani, E.; Siviero, M.; Presti, D. On the Assessment of Compression and Shear Wave Velocities via Seismic Cone Penetration Test and Comparisons with Other Geophysical Tests at Different Sites. J. GeoEng. 2024, 19, 160–169. [Google Scholar] [CrossRef]
  37. Lo Presti, D.; Fiera, F.; Perini, M.; Pagani, E.; Siviero, M.; Stacul, S. Use of Seismic Piezocone for the Assessment of the Propagation Velocity of Body Waves. Riv. Ital. Geotec. 2024, 1281, 90–98. [Google Scholar] [CrossRef]
  38. Koreta, O.; Augustesen, A.; Krogh, L.; Lundvig, K.; Bøtker-Rasmussen, S. On the Accuracy and Precision of the Seismic Cone Penetration Test—A Field Test Study on the Seismic Source. In Cone Penetration Testing 2022; CRC Press: London, UK, 2022; pp. 177–183. [Google Scholar]
  39. Wair, B.R.; DeJong, J.T.; Shantz, T. Guidelines for Estimation of Shear Wave Velocity Profiles; Pacific Earthquake Engineering Research Center, University of California: Berkeley, CA, USA, 2012; pp. 1–95. [Google Scholar]
  40. Stolte, A.C.; Cox, B.R. Towards Consideration of Epistemic Uncertainty in Shear-Wave Velocity Measurements Obtained via Seismic Cone Penetration Testing (SCPT). Can. Geotech. J. 2020, 57, 48–60. [Google Scholar] [CrossRef]
  41. Mayne, P.; Cargill, E.; Greig, J. The Cone Penetration Test: Better Information; ConeTec Group: Burnaby, BC, Canada, 2023. [Google Scholar]
  42. Firouzianbandpey, S.; Nielsenl, B.N.; Andersen, L.V.; Ibsen, L.B. Geotechnical Site Assessment by Seismic Piezocone Test in North of Denmark. In Proceedings of the 17th International Conference on Case Histories in Geotechnical Engineering, Chicago, IL, USA, 6–8 May 2013; pp. 1–11. [Google Scholar]
  43. Robertson, P.; Cabal, K. Cone Penetration Testing Guide to, 7th ed.; Gregg Drilling LLC: Walnut Ave, CA, USA, 2023; pp. 1–165. [Google Scholar]
  44. Gottardi, G.; Tonni, L. Cone Penetration Testing 2022: Abstracts Volume, 1st ed.; CRC Press: London, UK, 2022; ISBN 978-1-00-332909-1. [Google Scholar]
  45. Holmsgaard, R.; Ibsen, L.B.; Nielsen, B.N. Interpretation of Seismic Cone Penetration Testing in Silty Soil. Electron. J. Geotech. Eng. 2016, 21, 4759–4779. [Google Scholar]
  46. Iliescu, A.; Geron, J. Seismic Cone Penetration Test. Experimental Results in Onshore Areas. Geol. Eng. Environ. Sci. 2012. Available online: https://projekter.aau.dk/projekter/files/63666390/Article1Experimental.pdf (accessed on 2 October 2025).
  47. Miller, G.A.; Abuawad, T.Z.; Nevels, J. Demonstration of the Applicability of the New CPTU/SCPTU Correlations with Soil Parameter Evaluation; Sci. Report Federal Highway Administration, Department of Transportation Oklahoma: Oklahoma, OK, USA, 2022; pp. 1–184. [Google Scholar]
  48. Leetsaar, L.; Korkiala-Tanttu, L. Advantages of Using a Seismic Piezocone Penetration Test for Analysis of a Single Screw in Situ Displacement Pile in Silty Soils. Indian Geotech. J. 2025, 55, 802–815. [Google Scholar] [CrossRef]
  49. Farbák, M.; Chromčák, J.; Bačová, D.; Odrobiňák, J. Investigation of Actual In-Plane Geometric Imperfections of Steel Tied-Arch Bridges. Appl. Sci. 2023, 13, 6393. [Google Scholar] [CrossRef]
Figure 1. Location of the testing site and general geological conditions.
Buildings 15 04127 g001
Figure 2. Grain size curves for soils from boreholes.
Buildings 15 04127 g002
Figure 3. Geological cross-section.
Buildings 15 04127 g003
Figure 4. Implementation of pile driving and construction site plan.
Buildings 15 04127 g004aBuildings 15 04127 g004b
Figure 5. Implementation and course of wave propagation through the environment.
Buildings 15 04127 g005
Figure 6. Penetration apparatus and SCPTu probe.
Buildings 15 04127 g006
Figure 7. Comparison of SCPTu probing, (a) SCPTu-1 before and (b) SCPTu-2 after pile driving.
Buildings 15 04127 g007
Figure 8. Ground wave velocities before and after pile driving.
Buildings 15 04127 g008
Figure 9. Shear modulus propagation obtained from empirical methods and field test results.
Buildings 15 04127 g009
Table 1. Results of bulk density of soils.
LayerAnthropogenicClayGravel
SCPTu-1γt [kN/m3]17.116.718.7
SCPTu-2γt [kN/m3]17.617.719.1
Table 2. Results of Gmax measurements for given depth intervals.
Depth Interval
[m]
Gmax [MPa]
Before Piling
Gmax [MPa]
After Piling
Gmax11.25–1.750.10.1
Gmax21.75–2.2573.2187.5
Gmax32.25–2.7568.0665.4
Gmax42.75–3.25989.41535.7
Gmax53.25–3.75554.4875.5
Table 3. Results of Gmax measurements of soils.
Depth Interval
[m]
Gmax [MPa]
Before Piling
Gmax [MPa]
After Piling
Gmax10.00–2.0021.852.9
Gmax22.00–2.5062.1306.5
Gmax33.00–3.75510.4888.7
Disclaimer/Publisher’s Note: The statements, opinions and data contained in all publications are solely those of the individual author(s) and contributor(s) and not of MDPI and/or the editor(s). MDPI and/or the editor(s) disclaim responsibility for any injury to people or property resulting from any ideas, methods, instructions or products referred to in the content.