Article

Study on Cumulative Deformation of Silt Soil Under Traffic Loading Based on PSO-BP Neural Network

1
School of Civil Engineering, Qingdao University of Technology, Qingdao 266033, China
2
China Institute of Water Resources and Hydropower Research, Beijing 100038, China
3
State Key Laboratory of Safety, Durability and Healthy Operation of Long Span Bridges, Nanjing 210012, China
4
School of Civil Engineering, Southeast University, Nanjing 211189, China
5
School of Civil and Architectural Engineering, Jiangsu University of Science and Technology, Zhenjiang 212000, China
6
Taizhou Survey and Design Institute of Communications Co., Ltd., Taizhou 318000, China
7
Inner Mongolia Urban Planning and Municipal Design and Research Institute Limited, Hohhot 010000, China
8
China Railway 17th Bureau Group Co., Taiyuan 030000, China
*
Authors to whom correspondence should be addressed.
Buildings 2025, 15(22), 4126; https://doi.org/10.3390/buildings15224126 (registering DOI)
Submission received: 22 October 2025 / Revised: 9 November 2025 / Accepted: 14 November 2025 / Published: 16 November 2025
(This article belongs to the Section Building Structures)

Abstract

In order to investigate the cumulative deformation characteristics of silt soil in highway subgrade engineering, dynamic triaxial tests were carried out to examine the influences of dynamic stress, confining pressure, and moisture content on the cumulative plastic strain of silt soil under traffic loading conditions. Particle Swarm Optimization (PSO) is employed to enhance the prediction performance of cumulative plastic strain in silt soils. Specifically, the architecture of the traditional Backpropagation (BP) neural network is optimized for its learning process, and weight parameters are introduced to achieve more effective control over the development and analysis of prediction results. Furthermore, this optimized neural network also enables more accurate predictions regarding multiple influencing factors, which further improves the overall accuracy of the prediction outcomes. The results show that. The cumulative deformation of the silt soil decreases gradually with increasing confining pressure. The cumulative deformation decreases from 3.32 percent to 2.82 percent when the confining pressure increases from 60 kPa to 150 kPa. With the increase in dynamic stress and moisture content, the cumulative deformation gradually increases. The cumulative deformation rate was derived from the cumulative deformation and the number of loading cycles, and it was found that the cumulative deformation rate decreases gradually with the increase in the number of cycles. Specifically, when the moisture content is 17.4%, the cumulative deformation rate decreases from 0.3912 to 4.54 × 10⁻⁵ as the number of cycles increases from 1 to 10,000. Based on the cumulative deformation test data of silt soil, the Monismith model was applied to predict plastic deformation. Meanwhile, a cumulative plastic deformation prediction model was constructed by leveraging the learning capability of the PSO-BP neural network, which incorporates multiple influencing factors including moisture content, confining pressure, and dynamic stress magnitude. By comparing the three cumulative deformation prediction models (i.e., the Monismith model, the traditional BP neural network model, and the PSO-BP neural network model), it was found that the PSO-BP neural network model exhibits the optimal prediction performance, with its correlation coefficient (R2) all exceeding 0.99.

1. Introduction

Silt soil is widely distributed in coastal and riverine areas of China, and thus has a close connection with engineering projects such as ports, airports, underground facilities, highways, and tunnels. Due to its characteristics of low strength, high creep, and high sensitivity, silt soil has attracted extensive attention in relevant engineering fields. During the long-term geological evolution process, silt soil is affected by the combined action of stress history, stress conditions, drainage conditions, and structural properties [1,2,3]. The aforementioned characteristics of silty soils result in the regionalization and complexity of their physical and mechanical properties, which in turn affect the stability and durability of engineering projects such as highways. However, due to the concealment of subgrade defects and the difficulty in monitoring the deformation induced by traffic loading, investigating how different factors influence the deformation of silty soils is of great significance for addressing road engineering problems.
Many scholars have studied the dynamic characteristics and permanent deformation prediction of soft soil [4,5,6]. Feng et al. [7] investigated the dynamic deformation characteristics and dynamic strength characteristics of saturated silt sandy soil under different states of consolidation stress by dynamic triaxial tests. Then, a preliminary study of the effect of the ratio of silt and sand content on the dynamic characteristics of silty sandy soil. Lei et al. [8] investigated the effects of consolidation confining pressure and dynamic stress on the dynamic strength of silt soil through dynamic triaxial tests of silt soil in Fuzhou area, and established empirical relationships between the confining pressure, vibration frequency and the dynamic strength of soil; Xuanwei et al. [9] reported the effects of particle size, particle grading and silt content on the liquefaction resistance of silt sandy soils through dynamic triaxial tests on remodeled silt sandy soil specimens with different ratios; Li XL et al. [10] Characteristics of stress–strain waveforms in rock masses studied by uniaxial loading based on the Hilbert-Yellow transformation; Li HT et al. [11] compressive behaviour and damage characteristics of steel-fibre imitation concrete under uniaxial loading are investigated; However, most of the tests have a wide range of dynamic stress, and few of them have been conducted to study the cumulative plastic strain with a small range of dynamic stress floating, for which this paper develops the tests.
Research on the deformation evolution characteristics of roadbed structures based on dynamic triaxial tests has been widely reported [12,13,14,15,16,17,18,19], and then various models for predicting the cumulative plastic strain have been proposed [12,13,14,15,16,19,20,21]. These models account for the material’s physical properties, cycles and stress levels. He et al. [22] presented a model for the macroscopic development and internal structural changes in the cumulative deformation of coarse-grained soil when subjected to traffic loading. Furthermore, A comprehensive prediction model for the cumulative deformation of coarse-grained soil was established.
In addition, a new prediction method for roadbed deformation has appeared. Both machine learning methods start late but develop rapidly and have unique advantages, especially in solving the nonlinear problem with significant effect. Wang et al. [23] developed a structurally optimal artificial neural network (ANN) prediction model and optimized the model using the particle swarm optimization (PSO) algorithm. A critical dynamic stress prediction model considering the parameters affected by elastic modulus and cumulative plastic strain was developed, and the performance and accuracy of the model were verified by supplementary analysis. Sun et al. [24] and others established a particle swarm optimization-backpropagation-based cumulative plastic strain prediction model for clay based on triaxial test results. In this model, Freezing and thawing processes and loading cycles are considered. The model’s predictive performance is validated and compared with traditional regression models. Most scholars have predicted the mechanical properties of soil through neural networks [25,26]. However, most of them only use neural network for prediction, and only one factor is considered, and it is not compared with some traditional models and unoptimized models, and there are very few studies on the prediction of cumulative deformation of silt soil for this paper, this paper is based on the inadequacy of the three models to predict the cumulative deformation of silt soil of multiple factors and compare the advantages and disadvantages of each model.
The aim of this study is to investigate the cumulative deformation law of silt soil under different confining pressure, dynamic stress and Moisture content conditions. The particle swarm optimisation algorithm is used to perform the global optimum search, to assign values to the weights and thresholds of the BP neural network, to optimise the traditional BP model, and to study the comparison between the BP model and the particle swarm optimised BP model and the traditional model, with the intention of exploring the effect of PSO-BP neural network on the prediction of cumulative deformation. To provide guidance for practical engineering applications.

2. Materials and Methods

2.1. Materials

Silt soil samples with a specific depth were collected in Taizhou City, Zhejiang Province. After collection, the silt soil samples were placed in sealed bags for preservation and transported to the laboratory for subsequent tests. The silt soil exhibited a grey color. The collected fill soil was first air-dried, subsequently crushed, and finally sieved through a 2 mm sieve to obtain the particle gradation of the silt soil, as shown in Figure 1. The obtained soil had a uniformity coefficient (Cu) of 8 and a curvature coefficient (Cc) of 0.7, which was classified as poorly graded soil. This processed soil filler served as the test material. Subsequently, the basic physical property test was carried out according to the standard of JTG 3430-2020 [27], and the basic physical properties of the test soil samples were determined by liquid-plastic limit apparatus and compaction apparatus, and the results are shown in Table 1.

2.2. Testing Methodology

Five sets of dynamic triaxial tests were conducted on silty soil samples under different moisture content (17.4–21.4%) and confining pressure conditions. For the test soil filler, it was first dried in an oven; subsequently, the soil was adjusted to the specified moisture content, sealed in bags, and allowed to stand for 24 h for moisture equilibrium, followed by specimen preparation. The prepared specimens had a diameter of 50 mm and a height of 100 mm. In accordance with the specification JTG 3430-2020, the specimens were prepared in five layers using the wet layered compaction method, with a compaction degree of 95%. The dynamic triaxial tests were initiated after the specimens were prepared.
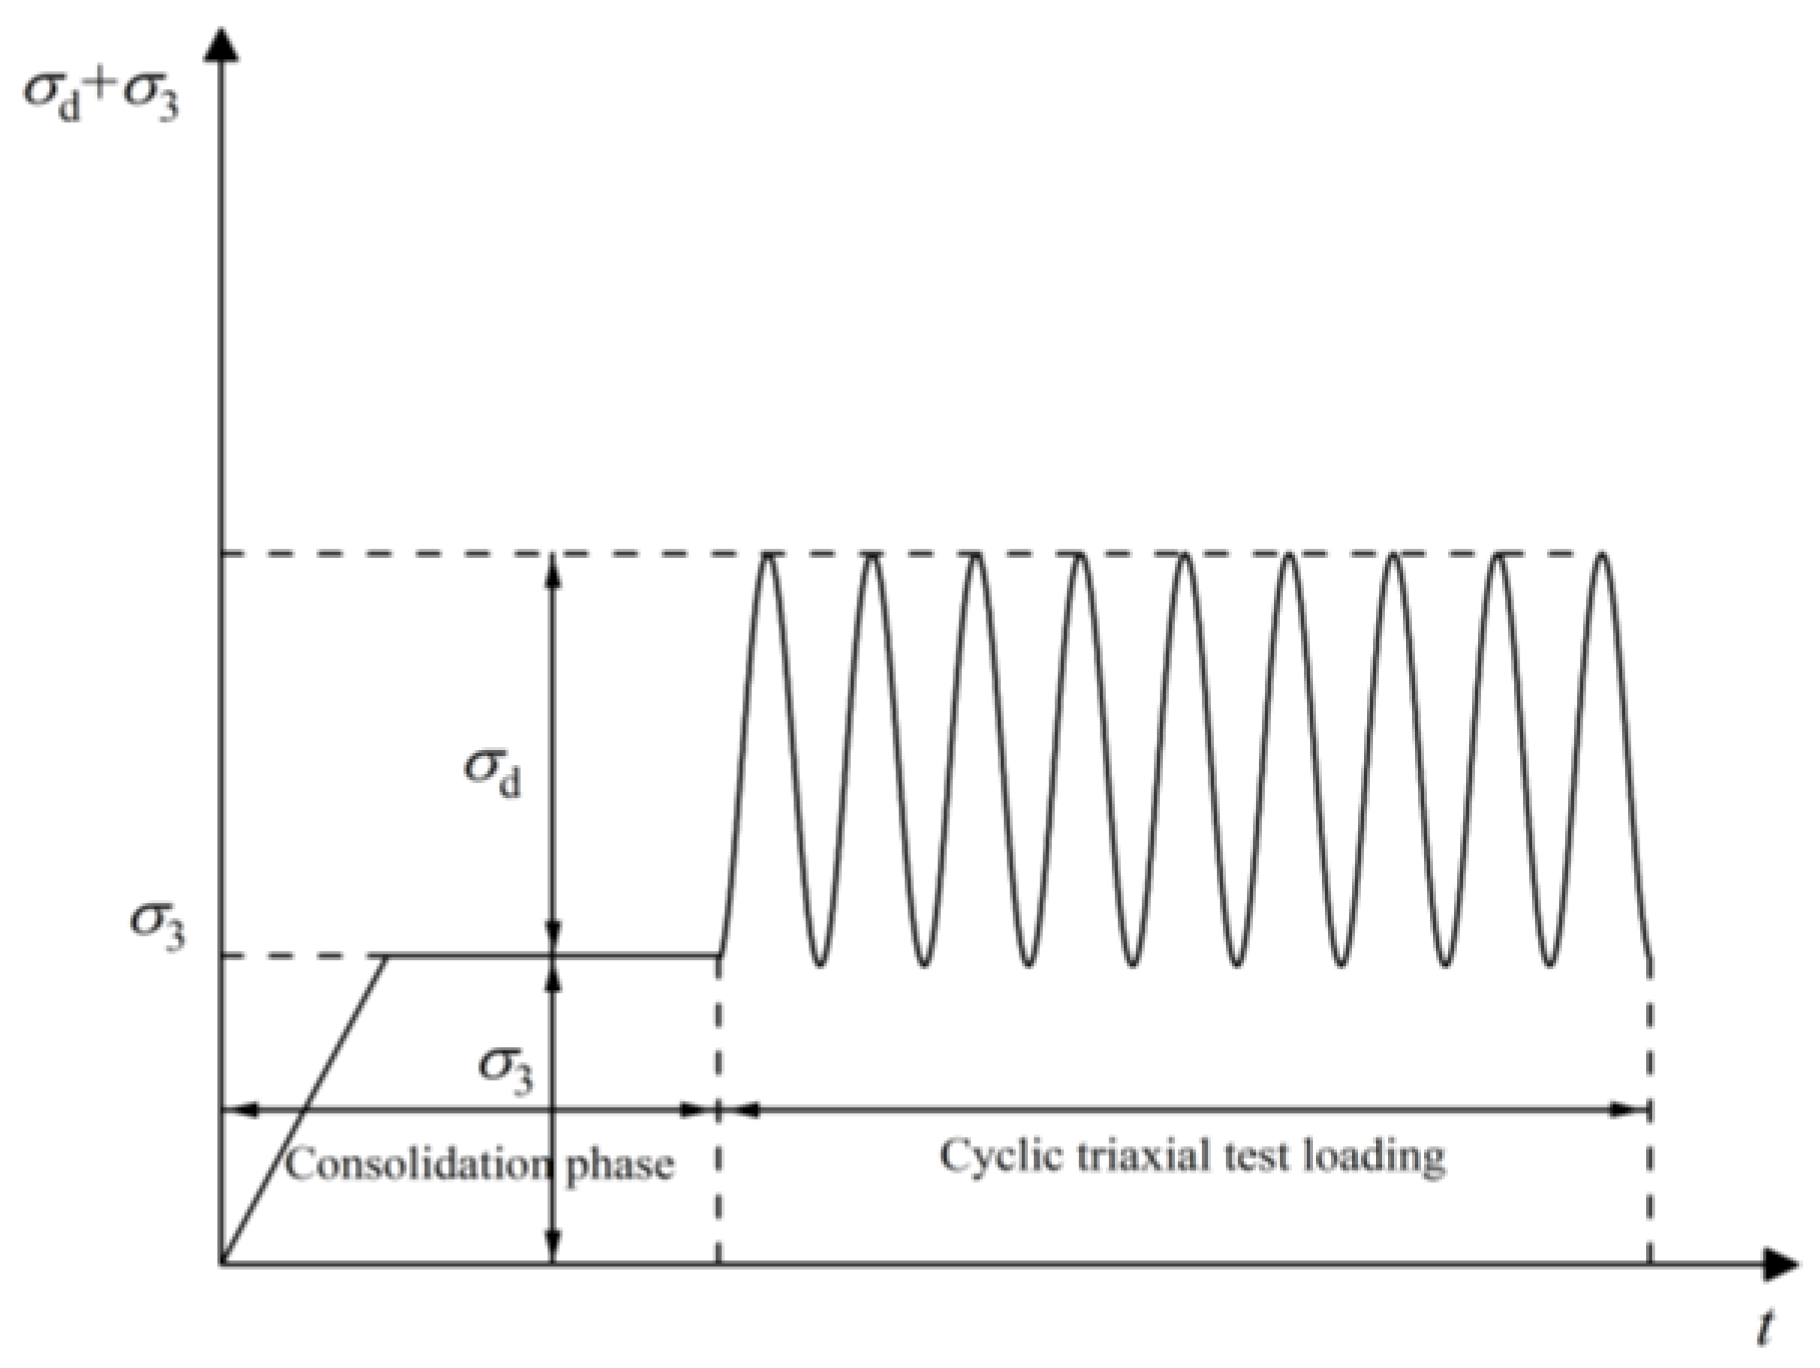
In this paper, the test confining pressure was set to be consistent with the lateral earth pressure at the corresponding position of the road, with a value range of 60–150 kPa. The dynamic triaxial tests were conducted using a GDS dynamic triaxial testing machine (see Figure 2), and a total of four sets of tests were completed (see Table 2). The loading method is illustrated in Figure 3: a half-sine waveform with a frequency of 1 Hz was adopted, and the test was terminated when either the number of vibrations (N) reached 10,000 or the cumulative plastic strain reached 5%. In the figure, σs + σd represents the peak value of the vibration waveform, while σs − σd represents the valley value of the vibration waveform. For each moisture content group, five dynamic stress levels were set; this design aimed to investigate the cumulative deformation characteristics of the filler under different dynamic stress conditions and to obtain the deformation response of the filler from the stable state to the damaged state.

3. Results

3.1. Axial Cumulative Plastic Strain Analysis

Effect of Confining Pressure on Cumulative Plastic Strain

Figure 4 presents the variation curves of axial cumulative plastic strain of silt soil with the number of cyclic loads under different confining pressures. It can be observed that the deformation rate of the specimens gradually decreases as the confining pressure increases. Specifically, under a cyclic dynamic stress of 250 kPa, the axial cumulative plastic strain decreases by 49% at the end of loading, indicating that the increase in confining pressure can effectively mitigate the axial deformation of the soil mass. In general, when the cyclic dynamic stress is consistent, the elevation of confining pressure enhances the interparticle occlusion effect and improves the soil’s resistance to cyclic loading.

3.2. Effect of Dynamic Stress on Cumulative Plastic Strain

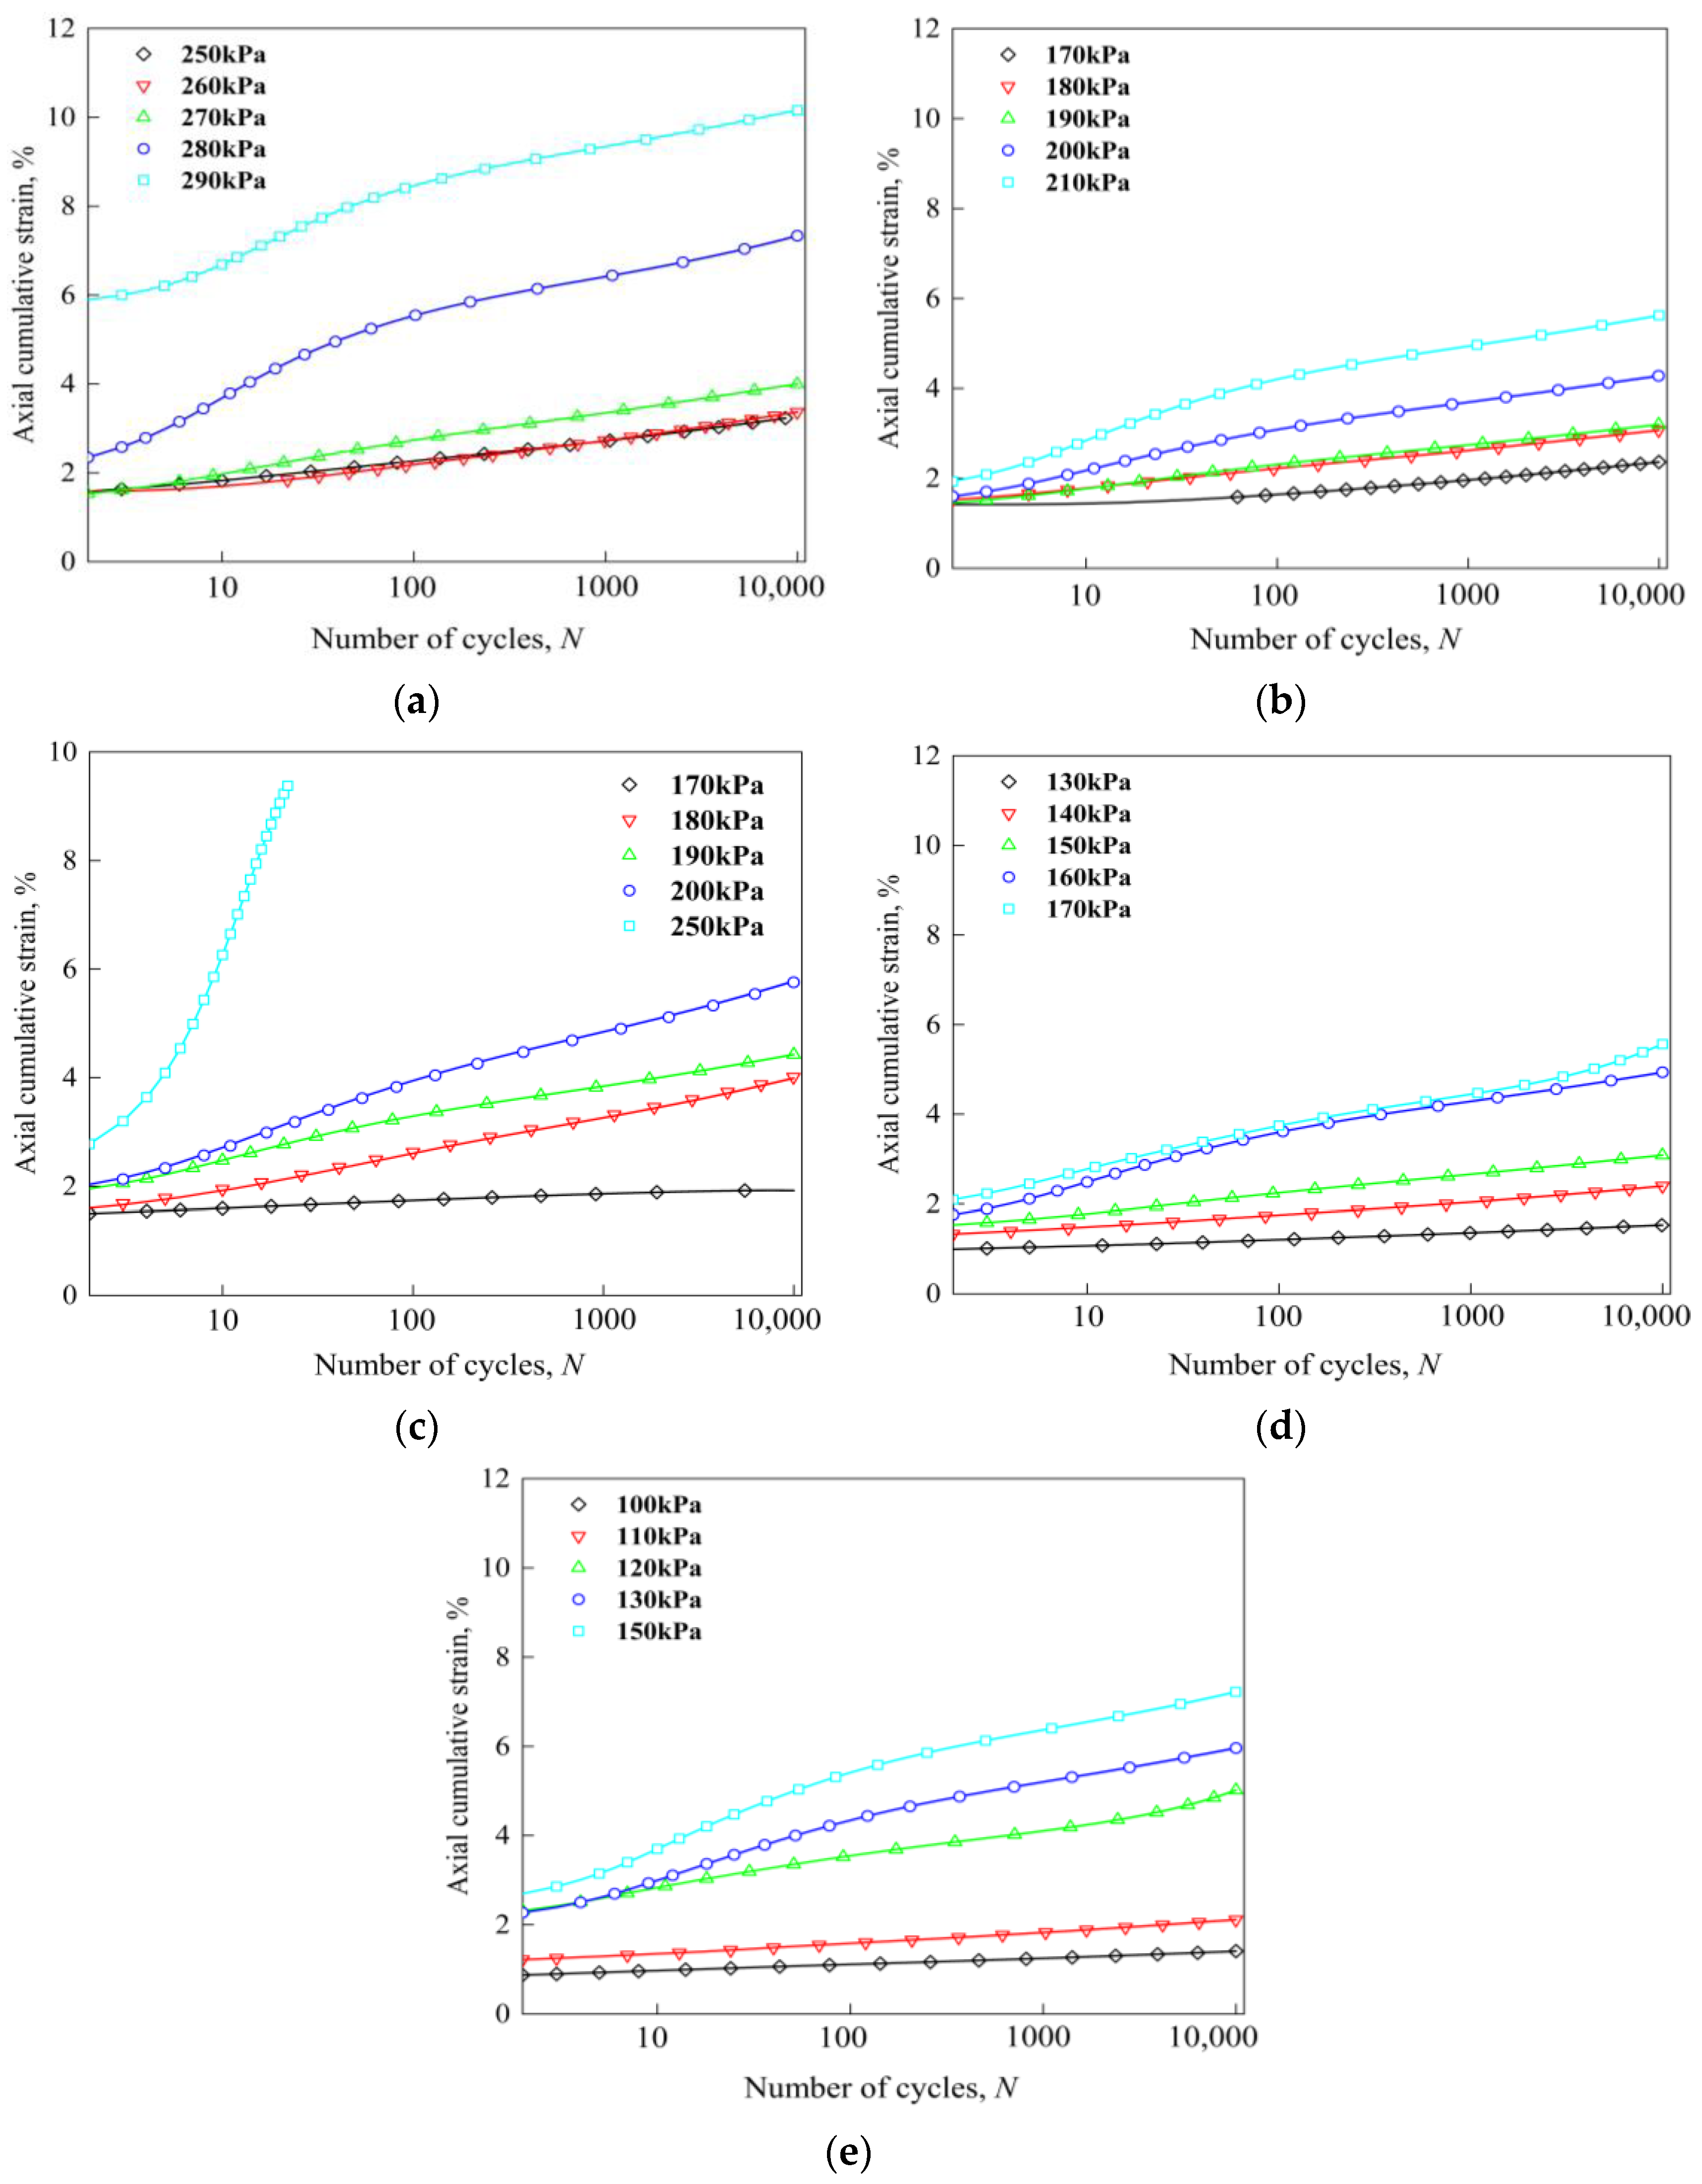
Plastic creep refers to a significant plastic deformation of the material induced by an increase in the applied dynamic load, followed by the accumulation of plastic deformation with the increase in the number of cycles, and ultimately the failure of the material after a large number of cycles. As shown in Figure 5a, under constant moisture content and confining pressure, the axial cumulative plastic strain of the specimen increases continuously with the increase in dynamic stress. When the dynamic stress is low, the internal structural characteristics of the soil are sufficient to resist the cyclic loading; the cumulative deformation first increases rapidly from 1.76% to 3.22% and then tends to stabilize, indicating that the specimen exhibits plastic creep behavior [28].
With an increase in the number of cyclic loads, the rate of axial strain growth of the specimen gradually slows down and eventually plateaus. After logarithmic transformation, the axial cumulative plastic strain exhibits an approximate linear relationship with the number of load cycles. Furthermore, when the amplitude of the applied cyclic dynamic stress is large (exceeding the plastic creep limit), the internal structural stability of the soil mass is insufficient to resist the cyclic loading, causing the specimen to enter the yield stage and exhibit incremental collapse behavior.
The axial cumulative plastic strain continues to increase, ultimately leading to structural failure. Figure 5b illustrates that for the specimen with a moisture content of 18.3% and a confining pressure of 90 kPa, the deformation rate gradually increases as the dynamic stress increases, and the axial cumulative plastic strain at the end of loading increases accordingly. Consequently, the soil mass transitions from plastic creep to incremental damage. This indicates that an increase in the dynamic stress amplitude induces a transition in the stability state of the soil samples from plastic creep to incremental damage.

3.3. Effect of Moisture Contents on Cumulative Plastic Strain

The cumulative deformation of silt soil filler affected by moisture content is presented in Figure 5 and Figure 6, which, respectively, depict the development of axial cumulative plastic strain with the number of vibrations and the relationship between axial cumulative plastic strain and dynamic stress for silt soil under different moisture contents. Specifically, it can be observed from Figure 5a–e that the cumulative plastic strain tends to increase with the increase in dynamic stress. Moreover, under different moisture content conditions, as the moisture content increases, the dynamic stress required for the specimen to reach the 5% cumulative plastic strain (i.e., damage criterion) gradually decreases. Among them, the dynamic stress required for damage in Figure 5c–e has decreased to below 200 kPa [29].
Furthermore, it can be observed from Figure 6 that the axial cumulative plastic strain–dynamic stress curve of silt soil shifts leftward with the increase in moisture content. Specifically, as moisture content increases, lower dynamic stress is required for the specimen to achieve the corresponding cumulative deformation. The axial cumulative plastic strain of the specimens follows the order: 21.4% > 20.4% > 19.4% > 18.4% > 17.4% with increasing moisture content. That is, the silt soil specimens exhibit the minimum axial cumulative plastic strain at the optimal moisture content. This is because water acts as a lubricant between soil particles; the soil mass has the most stable structure at the optimal moisture content, while either an increase or decrease in moisture content tends to induce structural damage to the specimens, leading to irreversible plastic deformation of the soil mass.

3.4. Change Rule of Axial Strain Rate Under Different Factors

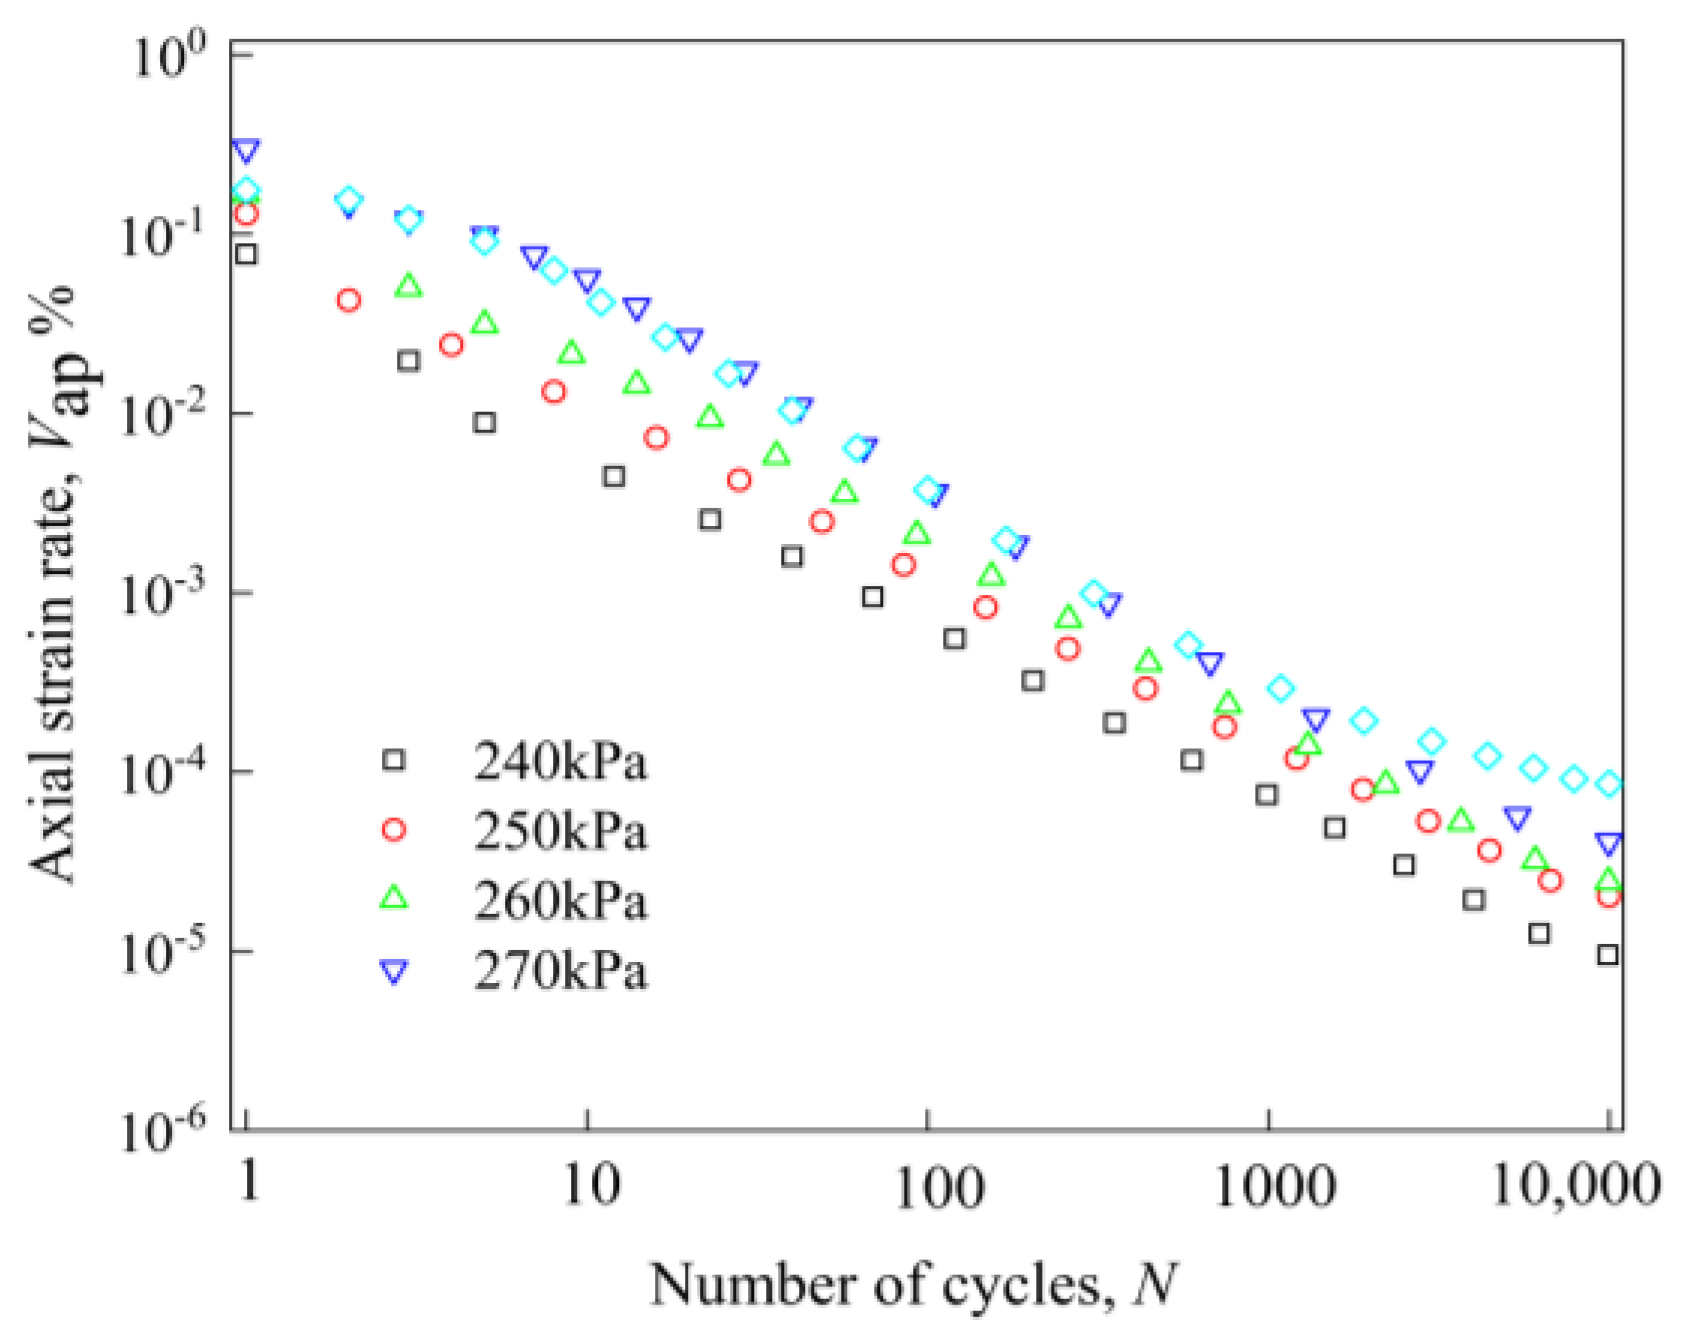
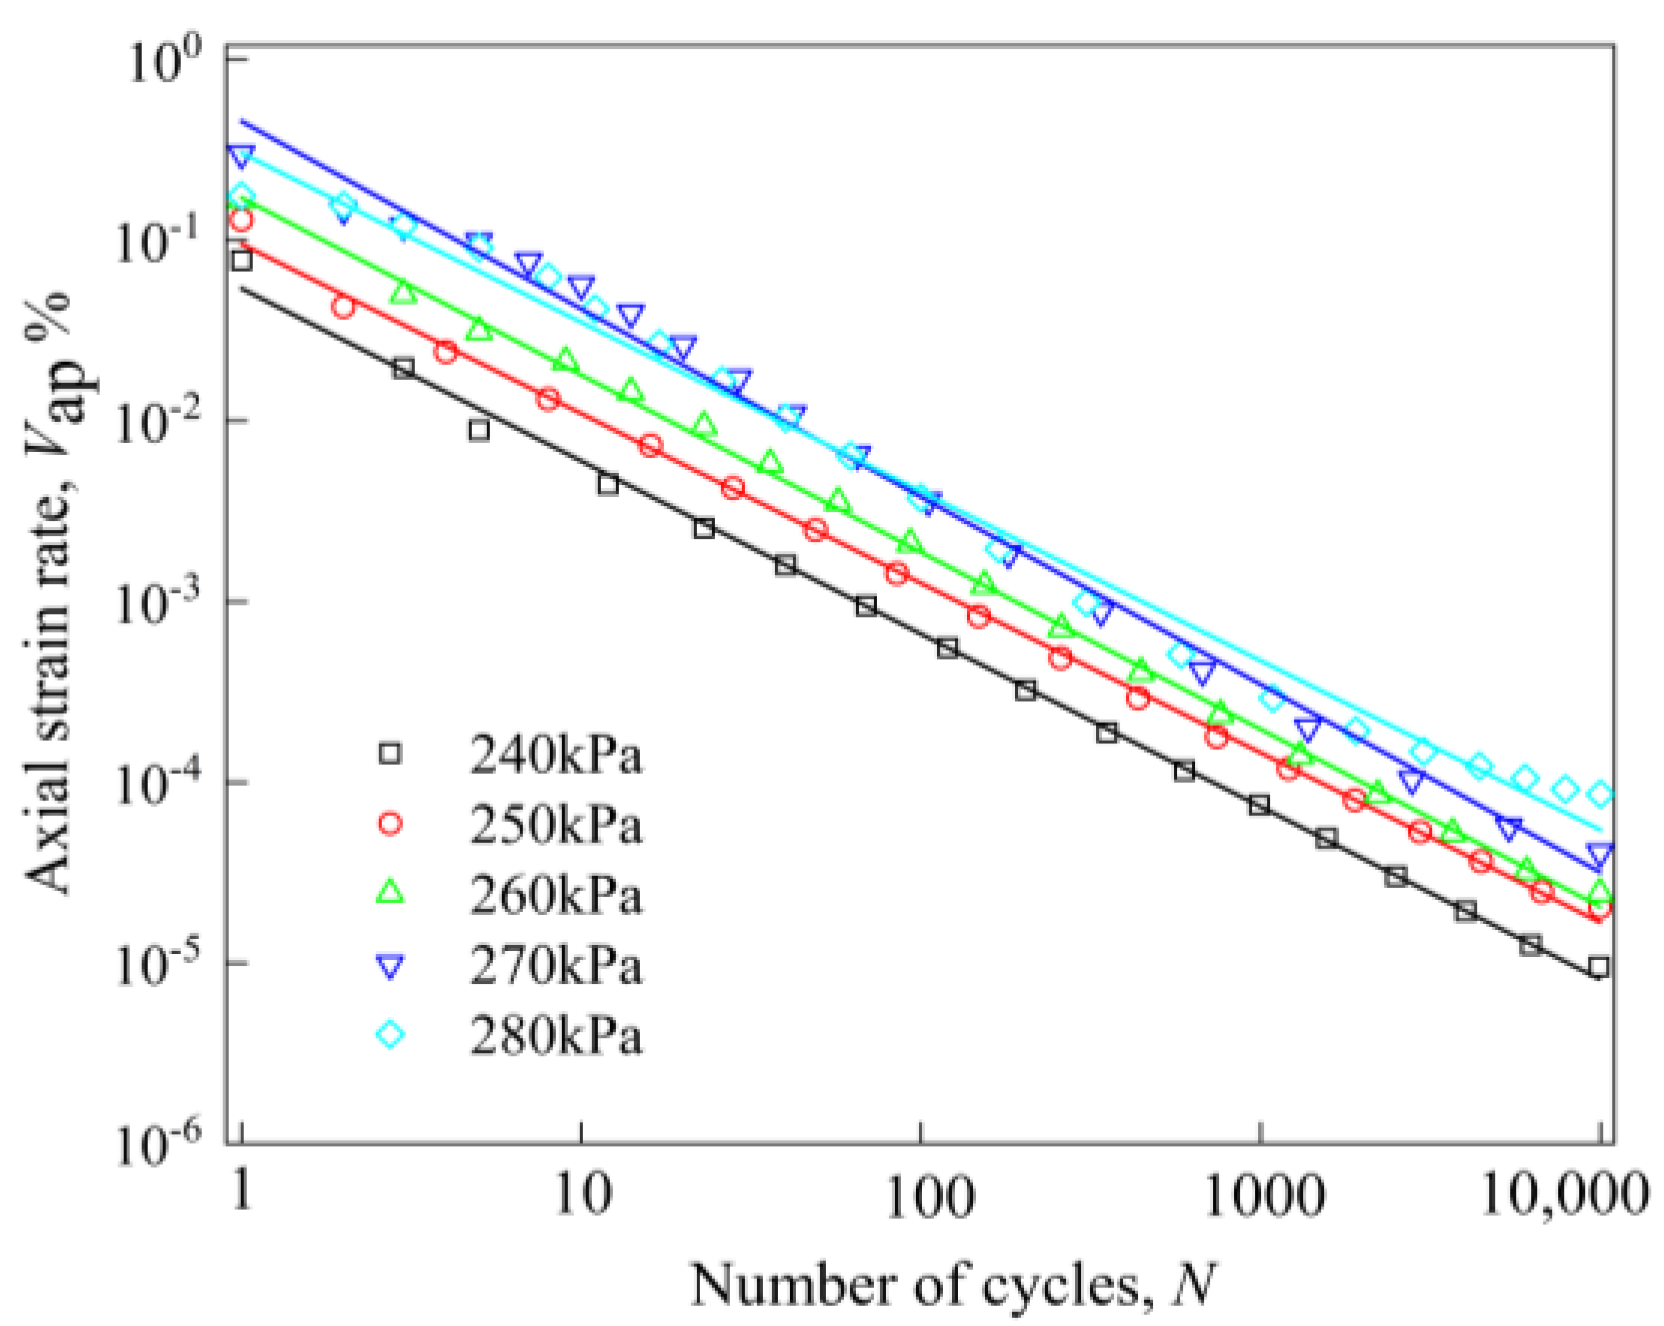
Figure 7 and Figure 8 present the variation curves of cumulative plastic strain (εp) versus axial strain rate (Vap = dεp/dN) processed in a double logarithmic coordinate system under different dynamic stresses. From Figure 7 and Figure 8, it can be observed that with the increase in the number of cycles, the average axial strain rate decays rapidly within the first several hundred cycles. After a large number of loading cycles, the average axial strain rate decreases to a very low value. Specifically, under low dynamic stress levels, the axial deformation rate of the silt soil continues to decay with the number of cycles, whereas under high dynamic stress levels, the deceleration rate slows down.
Taking the test condition of 20.4% moisture content as an example, the deformation rate of the filler after 10,000 loading cycles under a dynamic stress of 170 kPa is nearly 100 times higher than that under 130 kPa. This indicates that the dynamic stress level is one of the key factors determining the internal deformation of the filler. Moreover, there is a good linear relationship between the axial strain rate and the number of cycles after logarithmic transformation. For loading cycles exceeding 100, the fitted curves of log(εp/N) versus logN under different moisture contents and dynamic stress levels are presented in Figure 9 and Figure 10, and this relationship can be described by a linear function in the following form [29]:
log ε p N = f log N + g
where f and g are the experimental parameters, obtained by fitting, as shown in Table 3, it shows that the linear relationship can better reflect the change rule between the two.

4. Discussion

4.1. Plastic Strain Prediction Model

Monismith Model

By summarizing the results of a large number of dynamic triaxial tests, the literature [20] proposed the following cumulative plastic strain model for soil under cyclic loading:
ε p = a N b
where εp is the cumulative plastic strain of the soil, a and b are parameters related to the stress state of the soil, the type of soil, and its physical properties.
The model was used to fit the axial cumulative plastic strain test data of silt soil, and the relevant parameters of the axial cumulative plastic strain model for silt soil under different moisture contents and confining pressures are presented in Table 4 below.
It can be observed from Table 4 and Figure 11 that the coefficient of determination (R2) of most test data exceeds 0.9. This indicates that the Monismith model can accurately characterize the growth trend of axial cumulative plastic strain of silt soil within 10,000 loading cycles under different moisture contents and confining pressures. Thus, the Monismith model is feasible for predicting the cumulative plastic deformation of silt soil.

4.2. PSO-BP Neural Network Prediction Model

4.2.1. PSO-BP

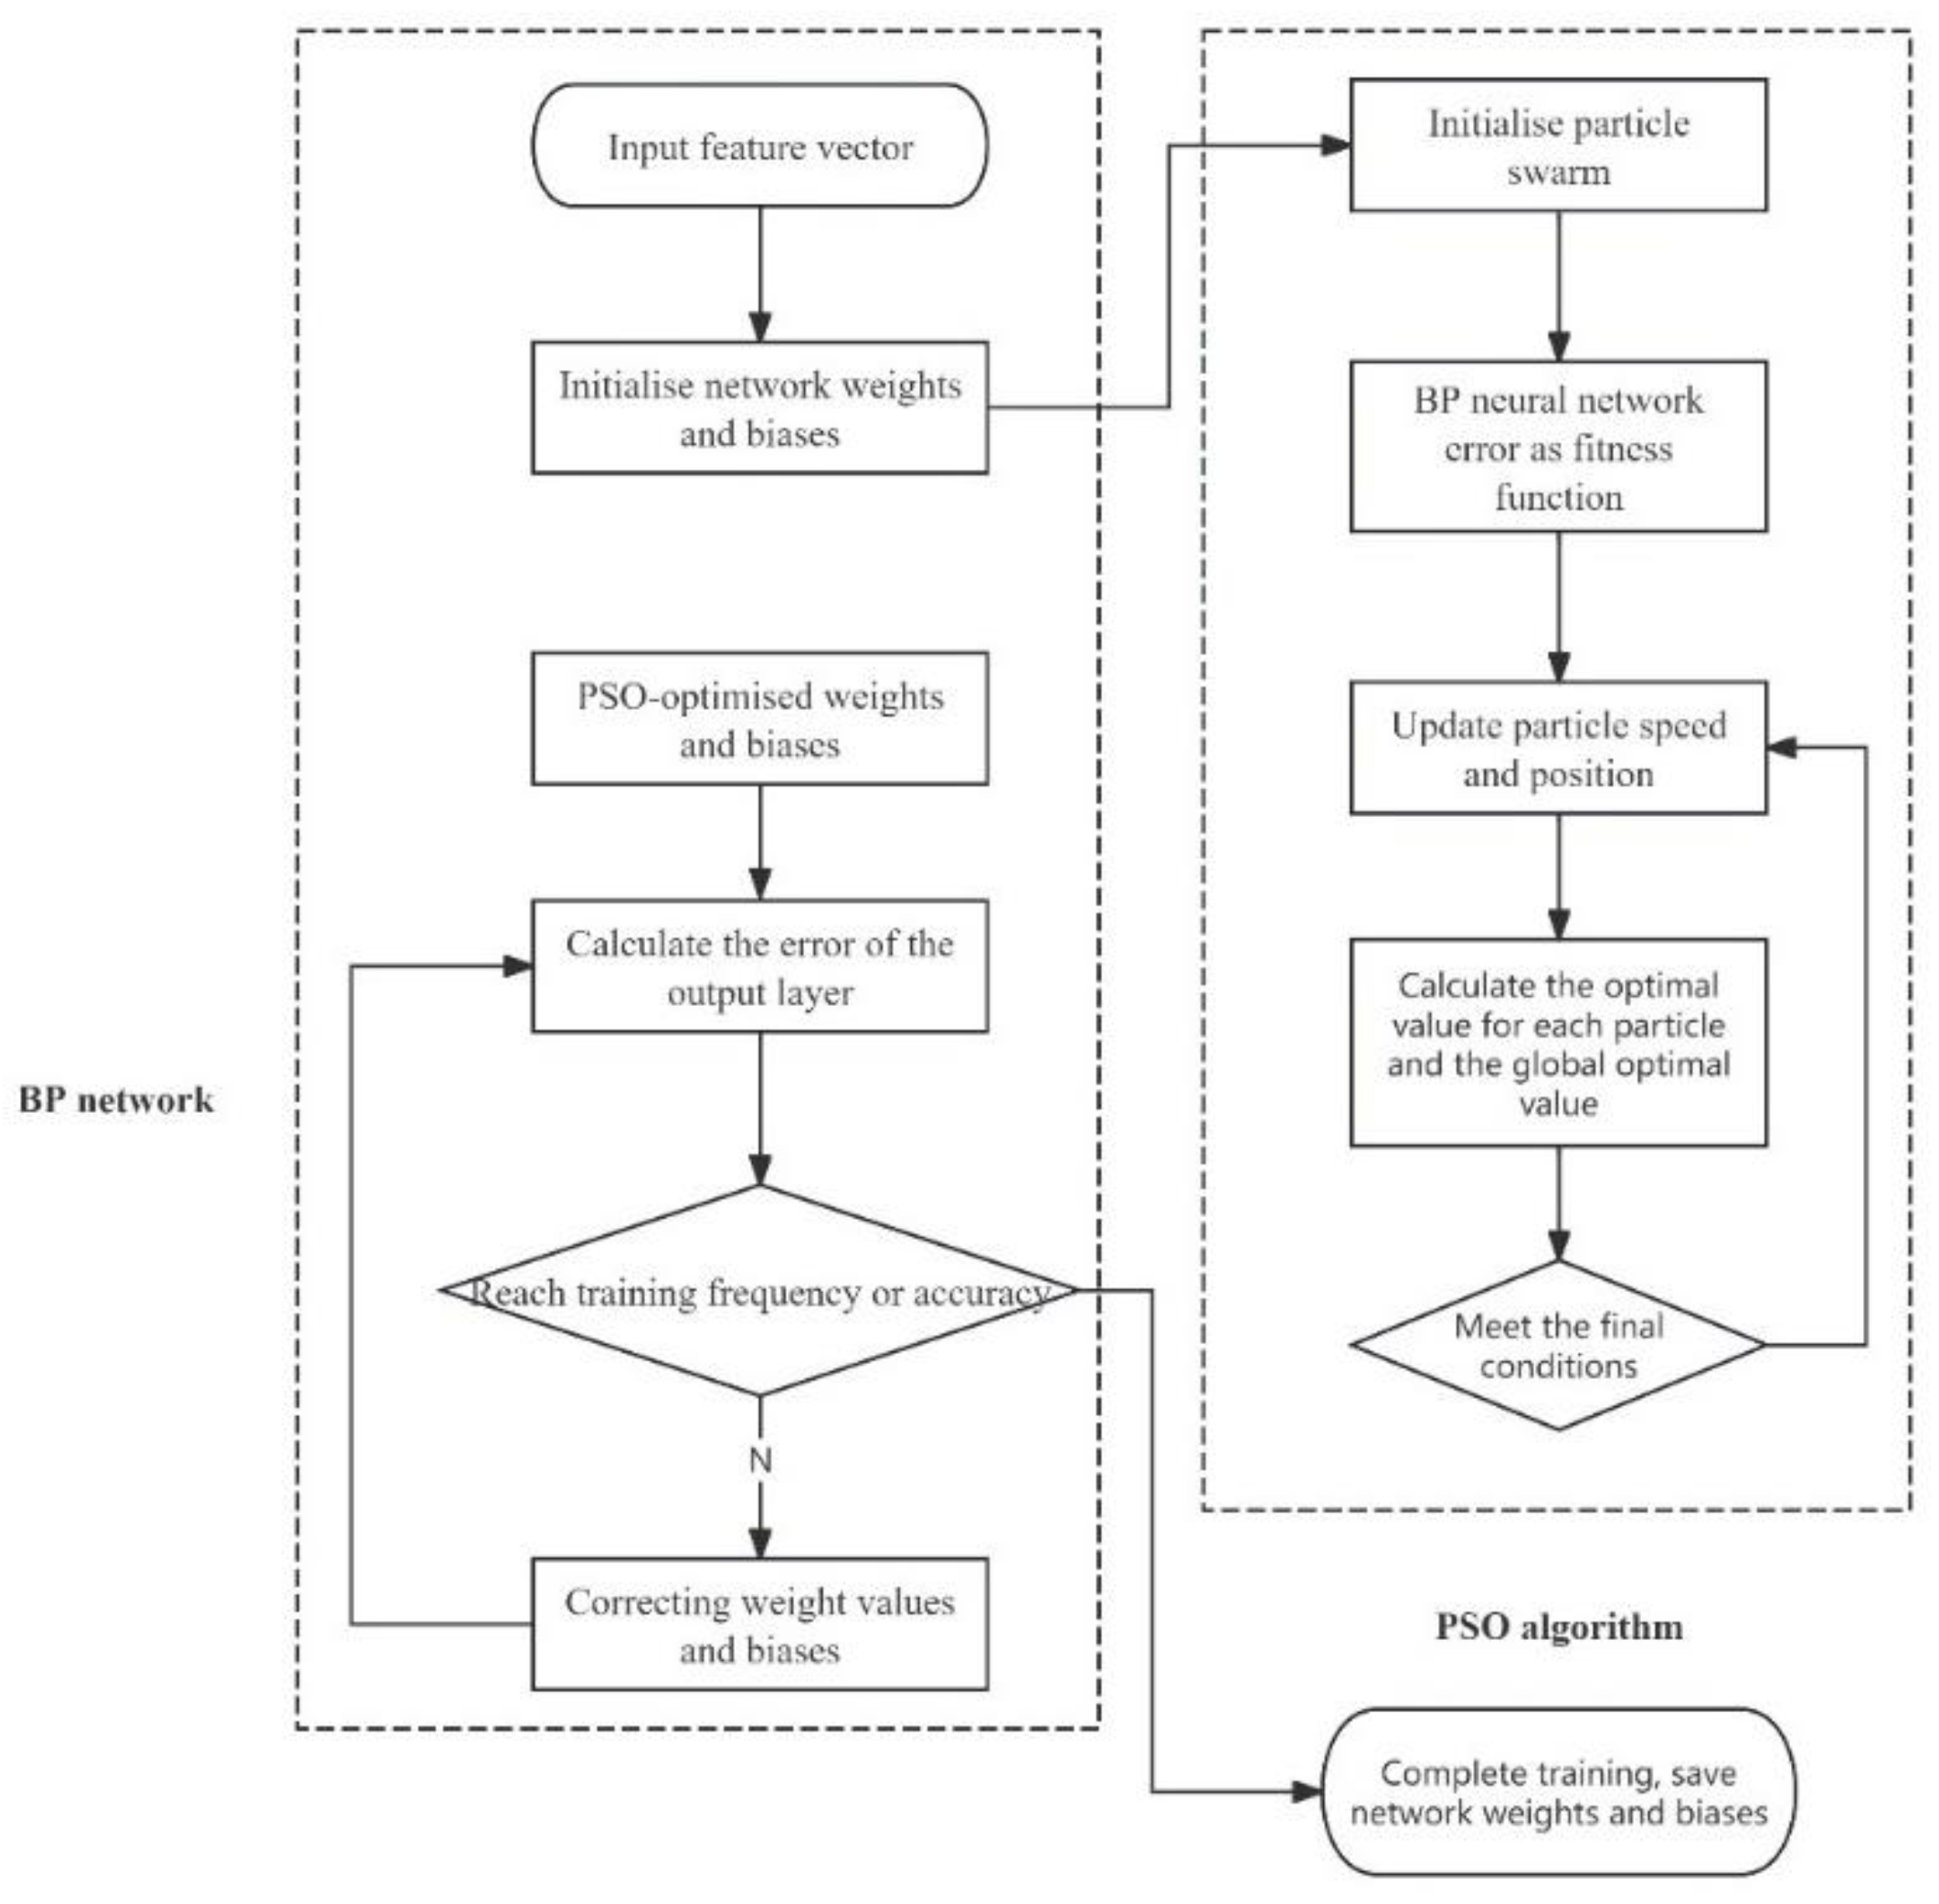
The PSO-BP neural network is an optimized model that integrates the Particle Swarm Optimization (PSO) algorithm and Backpropagation (BP) neural network, with its workflow illustrated in Figure 12. In the PSO-BP neural network, each particle represents an initial weight configuration of the neural network, and the velocity of each particle denotes the rate of change in the weights. By updating the velocity and position of particles via the PSO algorithm, the optimal weight configuration can be determined. Meanwhile, the BP neural network is employed to train and adjust the network’s weights and thresholds, aiming to minimize the network’s output error. The PSO-BP neural network integrates the global search capability of PSO with the local search capability of the BP neural network, thereby enabling it to efficiently and rapidly address complex nonlinear problems.

4.2.2. k-Fold Cross-Validation

Typically, data is divided into training, validation, and test sets, with each hyperparameter value paired with a separate set. If hyperparameters are determined in this manner, the model may lack sufficient generalization ability. To mitigate this issue, k-fold cross-validation was adopted. Specifically, the original training data was divided into k non-overlapping stratified subsets, followed by k rounds of model training and validation. In each round, the model is trained on k − 1 subsets, and validated on the remaining one subset (i.e., the subset not used for training in that round). Finally, the training and validation errors are estimated by averaging the results of the k trials [30].

4.2.3. Cumulative Plastic Strain Database

The number of cyclic loadings in this test was set to 10,000. Due to the large volume of cumulative deformation test data, sampling tests were conducted to facilitate analysis and calculation: sampling was first performed at intervals of 3 cycles, followed by intervals of 7, 10, and 100 cycles. The impact of different sampling intervals on fitting accuracy was evaluated, and it was found that sampling at an interval of 5 cycles (i.e., taking one data point every 5 cycles) avoids excessive point density—which could lead to model overfitting. The fitting result under this interval is nearly identical to that of sampling at intervals of 10 cycles, while a fitting deviation of 0.05 occurs when sampling at intervals of 3 cycles. Thus, this study adopted sampling at intervals of 5 cycles: one cumulative deformation data point was recorded every 5 cyclic loadings. A total of approximately 80,000 data points were obtained, corresponding to different working conditions defined by combinations of confining pressure, moisture content, and dynamic stress. These data points were grouped into 8 datasets based on the specimen numbers. Each dataset was shuffled randomly and then normalized to mitigate the influence of data volume and magnitude on the model’s calculation results.

4.2.4. Gray Correlation of Cumulative Deformation Influence Factors

Gray correlation analysis (GCA) is a method for evaluating the correlation between multiple influencing factors and a target variable. During the evolution of the system, if two factors exhibit similar variation trends and strong synchronization, they are considered to have a high correlation, and vice versa for low correlation [31].
To determine the correlation between each characteristic parameter and cumulative plastic strain under different test conditions, GCA was performed using MATLABR2024a programming to calculate the grey correlation degrees between all influencing factors and the cumulative plastic strain of silt soil. This study adopted 0.6 as the threshold to assess the significance of grey correlation degrees. The calculated results show that the grey correlation degree of moisture content (a characteristic parameter) is 0.719, that of dynamic stress is 0.755, and that of confining pressure is 0.737. All correlation degrees exceed the preset threshold of 0.6, indicating that the selected characteristic parameters have a high correlation with the target output (cumulative plastic strain), and their correlation degree values are relatively close. Thus, all characteristic parameters were retained for the construction of the artificial neural network (ANN).

4.2.5. Parameter Optimization of the PSO-BP Model

Based on the constructed BP neural network, a particle swarm algorithm-optimized PSO-BP neural network prediction model was proposed to predict the cumulative deformation of silt soil roadbed fill under different confining pressure, dynamic stress, and moisture content.
Neuronal activation functions and hidden layer configurations are two other critical parameters of the neural network. Activation functions introduce nonlinear factors into the model, enabling it to capture complex nonlinear relationships between input and output variables. Among the commonly used activation functions, the “tansig” (hyperbolic tangent sigmoid) and “logsig” (logarithmic sigmoid) functions are the most widely adopted.
tan sig ( x ) = 2 1 + 2 e 2 x 1 log sig ( x ) = 1 1 + e x
The hidden layer set up includes the number of layers and the number of nodes in a hidden layer. Since a single hidden layer can satisfy the requirements of most data structures, only one hidden layer is used in this study. However, there is no consensus on the optimal number of nodes for a hidden layer. The range of hidden layer nodes is usually determined using the empirical formula (Equation (4)) and its optimal value is selected by trial-and-error method:
m = n + l + a
where m is the number of nodes in each hidden layer; n and l are the number of nodes in the input and output layers, respectively; and a is a constant in the range 1–10.
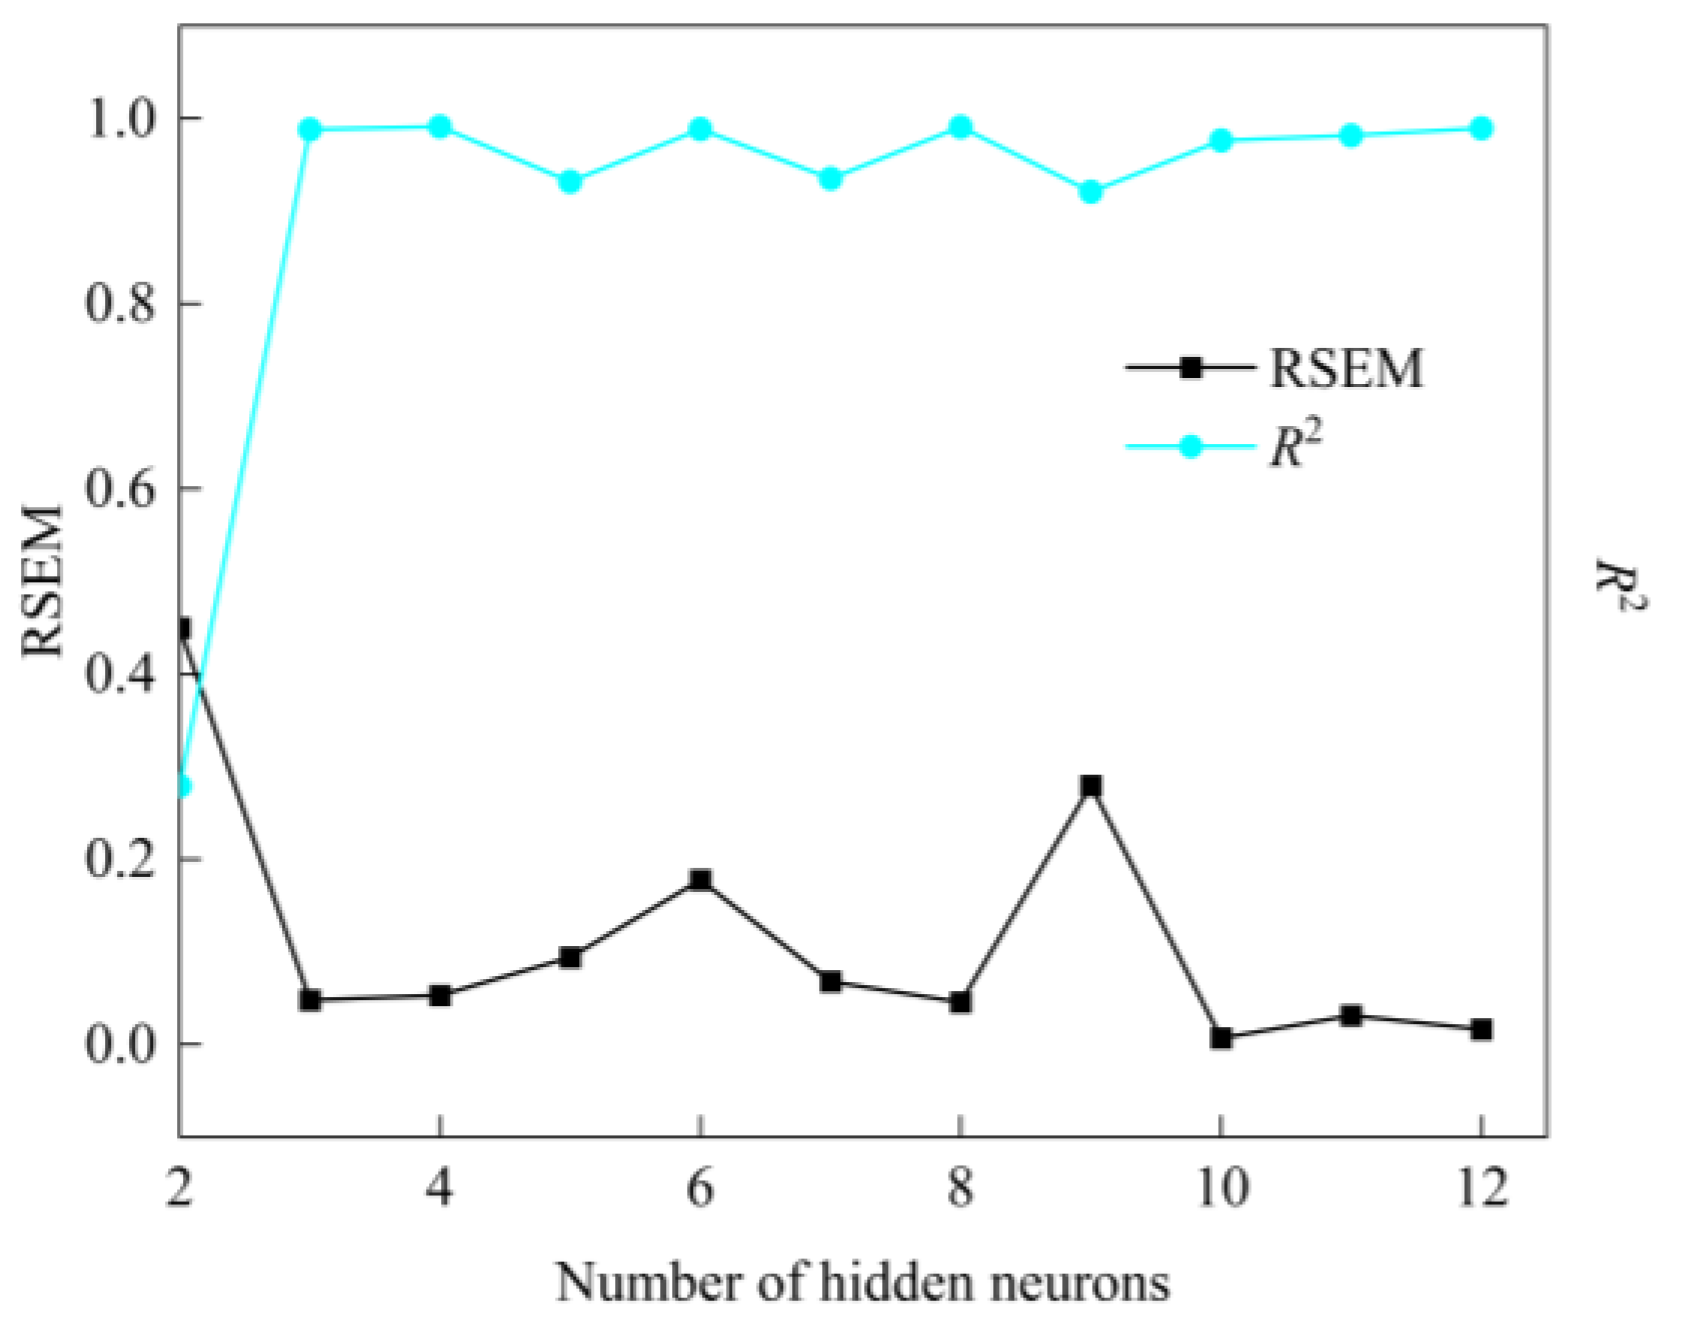
Based on Equation (4), the number of hidden layer nodes is determined to range from 2 to 12. To evaluate the combined effect of activation functions and hidden layer node counts, the loss values of models with different combinations of these parameters were calculated. The results indicate that the model using the “logsig” function outperforms that using the “tansig” function.
The “logsig” activation function outperforms the “tansig” function in most cases. Furthermore, the minimum mean squared error (MSE) is achieved when the number of hidden layer nodes is set to 4. Finally, the Levenberg–Marquardt (LM) training algorithm, the “logsig” activation function, and a hidden layer with 4 nodes were selected as the hyperparameters for the PSO-BP neural network model.
After hyperparameter optimization, the optimal network structure was determined as 4 × 4 × 1, where the input layer consists of 4 nodes (corresponding to confining pressure, dynamic stress, moisture content, and number of cyclic loadings), the hidden layer has 4 nodes, and the output layer has 1 node (representing cumulative plastic deformation). Subsequently, as elaborated earlier, the initial network parameters were further optimized using the PSO algorithm. Prior to this optimization, the number of parameters to be optimized was calculated. Specifically, the number of weights between the input and hidden layers was 16, which is the product of the number of input layer nodes and hidden layer nodes. Similarly, the number of weights between the hidden and output layers was 4 (i.e., the product of the number of hidden layer nodes and output layer nodes).
Mean squared error (MSE) was selected as the loss function. To comprehensively evaluate the performance of the proposed model, three evaluation metrics were computed: mean absolute error (MAE, i.e., the mean of absolute errors), mean squared error (MSE, i.e., the mean of squared errors), and root mean square error (RMSE, i.e., the square root of MSE).
M A E = 1 n i = 1 n ( y i y ^ i ) M S E = 1 n i = 1 n ( y i y ^ i ) 2 R M S E = 1 n i = 1 n ( y i y ^ i ) 2
where y i ^ is the predicted value of the accumulated plastic strain, yi is the experimental cumulative strain, and n is the total number of datasets. The values of MAE, MSE, and RMSE are always positive, and the closer they are to zero, the more accurate the prediction.
Data normalization aims to scale data to the range [0, 1]. In this study, the training input data (P-train) was normalized first, and the corresponding normalization parameters (ps-input) were saved. The test input data (P-test) was then normalized using these saved ps-input parameters. Similarly, the training output data (T-train) was normalized, with the normalization parameters (ps-output) stored; the test output data (t-test) was normalized using the saved ps-output parameters.
For the PSO algorithm, the inertia weight was set to 0.9. Through parameter debugging, the learning factors were determined as c1 = 4.494 and c2 = 4.494, which achieved the optimal optimization effect; thus, these parameter values were adopted in this study.
An appropriate population size is critical for the PSO process. If the population size was excessively small, the algorithm would easily fall into a local optimum; in contrast, an excessively large population size would significantly prolong the training time. However, there is no universal consensus on the optimal population size for PSO in such scenarios. As shown in Figure 13, which presents the loss value evolution when the population size is 10, the loss value is minimized and the optimal training parameters are obtained under this population size. Therefore, the population size was set to 10 in this study to ensure accurate prediction results.
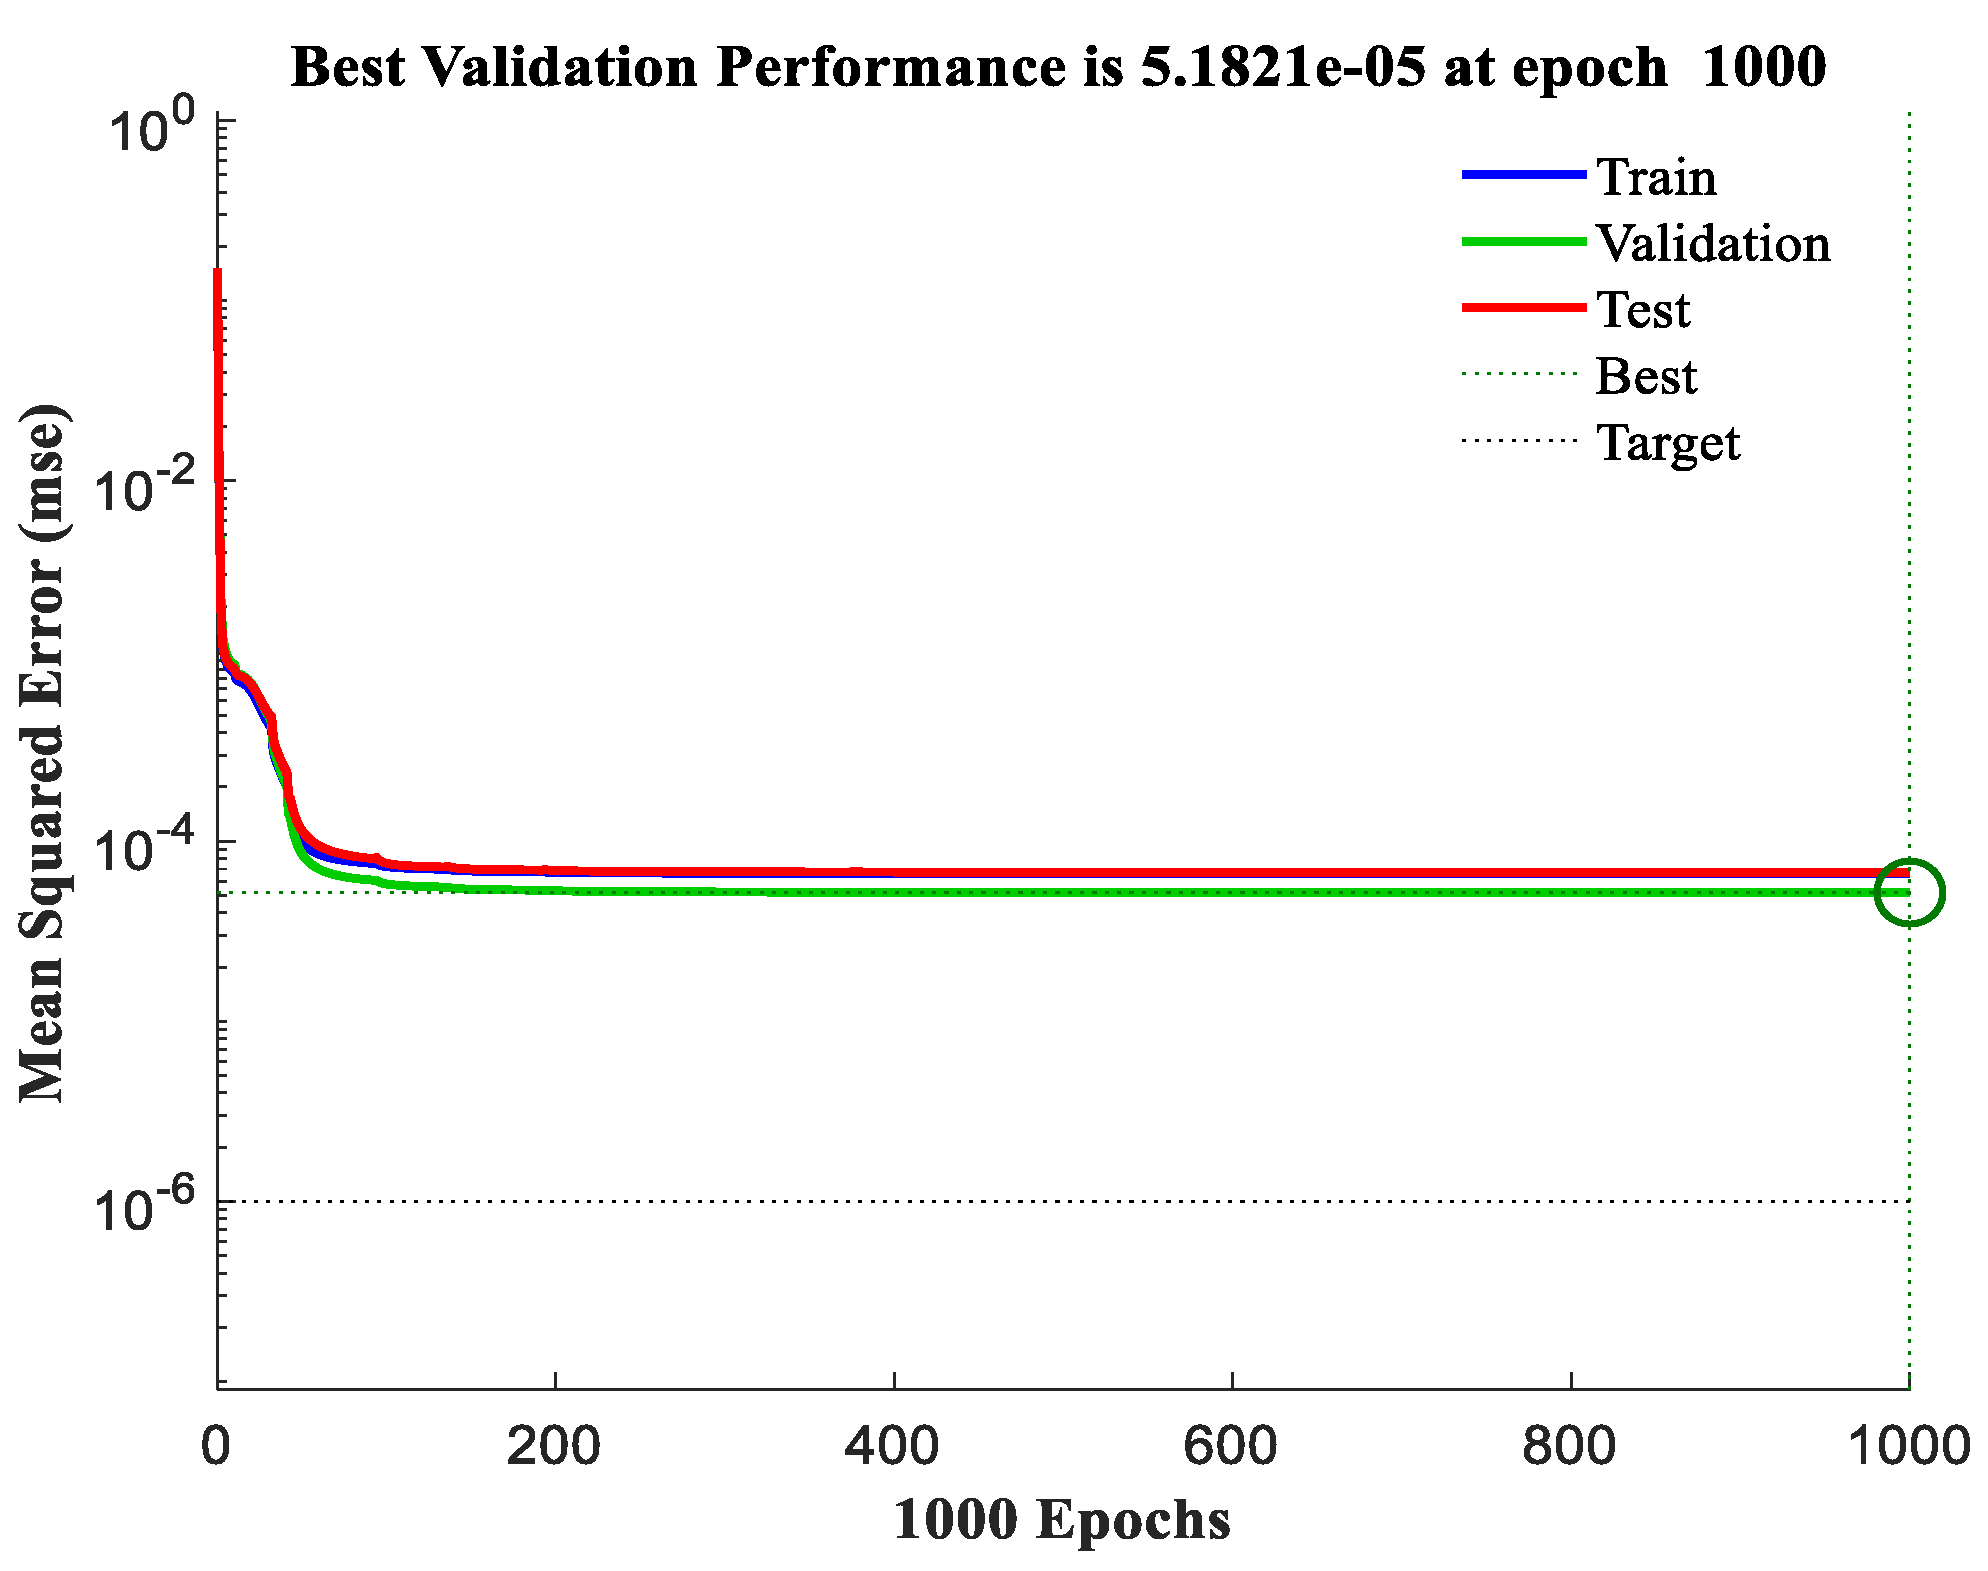
The key parameters of the PSO algorithm were set as follows: number of population update iterations = 40, population size = 10, maximum particle velocity = 10, minimum particle velocity = −1, upper boundary value = 1, and lower boundary value = 1. The error of the BP neural network was used as the fitness function, and iterative operations were performed to obtain the optimal weights and thresholds of the neural network. The particle swarm optimization process is illustrated in Figure 14, the training results are presented in Figure 15, and the parameter debugging process is shown in Figure 16. The performance of each evaluation metric is summarized in Table 5.
As can be seen from Table 5, the performance of the evaluation parameters is excellent, demonstrating a good modelling effect.

4.3. Analysis of Model Prediction Results

4.3.1. Comparison of BP and PSO-BP Prediction Performance

In order to assess the generality of the models, their performance in predicting unknown data was investigated by using a test set for prediction, and the performance of the two models on the test set is shown in Figure 17a. The PSO-BP model outperforms the BP model on the test set, and its optimised root mean square error (RMSE = 0.005) is about two times lower than that of the BP model (RMSE = 0.012), and the root mean square error (MSE) is reduced from 0.005 to 6.8168 × 10⁻⁴. To further evaluate the performance of the BP and PSO-BP models, the prediction errors of both models on the test set are shown in Figure 17b. The pattern is consistent with the variation in RMSE and MSE parameters compared to those in the literature [24]. Compared with the BP neural network model, the PSO-BP neural network model exhibits smaller prediction errors, and its predicted values are more consistent with the measured values.

4.3.2. PSO-BP Prediction Results

The established PSO-BP neural network model was employed to compute the axial cumulative plastic strain values under different numbers of cyclic loadings for 1 to 7 sets of test data. For example, the predicted results of axial cumulative plastic strain under varying confining pressures and dynamic stresses are illustrated in Figure 18.
As can be seen from Figure 18, the PSO-BP model can predict the maximum axial cumulative plastic strain under each working condition, and the curve generated by the model is closer to the measured curve—especially when the number of cyclic loadings is less than 10,000. The PSO-BP model can better learn the characteristic information (e.g., confining pressure) from the test data and effectively process complex nonlinear relationships, thus establishing a more accurate relationship curve for axial cumulative plastic strain at low numbers of cyclic loadings.
Neural network performance is usually evaluated using the root mean square error (RMSE) between predicted values and measured values as an accuracy metric. The calculated RMSE values of the PSO-BP model are all less than 0.05, indicating that the model has small prediction errors and high accuracy.

4.3.3. Analysis of Model Predictions

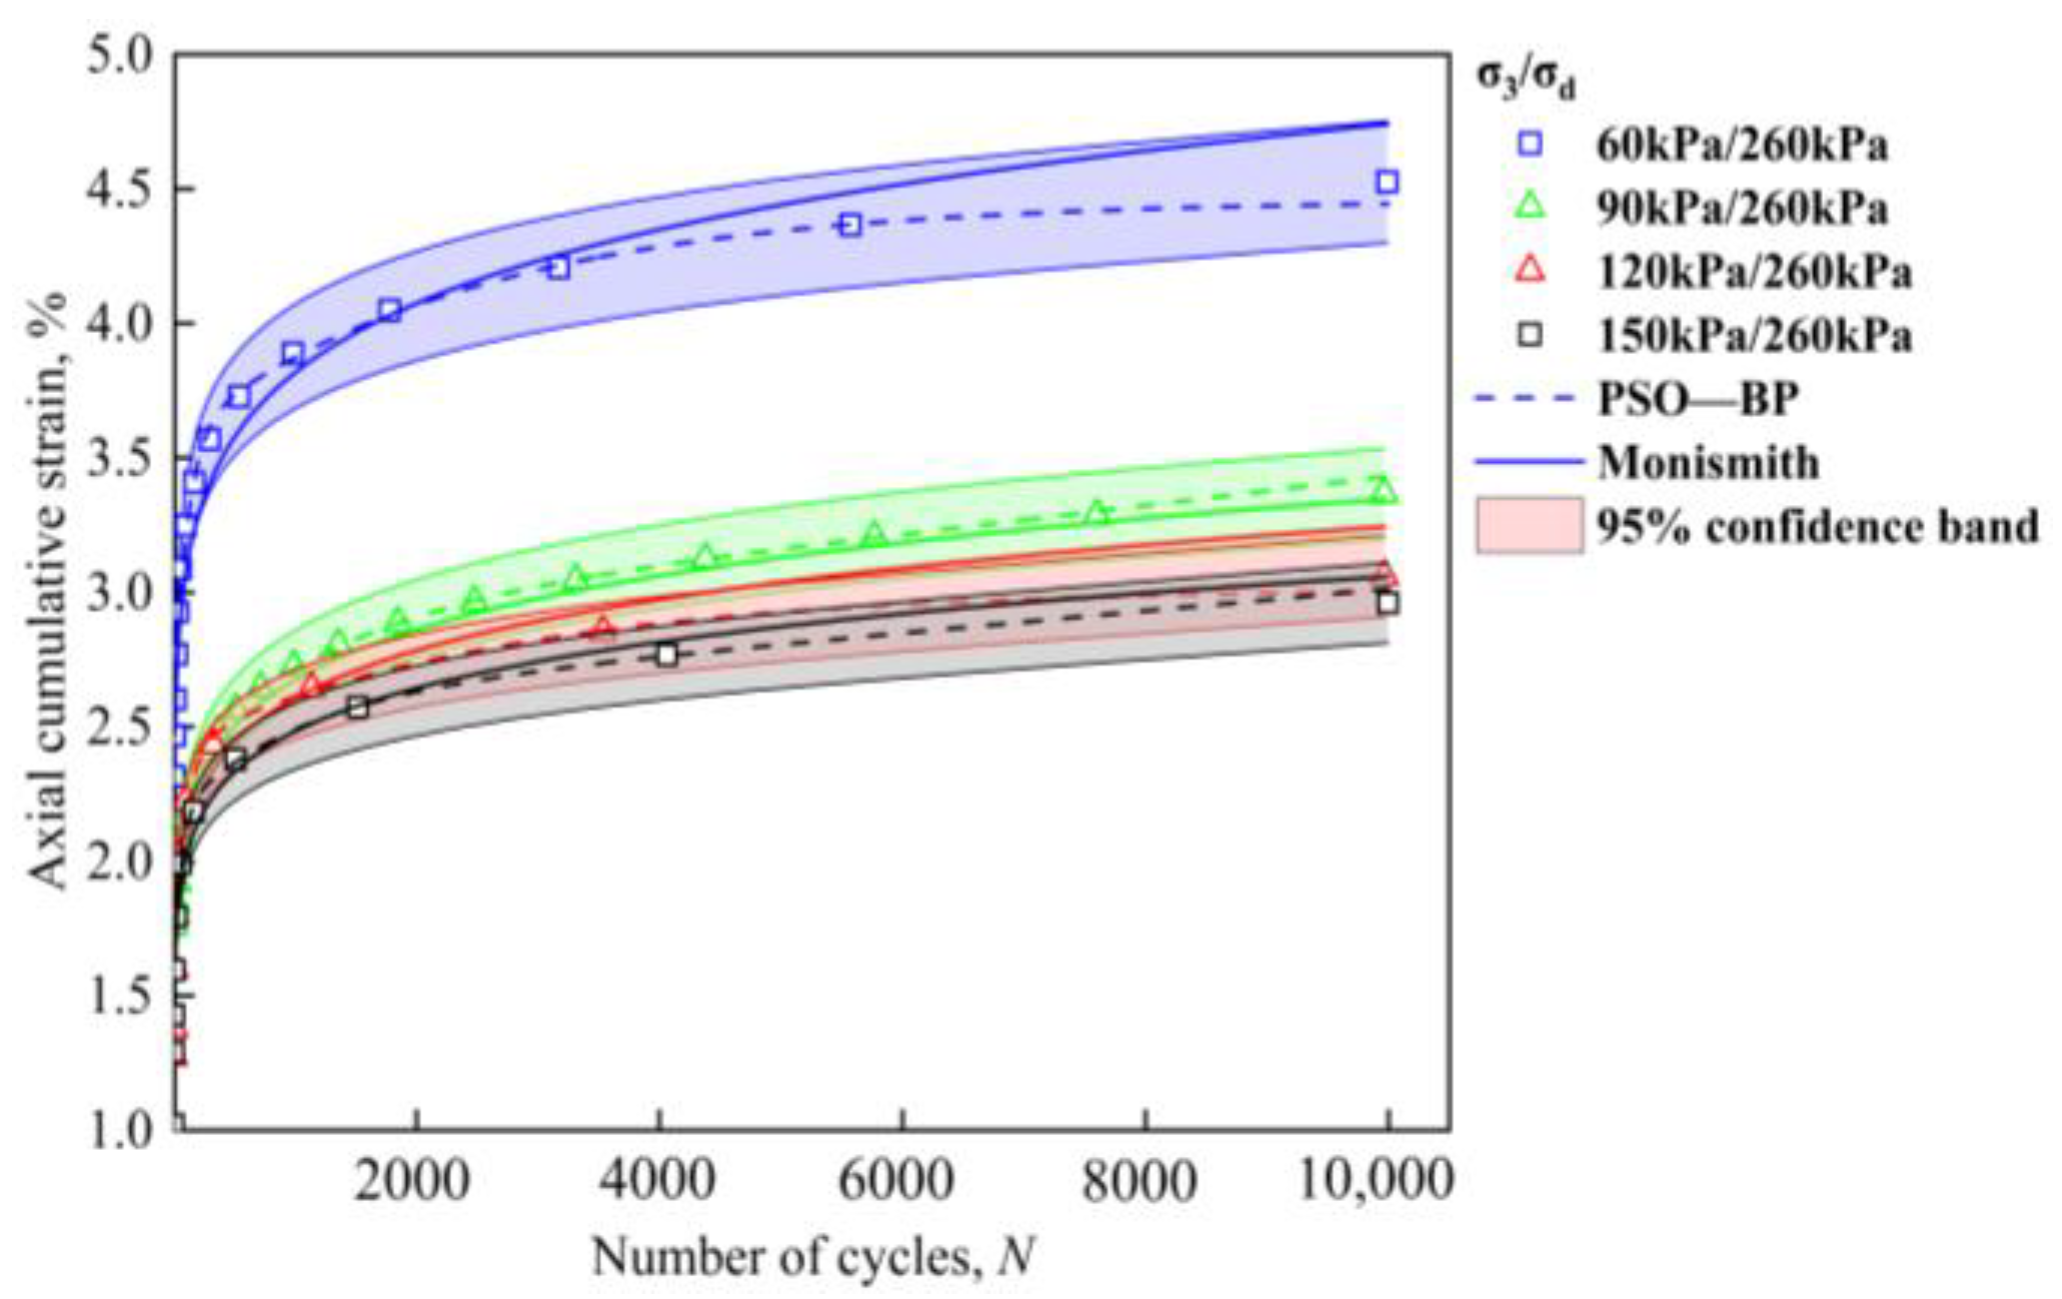
The PSO-BP neural network model was employed to compute the axial cumulative plastic strain values under different numbers of cyclic loadings for 1 to 7 sets of test data. The predicted results of axial cumulative plastic strain obtained by the Monismith prediction model and the PSO-BP neural network model under various combinations of moisture content, dynamic stress, and confining pressure are illustrated in Figure 19 and Figure 20.
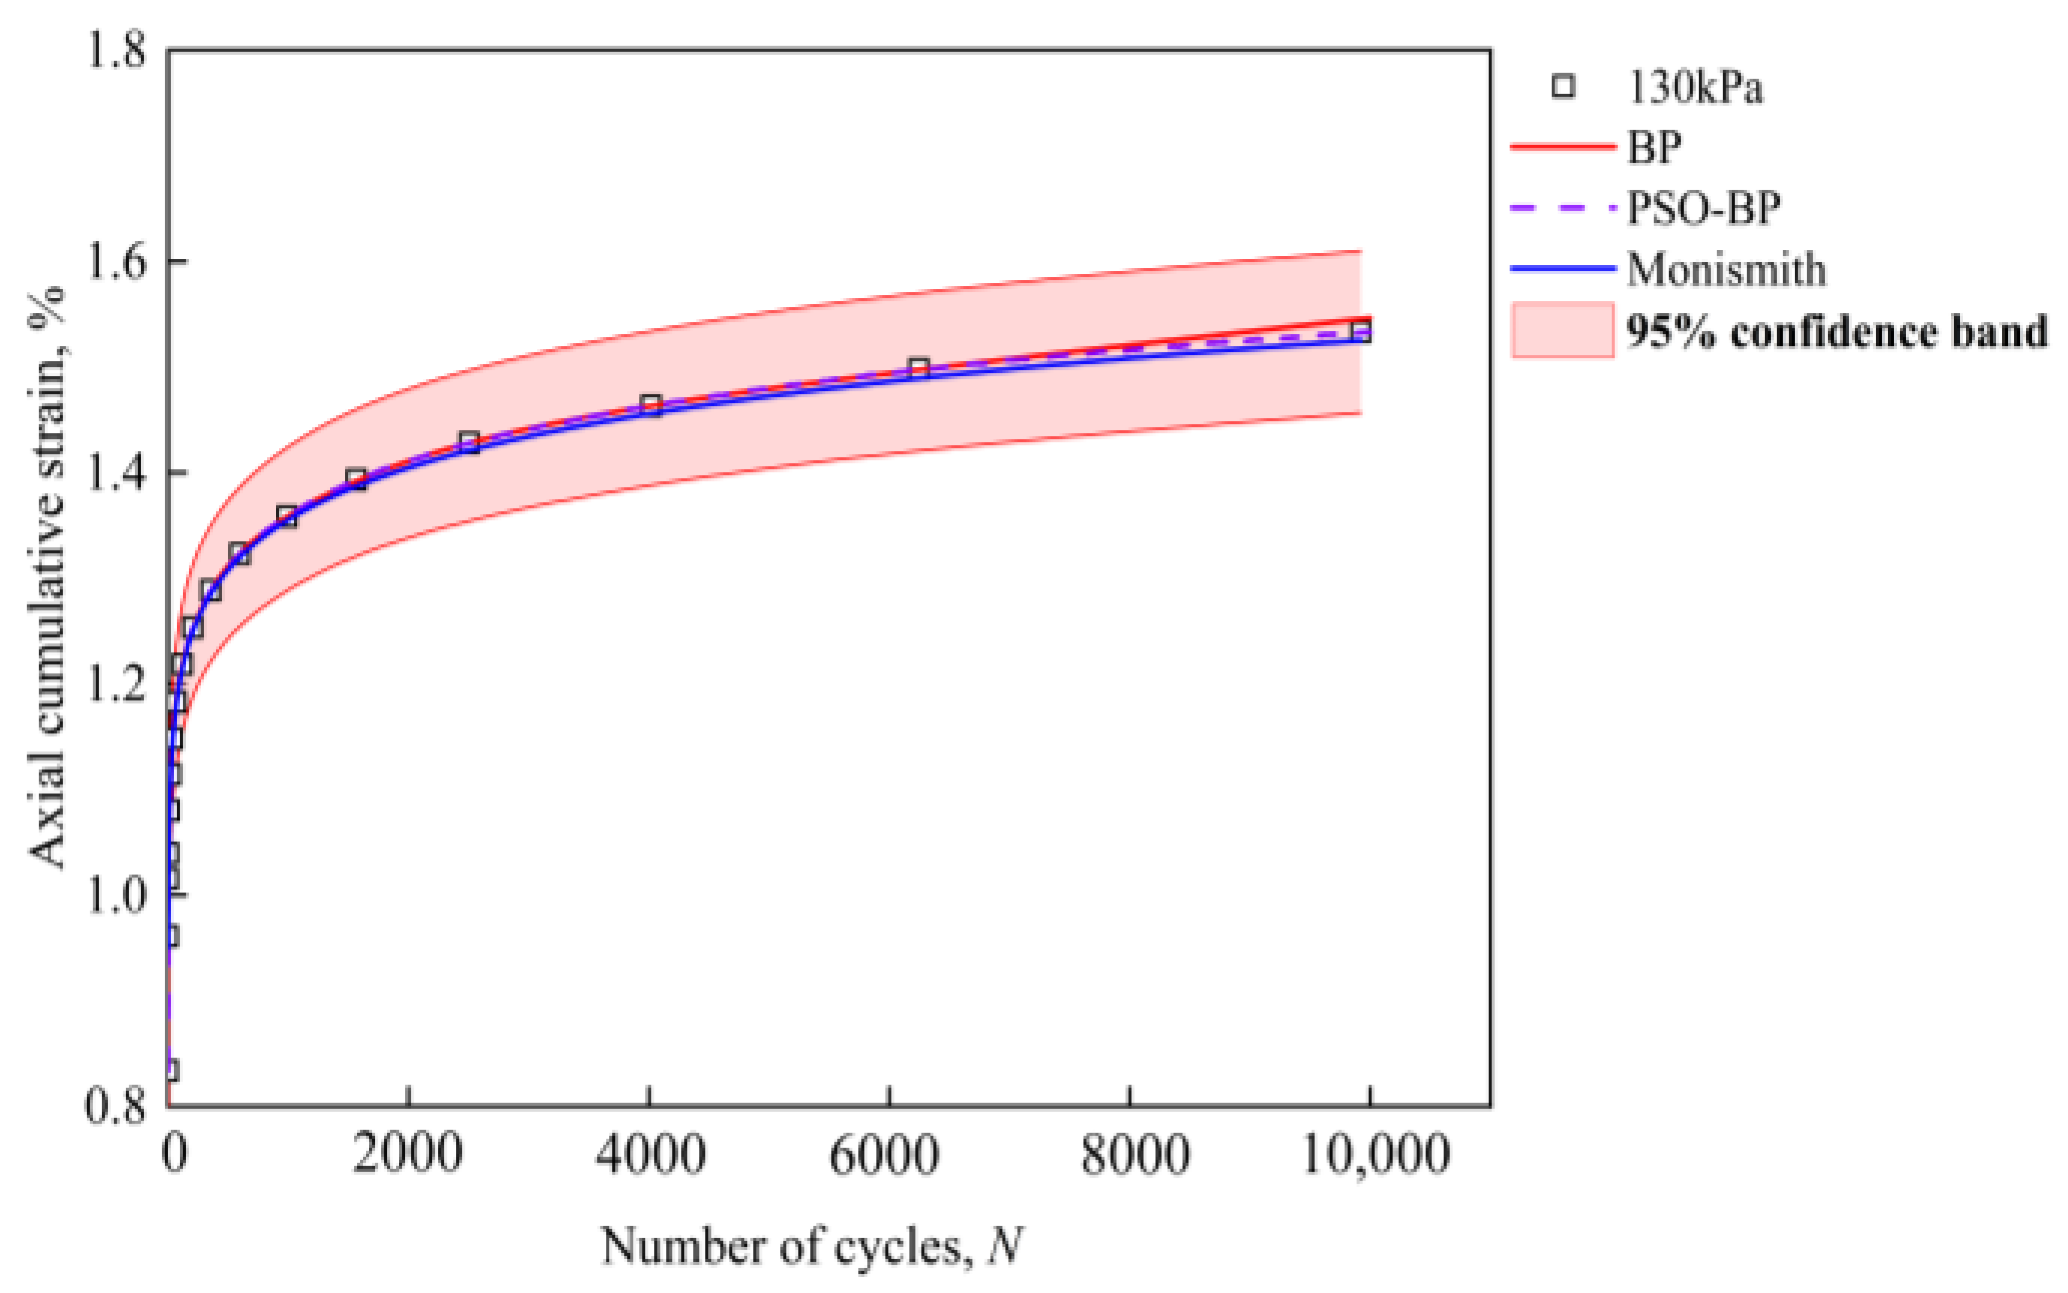
As can be seen from Figure 19, both models are capable of predicting the maximum axial cumulative plastic strain under each influencing factor. However, compared with the Monismith model, the curves generated by the PSO-BP model better fit the measured curves. This is because the Monismith model, as a power function, exhibits poor fitting performance on steady-state deformation curves but more satisfactory fitting on damage curves. Therefore, the fitting degree of the steady-state deformation curves obtained by the Monismith model is lower than that of the PSO-BP model, and the final cumulative plastic strain predicted by its fitted curves is relatively higher.
The average goodness of fit of the PSO-BP neural network model derived from Figure 19 is 0.993, while that of the Monismith model is 0.973. Figure 20 presents the goodness of fit values of the three prediction models: 0.995 for the PSO-BP model, 0.967 for the BP neural network model, and 0.976 for the Monismith model. These results indicate that the PSO-BP model outperforms both the Monismith prediction model and the BP model, featuring smaller prediction errors and higher accuracy. Notably, when dealing with large datasets, the accuracy of the PSO-BP model is significantly higher than that of the Monismith model.
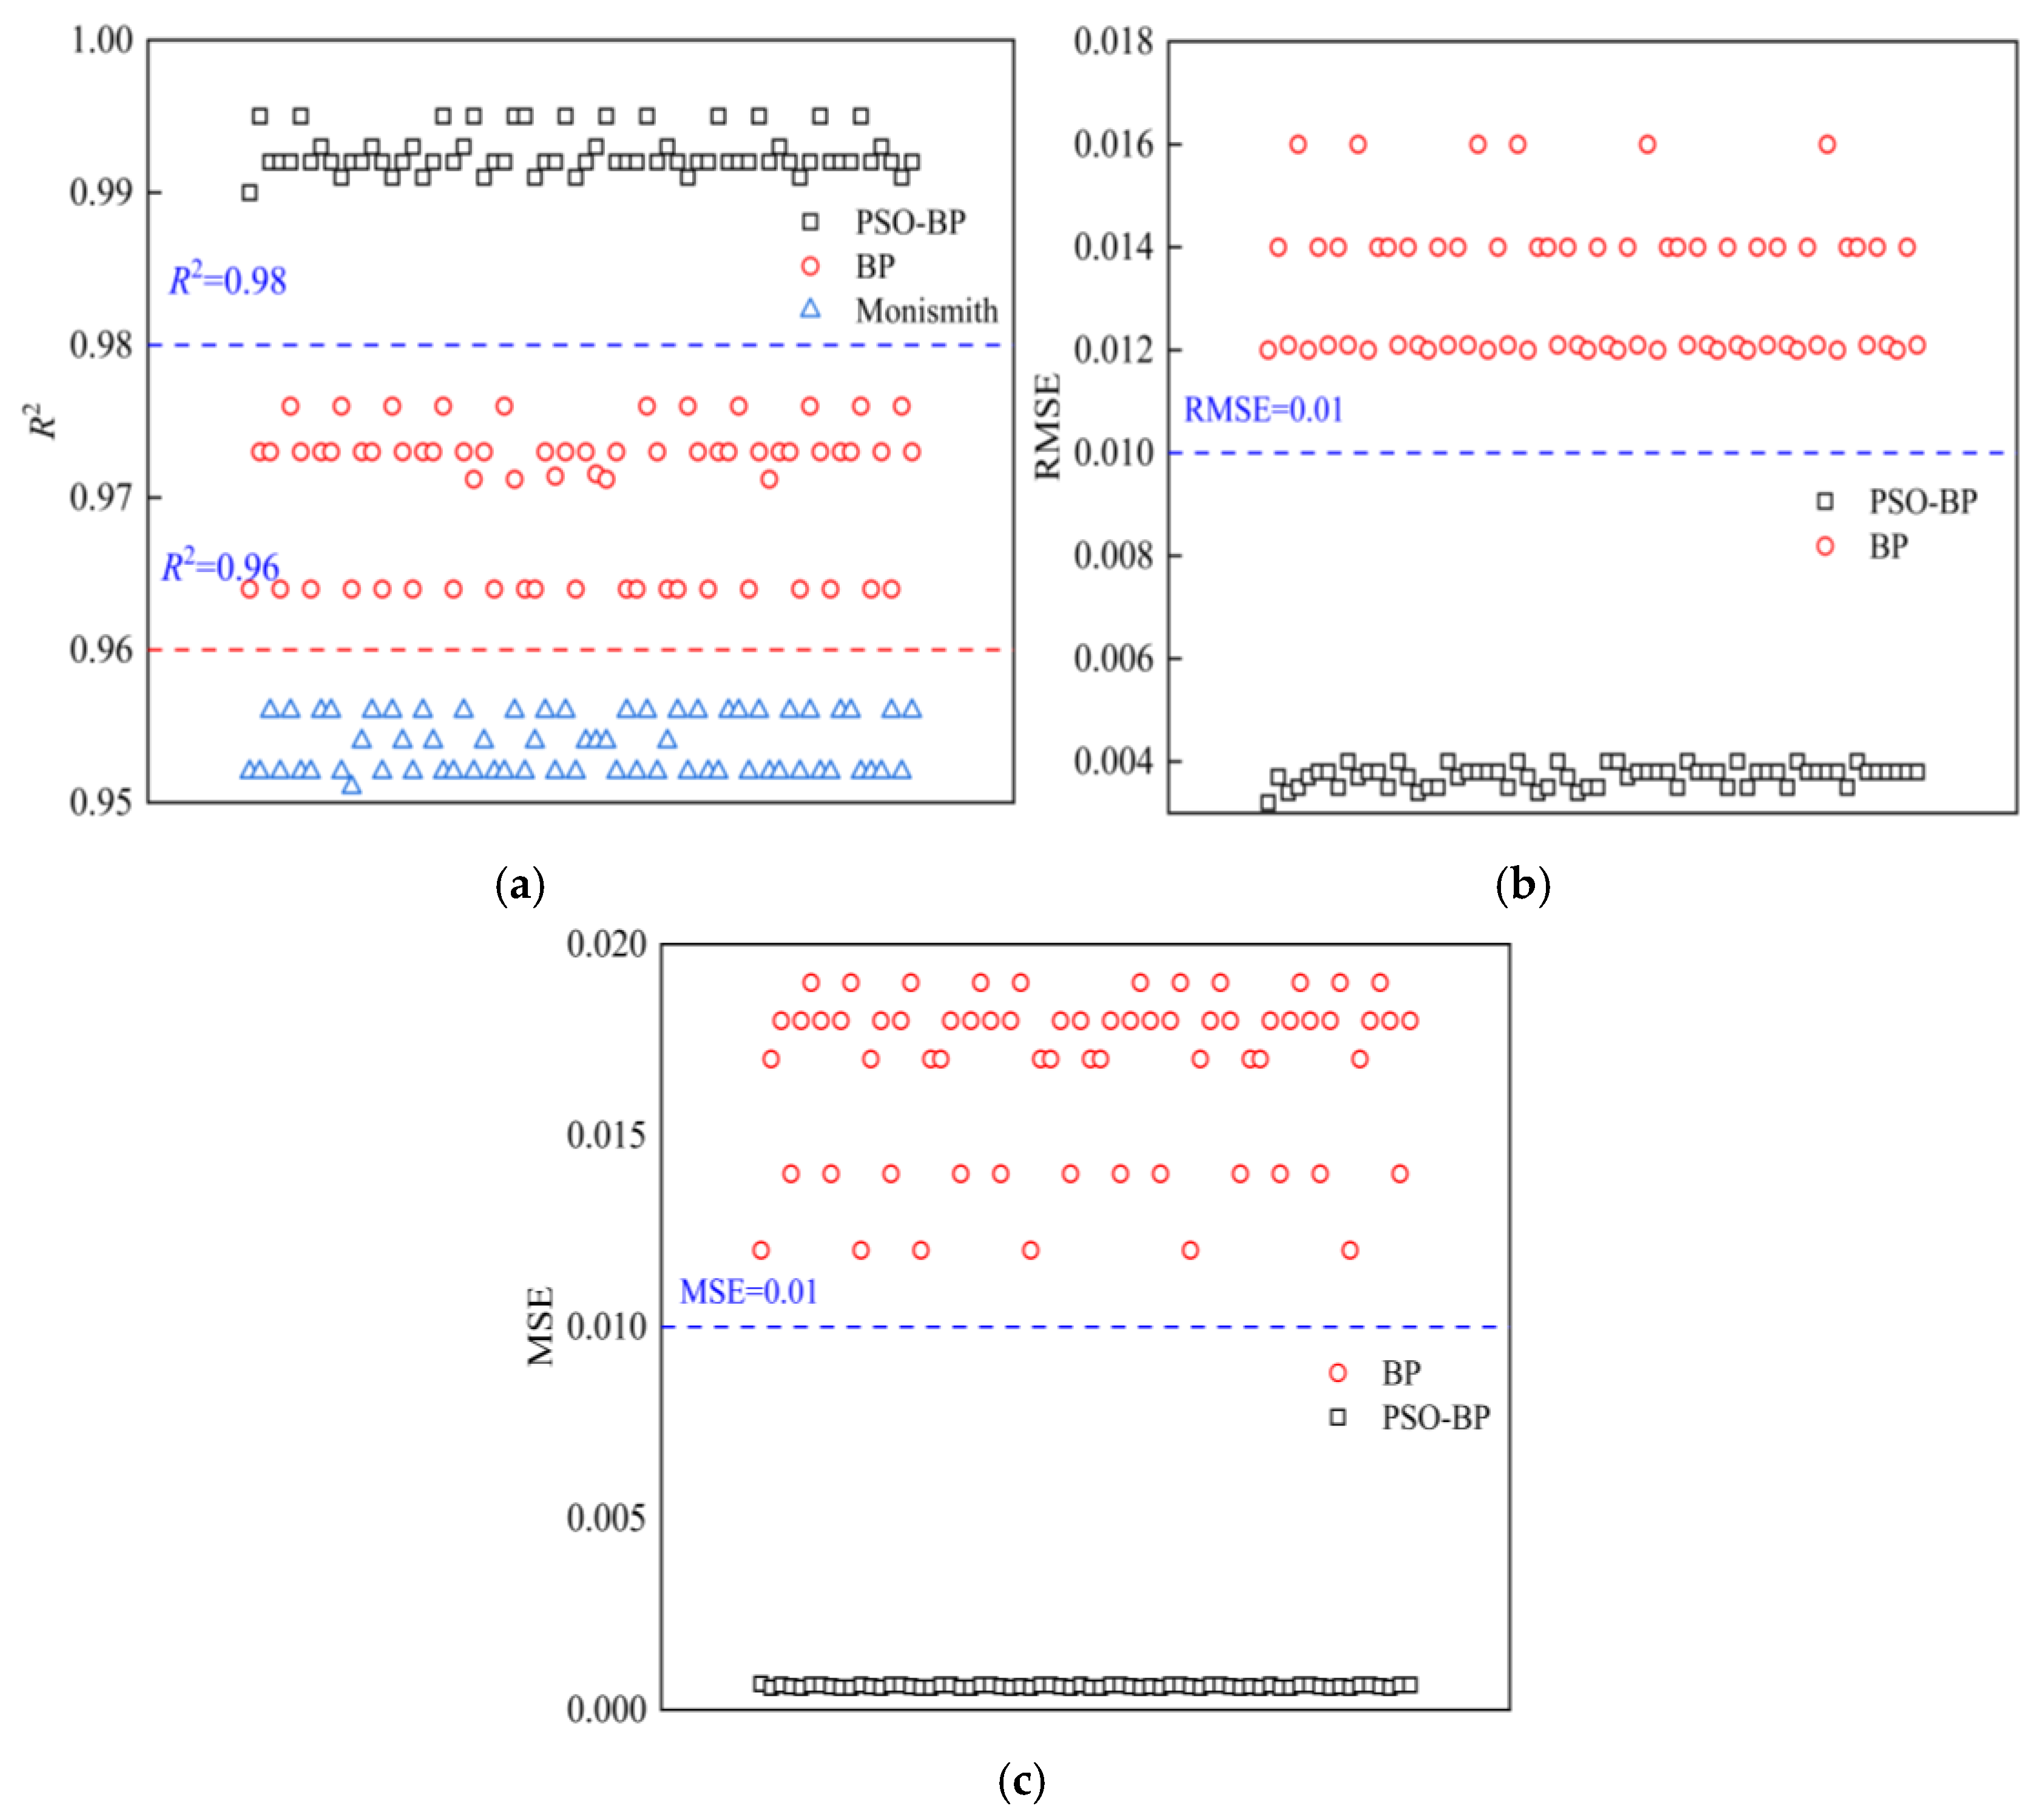
Figure 21 illustrates the variations in the coefficient of determination (R2), root mean square error (RMSE), and mean squared error (MSE) for the PSO-BP, BP, and Monismith models. From the figure: For R2 (a measure of goodness of fit), the PSO-BP model exhibits the best performance, with values ranging from 0.98 to 0.999; the BP model has R2 values between 0.96 and 0.98; the Monismith model’s R2 fluctuates around 0.95. Similarly, regarding RMSE, the PSO-BP model achieves the smallest values, fluctuating around 0.003, while the BP model’s RMSE ranges from 0.012 to 0.016. In terms of MSE, the PSO-BP model also yields the smallest values (fluctuating around 6 × 10⁻⁴), and the BP model’s MSE is in the range of 0.01 to 0.02.

5. Conclusions

In this study, dynamic triaxial tests were conducted on silt soil under different combinations of confining pressure, moisture content, and dynamic stress, and the effects of these three factors on cumulative plastic deformation were analyzed. Gray relational analysis (GRA) was adopted to identify and prioritize the key factors influencing cumulative plastic deformation. Subsequently, a BP neural network was established using these three key characteristic parameters (confining pressure, moisture content, and dynamic stress) as inputs. To improve prediction accuracy, the particle swarm optimization (PSO) algorithm was employed to optimize the initial weights and thresholds of the BP neural network, leading to the development of a novel PSO-BP neural network prediction model for the cumulative plastic deformation of silt soil. The main findings and conclusions are summarized as follows:
In the dynamic triaxial tests, the cumulative plastic deformation of silt soil gradually decreases as confining pressure increases. The cumulative plastic strain rate decreases with the number of cyclic loadings and decays very rapidly after several hundred cycles. After these cycles, the average cumulative plastic strain rate eventually decreases to an extremely low value. Additionally, the cumulative plastic strain rate and the number of cyclic loadings exhibit a good linear correlation.
First, based on the dynamic triaxial test results, Gray relational analysis (GRA) was employed to calculate the correlation coefficients of confining pressure, dynamic stress, and moisture content with cumulative plastic deformation—all of which were relatively high, confirming these three factors as key influencing variables. A database of silt soil’s cumulative plastic deformation was then established using the test data.
Subsequently, both the BP neural network model and the PSO-BP neural network model were developed to predict the axial cumulative plastic strain (εap) of silt soil. Compared with the BP model, the root mean square error (RMSE) of the PSO-optimized model decreased to approximately one-fourth (i.e., a reduction of about 75%).
Furthermore, the PSO-BP model exhibits superior predictive performance for unseen data compared to the Monismith model, fully demonstrating its advantages and reliability. The predicted deformation curves of the PSO-BP model are in good agreement with the experimental results.
Notably, this study constructs a cumulative plastic deformation prediction model using the PSO-BP neural network, which is trained on experimental data and incorporates multiple influencing factors (i.e., moisture content, confining pressure, and dynamic stress). Compared with the BP neural network model and the Monismith model, the PSO-BP model exhibits more excellent fitting performance. Through interpolation, the model can achieve high-precision prediction of unseen data within the defined ranges of dynamic stress, moisture content, and confining pressure; however, predictions for data beyond this parameter range require further investigation.
In addition, factors such as freeze–thaw cycles were not incorporated in the current study. Future research should focus on expanding the scope to construct a comprehensive database encompassing diverse influencing factors, thereby improving the model’s universality and applicability.

Author Contributions

Funding acquisition: Y.Z., Y.W., J.L., L.W., W.Z., Y.Y., S.H. and H.X.; Project administration: Y.Z.; Validation, Resources: Y.Z., Y.W., J.L., L.W., W.Z., Y.Y., S.H. and H.X.; Writing—review & editing: Y.Z., F.T. and J.L.; Data curation: F.T.; Formal analysis: F.T.; Investigation: F.T. and Y.W.; Methodology: F.T. All authors have read and agreed to the published version of the manuscript.

Funding

This research was funded by the Central Guidance for Local Science and Technology Development Funds Project, grant number 2022ZY0052, YDZJSX2025C035. Science and Technology Plan Project of Zhejiang Provincial Department of Transportation, grant number 2023020-2. Natural Science Foundation of Shandong Province, grant number ZR2023ME195. Special Fund for Guiding the Transformation of Scientific and Technological Achievements in Shanxi Province, grant number 202304021301071. National Key Laboratory of Mechanical Behaviour and System Safety of Traffic Engineering Structures, Shijiazhuang Railway University, Project No.: KF2025-09. Shandong Province Enterprise Technology Innovation Project Programme, Project No.: 202350101531, 202350101529. Science and Technology Research Project of Heilongjiang Provincial Education Department, Project No.: 12511566.

Data Availability Statement

The raw data supporting the conclusions of this article will be made available by the authors on request.

Conflicts of Interest

Author Yongbo Wang was employed by the Taizhou Survey and Design Institute of Communications Co., Ltd., who provided funding and teachnical support for the work. Author Yaping Yang was employed by the Inner Mongolia Urban Planning and Municipal Design and Research Institute Limited, who provided funding and teachnical support for the work. Author Sanping Han was employed by the China Railway 17th Bureau Group Co., who provided funding and teachnical support for the work. The remaining authors declare that the research was conducted in the absence of any commercial or financial relationships that could be construed as a potential conflict of interest. The funder had no role in the design of the study; in the collection, analysis, or interpretation of data, in the writing of the manuscript, or in the decision to publish the results.

References

  1. Ren, X.W.; Xu, Q.; Teng, J.; Zhao, N.; Lv, L. A novel model for the cumulative plastic strain of soft marine clay under long-term low cyclic loads. Ocean. Eng. 2018, 149, 194–204. [Google Scholar] [CrossRef]
  2. Ren, X.W.; Xu, Q.; Xu, C.B.; Teng, J.D.; Lv, S.H. Undrained pore pressure behavior of soft marine clay under long-term low cyclic loads. Ocean. Eng. 2018, 150, 60–68. [Google Scholar] [CrossRef]
  3. Xu, L.; Zhang, R.; Zheng, J.; Sun, H.; Gao, Y. Evolution of axial cumulative strain and micro-pore structure characteristics of solidified mud under cyclic loading. Transp. Geotech. 2025, 50, 101454. [Google Scholar] [CrossRef]
  4. Ural, N.; Gunduz, Z. Behavior of Nonplastic Silty Soils under Cyclic Loading. Sci. World J. 2014, 2014, 635763. [Google Scholar] [CrossRef]
  5. Sun, L. Undrained Deformation Characteristics of Soft Marine Clay Subjected to One-Way Cyclic Loading with Variable Confining Pressure. Adv. Mater. Sci. Eng. 2022, 2022, 9630795. [Google Scholar] [CrossRef]
  6. Sun, L. Undrained behavior of marine clay under one-way cyclic loading with variable confining pressure. Sci. Rep. 2024, 14, 13572. [Google Scholar] [CrossRef] [PubMed]
  7. Chen, W.B.; Feng, W.Q.; Yin, J.H.; Chen, J.M.; Borana, L.; Chen, R.P. New model for predicting permanent strain of granular materials in embankment subjected to low cyclic loadings. J. Geotech. Geoenviron. Eng. 2020, 146, 04020084. [Google Scholar] [CrossRef]
  8. Lei, H.; Xu, Y.; Jiang, M.; Jiang, Y. Deformation and fabric of soft marine clay at various cyclic load stages. Ocean. Eng. 2020, 195, 106757. [Google Scholar] [CrossRef]
  9. Chu, F.; Shao, S.J.; Chen, C.L. Experimental study of dynamic deformation and dynamic strength properties of saturated silty sand. Chin. J. Rock Mech. Eng. 2014, 33, 3299–3305. [Google Scholar]
  10. Lai, X.; Jian, W.; Xu, X.; Tang, W. Experimental study on dynamic characteristics of muddy soil in Fuzhou. J. Eng. Geol. 2016, 24, 1302–1308. [Google Scholar]
  11. Li, X.L.; Chen, S.J.; Liu, S.M.; Li, Z.H. AE waveform characteristics of rock mass under uniaxial loading based on Hilbert-Huang transform. J. Cent. South Univ. 2021, 28, 1843–1856. [Google Scholar] [CrossRef]
  12. Li, H.; Li, X.; Fu, J.; Zhu, N.; Chen, D.; Wang, Y.; Ding, S. Experimental study on compressive behavior and failure characteristics of imitation steel fiber concrete under uniaxial load imitation steel fiber concrete under uniaxial load. Constr. Build. Mater. 2023, 399, 132599. [Google Scholar] [CrossRef]
  13. Huang, X.; Tong, H.; Li, S. Dynamic Triaxial Test Investigation of Silty Sand Anti-liquefaction Performance. Sci. Technol. Eng. 2018, 18, 252–256. [Google Scholar]
  14. Cerni, G.; Cardone, F.; Virgili, A.; Camilli, S. Characterisation of permanent deformation behaviour of unbound granular materials under repeated triaxial loading. Constr. Build. Mater. 2012, 28, 79–87. [Google Scholar] [CrossRef]
  15. Chen, C.; Zhou, Z.; Kong, L.; Zhang, X.; Yin, S. Undrained dynamic behaviour of peaty organic soil under long-term cyclic loading, Part I: Experimental investigation. Soil Dyn. Earthq. Eng. 2018, 107, 279–291. [Google Scholar] [CrossRef]
  16. Chen, W.B.; Feng, W.Q.; Yin, J.H.; Borana, L.; Chen, R.P. Characterization of permanent axial strain of granular materials subjected to cyclic loading based on shakedown theory. Constr. Build. Mater. 2019, 198, 751–761. [Google Scholar] [CrossRef]
  17. Guo, L.; Wang, J.; Cai, Y.; Liu, H.; Gao, Y.; Sun, H. Undrained deformation behavior of saturated soft clay under long-term cyclic loading. Soil Dyn. Earthq. Eng. 2013, 50, 28–37. [Google Scholar] [CrossRef]
  18. Tang, L.; Yan, M.H.; Ling, X.Z.; Tian, S. Dynamic behaviours of railway’s base course materials subjected to long-term low-level cyclic loading: Experimental study and empirical model. Géotechnique 2017, 67, 537–545. [Google Scholar] [CrossRef]
  19. Wang, J.; Ling, X.; Li, Q.; Zhang, F.; Li, Y. Accumulated permanent strain and critical dynamic stress of frozen silty clay under cyclic loading. Cold Reg. Sci. Technol. 2018, 153, 130–143. [Google Scholar] [CrossRef]
  20. Monismith, C.L.; Ogawa, N.; Freeme, C.R. Permanent deformation characteristics of subgrade soils due to repeated loading. In Proceedings of the 54th Annual Meeting of the Transportation Research Board, Washington, DC, USA, 13–17 January 1975; pp. 1–17. [Google Scholar]
  21. Rahman, M.S.; Erlingsson, S. Predicting permanent deformation behaviour of unbound granular materials. Int. J. Pavement Eng. 2014, 16, 587–601. [Google Scholar] [CrossRef]
  22. He, Z.; Wang, P.; Liu, Y. Cumulative deformation prediction and microstructure change of coarse-grained soil under cyclic loading. Soil Dyn. Earthq. Eng. 2023, 173, 108136. [Google Scholar] [CrossRef]
  23. Wang, Z.; Xiao, Y.; Aminu, U.F.; He, Q.; Li, Y.; Li, W. Prediction of resilient modulus and critical dynamic stress of recycled aggregates: Experimental study and machine learning methods. Transp. Geotech. 2024, 49, 101363. [Google Scholar] [CrossRef]
  24. Sun, Y.; Zhou, S.; Meng, S.; Wang, M.; Bai, H. Accumulative plastic strain of freezing–thawing subgrade clay under cyclic loading and its particle swarm optimisation–back-propagation-based prediction model. Cold Reg. Sci. Technol. 2023, 214, 103946. [Google Scholar] [CrossRef]
  25. Mei, H.; Leng, W.; Liu, W.; Nie, R.; Xu, X. Experimental study on accumulated plastic strain of coarse grained soil filling in subgrade bed under persistent dynamic loading. J. China Railw. Soc. 2017, 39, 119–126. [Google Scholar]
  26. Ramezan, C.; Warner, T.A.; Maxwell, A.E. Evaluation of sampling and cross-validation tuning strategies for regional-scale machine learning classification. Remote Sens. 2019, 11, 185. [Google Scholar] [CrossRef]
  27. JTG 3430-2020; Geotechnical Test Procedure for Roads. People’s Communications Press: Beijing, China, 2020.
  28. Chen, K.; Liu, X.; Jiang, G.; Yuan, S.; Ma, J.; Chen, Y. Effect of water content on dynamic properties of red mudstone fill material. Rock Soil Mech. 2024, 45, 3705–3716. [Google Scholar]
  29. Ai, X. Research on Cumulative Deformation Behaviour of Loess Improved by Nano-SiO2 Based on Stability Theory. Ph.D. Thesis, Sichuan Agricultural University, Chengdu, China, 2023. [Google Scholar]
  30. Liu, S. Experimental Study on Deformation Characteristics and Shear Characteristics of Loess Under Wet Load. Master’s Thesis, Changan University, Xi’an, China, 2023. [Google Scholar]
  31. Liu, S.; Cai, H.; Cao, Y.; Yang, Y. Advance in grey incidence analysis modelling. In Proceedings of the IEEE International Conference on Systems, Man, and Cybernetics, Anchorage, AL, USA, 9–12 October 2011; pp. 1886–1890. [Google Scholar]
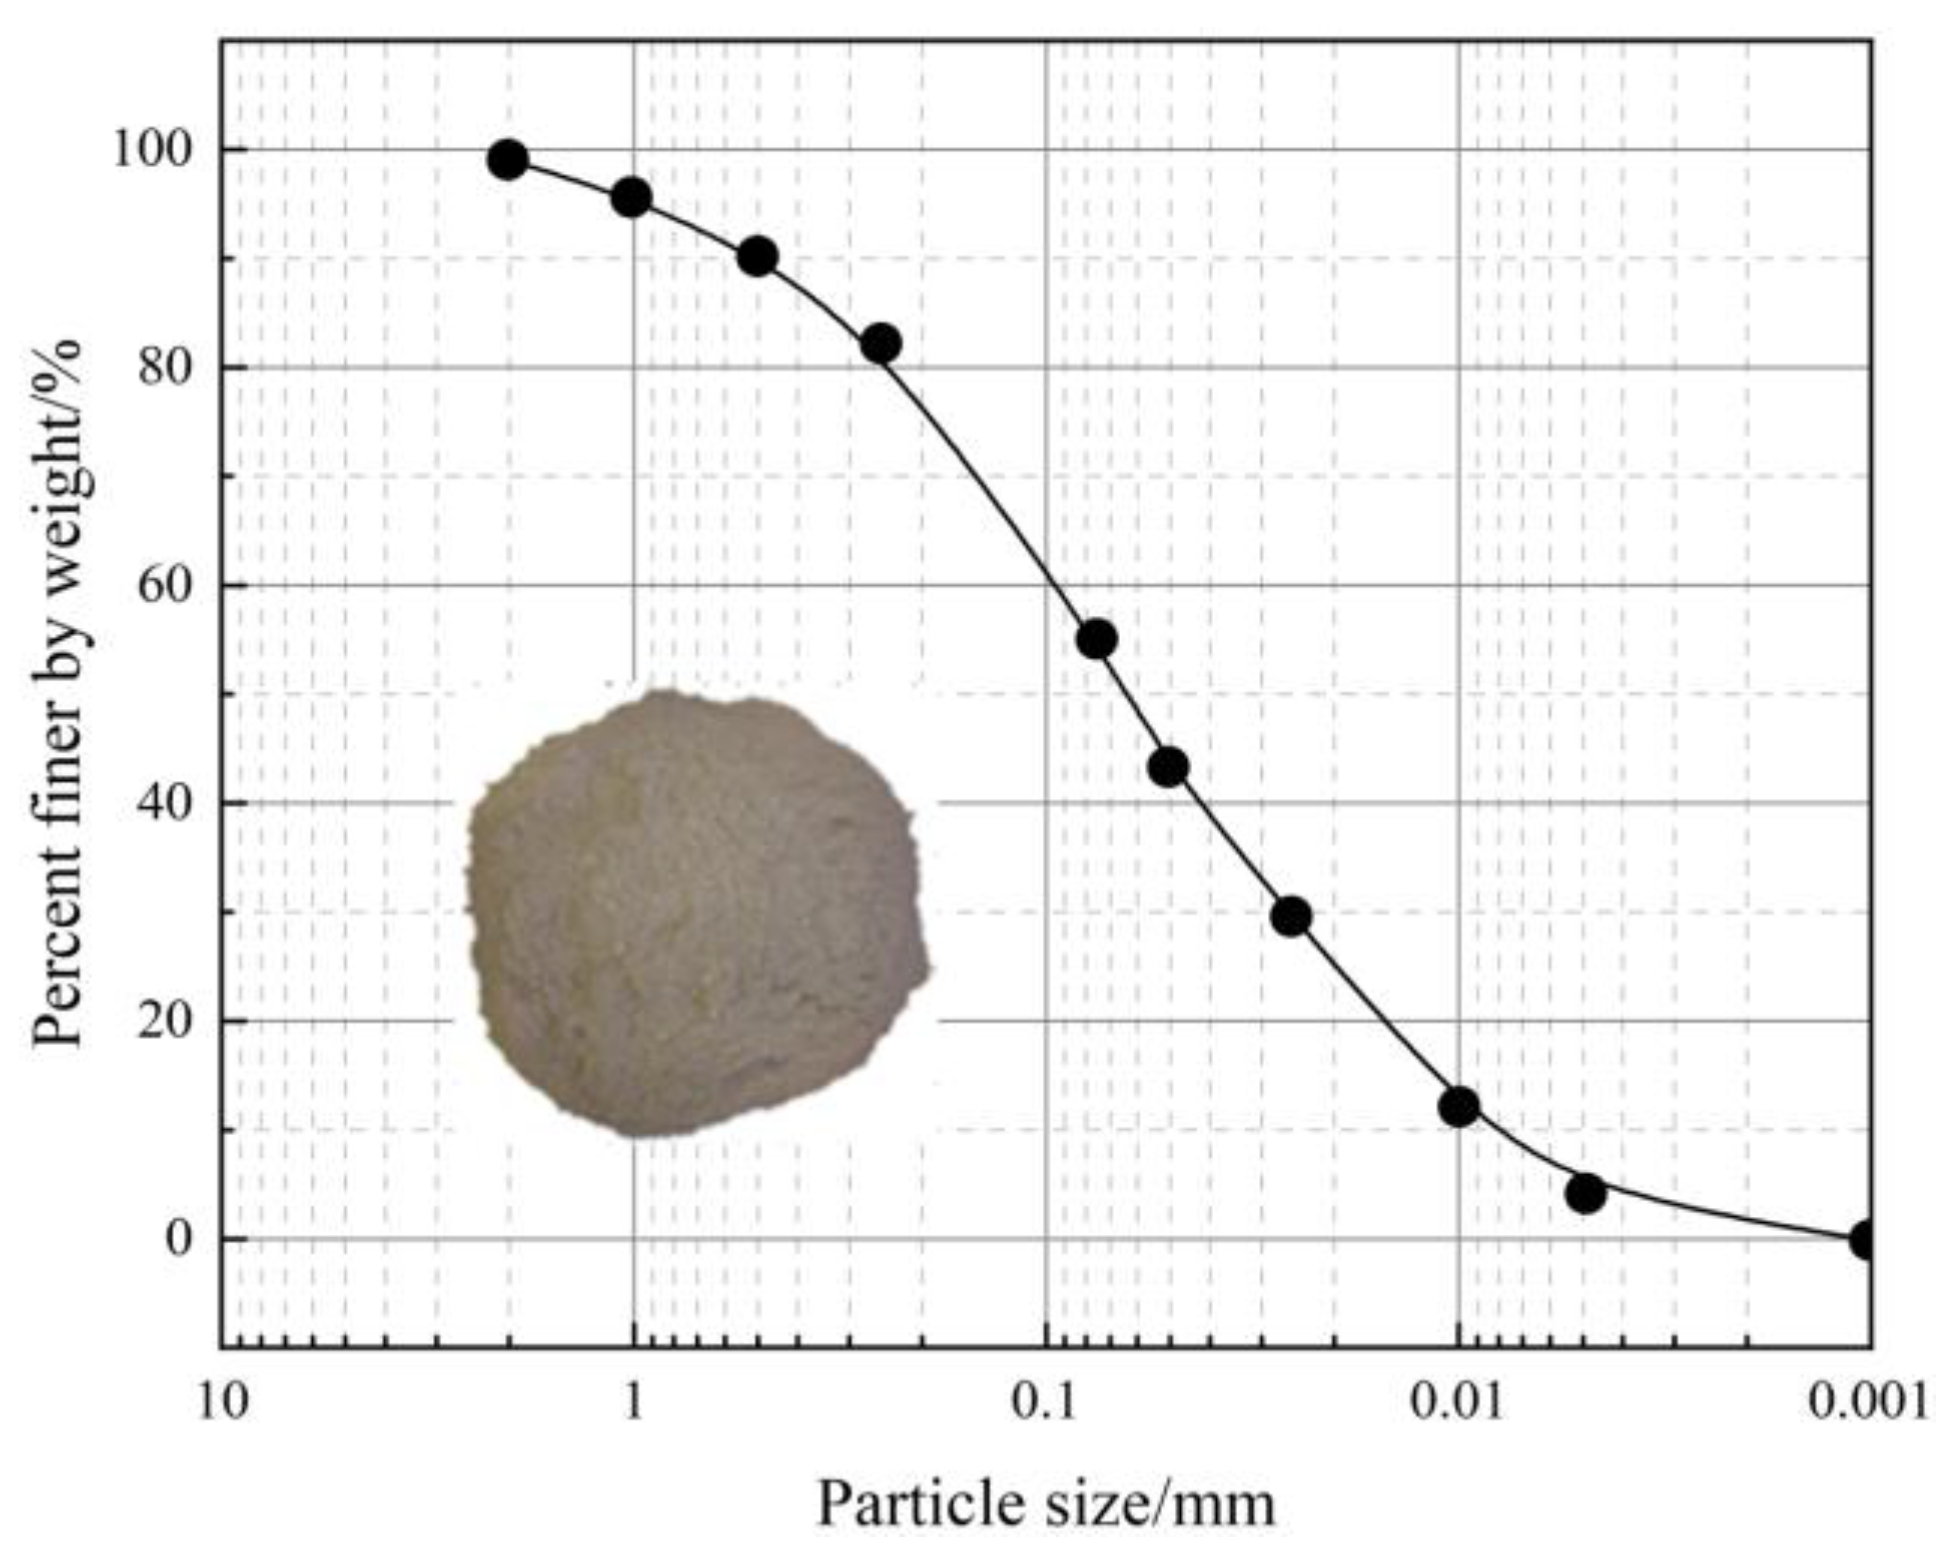
Figure 1. Particle size distribution of the test silt soil sample.
Buildings 15 04126 g001
Figure 2. Schematic diagram of the test equipment.
Buildings 15 04126 g002
Figure 3. Schematic diagram of cyclic loading.
Buildings 15 04126 g003
Figure 4. Variation in axial cumulative plastic strain with number of cycles.
Buildings 15 04126 g004
Figure 5. Variation in axial cumulative deformation with the number of cycles at different moisture contents: (a) 17.3% moisture content; (b) 18.3% moisture content; (c) 19.3% moisture content; (d) 20.3% moisture content; and (e) 21.3% moisture content.
Buildings 15 04126 g005
Figure 6. Relationship between dynamic stress and cumulative deformation under different moisture contents.
Buildings 15 04126 g006
Figure 7. Variation curve of axial strain rate with the number of cycles for moisture content 17.4%, confining pressure 90 kPa.
Buildings 15 04126 g007
Figure 8. Variation Curve of Axial Strain Rate with the Number of Cycles under a Moisture Content of 20.4% and a Confining Pressure of 90 kPa.
Buildings 15 04126 g008
Figure 9. Fitted Curve of Cumulative Plastic Strain Rate versus the Change in the Number of Cycles under a Moisture Content of 17.4% and a Confining Pressure of 90 kPa.
Buildings 15 04126 g009
Figure 10. Fitted Curve of Cumulative Plastic Strain Rate versus the Change in the Number of Cycles under a Moisture Content of 20.4% and a Confining Pressure of 90 kPa.
Buildings 15 04126 g010
Figure 11. Predicted effects of Monismith’s model.
Buildings 15 04126 g011
Figure 12. PSO-BP Neural Network Flowchart.
Buildings 15 04126 g012
Figure 13. Evolution of model loss value considering population size.
Buildings 15 04126 g013
Figure 14. Particle swarm optimization process.
Buildings 15 04126 g014
Figure 15. Training results of four measurement points: (a) w = 17.3%, σ3 = 90 kPa, σd = 270 kPa; (b) w = 20.3%, σ3 = 90 kPa, σd = 270 kPa.
Buildings 15 04126 g015
Figure 16. Debugging of Hidden Layer Neuron Number for Silt Soil Cumulative Plastic Deformation Prediction.
Buildings 15 04126 g016
Figure 17. BP and PSO-BP performance and error real measurements: (a) Performance of BP vs. PSO-BP test set; (b) BP vs. PSO-BP error curves.
Buildings 15 04126 g017
Figure 18. PSO-BP prediction results under different working conditions: (a) PSO-BP prediction results under different confining pressures; (b) PSO-BP prediction results under different dynamic stress.
Buildings 15 04126 g018
Figure 19. Comparison of PSO-BP and Monismith model prediction results.
Buildings 15 04126 g019
Figure 20. Comparison of the prediction results of multiple axial cumulative deformation prediction models.
Buildings 15 04126 g020
Figure 21. Comparison of PSO-BP, BP, and Monismith model: (a) R2; (b) RMSE; (c) MSE.
Buildings 15 04126 g021
Table 1. Basic physical characteristics of the silt soil used in the test.
Natural Moisture Contents (%)Optimum Moisture Contents (%)Maximum Dry Density (g/cm3)Plastic Limit (%)Liquid Limit (%)
20.317.41.7418.7933.51
Table 2. Dynamic triaxial test program.
Moisture Contents/%Confining Pressure/kPaDynamic Stress/kPa
17.460240 → 250 → 260 → 270 → 280
17.490, 120, 150250 → 260 → 270 → 280 → 290
18.490170 → 180 → 190 → 200 → 210
19.490170 → 180 → 190 → 200 → 250
20.490130 → 140 → 150 → 160 → 170
21.490100 → 110 → 120 → 130 → 150
Table 3. Linear fitting parameters.
Moisture Content/%Dynamic Stress/kPafg
17.4250−0.953−0.993
17.4260−0.986−0.625
17.4270−1.016−0.462
17.4280−0.995−0.423
20.4130−0.937−0.517
20.4140−1.039−0.341
20.4150−0.981−0.764
20.4160−0.939−1.020
20.4170−0.956−1.266
Table 4. Monismith model parameters.
Moisture Content
/%
Dynamic Stress
/kPa
Confining Pressure
/kPa
abR2
17.4250602.32230.08060.9881
17.4250901.51940.08390.8986
17.42501201.35440.0870.9917
17.42501501.39940.08850.8779
18.4180901.50070.07980.9935
19.4180901.59020.10290.9925
20.4140901.27420.06840.8998
21.4110901.16960.06450.9996
Note: Most of the remaining confining pressure and moisture content fits exceed 0.85.
Table 5. PSO-neural network evaluation indicators.
DatasetCoefficient of DeterminationMean Absolute ErrorRoot Mean Square Error
R2MAERMSE
Training Set0.9920.0120.0031
Test Set0.9930.0140.0020
Disclaimer/Publisher’s Note: The statements, opinions and data contained in all publications are solely those of the individual author(s) and contributor(s) and not of MDPI and/or the editor(s). MDPI and/or the editor(s) disclaim responsibility for any injury to people or property resulting from any ideas, methods, instructions or products referred to in the content.