1. Introduction
In the era of digitalization and intelligent systems, public safety remains a pressing concern across diverse built environments. In university campuses, behavior-related safety risks are often aggravated by architectural and spatial design factors, such as poor lighting, uneven flooring, or congested circulation zones. Conventional surveillance systems can record these events but lack the analytical capacity to identify where and why such risks frequently occur, highlighting the need for adaptive monitoring methods that link behavioral detection with spatial safety improvement. With recent advances in artificial intelligence—particularly deep learning and computer vision—new opportunities have emerged to use intelligent models not only for event recognition but also as diagnostic tools for spatial risk evaluation and evidence-based design enhancement.
In recent years, abnormal behavior detection has become a major focus of deep learning research. Most existing studies concentrate on outdoor scenarios or public transportation hubs, emphasizing object recognition and risk warning [
1,
2]. Commonly used methods include the YOLO series (YOLOv4/v5/v7/v8), CNNs, and LSTMs, which have demonstrated promising real-time performance and accuracy [
3,
4]. In the educational domain, some scholars have applied such algorithms to classroom engagement monitoring [
5], student emotion and attendance detection [
6], and classroom state recognition [
7]. Improvements in system responsiveness have also been achieved through head pose recognition and multimodal sensing [
8,
9]. In addition, for dormitory safety and contraband detection, Jahid et al. [
10] proposed the DormGuardNet framework, which optimized YOLO specifically for student dormitory environments and constructed the dedicated PISD dataset to address challenges such as high concealment and low inspection efficiency.
In the architecture, engineering, and construction (AEC) domain, activity recognition techniques have similarly evolved from early sensor-based machine learning to advanced computer-vision approaches, achieving higher accuracy and broader applicability. Zhang et al. combined LSTM algorithms with the MediaPipe framework to recognize workers’ actions, providing an effective solution for improving construction management and ensuring on-site safety [
11]. Onososen et al. analyzed facial and ocular features of construction workers to identify fatigue symptoms and develop preventive strategies to reduce accidents [
12]. Wang et al. employed machine learning models with points-of-interest (POI) and thermal environmental features as inputs to generate high-resolution insights into behavioral drivers [
13]. Zhao et al. [
14] improved the equipment pose estimation accuracy using enhanced AlphaPose and YOLOv5-FastPose models, while Feng et al. [
15] proposed a camera-marking network to estimate complex equipment postures and reduce uncertainty. Liang et al. [
16] implemented real-time 2D–3D pose estimation for construction robots through deep convolutional networks without additional markers or sensors, and Luo et al. [
17] predicted equipment posture and potential safety hazards using historical monitoring data and neural networks. In terms of human posture assessment, Ray et al. [
18] applied deep learning and vision-based methods to monitor workers’ body positions in real time and evaluate ergonomic compliance, while Paudel et al. [
19] integrated CMU OpenPose with ergonomic assessment tools to automatically identify risky postures and enhance workplace safety. These studies collectively demonstrate that human activity recognition serves as an effective foundation for diagnosing spatial risks and informing safety-oriented design and management strategies in the built environment.
In the field of architectural safety and human factors, previous studies have emphasized that accident prevention in built environments depends not only on hazard detection but also on the spatial and ergonomic design of circulation areas [
20]. Recent studies highlight that safety in built environments is inherently multidimensional, integrating physical, perceptual, and environmental dimensions of indoor quality [
21,
22,
23]. Research on human–environment interaction shows how floor materials, illumination, and accessibility features directly influence postural stability and fall likelihood [
24,
25,
26,
27]. Moreover, Atlas [
28] demonstrated that poor architectural decisions—such as uneven level transitions, discontinuous handrails, excessive thresholds, and inadequate lighting—are recurrent design failures contributing to slip, trip, and fall accidents. He further noted that “the lack of perception by the human brain to detect a change in elevation or a change in surface” is a key cause of falls in unfamiliar environments, underscoring the inseparability of human factors and spatial design in safety management. This aligns with findings from Wittek et al. [
29], who emphasized that inadequate visual cues and spatial ambiguity reduce occupants’ sense of control and increase behavioral risk in complex indoor settings. Similarly, ergonomic risk assessment frameworks, such as REBA and RULA, have been applied to evaluate posture-related hazards in construction and public interiors [
30]. Within campus contexts, indoor safety audits reveal that glare, narrow corridor design, and slippery floor materials significantly increase accident risk [
31,
32]. These studies collectively suggest that effective safety management requires integrating behavioral monitoring with architectural diagnostics and environmental quality indicators.
For broader human activity recognition tasks, such as abnormal behavior detection, posture change, and collective behavior analysis, numerous studies have introduced diverse deep models, including C3D [
33], LRCN [
34,
35], and deep belief networks [
36]. Most of these models have achieved recognition accuracies exceeding 90% and are gradually evolving toward intelligent surveillance, real-time response, and behavior prediction. Nevertheless, these approaches remain limited when applied to university campuses, which are inherently more complex and dynamic. Existing models often address specific scenarios but struggle with the fragmented, sporadic, and time-sensitive nature of crises that occur in higher-education environments. University settings, therefore, present additional challenges: they are characterized by open and heterogeneous spaces, infrequent crisis events, and the urgent need for rapid emergency responses. Addressing these issues requires solutions that not only ensure accurate and efficient detection but also support lightweight deployment and provide transparent reasoning.
The present study addresses these gaps by introducing YOLOv11-Safe, an intelligent monitoring and spatial diagnostic framework specifically designed for campus safety. The main contributions are: (i) an improved YOLOv11 detector enhanced with attention and geometry-aware loss functions for robust crisis detection, (ii) a risk-level prediction mechanism based on Random Forest and SHAP analysis to identify spatial zones with higher structural or behavioral risk and guide modification strategies, and (iii) a dedicated dataset of crisis scenarios enabling systematic evaluation against conventional baselines. Experimental results demonstrate that the framework achieves superior detection performance while remaining lightweight and interpretable. While the proposed B-SAFE system is conceptually outlined to demonstrate potential integration into campus safety infrastructure, its implementation remains a prototype-level framework that requires further empirical validation through long-term deployment and user studies.
2. Materials and Methods
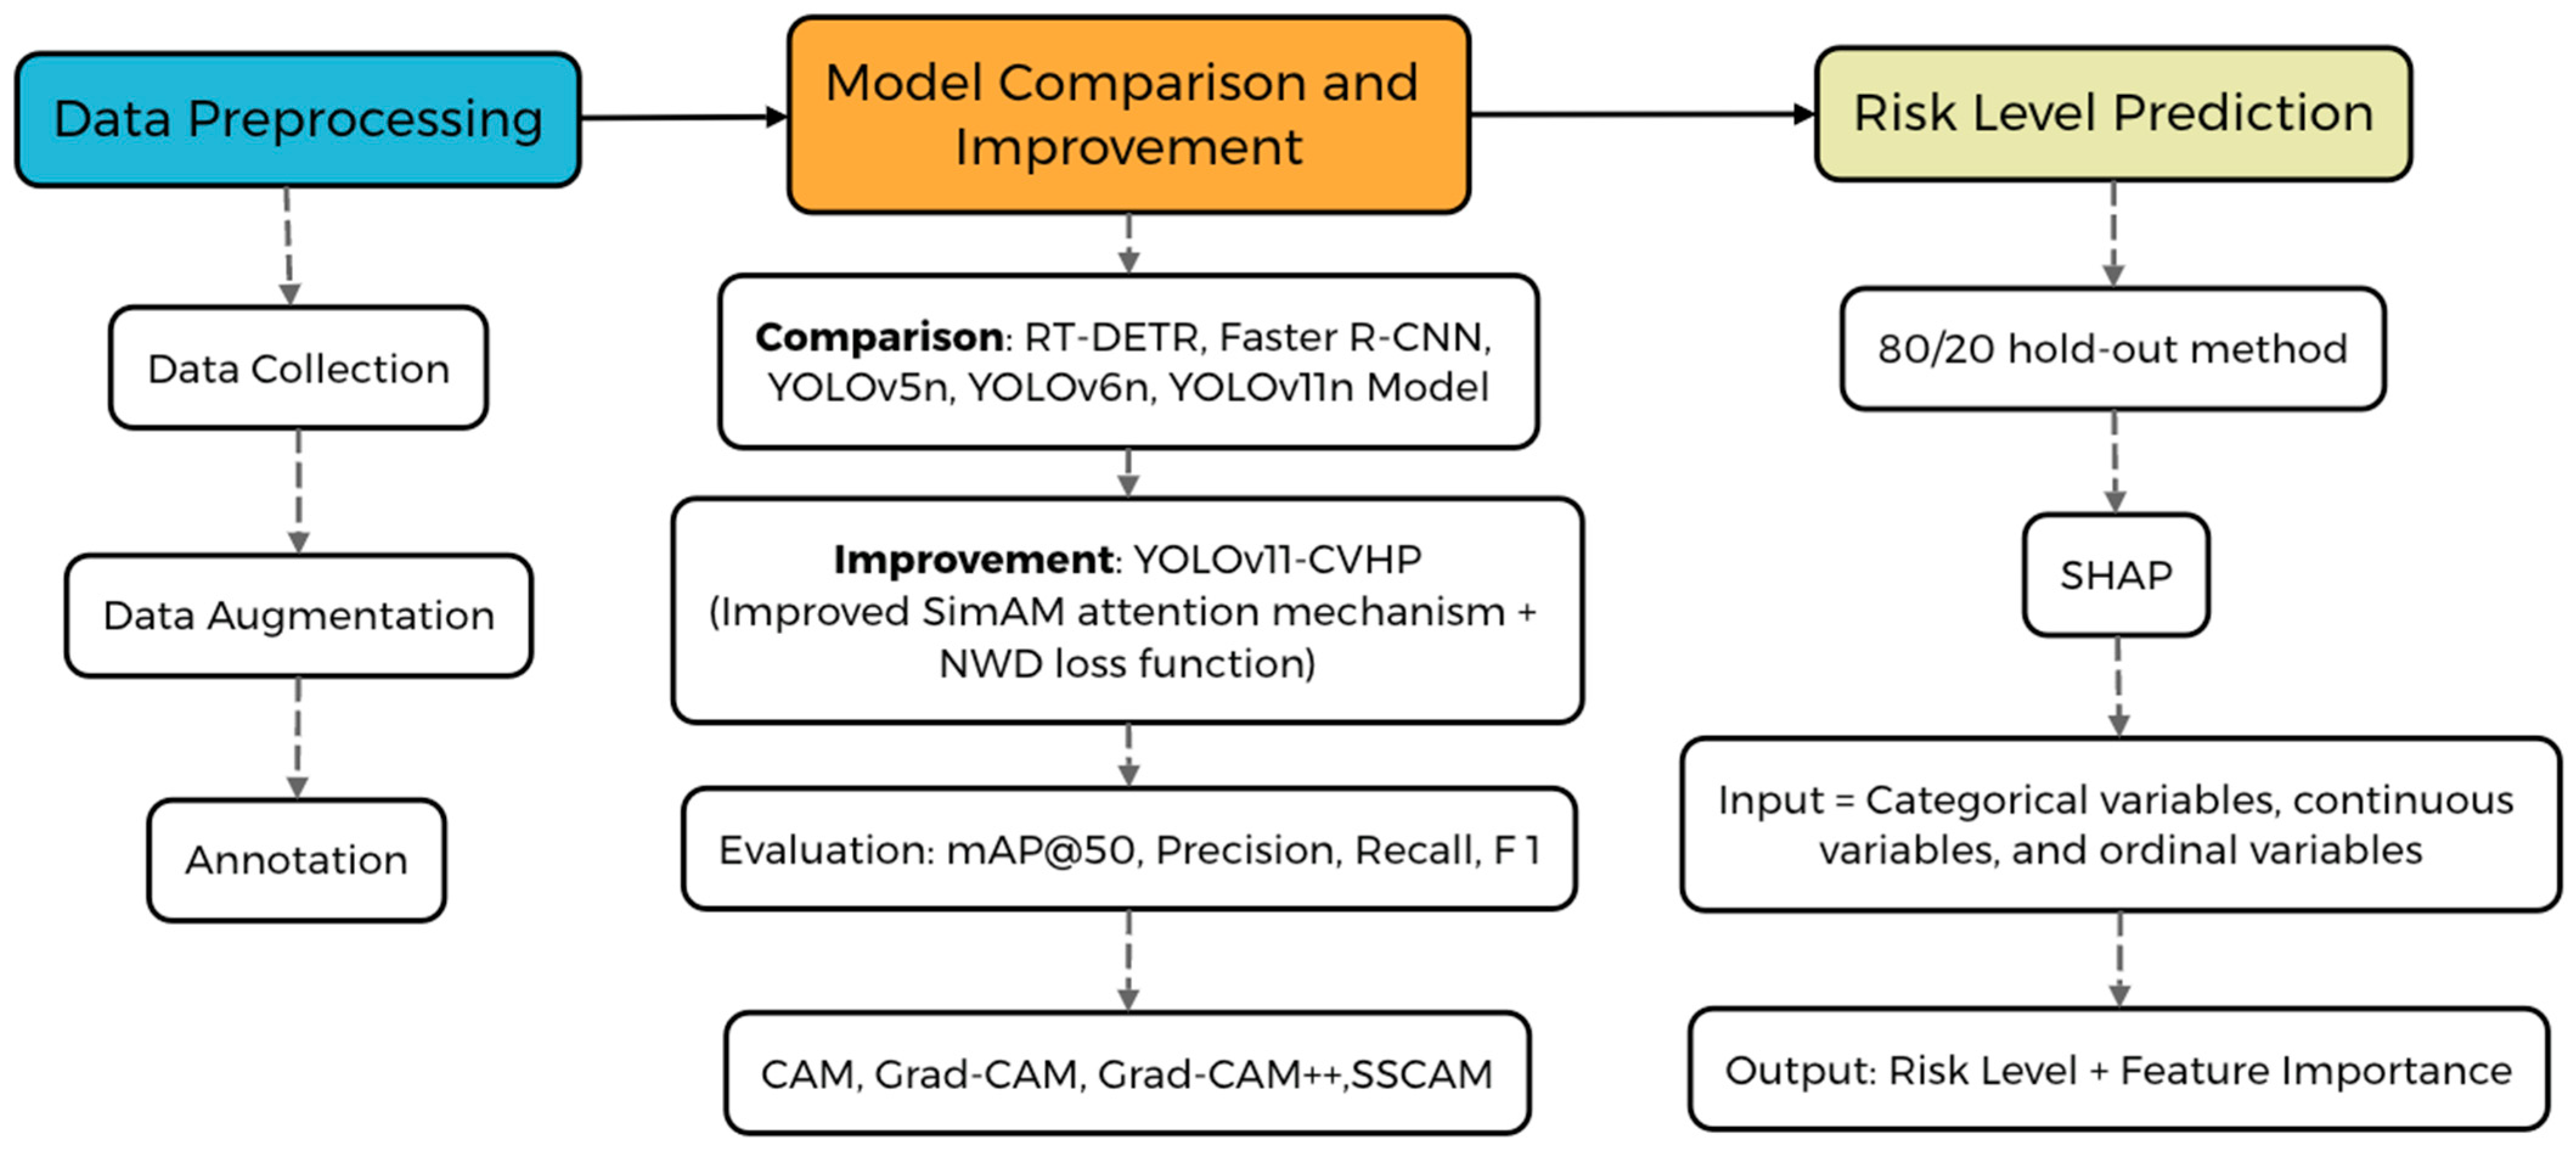
The deep learning framework consists of three stages: data preprocessing, model comparison and improvement, and risk-level prediction, as shown in
Figure 1. First, a dedicated dataset of building-related safety events, including falls and wheelchair accidents that frequently occur in interior campus environments such as corridors, staircases, and ramps, was constructed and preprocessed with extensive data augmentation strategies. These events were selected because they directly reflect the relationship between human behavior and architectural safety performance, providing a foundation for evidence-based design evaluation. Second, a comparative analysis of mainstream detectors was conducted, leading to the development of the improved YOLOv11-Safe framework, which integrates a modified SimAM attention mechanism and a normalized Wasserstein distance (NWD) loss function to enhance localization accuracy and robustness in indoor environments. Finally, a risk-level prediction stage was implemented using a Random Forest model with SHAP-based interpretability to quantify how spatial attributes—such as floor material, lighting, and slope—affect the likelihood and severity of safety incidents. Together, these stages establish a unified framework linking deep learning-based behavior detection with architectural safety assessment and spatial retrofit decision support.
2.1. Data Preprocessing
A dedicated dataset of 1000 annotated images was constructed to represent two common safety-critical categories—falling and wheelchair instability—each comprising 500 samples. Although the dataset size is moderate, diversity and representativeness were prioritized through multi-source collection and extensive augmentation. Data were obtained from two sources: (i) Real-world campus recordings, collected in collaboration with university security and medical departments across three different semesters (2023–2024) to capture seasonal lighting variations and occupancy patterns. Recordings covered daytime and nighttime conditions under varied illumination and crowd densities, using Hikvision DS-2CD2021G1-IDW and Dahua IPC-HFW3249T cameras (1080 p, 25 fps). (ii) Open-access safety video repositories and emergency drill datasets, including curated subsets collected from public behavior recognition datasets for safety and emergency response at
https://blog.csdn.net/guyuealian/article/details/130184256 (accessed on 10 August 2025). These publicly available resources compile representative fall and accident scenarios captured in controlled environments, which were further screened by our research team to ensure contextual alignment with university campus conditions. All videos and images were anonymized and reprocessed to remove personal identifiers, following institutional ethical standards. All external data were screened to ensure contextual relevance to campus environments and anonymized according to institutional privacy guidelines (no identifiable faces or personal data). All data collection and processing procedures complied with institutional research ethics guidelines and the relevant national data protection regulations of the People’s Republic of China, including the Personal Information Protection Law (PIPL) and the Cybersecurity Law. All recordings were fully anonymized before analysis: automatic face and body blurring were applied using the OpenCV and MediaPipe libraries, followed by manual inspection to ensure that no personally identifiable information was visible. Metadata such as timestamps, camera IDs, and location details were removed. All videos were collected either from publicly available safety datasets or controlled campus recordings conducted in non-sensitive, low-risk environments (e.g., corridors, staircases, dormitories, and open walkways) without capturing identifiable individuals. The resulting dataset contains no personal information and is used solely for academic research purposes. The dataset was fully anonymized prior to analysis, and no identifiable facial or personal information was stored, displayed, or used in training. The study followed institutional privacy protection principles consistent with national data security standards in China. In addition, this study focuses on two representative categories—falls and wheelchair instability—chosen due to their frequency in campus environments and the ethical feasibility of data collection under controlled conditions. These categories serve as proxies for broader safety-critical behaviors that share similar spatial and biomechanical features.
To enhance model robustness, multiple augmentation strategies were applied: random cropping, ±90° rotation, horizontal flipping, Gaussian blur, and background normalization. For cluttered indoor scenes, GrabCut-based foreground extraction was applied to highlight motion-active regions. This ensured coverage of diverse conditions, including occlusion, background clutter, low illumination, and multi-person overlaps.
Annotation was performed by a team of three trained security researchers, each with at least two years of surveillance analysis experience. Every image was independently annotated by two annotators and then reviewed in a third consensus round. Bounding boxes followed YOLOv11 format standards and were verified using an IoU ≥ 0.5 criterion for inter-annotator consistency. Cases with disagreement (IoU < 0.5 or >10 px centroid displacement) were reviewed jointly, and consensus was reached through majority voting. Across all scenes, the mean Cohen’s Kappa coefficient was 0.91 (SD = 0.04), with per-scene values ranging from 0.87 (dormitory corridors) to 0.94 (staircases), indicating high annotation reliability. To further assess labeling consistency across different contexts, Cohen’s Kappa coefficients were computed separately by category (fall vs. wheelchair), period (daytime vs. nighttime), and scene type. The overall mean κ remained 0.91 (SD = 0.04). Stratified analysis showed κ = 0.92 for fall incidents and κ = 0.89 for wheelchair instability, indicating consistent annotation quality across event types. Temporal analysis yielded κ = 0.90 for daytime and κ = 0.91 for nighttime samples, demonstrating negligible illumination-related bias. Scene-level values ranged from 0.87 in dormitory corridors (where partial occlusions were common) to 0.94 in staircases, confirming robust inter-annotator agreement across spatial conditions. Disputed samples (IoU < 0.5 or centroid displacement > 10 px) accounted for approximately 3.2% of all annotated instances and were resolved through a third-round consensus review.
To prevent data leakage, all frames belonging to the same event sequence (same camera, same timestamp cluster within ±2 s) were grouped as a single unit and assigned to one split only. This ensured that no temporally adjacent frames or correlated video segments appeared across training, validation, and test subsets. The final dataset split was 70% training, 20% validation, and 10% testing, with 20% of the training subset reserved internally for hyperparameter tuning. Although the test subset represents approximately 10% of the total data (around 100 images), it includes samples from all seven spatial scenes and both behavioral categories, ensuring adequate coverage of lighting, crowding, and viewpoint variations.
The YOLOv11-Safe framework was trained entirely from scratch, as the newly introduced components—SimAM attention layers and the NWD loss function—do not have any pretrained weights available. Following the standard practice of YOLO-based detectors, the stochastic gradient descent (SGD) optimizer was employed by YOLOv11-Safe with an initial learning rate of 1 × 10⁻², momentum = 0.9, and weight decay = 1 × 10⁻⁴. The batch size was set to 16, and training images were resized to 640 × 640. A cosine-annealing learning-rate scheduler was applied to enhance convergence stability.
All experiments were conducted using an NVIDIA RTX 4090 GPU (24 GB VRAM) and an Intel Core i9-13900K CPU on a workstation with 64 GB RAM. The models were implemented in Python 3.10 and PyTorch 2.1.0 under Ubuntu 22.04 LTS, with CUDA 12.1 and cuDNN 8.9 acceleration.
The training process was executed for a maximum of 200 epochs, with early stopping triggered after 50 consecutive epochs without improvement in the validation F1 score. To ensure reproducibility and robustness, all random processes (data shuffling, weight initialization, and augmentation order) were controlled by fixed random seeds. Each full training configuration was repeated five times with independent seeds, and the final model was selected based on the highest mean validation F1 score across runs. For the ablation experiments in Results section, each configuration was trained and evaluated three times, and results are reported as mean ± standard deviation across runs to reflect statistical consistency under limited data conditions.
2.2. Model Comparison and Improvement
To establish a performance baseline, several mainstream detectors were evaluated, including RT-DETR [
37], Faster R-CNN [
38], and the YOLO family. While YOLOv11 offers competitive accuracy–efficiency trade-offs, challenges remain in (i) focusing on critical body regions under diverse postures, (ii) discriminating behaviors under complex backgrounds, and (iii) ensuring robustness under low-quality inputs.
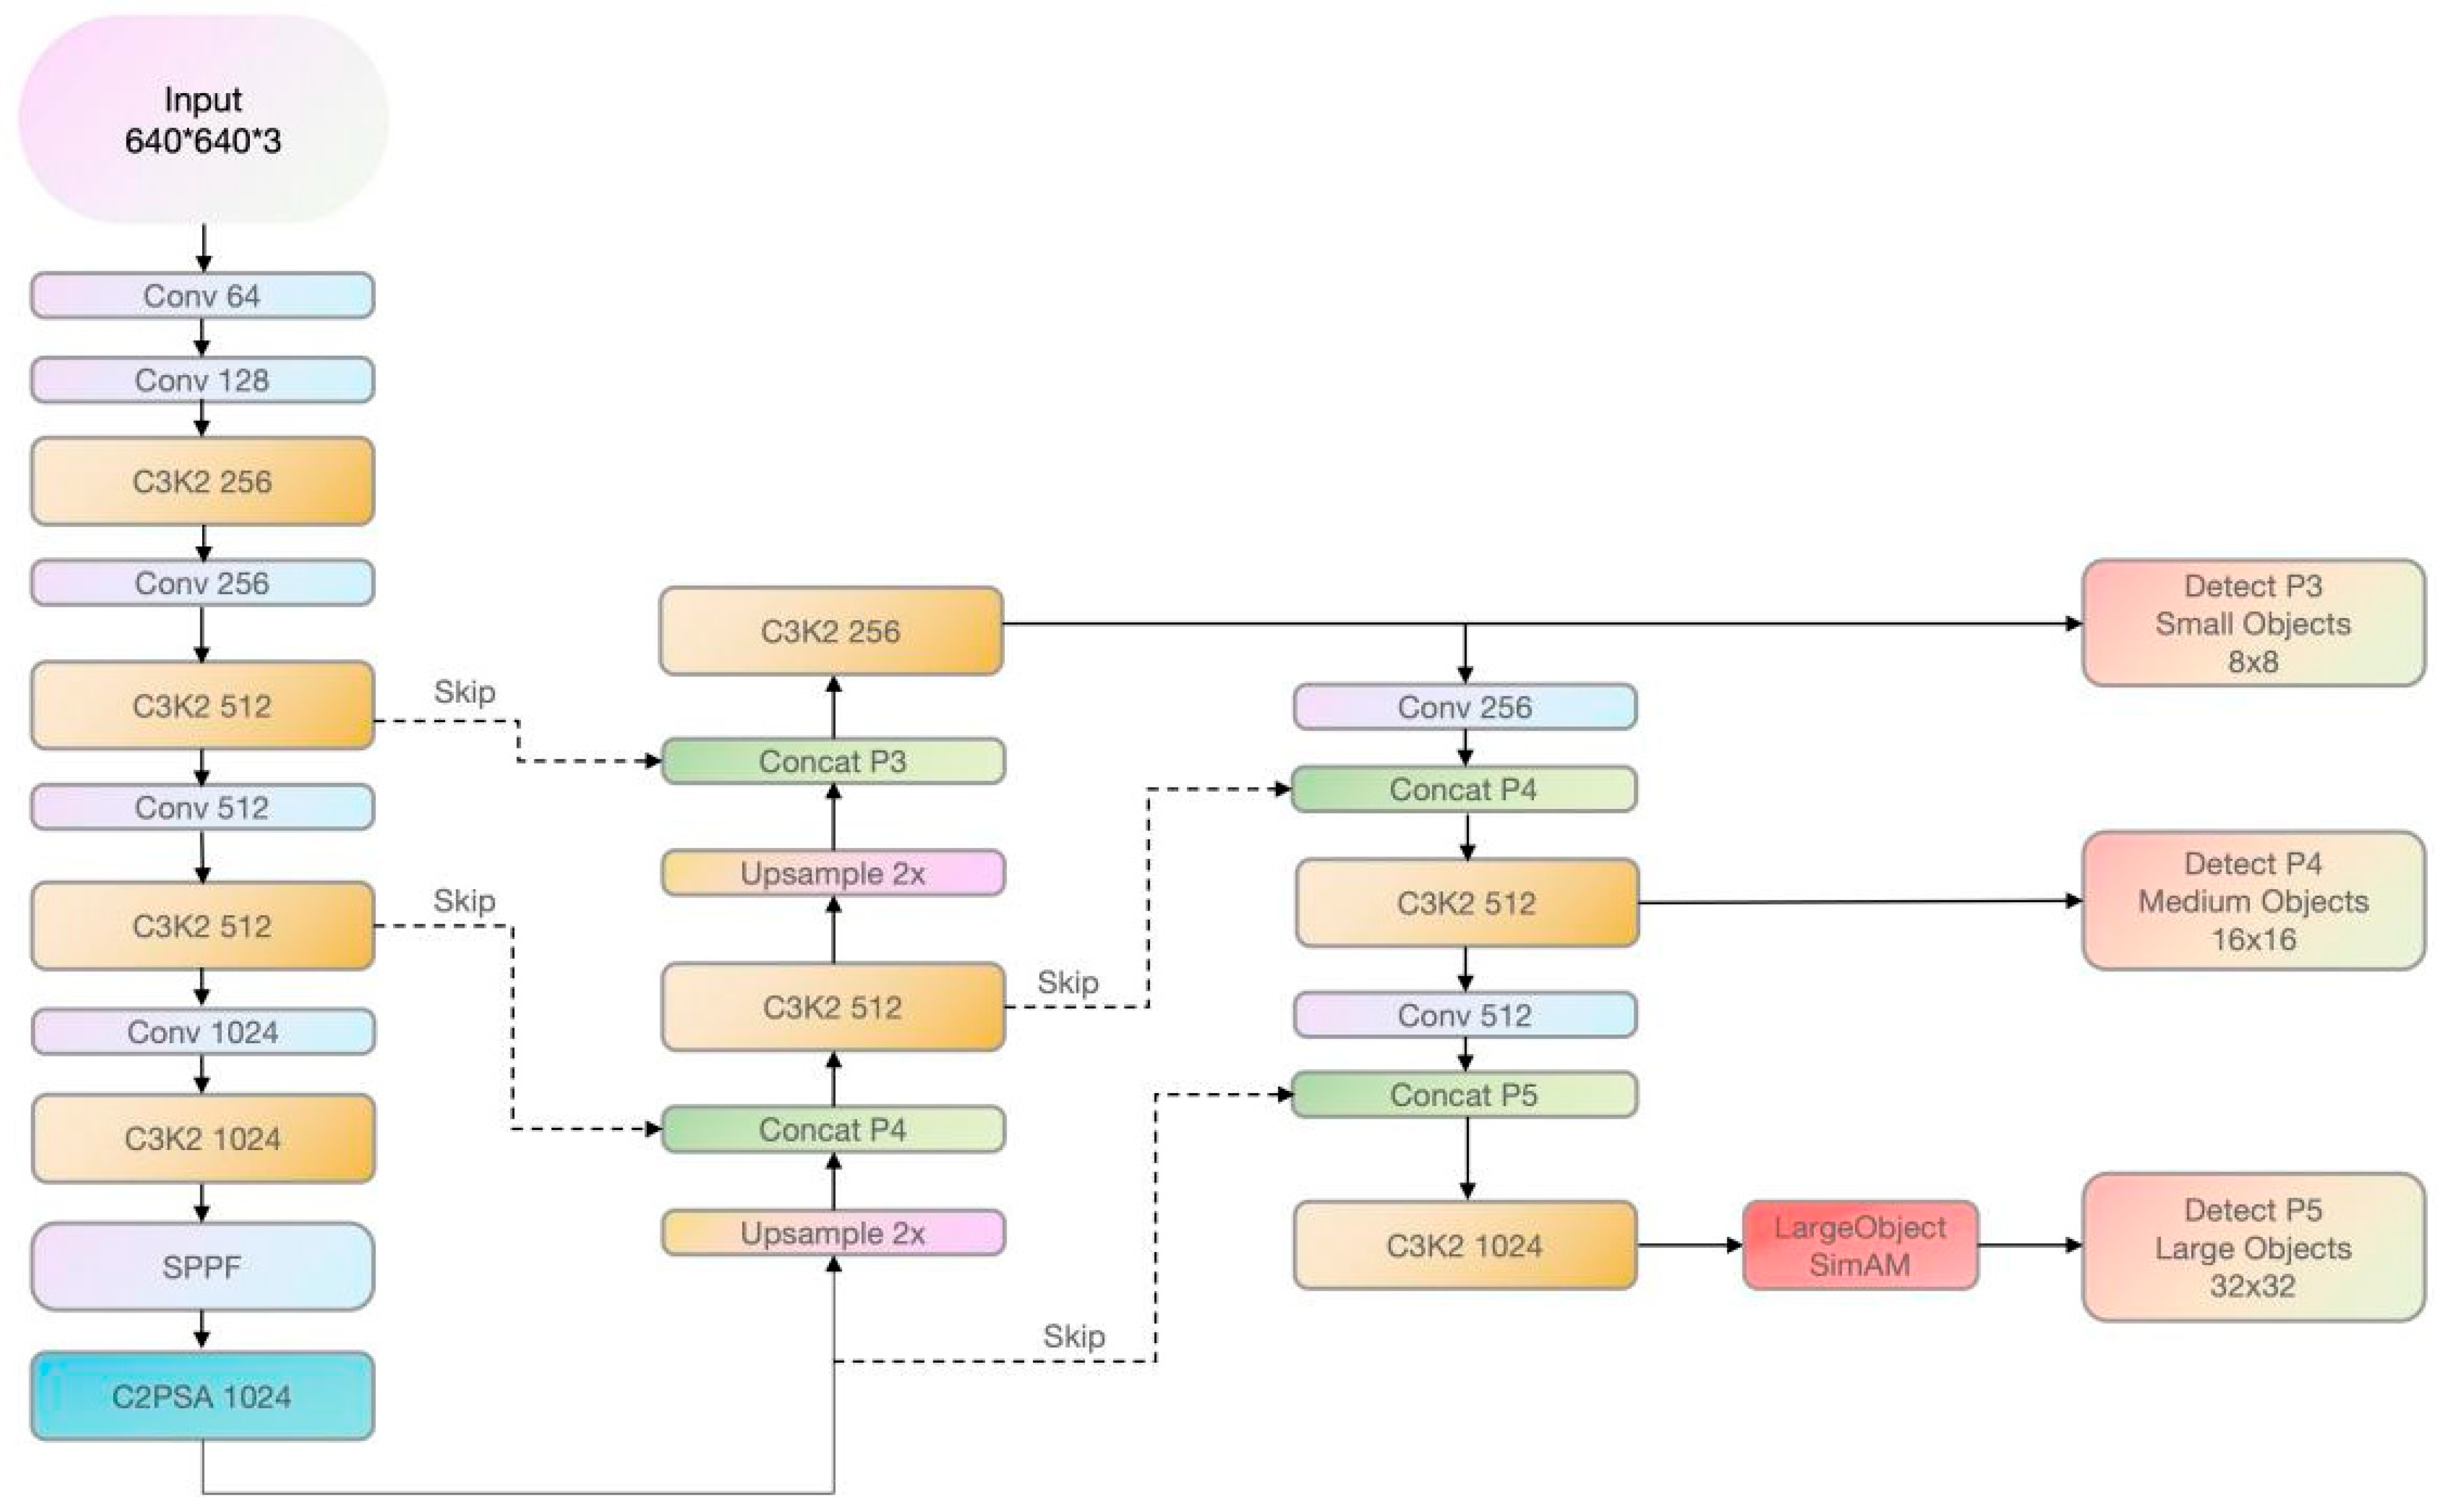
To address the challenges, this study introduces the YOLOv11-Safe framework, a task-driven extension of YOLOv11 tailored for safety-critical behavior detection in educational environments, as shown in
Figure 2. Unlike generic object detectors, YOLOv11-Safe strategically integrates two core improvements—an enhanced SimAM attention mechanism and a Normalized Wasserstein Distance (NWD) loss function [
39]—to jointly improve localization accuracy, robustness under occlusion, and interpretability of predictions. The integration of these modules is not an arbitrary stacking of components but rather a functionally coordinated strategy designed specifically to meet the challenges of heterogeneous crisis events: (i) significant pose variability across different categories, (ii) interference from complex campus backgrounds (crowds, occlusion, illumination changes), and (iii) degraded input quality due to camera placement or motion blur.
At the backbone level, the framework preserves the standard YOLOv11 feature extraction pipeline to maintain efficiency on large-scale surveillance data. To mitigate the difficulty of detecting subtle local features under significant posture variations, an improved SimAM module is introduced at the P5 layer. By fusing global statistics (mean, variance of feature maps) with local contextual cues (regional pooling and variance estimation), the modified SimAM dynamically balances long-range context with fine-grained local signals. Additionally, a position-aware weighting scheme is employed to emphasize central body regions, which typically carry higher semantic salience. This design enables the network to focus on critical body parts more effectively (e.g., head, arms, torso tilt) under conditions of overlapping individuals or visual noise.
For bounding box regression, the traditional IoU-based losses are replaced by the NWD loss function, which models predicted and ground-truth boxes as spatial probability distributions. NWD jointly considers the center displacement and scale discrepancy between boxes and normalizes the Wasserstein distance with a constant factor to achieve scale-invariant optimization. Compared with IoU and its variants, NWD provides smoother gradients and superior convergence stability, particularly in cases of incomplete boundaries, small object detection, and blurred inputs. This ensures reliable localization even under adverse imaging conditions.
Furthermore, the framework explicitly accounts for event diversity across scales by optimizing detection at three hierarchical branches: P3 (small objects), P4 (medium objects), and P5 (large objects). A LargeObject-SimAM variant is deployed at P5, enabling enhanced attention allocation to large-scale, whole-body movements. This multi-branch optimization ensures robustness across both fine-scale subtle motions and coarse-scale full-body dynamics.
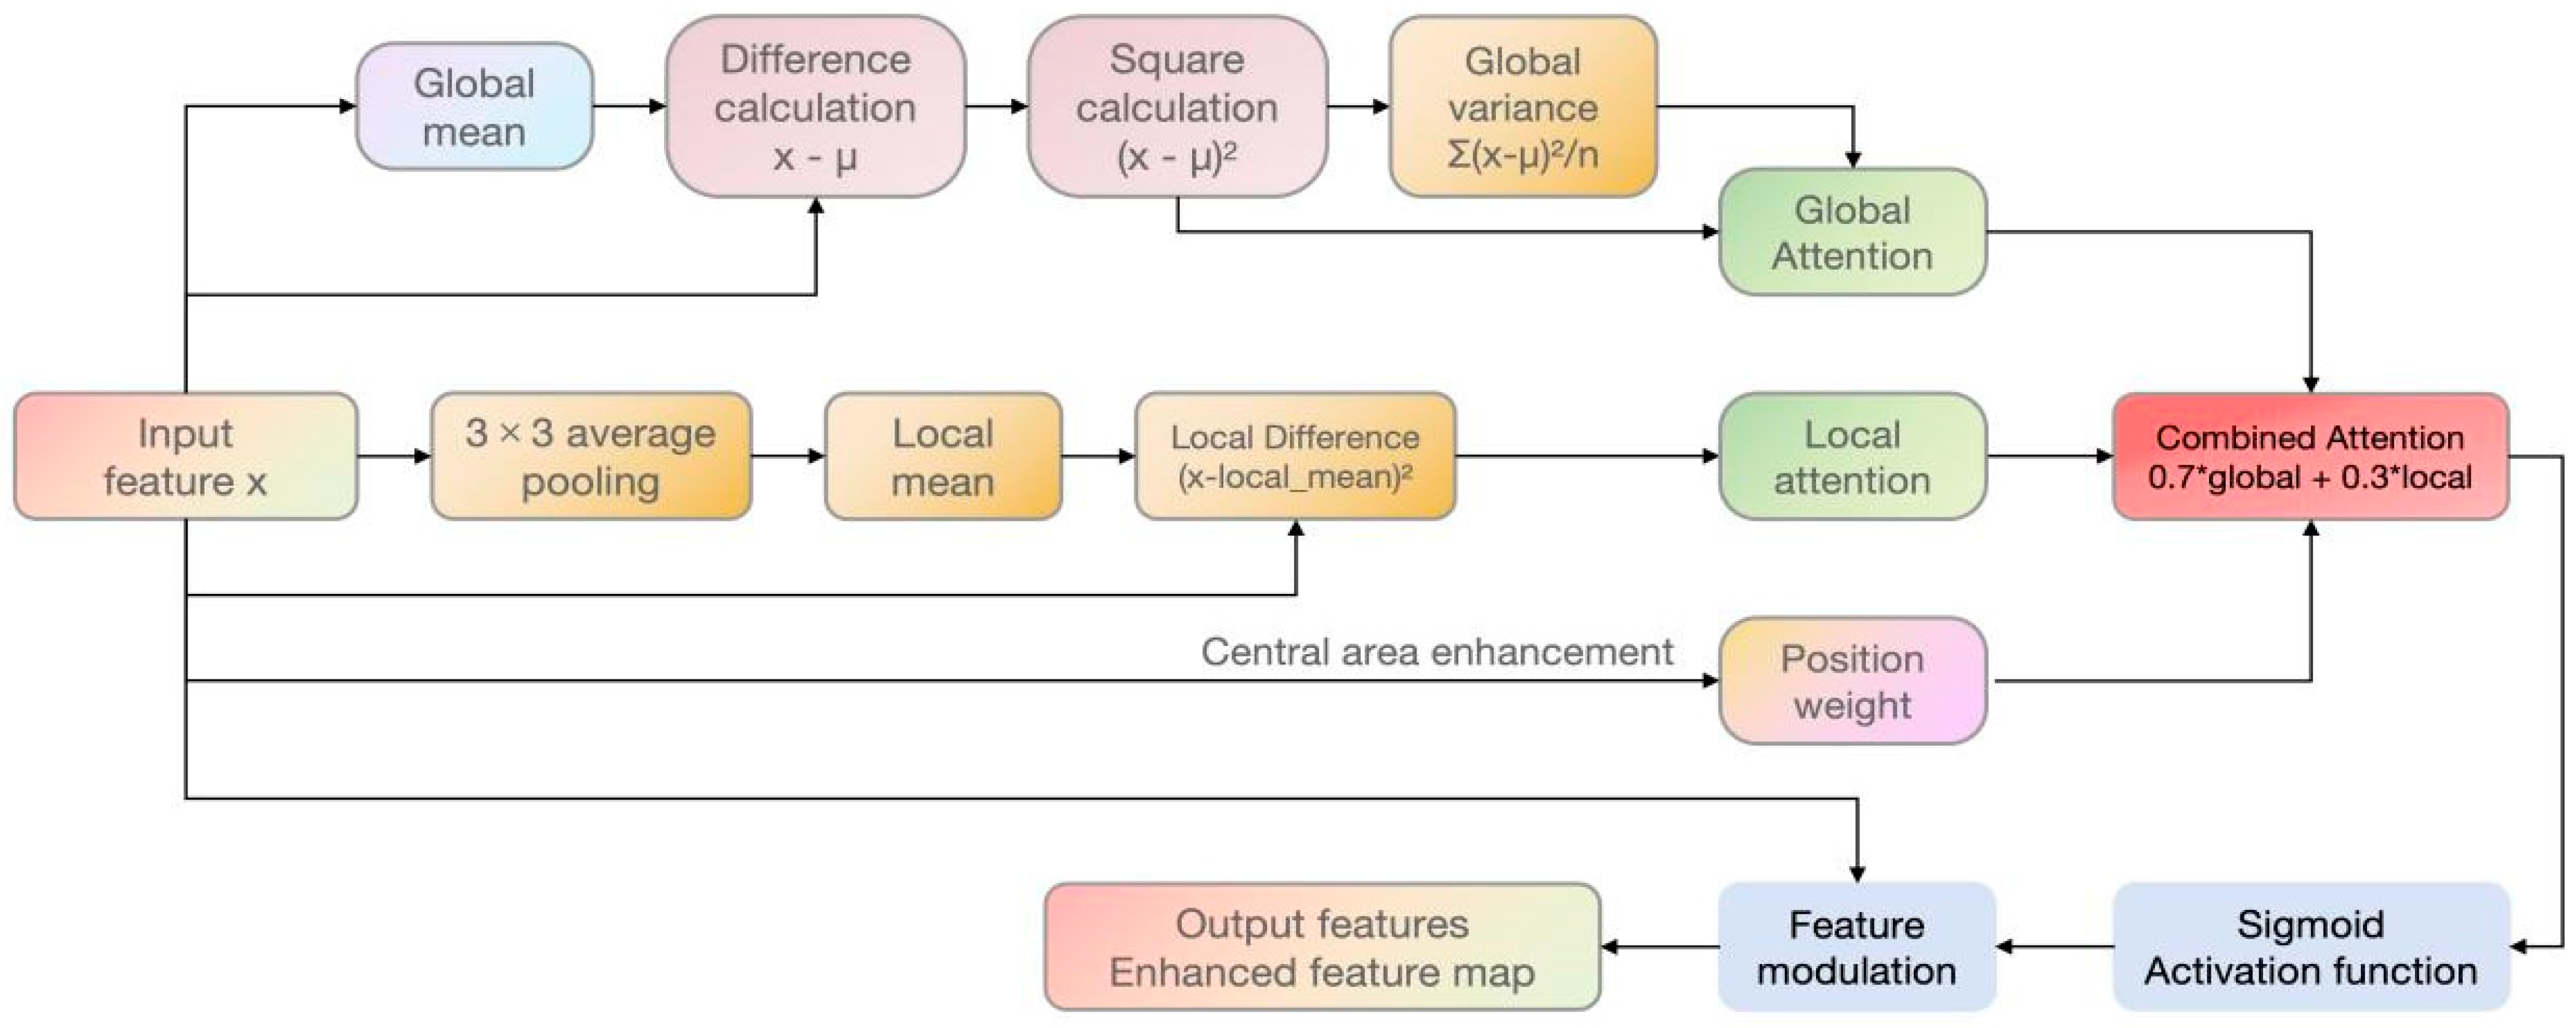
Specifically, to improve the robustness of YOLOv11 in detecting abnormal behaviors, we propose a modified SimAM attention module, as shown in
Figure 3. Unlike the original SimAM, which relies solely on global statistics, our version integrates global and local statistical information and introduces a position-aware weighting scheme to better capture feature variations across different object scales. For recognizing posture-related abnormalities, an improved SimAM attention mechanism was integrated into the backbone. The module was inserted after the C3 block at the P5 feature layer (stride = 32), where semantic abstraction is high but local spatial cues are partially lost. This placement enables refined attention to human body regions before multi-scale fusion in the PANet head.
Unlike the original SimAM, which relies solely on global statistics, the improved version jointly computes global and local attention weights and fuses them using a position-aware spatial mask. Global statistics capture overall semantic distribution, while local pooling preserves intra-object consistency for large-scale movements. A fusion coefficient α = 0.7 balances these two branches, empirically determined through ablation among {0.3, 0.5, 0.7, 0.9}. To maintain convergence stability, α is fixed during training rather than optimized as a learnable parameter, as dynamic α values led to gradient variance and slower convergence. The improved SimAM introduces no trainable parameters and adds only +0.01 GFLOPs (~0.15%) to total computation. The core computation process can be summarized as
Supplementary Code S1.
The workflow of the module is as follows:
(i) Global statistics: For an input feature map
, the global mean
and variance
are computed across spatial dimensions. These are used to construct a global attention weight
, which captures holistic feature distribution:
(ii) Local statistics: A local branch applies a 3 × 33\times 33 × 3 average pooling to obtain regional means
, followed by local variance estimation
. This preserves intra-object consistency for large-scale targets and prevents uniform weighting across heterogeneous body regions. The local attention weight is defined as:
(iii) Position-aware weighting: A spatial distance-based mask
M (
x,
y) is generated to emphasize central regions of the target:
where
denotes the target center and σp\sigma_pσp controls the spread. This design leverages the empirical prior that central regions often contain semantically salient cues.
(iv) Fusion and normalization: Global and local attentions are fused using adaptive weighting:
And multiplied with the positional mask:
where
denotes the Sigmoid activation. The refined attention map
is then applied elementwise to the input feature map, yielding the enhanced representation.
Compared with the original design, our modified SimAM introduces (i) Local statistics computation (configurable pooling window, default kernel size = 3) for improved consistency in large objects. (ii) Position-aware weighting to highlight central body regions, enhancing robustness in large-scale human action scenarios. (iii) Adaptive global–local fusion (fixed ratio, extendable to learnable) for balanced context modeling. (iv) Configurable local window size (local_sizelocal\_sizelocal_size), enabling adaptation to objects of varying scales.
By explicitly modeling local differences and spatial priors, the improved SimAM produces more precise attention maps. It enhances the model’s ability to locate critical body regions (head, limbs, torso) under occlusion and background noise, thereby improving both detection accuracy and interpretability.
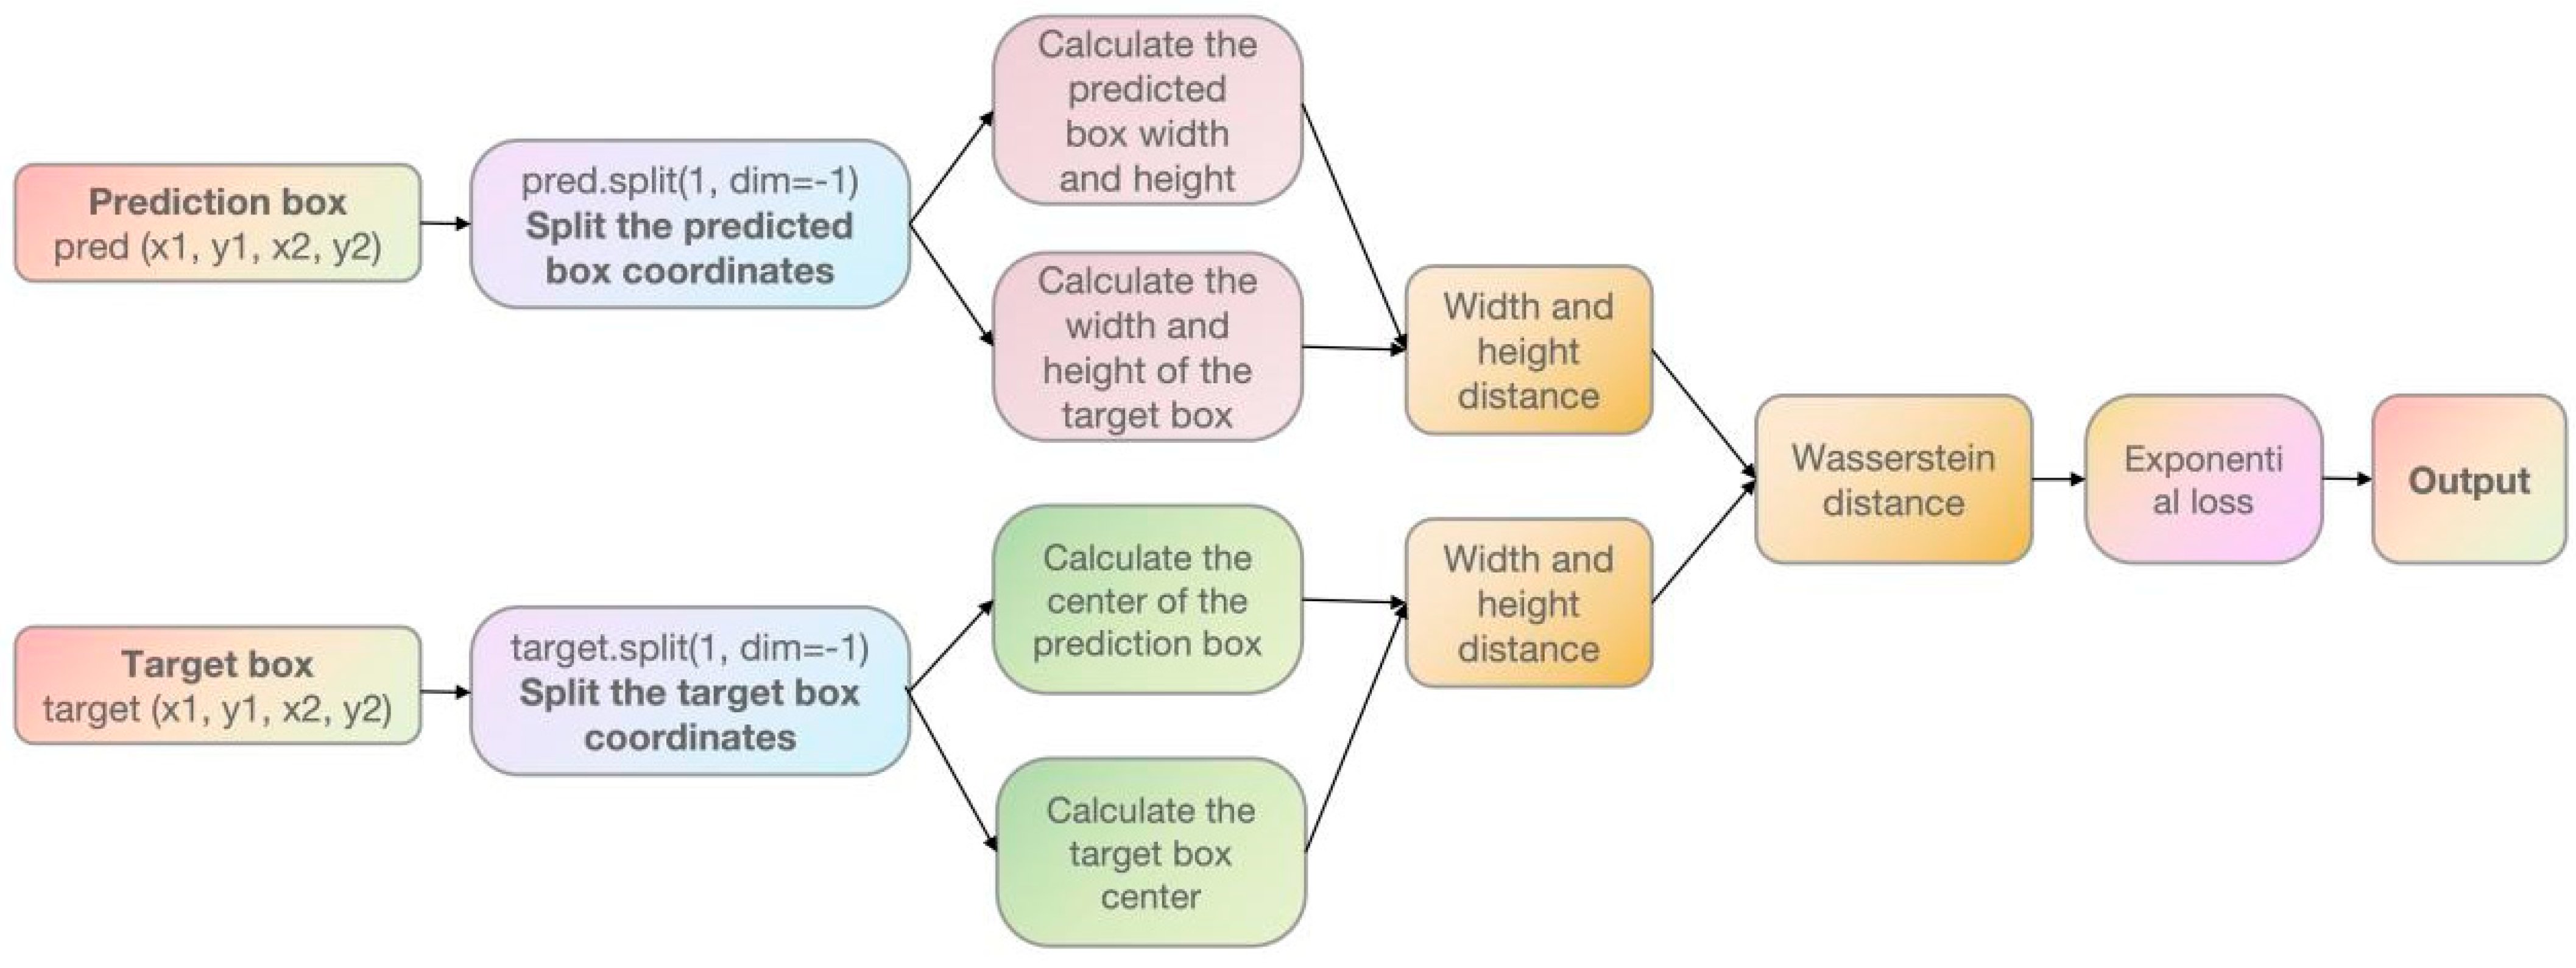
To overcome the limitations of IoU-based losses in capturing geometric relations between bounding boxes, we introduce the Normalized Wasserstein Distance (NWD) loss, as shown in
Figure 4. Unlike IoU, which only measures overlapping areas, NWD treats predicted and ground-truth boxes as two-dimensional Gaussian distributions and evaluates their similarity through a Wasserstein-based distance metric.
(i) Bounding box decomposition. For a predicted box
and a ground-truth box
, we compute width and height as:
where a small constant
ϵ is added during computation to avoid division by zero.
(ii) Center distance. The box centers are defined as:
The squared Euclidean distance between centers is:
(iii) Width–height discrepancy. The scale difference is defined as:
(iv) Wasserstein distance and normalization. The total distance is then formulated as a first-order approximation of the closed-form 2D Gaussian Wasserstein distance under isotropic covariance assumption
:
This formulation decomposes the true Wasserstein cost into translational and scale components, preserving geometric interpretability while maintaining real-time efficiency. The simplification assumes diagonal covariance and neglects rotation and cross-covariance terms, which are discussed as a limitation in
Section 4.
To ensure scale-invariant gradient magnitudes, the Wasserstein distance is normalized by a constant factor
:
The normalization constant corresponds to the expected diagonal standard deviation of a 640 × 640 input image , ensuring balanced gradient magnitudes across pyramid scales (P3–P5). Empirically, varying within [8.0, 16.0] produced negligible effects (<0.3%) on training stability and mAP performance, confirming robustness across scales. This theoretical and empirical consistency supports the use of a fixed constant in all experiments.
Compared to IoU-based losses, NWD offers the following advantages: First, it captures both positional and scale discrepancies through probabilistic distance rather than area overlap. Second, the normalization constant ensures stable optimization across varying object sizes. Third, the Wasserstein metric provides smoother and more interpretable gradients, improving convergence stability and localization accuracy under occlusion, scale variation, and blurred inputs. Consequently, NWD enhances the geometric fidelity and training stability of YOLOv11-Safe, enabling more reliable detection of safety-critical events under complex campus environments.
2.3. Model Evaluation Metrics
To ensure fair and statistically reliable comparisons, all models—including Faster R-CNN, RT-DETR, YOLOv5n, YOLOv6n, YOLOv10n, YOLOv11n, and YOLOv11-Safe—were evaluated using a consistent set of performance metrics following the COCO evaluation protocol. These metrics include Precision, Recall, F1 score, and mean Average Precision at 50% IoU (mAP@50). For baseline detectors (Faster R-CNN to YOLOv11n), training was conducted using their publicly available COCO-pretrained weights to ensure initialization consistency. In contrast, YOLOv11-Safe was trained entirely from scratch due to the inclusion of newly designed components—SimAM attention and NWD loss—which lack pretrained parameters. The model was trained using the stochastic gradient descent (SGD) optimizer with an initial learning rate of 1 × 10⁻², momentum = 0.9, and weight decay = 1 × 10⁻⁴. The batch size was set to 16, and input images were resized to 640 × 640.
(i)
Precision: Measures the proportion of samples predicted to be positive that are positive.
(ii) Recall: measures the proportion of correctly identified samples among all positive samples.
(iii) F1 score: strikes a balance between Precision and Recall.
(iv) Mean Average Precision (mAP@50): The average detection accuracy of all categories is evaluated under an IoU threshold of 0.5.
(v) Deployment efficiency indicators. Considering that campus security systems are mostly deployed on edge servers or resource-constrained monitoring devices, this paper further evaluates the operational efficiency of the model in actual deployment using FLOPs, parameter count (Params), and inference speed (FPS). FLOPs (Floating Point Operations) measure the amount of computation required for a single inference process; parameter count (Params) indicates the model storage size and determines its deployability on lightweight devices; FPS (Frames Per Second) directly reflects the model’s inference speed in real-time monitoring video streams.
2.4. Danger Level Definition and Random Forest Classification
To classify building-related safety incidents into interpretable risk levels and link behavioral patterns to architectural factors, this study employed a Random Forest (RF) classifier combined with SHAP (SHapley Additive exPlanations) analysis. SHAP, grounded in cooperative game theory, quantifies the marginal contribution of each input variable to the model’s output, providing post hoc interpretability for complex learning models [
40].
Rather than relying on subjective scoring, a quantitative evaluation framework was developed to reflect practical safety-management requirements in campus indoor environments. Five measurable indicators were selected according to established building-safety assessment standards and the physical characteristics of fall and wheelchair-instability events: event duration (D), spatial density (SD), posture angle (PA), body–ground contact ratio (BGCR), and accessibility index (AI). All indicators were normalized to [0, 1] for comparability across heterogeneous dimensions:
(i) Event Duration (
D): The total duration (in seconds) during which a fall or wheelchair-instability event persists within a single sequence is defined as:
where
denotes the frame rate. Longer durations typically correspond to more severe or unresolved incidents. Durations are normalized by the maximum observed event length
.
(ii) Spatial Density (
SD):
SD measures
spatial occupation rather than direct risk probability:
where
is the i-th bounding-box area and
the total frame area. High
SD values indicate crowding, which may constrain evacuation but does not necessarily imply danger; low SD values may still coincide with isolated hazards.
SD is therefore interpreted jointly with posture-based cues in subsequent risk evaluation and normalized via Min–Max scaling.
(iii) Posture Angle (
PA):
PA quantifies the deviation of the body’s principal axis from the vertical direction, computed from the key points of the detected human bounding box:
where
,
) and (
) denote the coordinates of the upper and lower body points, respectively. Smaller
PA values indicate a greater body tilt and higher likelihood of balance loss.
(iv) Body–Ground Contact Ratio (BGCR): BGCR reflects the proportion of body area in contact with the floor and thus indicates potential impact severity. To approximate the floor plane from monocular 2D images, a hybrid method combining edge-based contour extraction and RANSAC plane fitting was adopted. Temporal averaging over five consecutive frames mitigated short-term occlusions, and low-confidence detections (IoU < 0.5 with the bounding-box base) were discarded.
A small-scale validation (120 frames) yielded an average vertical-position error of ±3–4 pixels (≈1–1.5% of frame height). Although monocular estimation is inherently approximate, this accuracy is adequate because BGCR functions as a relative indicator of body-to-floor proximity rather than an absolute geometric measurement. The revised text also acknowledges potential bias under extreme viewpoints or heavy occlusion and notes that future work will explore depth-assisted or multi-view calibration to further reduce this error.
(v) Accessibility Index (AI): AI evaluates the presence of safety-support features such as ramps, handrails, and unobstructed exits that facilitate movement and reduce fall risk. To ensure applicability in non-BIM environments, AI is derived through vision-based detection confidence using auxiliary YOLOv11-Safe classes (“ramp”, “handrail”, “exit”). Each detected element contributes its confidence score p ∈ [0, 1], and the scene-level AI is defined as the mean confidence across all detected elements.
In cases where no auxiliary elements are detected (e.g., due to occlusion or limited field of view), the missing values are approximated using the average detection confidence of scenes with the same spatial type (corridor, staircase, dormitory). This imputation allows the RF model to maintain completeness while acknowledging potential bias in small or heterogeneous samples.
To mitigate such effects, the conclusion section explicitly notes that future work will adopt probabilistic or multi-imputation modeling to quantify uncertainty and examine the sensitivity of SHAP feature importance to AI estimation. When BIM or floor-plan data are available, they can optionally enhance calibration accuracy but are not required for model deployment.
(vi) Composite Risk Scoring and Discretization. The five normalized indicators were integrated into a composite score through an equal-weight linear combination:
Equal weighting was adopted as a neutral initialization to prevent dominance by any single metric and to maintain interpretability in the absence of empirical priors.
A sensitivity test was performed by perturbing each by ±0.1 while keeping on the 200-sample validation subset. The resulting variation in accuracy and mAP was below ±1.5%, confirming robustness to moderate weight changes. For label generation, both equal-width and quantile-based binning strategies were evaluated. Equal-width binning achieved higher cross-validation consistency (+7.9% Top-1 accuracy) and clearer interpretability for architectural-risk communication and was therefore retained to define four danger levels (L1–L4).
This composite score served as the input label for the Random Forest (RF) classifier, enabling prediction of discrete risk levels (L1–L4) corresponding to distinct spatial safety conditions within campus buildings. SHAP analysis further decomposed each prediction into feature-level contributions, identifying dominant risk factors in alignment with expert judgment.
Each indicator directly corresponds to a measurable physical or behavioral dimension of the built environment, thereby linking human-centered observations with actionable design feedback. For instance, long event duration (D) indicates insufficient floor friction or lighting conditions that delay recovery after imbalance; high spatial density (SD) often suggests circulation bottlenecks or furniture layout constraints; steep posture angles (PA) and large body–ground contact ratios (BGCR) reveal fall-prone zones likely associated with inadequate handrail positioning or step geometry; and low accessibility index (AI) values highlight missing or malfunctioning ramps and exits.
By mapping these quantified indicators into four ordered risk levels (L1–L4) through equal-width binning (
Table 1), the system translates behavioral observations into spatially interpretable diagnostics. Levels L1–L2 denote manageable conditions where design meets minimum safety standards, but routine maintenance or signage enhancement may still be required. Levels L3–L4 indicate spatial zones requiring design-level interventions, such as surface material replacement, slope correction, installation of additional handrails, or reconfiguration of narrow corridors. This hierarchical mapping establishes a bridge between machine-learning outputs and evidence-based architectural decision-making.
The proposed risk-scoring framework was reviewed by two senior experts in building-safety engineering and facility management (each with over ten years of professional experience) to ensure semantic and practical consistency. Further validation involved thirty representative video segments independently annotated by five interdisciplinary experts specializing in building safety, ergonomics, and human behavior analysis. Inter-rater agreement was evaluated using Fleiss’ Kappa, yielding κ = 0.81 (p < 0.001), which indicates substantial agreement. Spearman’s rank correlation between expert ratings and model-generated scores was ρ = 0.74 (p < 0.001), confirming strong positive alignment between expert assessment and automated quantification.
In comparative experiments, alternative stratification strategies—including unequal-interval grouping and expert-only ordinal labeling—produced an average 7.9% reduction in classification accuracy, with Top-2 errors concentrated in adjacent risk levels. These findings confirm that the adopted four-level equal-width scheme provides an optimal trade-off between statistical discriminability, architectural interpretability, and practical management relevance.
(vii) Feature Selection, Dimensionality Reduction, and Classification. The complete feature matrix included 15 variables—five behavioral indicators plus ten categorical spatial encodings derived from architectural context. An RF-based Gini-importance filter first removed low-variance or highly collinear features (r > 0.9). Subsequently, Principal Component Analysis (PCA) was applied to the remaining features, reducing the dimensionality from 15 to 5 principal components explaining over 90% of total variance. This procedure performs genuine dimensionality reduction and enhances model generalization rather than identity transformation.
The resulting compact representation served as input to the Random Forest classifier (100 trees, maximum depth = 10). SHAP analysis was conducted on the trained RF model, and attributions were projected back to the original interpretable indicators (D, SD, PA, BGCR, AI) for visualization, ensuring consistency between model interpretability and semantic meaning.
(viii) Summary of Interpretability Framework. By integrating the quantitative indicators (D, SD, PA, BGCR, AI) with interpretable machine-learning techniques (RF + SHAP), the framework establishes a transparent linkage between observable human behaviors and architectural safety conditions. BGCR and PA capture individual posture-related risk; SD and AI represent spatial and accessibility factors; D characterizes temporal persistence. The combination yields predictive accuracy and actionable interpretability, providing a data-driven basis for design and management decisions in risk-informed feedback.
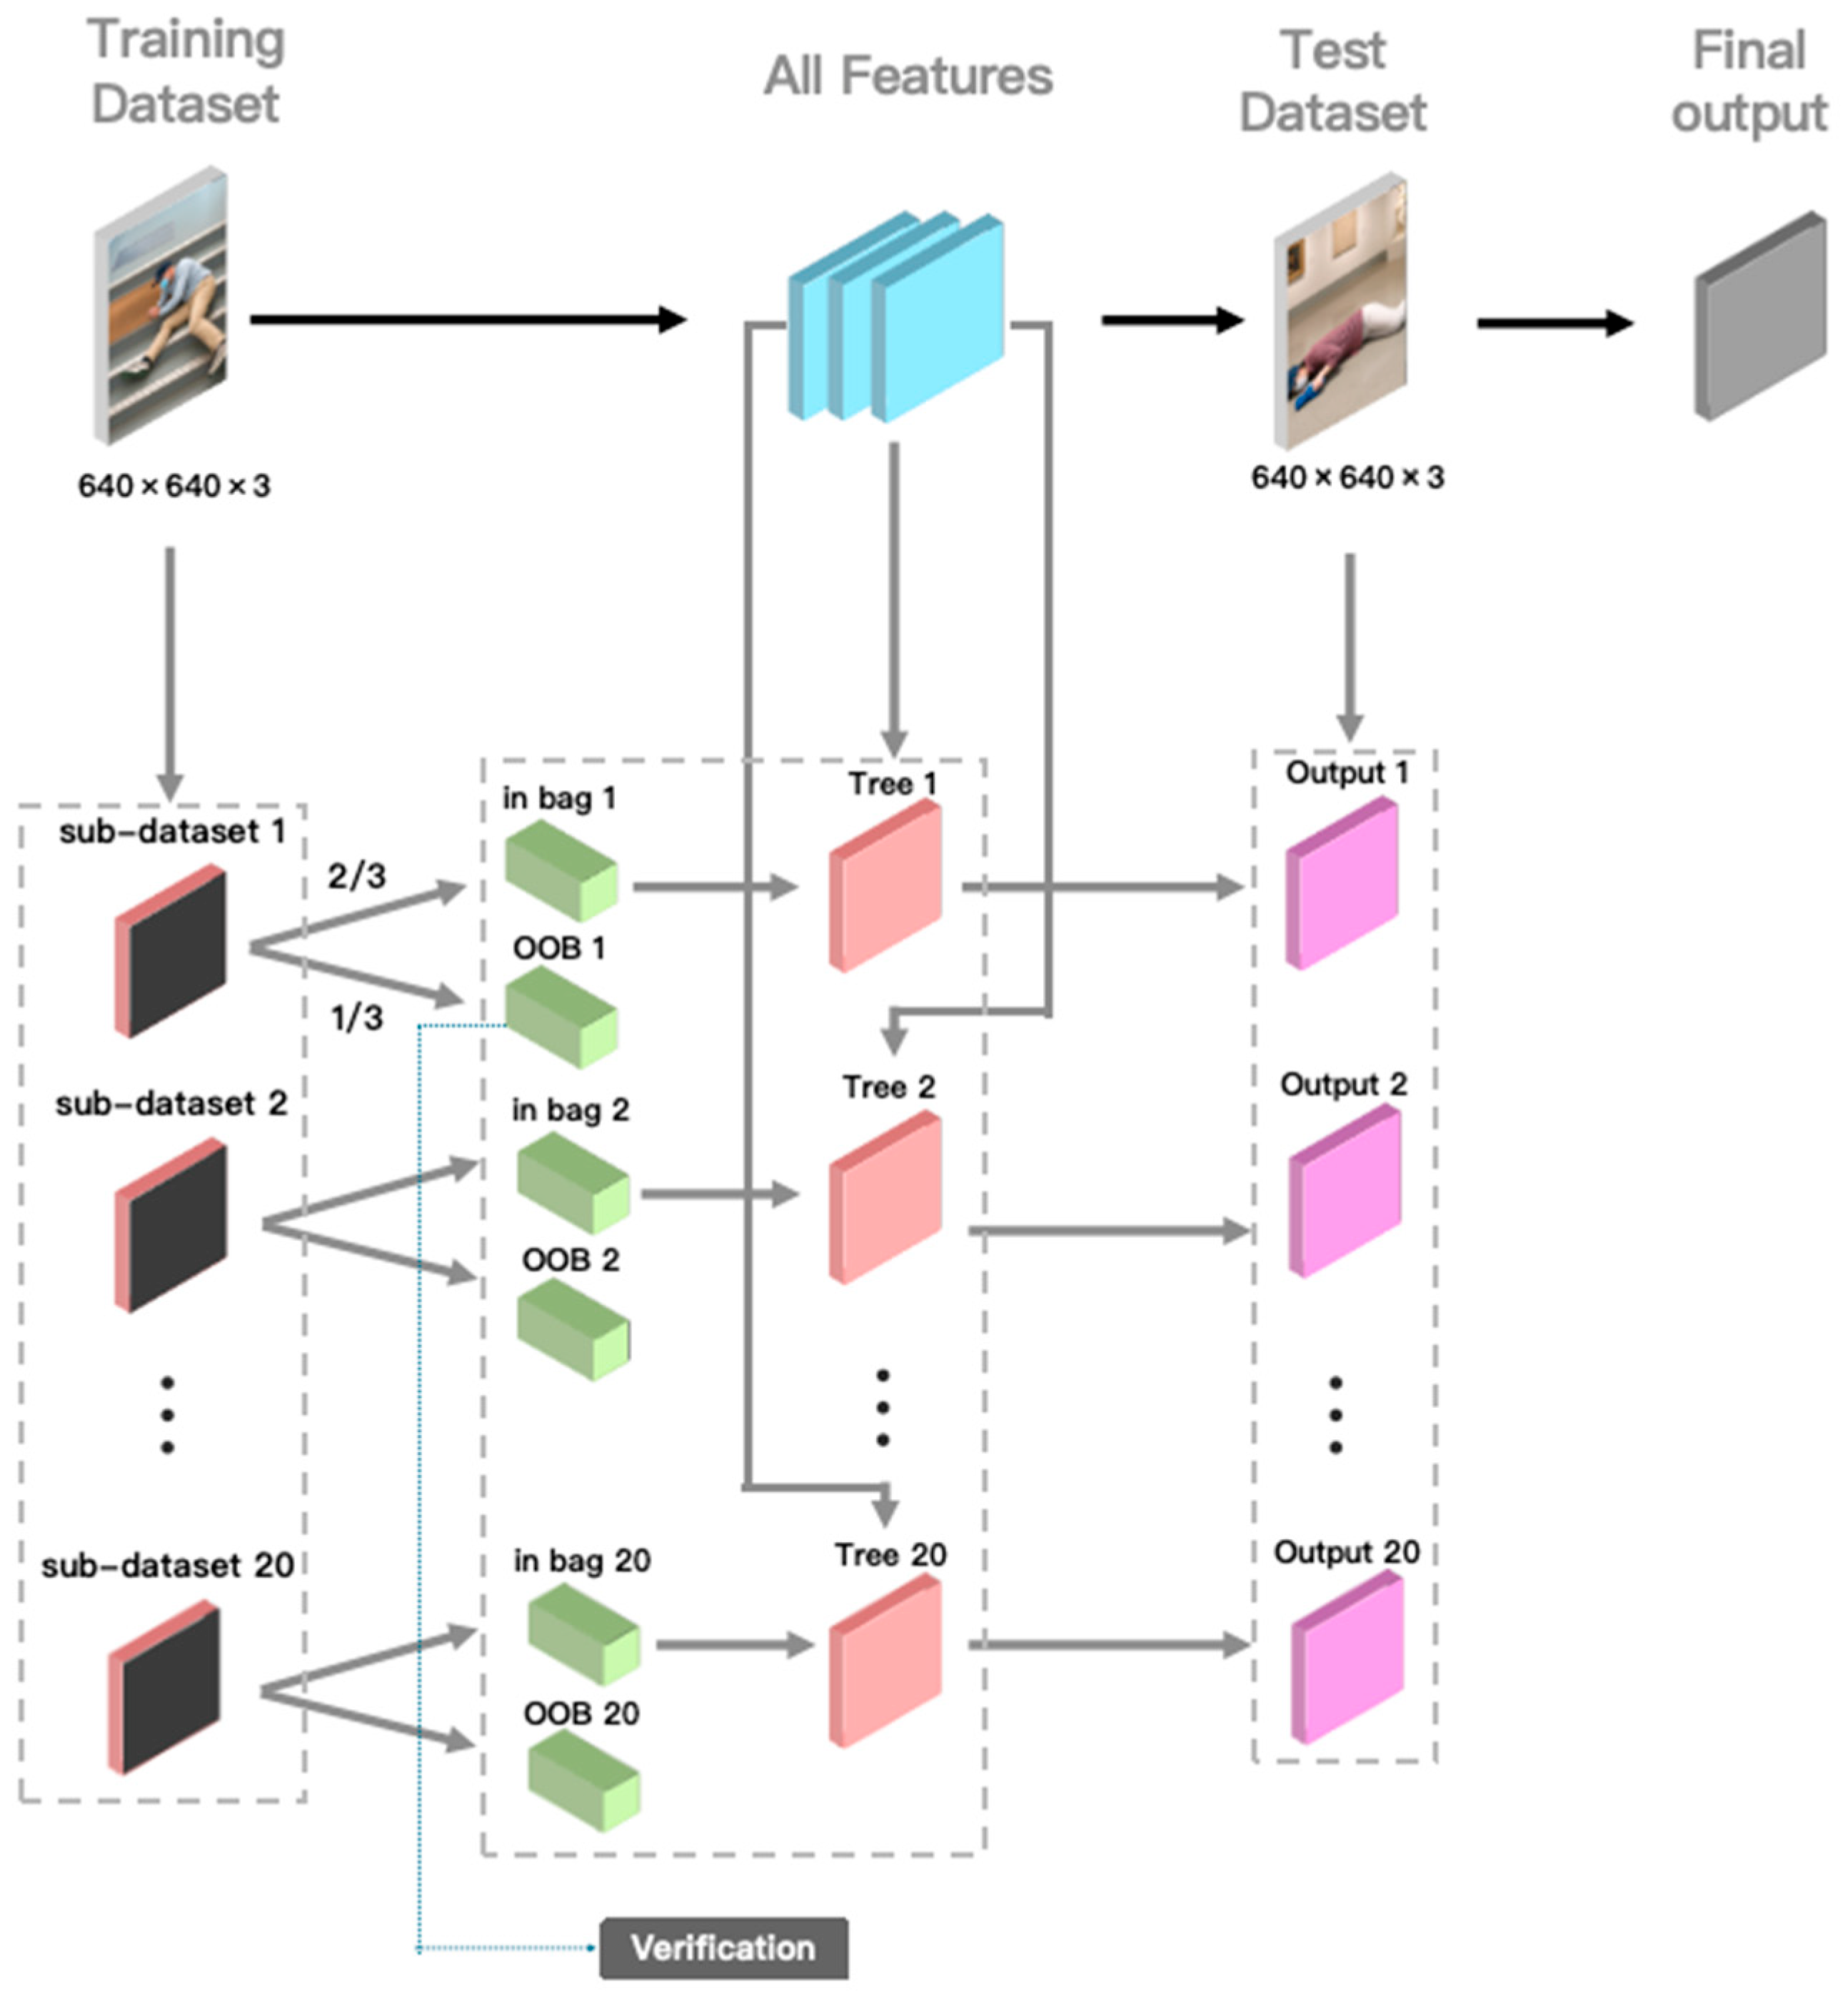
The Random Forest (RF) classifier was trained and evaluated using a standard hold-out method with an 80/20 train-test split. Eighty percent of the dataset was used for model construction, while the remaining twenty percent was reserved for generalization testing. Categorical variables (e.g., discretized space type) were encoded numerically using OHE, and all continuous features were normalized within [0, 1] to maintain consistency across heterogeneous spatial–behavioral inputs, as shown in
Figure 5.
To prevent overfitting and balance model complexity with accuracy, a grid search was conducted over multiple hyperparameter settings: (i) Number of trees (numTrees): 10, 50, 100, 150. (ii) Maximum depth (maxDepth): 2, 5, 10, 20. (iii) Maximum features (maxFeatures): one-third of total features, and (where is the feature dimension). (iv) Minimum samples per leaf (minSamplesLeaf): 1, 5, 10, 20, 50, 100.
After completing model training, SHAP analysis was employed to interpret feature contributions without requiring retraining, thereby avoiding additional bias. This interpretability workflow aimed to connect quantitative model outputs with spatial safety insights, revealing how each variable influences risk levels and, consequently, informs architectural design or management strategies. The workflow consisted of five complementary components: (i) Class-wise feature contribution: A SHAP summary plot (beeswarm plot) was generated to visualize the distribution of SHAP values across all samples, showing both the magnitude and direction (positive or negative) of each feature’s effect on predicted safety levels. In this study, high SHAP values for body–ground contact ratio and low accessibility index strongly corresponded to L3–L4 classifications (high or very high risk), indicating areas lacking proper handrails, ramps, or non-slip surfaces. (ii) Global feature importance: The mean absolute SHAP values were aggregated and visualized in a bar chart to compare the relative importance of the five core features (event duration, spatial density, body posture angle, body–ground contact ratio, and accessibility index). This ranking revealed that body–ground contact ratio and accessibility index were dominant predictors of high-risk zones, while spatial density played a moderating role, especially in corridors and staircases where crowding elevates fall risk. (iii) Feature-level dependency analysis: Scatter plots of SHAP values against raw feature values were plotted to reveal marginal effects. Longer event durations and steeper body posture angles exhibited strong positive SHAP contributions, pushing predictions toward L3–L4 levels and identifying insufficient friction or poor illumination as spatial triggers. Conversely, low spatial density and high accessibility index (presence of ramps and unobstructed exits) produced negative SHAP values, aligning with safer spatial configurations (L1–L2). This analysis provided quantitative, design-relevant evidence explaining why particular areas were classified as high risk. (iv) Precision–Recall (PR) evaluation: To address the imbalance between high- and low-risk samples, five-fold cross-validation was conducted, and PR curves were plotted to evaluate detection performance under minority class conditions (L3–L4). This step ensured that areas classified as structurally unsafe were reliably identified without excessive false alarms. (v) ROC–AUC comparison: Multi-class ROC curves were generated, and area-under-curve (AUC) scores were computed for both training and test sets. Consistent AUC performance confirmed the stability and generalization of the RF model in predicting risk patterns across different campus building types.
All SHAP visualizations were implemented using the Python SHAP library (v0.44), combined with Matplotlib (v3.8) and Scikit-learn (v1.3). The integration of quantitative interpretability metrics with standard evaluation curves (PR and ROC–AUC) not only quantified feature influence but also strengthened the transparency, architectural relevance, and reproducibility of the proposed risk prediction and building-safety evaluation framework.
2.5. System Architecture and Application in Campus Spatial Scenarios
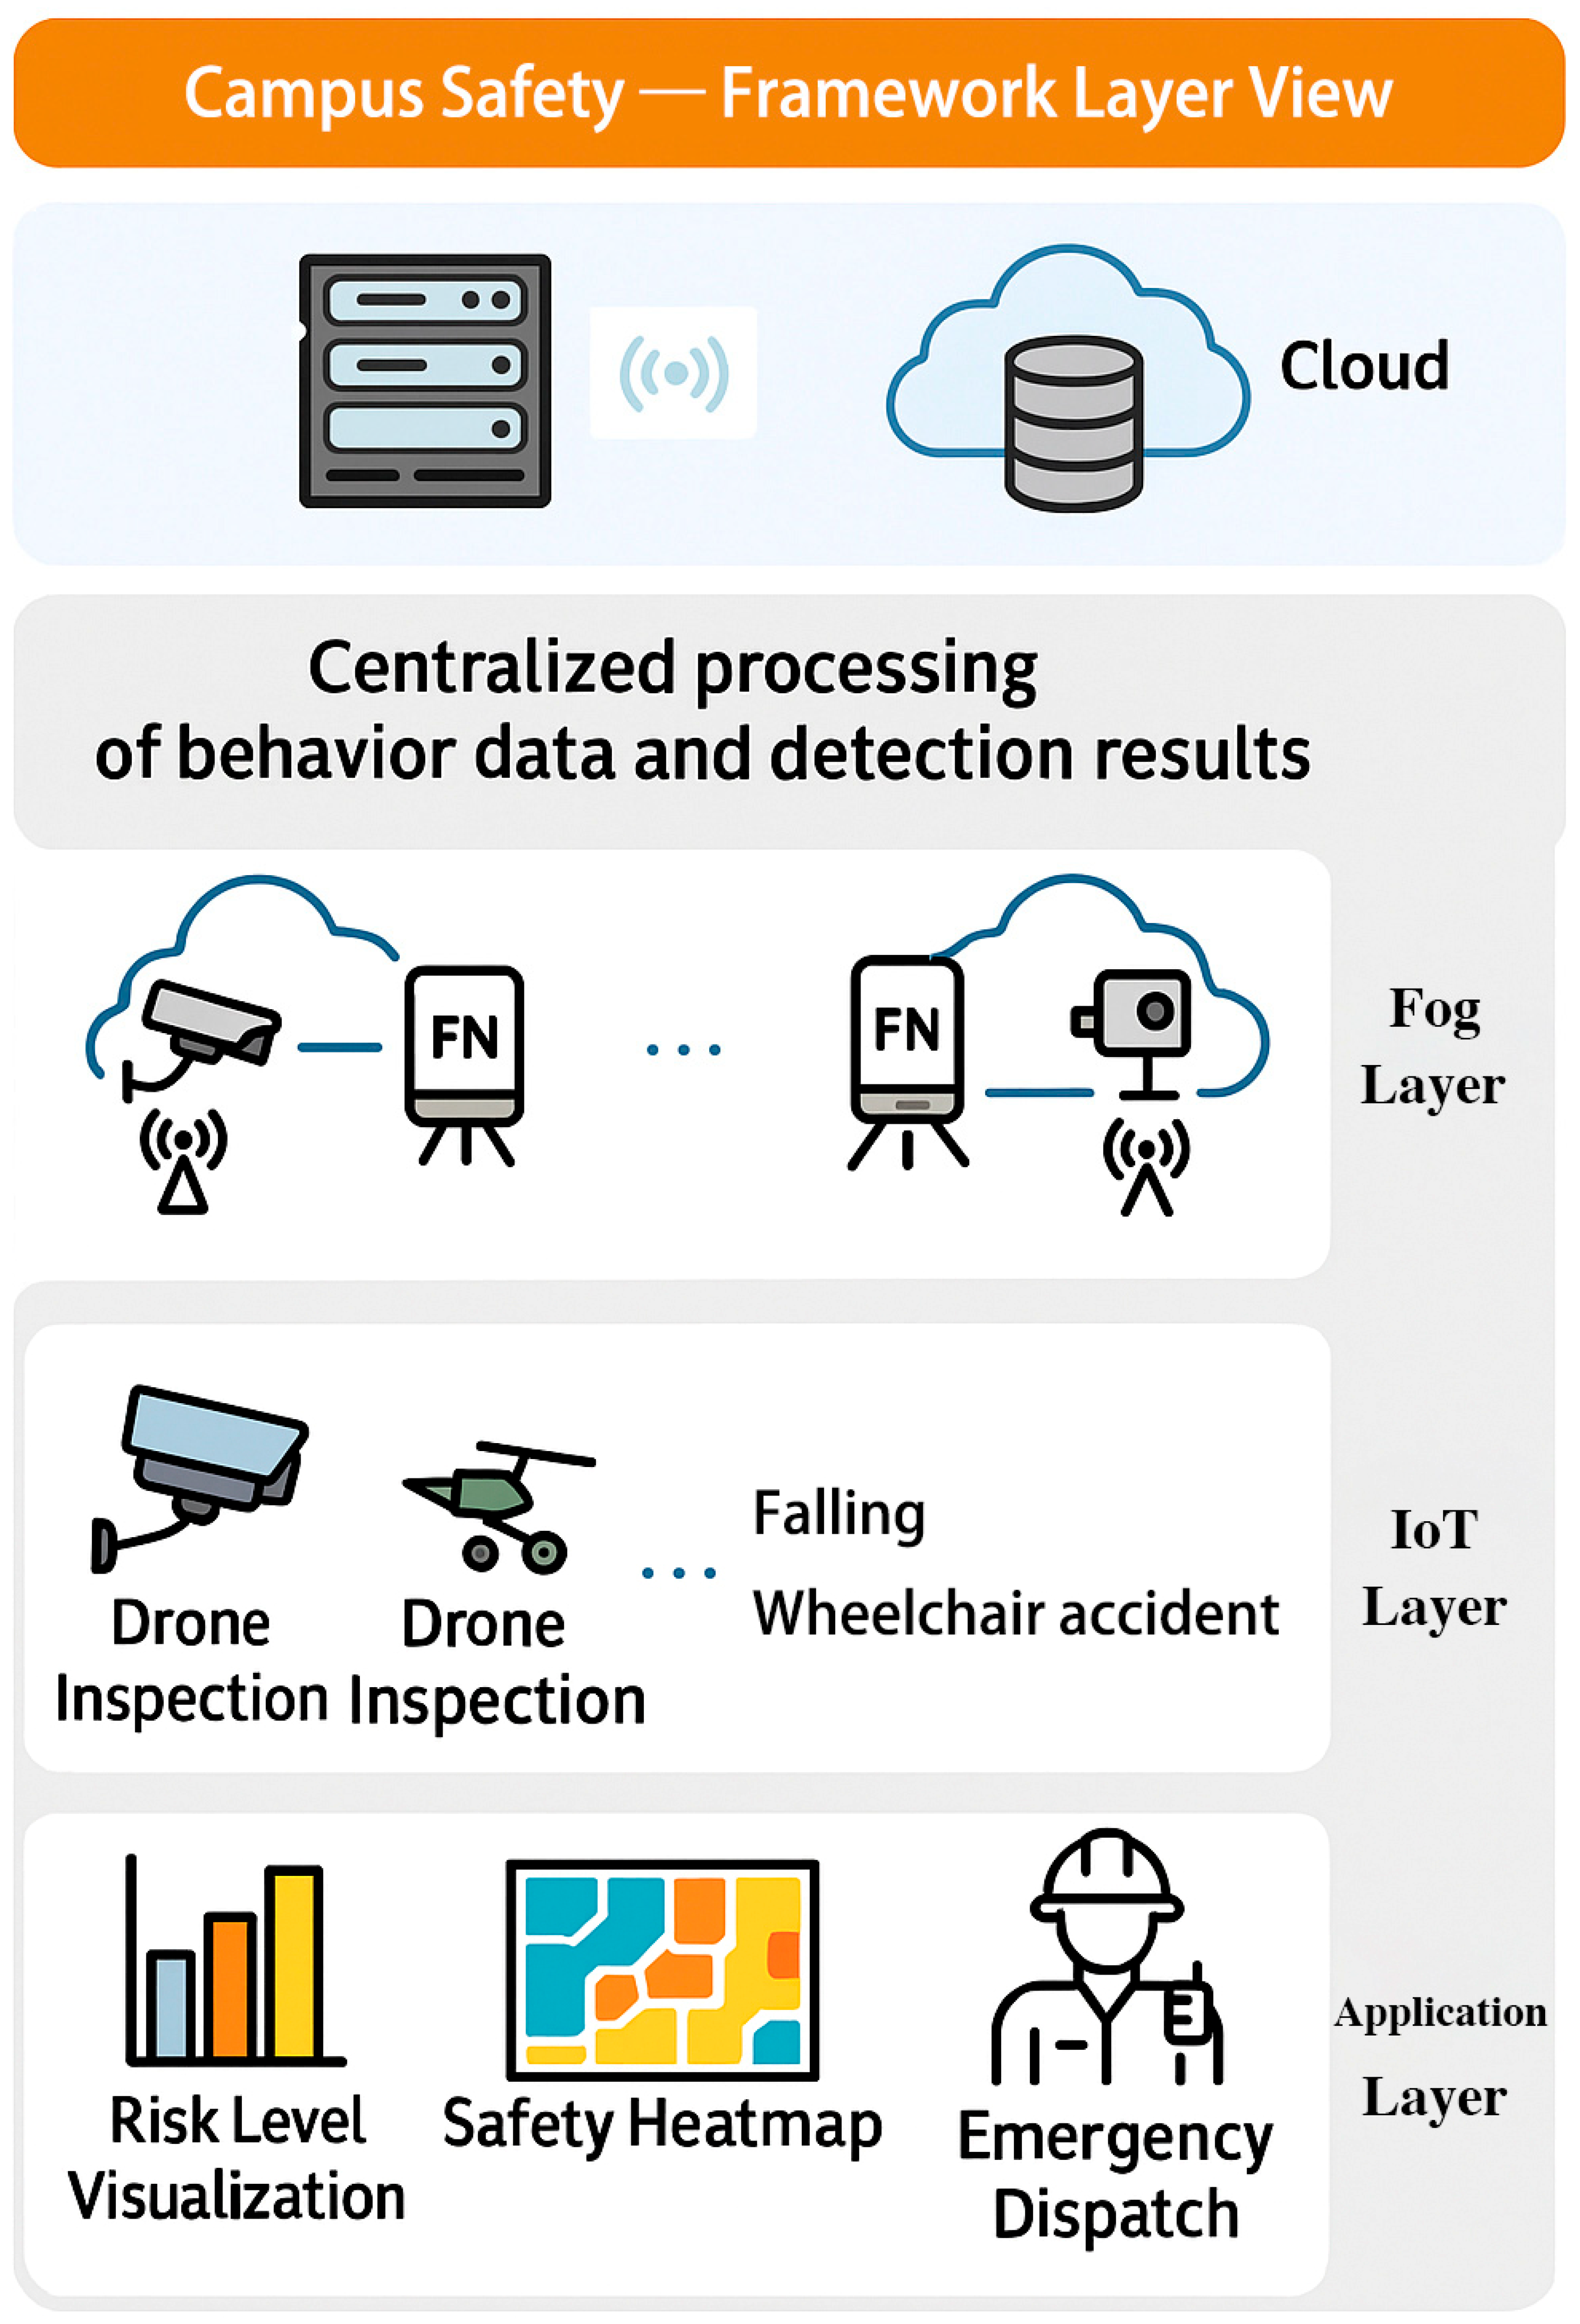
A conceptual system architecture is proposed to illustrate potential applications. The overarching objective of the proposed system is to enhance interior building safety, spatial risk awareness, and evidence-based design improvement in intelligent campus environments. To address spatially induced risks such as falls and wheelchair accidents occurring in corridors, staircases, ramps, and dormitories, we designed an integrated framework—B-SAFE (Building-Integrated Safety Feedback Framework)—that combines deep learning-based event detection with hierarchical IoT–Fog–Cloud computing and spatial analytics. The system is embedded within a multi-layer perception and decision-making architecture, with the following key capabilities: (i) A secure and scalable infrastructure for multi-source video and environmental data acquisition, supported by edge cameras and local processing nodes. (ii) A spatially aware system design that benefits both facility managers and campus administrators by transforming detected incidents into actionable architectural insights. (iii) Facilities for data storage, semantic annotation, and visualization of safety-critical events, enabling longitudinal safety tracking and identification of spatial design deficiencies. (iv) YOLOv11-Safe framework deployed at the edge and fog levels for behavioral detection, risk scoring, and spatial mapping of incident locations. (v) A comprehensive multi-layer architecture integrating IoT (perception), Fog (computation), Cloud (analysis), and Application (feedback), ensuring real-time flow of data and enabling immediate as well as long-term spatial interventions. Future work will focus on empirical validation in real-world campus settings.
As shown in
Figure 6, the proposed B-SAFE architecture consists of four interconnected layers:
(i) Cloud Layer. The Cloud layer serves as the central analytical platform, aggregating data from multiple fog nodes for large-scale model training, updating, and cross-building risk comparison. It generates structural safety heatmaps, accessibility metrics, and long-term trend analyses, identifying high-risk architectural elements such as slippery surfaces or poorly illuminated corridors. The cloud platform also hosts the visualization dashboard, enabling planners to review spatial risk distributions and prioritize retrofit projects.
(ii) Fog Layer. Optimized YOLOv11-Safe framework are deployed on fog nodes (FN), incorporating enhanced attention mechanisms and multi-feature fusion. These nodes perform low-latency local detection of falls and wheelchair instability, extracting quantitative features such as duration, spatial density, posture angle, and body–ground contact ratio. Each fog node transmits summarized incident data to the fog master node (FMN), which coordinates computation across multiple buildings and synchronizes risk-level updates with the cloud. This distributed setup ensures high responsiveness while reducing bandwidth requirements.
(iii) IoT Layer (Perception). Comprising fixed cameras, environmental sensors, and smart access systems strategically placed in corridors, staircases, and dormitories, this layer captures real-time visual and contextual data. It provides the foundational stream for YOLO-based inference and spatial risk modeling, including environmental attributes (e.g., lighting, floor friction, and occupancy density) that affect building safety performance.
(iv) Application Layer. The Application layer delivers actionable insights to architects, facility managers, and safety personnel. Outputs include risk-level predictions, spatial heatmaps, and accessibility indices visualized through intuitive dashboards.
The B-SAFE framework aims to support evidence-based design improvement through spatial risk visualization and feedback rather than algorithmic optimization. Its function is diagnostic and decision-supportive, guiding architects and facility managers toward safer spatial configurations.
To validate the applicability of the YOLOv11-Safe and B-SAFE framework within real campus environments, seven representative architectural scenarios were selected across Guangdong University of Science and Technology, Dongguan City, Guangdong Province (
Figure 7). These spaces encompass both living and teaching zones, covering diverse functional layouts and material conditions typical of higher-education buildings. Each scene was monitored using fixed smart cameras connected to the IoT-Fog-Cloud network, forming a real-time spatial safety dataset for model training and testing.
Scene 1: Dormitory Corridor. A narrow corridor with exposed pipelines and limited lighting was chosen to examine the effects of spatial density and accessibility index on near-fall detection. The system identified congestion points where furniture or belongings obstructed safe circulation.
Scene 2: Living-Area Walkway. This open corridor links dormitory units to the main plaza. Its smooth ceramic flooring and partial handrail coverage provided data for evaluating floor friction and handrail adequacy, variables strongly influencing the body-ground contact ratio.
Scene 3: Staircase Node. A multi-flight stairwell with irregular lighting conditions was used to test the sensitivity of the body posture angle indicator. YOLOv11-Safe captured descent-related imbalance behaviors, while SHAP analysis revealed that inadequate illumination and uneven riser height contributed to elevated risk scores (L3).
Scene 4: Playground Edge. The transition zone between the playground and teaching block often includes ramps and curbs. This site was utilized to evaluate wheelchair navigation and the accessibility index, emphasizing how gentle slope design and clear spatial markings mitigate instability risks.
Scene 5: Classroom Interior. A densely arranged classroom tested the influence of spatial density on movement safety. The model identified areas where furniture spacing below 0.9 m restricted wheelchair access, guiding design feedback for interior layout optimization.
Scene 6: Teaching-Block Entrance Hall. This wide but slippery entrance area was used to monitor fall events associated with surface materials. The analysis connected prolonged event duration and high body–ground contact ratio with low-friction tiles, supporting recommendations for surface replacement or anti-slip coating application.
Scene 7: Accessible Ramp. The outdoor ramp connecting the teaching and playground areas served as a benchmark for evaluating accessibility compliance. The B-SAFE feedback framework correlated low incident frequency and short event duration with effective gradient control and handrail design, confirming compliance with universal-design principles.
Collectively, these seven locations represent the functional and morphological diversity of campus building spaces. In the context of the seven campus spatial scenarios, five quantitative variables were designed as key measurement indicators to evaluate the spatial safety performance of building interiors. Each indicator was derived from YOLOv11-Safe detection outputs and spatial metadata, serving as an analytical bridge between behavioral incidents and architectural risk characteristics. Specifically, the event duration (D) is hypothesized to represent the persistence of unsafe states—longer durations may suggest insufficient friction, lighting imbalance, or delayed human response. The spatial density (SD) measures the proportion of occupied floor area relative to the total visible scene; higher SD values are expected in narrow or obstructed spaces (e.g., dormitory corridors or classrooms), indicating potential congestion or circulation inefficiency. The body posture angle (PA) quantifies the deviation of the human body axis from the vertical line, acting as an indirect measure of balance stability—smaller angles may correspond to greater fall likelihood on uneven surfaces or stair edges. The body–ground contact ratio (BGCR) estimates the proportion of body area in contact with the ground, used here as a proxy for impact severity and surface risk; higher BGCR values could indicate slippery materials or inappropriate floor gradients. Finally, the accessibility index (AI) reflects the spatial availability of safety-support features such as ramps, handrails, and unobstructed egress paths. Low AI scores are presumed to correspond to incomplete barrier-free design or ineffective circulation planning.
These variables jointly serve as quantitative criteria for spatial safety assessment, allowing subsequent stages of analysis (e.g., RF classification and SHAP interpretation) to determine how behavioral events correspond to architectural conditions. While this study does not aim to establish empirical conclusions at this stage, the proposed indicators define a consistent framework for linking human–environment interactions with building safety evaluation in university campuses.
3. Results
3.1. Ablation Experiments
To further evaluate the contribution of the proposed modules, ablation experiments were conducted on the improved SimAM attention mechanism and the NWD loss function, as summarized in
Table 2. Each configuration was trained and evaluated under identical hyperparameter settings to ensure comparability. The reported metrics represent the mean ± standard deviation from three independent runs, minimizing random variation due to initialization and confirming statistical consistency.
Integrating the improved SimAM attention module led to a modest yet consistent improvement over the baseline, with an F1 score of 85.6 ± 0.7%, precision of 86.5 ± 0.8%, recall of 84.8 ± 1.0%, and mAP@50 of 91.2 ± 0.7%. These gains (+0.5% F1 and +1.1% mAP@50 relative to the baseline) indicate that enhanced spatial attention reduces background interference and strengthens feature discrimination, while the computational overhead remains negligible (+0.01 GFLOPs).
When the NWD loss function was applied independently, the model achieved larger performance gains: F1 = 85.9 ± 0.8%, precision = 89.3 ± 0.9%, recall = 82.8 ± 1.2%, and mAP@50 = 91.35 ± 0.8%. This demonstrates that NWD provides a geometrically interpretable penalty for bounding-box regression, improving localization stability under scale variation and partial occlusion. The slight decrease in recall (−1.9%) suggests a trade-off between stricter box matching and sensitivity to positive samples.
Combining both SimAM and NWD yielded the best overall performance, achieving F1 = 86.9 ± 0.8%, precision = 87.4 ± 0.9%, recall = 86.3 ± 1.0%, and mAP@50 = 92.35 ± 0.8%. Compared with the baseline, these represent relative improvements of +1.8% in F1, +1.7% in precision, +1.6% in recall, and +2.25% in mAP@50, while maintaining the same parameter size (2.6 MB) and almost constant computation cost (6.45 GFLOPs).
Overall, the results show consistent and statistically stable improvements rather than random fluctuations. Both the improved SimAM and NWD modules contribute positively to detection accuracy, and their combination delivers the most balanced performance across all metrics. This confirms the complementary roles of fine-grained attention focusing and geometry-aware loss design in enhancing the accuracy–efficiency trade-off for safety-critical behavior detection.
3.2. Model Comparison
To ensure a fair comparison, all baseline detectors (Faster R-CNN, RT-DETR, YOLOv5n–YOLOv11n) were initialized from their publicly available COCO-pretrained weights, whereas YOLOv11-Safe using the stochastic gradient descent (SGD) optimizer with an initial learning rate of 1 × 10
−2, momentum = 0.9, and weight decay = 1 × 10
−4. The batch size was set to 16, and input images were resized to 640 × 640.
Table 3 summarizes quantitative results in terms of accuracy, efficiency, and model complexity. Parameter counts and floating-point operations per second (FLOPs) were calculated using the PyTorch profiling tool with a batch size of 1 and input resolution of 640 × 640. All results represent full-precision (FP32) models without any quantization or compression applied.
As a two-stage baseline, Faster R-CNN achieved strong recall (94.6%) and competitive mAP@50 (93.6%), demonstrating its capability to capture positive samples. However, its relatively low precision (66.4%) reduced the F1 score to 77.8%, indicating a higher false-positive rate. Moreover, Faster R-CNN incurred the heaviest computational cost (134.4 GFLOPs) and the largest parameter size (41.5 MB), limiting its suitability for real-time deployment in resource-constrained environments.
In comparison, RT-DETR provided a more balanced trade-off between accuracy and efficiency. It achieved 82.3% precision, 77.1% recall, and an F1 score of 79.6%, while significantly reducing computation to 54.1 GFLOPs and parameters to 19 MB. These results suggest that transformer-based detectors can offer an effective balance between accuracy and deployment efficiency.
Within the YOLO family, lightweight variants displayed clear advantages in performance–efficiency trade-offs. YOLOv5n achieved an F1 score of 81.7% (precision 85.6%, recall 78.1%) with only 7.2 GFLOPs and 2.5 MB parameters, providing a competitive lightweight baseline. YOLOv6n and YOLOv10n achieved moderate performance (F1 scores 73.6% and 73.0%), reflecting trade-offs between structural optimization and recognition stability.
YOLOv11n achieved the best overall performance among the original architectures, with the highest F1 (85.1%), precision (85.7%), recall (84.7%), and mAP@50 (90.1%), while maintaining extremely low computational complexity (6.44 GFLOPs) and parameter size (2.6 MB). The proposed YOLOv11-Safe, which integrates the improved SimAM attention and NWD loss modules, further improved the F1 score to 86.9%, precision to 87.4%, recall to 86.3%, and mAP@50 to 92.35%.
It should be noted that the SimAM and NWD components were implemented as lightweight plug-in modules. SimAM introduces a single activation function and several scalar operations without adding new convolutional layers, while NWD modifies only the loss function formulation. Consequently, both modules contribute less than 0.02 MB of additional parameters and no measurable change in FLOPs compared with YOLOv11n, confirming their computational efficiency.
Overall, the results indicate that while two-stage detectors (e.g., Faster R-CNN) excel in recall, lightweight one-stage detectors—particularly YOLOv11-Safe—achieve the best trade-off between accuracy, computational efficiency, and deployment feasibility, making them suitable for safety-critical monitoring in campus environments.
3.3. Performance Evaluation of CAM, Grad-CAM, XGrad-CAM, SSCAM for Deep Learning Model
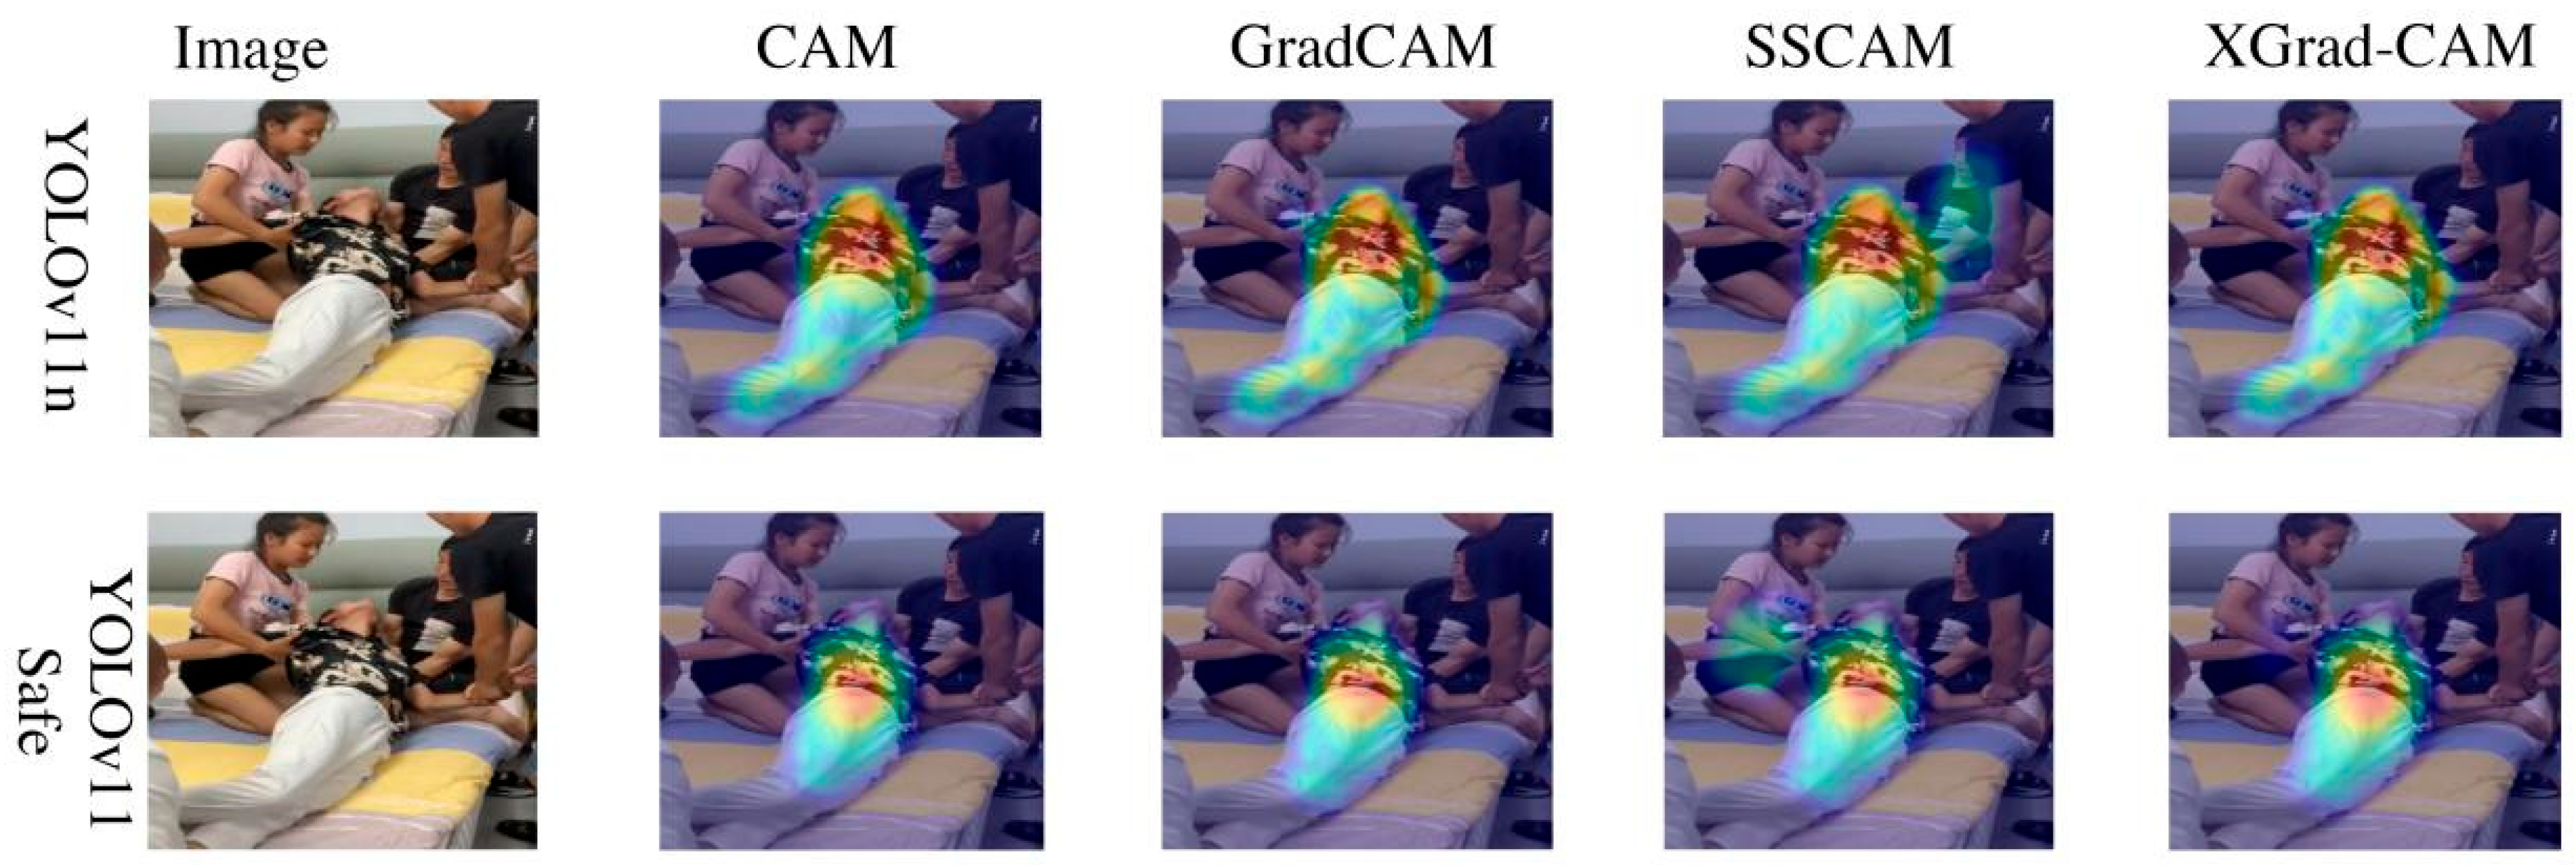
To enhance the interpretability of YOLOv11-Safe in campus safety detection tasks, four widely used class activation mapping (CAM) methods—CAM, Grad-CAM, SSCAM, and XGrad-CAM—were employed to analyze the model’s spatial attention and discriminative regions. As illustrated in
Figure 8, attention heatmaps generated by the baseline YOLOv11n and the improved YOLOv11-Safe were compared under identical input conditions.
The visualization results show that YOLOv11-Safe consistently exhibits stronger semantic focus and boundary sensitivity across all four CAM methods, enabling more precise localization of safety-critical regions, such as areas around the human body and surrounding floor zone. Compared with YOLOv11n, the improved model produced more compact and contextually relevant attention maps, with reduced distraction from background clutter, illumination changes, or non-salient motion cues.
Notably, in Grad-CAM and SSCAM visualizations, the attention regions of YOLOv11-Safe were more accurately aligned with key behavioral indicators of unsafe conditions—such as body inclination, partial contact with the floor, or unstable wheelchair orientation—demonstrating its enhanced capacity to extract meaningful safety cues under complex campus environments. These results verify the contribution of the improved SimAM attention mechanism and NWD loss function in reinforcing spatial discrimination and geometric precision.
Overall, the visualization findings confirm that YOLOv11-Safe not only improves the separation between safe and unsafe behaviors but also provides structured and interpretable decision cues for subsequent risk-level prediction. This transforms the system from an opaque detector into a transparent and explainable spatial–behavioral analysis framework, thereby strengthening its reliability and applicability for intelligent campus safety monitoring.
Although the YOLOv11-Safe framework can generally capture key spatial regions in most campus safety detection tasks and provide reliable visual explanations for subsequent risk-level prediction, its interpretability exhibits certain limitations under complex or ambiguous campus scenes. As illustrated in
Figure 9, the input depicts a student experiencing a safety-critical event in a crowded corridor with multiple overlapping individuals, partial occlusion, and uneven illumination.
Under these conditions, the attention heatmaps generated by CAM, Grad-CAM, and SSCAM for YOLOv11-Safe primarily concentrated on central body areas (e.g., torso or brightly illuminated clothing) while showing insufficient activation around peripheral regions such as the arms, legs, or wheelchair boundaries. In particular, Grad-CAM visualizations produced narrowly focused hotspots that did not adequately capture body tilt, partial ground contact, or unstable wheelchair orientation—features that are crucial for security staff to determine whether an incident represents a genuine fall or instability event.
This observation suggests a semantic bias in the model’s attention mechanism: it tends to emphasize high-contrast or central features while under-attending to low-contrast, peripheral, or occluded cues. Consequently, when unsafe behaviors are subtle, partially hidden, or occur within multi-person interactions, the current spatial attention module exhibits reduced sensitivity and interpretability.
These findings reveal potential limitations for real-world deployment: while YOLOv11-Safe performs reliably for typical unsafe behaviors (e.g., clear falls, wheelchair instability), it may still suffer from incomplete attention coverage in crowded, occluded, or visually cluttered campus environments. This highlights the need for future improvements such as adaptive multi-scale attention, multi-modal integration (e.g., combining RGB with depth or audio data), and temporal modeling to achieve more comprehensive interpretability in complex safety-critical monitoring scenarios.
3.4. Random Forest Classification Results
Before conducting feature-level interpretability analysis, statistical aggregation of the experimental dataset was performed to identify spatial scenes with dominant variable characteristics. Among the seven monitored locations, Scene 1 (dormitory corridor) exhibited the most prominent distributional deviations across all five variables. Specifically, the average event duration (D) reached 8.7 s, exceeding the cross-scene mean by 41%, while spatial density (SD) averaged 0.46 due to narrow corridor width and the presence of fixed barriers. The body posture angle (PA) showed a higher standard deviation (±18°) than any other scene, suggesting frequent imbalance during movement. Meanwhile, the body–ground contact ratio (BGCR) attained a moderate-to-high level (0.58), indicating repeated near-fall or slip events. The accessibility index (AI) remained the lowest (0.42) because of limited handrail continuity and uneven floor joints near door thresholds (as shown in
Figure 8). These combined factors resulted in Scene 1 contributing the largest number of L3–L4 samples (37.5% of all high-risk cases) in the dataset. This statistical dominance establishes Scene 1 as a representative high-risk spatial context for subsequent interpretability analysis. Accordingly, Random Forest classification and SHAP-based feature attribution were further applied to quantify how each variable influences the model’s prediction of risk levels (L1–L4).
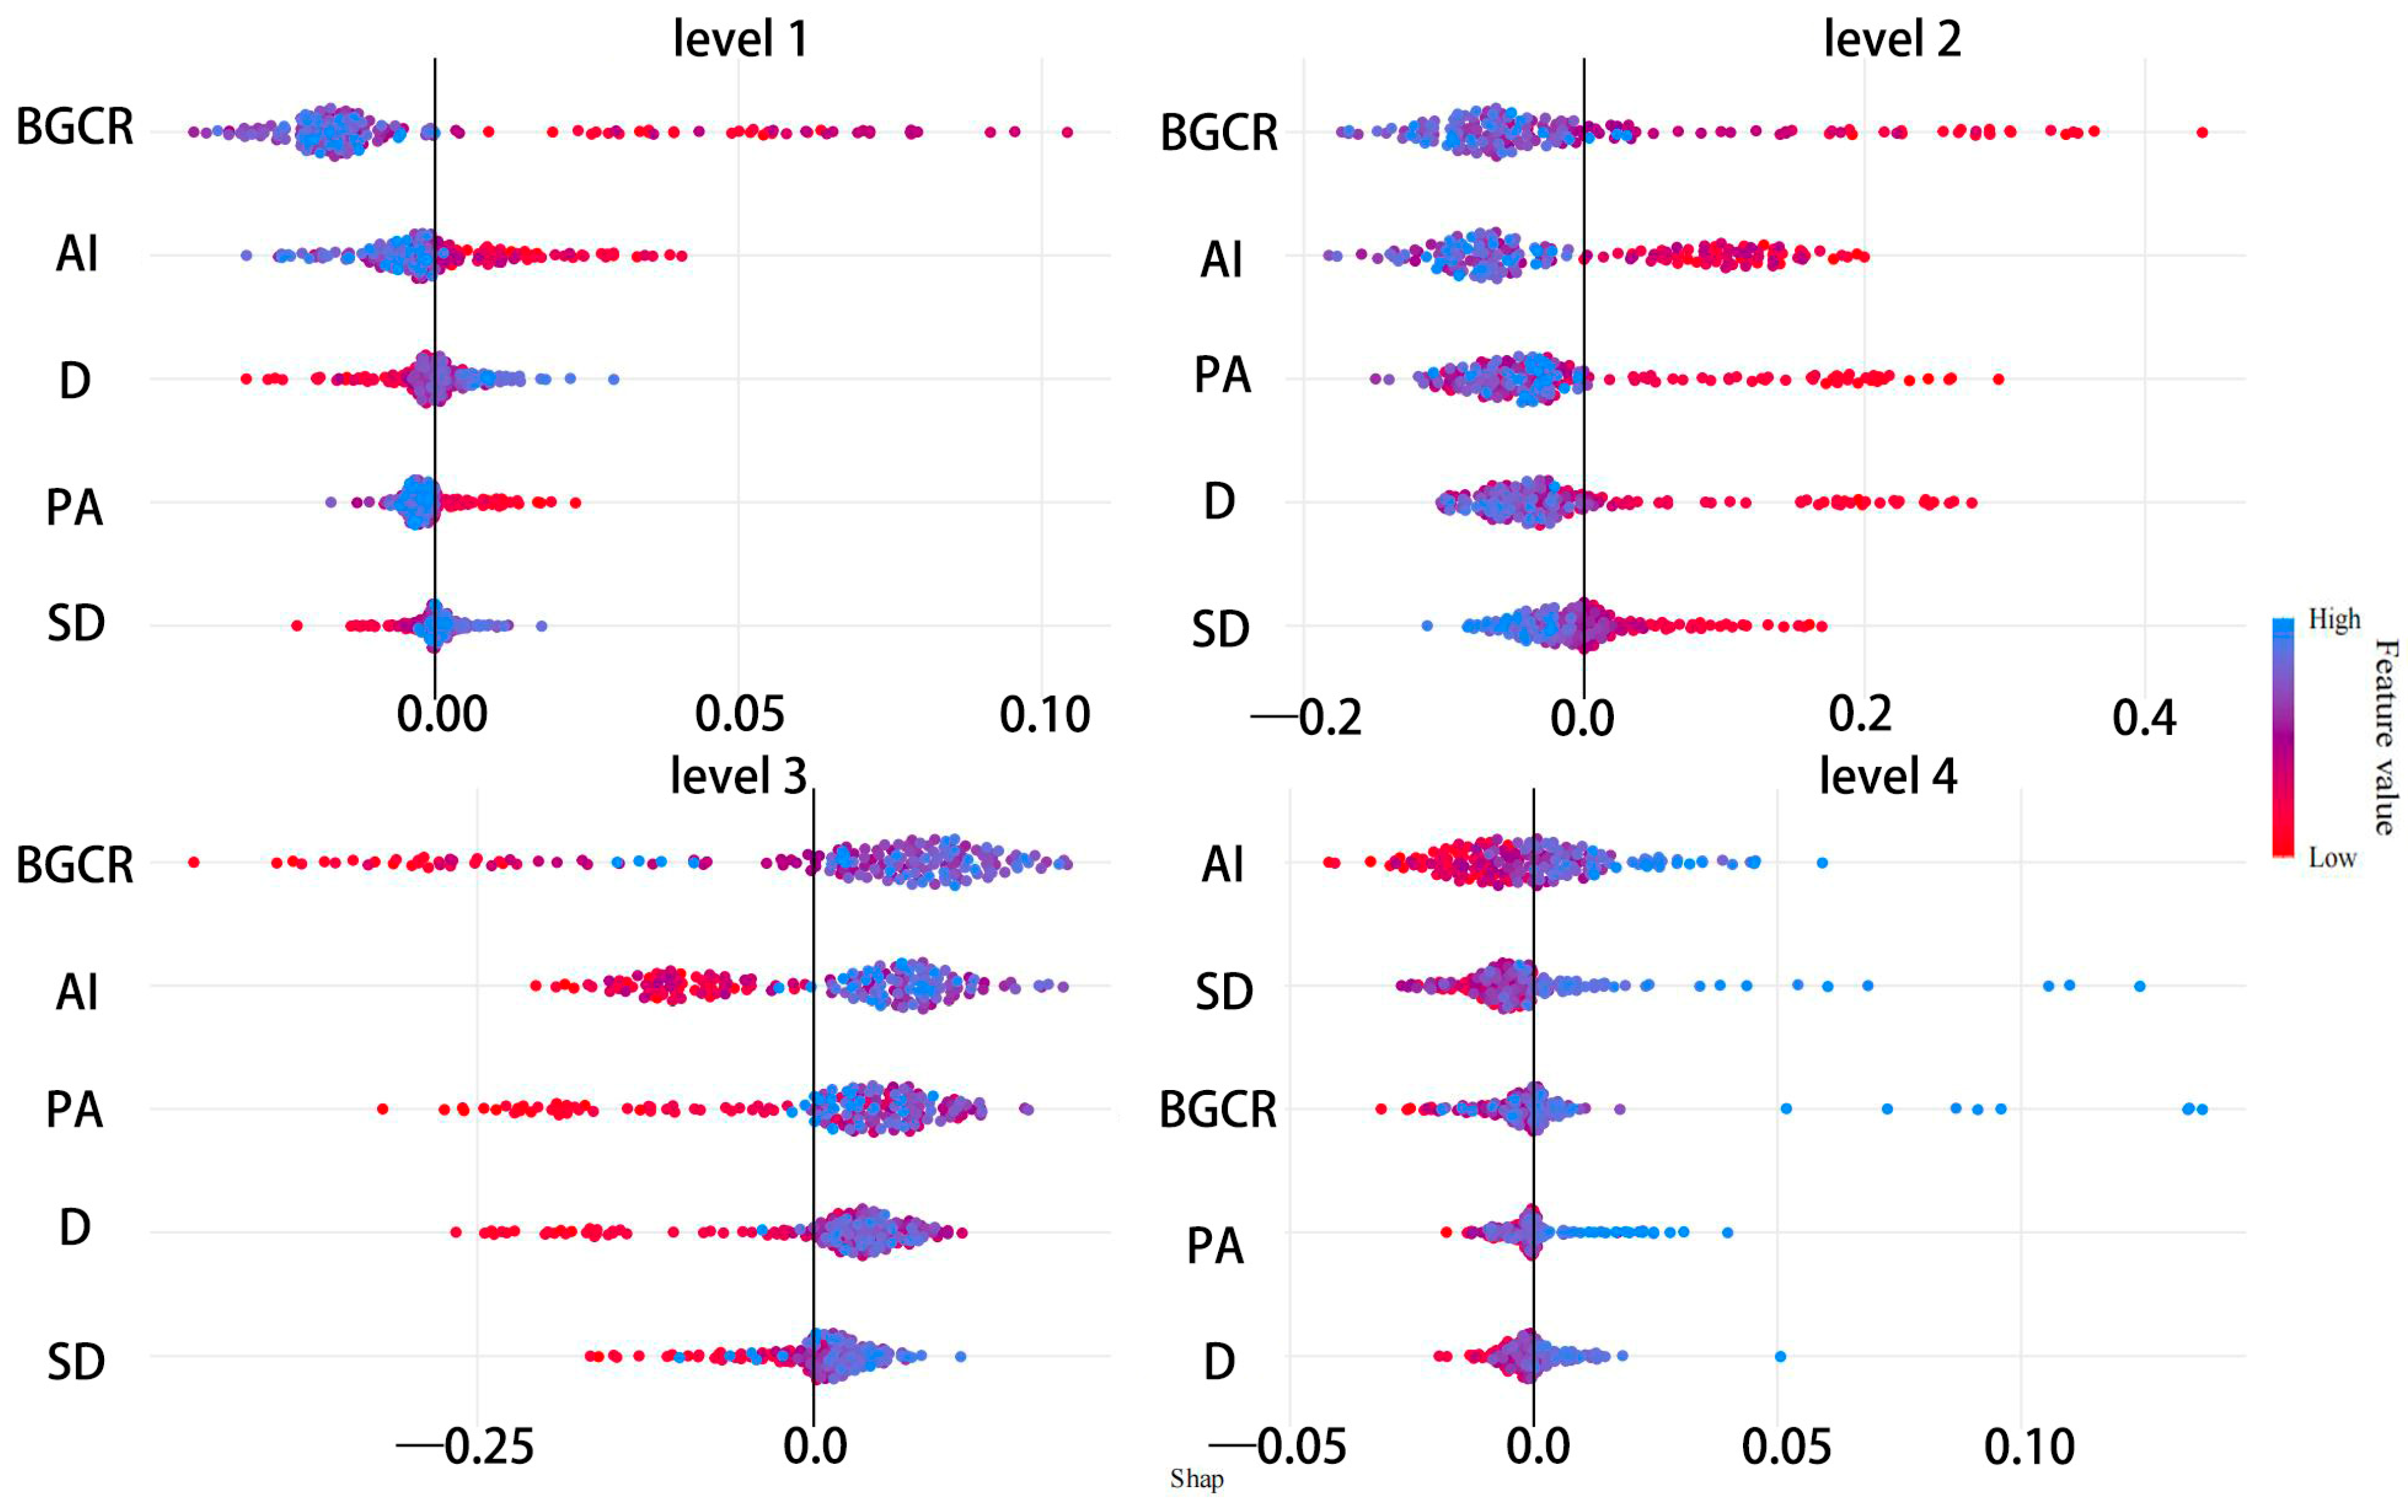
To ensure that the model not only achieves accurate classification but also provides interpretable decision logic, SHAP analysis was applied to the Random Forest risk-level predictor to quantify the marginal contribution of each spatial–behavioral feature across the four levels (L1–L4). As shown in
Figure 10, the class specific SHAP bee swarm plots reveal distinct contribution patterns, indicating strong alignment between the model’s prediction mechanism and established principles of architectural safety assessment.
First, the body–ground contact ratio (BGCR) exhibited the highest absolute SHAP values across all risk levels, confirming its role as the most influential determinant of spatial safety. High BGCR values strongly shifted predictions toward L3–L4, reflecting conditions where complete body-floor contact occurs—an outcome typically associated with slippery surfaces or steep gradients. Conversely, low BGCR values stabilized predictions in L1–L2, corresponding to safe surface conditions and stable flooring materials.
Second, the accessibility index (AI) formed the next most important factor, exerting a strong negative correlation with predicted risk. Low AI values—characterized by absent handrails, blocked ramps, or narrow egress paths—amplified high-risk predictions, whereas high AI values mitigated risks by providing effective environmental support. This finding reinforces the preventive role of barrier-free and ergonomically optimized design in campus buildings.
Third, event duration (D) ranked in the mid-tier of influence, with longer events contributing positively to risk escalation. Prolonged durations suggest spatial conditions that delay recovery or impede mobility, such as low-friction flooring or inadequate lighting. In contrast, short-duration events were more frequently classified as low risk.
Fourth, body posture angle (PA) acted as a boundary-refinement feature, influencing predictions primarily at the transition between moderate and high-risk categories. Smaller PA values (greater deviation from vertical) reinforced high-risk classifications, especially in stair or ramp scenes, whereas upright postures contributed negatively, anchoring predictions in safer levels.
Finally, spatial density (SD) had the smallest relative contribution. While high SD values (indicating crowding or narrow walkways) increased model sensitivity in confined spaces, the overall impact of SD was indirect, functioning as a contextual variable that modulates risk rather than directly triggering unsafe events.
In summary, these layered SHAP contribution patterns suggest that BGCR and AI dominate the spatial-safety inference process, representing the physical manifestation of accidents and the preventive potential of the built environment, respectively. Event duration and posture angle provide temporal and geometric refinements, while spatial density serves as a contextual modifier. This multi-level interpretability structure closely aligns with architectural safety evaluation principles, reinforcing the transparency, reliability, and design relevance of the YOLOv11-Safe + RF + SHAP framework in assessing spatial safety within campus buildings.
To further clarify the overall influence of spatial–behavioral variables on multi-level risk prediction, global feature importance was computed using the mean absolute SHAP values for the five core indicators: body–ground contact ratio (BGCR), accessibility index (AI), body posture angle (PA), event duration (D), and spatial density (SD). A stacked bar chart (
Figure 11) was generated to visualize the weighted contributions of each feature across the four risk levels (L1–L4).
Among all variables, BGCR exhibited the highest mean SHAP magnitude (≈0.25), substantially surpassing the others. In high-risk levels (L3–L4), elevated BGCR values were dominant, reflecting frequent or complete body–ground contact during fall or wheelchair instability events. This confirms BGCR as the most direct physical indicator of unsafe architectural surfaces, such as slippery flooring, uneven thresholds, or inadequate edge protection.
The accessibility index (AI) ranked second, contributing negatively to risk prediction. Lower AI values—associated with missing handrails, blocked ramps, or poor corridor clearance—corresponded to L3–L4 cases, whereas higher AI values mitigated risk by enabling safe movement. This demonstrates the model’s sensitivity to architectural prevention mechanisms, validating AI as a crucial design-level variable in spatial safety optimization.
The body posture angle (PA) occupied the third position, exerting a moderate yet consistent effect. Reduced posture angles (forward leaning or imbalance) correlated with higher risk levels, whereas upright postures stabilized predictions toward L1–L2. The event duration (D) followed closely, emphasizing that prolonged events typically occur in environments with low friction or poor lighting, where users require more time to regain balance. Finally, spatial density (SD) showed the smallest mean SHAP value, serving as a contextual factor rather than a direct trigger. Although high SD slightly increased risk in narrow corridors or clustered classroom settings, its overall contribution remained secondary.
In summary, the SHAP-based global importance hierarchy (BGCR > AI > PA > D > SD) quantitatively confirms that direct contact and accessibility dominate spatial-safety inference, while temporal and geometric features refine boundary distinctions between moderate and high-risk conditions. This evidence supports the rationality of the selected variables and underscores the interpretability, reliability, and architectural relevance of the YOLOv11-Safe + RF + SHAP framework for building-integrated campus safety assessment.
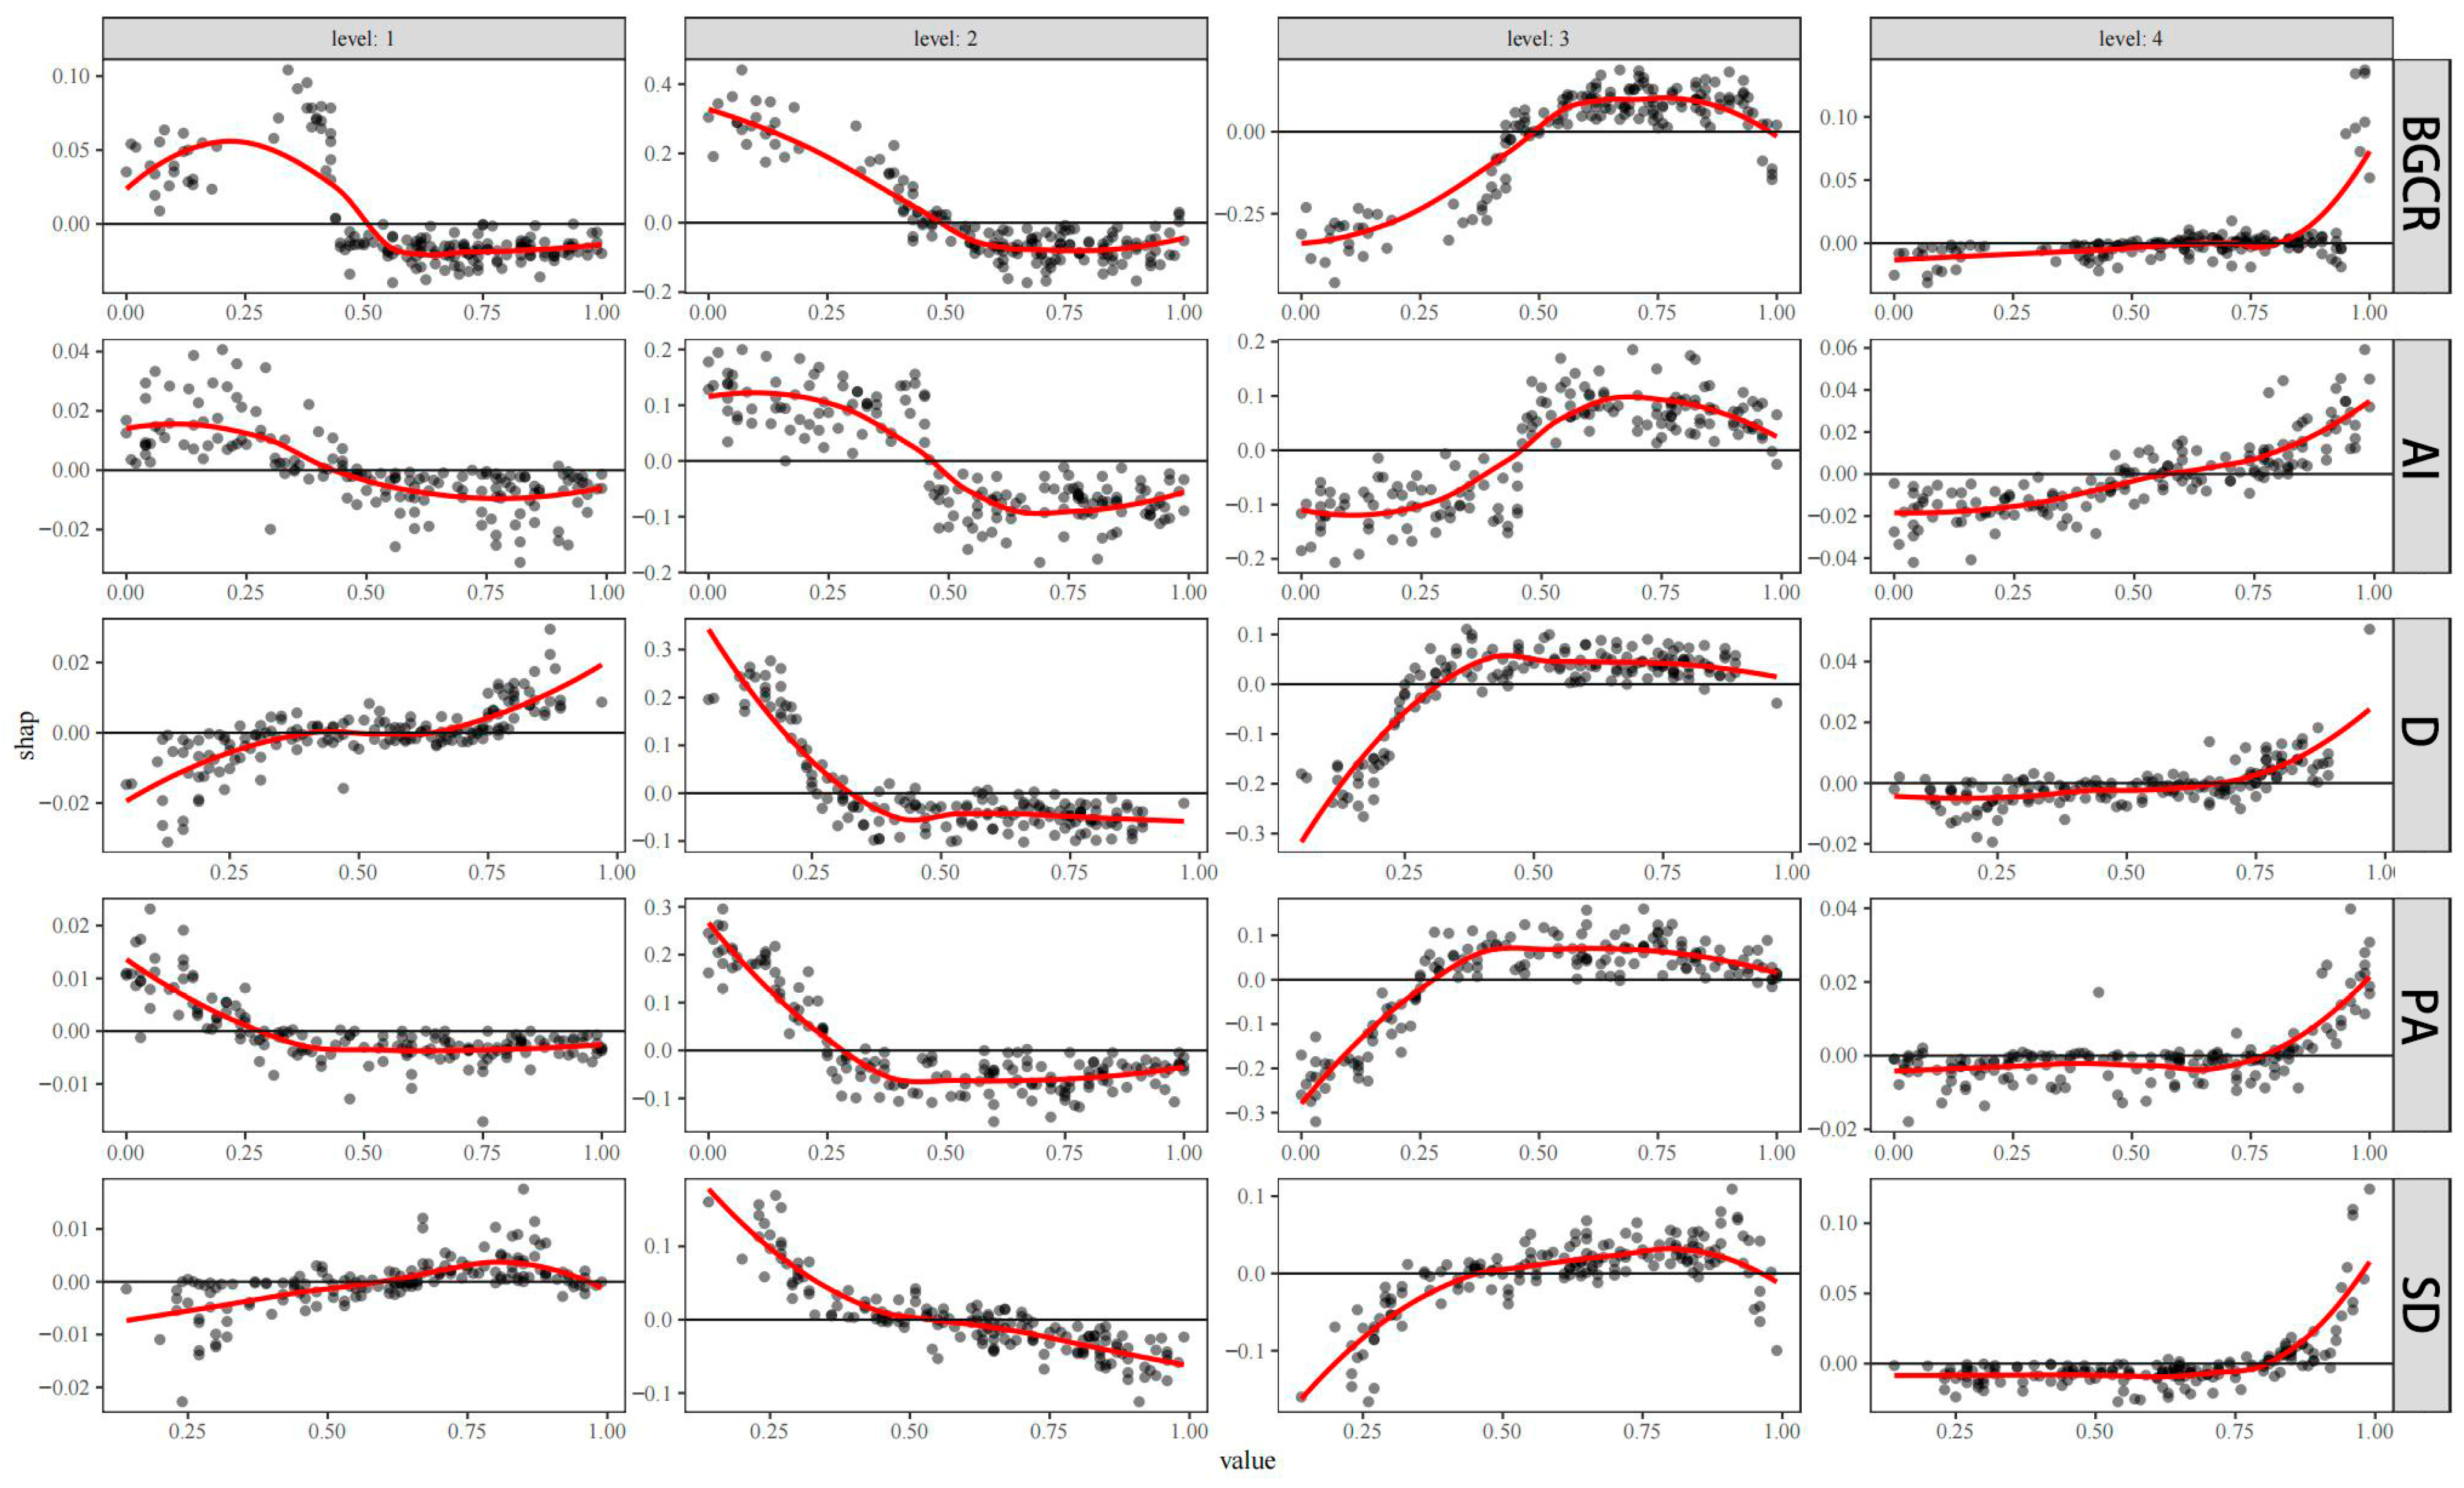
Figure 12 presents the SHAP dependency plots for the five core input variables—body–ground contact ratio (BGCR), accessibility index (AI), event duration (
D), body posture angle (
PA), and spatial density (
SD)—illustrating how their continuous value ranges influence risk-level predictions (L1–L4). Unlike the global feature importance ranking, these plots reveal nonlinear and threshold-based relationships between feature magnitude and SHAP value, providing deeper insight into how spatial and behavioral conditions shape the model’s decision logic.
BGCR exhibited the clearest and most consistent monotonic pattern across all levels. When BGCR values remained low (<0.3), corresponding to partial or no ground contact, SHAP values were close to zero or negative, indicating safe conditions (L1–L2). As BGCR exceeded 0.6—implying full body-floor contact—SHAP values sharply increased, driving predictions toward high-risk categories (L3–L4). This threshold transition reflects the model’s recognition of ground impact intensity as a direct physical indicator of unsafe spatial conditions, such as slippery floors or abrupt level changes.
The accessibility index (AI) displayed a reverse trend. Low AI values (<0.4), representing poor handrail coverage or blocked ramps, produced strongly positive SHAP contributions, elevating risk levels to L3–L4. In contrast, high AI values (>0.7) led to negative SHAP values, reducing predicted risk. This pattern demonstrates the protective function of architectural accessibility, confirming that well-designed circulation spaces mitigate incident severity.
For event duration (D), SHAP values remained low and stable until approximately 0.5, after which they increased nonlinearly, especially in L3 scenarios. Longer durations (>0.7) corresponded to positive SHAP values, indicating that persistent imbalance or delayed recovery significantly contributes to high-risk classification. Similarly, body posture angle (PA) showed a positive nonlinear increase as values approached the lower range (<0.4), representing leaning or collapsing postures; upright postures (>0.7) consistently maintained near-zero SHAP effects, stabilizing predictions within L1–L2.
Finally, spatial density (SD) produced relatively weak yet interpretable trends. Low SD values (<0.3) had negligible influence, but as SD increased beyond 0.6—representing narrow or obstructed spaces—SHAP values rose moderately, shifting predictions toward higher risk categories. This suggests that the model captures crowding and spatial confinement as contextual amplifiers of incident risk rather than direct causes.
Overall, these continuous-variable analyses demonstrate that the YOLOv11-Safe + RF + SHAP framework not only identifies globally dominant features but also learns value-dependent, nonlinear decision boundaries that align with architectural safety principles. The combined interpretation of global importance (
Figure 11), class-level beeswarm patterns (
Figure 9), and variable-specific dependencies (
Figure 12) confirms the framework’s transparency, robustness, and architectural applicability in multi-level spatial safety prediction.
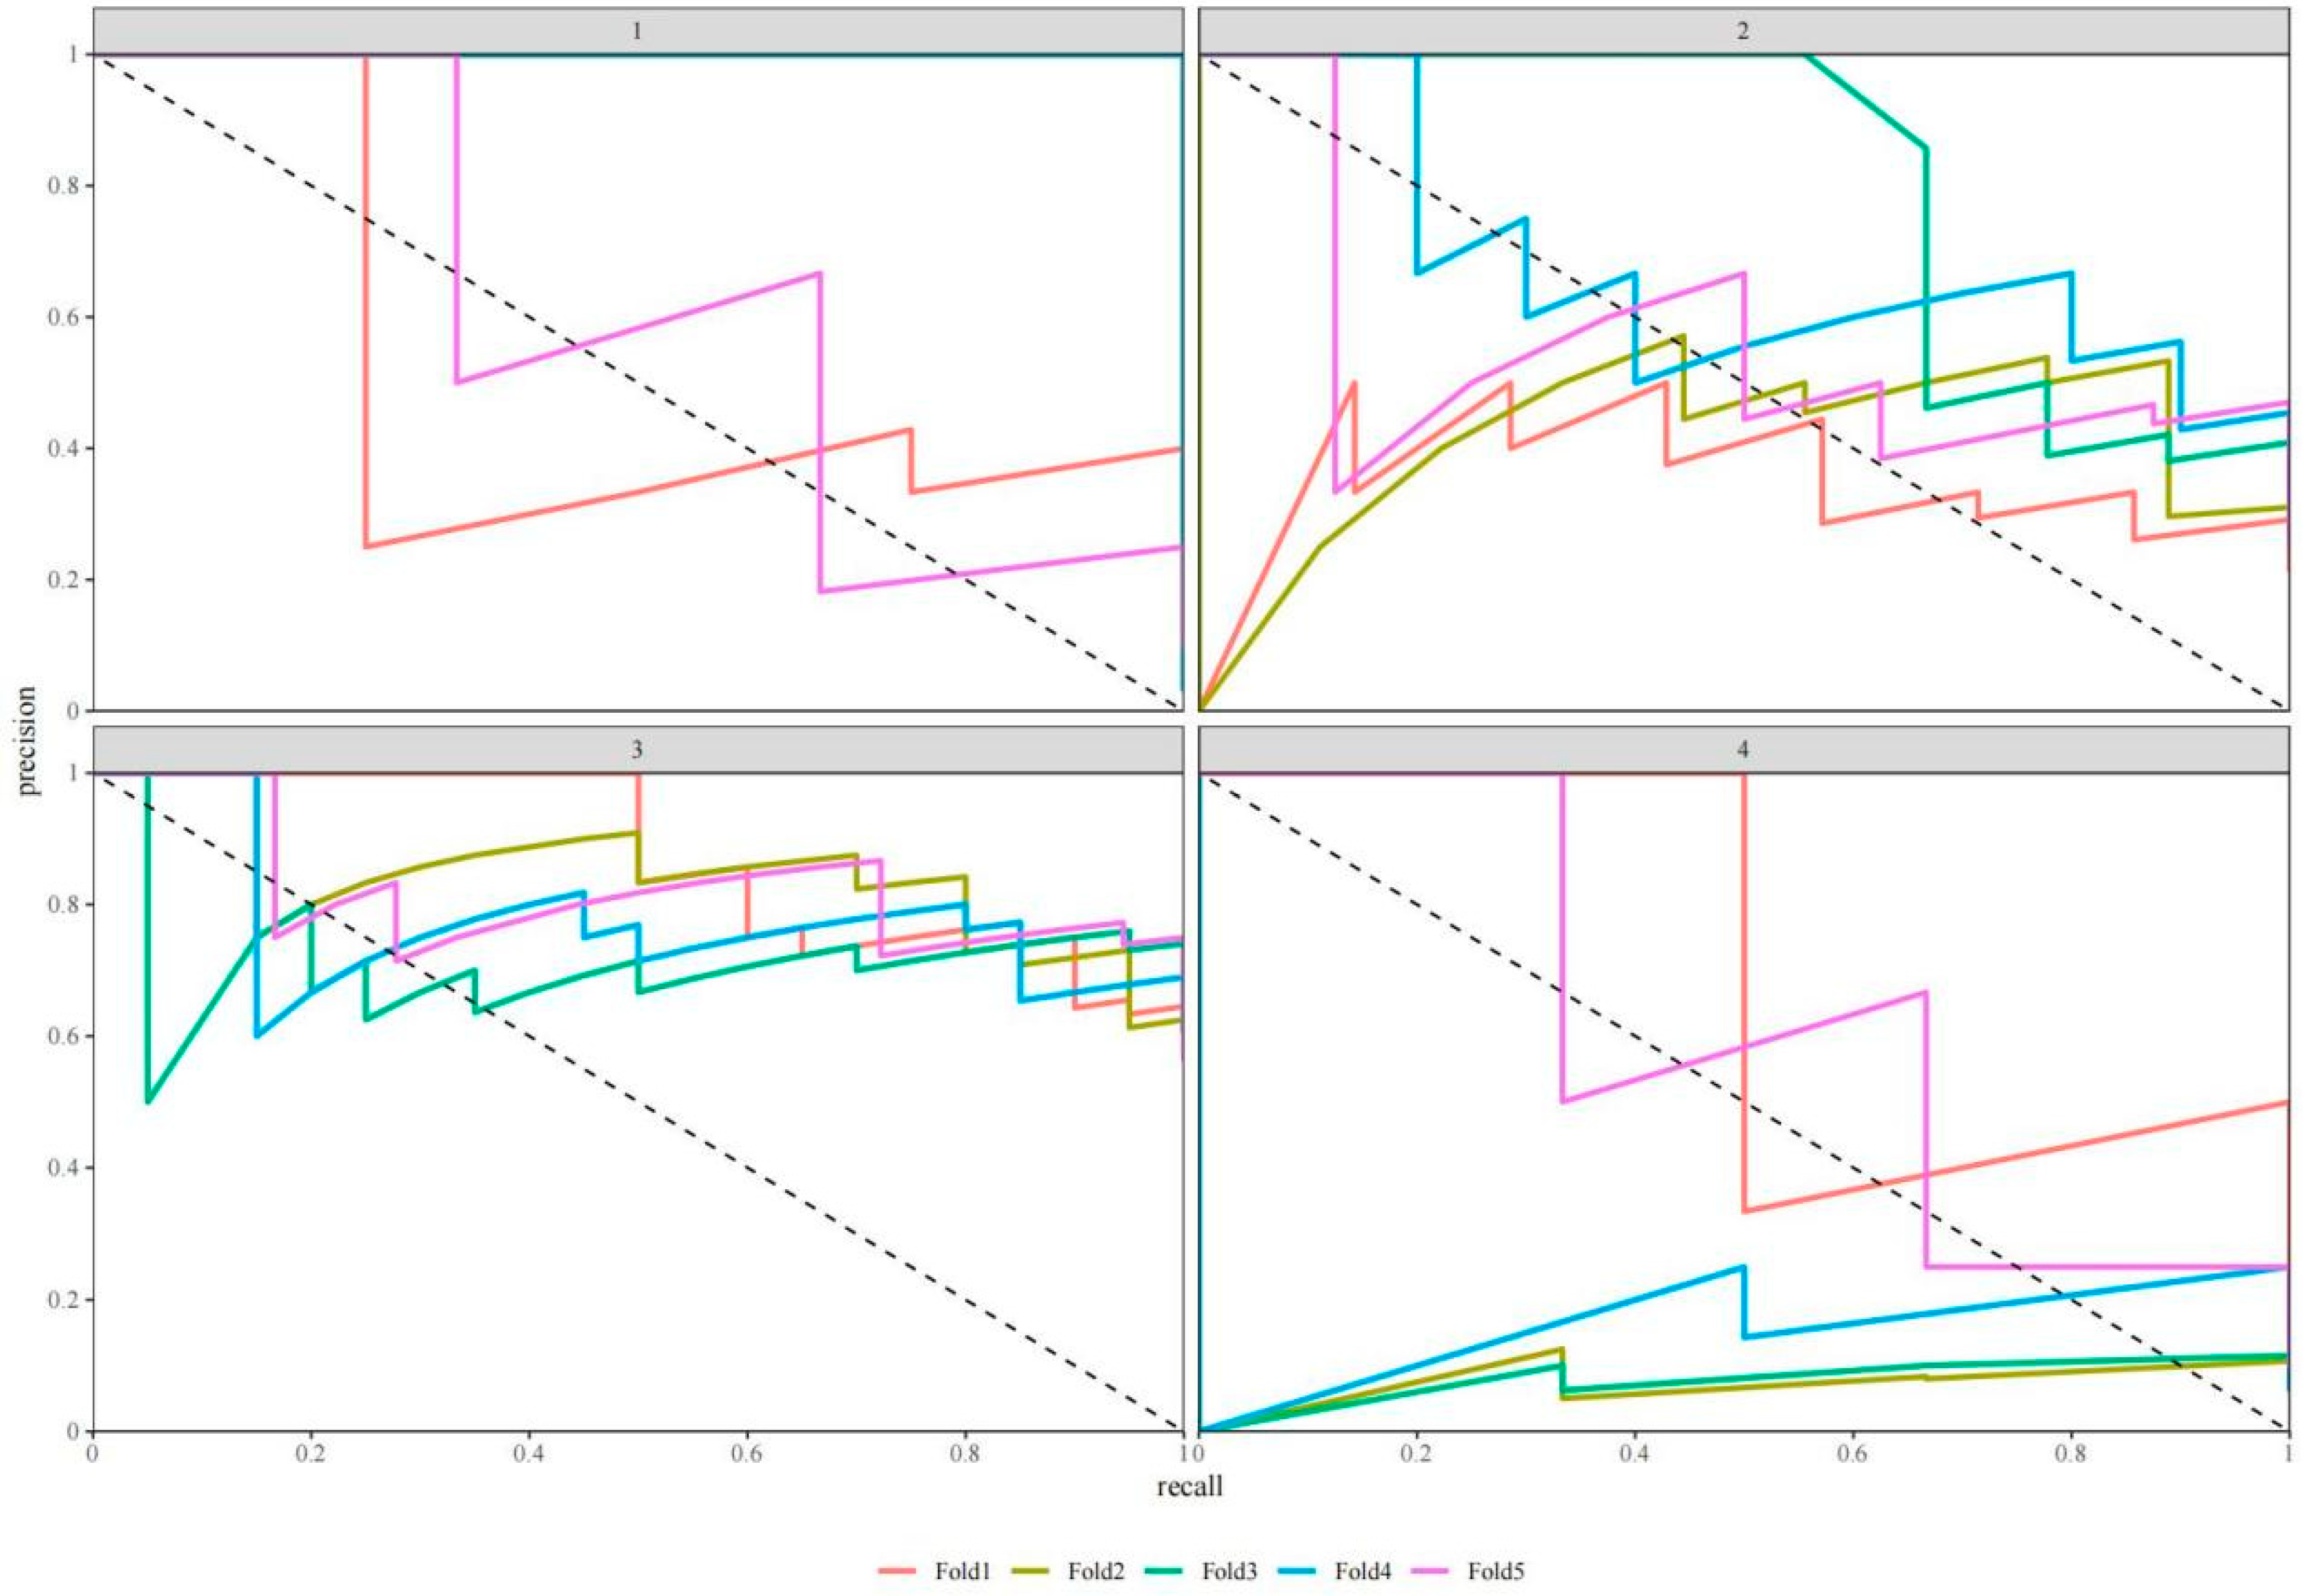
Figure 13 illustrates the precision–recall (PR) curves of the YOLOv11-Safe + RF risk-level prediction model under five-fold cross-validation across the four spatial risk categories (L1–L4). Each curve represents one validation fold, with recall on the x-axis and precision on the y-axis, providing an intuitive assessment of the model’s stability and robustness in multi-class spatial safety prediction.
For L1 (Low risk), the five PR curves are nearly identical and consistently well above the random baseline, with area under the PR curve (AUPRC) ranging between 0.85 and 0.90. This confirms high precision–recall balance and stable detection of low-risk conditions, such as short-duration micro-instabilities or safe movement in open, well-lit spaces. The uniformity of curves suggests that low-risk samples are well-separated in feature space.
For L2 (Medium–low risk), the PR curves-maintained precision above 0.80 up to recall ≈ 0.6, followed by gradual decline. This category often includes borderline scenarios, such as minor slips or temporary balance loss on smooth surfaces. The narrow variance among folds indicates consistent model generalization, showing that YOLOv11-Safe can reliably recognize early-stage instability patterns before they escalate.
For L3 (High risk), performance declined moderately, with AUPRC values between 0.45 and 0.60. These samples represent sustained imbalance events or wheelchair instability occurring in congested corridors or stair-adjacent spaces. The increased dispersion across folds suggests that feature overlap and class imbalance limit model precision at this stage—an expected challenge in architectural environments where mid-risk incidents share attributes with both safe and critical conditions.
For L4 (Very high risk), the PR curves showed extended plateaus starting near precision = 1.0, confirming that the model can confidently identify extreme cases such as complete falls, prolonged ground contact, or wheelchair overturns. Although these events are rare, their distinctive spatial–behavioral signatures (high BGCR, low AI, and steep PA deviation) ensure stable high-confidence predictions.
Across all risk levels, five-fold cross-validation confirms that the proposed framework achieves strong generalization and interpretability for spatial safety classification. Performance is particularly robust for L1 and L4, while intermediate levels (L2–L3) show modest sensitivity to spatial overlap and data imbalance. These results demonstrate the framework’s effectiveness for real-world building-safety assessment, while highlighting the potential for future work in feature representation optimization, imbalance mitigation, and adaptive spatial modeling to further enhance cross-level stability.
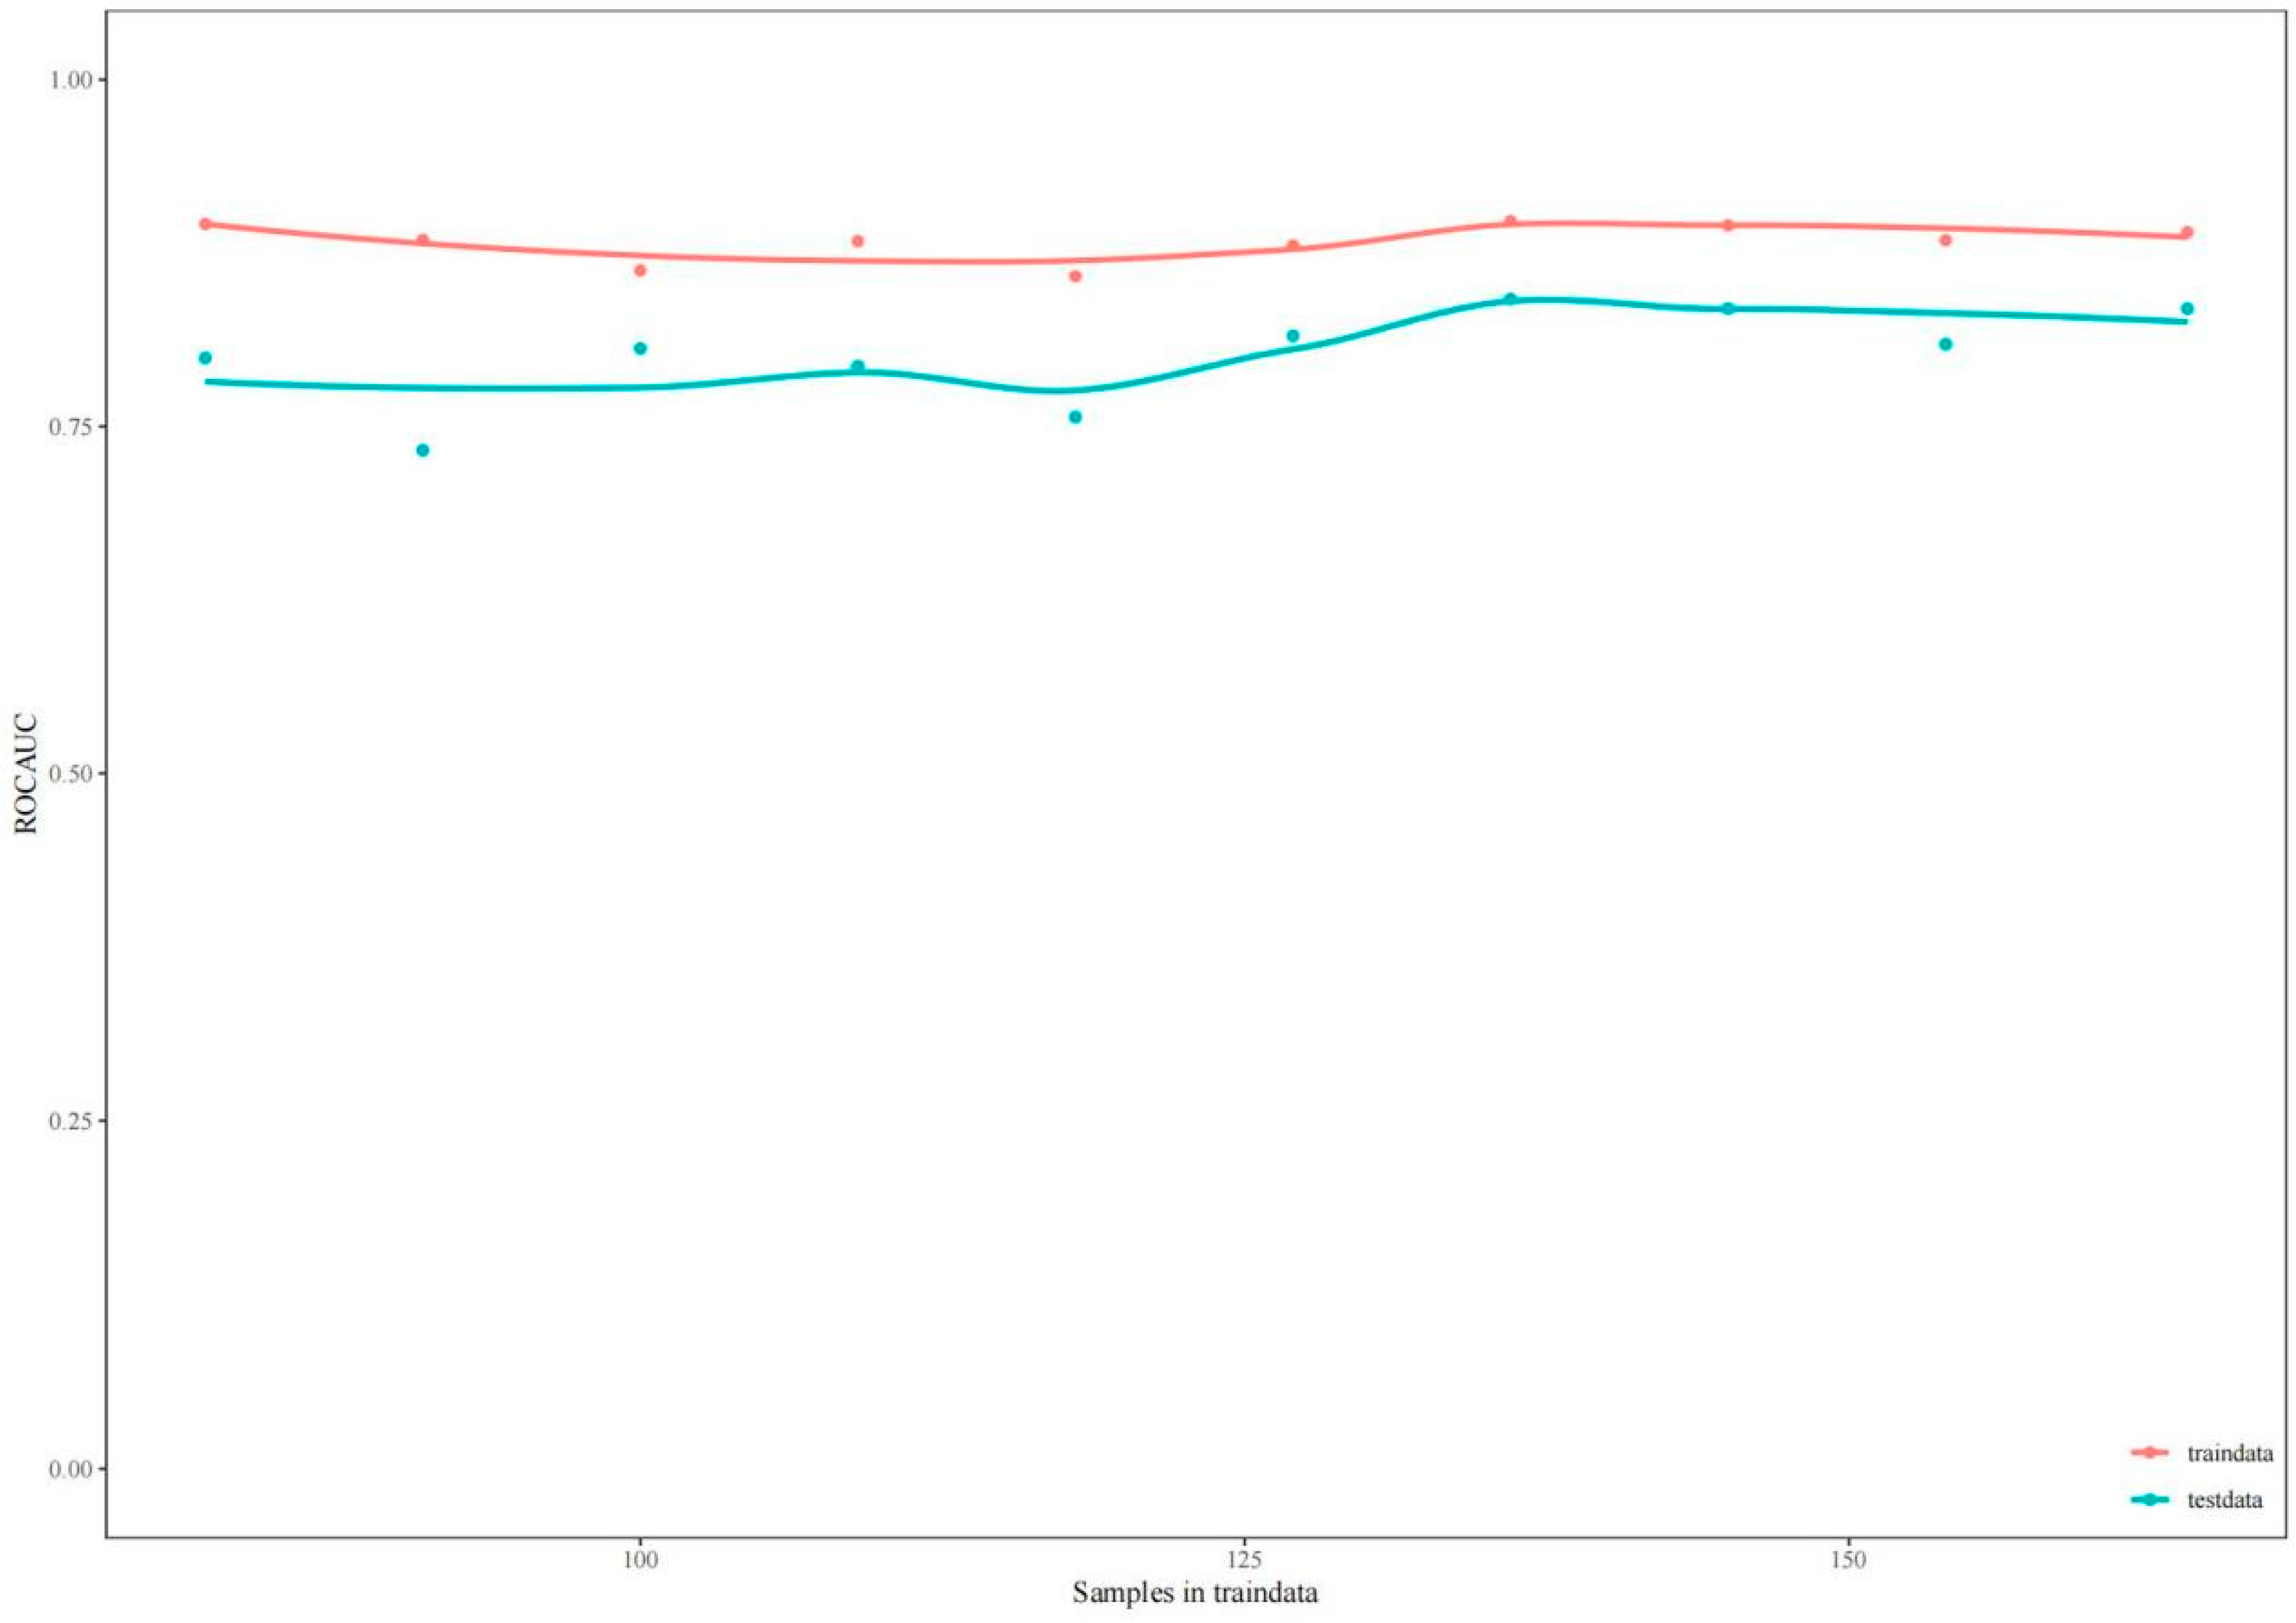
To further evaluate the generalization capacity of the proposed risk-level classifier within architectural contexts, test-set ROC–AUC learning curves were plotted under varying training sample sizes (
Figure 14). These curves visualize the evolution of classification performance as the number of training samples increased from approximately 100 to 150, providing insight into model stability and scalability.
To avoid over-interpretation of global AUC under limited data, we report one-vs-rest ROC–AUC and PR–AUC with 95% bootstrap confidence intervals (1000 resamples) computed from predicted probabilities, together with a confusion matrix and per-class Precision/Recall/F1 (
Supplementary Materials Figure S1). The average test ROC–AUC reached 0.93 [0.90, 0.95] (macro) and 0.94 [0.92, 0.96] (micro), indicating consistent discrimination across multiple risk levels. Class-wise AUCs were L1: 0.98 [0.96, 0.99], L2: 0.94 [0.90, 0.97], L3: 0.91 [0.87, 0.95], and L4: 0.96 [0.93, 0.98], with the L2–L3 pair showing the lowest separability—consistent with their semantic proximity and transitional visual characteristics.
The confusion matrix confirms that most misclassifications occurred between adjacent risk levels (L2 and L3), while L1 and L4 maintained high precision and recall. Global robustness metrics on the test set were Balanced Accuracy = 0.89, Cohen’s κ = 0.86, and MCC = 0.86, suggesting stable but not perfect generalization. Accordingly,
Figure 14 presents only test-set curves with CI bands, omitting overlapping training curves to prevent misinterpretation of apparent convergence.
Overall, the ROC–AUC analysis and diagnostic evaluation demonstrate that the YOLOv11-Safe feature extractor combined with Random Forest classification achieves consistent multi-level risk differentiation under current data conditions. While performance stability supports the model’s interpretability and architectural scalability, the results also highlight potential sensitivity between intermediate classes, warranting further validation with expanded datasets.
3.5. Scene-Based Verification and Design Feedback
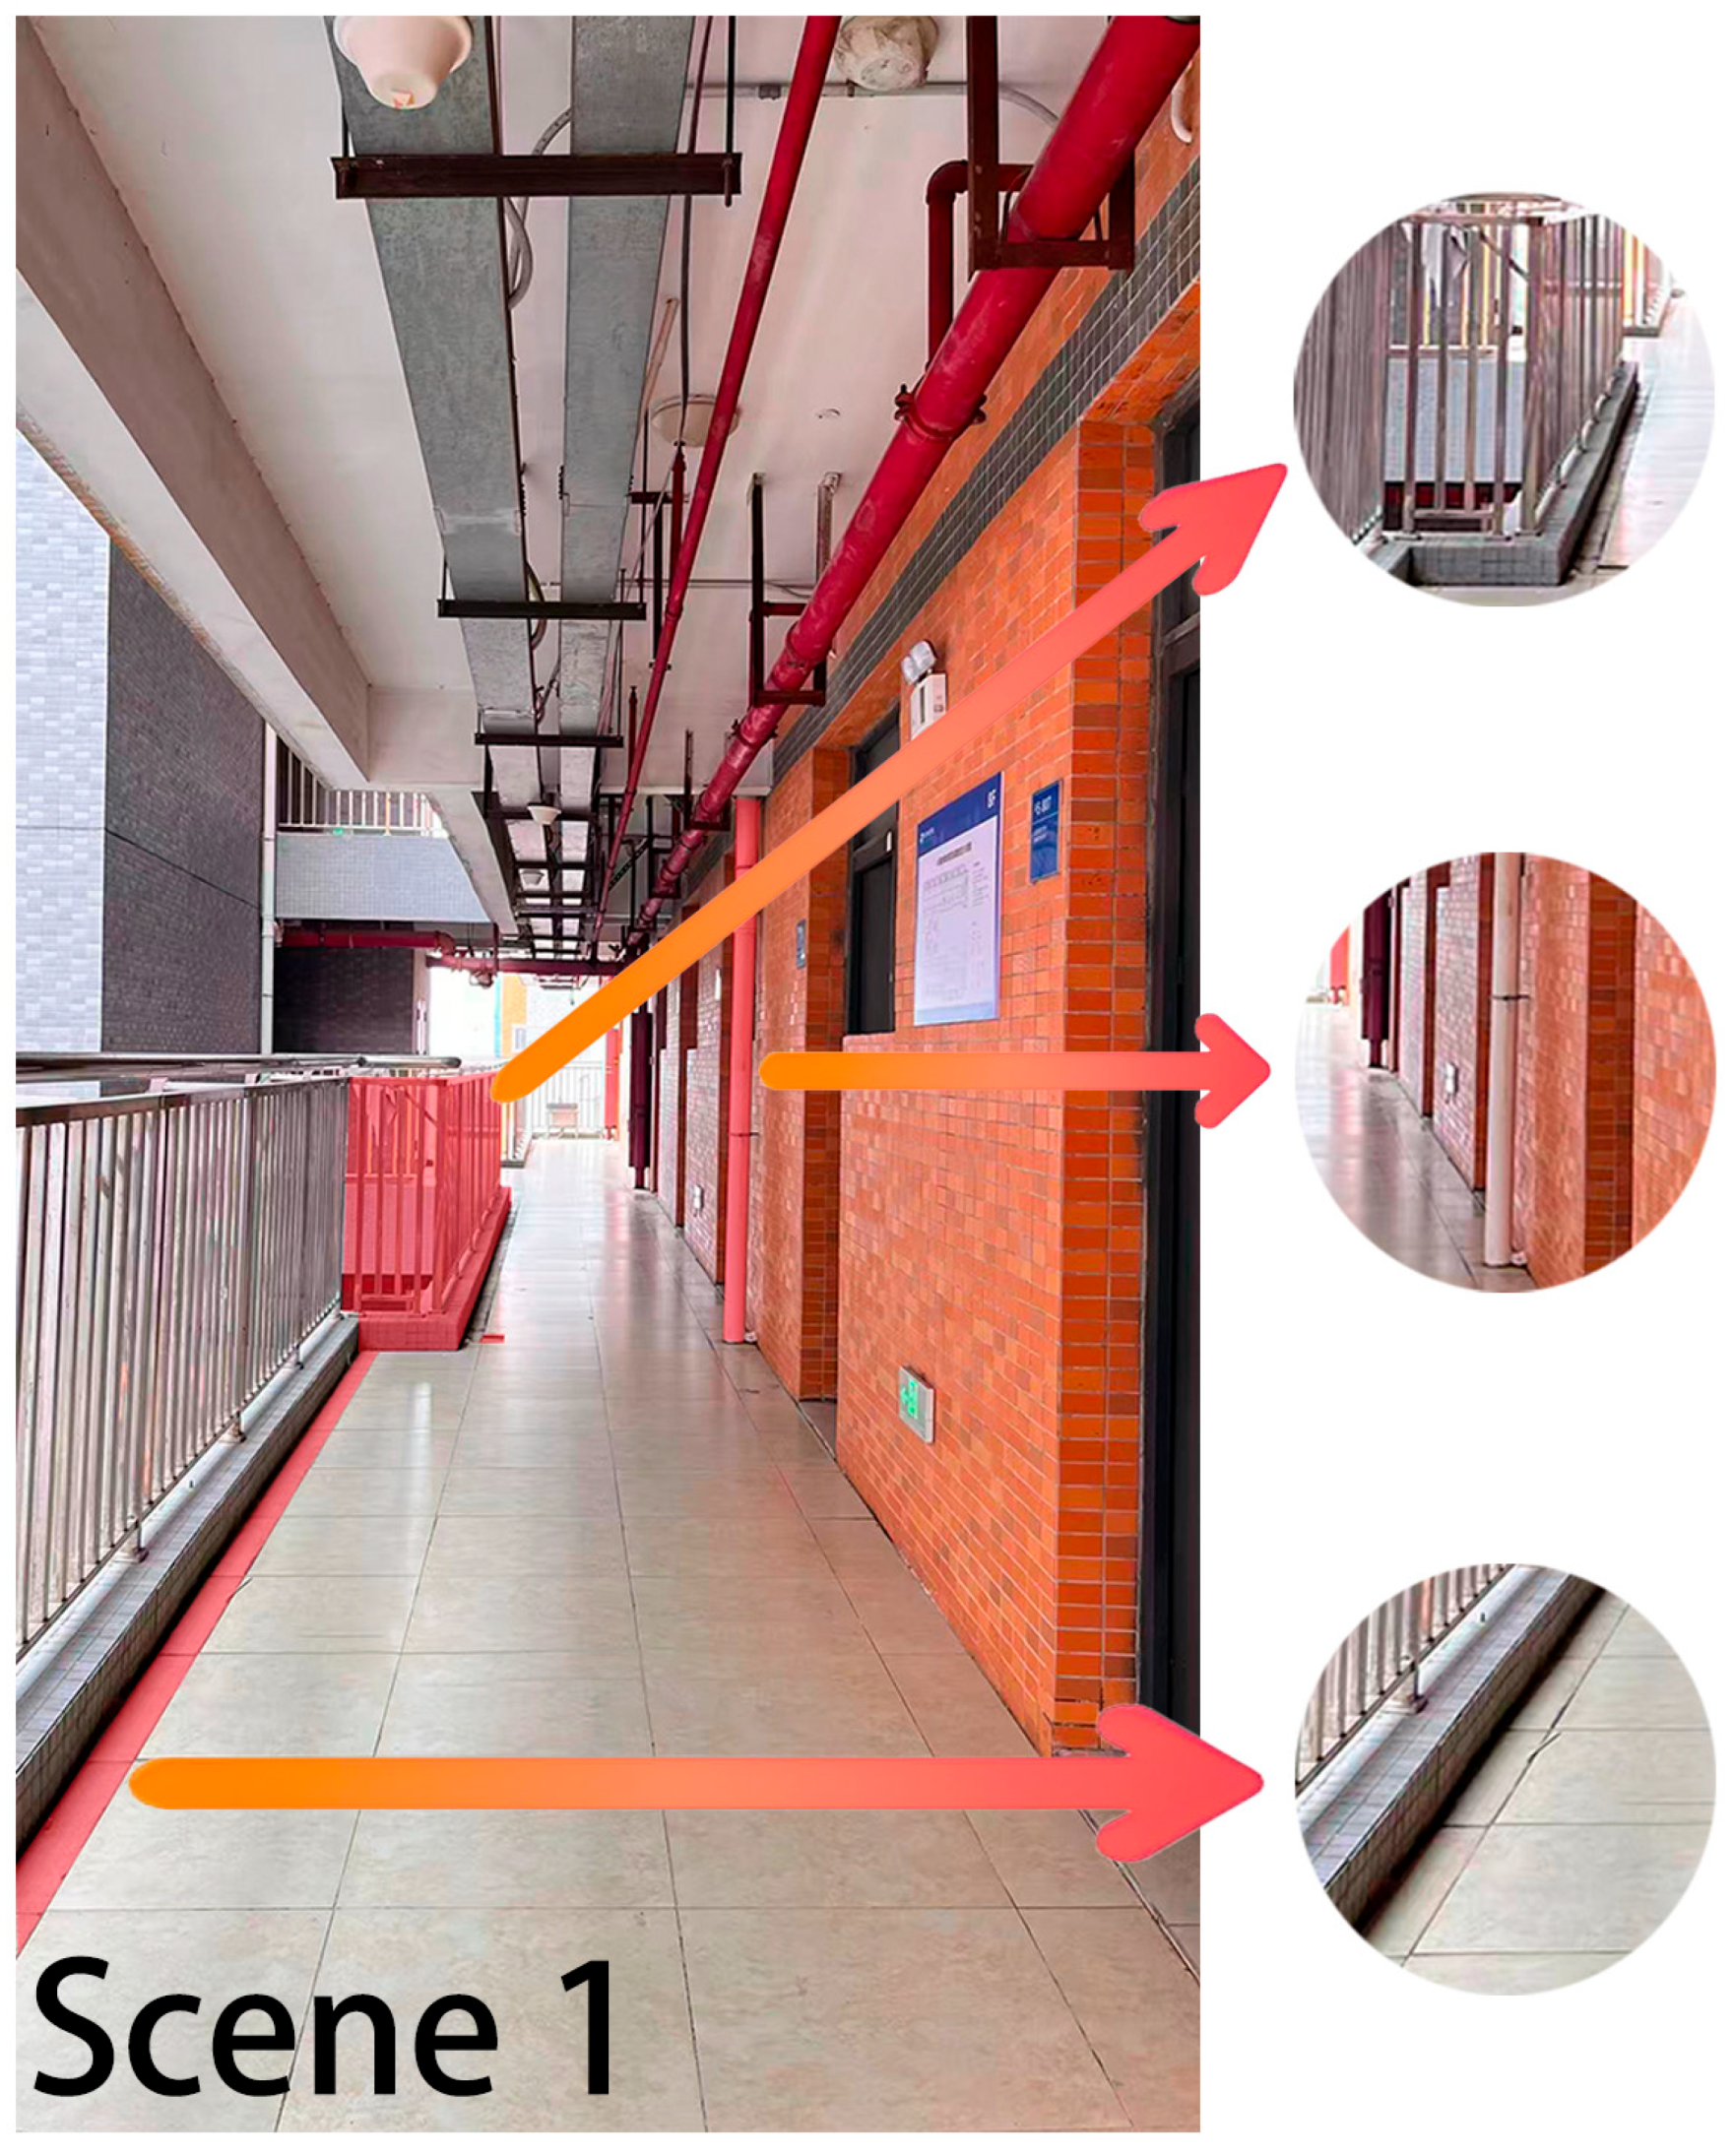
Figure 15 presents Scene 1 (Dormitory Corridor), which the model repeatedly classified as high risk (L3–L4) in both cross-validation and SHAP-based interpretation. Subsequent Random Forest feature attribution confirmed that this location exhibited the highest body–ground contact ratio (BGCR = 0.58) and the lowest accessibility index (AI = 0.42) among all monitored scenes. These results indicate that specific physical characteristics—such as abrupt corridor corners, level differences between the drainage channel and the floor surface, and protruding drainage pipes encroaching into the walkway—directly contributed to the elevated risk probabilities detected by the model.
Based on these quantitative findings, the corridor was revisited for post hoc spatial annotation. The highlighted areas in the figure mark architectural deficiencies identified through both visual inspection and model-supported evidence. This verification confirms that the YOLOv11-Safe + RF framework can effectively translate abstract risk predictions into site-specific design feedback, bridging computational analysis with tangible architectural modification strategies—such as installing continuous handrails, resurfacing the floor, and improving drainage edge detailing.
This step illustrates the final phase of the proposed workflow—data → model → spatial diagnosis → design feedback—thereby closing the loop between intelligent spatial safety prediction and architectural improvement within campus buildings.
