Article

Dynamic Response and Performance Degradation of a Deployable Antenna Under Sea-Based Excitation

1
School of Civil Engineering, Southeast University, Nanjing 211189, China
2
Nanjing Research Institute of Electronics Technology, Nanjing 210039, China
*
Author to whom correspondence should be addressed.
Buildings 2025, 15(22), 4108; https://doi.org/10.3390/buildings15224108
Submission received: 22 October 2025 / Revised: 11 November 2025 / Accepted: 12 November 2025 / Published: 14 November 2025

Abstract

To address the performance degradation of large deployable antennas mounted on floating offshore platforms, this paper presents a systematic investigation into their dynamic response and surface precision evolution under typical sea-based excitations. A high-fidelity finite element model of a truss-type deployable antenna is established, with the root mean square (RMS) error serving as the primary metric for the quantitative assessment of surface precision. Through a comparative analysis of structural behaviors under static loads (e.g., gravity and wind) and dynamic excitations (e.g., heave and roll motions), the antenna’s response characteristics under complex loading conditions are revealed. The results indicate that the peak surface precision error induced by dynamic excitation occurs during the initial transient phase, rather than the steady-state phase. Furthermore, the structure exhibits high sensitivity to roll motion parameters, with a 90° roll azimuth identified as the worst-case scenario. The RMS value of the surface error is also found to increase linearly with motion amplitude. This study successfully quantifies the influence of the marine environment on antenna performance, providing a theoretical basis for the optimization design and performance evaluation of offshore antenna structures.

1. Introduction

Modular and transformable structures, capable of large-scale geometric changes from a compact, stowed state to a large, deployed state, are at the forefront of modern engineering innovation. Deployable antennas, as key equipment for achieving wide-area coverage and high-gain communication and detection, play an essential role in modern technology. Traditionally, their design and application have primarily focused on the aerospace field to meet the demands of satellite communication and deep-space exploration [1]. However, with the increasing strategic importance of the maritime domain, the demand for such advanced technologies is gradually expanding from deep space to the deep blue ocean. Deploying large deployable antennas on marine floating platforms to construct a stable maritime monitoring and communication network has emerged as a promising new research direction [2,3].
In stark contrast to the relatively vacuum and microgravity space environment, the marine environment is extremely complex and variable. Antenna systems deployed on buoys are constantly subjected to the combined effects of environmental loads such as wind, waves, and currents [4,5]. These loads induce intense, multi-degree-of-freedom reciprocating motions (such as heave and roll) in the buoy, which serves as the base. The nonlinear dynamic response of the buoy is one of the core issues in the field of marine engineering [6,7,8]. The dynamic excitation caused by the base motion is directly transmitted to the upper precision antenna structure, causing vibrations and deformations that significantly affect its key performance metric—surface accuracy. Any degradation of surface accuracy will directly lead to a decline in antenna electrical performance (such as reduced gain and beam pointing offset), and even mission failure [9,10]. Therefore, gaining a deep understanding of the dynamic response characteristics of deployable antennas under marine base excitation and quantifying their performance degradation patterns is of great theoretical value and urgent engineering significance for guiding the reliability design, performance evaluation, and operational state prediction of such antennas in the marine environment.
In terms of space-based applications, the development of large truss-type deployable antennas has spanned several decades, with continuous innovation in structural forms, drive mechanisms, and the application of smart materials [11]. From the early landmark achievements, such as the Seasat SAR in the United States and the ERS-1 of the European Space Agency, to the more mature technological iterations of the Canadian RADARSAT series [12,13], and the more diverse structural forms of the recent Argentina SAOCOM [14,15], Japan ALOS, and the NASA-ISRO NISAR mission, these projects have collectively driven significant progress in synthetic aperture radar for Earth observation [16,17,18]. Along with these engineering practices, high-precision in-orbit measurement techniques, such as photogrammetry, have also become key means for assessing the surface accuracy of large reflectors [19]. However, these milestone studies have all targeted space environments, with load conditions (microgravity, thermal cycling) and boundary conditions fundamentally different from those in the marine environment.
In marine engineering, research on the motion response of floating platforms such as buoys has established a mature theoretical and methodological system, covering both model testing and numerical simulation [20,21,22]. Scholars have conducted in-depth analyses of the dynamics of deep-water buoy systems and their complex mooring systems using experiments and coupled nonlinear time-domain methods, and proposed various methods for calculating buoy attitude angles under environmental loads [23,24]. Researchers have systematically studied the motion response amplitude operators (RAOs) of specific buoys through tank tests and numerical simulations [25,26,27]. These studies have laid a solid foundation for understanding the platform motion characteristics as the excitation source, and their analysis methods have been successfully applied to the coupled dynamic analysis of various marine equipment, such as floating wind turbines and wave energy converters [28,29]. However, these studies focus on the survival and stability of the platform itself, typically simplifying the upper structure as a rigid mass, with little involvement in the internal performance degradation of precision payloads such as antennas.
Despite significant achievements in both “space deployable antennas” and “dynamics of marine platforms,” their research paradigms differ fundamentally. The former focuses on deployment accuracy and on-orbit stability in the space environment (characterized by microgravity and high vacuum), with challenges primarily stemming from unique effects such as extreme thermal cycling. In contrast, the latter concentrates on structural survivability and operational performance in the marine environment, with its main challenge being to address the strong dynamic disturbances caused by the intense reciprocating motion of the base. Therefore, systematic research on the dynamic response of the coupled system of marine floating platforms and large deployable antennas, especially the evolution laws of antenna surface accuracy under marine motion excitation, remains a gap [30,31]. Existing studies cannot directly answer how antenna performance degrades under heave and roll conditions, and which motion parameters are the dominant factors.
To fill the aforementioned research gap, this paper aims to systematically investigate the dynamic response and performance degradation patterns of truss-type deployable antennas under marine base excitation. The organization of this paper is as follows: Section 2: Develop a high-fidelity numerical model that accurately reflects the physical characteristics of the antenna and define its performance evaluation criteria. Section 3: Analyze the antenna response under its own weight and wind load based on this model to determine its static performance baseline and the most unfavorable conditions. Section 4: As the core of the study, conduct parametric simulation research on the dynamic behavior of the antenna under buoy heave and roll motion to reveal the influence laws of key motion parameters on surface accuracy.

2. High-Fidelity Finite Element Modeling

This section details the development of the high-fidelity finite element model (FEM), which serves as the foundation for all subsequent numerical analyses presented in this study. The process encompasses a description of the physical system configuration and the specific methodology used to translate it into an accurate numerical model within the finite element software environment.

2.1. Physical System Description

The truss-type deployable antenna is a common structural form widely used in fields like space communication and remote sensing [32]. Its modularity and high deployment ratio also make it suitable for marine platforms requiring rapid deployment. The specific design in this study is based on established configurations for large deployable antennas, and this study focuses on a truss-type deployable antenna system specifically designed for offshore platforms. As illustrated in Figure 1, the system comprises a central frame mounted on a buoy, surrounded by six identical deployable antenna units arranged in an annular array. Each antenna unit consists of a reflector surface and a deployable support truss. In its fully deployed state, the entire antenna array has an approximate overall span of 1977.84 mm, a height of 570.14 mm, and a width of 600 mm.
The design of the support truss is based on the planar four-bar mechanism, which serves as its fundamental kinematic unit. This mechanism was chosen for its inherent advantages, including ease of manufacturing, minimal joint wear, and high kinematic reliability. To guarantee an interference-free deployment, the link lengths are designed in accordance with Grashof’s Law, ensuring the desired kinematic path is achieved.
In its fully deployed, operational state, the four independent planar four-bar mechanisms transform into stable triangular trusses. These are then secured by a locking mechanism to form a single, rigid structure. This configuration ensures that the individual reflector panels align precisely to be co-planar, thereby creating a flat, seamless, and continuous reflector surface, which is critical for meeting the antenna’s stringent electrical performance requirements.

2.2. Finite Element Modeling

All numerical simulations presented in this paper were performed using the commercial finite element analysis software Abaqus 2020. A high-fidelity numerical model of the antenna in its fully deployed state was developed to accurately analyze its mechanical performance under complex marine environmental conditions. In this model, all structural members, including those of the reflector surface and the support truss, are discretized using three-dimensional beam elements.
The elements are modeled with an annular cross-section to precisely represent the hollow circular tubes, which feature an outer diameter of 26 mm and a wall thickness of 2 mm. The entire structure is modeled using 2A12 aluminum alloy, with the following material properties: a density of 2.78 × 10³ kg/m3, a Young’s modulus of 70.6 GPa, and a Poisson’s ratio of 0.31. The specific lengths of the truss members are detailed in Table 1, and their spatial arrangement is illustrated in Figure 2a.
To ensure the reliability of the numerical results, the mesh density was carefully considered. Since the model is primarily composed of beam elements, its overall dynamic response is known to be less sensitive to mesh discretization, and the element size was chosen based on established practices to ensure the accuracy of the conclusions.
To accurately represent the structure’s internal connectivity, different joint types were modeled distinctly. For the revolute joints connecting the members, “Hinge” connectors were employed. These connectors precisely simulate the kinematics of a physical hinge by constraining all relative translations between two points while releasing the single rotational degree of freedom (DOF) about a specific axis. In contrast, the rigid nodes, which are locked in the deployed state, were simulated using “Binding” constraints. These constraints restrict all six relative DOFs (three translational and three rotational) between the nodes, effectively emulating a rigid connection.
Furthermore, to define the model’s interaction with its foundation, the buoy structure was modeled as a rigid body. This assumption is justified because the buoy’s structural stiffness is significantly higher than that of the antenna, rendering the effect of its elastic deformation on the antenna’s response negligible. The antenna model is attached to this foundation at four connection points on its base. At these locations, fixed boundary conditions were imposed by constraining all six DOFs (U1 = U2 = U3 = UR1 = UR2 = UR3 = 0), as illustrated in Figure 2b. These four fixed points serve a dual purpose: they act as the supports for the static load analyses and as the input interfaces for the dynamic base excitation analyses.

2.3. Performance Evaluation Metric

To facilitate a precise and quantitative assessment of the antenna’s performance degradation under various operational conditions, the Root Mean Square (RMS) error is adopted as the primary metric for surface precision. The RMS error is an effective statistical measure that quantifies the overall deviation of a surface from its ideal form. It is calculated from the collective displacement of critical nodes on the reflector surface relative to an ideal reference plane following deformation. A smaller RMS value signifies less deviation, which in turn indicates a higher surface precision. The distribution of the critical nodes selected for this computation is illustrated in Figure 3, and the governing formula is presented as Equation (1):
δ R M S = 1 n n i = 1 Δ i 2
where n is the total number of critical nodes; Δi is the normal distance of the i-th critical node from the ideal reference plane.

3. Baseline Performance Assessment Under Static Loading

3.1. Structural Performance Under Gravity Loading

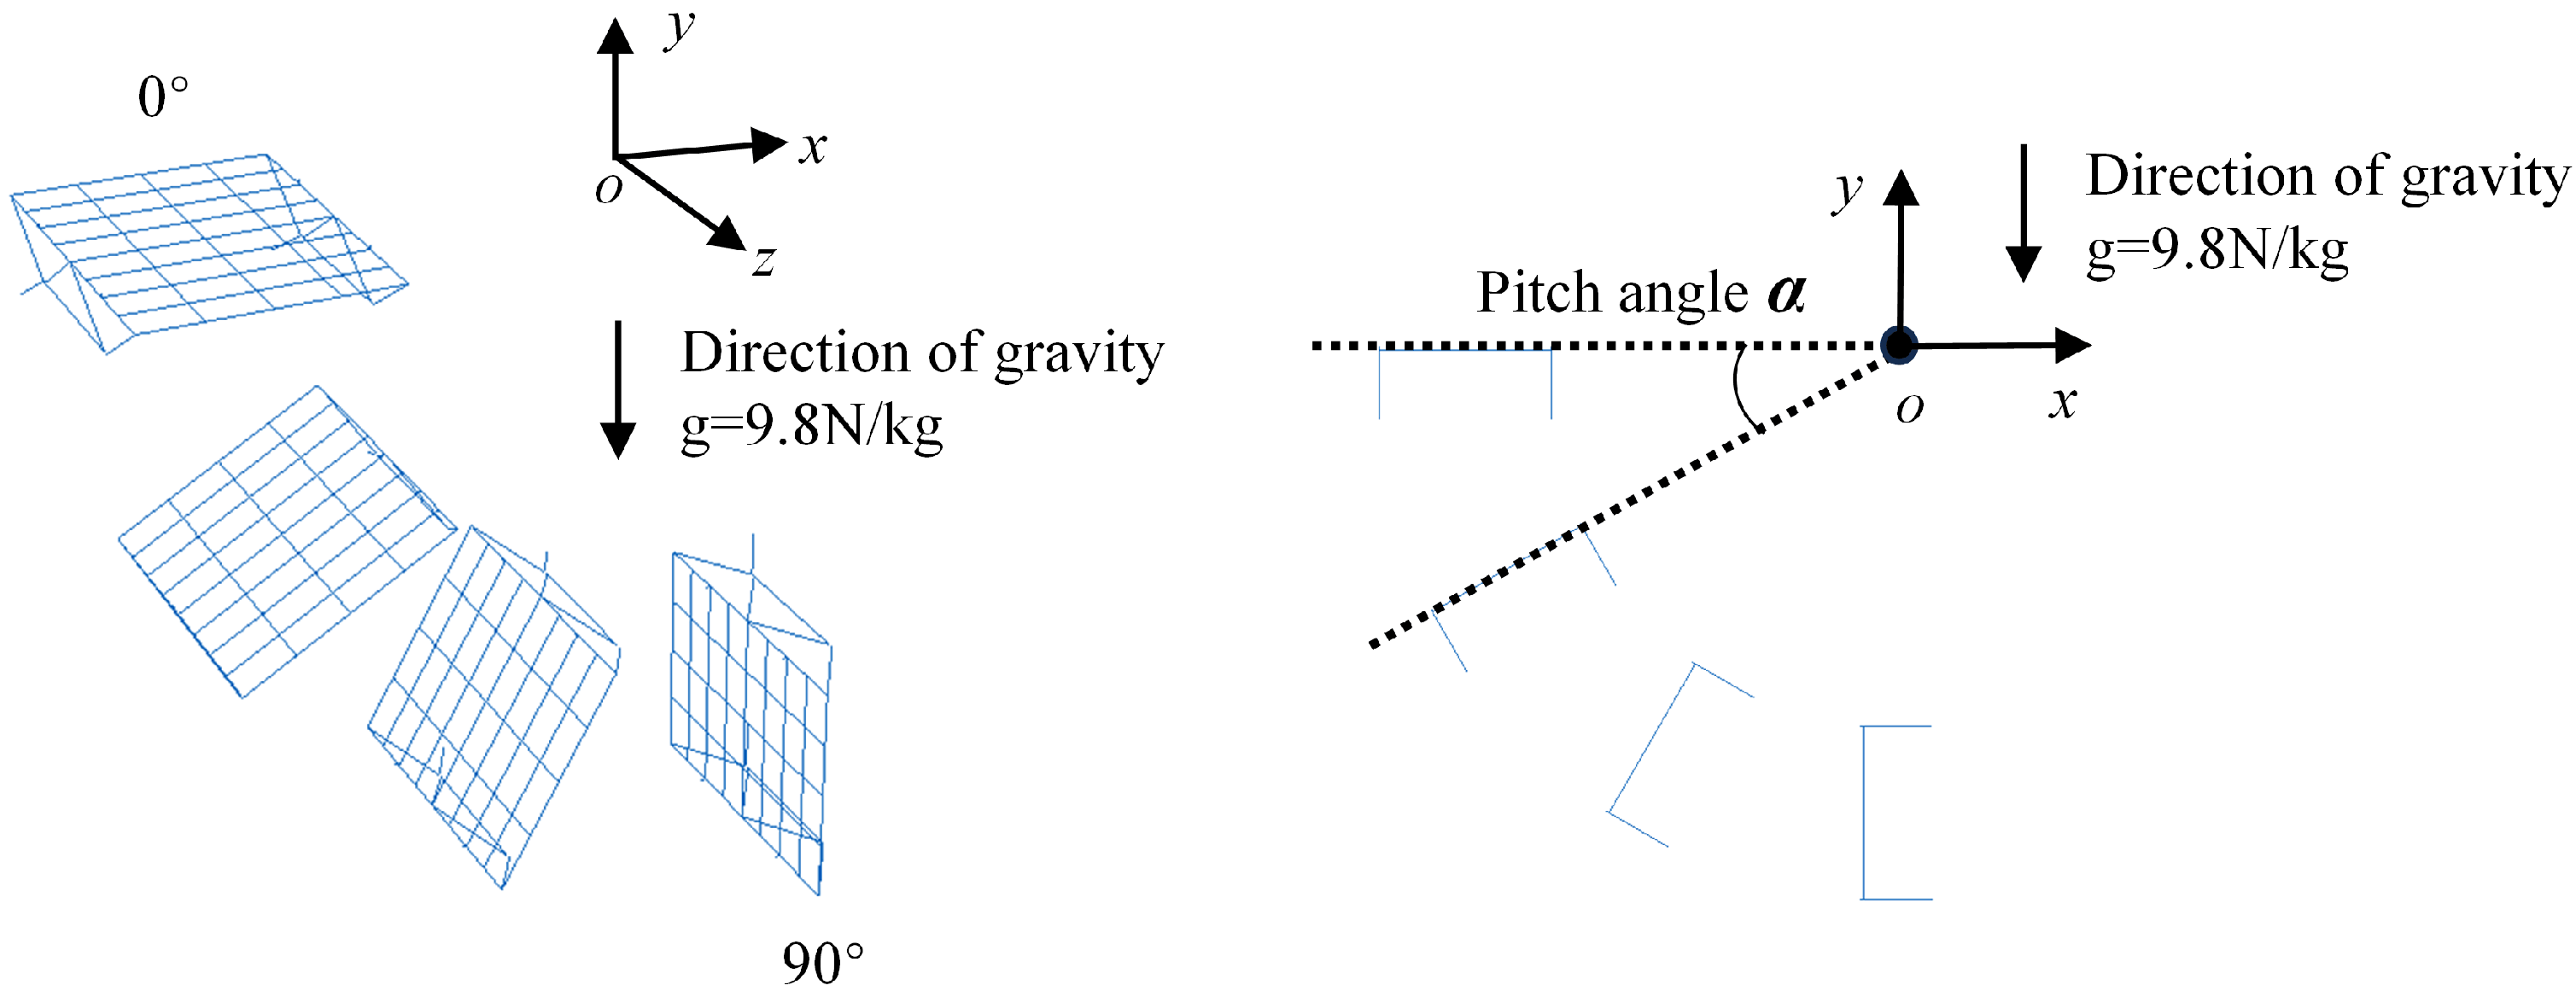
During in-orbit operations, a large deployable antenna continuously adjusts its attitude (i.e., azimuth and elevation). When evaluated in a terrestrial gravity environment, changes in the elevation angle, α (defined as the angle between the reflector surface and the horizontal plane), directly alter the structural effect of the antenna’s self-weight. The resulting deformation impacts the surface precision, which consequently degrades the antenna’s operational performance. Therefore, identifying the most unfavorable orientation is critical for guiding ground-based testing and performance assessment. As illustrated in Figure 4, the structural stress and deformation responses were analyzed as α was varied from 0° to 90° in 5° increments.
Through a series of parametric calculations, the maximum structural displacement as a function of the elevation angle α was determined, as plotted in Figure 5a. The analysis reveals that as α increases from 0° to 90°, the absolute maximum values of the total displacement, the displacement perpendicular to the support truss plane, and the displacement normal to the reflector surface all exhibit a trend of initially increasing and then decreasing, reaching their minimum at α = 90°. (Displacements along the Z-axis were found to be negligible and are, therefore, excluded from this analysis). From a structural mechanics standpoint, this trend indicates that the horizontal orientation (α = 0°) induces the maximum bending deformation, as gravity acts entirely as a transverse load on the cantilever-like structure. Consequently, this orientation is preliminarily identified as the most unfavorable attitude, whereas the vertical orientation (α = 90°) is the most optimal.
Under this most unfavorable horizontal orientation (α = 0°), the absolute maximum displacement normal to the reflector surface reaches a peak of 2.04 mm. Simultaneously, the maximum displacement perpendicular to the support truss plane also peaks at 0.59 mm. The corresponding von Mises stress distribution is depicted in Figure 5b, where the deformation is scaled by a factor of 700 for better visualization. The analysis shows that the maximum structural stress is merely 0.88 MPa, a value significantly below the material’s yield strength. Stress is predominantly concentrated in the deployable support truss, which underscores its primary load-bearing function. The dominant deformation mode is characterized by a gravity-induced sag in the central region of the reflector surface. The displacement profile is symmetrical, with the maximum deflection occurring at the center.
In the optimal vertical orientation (α = 90°), the structure experiences minimal deformation. As illustrated in Figure 5c, the deformation is predominantly characterized by displacement perpendicular to the support truss plane. Since the reflector surface possesses a higher lateral stiffness than the support truss, the truss exhibits significantly more displacement than the reflector. In contrast, there is almost no displacement normal to the reflector surface, which explains why the surface precision is minimally affected in this orientation. In this case, the maximum structural stress is 3.34 MPa—higher than that at α = 0°—which is identified as a localized stress concentration at the connection points between the truss and the buoy.
It is noteworthy that the 90° orientation exhibits lower displacement but higher stress compared to the 0° orientation. This phenomenon is attributed to the different primary load-bearing modes. At α = 0° (horizontal), the antenna structure acts like a cantilever beam under a transverse gravitational load, leading to significant bending deformation and thus maximum displacement. Conversely, at α = 90° (vertical), the structure primarily bears axial compression, resulting in minimal overall deformation. However, in this vertical orientation, the load is directly transferred to the connection points with the buoy, causing localized stress concentrations at these constrained points, which explains the higher maximum stress value.
Based on the preceding analysis, the α = 0° orientation, which exhibits the most significant structural deformation, was selected for all subsequent analyses to ensure a conservative assessment of the surface precision. In this state, the displacement along the Y-axis (normal to the reflector surface) is predominant over the other two axes. Therefore, only the Y-axis displacement values were used for the surface precision calculation. The resulting Root Mean Square (RMS) error was calculated to be 1.072 mm.

3.2. Impact of Offshore Wind Loading on the Structure

To assess the stability of the antenna during offshore operations, this section analyzes the structural response under various wind loading conditions. The direction of the applied wind load is highly dependent on the antenna’s attitude, which is a function of both the elevation angle (α) and the azimuth angle (β). As illustrated in Figure 6, the azimuth angle, β, is defined as the angle between the incident wind direction and the deployable support truss.
Considering the structural symmetry, azimuth angles of opposite sign (e.g., β = 30° and β = −30°) produce identical magnitudes of the normal wind load component on the reflector surface. Furthermore, the influence of the wind load components parallel to the reflector surface, and the resulting in-plane displacements, on the overall surface precision is considered negligible. Based on these considerations, the analysis can be simplified by examining only half of the full operational range. Therefore, the scope of this study is confined to an azimuth angle β ranging from 0° to 180°.
Given that the antenna reflector presents a large wind-facing area, the structure is subjected to maximum wind pressure when the wind direction is normal to its surface (β = 0°). This condition induces the most significant deformation and stress; therefore, it was selected as the worst-case wind direction for this study. Building on this, the influence of different elevation angles (α) was investigated to identify the overall most unfavorable attitude.
A level 12 wind was chosen as the extreme load case for the analysis. In accordance with the Load code for the design of building structures (GB 50009-2012 [33]), this corresponds to a wind pressure of 689.69 N/m2. As illustrated in Figure 6b, in the finite element model, this distributed wind pressure was applied to the truss structure by converting it into equivalent nodal forces based on the tributary area of each member. The structural responses were subsequently calculated for three representative elevation angles: α = 30°, 60°, and 90°, all under the β = 0° condition. The results are summarized in Table 2, with the corresponding stress distribution contours depicted in Figure 7.
As the elevation angle α is increased from 30° to 90°, both the maximum structural displacement (Umax) and the surface precision RMS exhibit a corresponding increase. At α = 90°, the maximum displacement peaks at 10.10 mm and the RMS error reaches 2.54 mm; this value remains within the required design specifications. The deformation mode is characterized by the bending of the reflector surface, with maximum deflection at the mid-span, accompanied by a symmetrical tilting of the support trusses. The maximum structural stress, which also occurs at α = 90°, is 26.67 MPa. This stress level is significantly below the allowable strength of the carbon fiber composite material, confirming that the structure satisfies the strength requirements and will not fail under a level 12 wind.
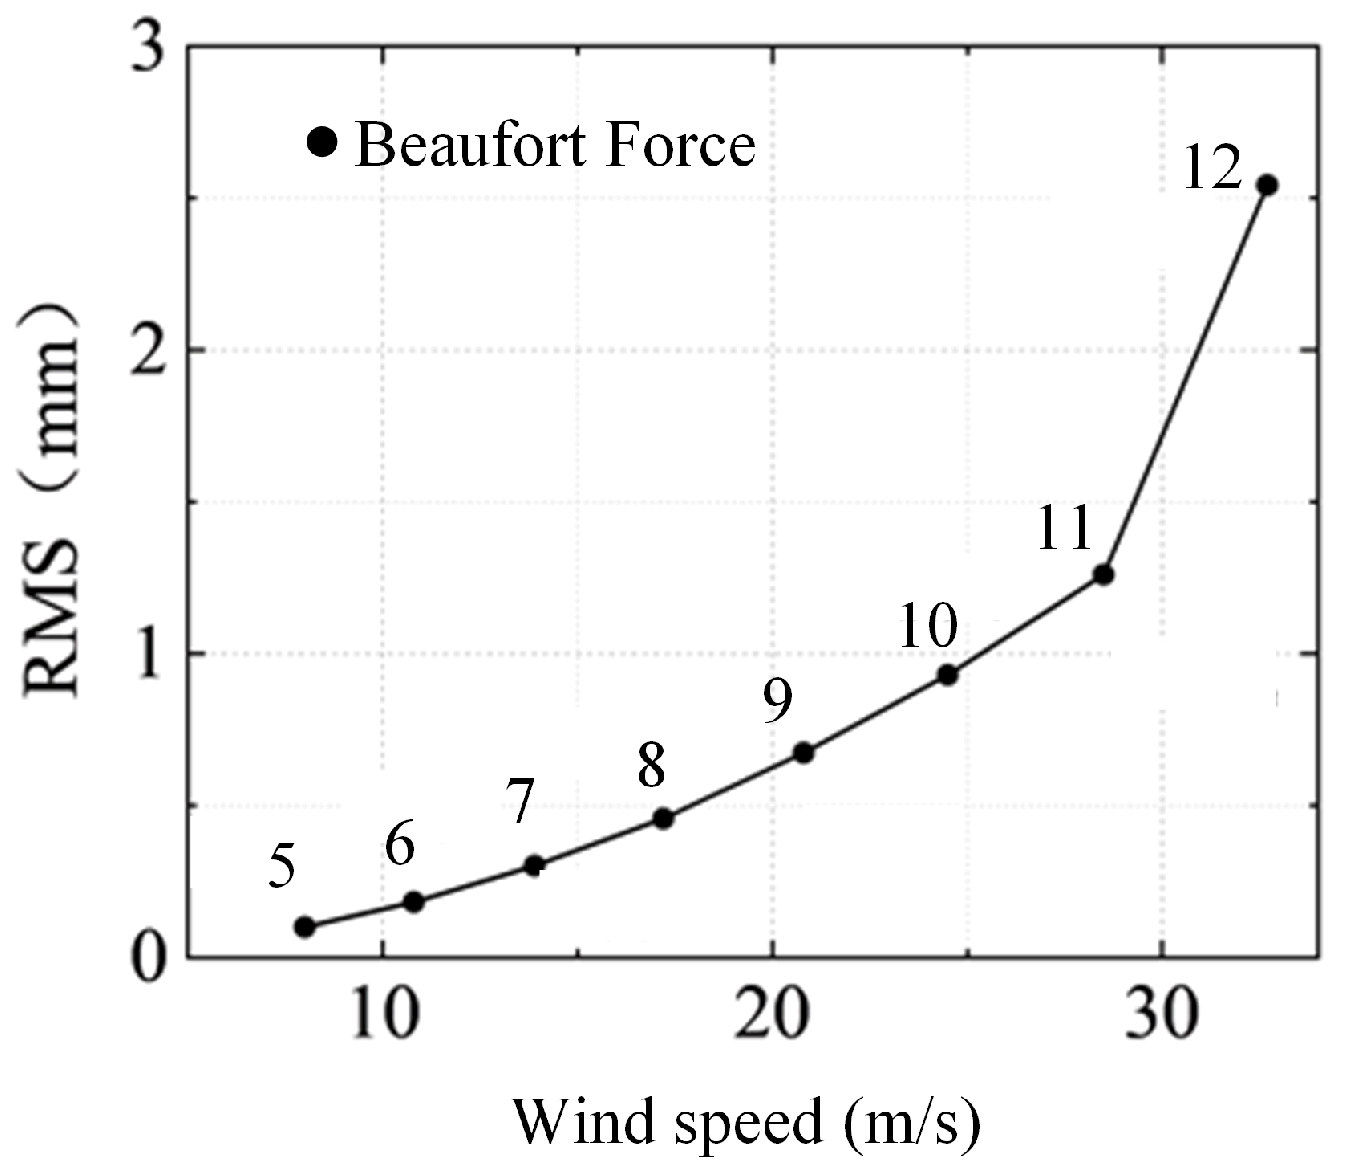
To investigate the relationship between surface precision and wind speed, a series of analyses was conducted using the previously identified worst-case orientation (α = 90°, β = 0°). The structure was subjected to wind loads corresponding to wind levels 5 through 12. The wind speeds for each level were determined in accordance with the Wind Scale standard (GB/T 28591-2012 [34]), ranging from 8 m/s (Level 5) to 32.7 m/s (Level 12). The resulting surface precision RMS as a function of wind speed is plotted in Figure 8. The plot reveals a non-linear increase in the RMS error with increasing wind speed. Within the range of Level 5 to Level 11 winds, the RMS value grows at a relatively slow rate. However, as the wind intensifies from Level 11 to Level 12, a sharp rise in the RMS value is observed, indicating a higher sensitivity of the structural response to extreme wind speeds.

3.3. Combined Impact of Wind Loading and Gravity

This section presents a comprehensive analysis of the structural response under the combined effects of gravity and wind loading. To this end, three representative scenarios were analyzed: cases with the antenna elevation angle, α, set to 30°, 60°, and 90°. The resulting von Mises stress distributions for each elevation angle, under the combined action of a Level 12 wind and gravity, are depicted in Figure 9.
For a more precise quantification of the combined effects on the antenna’s performance, key indicators—namely, surface precision (RMS), maximum displacement (Umax), and maximum stress (σmax)—were extracted for each case. These results are summarized in Table 3.
The results in Table 3 indicate that under the combined influence of a Level 12 wind and gravity, distinct trends emerge as the elevation angle increases from 30° to 90°. Specifically, both the surface precision (RMS) and the maximum displacement (Umax) monotonically increase, whereas the maximum stress (σmax) monotonically decreases. From a stiffness and surface precision standpoint, the α = 90° orientation represents the worst-case scenario, yielding the highest RMS error of 2.44 mm. Although this is the most severe deformation among the cases studied, the value remains well within the specified engineering requirement of 5 mm. From a strength perspective, the α = 30° orientation is the most critical, as it produces the peak stress of 71.52 MPa. This stress level, however, is safely below the material’s allowable strength, confirming that the structural integrity is maintained.

4. Dynamic Response to Buoy Motion

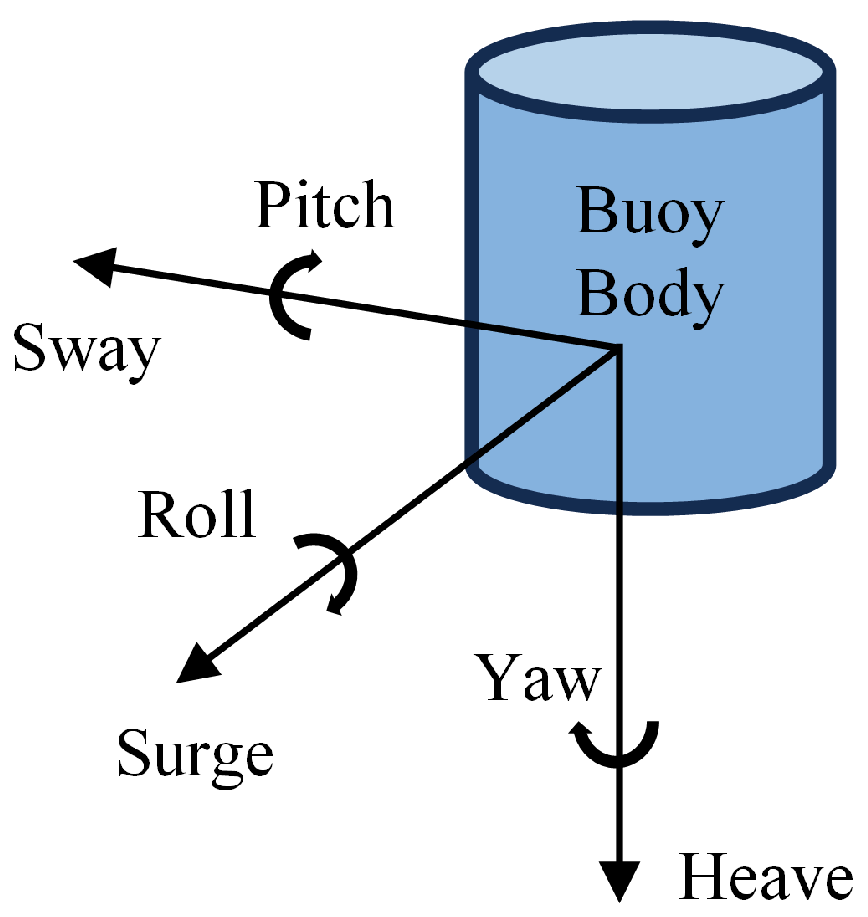
During its operational deployment in a marine environment, the antenna-buoy system is subjected to motions induced by environmental loads, such as wind and waves. This buoy motion acts as a base excitation that is directly transmitted to the antenna structure, significantly affecting its surface precision. Therefore, to accurately simulate the antenna’s operational state, this section utilizes the buoy’s motion as a dynamic boundary condition to perform an in-depth analysis of the antenna’s structural dynamics. Theoretically, a floating body exhibits six DOFs in water: three translational (surge, sway, and heave) and three rotational (roll, pitch, and yaw), as illustrated in Figure 10. Among these components, heave and roll typically exert the most significant influence on the structure, making them critical factors in the design process. Given the asymmetrical nature of the antenna superstructure, this section specifically investigates the dynamic response of the antenna to these two dominant motion types: heave and roll.
To accurately simulate the dynamic behavior, structural damping, which represents the energy dissipation during vibration, was incorporated into the model. In this study, the widely used Rayleigh damping model was adopted. Based on the material properties of the aluminum alloy and the typical characteristics of such truss structures, a damping ratio of 2% was assumed to calculate the mass and stiffness proportional damping coefficients.

4.1. Response to Heave Motion

Previous studies on the wave-following characteristics of buoys have shown that in a marine environment, the heave amplitude is proportional to the wave height. The dynamic response is highly dependent on the relationship between the wave frequency and the buoy’s natural frequency. When the wave frequency approaches the natural frequency, the resulting heave amplitude is less than the wave amplitude; conversely, when the wave frequency is significantly lower than the natural frequency, the heave amplitude closely matches the wave amplitude. In the current design configuration, the height from the antenna reflector to the buoy’s center of mass is approximately 4 m. Therefore, this study utilizes experimental data from the buoy’s dynamic response in waves as the input for the analysis.
In accordance with relevant maritime safety [35] and offshore unit classification rules [36], the heave motion was defined with a frequency of 1.26 rad/s and an amplitude of 700 mm for the simulation This input idealizes the experimentally obtained displacement–time data into a pure sinusoidal function, which serves as the dynamic boundary condition transmitted to the antenna structure via the buoy. Consequently, the heave motion induces a reciprocating vertical movement of the entire antenna structure along the y-axis, tracking the buoy’s motion between wave crests and troughs, as depicted in Figure 11.
The total duration of the dynamic analysis was set to 40 s. The displacement–time history used as input is plotted in Figure 11. To precisely assess the impact of heave on surface precision, the nodal coordinates were extracted at each time step to compute the instantaneous RMS value. Because the base of the structure undergoes a pure vertical displacement, the position of the ideal reference plane at any given moment can be precisely determined analytically, as given by Equation (2).
y = 700 sin ( 1.26 t )
where y is the y-coordinate of the ideal plane; t is the time.
For this analysis, nine critical points along the mid-span axis of symmetry of the reflector were selected for detailed examination, as shown in Figure 12a. This location was chosen because the mid-span typically exhibits the maximum structural deflection, and thus the displacement of these points provides a preliminary indication of the overall reflector deformation. The resulting displacement–time histories for these nine points along the y-axis are plotted in Figure 12b. The curves for all nine points are nearly indistinguishable, indicating that they follow a highly similar motion pattern. During the initial transient phase (up to approximately 5 s), the displacement peaks and troughs slightly exceed the ±700 mm range, implying that the structural motion amplitude is momentarily larger than that of the base excitation. After 5 s, the motion stabilizes into a steady state, with the peaks and troughs aligning closely with the ±700 mm boundaries. This shows that the antenna’s oscillation amplitude ultimately converges to the heave amplitude of the buoy.
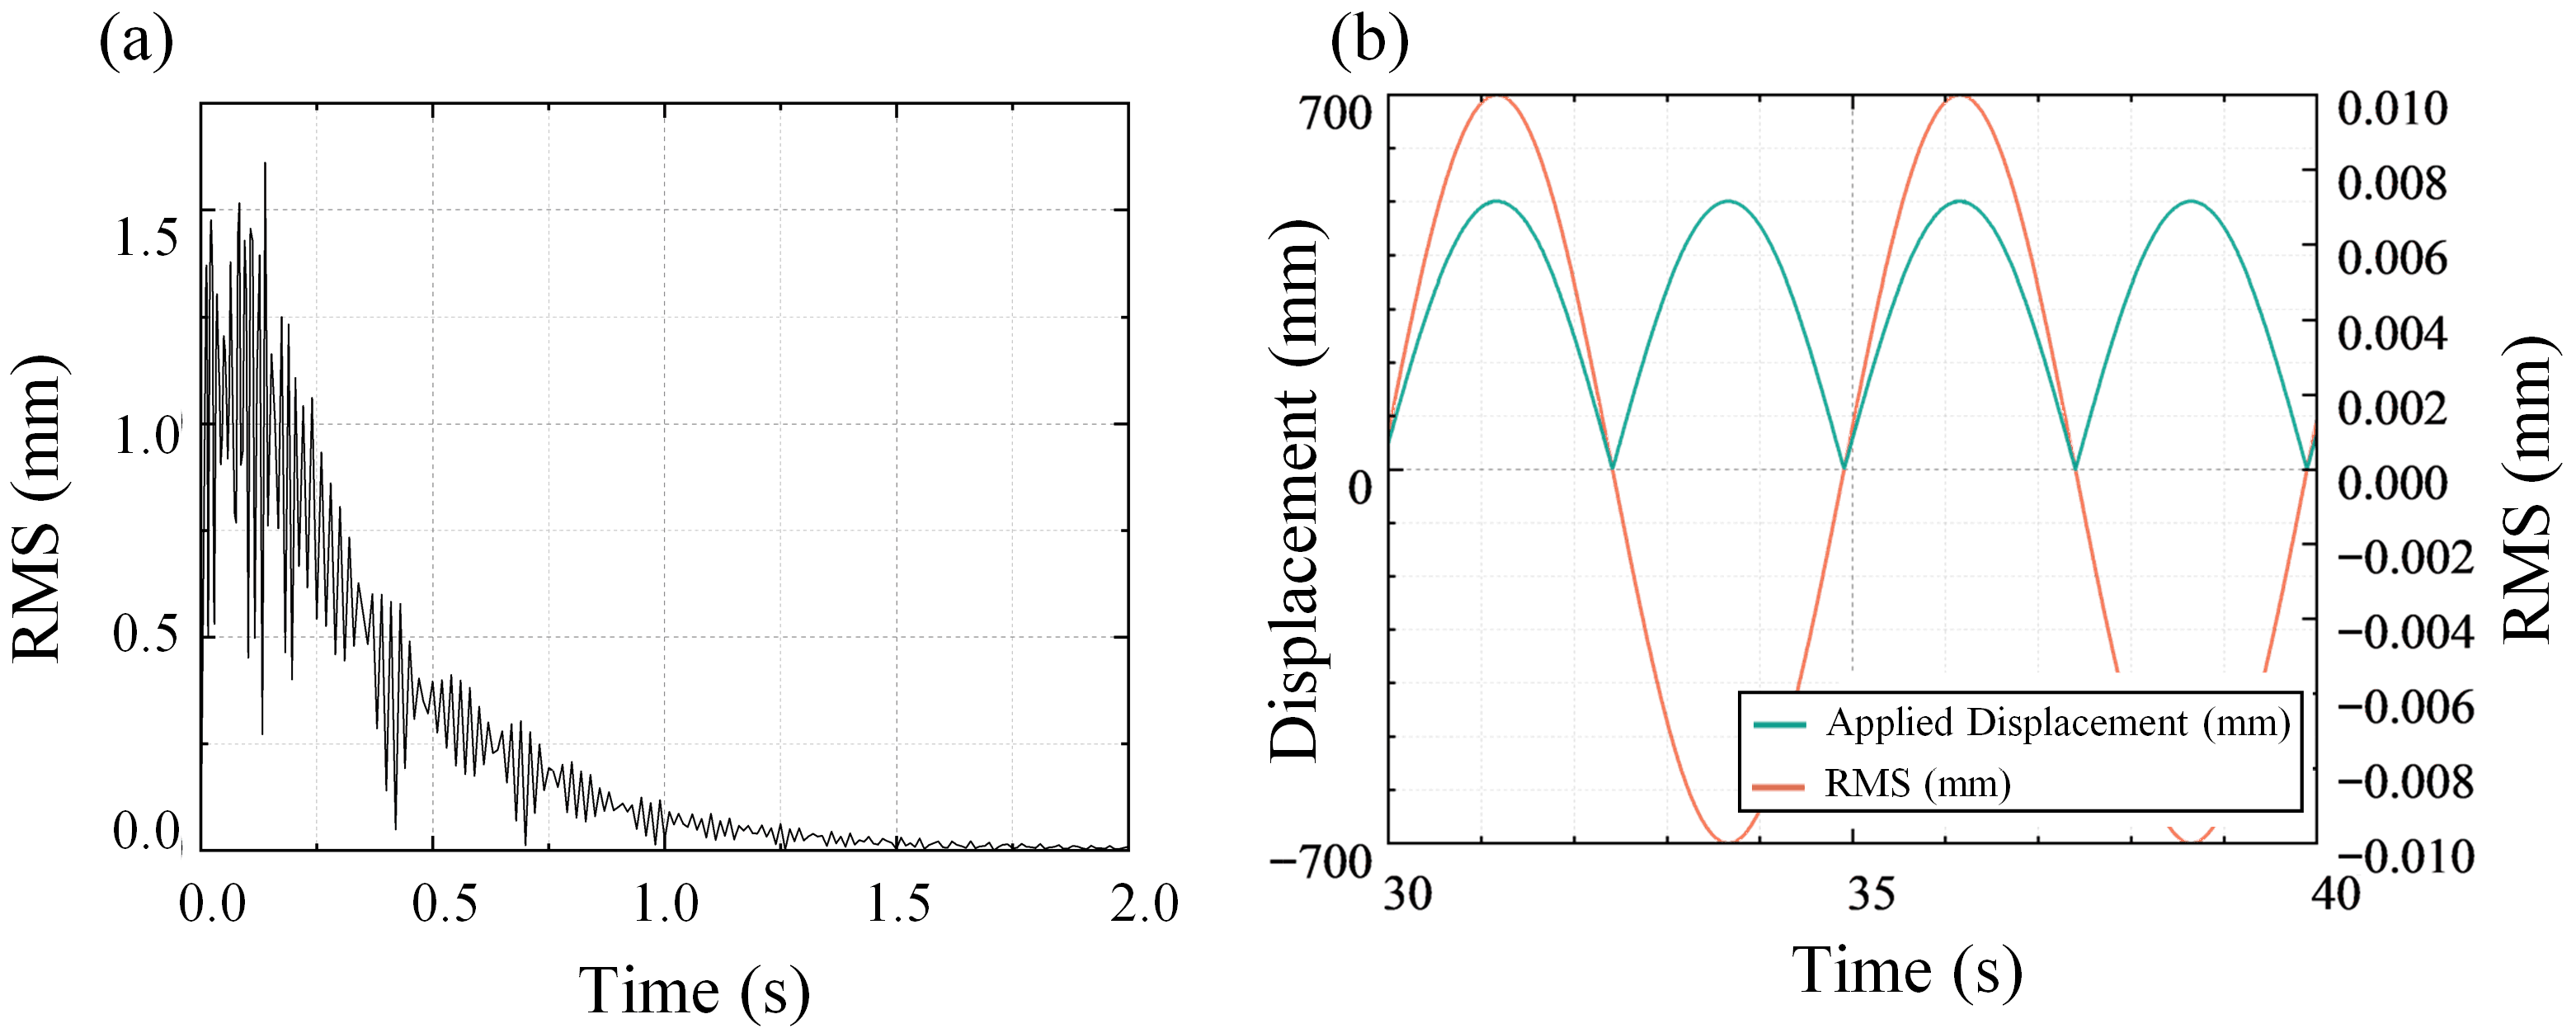
The time history of the RMS error was determined by calculating the distance of the nodes from the ideal reference plane at each time step. The analysis reveals a peak RMS value of 1.61 mm, which occurs at t = 0.14 s, shortly after the motion begins. Figure 13a plots the RMS time history for the first 2 s of the simulation. It is evident that during this initial phase, the RMS value fluctuates, and the equilibrium position of these fluctuations trends downward.
According to the principles of structural dynamics, the total response of a structure to harmonic excitation can be decomposed into two components: a transient response and a steady-state response. The transient component, which is governed by the structure’s natural frequency, damping, and initial conditions, decays over time. When the sinusoidal displacement is first applied, the structure transitions from a static state to a vibrating one, generating significant acceleration. This causes severe jitter in the reflector surface, resulting in a high RMS value. As shown in Figure 13a, although the vertical displacement reaches a steady state after approximately 1.5 s, the RMS value remains elevated, indicating that the RMS response enters its steady-state phase later than the displacement response.
Figure 13b displays the RMS time history from t = 30 s to 40 s, by which time the structural vibration has fully entered the steady-state phase. The plot shows that the period of the steady-state RMS response is half that of the input displacement period. This is because the RMS error, being a root-mean-square value, is always non-negative. This analysis suggests that increasing the structure’s damping (damping ratio ζ) and natural frequency (ωn) can accelerate the decay of the transient response, thereby shortening the duration of high RMS values and improving surface precision. This implies that the optimal design of the antenna should consider not only its static stiffness but also its dynamic characteristics (e.g., damping ratio) to enhance its ability to stabilize rapidly in a wave environment.
At t = 0.14 s, when the RMS error peaks, the maximum structural stress is 17.73 MPa. This occurs in the middle section of two lower chord members and is well below the strength limit of the carbon fiber composite material. This indicates that under the specified heave motion, the antenna structure exhibits excellent operational performance, ensuring both structural integrity and high surface precision.
To further investigate the effect of heave amplitude on structural performance, a dynamic response analysis was performed for amplitudes ranging from 700 mm to 3500 mm. The relationship between the heave amplitude and the maximum RMS value is plotted in Figure 14. All the peak RMS values shown in the plot occur during the initial transient response phase. A clear linear relationship is observed between the heave amplitude and the maximum RMS, which can be described by the predictive expression: RMS_max = 0.00225A + 0.0003. Based on this expression, it can be inferred that when the heave amplitude (A) reaches 2222.77 mm, the maximum RMS value will reach the 5 mm limit. This implies that for any heave amplitude less than 2222.77 mm, the structure’s surface precision is guaranteed to meet the design requirement.

4.2. Effect of Roll Motion

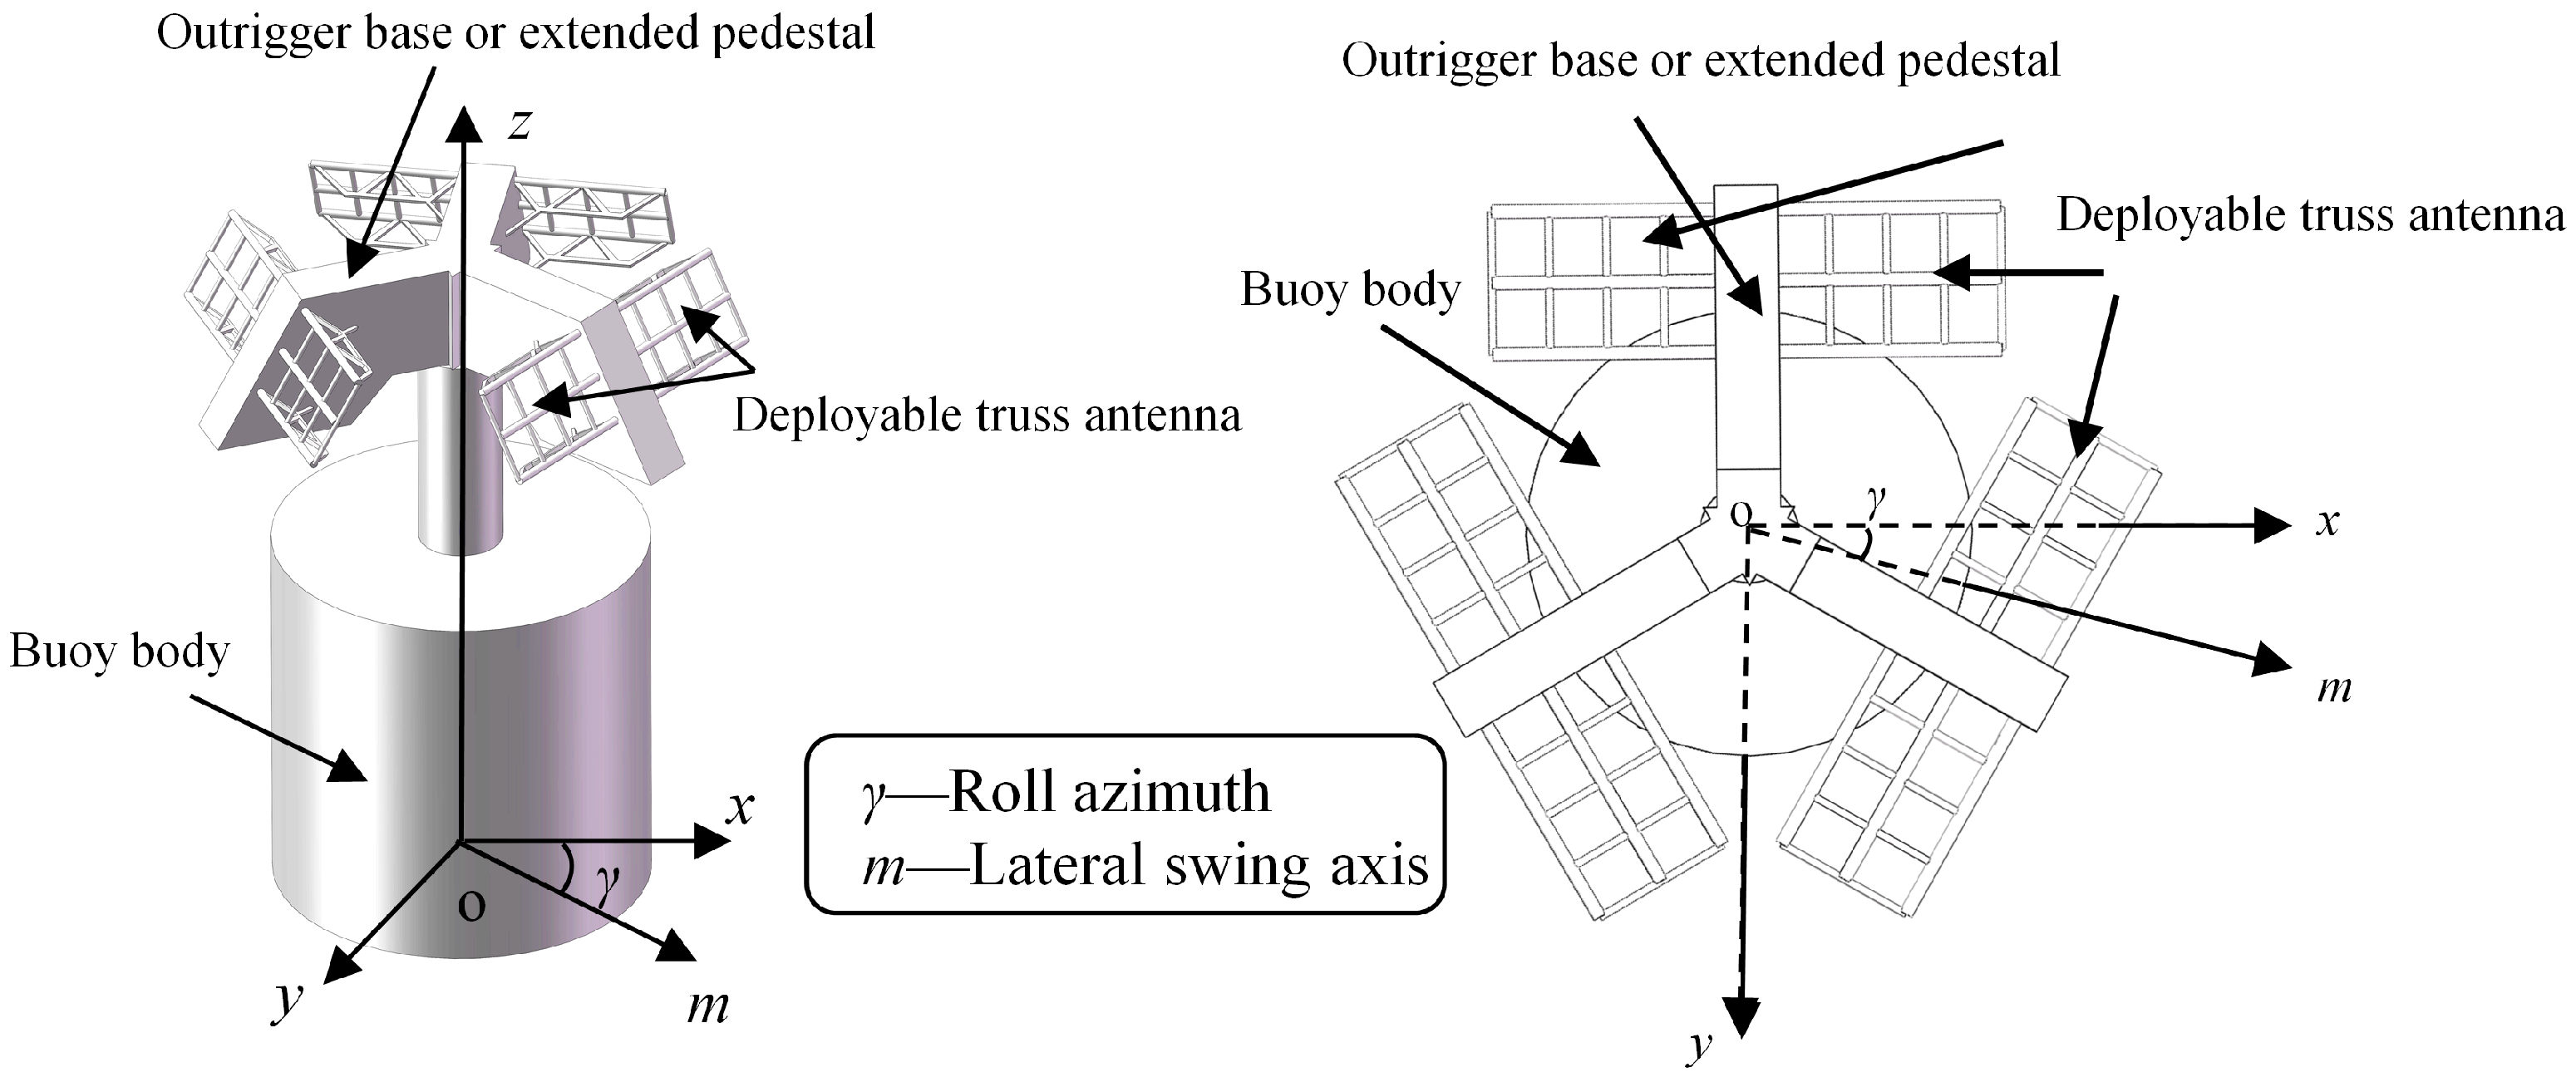
This section investigates the impact of the buoy’s roll motion on the antenna’s surface precision, focusing on two key parameters: the roll azimuth angle and the roll amplitude. A schematic of the roll motion is provided in Figure 15, showing six antenna units connected to the buoy via an outrigger base. The roll motion is defined as the reciprocating rotation of the buoy about an axis m located within the x-y plane. The angle γ between this axis and the x-axis defines the roll azimuth. Due to the rotational symmetry of the antenna array, the position of each antenna relative to the roll axis differs. Therefore, the response of the entire array can be inferred by studying a single antenna unit over a roll azimuth range of 0° to 180°. The objective is to identify the worst-case roll azimuth and determine the maximum allowable roll amplitude that still meets the surface precision requirements.
To accurately apply the angular displacement excitation at the base, a simplified modeling approach was adopted: a rigid plate was added at the antenna’s base, and its rotation was controlled to simulate the motion of the entire buoy. The analysis began with a baseline case using a roll azimuth γ = 90° and an amplitude of 0.44 rad. A rotational displacement was applied at point o about the x-axis (UR1 = 0.44, UR2 = 0), with the roll angle time history shown in Figure 16a. An analysis of the first cycle (t = 0–5 s), as shown in Figure 16b, reveals that the antenna primarily undergoes a reciprocating rocking motion with the rigid plate. Throughout this process, no significant macroscopic deformation is observed, and the internal von Mises stress remains below 7 MPa. However, within the first 0.1 s, a large transient internal force is generated. This is attributed to the abrupt change in velocity as the structure is accelerated from rest, resulting in a large initial acceleration.
Next, the time-dependent surface precision (RMS) for this case was examined. As shown in Figure 17a, the RMS value is high during the first 1.5 s, reaching a peak of 2.29 mm and indicating poor surface precision. This period corresponds to the structure’s transient response. After 1.5 s, the transient response largely dissipates, and the structure enters a steady-state phase, as seen in Figure 17b. In this phase, the RMS value drops dramatically, stabilizing into a sinusoidal fluctuation with a peak of only 0.011 mm—approximately 0.48% of the transient peak. This demonstrates that, similar to heave motion, the impact of roll motion on surface precision is dominated by a short-lived transient phase where the maximum RMS error occurs.
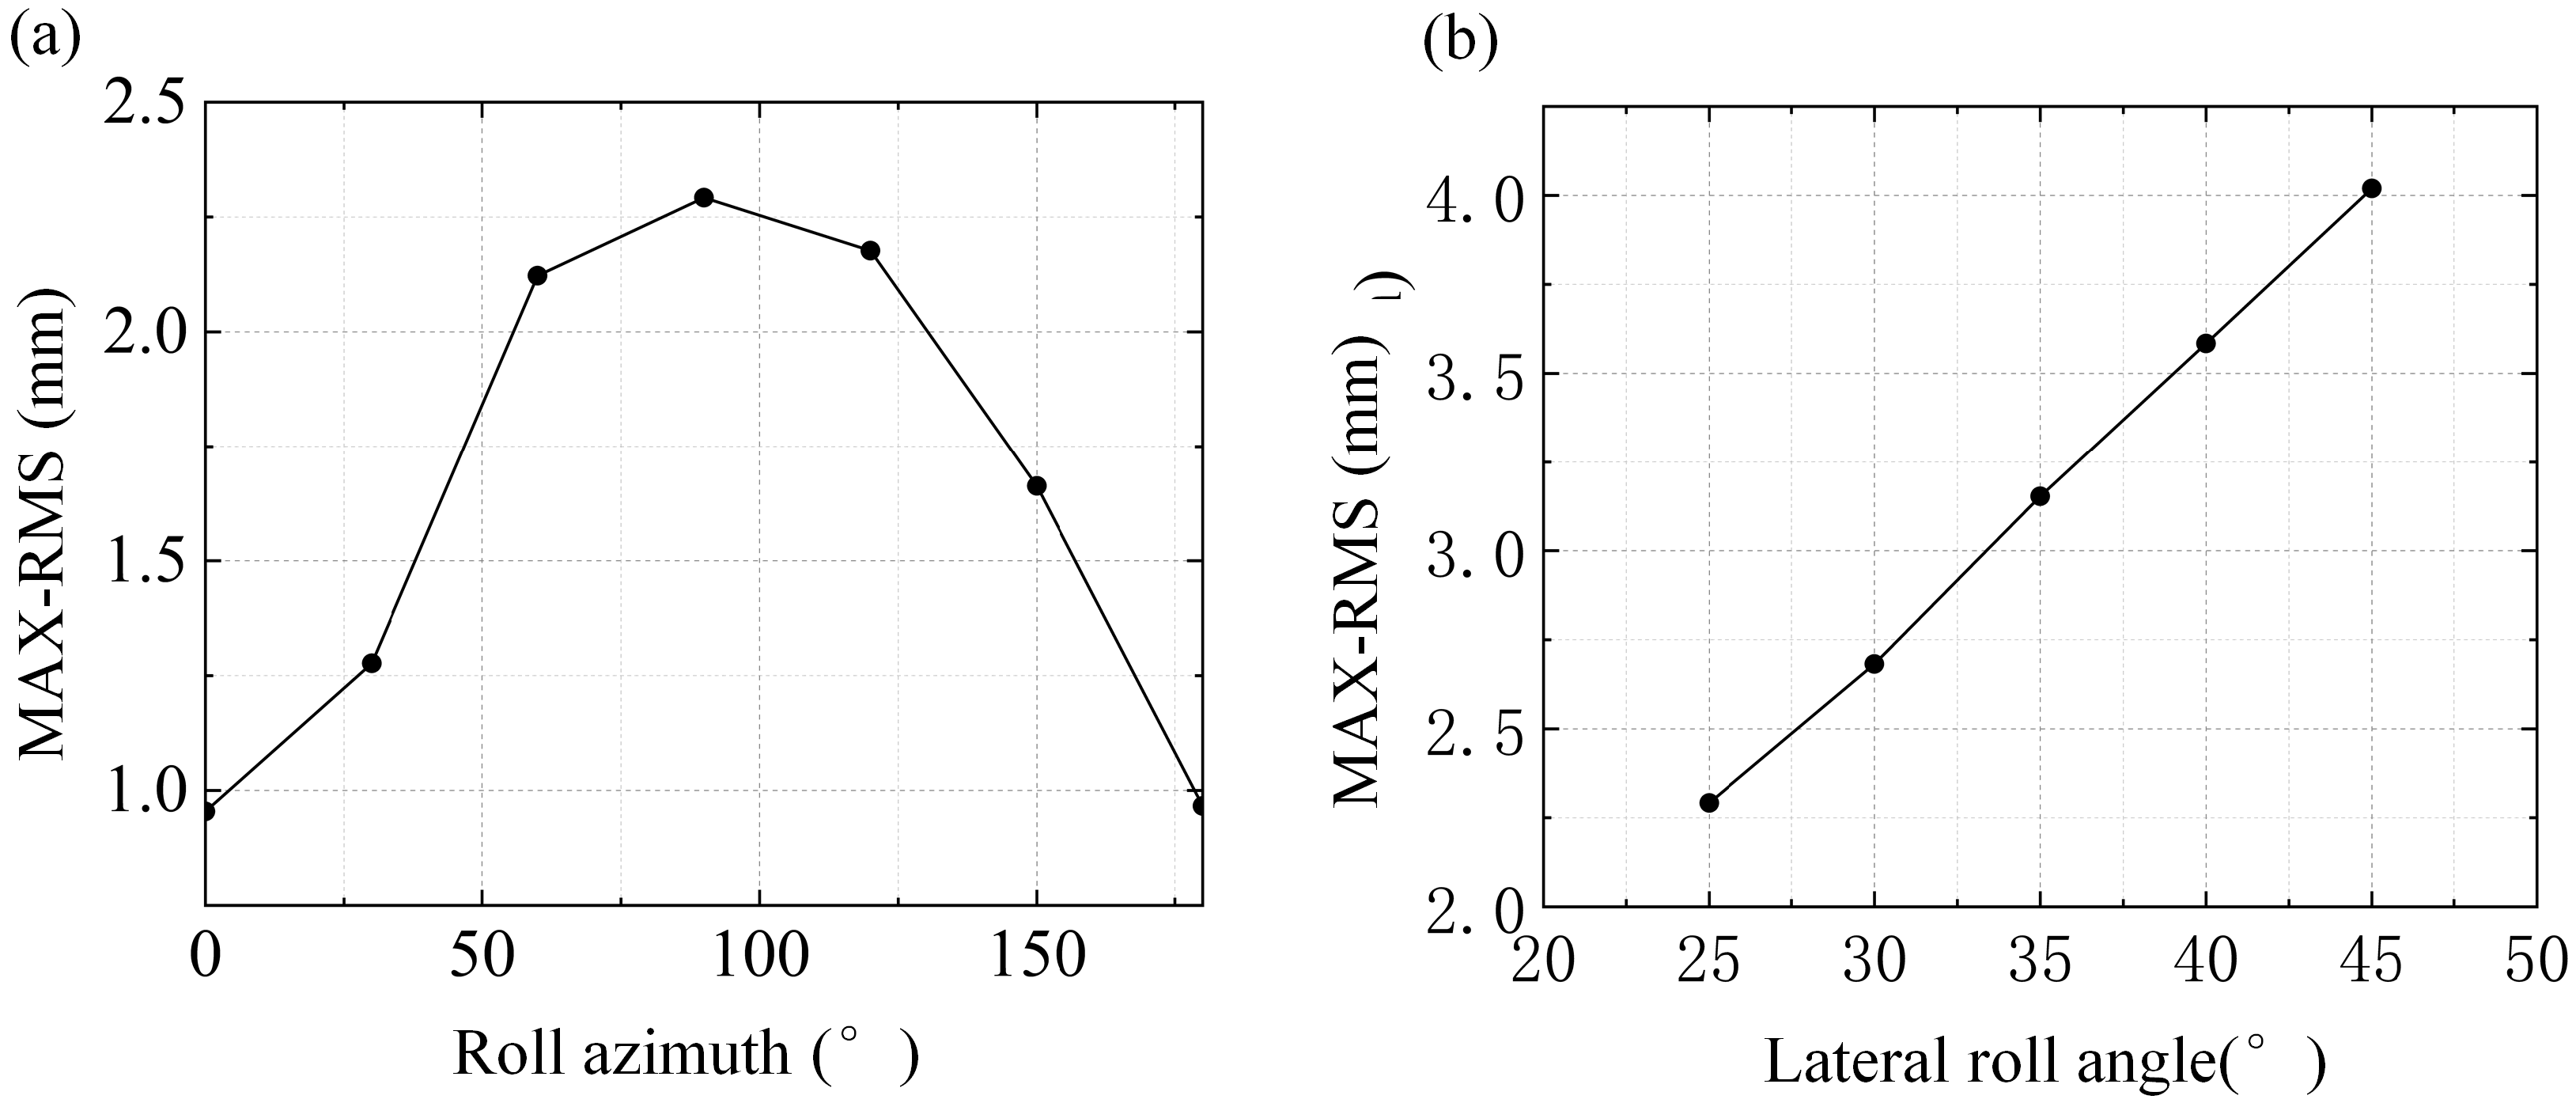
A parametric study was conducted on both the roll azimuth (γ) and the roll amplitude. First, a series of models was created, varying the roll azimuth from 0° to 180° in 30° increments. The maximum RMS value (the peak value over the entire simulation) was calculated for each case. The resulting relationship between the maximum RMS and the roll azimuth is plotted in Figure 18a. The plot shows that the maximum RMS increases monotonically as the angle increases from 0° to 90°, reaching its peak of 2.29 mm at γ = 90°. As the angle increases further, the maximum RMS gradually decreases.
With the worst-case roll azimuth identified (γ = 90°), the influence of the roll amplitude was then investigated. Models were created with roll amplitudes of 25°, 30°, 35°, 40°, and 45°. The results are presented as an amplitude-RMS curve in Figure 18b. A clear linear relationship is observed between the maximum RMS and the roll amplitude. As the amplitude increases from 25° to 45°, the maximum RMS increases from 2.29 mm to 4.02 mm—a 75.5% increase—confirming that roll amplitude is a critical factor influencing surface precision. Importantly, even under a large 45° roll, the maximum RMS error remains below the 5 mm design specification.

5. Conclusions

This study employed the finite element method to systematically investigate the dynamic response and mechanical performance of a truss-type deployable antenna under typical maritime conditions. The objective was to quantify its structural behavior under complex loading, with a particular focus on the evolution of its surface precision. The primary conclusions are as follows:
(1) Static analysis revealed that the gravity-induced deformation is closely correlated with the antenna’s orientation. As the elevation angle was varied from 0° (horizontal) to 90° (vertical), the maximum displacement and the RMS error exhibited a non-linear trend of first decreasing and then increasing. The horizontal orientation (0° elevation) was identified as the most unfavorable static condition, resulting in a maximum RMS error of 1.072 mm.
(2) The dynamic response analysis demonstrated that for both heave and roll motions, the structural response comprises a brief transient phase followed by a steady-state phase. Crucially, the peak surface precision error (maximum RMS) was found to occur during the initial transient response, establishing this phase as the critical period for determining the structure’s performance limits.
(3) For heave motion, the maximum transient RMS reached 1.61 mm (for a 700 mm amplitude) and exhibited a strong positive linear correlation with the heave amplitude. For roll motion, the structure showed a high sensitivity to motion parameters: a roll azimuth of 90° was identified as the worst-case scenario. Under this condition, the maximum RMS value also increased linearly with the roll amplitude, reaching 4.02 mm at a roll angle of 45°, a 75.5% increase compared to the RMS value at 25°.
(4) The study revealed that for both heave and roll excitations, the transient dynamic effect is the dominant factor influencing the antenna’s surface precision. The peak RMS error generated during the initial phase far exceeds that of the subsequent steady-state phase, making this transient peak the critical determinant of whether the antenna meets its performance specifications. This finding highlights that a performance assessment based solely on steady-state analysis would be insufficient.
This study also highlights several avenues for future research. The current analysis was based on deterministic sinusoidal inputs to establish fundamental response characteristics. Future work should incorporate random environmental loads, such as wind and wave spectra, to simulate operational conditions more realistically. Furthermore, a crucial next step is to establish a direct correlation between the quantified structural deformation (RMS error) and the antenna’s electrical performance degradation (e.g., gain loss, beam pointing error) through integrated electro-mechanical analysis. This will provide a more comprehensive assessment of the antenna’s operational viability in the marine environment.
In summary, this research not only quantifies the mechanical performance of the truss-type deployable antenna in specific maritime environments but, more importantly, reveals the underlying principles and dependencies of its surface precision on dynamic load parameters. These findings emphasize the dominant role of transient dynamic effects and provide a theoretical basis and data support for the performance evaluation and optimal design of such antennas for marine applications.

Author Contributions

Conceptualization, Y.G.; Methodology, Y.G. and Z.L.; Software, Q.Z. and Z.L.; Validation, Q.Z.; Formal analysis, Q.Z.; Investigation, Y.G.; Writing—original draft, Y.G.; Writing—review & editing, J.F. and J.C.; Supervision, J.C.; Project administration, J.F. All authors have read and agreed to the published version of the manuscript.

Funding

The work presented in this article was supported by the National Natural Science Foundation of China (52478306, 52478145), Jiangsu Provincial Department of Science and Technology Projects (Grant No. BZ2022049 and BE2023801), and the Fundamental Research Funds for the Central Universities (2242024K30020).

Data Availability Statement

Some or all data, models, or codes that support the findings of this study are available from the corresponding author upon reasonable request.

Conflicts of Interest

The authors declare no conflicts of interest.

References

  1. Liu, Z.-Q.; Qiu, H.; Li, X.; Yang, S.-L. Review of Large Spacecraft Deployable Membrane Antenna Structures. Chin. J. Mech. Eng. 2017, 30, 1447–1459. [Google Scholar] [CrossRef]
  2. Ranjbaran, P.; Yousefi, H.; Gharehpetian, G.; Astaraei, F.R. A review on floating photovoltaic (FPV) power generation units. Renew. Sustain. Energy Rev. 2019, 110, 332–347. [Google Scholar] [CrossRef]
  3. Nielsen, F.G.; Hanson, T.D.; Skaare, B. Integrated dynamic analysis of floating offshore wind turbines. In Proceedings of the 25th International Conference on Offshore Mechanics and Arctic Engineering, Hamburg, Germany, 4–9 June 2006; pp. 671–679. [Google Scholar] [CrossRef]
  4. Wang, B.; Gao, X.; Li, Y.; Liu, L.; Li, H. Dynamic response analysis of a semi-submersible floating wind turbine based on different coupling methods. Ocean Eng. 2024, 297, 116948. [Google Scholar] [CrossRef]
  5. Dong, Y.; Chen, Y.; Liu, H.; Zhou, S.; Ni, Y.; Cai, C.; Zhou, T.; Li, Q. Review of Study on the Coupled Dynamic Performance of Floating Offshore Wind Turbines. Energies 2022, 15, 3970. [Google Scholar] [CrossRef]
  6. Tran, T.T.; Kim, D.-H. The coupled dynamic response computation for a semi-submersible platform of floating offshore wind turbine. J. Wind. Eng. Ind. Aerodyn. 2015, 147, 104–119. [Google Scholar] [CrossRef]
  7. Ishihara, T.; Liu, Y. Dynamic Response Analysis of a Semi-Submersible Floating Wind Turbine in Combined Wave and Current Conditions Using Advanced Hydrodynamic Models. Energies 2020, 13, 5820. [Google Scholar] [CrossRef]
  8. Yue, M.; Liu, Q.; Li, C.; Ding, Q.; Cheng, S.; Zhu, H. Effects of heave plate on dynamic response of floating wind turbine Spar platform under the coupling effect of wind and wave. Ocean Eng. 2020, 201, 107103. [Google Scholar] [CrossRef]
  9. Duan, B. Large Spaceborne Deployable Antennas (LSDAs)—A Comprehensive Summary. Chin. J. Electron. 2020, 29, 1–15. [Google Scholar] [CrossRef]
  10. Rahmat-Samii, Y.; Haupt, R. Reflector Antenna Developments: A Perspective on the Past, Present and Future. IEEE Antennas Propag. Mag. 2015, 57, 85–95. [Google Scholar] [CrossRef]
  11. Yadav, A.; Singh, S.K.; Das, S.; Kumar, S.; Kumar, A. Shape memory polymer and composites for space applications: A review. Polym. Compos. 2025, 46, 11647–11683. [Google Scholar] [CrossRef]
  12. Gralewski, M.R.; Adams, L.; Hedgepeth, J.M. Deployable Extendable Support Structure for the RADARSAT Synthetic Aperture Radar Antenna; International Astronautical Federation Congress: Washington, DC, USA, 1992; Available online: https://ui.adsabs.harvard.edu/abs/1992wadc.iafcU....G (accessed on 19 October 2025).
  13. Chiu, S. Moving target parameter estimation for RADARSAT-2 Moving Object Detection EXperiment (MODEX). Int. J. Remote Sens. 2010, 31, 4007–4032. [Google Scholar] [CrossRef]
  14. Barbier, C.; Derauw, D.; Orban, A.; Davidson, M.W.J. Study of a passive companion microsatellite to the SAOCOM-1B satellite of Argentina, for bistatic and interferometric SAR applications. In Proceedings of the Sensors, Systems, and Next-Generation Satellites XVIII, Amsterdam, The Netherlands, 22–25 September 2014; Meynart, R., Neeck, S.P., Shimoda, H., Eds.; SPIE: Philadelphia, PA, USA, 2014; p. 92410K. [Google Scholar] [CrossRef]
  15. Montenbruck, O.; Allende-Alba, G.; Rosello, J.; Tossaint, M.; Zangerl, F. Precise Orbit and Baseline Determination for the SAOCOM-CS Bistatic Radar Mission. Navigation 2018, 65, 15–24. [Google Scholar] [CrossRef]
  16. Salas, W.A.; Ducey, M.J.; Rignot, E.; Skole, D. Assessment of JERS-1 SAR for monitoring secondary vegetation in Amazonia: I. Spatial and temporal variability in backscatter across a chrono-sequence of secondary vegetation stands in Rondonia. Int. J. Remote Sens. 2002, 23, 1357–1379. [Google Scholar] [CrossRef]
  17. Buckreuss, S.; Balzer, W.; Muhlbauer, P.; Werninghaus, R.; Pitz, W. The terraSAR-X satellite project. In Proceedings of the IGARSS 2003, 2003 IEEE International Geoscience and Remote Sensing Symposium, Toulouse, France, 21–25 July 2003; IEEE: Piscataway, NJ, USA, 2003; pp. 3096–3098. [Google Scholar] [CrossRef]
  18. Li, T. Deployment analysis and control of deployable space antenna. Aerosp. Sci. Technol. 2012, 18, 42–47. [Google Scholar] [CrossRef]
  19. Yang, S.; Zhao, Q.; Jiang, D.; Guo, J.; Zhang, J.; Hong, J. A laser target digital photogrammetry system for on-orbit surface error measurement of large spaceborne antennas. Measurement 2026, 257, 118526. [Google Scholar] [CrossRef]
  20. Cozijn, H.; Uittenbogaard, R.; Brake, E.T. Heave, roll and pitch damping of a deepwater CALM buoy with a skirt. In Proceedings of the International Society of Offshore and Polar Engineering Conference, Seoul, Republic of Korea, 19–24 June 2005. [Google Scholar]
  21. Bunnik, T.H.J.; De Boer, G.; Cozijn, J.L.; Van Der Cammen, J.; Van Haaften, E.; Brake, E.T. Coupled Mooring Analysis and Large Scale Model Tests on a Deepwater Calm Buoy in Mild Wave Conditions. In Proceedings of the ASME 2002 21st International Conference on Offshore Mechanics and Arctic Engineering, Oslo, Norway, 23–28 June 2002; pp. 65–76. [Google Scholar] [CrossRef]
  22. Cozijn, J.L.; Bunnik, T.H.J. Coupled Mooring Analysis for a Deep Water CALM Buoy. In Proceedings of the ASME 2004 23rd International Conference on Offshore Mechanics and Arctic Engineering, Vancouver, BC, Canada, 20–25 June 2004; pp. 663–673. [Google Scholar] [CrossRef]
  23. Ryu, S.; Duggal, A.S.; Heyl, C.N.; Liu, Y. Coupled analysis of deepwater oil offloading buoy and experimental verification. In Proceedings of the Fifteenth International Offshore and Polar Engineering Conference, Seoul, Republic of Korea, 19–24 June 2005. [Google Scholar]
  24. Benassai, G.; Campanile, A.; Piscopo, V.; Scamardella, A. Optimization of Mooring Systems for Floating Offshore Wind Turbines. Coast. Eng. J. 2015, 57, 1550021-1–1550021-19. [Google Scholar] [CrossRef]
  25. Xu, S.; Ji, C.-Y.; Soares, C.G. Experimental and numerical investigation a semi-submersible moored by hybrid mooring systems. Ocean Eng. 2018, 163, 641–678. [Google Scholar] [CrossRef]
  26. Li, Y.; Yin, W.; Leng, S.; Meng, Y.; Zhang, Y. Dynamic Analysis of a Spar-Type Floating Offshore Wind Turbine Under Extreme Operation Gust. Sustainability 2025, 17, 5655. [Google Scholar] [CrossRef]
  27. Nallayarasu, S.; Kumar, N.S. Experimental and numerical investigation on hydrodynamic response of buoy form spar under regular waves. Ships Offshore Struct. 2017, 12, 19–31. [Google Scholar] [CrossRef]
  28. Penalba, M.; Ringwood, J.V. A Review of Wave-to-Wire Models for Wave Energy Converters. Energies 2016, 9, 506. [Google Scholar] [CrossRef]
  29. Shim, S. Coupled Dynamic Analysis of Floating Offshore Wind Farms. Available online: https://hdl.handle.net/1969.1/ETD-TAMU-2564 (accessed on 19 October 2025).
  30. Salic, T.; Charpentier, J.F.; Benbouzid, M.; Le Boulluec, M. Control Strategies for Floating Offshore Wind Turbine: Challenges and Trends. Electronics 2019, 8, 1185. [Google Scholar] [CrossRef]
  31. Lu, S.; Qi, X.; Hu, Y.; Li, B.; Zhang, J. Deployment Dynamics of Large Space Antenna and Supporting Arms. IEEE Access 2019, 7, 69922–69935. [Google Scholar] [CrossRef]
  32. Li, M.; Cui, Q.; Wu, M.; Zhou, X.; Shi, F.; Meng, G. Flatness-oriented parameters allocation of multi-panel deployable antenna based on monte-carlo simulation. In Proceedings of the 2019 9th International Conference on Recent Advances in Space Technologies (RAST), Istanbul, Turkey, 11–14 June 2019; pp. 497–502. [Google Scholar] [CrossRef]
  33. GB 50009-2012; Load Code for the Design of Building Structures. China Architecture & Building Press: Beijing, China, 2012.
  34. GB/T 28591-2012; Wind Scale. Standards Press of China: Beijing, China, 2012.
  35. Rules for the Division of Navigation Areas; China Maritime Safety Administration: Beijing, China, 2021.
  36. Rules for Classification of Mobile Offshore Units; China Classification Society (CCS): Beijing, China, 2020.
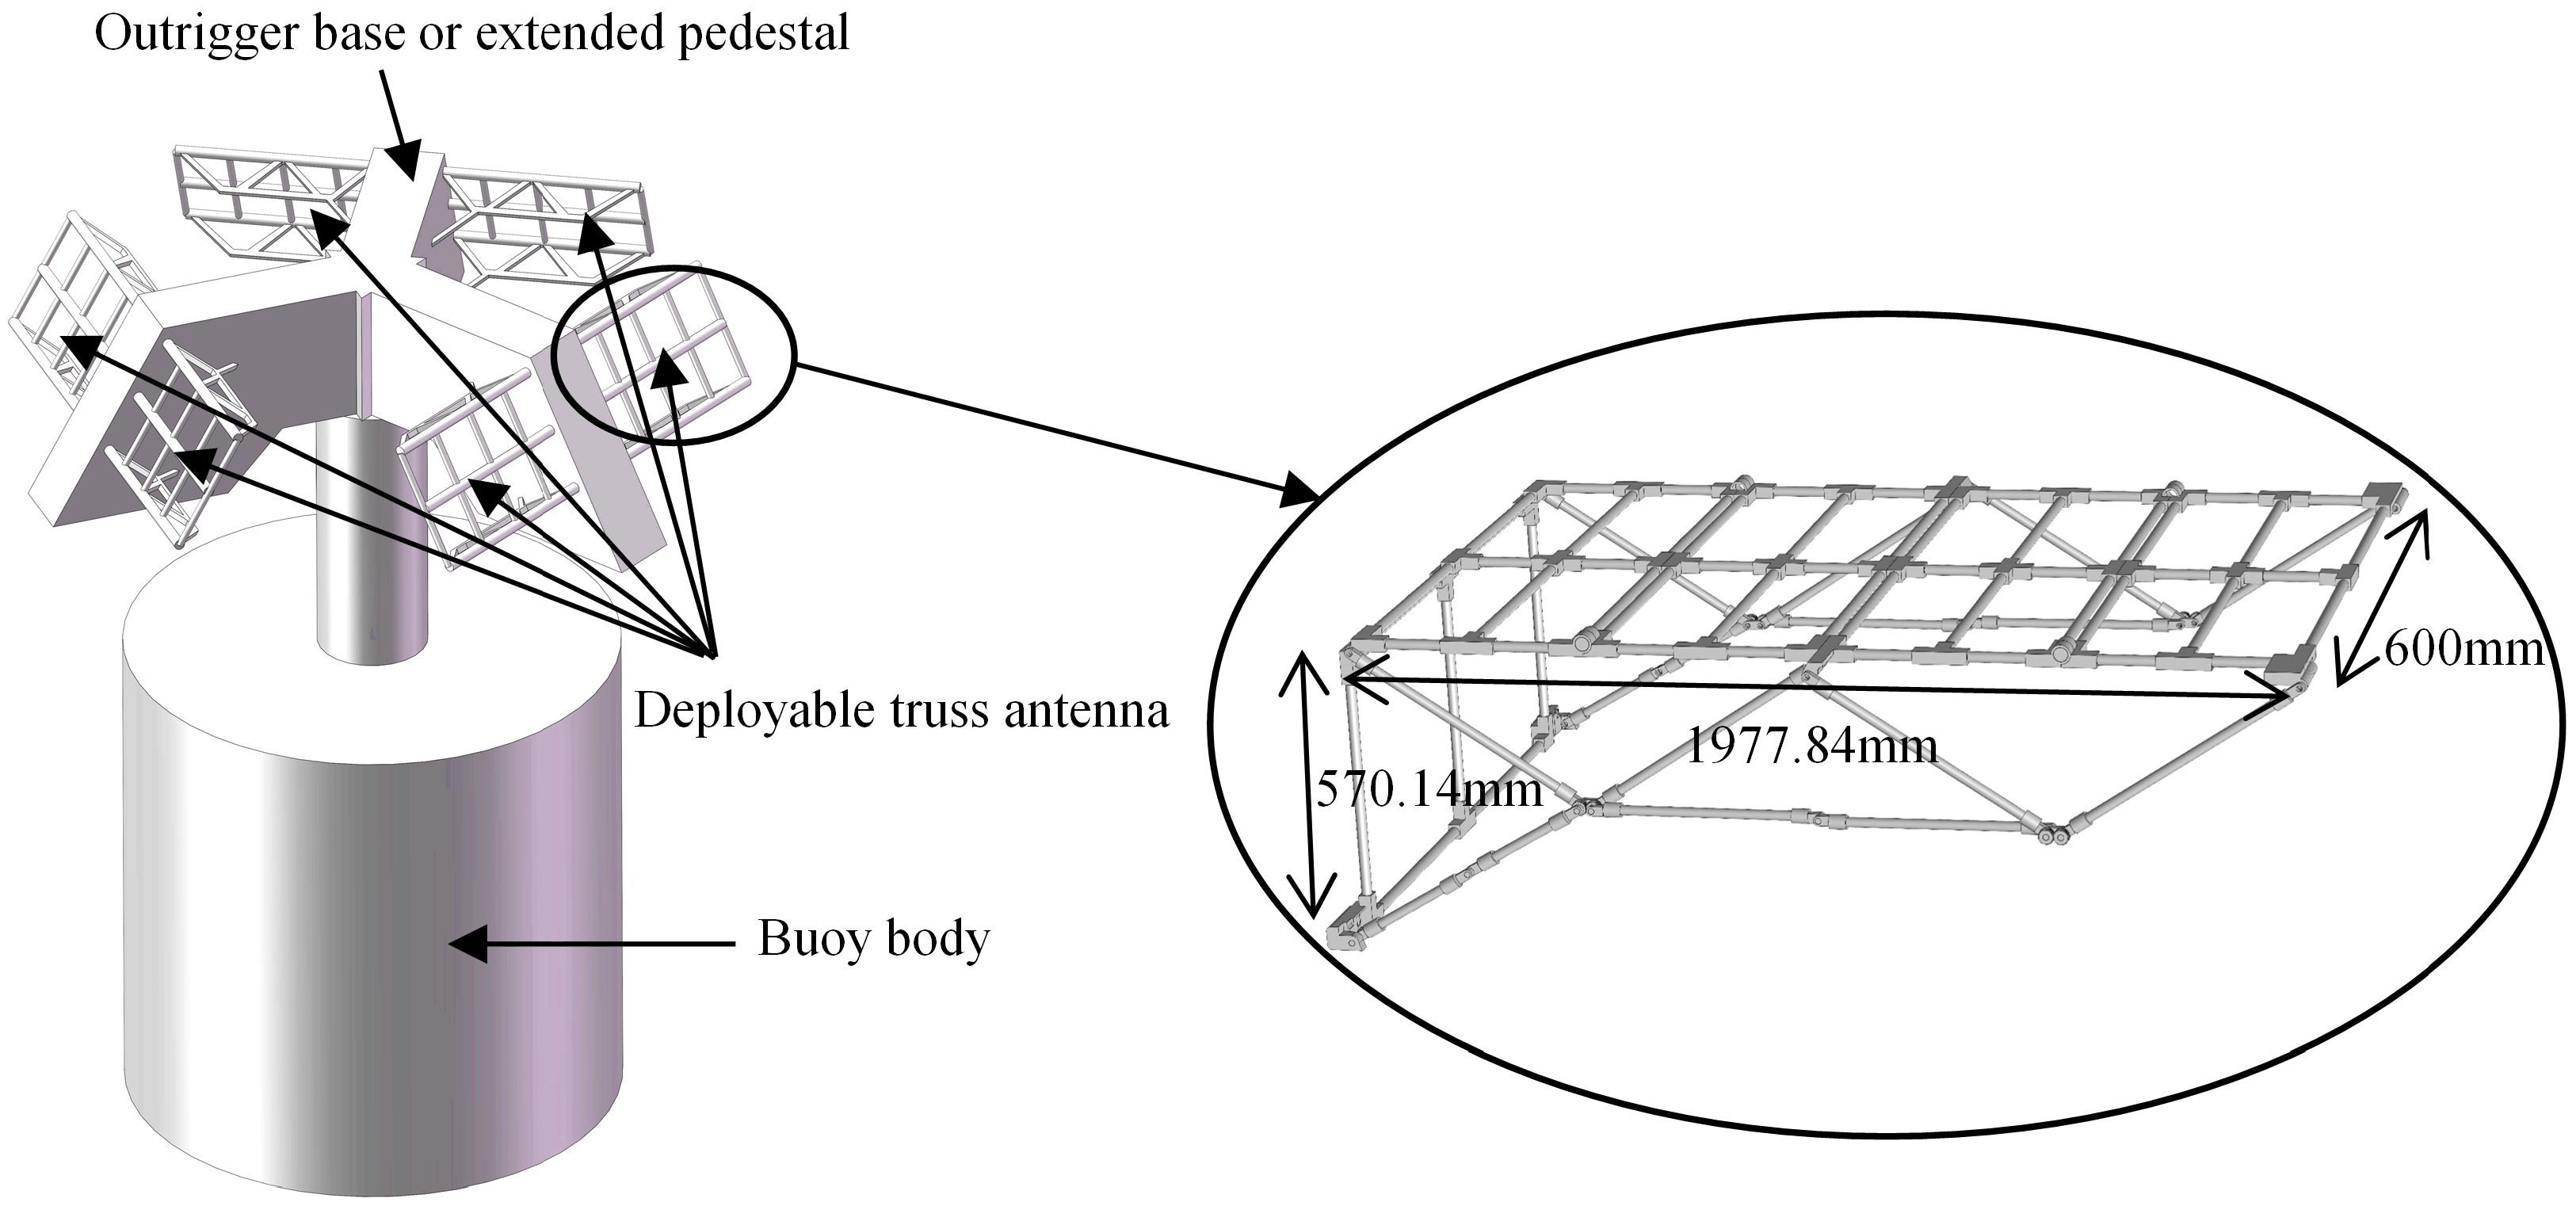
Figure 1. Configuration and layout of the truss-type deployable antenna.
Buildings 15 04108 g001
Figure 2. Layout and settings of the finite element model: (a) member length definitions and (b) model setup.
Buildings 15 04108 g002
Figure 3. Distribution of the critical nodes for RMS calculation.
Buildings 15 04108 g003
Figure 4. Definition of the antenna elevation angle, α.
Buildings 15 04108 g004
Figure 5. Effect of the elevation angle on antenna performance: (a) variation in maximum structural displacement with elevation angle, (b) von Mises stress distribution at α = 0°, and (c) von Mises stress distribution at α = 90°.
Buildings 15 04108 g005
Figure 6. Illustration of offshore wind loading: (a) definition of the elevation (α) and azimuth (β) angles, and (b) wind loading on the structure at α = 90° and β = 0°.
Buildings 15 04108 g006
Figure 7. Simulation results under Level 12 wind loading.
Buildings 15 04108 g007
Figure 8. RMS error versus wind speed.
Buildings 15 04108 g008
Figure 9. Stress distribution under the combined effect of a Level 12 wind load and gravity.
Buildings 15 04108 g009
Figure 10. The six DOFs of a floating body.
Buildings 15 04108 g010
Figure 11. Displacement time history of the buoy.
Buildings 15 04108 g011
Figure 12. Analysis of reflector surface displacement: (a) location of the mid-span analysis points and (b) y-coordinate time history of the analysis points.
Buildings 15 04108 g012
Figure 13. RMS time history for the heave motion: (a) t = 0–2 s and (b) t = 30–40 s.
Buildings 15 04108 g013
Figure 14. Maximum RMS error versus heave amplitude.
Buildings 15 04108 g014
Figure 15. Schematic of the roll azimuth angle.
Buildings 15 04108 g015
Figure 16. Roll motion analysis results: (a) roll angle time history and (b) von Mises stress distribution.
Buildings 15 04108 g016
Figure 17. RMS time history for a roll azimuth of 90°. (a) RMS time history for the first 2 s; (b) RMS time history from 2 s to 8 s.
Buildings 15 04108 g017
Figure 18. Parametric analysis of roll motion: (a) maximum RMS versus roll azimuth and (b) maximum RMS versus roll amplitude.
Buildings 15 04108 g018
Table 1. Link length parameters of the deployable support truss.
Component IDl1l2l3l4l5l6l7
Length (mm)284.4268.42494.46570.1430570.14494.46
Component IDl8l9l10l11l12l13l14
Length (mm)570.14478.75478.75494.4630570.14494.46
Table 2. Structural response under a Level 12 wind load at various elevation angles (Azimuth β = 0°).
CaseElevation Angle α (°)Surface Precision RMS (mm)Max. Displacement Umax (mm)Max. Stress σmax (MPa)
I301.275.0513.33
II602.198.7423.09
III902.5410.1026.67
Table 3. Structural response under the combined loading of a Level 12 wind and gravity.
CaseElevation Angle α (°)Surface Precision RMS (mm)Max. Displacement Umax (mm)Max. Stress σmax (MPa)
I301.305.3071.52
II602.176.9446.90
III902.447.5520.06
Disclaimer/Publisher’s Note: The statements, opinions and data contained in all publications are solely those of the individual author(s) and contributor(s) and not of MDPI and/or the editor(s). MDPI and/or the editor(s) disclaim responsibility for any injury to people or property resulting from any ideas, methods, instructions or products referred to in the content.