Abstract
Non-contact measurement of human skin temperature is an important area of research. Infrared temperature devices have played a critical role in measuring skin temperature without physical contact. Thermal cameras have also been employed for non-contact skin temperature measurements. However, both infrared devices and thermal cameras have limitations that restrict their use in the building industry for assessing occupant thermal comfort. The building industry requires sophisticated equipment capable of measuring human temperature non-invasively and, through integration with building control systems, adjusting the environment to meet occupants’ thermal comfort needs. Unfortunately, standard thermal cameras and infrared temperature sensors are not designed with building applications in mind. This paper proposes an affordable and building-compatible thermal camera designed to measure occupant skin temperature via a non-contact method, enabling better integration with building control systems to support occupant comfort. Experimental results demonstrate that the proposed system can reliably capture facial skin temperature and establish a quantifiable relationship between facial and room temperatures. Moreover, this provides a foundation for future real-time thermal comfort and building-control applications.
1. Introduction
Thermal comfort is essential for building occupants’ productivity, mental state, and well-being [1]. Modern building designs often account for thermal comfort by applying Fanger’s Predictive Mean Vote (PMV) model to calculate the required comfort levels for occupants [2]. However, Fanger’s explicit model requires customization to meet occupants’ thermal comfort needs in real time [3,4].
Researchers have proposed using thermal cameras to collect real-time temperature data from occupants, which can then be used to train AI models to operate the building’s Heating, Ventilation, and Air Conditioning (HVAC) systems in accordance with occupants’ comfort requirements. Existing room temperature measurement solutions, however, have certain limitations. Most rely on RTD (Resistance Temperature Detector) wall sensors, which are prone to inaccuracies due to their physical installation locations and exposure to other heat sources, such as window glazing or electronic equipment [5,6,7,8]. Similarly, gadgets and occupant feedback are often inaccurate, either because of limited temperature measurement range or because feedback is influenced by personal feelings and emotions, resulting in an unreliable database for training AI models [9,10,11,12].
Thermal cameras are preferred for real-time occupant temperature measurement. However, they are generally expensive, prompting many researchers to develop customized thermal cameras [13]. With limited building budgets, these custom solutions allow researchers to adapt the cameras to specific building designs and geographic locations.
Given this context, this paper presents a solution for measuring occupants’ temperature using a customized, non-contact thermal camera. The camera is programmed to capture temperature from commonly exposed body parts, specifically the facial skin. A relationship will be established between wall-mounted RTD sensors and the thermal camera to identify facial comfort temperature and predict overall occupant comfort.
1.1. Concept of Calculating Thermal Comfort in Modern Buildings
In the 1970s, Fanger proposed two models for assessing and predicting thermal comfort in indoor environments: the Predicted Mean Vote (PMV) and the Predicted Percentage Dissatisfied (PPD). The PMV quantifies the average thermal sensation of a large group of people on a seven-point scale, ranging from −3 (cold) to +3 (hot), with 0 representing neutral. PPD estimates the percentage of people likely to feel uncomfortable in a given environment. The design parameters for both models include air temperature, mean radiant temperature, relative humidity, air velocity, clothing insulation, and metabolic rate for a given environment. Both models are widely used in building design and are incorporated in ASHRAE Standard 55 [14] and ISO 7730 [15] as international thermal comfort standards. However, a key limitation is that all design parameters are calculated based on fixed values and do not reflect real-time variations in thermal comfort [16].
1.2. Skin Temperature Relationship with Indoor Comfort
Studies have shown that human skin temperature is closely related to indoor comfort, which is not uniform and can vary over time depending on indoor air parameters, metabolic activity, and clothing. Research indicates that skin temperature is a strong indicator of occupants’ perceived thermal comfort, and certain body parts, such as the face, can help identify comfort levels [17,18].
The inner core body temperature for a healthy human is approximately 36.7 °C. To maintain this core temperature, the body engages in several automated responses, adjusting blood flow under the skin to regulate heat [5,11,19,20]. These changes in blood flow manifest as sensations such as warmth, sweating, cold, or shivering, which are reflected in skin temperature and thus indicate the occupant’s comfort level [21,22,23].
In one study, an experiment was conducted to examine the relationship between skin temperature and occupant comfort using wireless temperature sensors (thermistors) attached to multiple body locations, including the forehead, chest, upper arm, thigh, calf, and hand. Skin temperature was continuously monitored alongside environmental measurements and occupants’ subjective comfort assessments. The results confirmed that skin temperature is a reliable predictor of thermal sensation and can be used to assess indoor comfort in buildings [24].
Table 1 summarizes the observed relationship between indoor air temperature and mean skin temperature, illustrating how changes in the indoor environment correspond to variations in occupants’ skin temperature and, consequently, their perceived thermal comfort.

Table 1.
Indoor air temperature and mean skin temperature measurements.
Clothing, metabolic rate, air velocity, humidity, radiant temperature, and air temperature all influence thermal comfort for occupants. Indoor air quality (IAQ) parameters, such as CO2 (ppm), also play a role in comfort [2,16,25,26]. Frontczak and Wargocki note that achieving optimal indoor comfort requires a holistic approach, as occupant comfort results from the combination of multiple factors [27]. During the experiment, CO2 (ppm) and humidity (%RH) will be monitored to observe their effect as indoor air temperature changes.
1.3. Current Methods of Measuring Indoor Room Temperature
The most common method to measure and control indoor environments is through wall-mounted temperature sensors. These sensors are typically RTD types, which measure the resistance of the sensor’s surface to determine the indoor temperature. They are integrated into the Heating, Ventilation, and Air Conditioning (HVAC) system as part of a closed-loop feedback mechanism. The wall-mounted sensors measure room temperature and send feedback via programmable logic controllers (PLC) to modulate the HVAC system according to predefined parameters.
This approach is prone to inaccuracies. The sensor’s location can produce false readings if installed near windows or close to heat-generating sources such as TVs or printers. In other words, the wall-mounted RTD sensor controls the indoor environment based on its surface temperature, which may not reflect the actual room conditions [28].
In addition to wall-mounted temperature sensors, modern smart-building systems increasingly deploy distributed Internet-of-Things (IoT) sensor networks for monitoring ventilation performance, indoor air pollutants, and occupancy behavior [29]. These systems typically track variables such as CO2 concentration, humidity, and airflow patterns to support ventilation control and indoor-air-quality management, rather than measuring individual occupants’ thermal state. Such approaches provide environmental context but do not directly assess personal thermal comfort, motivating alternative sensing techniques such as non-contact facial temperature monitoring.
Another method for regulating indoor temperature is through occupant-based monitoring devices such as smart watches. With advancements in medical technologies for skin temperature measurement, researchers have proposed solutions to measure occupants’ sweat rates via smart watches. This data can then be used to modulate HVAC operation through IoT-based communication between the watch and the control system. Sweat rate sensors operate by integrating miniaturized thermo-pneumatic actuators, which measure humidity evaporation caused by sweat. These sensors typically include two components: a humidity chamber for collecting sweat-induced humidity and a humidity sensor within the chamber to measure the collected moisture [18].
Natural ventilation-based sweat sensors are categorized into open and closed chamber types. Open chamber types include two humidity sensors, with one open to measure the humidity difference, while the generated sweat naturally ventilates through the open end. These are highly sensitive to even gentle airflow (<0.5 m/s), limiting their use in mobile monitoring applications. Closed chamber types use a single humidity sensor to measure the rate of humidity rise while in contact with the skin [30]. While effective for individual occupants, this solution cannot ensure thermal comfort for those not wearing the watch.
A third method relies on direct occupant feedback. This is commonly done during building fine-tuning, typically three to six months after commissioning or during routine maintenance [31]. However, this method is highly subjective, as occupant responses are influenced by stress, well-being, and mental state [32,33,34].
Since the COVID-19 pandemic, thermal imaging has emerged as a method for measuring facial temperature. Nevertheless, researchers have achieved limited success due to challenges in face detection, calibration, and environmental variables, which affect measurement accuracy [35,36,37,38,39,40].
This paper focuses on non-contact facial temperature measurement using thermal images and calibrating these thermal readings against room temperature obtained from wall-mounted sensors. AI-driven comfort models require diverse and reliable field data; however, wearable sensors and RTD-based measurements can suffer from practical limitations such as user compliance, placement constraints, motion artifacts, and location-dependent inaccuracies. These factors reduce real-world data robustness, making non-contact sensing a promising alternative.
To address this gap, we propose a low-cost RGB-T thermal imaging system integrated with a Raspberry Pi to continuously measure facial skin temperature and align these measurements with ambient indoor temperature. This approach provides spatial thermal information without requiring user-mounted devices and supports automated region-of-interest detection, offering a practical, occupant-centric solution for indoor comfort studies.
To guide this study, the following research questions (RQs) are addressed:
RQ1: Can a low-cost RGB-T thermal imaging system reliably measure facial skin temperature in indoor environments?
RQ2: What is the relationship between room air temperature and facial skin temperature under controlled conditions?
While this paper focuses on measurement and calibration, these findings also lay the groundwork for future research on integrating facial temperature sensing with HVAC control strategies.
2. Proposed System Design
Previous studies have shown that indoor temperature can be measured in multiple ways; however, occupant thermal comfort remains a concern, as highlighted in Section 1.3, which identifies limitations in the discussed techniques. To address this, an experiment was conducted to establish the relationship between facial temperature, measured using a thermal camera, and indoor temperature, recorded by RTD sensors. The Topdon Thermal Camera TS001 (Topdon Technology Co., Ltd., Shenzhen, China) was used to measure facial temperature.
Thermal cameras are limited in detecting objects, as they capture heat signatures rather than visible light images. As a result, fine details of an object are often too complex to be accurately captured by a thermal image. For face detection, the Grandstream GUV3100 (Grandstream Networks, Inc., Boston, MA, USA) was employed, while the Netatmo indoor modules (Netatmo S.A., Boulogne-Billancourt, France) were used to measure indoor air temperature, CO2, and humidity. The combination of the webcam and thermal camera is referred to as the RGB-T camera (Figure 1).
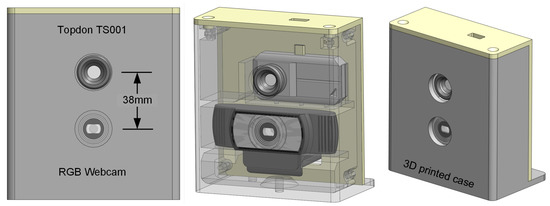
Figure 1.
Graphical model of the RGB-T camera, developed by integrating a low-cost thermal camera (Topdon TS001) with a high-definition webcam. Both cameras are housed in a 3D-printed enclosure to maintain a fixed position.
Both cameras are aligned so that the region of interest remains consistent, as shown in Figure 2. The dimensions of the area of interest are set during the calibration process to ensure that the occupant’s face can be accurately detected in each frame.
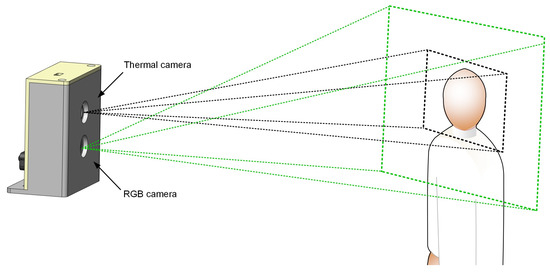
Figure 2.
Field of view (FOV) of the RGB and thermal cameras in the RGB-T system. The larger FOV of the RGB camera (indicated by the green dashed line) enables facial recognition, while the narrower FOV of the thermal camera (indicated by the black dashed line) captures temperature data for the facial region.
A Raspberry Pi 5 was programmed with an algorithm to detect a face. Once a face is detected, the algorithm triggers the thermal camera to measure facial temperature and the Netatmo sensors to record indoor temperature, CO2, and humidity. The readings are recorded in a text file whenever a face is detected. A relationship is then established between the Netatmo sensor and the Topdon thermal camera readings. The positions of the cameras and Netatmo indoor sensors remain fixed throughout the experiment. Figure 1 and Figure 3 illustrate the camera design and experimental setup.
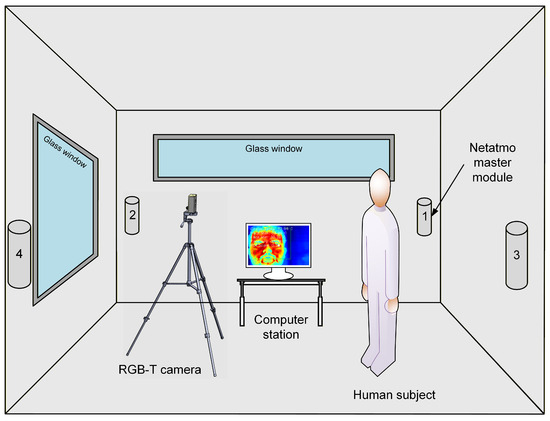
Figure 3.
Experimental setup for facial temperature measurement using a webcam and a thermal camera. Four indoor air quality units (Netatmo) were installed on the walls to record temperature at multiple locations within the room. Netatmo 1 served as the master module, while Netatmo 2–4 operated as slave modules. The room contained two glass windows, and the camera-to-participant distance was maintained at approximately 0.5 m.
Several alternative sensing approaches were evaluated. Low-cost thermopile devices (e.g., AMG8833 (Panasonic Corporation, Osaka, Japan)) were initially considered due to their affordability, but they provide only single-point temperature readings and therefore lack the spatial resolution needed to monitor multiple occupants or detect local facial thermal variations. Wearable skin-temperature sensors and low-cost IR spot sensors reported in literature can provide accurate skin temperature readings, but they require user compliance and are impractical for passive indoor comfort monitoring. Higher-end thermal cameras (e.g., FLIR A20V (FLIR Systems Inc., Wilsonville, OR, USA)) offer superior accuracy but are expensive and, in some cases, discontinued or unsupported.
The proposed system adopts a low-cost RGB-T camera platform combined with a Raspberry Pi for real-time acquisition, spatial temperature mapping, and automated ROI-based facial temperature extraction. This enables continuous non-contact temperature measurement with sufficient spatial resolution to support indoor comfort studies, distinguishing our approach from both single-point thermopile devices and wearable-based methods.
Four wall-mounted Netatmo temperature sensors are installed to accurately monitor the room temperature, as shown in Figure 3. The human body’s inner core temperature is approximately 36.7 °C, which is necessary for normal organ function. To maintain this core temperature, skin temperature across different body parts must be regulated. This experiment focuses on average facial temperature, measured using the Topdon TS001 thermal camera.
Studies indicate that, for indoor environments, thermal comfort corresponds to facial temperatures in the range of 32 °C to 34 °C. When facial temperature rises above 35 °C, occupants may begin to feel warm or hot, whereas temperatures below 32 °C may lead to sensations of coolness or cold [17,18]. Figure 4 presents the sequential workflow for implementing a facial temperature monitoring system.
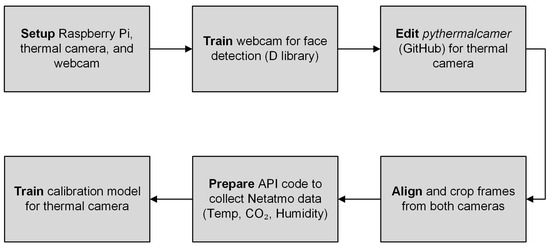
Figure 4.
Workflow for facial temperature measurement using the RGB–thermal (RGB-T) sensing system implemented on a Raspberry Pi platform. The pipeline includes hardware setup, webcam face-detection model configuration, thermal-camera software adaptation, and data alignment between thermal and RGB frames. Netatmo sensor data are collected via API, and a calibration model is trained to map thermal readings to reference temperature measurements.
The face detection model was trained using an open-source deep learning library called Dlib. Dlib employs Histogram of Oriented Gradients (HOG) features along with a linear Support Vector Machine (SVM) classifier, making it suitable for real-time face-detection applications. In addition, Dlib includes a deep learning model for face embeddings, which can be used for face identification and verification tasks, such as creating customized indoor comfort models for individuals. For more accurate face detection, Dlib leverages a conventional neural network (CNN) technique [41]. The primary advantage of using Dlib is that it is lightweight and fast, making it well-suited for deployment on a Raspberry Pi 5.
A Python (3.11) script was developed to measure average facial temperature using the Topdon TS001 thermal camera. The core communication logic, diagnostics, and data parsing routines were adapted from the open-source PyThermalCamera repository by Les Wright, originally designed for the Topdon TC001 camera [42]. The script was further extended to include data saving, Netatmo sensor integration, and facial recognition using the DLib library.
Both cameras were aligned to focus on the same region of interest (ROI). Table 2 summarizes the characteristics of both cameras. The ROI and cropping were adjusted to ensure that the frames from both cameras matched accurately.
Table 2.
Characteristics of Topdon TS001 thermal camera and GUV3100 webcam.
For calibration purposes, a region-of-interest (ROI) function was implemented, allowing the average facial temperature measurement area to be adjusted by scaling the side length of the square ROI between 0.1 and 1. The ROI size is defined relative to the bounding box detected by the face detection algorithm (i.e., an ROI of 1 corresponds to the full bounding box). A smaller ROI provides more accurate results, as the maximum and minimum temperatures are measured within a reduced area. The average facial temperature is calculated as the mean of the maximum and minimum temperatures recorded within the ROI. Figure 5 illustrates the difference between ROIs with scaling factors of 1 and 0.1, where the latter corresponds to an area 100 times smaller. The red square represents the ROI in the thermal image, while the green square indicates the bounding box around the face detected by the RGB camera. An offset feature was also incorporated for the maximum and minimum temperatures, which was set to 0 °C in the experiment.

Figure 5.
Comparison of face detection and region-of-interest (ROI) selection in thermal imaging. The green bounding box indicates the detected face, while the red box represents the ROI used for temperature extraction (scaling factor = 0.1 on the left and 1.0 on the right). The smaller ROI (0.1) corresponds to an area 100 times smaller than the full bounding box, enabling more localized and precise temperature averaging. The overlaid labels on the images indicate the maximum, minimum, and center facial temperatures, and the ROI scale is also displayed.
Netatmo readings were collected simultaneously with face detection. These measurements were integrated into the logic via the Netatmo API. Whenever the webcam detects a face within the frame, both the average face temperature and Netatmo sensor measurements are recorded with time and date in a text file, which is updated every 5 s. Figure 6 presents the corresponding logic flow chart.
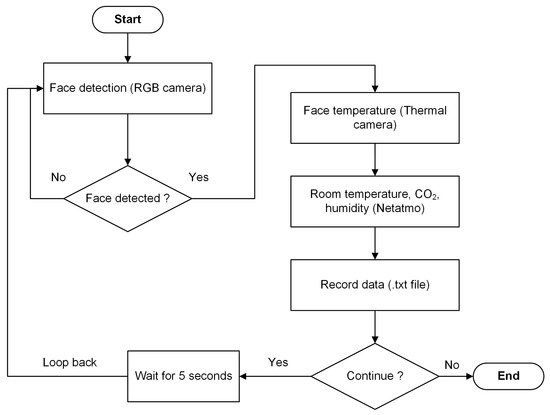
Figure 6.
Face detection and thermal measurement process flowchart. The RGB face detection loops run continuously and upon detection of a face triggers the remaining steps in the workflow. To avoid overloading the processing unit and air quality sensors, a five second wait is added after each successful reading.
Calibration of the Topdon TS001
Prior to the experiment, the Topdon TS001 was checked for temperature accuracy. Calibration was performed against a Sentry TS663 (Sentry Optronics Corp., Ban-Ciao (Taipei), Taiwan, R.O.C.) infrared temperature sensor using the Hierarchical Linear–Polynomial Mapping (HLPM) method. Measurements are traceable to the SI via the Measurement Standards Laboratory (MSL), New Zealand. A blackbody with a 35 mm aperture (0–90 °C range) was used; ambient conditions were maintained at 20 ± 2 °C and instrument readability was 1 °C. For the TS001 calibration, temperatures from the TS001 and TS663 were recorded at five setpoints between 30 °C and 35 °C, with both instruments positioned 0.5 m from the target and an indicated readability of 0.5 °C. Measured values were within the ±1 °C tolerance.
At a camera-to-subject distance of 0.5 m, the thermal camera field-of-view covers approximately 0.53 m × 0.38 m (H × V), while the RGB camera covers approximately 0.78 m × 0.44 m. This FOV ensures full facial coverage in both modalities, providing sufficient resolution for accurate region-of-interest–based temperature extraction.
3. Results and Discussion
The experimental setup was tested over a period of one week to ensure that the temperature readings remained within the expected range. The test was carried out multiple times to ensure that the results were consistent for validation purposes. Each test lasted 40 min, with the participant seated in front of the camera to ensure proper face detection while the thermal camera recorded the average facial temperature. The distance between the participant and the thermal camera/web camera was maintained at 0.5 m in a sitting position. The camera tripod was set at a height of 1.2 m. The age of the participant was 36 years and a slight beard was preferred to see the thermal affect and notice variation in temperature on the facial measurements. As shown in Figure 3, windows were opened or closed, and the heat pump setpoint temperature was adjusted to modify the room temperature. The wall-mounted Netatmo sensors recorded these temperature changes. Once the room temperature stabilized and the occupant adapted to the indoor environmental conditions, the average face temperature was measured, and thermal images of the face were captured. The room dimensions were 3 m (L) × 3 m (W) × 2.4 m (H). The ambient temperature for the room was in the range of 17 °C to 19 °C. Before the start of the experiment, the ambient temperature for the room was controlled to 15 °C by opening the windows as the outside ambient temperature was lower than the room temperature. Once the room temperature was set to 15 °C, the windows were closed, and an electric heater (2 kW) was used to gradually increase the room temperature to 25 °C. The entire process took approximately 40 min, and the results were recorded.
During the testing period, the outside ambient temperature ranged from 1 °C to 6 °C at night and 8 °C to 13 °C during the day. The participant wore casual clothing. The results were recorded in a text file every 5 s, resulting in 480 measurements over each 40 min test. Table 3 summarizes the results, which were also recorded at 5 min intervals during the testing period.
Table 3.
Summary of room temperature, facial temperature, CO2, humidity, and thermal images. Each block shows four repeated measurements followed by a mean ± standard deviation row.
During the test, the participant’s facial temperature changed in response to variations in room temperature. The thermal images captured at each degree of change reflected these variations. On the thermal scale, yellow indicates cooler regions of the face, while red indicates warmer areas. According to Fanger’s PMV model parameters, air velocity and clothing insulation remained constant throughout the experiment. However, relative humidity, air temperature, mean radiant temperature, and metabolic rate varied.
Although real-time metabolic rate was not measured in this experiment, changes in metabolic rate can be inferred from the facial thermal images, as metabolic rate corresponds to the rate at which the body produces heat. The shifting yellow and red regions on the face indicate biological responses to maintain core temperature, contributing to occupant comfort.
In Fanger’s model, mean radiant temperature is typically calculated from the surface temperatures of the environment without considering skin temperature. However, recent research supports combining environmental parameters with physiological measurements, such as skin temperature, to achieve more accurate and personalized assessments of thermal comfort [43,44].
In this experiment, environmental temperatures were not calculated; the focus was solely on analyzing real-time changes in facial temperature to determine occupant comfort.
Figure 7 shows screenshots of the participant’s thermal images at different room temperatures. The thermal images illustrate that as room temperature decreases, the red regions on the face (indicating higher temperature) diminish while yellow regions (indicating lower temperature) appear. An increase in yellow regions corresponds with the participant feeling cold, while an increase in red regions corresponds with the participant feeling warm.
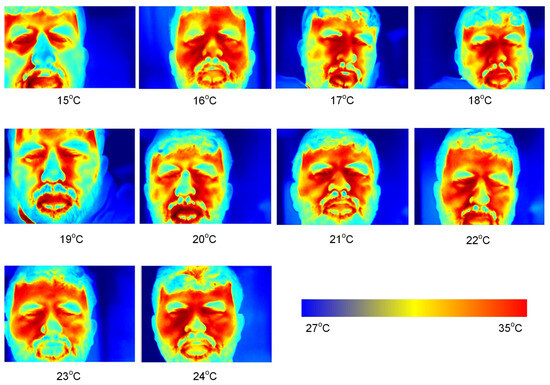
Figure 7.
Thermal images of the participant’s face at different room temperature setpoints, illustrating changes in facial heat distribution. Pixel-level temperature extraction and averaging within the defined region of interest (ROI) were performed algorithmically. A horizontal color bar is included to indicate the temperature scale used across all thermal images. Image labels denote the corresponding average room temperatures.
The following factors must be considered when analyzing the results, as they can affect the accuracy of the data presented:
- Accuracy of the thermal measurement via the thermal camera;
- Accuracy of the indoor temperature sensor;
- Location of the sensors;
- Participant distance from the camera;
- Metabolic rate of the participant.
During the experiment, the participant’s position, as well as the locations of the thermal camera and indoor temperature sensors, were kept consistent. However, the accuracy of the equipment must still be considered. With the limited budget for this experiment, results could have been more precise if devices with higher accuracy and lower tolerance had been used. According to the datasheet for the Topdon TS001 thermal camera, the accuracy is ±3 °C [45]. Other limitation that need to be considered, while analyzing the results is metabolic rate. For the research purpose, metabolic rate measurement was not considered as at the time of the experiment, we did not have the setup to measure it. However, in order to keep the metabolic rate consistent, the participant measured data was collected in sitting conditions (1.0–1.2 m) during the complete experiment [46]. The participant was given the same set of clothes during the experiment and his distance from the measuring device was kept constant. The experiment was conducted during night time to avoid any influence of window glare/reflection. Figure 8 shows the plots for all Netatmo sensors, while Figure 9 shows the average room temperature and its relation to average facial temperature. The plot shows a general upward trend: as room temperature increases, average face temperature also increases. Although the relationship is not perfectly linear, it suggests a stepwise response, indicating that facial temperature reacts to changes in room temperature.
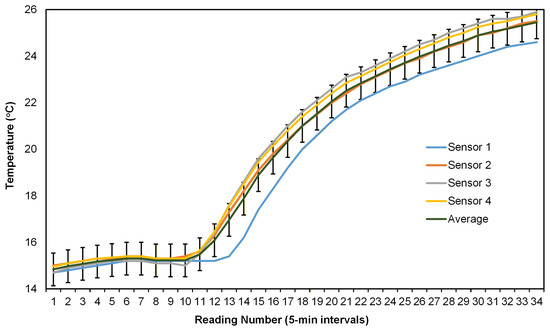
Figure 8.
Temperature measurements recorded by four Netatmo indoor air-quality sensors placed at different locations inside the test room. Each line represents the temperature profile at 5-min intervals during the controlled heating cycle. Error bars represent variability across repeated measurements and are shown for both individual sensors and the averaged temperature curve. The results demonstrate consistent spatial temperature trends as the room warmed from 15 °C to 24 °C.
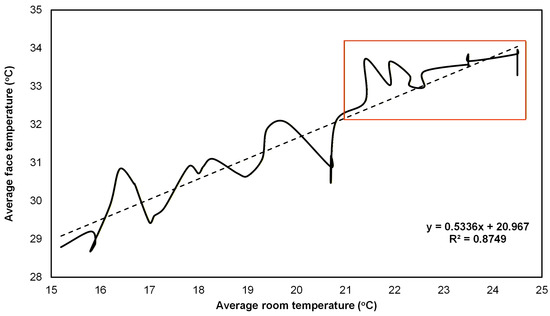
Figure 9.
Relationship between average room temperature and average facial temperature during a experiment. The solid line represents the facial temperature response, and the dashed line indicates a linear trend fit (R2 = 0.8749). The highlighted region indicates the upper-temperature range where facial temperature stabilizes as room temperature approaches warmer comfort levels.
The “stepwise” pattern observed in the relationship between room temperature and facial temperature (Figure 8 and Figure 9) can be attributed to both physiological responses and measurement artifacts. Physiologically, the human body regulates skin blood flow and sweating in discrete steps as environmental conditions change, leading to non-linear, stepwise adjustments in facial skin temperature [47,48]. This is consistent with thermoregulatory literature, where skin temperature does not always change smoothly but can exhibit plateaus or sudden shifts in response to thermal stimuli [49]. Alternatively, the stepwise pattern may partially result from measurement artifacts, such as the resolution limits of the TS001 thermal camera (±3 °C accuracy), or from averaging effects when calculating mean facial temperature across frames.
Our findings align with previous studies: Zhang [24] and Brager & de Dear [16] both report that facial skin temperatures in the range of 32–34 °C are associated with thermal comfort. The observed comfort range in this study (room temperature 21–25 °C, facial temperature 32–34 °C) is consistent with these references, supporting the validity of our approach. However, the experiment was conducted during winter with a single subject, which limits the generalizability of the results to other seasons and populations.
From a practical perspective, the demonstrated relationship between room and facial temperature suggests that real-time facial temperature monitoring could be integrated into HVAC control logic. By targeting occupant facial comfort, building systems could adapt setpoints dynamically, potentially improving both comfort and energy efficiency. However, the accuracy limitations of the TS001 camera and the single-subject, winter-only dataset mean that further validation is needed before widespread adoption.
Based on the observed facial temperature range of 32 °C to 34 °C, the corresponding room temperature was between approximately 21 °C and 25 °C. This range can be considered satisfactory for occupant comfort, consistent with findings from previous studies. Zhang [24] reports that 32 °C to 34 °C is a comfortable facial temperature, and Brager and de Dear [16] indicate that comfort facial skin temperature is around 33 °C.
As highlighted with a red box on the average room temperature vs. average facial temperature plot in Figure 9, it can be concluded that during hot days, occupant facial comfort should be maintained around 32 °C (indoor room temperature 21 °C), and during cold days, facial comfort should be maintained around 34 °C (indoor room temperature 24 °C). From Figure 7, facial temperature was observed within the range of 21 °C to 24 °C. Since the experiment was conducted during winter, these findings primarily reflect comfort in colder conditions. The participant reported facial discomfort when the room temperature dropped below 18 °C but reported no discomfort at temperatures above 20 °C.
This experimental result allows researchers to control room temperature for occupant comfort based on facial temperature. Depending on the chosen control strategy, temperature regulation can be implemented using two methods:
- Temperature control directly via face temperature;
- Temperature control via wall-mounted temperature sensors using a face temperature factor.
In Option 1, the system continuously adjusts the room temperature based on facial temperature measurements from multiple occupants or frequent changes in an occupant’s metabolic rate (e.g., during exercise). The temperature setpoint responds rapidly, as the HVAC unit’s heating and cooling valves are constantly modulated to achieve the desired comfort temperature.
In Option 2, the system operates more stably, as room temperature is adjusted using a face temperature factor. This factor defines a bandwidth for the temperature setpoint, allowing adjustments in intervals and resulting in a smoother transition to the occupant’s comfort temperature.
In complex building temperature control systems, other factors, such as IAQ parameters and humidity, are also considered when designing control strategies. In this experiment, only the relationship between room temperature and facial temperature was established, as temperature primarily determines how hot or cold the air feels and directly affects occupant comfort. IAQ and humidity are generally homogeneous within a space, with minimal variation observed in the measured results. As room temperature increases, CO2 levels also rise, indicating that the mechanical system should increase fresh air flow to maintain acceptable CO2 levels. Humidity remained within the acceptable range. In cases of high indoor humidity, the mechanical system should dehumidify the air, whereas excessively dry conditions require humidification.
4. Conclusions
This paper presents an experimental analysis of facial temperature versus wall-mounted temperature sensors using a low-cost thermal camera. The results indicate a stepwise relationship between facial temperature and room temperature. Other factors, such as clothing and metabolic rate, must also be considered, as they can influence the results. It should be noted that to maintain the body’s core temperature, rapid changes in blood flow occur across different body parts, which can further affect the relationship between facial temperature and indoor room temperature. The primary reason for measuring facial temperature as a reference for occupant comfort is that the face is generally uncovered and directly exposed to the indoor environment, making it a reliable indicator of thermal conditions.
The experimental results provide an alternative method to measure occupant temperature in real time. This approach allows for continuous monitoring of facial temperature for multiple occupants whenever a face is detected. Furthermore, it enables early detection of discomfort, as the measurements are directly obtained from occupants rather than inferred from average room temperature. Based on the thermal camera specifications, this method allows for a wider range of temperature measurements compared to wall-mounted sensors, occupant feedback, or wearable devices. Finally, this approach offers the potential to optimize HVAC control by delivering real-time occupant comfort data to the control logic rather than relying solely on return air temperature or average room temperature. Using facial temperature measurements for HVAC control can improve occupant focus, productivity, and well-being.
The study identified a clear link between room temperature and facial skin temperature, with optimal comfort generally occurring when facial temperatures are between 32 and 34 °C. The RGB-T system, built on a Raspberry Pi platform, proved effective for continuous facial detection and temperature tracking. This approach holds potential for integration with building management systems to support HVAC adjustments based on occupant comfort. Nonetheless, factors such as where sensors are placed, the distance from the camera, and individual physiological variations can still impact measurement accuracy.
For future work, it is important to conduct studies involving multiple occupants, assess system performance throughout different seasons, and develop closed-loop control mechanisms to further improve energy efficiency and comfort, in line with best practices in the buildings sector. Moreover, incorporating skin temperature data into the calculation of mean radiant temperature within Fanger’s PMV model could enable dynamic, real-time adjustments to indoor temperature settings. By merging real-time skin temperature readings with environmental data, thermal comfort evaluations can become more precise and tailored to occupant needs. As this investigation involved a single participant in winter conditions, the findings should be viewed as preliminary; broader seasonal and demographic studies are required to validate and generalize the observed trends.
Future research should explore integrating skin temperature into the mean radiant temperature calculation in Fanger’s PMV model. This integration would enable real-time adjustments to temperature setpoints in indoor environments to better meet occupant thermal comfort needs. Combining skin temperature with environmental factors in real time will further enhance the accuracy and personalization of thermal comfort assessments.
This research explores the use of an affordable RGB-T system for tracking facial temperature in real time, supplying supplementary data to inform building HVAC operations. The study’s key innovation lies in integrating accessible hardware (Topdon TS001, webcam- Grandstream GUV 3100, Raspberry Pi) with a facial detection workflow to monitor how occupants’ thermal states respond to environmental changes. Future investigations should address calibration with standard references, assess performance with multiple occupants across different climate scenarios, and implement closed-loop HVAC trials to determine actual benefits for energy efficiency and occupant comfort.
Author Contributions
Conceptualization, methodology, investigation, M.A. and K.M.A.; writing—original draft preparation, visualization, M.A.; writing—review and editing, M.A., W.S. and K.M.A.; funding acquisition K.M.A.; supervision, project administration, W.S. and K.M.A. All authors have read and agreed to the published version of the manuscript.
Funding
This work was supported by the New Zealand Product Accelerator (Grant No. RM23459) and HauHau Research, which contributed in-kind resources to the project.
Institutional Review Board Statement
The study was conducted in accordance with the Low-Risk approval granted by the Massey University Human Ethics Committee (MUHEC), Project Application ID 4000031158.
Informed Consent Statement
Not applicable.
Data Availability Statement
The original contributions presented in this study are included in the article. Further inquiries can be directed to the corresponding author.
Conflicts of Interest
The authors declare no conflict of interest.
Abbreviations
The following abbreviations are used in this manuscript:
| BMS | Building Management System |
| IOT | Internet of Technology |
| PMV | Predictive Mean Vote |
| ROI | Region of Interest |
| HVAC | Heating, Venting and Air Conditioning |
| ASHRAE | American Society of Heating, Refrigerating |
| and Air-Conditioning Engineers | |
| CNN | Convolutional Neural Network |
| PPM | Particles Per Minute |
| HOG | Histogram of Oriented Gradients |
| SVM | Support Vecrtor Machine |
| CO2 | Carbon dioxide |
| IAQ | Indoor Air Quality |
| PPD | Predicted Percentage of Dissatisfied |
| RTD | Resistance Temperature Detector |
| HLPM | Hierarchical Linear–Polynomial Mapping |
| MSL | Measurement Standards Laboratory |
References
- Fischer, S.; Naegeli, K.; Cardone, D.; Filippini, C.; Merla, A.; Hanusch, K.U.; Ehlert, U. Emerging effects of temperature on human cognition, affect, and behaviour. Biol. Psychol. 2024, 189, 108791. [Google Scholar] [CrossRef] [PubMed]
- Ekici, C. A review of thermal comfort and method of using Fanger’s PMV equation. In Proceedings of the 5th International Symposium on Measurement, Analysis and Modelling of Human Functions ISHF, Vancouver, BC, Canada, 27–29 June 2013; Volume 2013, pp. 61–64. [Google Scholar]
- Nicol, J.F.; Humphreys, M.A. Adaptive thermal comfort and sustainable thermal standards for buildings. Energy Build. 2002, 34, 563–572. [Google Scholar] [CrossRef]
- Maiti, R. PMV model is insufficient to capture subjective thermal response from Indians. Int. J. Ind. Ergon. 2014, 44, 349–361. [Google Scholar] [CrossRef]
- Qi, L.; Wu, Q.; Zhang, L.; Liu, J. Effect of environmental parameters on heat transfer characteristics and thermal sensation of human body with step change of temperature. Heat Mass Transf. 2022, 58, 873–885. [Google Scholar] [CrossRef]
- Zhao, Q.; Lian, Z.; Lai, D. Thermal comfort models and their developments: A review. Energy Built Environ. 2021, 2, 21–33. [Google Scholar] [CrossRef]
- Orimoloye, I.R.; Mazinyo, S.P.; Kalumba, A.M.; Ekundayo, O.Y.; Nel, W. Implications of climate variability and change on urban and human health: A review. Cities 2019, 91, 213–223. [Google Scholar] [CrossRef]
- Niemann, P.; Schmitz, G. Impacts of occupancy on energy demand and thermal comfort for a large-sized administration building. Build. Environ. 2020, 182, 107027. [Google Scholar] [CrossRef]
- Jayathissa, P.; Quintana, M.; Abdelrahman, M.; Miller, C. Humans-as-a-sensor for buildings—intensive longitudinal indoor comfort models. Buildings 2020, 10, 174. [Google Scholar] [CrossRef]
- Buguet, A.; Gati, R.; Soubiran, G.; Straboni, J.; Hanniquet, A.; Livecchi-Gonnot, G.; Bittel, J. Seasonal changes in circadian rhythms of body temperatures in humans living in a dry tropical climate. Eur. J. Appl. Physiol. Occup. Physiol. 1988, 58, 334–339. [Google Scholar] [CrossRef]
- Goto, T.; Niu, Z.; Chiba, Y.; Amano, K.; Saijo, Y. Human body temperature and cardiovascular response to changes in ambient temperature and body posture. Build. Environ. 2024, 266, 112085. [Google Scholar] [CrossRef]
- Kuhnen, G.; Jessen, C. The metabolic response to skin temperature. PflüGers Arch. Eur. J. Physiol. 1988, 412, 402–408. [Google Scholar] [CrossRef]
- Stančić, I.; Kuzmanić Skelin, A.; Musić, J.; Cecić, M. The Development of a Cost-Effective Imaging Device Based on Thermographic Technology. Sensors 2023, 23, 4582. [Google Scholar] [CrossRef] [PubMed]
- ANSI/ASHRAE Standard 55-2020; Thermal Environmental Conditions for Human Occupancy. American Society of Heating, Refrigerating and Air-Conditioning Engineers: Atlanta, GA, USA, 2020.
- ISO 7730:2005; Ergonomics of the Thermal Environment—Analytical Determination and Interpretation of Thermal Comfort Using Calculation of the PMV and PPD Indices and Local Thermal Comfort Criteria. International Organization for Standardization: Geneva, Switzerland, 2005.
- Van Hoof, J. Forty years of Fanger’s model of thermal comfort: Comfort for all? Indoor Air 2008, 18, 182–201. [Google Scholar] [CrossRef] [PubMed]
- Zhang, H.; Arens, E.; Huizenga, C.; Han, T. Thermal sensation and comfort models for non-uniform and transient environments, part III: Whole-body sensation and comfort. Build. Environ. 2010, 45, 399–410. [Google Scholar] [CrossRef]
- Arens, E.; Zhang, H.; Huizenga, C. Partial-and whole-body thermal sensation and comfort—Part I: Uniform environmental conditions. J. Therm. Biol. 2006, 31, 53–59. [Google Scholar] [CrossRef]
- Sund-Levander, M.; Forsberg, C.; Wahren, L.K. Normal oral, rectal, tympanic and axillary body temperature in adult men and women: A systematic literature review. Scand. J. Caring Sci. 2002, 16, 122–128. [Google Scholar] [CrossRef]
- Mackowiak, P.A.; Wasserman, S.S.; Levine, M.M. A critical appraisal of 98.6 F, the upper limit of the normal body temperature, and other legacies of Carl Reinhold August Wunderlich. JAMA 1992, 268, 1578–1580. [Google Scholar] [CrossRef]
- Romanovsky, A.A. Skin temperature: Its role in thermoregulation. Acta Physiol. 2014, 210, 498–507. [Google Scholar] [CrossRef]
- Johnson, J.M.; Kellogg, D.L., Jr. Thermoregulatory and thermal control in the human cutaneous circulation. Front. Biosci. Schol. Ed. 2010, 2, 825–853. [Google Scholar]
- Ono, T.; Murakami, S.; Ooka, R.; Omori, T. Numerical and experimental study on convective heat transfer of the human body in the outdoor environment. J. Wind Eng. Ind. Aerodyn. 2008, 96, 1719–1732. [Google Scholar] [CrossRef]
- Wang, D.; Zhang, H.; Arens, E.; Huizenga, C. Observations of upper-extremity skin temperature and corresponding overall-body thermal sensations and comfort. Build. Environ. 2007, 42, 3933–3943. [Google Scholar] [CrossRef]
- Prek, M.; Butala, V. Comparison between Fanger’s thermal comfort model and human exergy loss. Energy 2017, 138, 228–237. [Google Scholar] [CrossRef]
- Meade, R.D.; Akerman, A.P.; Notley, S.R.; Kirby, N.V.; Sigal, R.J.; Kenny, G.P. Exploring the contribution of inter-individual factors to the development of physiological heat strain in older adults exposed to simulated indoor overheating. Appl. Physiol. Nutr. Metab. 2024, 49, 1252–1270. [Google Scholar] [CrossRef]
- Frontczak, M.; Wargocki, P. Literature survey on how different factors influence human comfort in indoor environments. Build. Environ. 2011, 46, 922–937. [Google Scholar] [CrossRef]
- Akimoto, T.; Tanabe, S.i.; Yanai, T.; Sasaki, M. Thermal comfort and productivity-Evaluation of workplace environment in a task conditioned office. Build. Environ. 2010, 45, 45–50. [Google Scholar] [CrossRef]
- Scislo, L.; Szczepanik-Scislo, N. Near Real-Time Access Monitoring Based on IoT Dynamic Measurements of Indoor Air Pollutant. In Proceedings of the 2023 IEEE 12th International Conference on Intelligent Data Acquisition and Advanced Computing Systems: Technology and Applications (IDAACS), Dortmund, Germany, 7–9 September 2023; Volume 1, pp. 729–734. [Google Scholar] [CrossRef]
- Sim, J.K.; Yoon, S.; Cho, Y.H. Wearable sweat rate sensors for human thermal comfort monitoring. Sci. Rep. 2018, 8, 1181. [Google Scholar] [CrossRef]
- Mills, E. Building commissioning: A golden opportunity for reducing energy costs and greenhouse gas emissions in the United States. Energy Effic. 2011, 4, 145–173. [Google Scholar] [CrossRef]
- Leaman, A.; Bordass, B. Assessing building performance in use 4: The Probe occupant surveys and their implications. Build. Res. Inf. 2001, 29, 129–143. [Google Scholar] [CrossRef]
- Vischer, J.C. Towards an environmental psychology of workspace: How people are affected by environments for work. Archit. Sci. Rev. 2008, 51, 97–108. [Google Scholar] [CrossRef]
- Altomonte, S.; Schiavon, S. Occupant satisfaction in LEED and non-LEED certified buildings. Build. Environ. 2013, 68, 66–76. [Google Scholar] [CrossRef]
- Bronzino, J.D. Medical Devices and Systems, 3rd ed.; Taylor & Francis: Boca Raton, FL, USA, 2006. [Google Scholar]
- Ng, E.Y.K. Is thermal scanner losing its bite in mass screening of fever due to SARS? Med. Phys. 2005, 32, 93–97. [Google Scholar] [CrossRef] [PubMed]
- LS, C. Screening for fever by remote-sensing infrared thermo graphic camera. J. Travel Med. 2004, 11, 273–279. [Google Scholar]
- Hausfater, P.; Zhao, Y.; Defrenne, S.; Bonnet, P.; Riou, B. Cutaneous infrared thermometry for detecting febrile patients. Emerg. Infect. Dis. 2008, 14, 1255. [Google Scholar] [CrossRef]
- Chiu, W.; Lin, P.; Chiou, H.; Lee, W.; Lee, C.; Yang, Y.; Lee, H.; Hsieh, M.; Hu, C.; Ho, Y.; et al. Infrared thermography to mass-screen suspected SARS patients with fever. Asia Pac. J. Public Health 2005, 17, 26–28. [Google Scholar] [CrossRef]
- Bitar, D.; Goubar, A.; Desenclos, J. InternatIonal travels and fever screenIng durIng epIdemIcs: And potentIal use of non-contact Infrared thermometers. Surveill. Outbreak Rep. 2008, 2009, 137. [Google Scholar]
- King, D.E. dlib C++ Library. 2024. Available online: https://dlib.net/ (accessed on 3 July 2025).
- Wright, L. PyThermalCamera. 2023. Available online: https://github.com/leswright1977/PyThermalCamera (accessed on 6 July 2025).
- Schweiker, M.; Ampatzi, E.; Andargie, M.S.; Andersen, R.K.; Azar, E.; Barthelmes, V.M.; Berger, C.; Bourikas, L.; Carlucci, S.; Chinazzo, G.; et al. Review of multi-domain approaches to indoor environmental perception and behaviour. Build. Environ. 2020, 176, 106804. [Google Scholar] [CrossRef]
- Zhai, Y.; Zhang, Y.; Zhang, H.; Pasut, W.; Arens, E.; Meng, Q. Human comfort and perceived air quality in warm and humid environments with ceiling fans. Build. Environ. 2015, 90, 178–185. [Google Scholar] [CrossRef]
- TOPDON. TS001 Product Profile. Available online: https://web-file.topdon.com/topdon-web/information_download/TS001-Product-Profile.pdf (accessed on 22 July 2025).
- Kim, J.; Zhou, Y.; Schiavon, S.; Raftery, P.; Brager, G. Personal comfort models: Predicting individuals’ thermal preference using occupant heating and cooling behavior and machine learning. Build. Environ. 2018, 129, 96–106. [Google Scholar] [CrossRef]
- Zhang, H.; Arens, E.; Huizenga, C.; Han, T. Thermal sensation and comfort models for non-uniform and transient environments: Part I: Local sensation of individual body parts. Build. Environ. 2010, 45, 380–388. [Google Scholar] [CrossRef]
- Bavaresco, M.; Geraldi, M.S.; de Souza, L.P.; Bracht, M.K.; Melo, A.P. Impacts of Personalized Environmental Control Systems on human psychophysiological responses to outdoor-to-indoor transitions in summer. Build. Environ. 2025, 283, 113421. [Google Scholar] [CrossRef]
- Zhe, W.; Richard, d.; Maohui, L.; Borong, L.; Yingdong, H.; Ali, G.; Yingxin, Z. Individual difference in thermal comfort: A literature review. Build. Environ. 2018, 138, 113421. [Google Scholar] [CrossRef]


Disclaimer/Publisher’s Note: The statements, opinions and data contained in all publications are solely those of the individual author(s) and contributor(s) and not of MDPI and/or the editor(s). MDPI and/or the editor(s) disclaim responsibility for any injury to people or property resulting from any ideas, methods, instructions or products referred to in the content. |
© 2025 by the authors. Licensee MDPI, Basel, Switzerland. This article is an open access article distributed under the terms and conditions of the Creative Commons Attribution (CC BY) license (https://creativecommons.org/licenses/by/4.0/).