Article

Experimental and Regression Modeling of Short-Term Flexural Behavior of Steel- and GFRP-Reinforced Early-Age Concrete Beams

by
Muhammet Karabulut
Department of Civil Engineering, Zonguldak Bulent Ecevit University, Zonguldak 67100, Turkey
Buildings 2025, 15(22), 4049; https://doi.org/10.3390/buildings15224049
Submission received: 16 October 2025 / Revised: 3 November 2025 / Accepted: 8 November 2025 / Published: 10 November 2025
(This article belongs to the Section Building Structures)

Abstract

To address the problem of corrosion, glass fiber-reinforced polymer (GFRP) bars have been introduced as a viable alternative to conventional steel reinforcement in concrete structures. While extensive research has been conducted on the flexural behavior of RC beams reinforced with steel and GFRP bars over both normal-term and long-term periods, studies focusing on fresh concrete beams are almost non-existent. Consequently, this research investigates the impact of steel and GFRP longitudinal reinforcement, as well as the influence of varying concrete compressive strengths, on the flexural behavior of RC beams. The study employs 3-point bending experiments and machine learning (ML) predictive analyses. Specifically, the short-term (fresh) concrete reinforcement compatibility and the effects of steel and GFRP bar reinforcements on beam flexural behavior were examined across three concrete compressive strength categories: low (C25), moderate (C35), and high (C50). A notable contribution of this research is the application of different ML regression models, utilizing Python’s library, for deflection prediction of RC beams. The failure mechanisms of the beams under static loading conditions were analyzed, revealing that composite bar RC beams failed through flexural cracking and demonstrated ductile behavior, whereas steel bar RC beams exhibited brittle failure characterized by shear cracks and sudden failure modes. The ML regression models successfully predicted the deflection values of RC beams under ultimate loads, achieving an average accuracy of 91.3%, which was deemed highly satisfactory. Among the 18 beams tested, the highest ultimate load was obtained for the SC50-1 beam at 87.46 kN. In contrast, while the steel-reinforced beams exhibited higher load-bearing capacities, it was observed that the GFRP-reinforced beams showed greater deflection and ductility, particularly in beams with low and medium concrete strengths. Based on these findings, it is recommended that the Gradient Boosting Regressor, an AI regression model, be utilized to guide researchers in evaluating the load-carrying and bending capacity of structural beam elements.

1. Introduction

Predicting the load–deflection behavior of reinforced concrete (RC) beams has long been a focal area of research, encompassing both controlled experimental studies and advanced computational modeling. Corrosion of steel reinforcement remains one of the primary causes of strength degradation in RC systems; although several mitigation strategies have been proposed, they are often costly and may not guarantee long-term durability. These challenges have driven growing interest in corrosion-resistant alternatives such as fiber-reinforced polymer (FRP) bars, with glass fiber-reinforced polymer (GFRP) in particular offering advantageous tensile properties and excellent chemical stability. While numerous studies have examined FRP-reinforced structural members under various conditions, the short-term (early-age) flexural performance of beams cast with fresh concrete has not been adequately investigated.
Alsayed [1] investigated the structural behavior of glass fiber-reinforced concrete beams. Load–deflection test results obtained from twelve GFRP-reinforced beams were compared with predictions made using the ACI model. It was found that the ACI model’s estimation of service-load deflection for GFRP-reinforced beams deviated by approximately 70% from the experimental observations.
Methods to prevent, delay, or repair the loss of strength in steel reinforcement caused by corrosion are often expensive and do not guarantee long-term effectiveness [2]. The most effective approach to eliminate the corrosion problem is the use of fiber-reinforced polymers (FRPs) as a substitute for steel reinforcement, since it is impossible to control environmental factors such as water, moisture, and oxygen.
Shear behavior of FRP-reinforced concrete beams under ultra-high concrete compressive strength was investigated [3,4,5]. All ultra-high-strength concrete beams exhibited shear failure modes and demonstrated greater shear capacity, deformation capacity, and stiffness compared to high-strength concrete beams. The use of basalt FRP stirrups proved effective in reducing the width of diagonal shear cracks and enhancing the ultimate shear capacity of the tested beams.
The shear strength of CFRP-reinforced concrete beams under unsymmetrical loading was investigated with nonlinear finite element analysis using the ANSYS version 14.5 program [6]. It was emphasized in this study that the finite element results were quite consistent with the measured experimental results. It has been argued that the maximum load–deflection responses of reinforced concrete beams can be predicted with the finite element model.
The load–deflection behavior of GFRP reinforcement deep-reinforced concrete beams was investigated by the experimental bending test [7,8]. It was found that normalized shear stress reduces as the depth of the beam increases. In the final stage, shear deformations were found to be 42% to 58% of the total deflection. It was demonstrated that the ultimate load capacity of reinforced concrete beams exposed to fire decreased; however, there was no change in the initial stiffness of the beams.
The relationship between deflection and crack mouth displacement of fiber and non-fiber self-compacting concrete beams was studied [9,10]. A good consistency was found between the proposed model and the test outcomes.
The load–deflection behavior of reinforced concrete beams with iron and GFRP composite reinforcement was investigated by mixing old tires into the concrete [11,12,13]. In this environmentally friendly research, it was determined that GFRP bar-reinforced concrete beams using rubber increased the load-carrying capacity more than iron-reinforced beams.
The flexural behavior of recycled aggregate concretes was investigated for iron and GFRP bar-reinforced beams [14]. Experimental load–deflection curves and ultimate failure modes of normal and recycled concrete beams gave similar results, indicating that recycled concrete can be reused. It has been shown that existing approaches can accurately predict crack widths of GFRP bar-reinforced recycled concrete beams within the serviceability limit but cannot be implemented at higher load levels.
The crack width and deflection performance behaviors of GFRP-reinforced concrete beams were investigated experimentally and numerically [15]. The load–deflection relationships of the high-strength concrete beams behaved linearly without any decrease in stiffness until failure. Nevertheless, normal-strength concrete beams behaved linearly up to 70–80% of the moment capacity, but after this point, the stiffness began to decrease until the concrete crushed.
Experimental and numerical investigation of the flexural behavior of reinforced concrete beams allowed us to compare iron and GFRP composite bars [16,17,18]. Load–deflection and fracture behaviors of reinforced concrete beams were investigated in these studies, and we aimed to predict and verify load–deflection curves with finite element models. The flexural behavior of various special beams, such as reinforced concrete T-beams and deep beams, has also been investigated, and experimental and numerical results obtained [19,20,21,22,23].
Studies have been conducted on the long-term bending behavior of reinforced concrete beams [24,25,26,27,28,29,30]. The long-term behavior of reinforced concrete beams under loads is determined and studied by fatigue analysis.
The short-term structural behavior of GFRP-reinforced concrete beams was studied experimentally [31,32,33,34]. The short-term behavior of FRP bar-reinforced concrete beams has been studied insufficiently. More research is needed on this issue.
Machine learning methods, which are quite limited, have been investigated to predict the performance of structural concrete members reinforced with steel- and fiber-reinforced polymers [35,36,37]. In addition to different strengthening techniques such as BFRP wrapping and externally bonded FRP, the flexural behavior of reinforced concrete beams with varying reinforcement types and concrete strength classes was also analyzed using machine learning methods [38,39,40,41,42]. The advancement in the GFRP technology review explores various fiber types, encompassing both synthetic fibers—such as glass, carbon, and aramid—and natural fibers, with an emphasis on their improved mechanical and functional properties achieved through advanced processing techniques. The fabrication of FRP composites is carried out using well-established methods like hand lay-up, compression molding, and pultrusion, as well as emerging technologies such as additive manufacturing, which have greatly accelerated the development of these materials. Moreover, the integration of nanomaterials has revolutionized FRP composites by enhancing their mechanical strength, interfacial adhesion, and energy absorption capacity [43,44]. The temperature resistance and performance of the GFRP reinforcements used have also been investigated for fire conditions, and they were found to exhibit effective performance [45]. In this study, the effect of GFRP bars produced by the pultrusion technique on the flexural behavior of beams with low, medium, and high concrete compressive strengths was investigated for beams cast with fresh concrete. This study investigates the behavior of GFRP-reinforced concrete elements under conditions where the construction process progresses rapidly. By examining the influence of material strength, it sheds light on this aspect and, unlike previous studies in the literature, explores the application and performance of reinforcement bars produced using the advanced GFRP pultrusion technique.
Recently it has been seen that owing to the developing and innovative technology, difficult and time-consuming experimental results can be predicted very quickly and consistently with the machine learning method. The effectiveness of using machine learning models in the load–deflection analysis of reinforced concrete beams becomes more evident when the obtained results are examined. It is observed that in a few beams, some analysis results fall below 80% accuracy. However, it should be noted that this discrepancy may not stem from the ML model itself but rather from the non-homogeneous nature of concrete—such as the presence of voids, increased heterogeneity in the material, and/or workmanship or construction defects.
It is evident from the completed studies that the machine learning analysis results obtained in this research are highly consistent and satisfactory, showing an accuracy of approximately 80% or higher when compared with similar studies on reinforced concrete beams in the literature [39,40,41,42].
In the machine learning analyses conducted in this study, thousands—and in some cases tens of thousands—of data rows were utilized for each analysis, which constitutes one of the most critical factors influencing the proper functioning of ML models. The limitation of ML models can be expressed in terms of insufficient data availability; when adequate learning and testing cannot be performed due to limited data, the models are expected to exhibit inconsistent performance, which is indeed likely under such constraints.
A review of the existing literature indicates that conventional steel reinforcements and various types of FRP reinforcements have been extensively analyzed from multiple perspectives. However, the behavior of fresh reinforced concrete beams has not been sufficiently investigated in the context of rapid construction processes, and this study is believed to contribute to addressing this gap in the literature. Owing to the advancement of emerging and innovative technologies, AI-based ML models now enable rapid computation and analysis in the field of structural engineering, providing highly satisfactory agreement with experimental results and thereby confirming their consistency. This study also highlights the crucial importance of incorporating and applying these technological structural safety assessment methods in future research.
As a result of comprehensive and detailed literature research, it is determined that there is not enough research using experimental and machine learning methods on the load–deflection behavior of fresh reinforced concrete beams. In this research, the early-stage behavior of steel- and GFRP bar-reinforced concrete beams at different concrete compressive strengths is investigated by machine learning analysis and experimentally with a total of 18 beams. In the study, concrete compressive strengths are examined, such as low C25 MPa, medium C35 MPa, and high C50 MPa. In total, nine GFRP and nine steel-reinforced concrete beams in three categories were tested according to concrete strength groups. Machine learning analyses, which represent a sub-branch of artificial intelligence, are performed by using the Python version 3.12 programming language and the Pycaret library to estimate the load–deflection graph of reinforced concrete beams.

2. Experimental Investigation

In this section, three-point bending tests are carried out for steel and GFRP bar reinforcement materials in reinforced concrete beams and for varied concrete compressive strength series: low C25, medium C35, and high C50. Schematic and photographic views of the experiments performed are presented in Figure 1. A total of 18 reinforced concrete beams are tested.
The three-point bending test method, bending moment–strength–stress, deflection, and details for a rectangular cross-section beam are presented below. Bending strength is the highest stress at the moment of rupture. In the equations, F denotes the total load applied over the beam span. Deflection (Δ) is dependent upon not only the material but also the configuration of the cross-section and unsupported length. The load–displacement response shows wide variation in many aspects, such as ductility, linear nonlinear area on the graph, and failure displacement. The max bending stress ( σ m a x ) , max bending moment ( M m a x ), max shear stress for solid section ( τ m a x ), and moment of inertia (I) formulas are presented in Equations (1)–(4).
σ m a x = M c I = 3 F L 2 w h 2
M m a x = F L 4
τ m a x = 3 F 2 w h
I s o l i d = b h 3 12
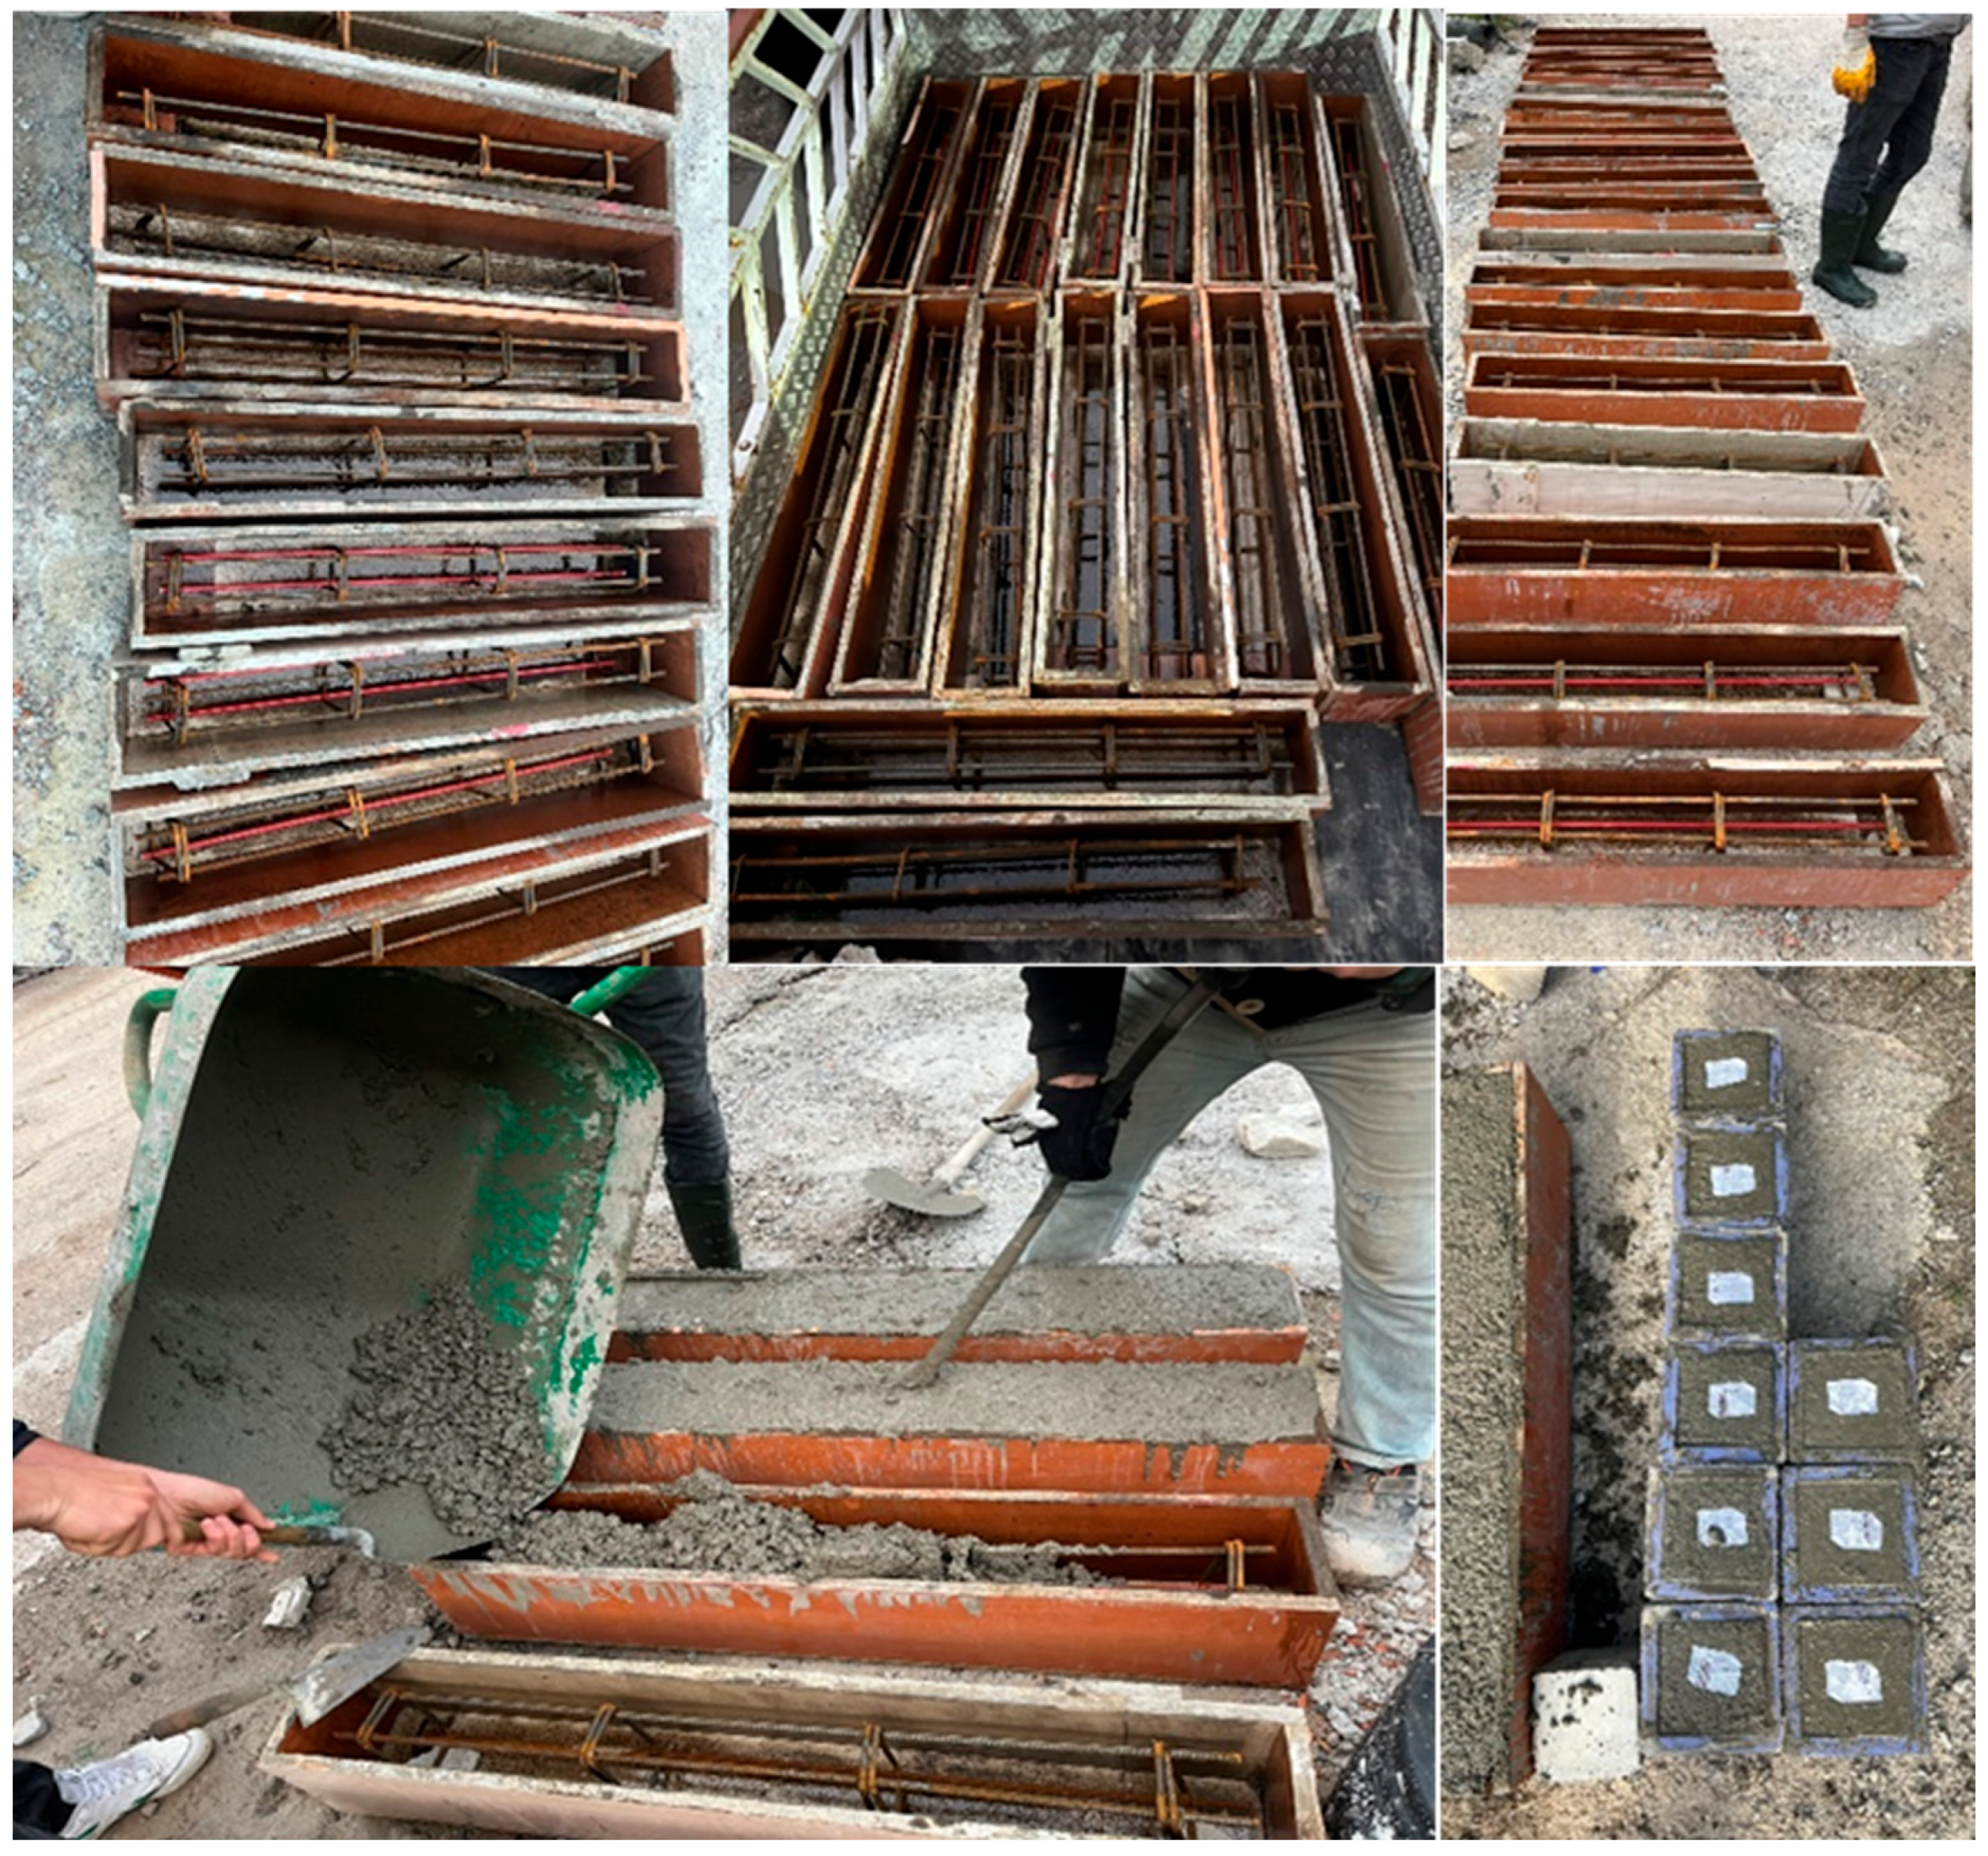
Six samples each were produced from the C25, C35, and C50 beam series for beams with low, medium, and high concrete compressive strength, respectively. While 3 of the 6 beams in each series produced are steel-reinforced, the other 3 beams are GFRP bar-reinforced. The purpose of the study carried out with this technique is to analyze the compatibility of steel and GFRP bar reinforcements in beams with low, medium, and high concrete compressive strengths according to the concrete class for the early period after a 7-day curing period. The 18 beams produced are geometrically identical and have a width of 150 mm, a depth of 200 mm, and a length of 1100 mm. The effect of GFRP composite reinforcement on the structural behavior of the beams produced compared to steel reinforcement was carried out by changing the longitudinal reinforcements in the principal tension zone. Another important issue is the reinforcement ratio; the number of steel and GFRP longitudinal reinforcements in reinforced concrete beams is 2, and the rebar diameters are equal and 10 mm. The longitudinal reinforcements in the compression zone of all reinforced concrete beams are steel reinforcements and comprise 2 pieces of 10 mm diameter. In all reinforced concrete beams, the stirrups have a diameter of 8 mm and are placed on the beams at 30 cm intervals. The concrete cover is produced at 25 mm on all sides around the wrapped area of the reinforced concrete beam. The process of the preparation stages of reinforced concrete beams is presented in Figure 2. The processes of connecting the reinforcement, greasing the wooden molds, placing the reinforcement, pouring the concrete, using the vibrator, and taking fresh concrete cube samples were carried out meticulously. Cube samples with dimensions of 150 × 150 × 150 mm were taken from fresh concrete by compacting with vibrators, with 3 cube samples each for the C25, C35, and C50 concrete compressive strength classes. For each specimen, vibration was carefully applied for at least 2 min to ensure better adhesion between the concrete and the reinforcements and to eliminate air gaps and voids. The average concrete compressive strength results for the concrete cube samples after 7 days of curing were obtained as 33.76 MPa, 39.27 MPa, and 53.76 MPa.
Details of 18 reinforced concrete beams are presented in Table 1. The names of the beams in the 25 MPa, 35 MPa, and 50 MPa series, respectively, are given according to the type of longitudinal reinforcement material in the beam tension region. Composite-reinforced concrete beams are named CC, and steel-reinforced concrete beams are named SC. The “a” value presented in Table 1 represents the distance between the loading point and the supports, while d represents the effective beam depth. Concrete compressive strength averages (fc′) of 7-day concrete cube samples taken from fresh concrete are named in Table 1. Bar details of reinforced concrete beams and geometric properties of the bars are given in Table 2. Beams are classified according to the type of reinforcement material in the tension region of the beam: CC if it is composite GFRP bar material and SC if it is steel bar reinforcement. In all three groups of the series, two longitudinal reinforcements were used in the beam tension zone. Longitudinal reinforcement ratios, beam stirrup diameters, and distances between stirrups are presented in Table 2. Longitudinal reinforcement ratios and stirrup diameters and spacings are presented in Table 2. The stirrups utilized in all beams are produced from steel. Stirrup diameters and spacing in reinforced concrete beams are identical in longitudinal composite- and steel bar-reinforced beams; the 7-day concrete cube sample strengths of low-, medium-, and high-compressive-strength concrete series are given for C25, C35, and C50, respectively.
The “-A” designation for CC25-A and the other specimens denotes the average of the corresponding specimens. In this study, ⍴ denotes the steel reinforcement ratio, ⍴b denotes the balanced steel reinforcement ratio, ⍴f denotes the GFRP reinforcement ratio, and ⍴fb represents the balanced GFRP reinforcement ratio. The mechanical properties of GFRP bars used as longitudinal reinforcement are revealed in Table 3. The diameter, cross-sectional area, test sample lengths, clean span of supports, ultimate failure load, ultimate bending strength, test sample weights, and maximum deflection values of GFRP bars obtained by three-point bending tests under 30.5 Hz loading speed are given in Table 3. The GFRP sample named 10-A is the arithmetic average of the first three samples.
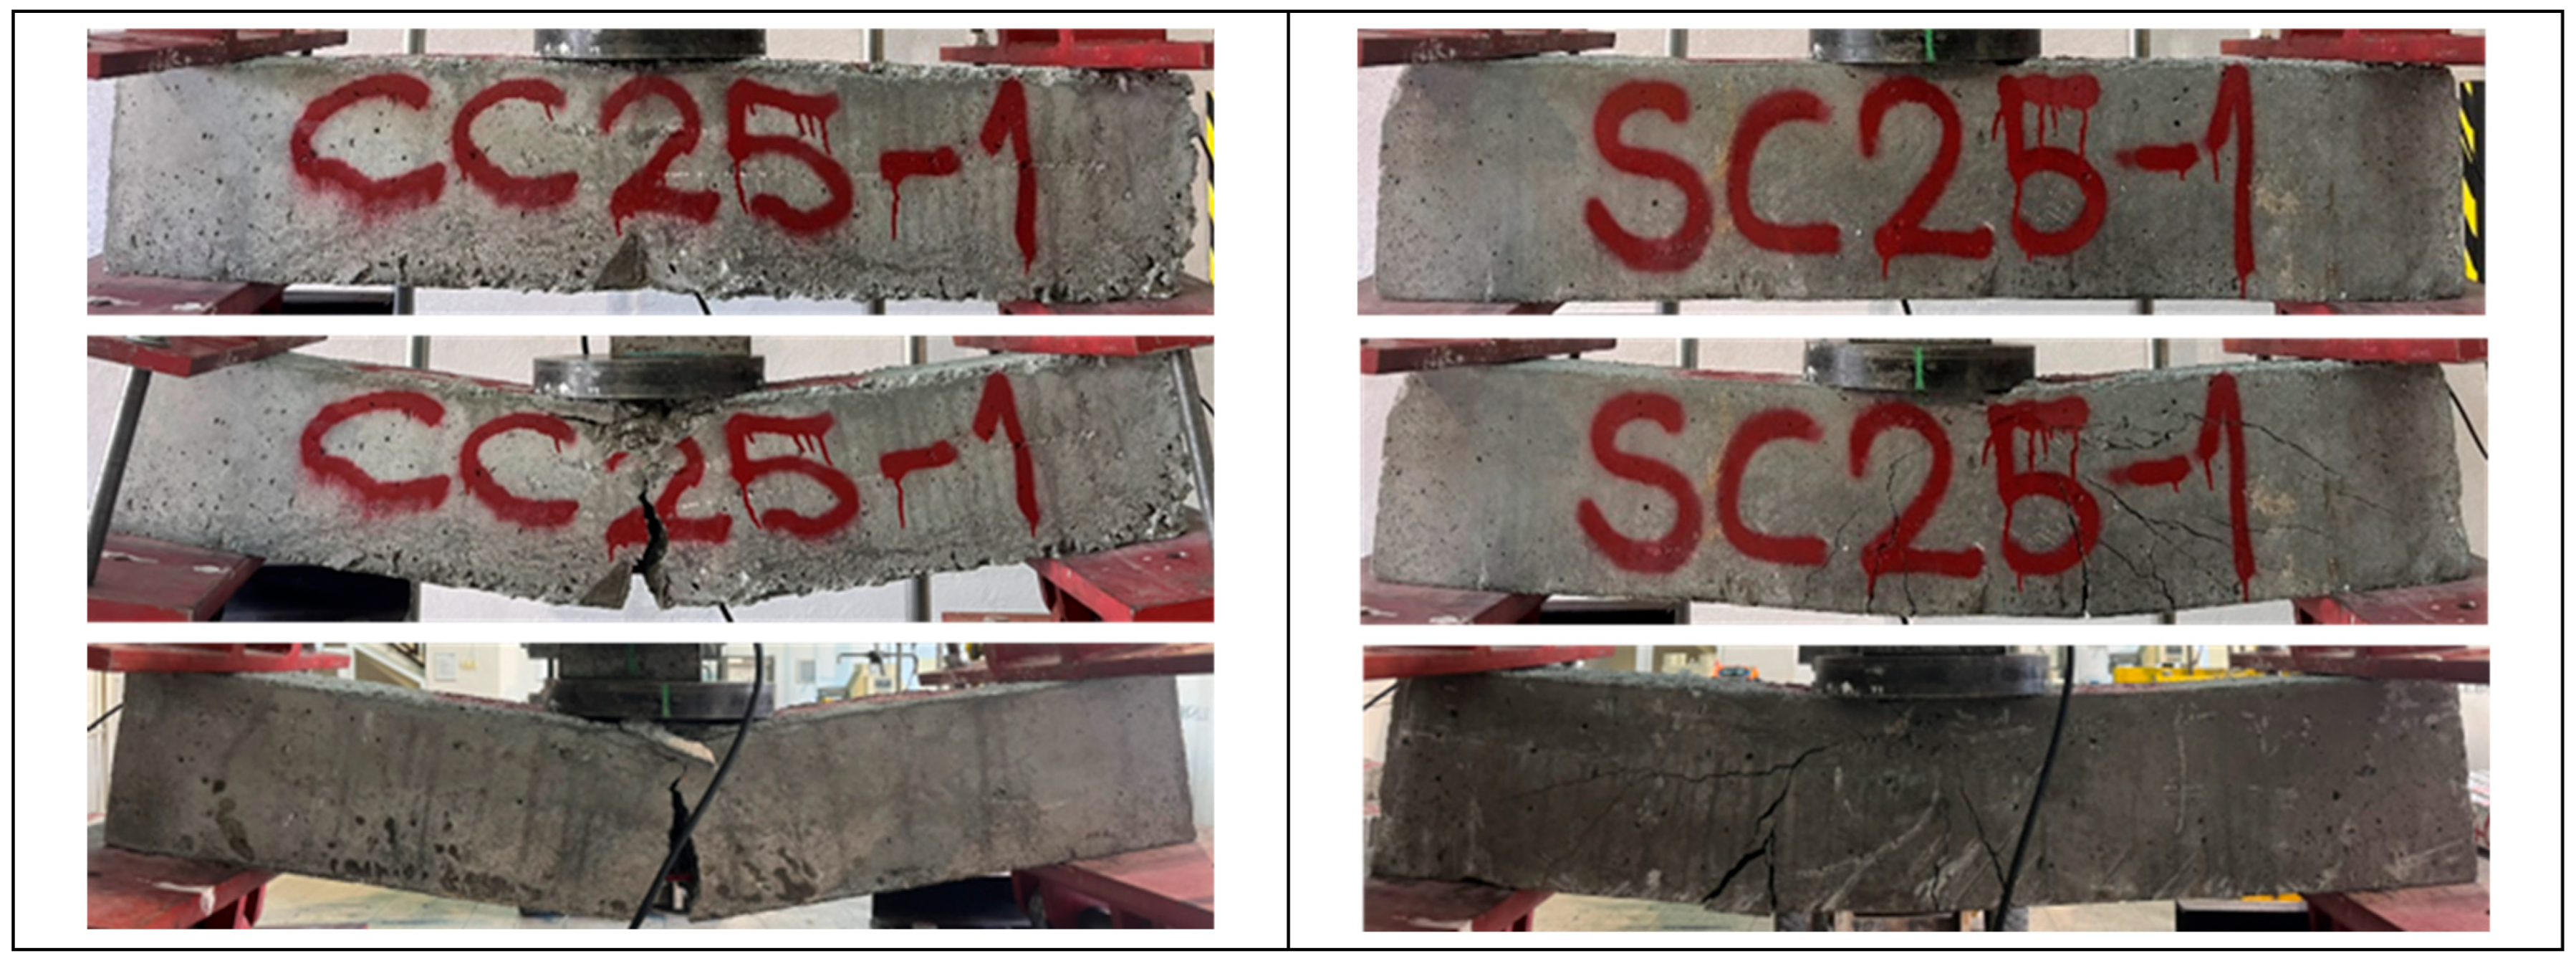
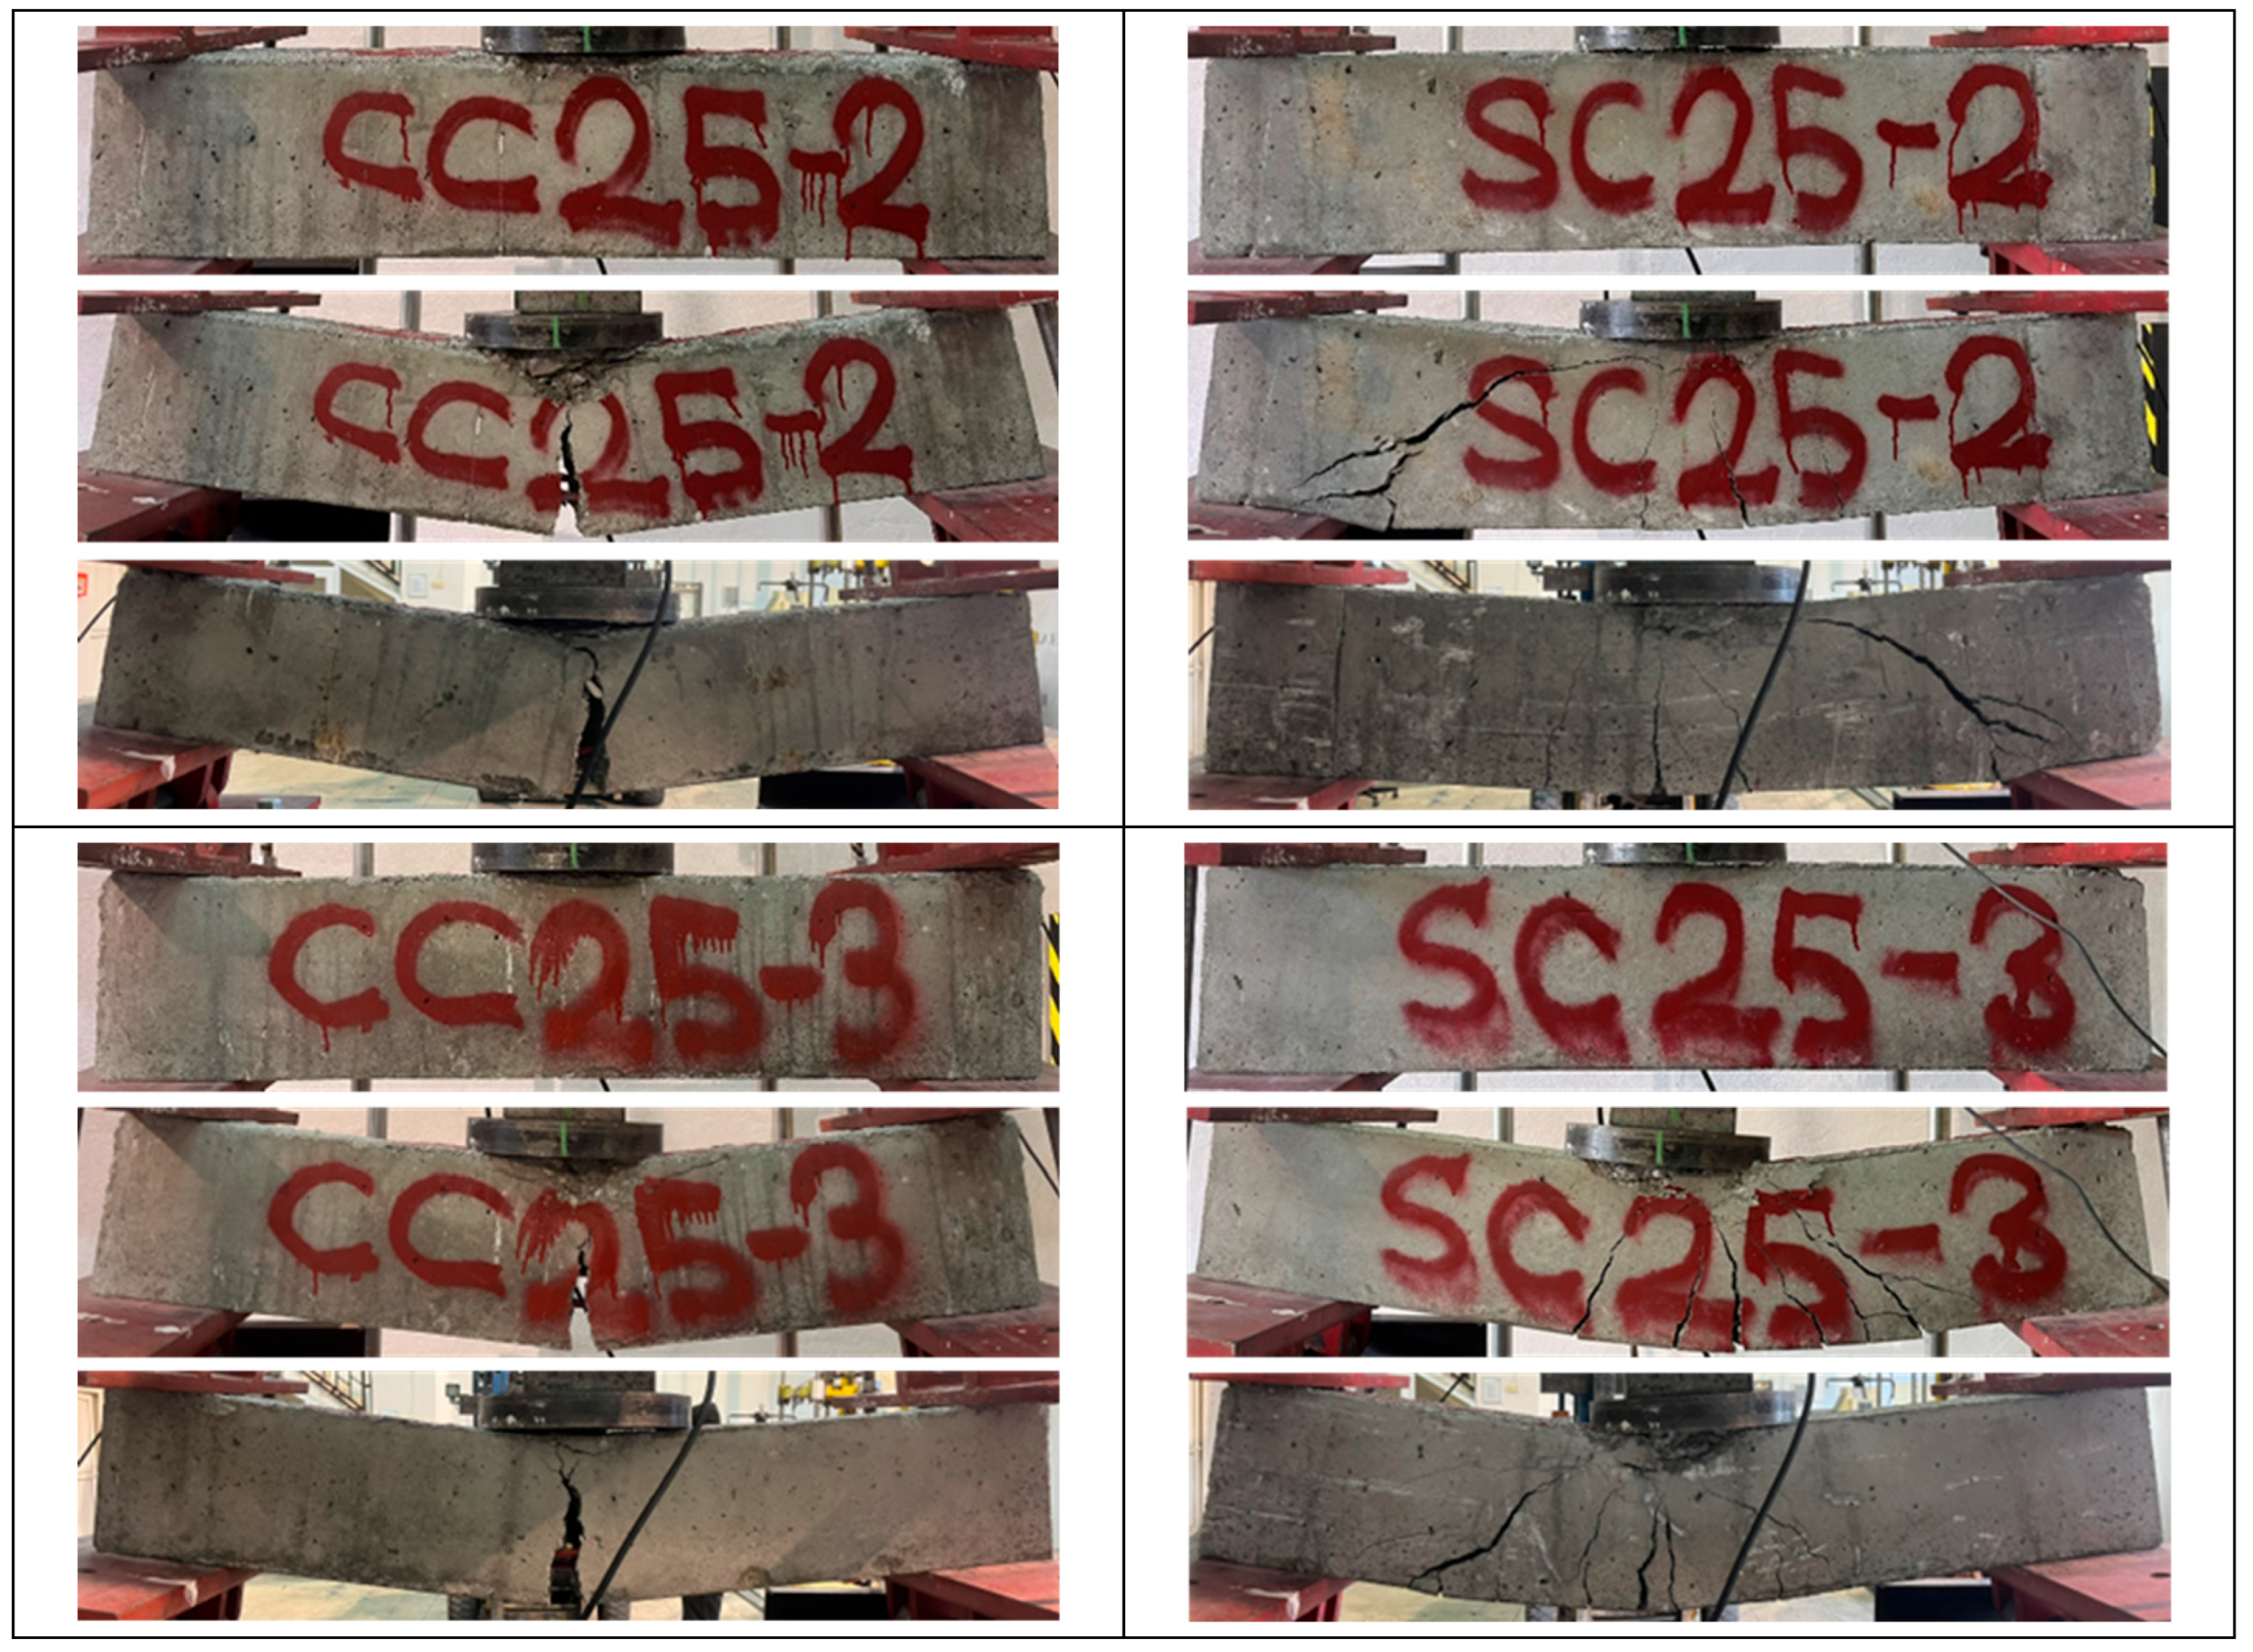
Three-point bending tests of six reinforced concrete beams in the C25 series are presented in Figure 3. Beams are divided into two groups according to whether the longitudinal reinforcement in the tension zones is a GFRP bar or steel bar. Three beams were tested in each group, and the structural behavior and crack formations of the beams were determined according to the reinforcement material and concrete compressive strength category. The C25 concrete beam series is categorized as low-strength concrete in this research. Flexural cracks are observed in all GFRP bar-reinforced beams, which is the desired failure behavior of a structural beam element underload. This means that the structural element exhibits ductile behavior, and a brittle fracture did not occur in the composite-reinforced CC25 low-strength beams. However, for all three of the traditionally utilized steel bar-reinforced beams, the SC25 series beams with low concrete strength demonstrated failure behavior with shear cracks and ruptures and were brittle, which is an undesirable situation.
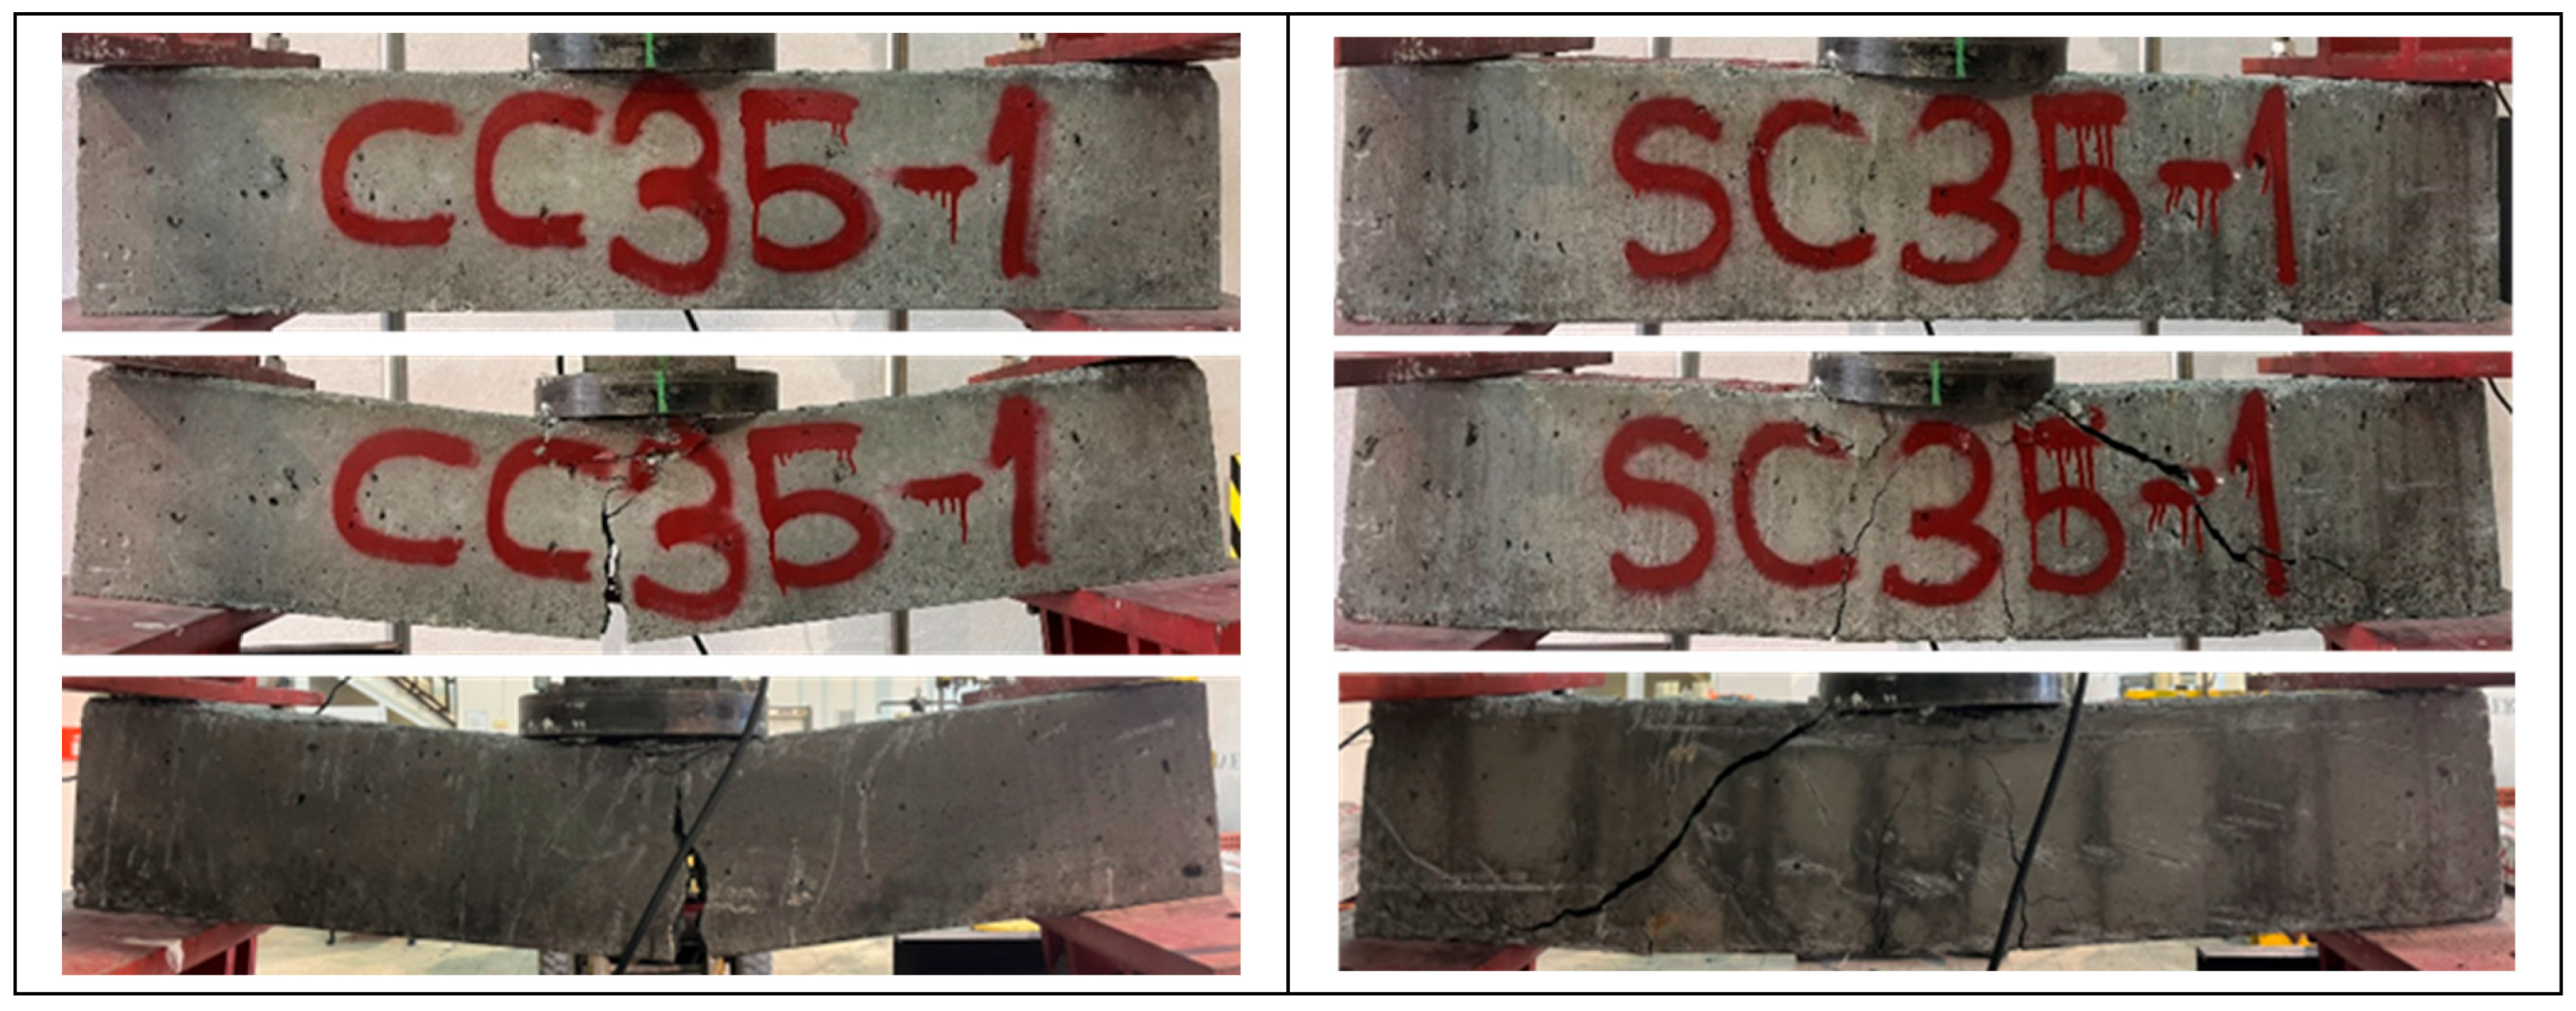
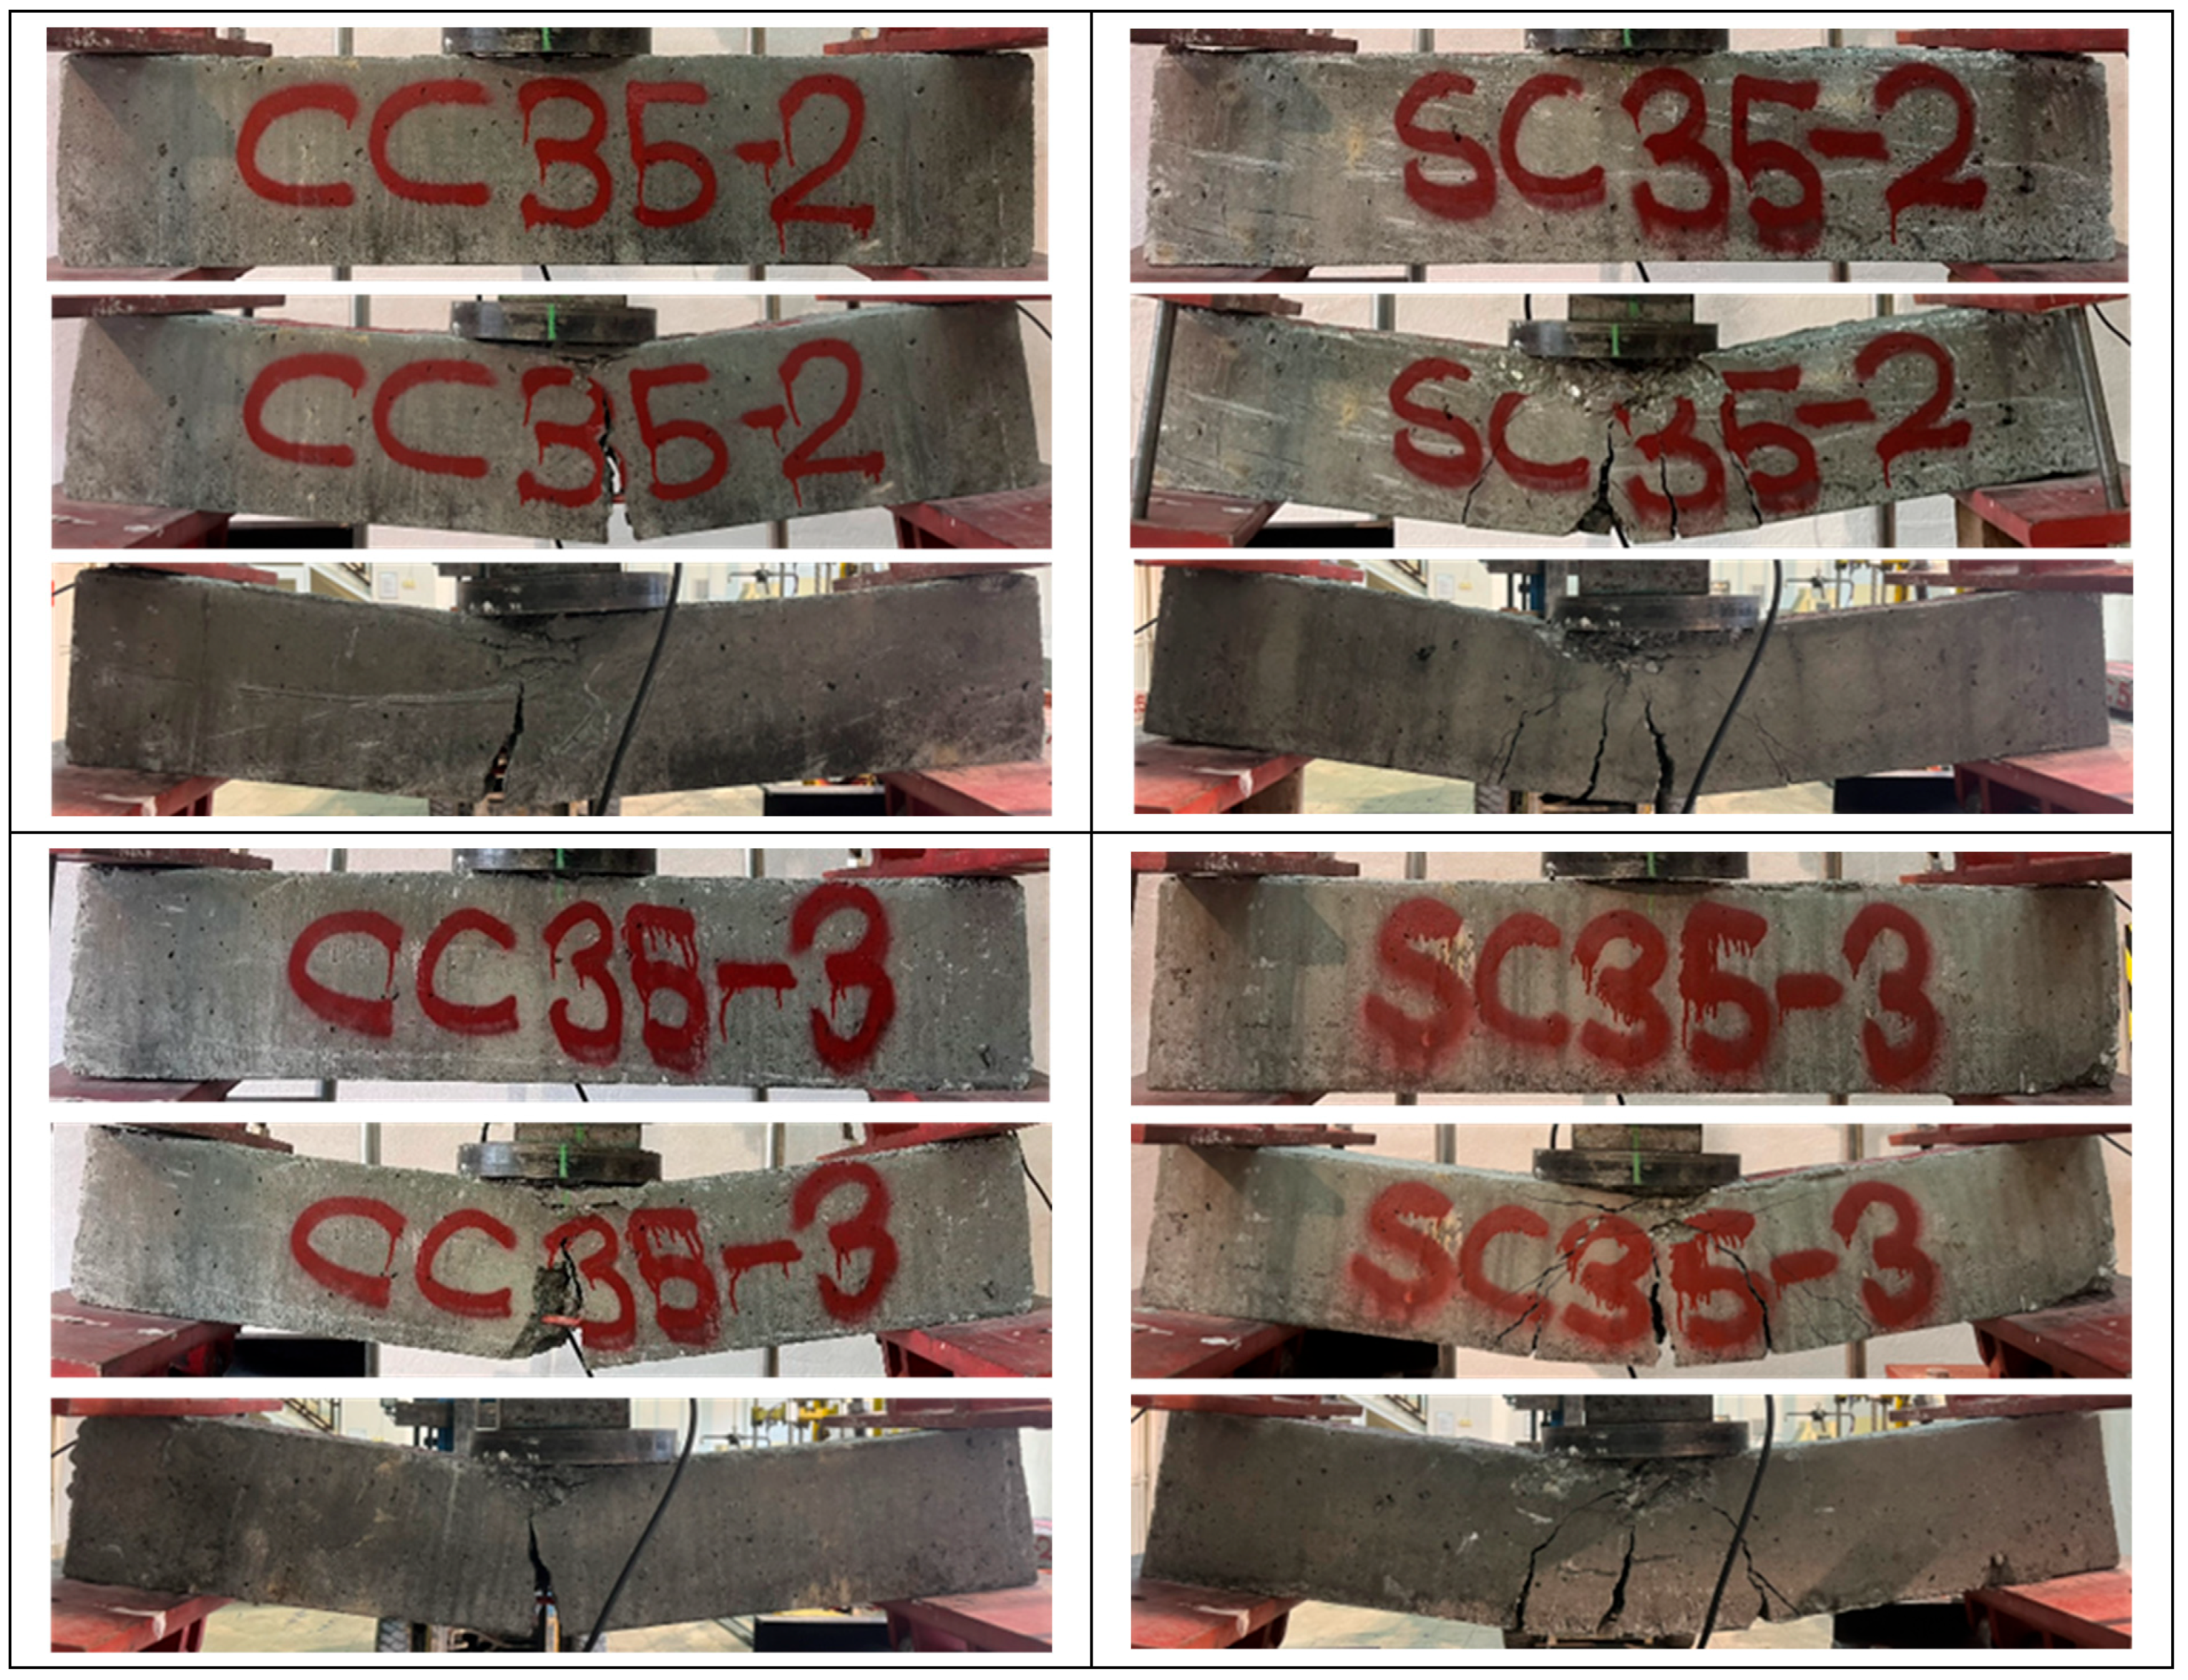
In the C35 series of moderate concrete strength beams, all three of those with GFRP bar composite reinforcement reached their ultimate load-carrying capacity with flexural cracks in Figure 4. While the average deflection values decreased from 71.71 mm in the C25 series to 51.74 mm in the C35 series, the load-carrying capacities of the reinforced concrete beams increased from 27.28 kN to 31.80 kN.
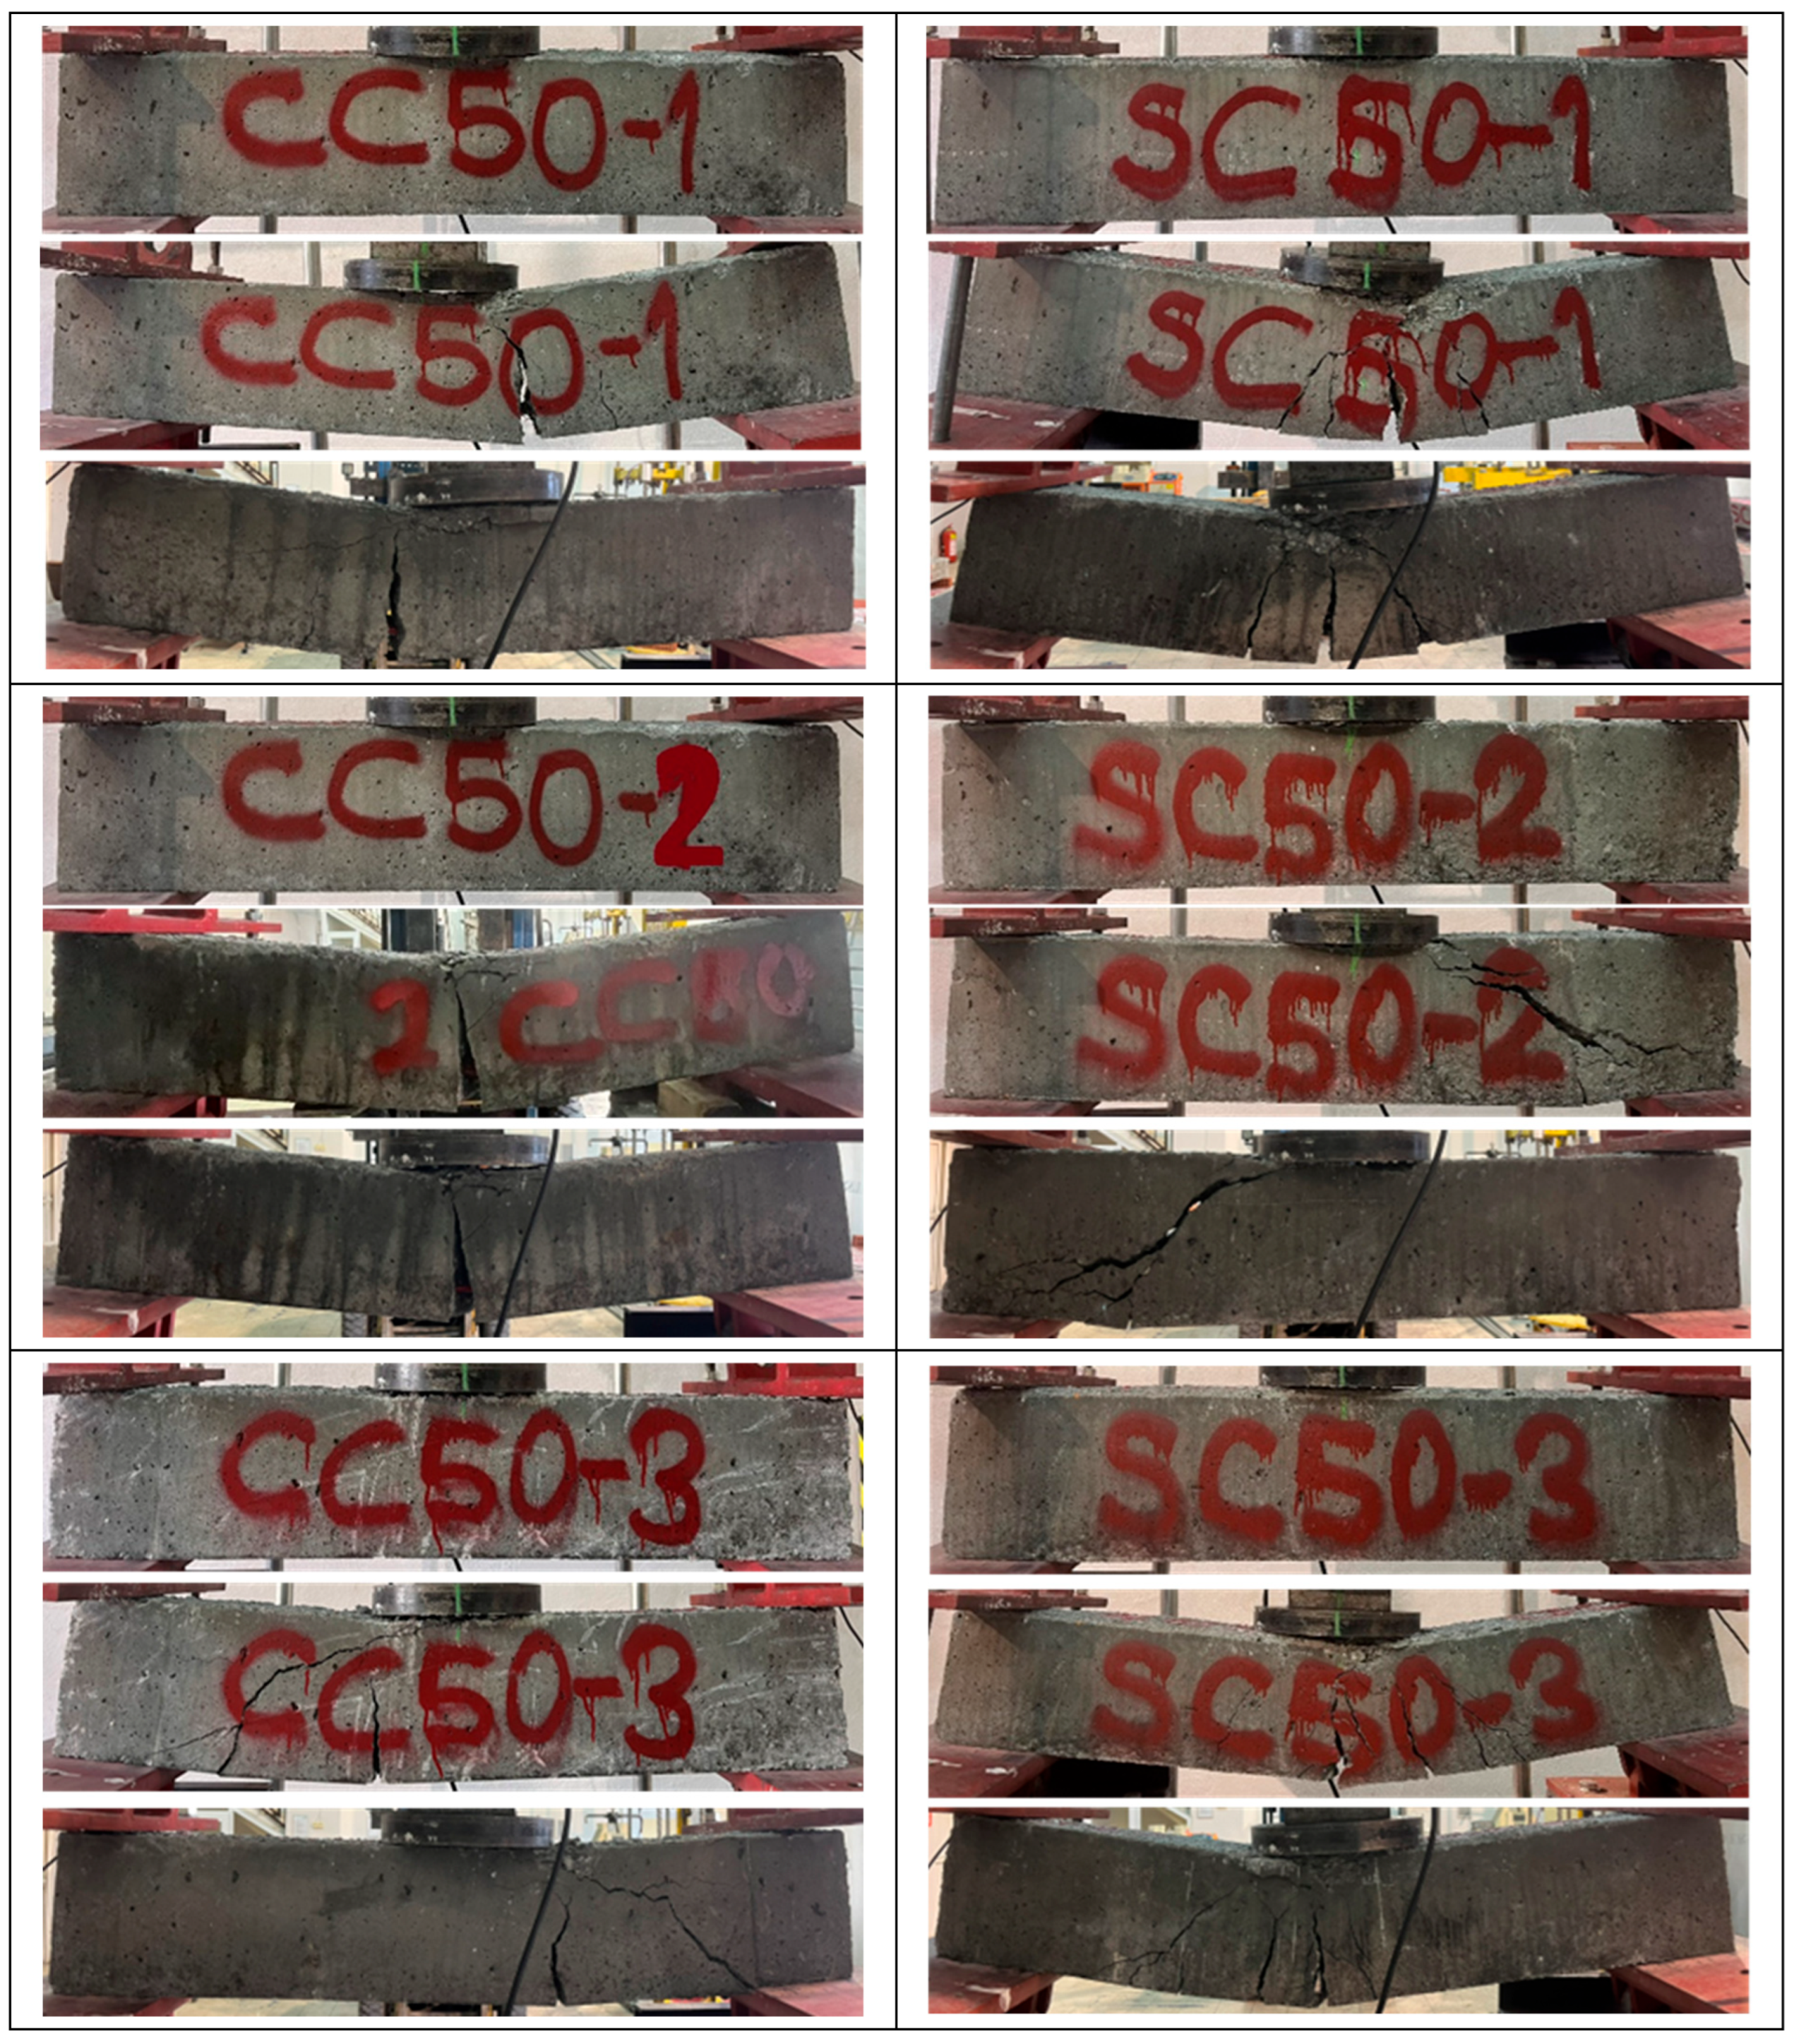
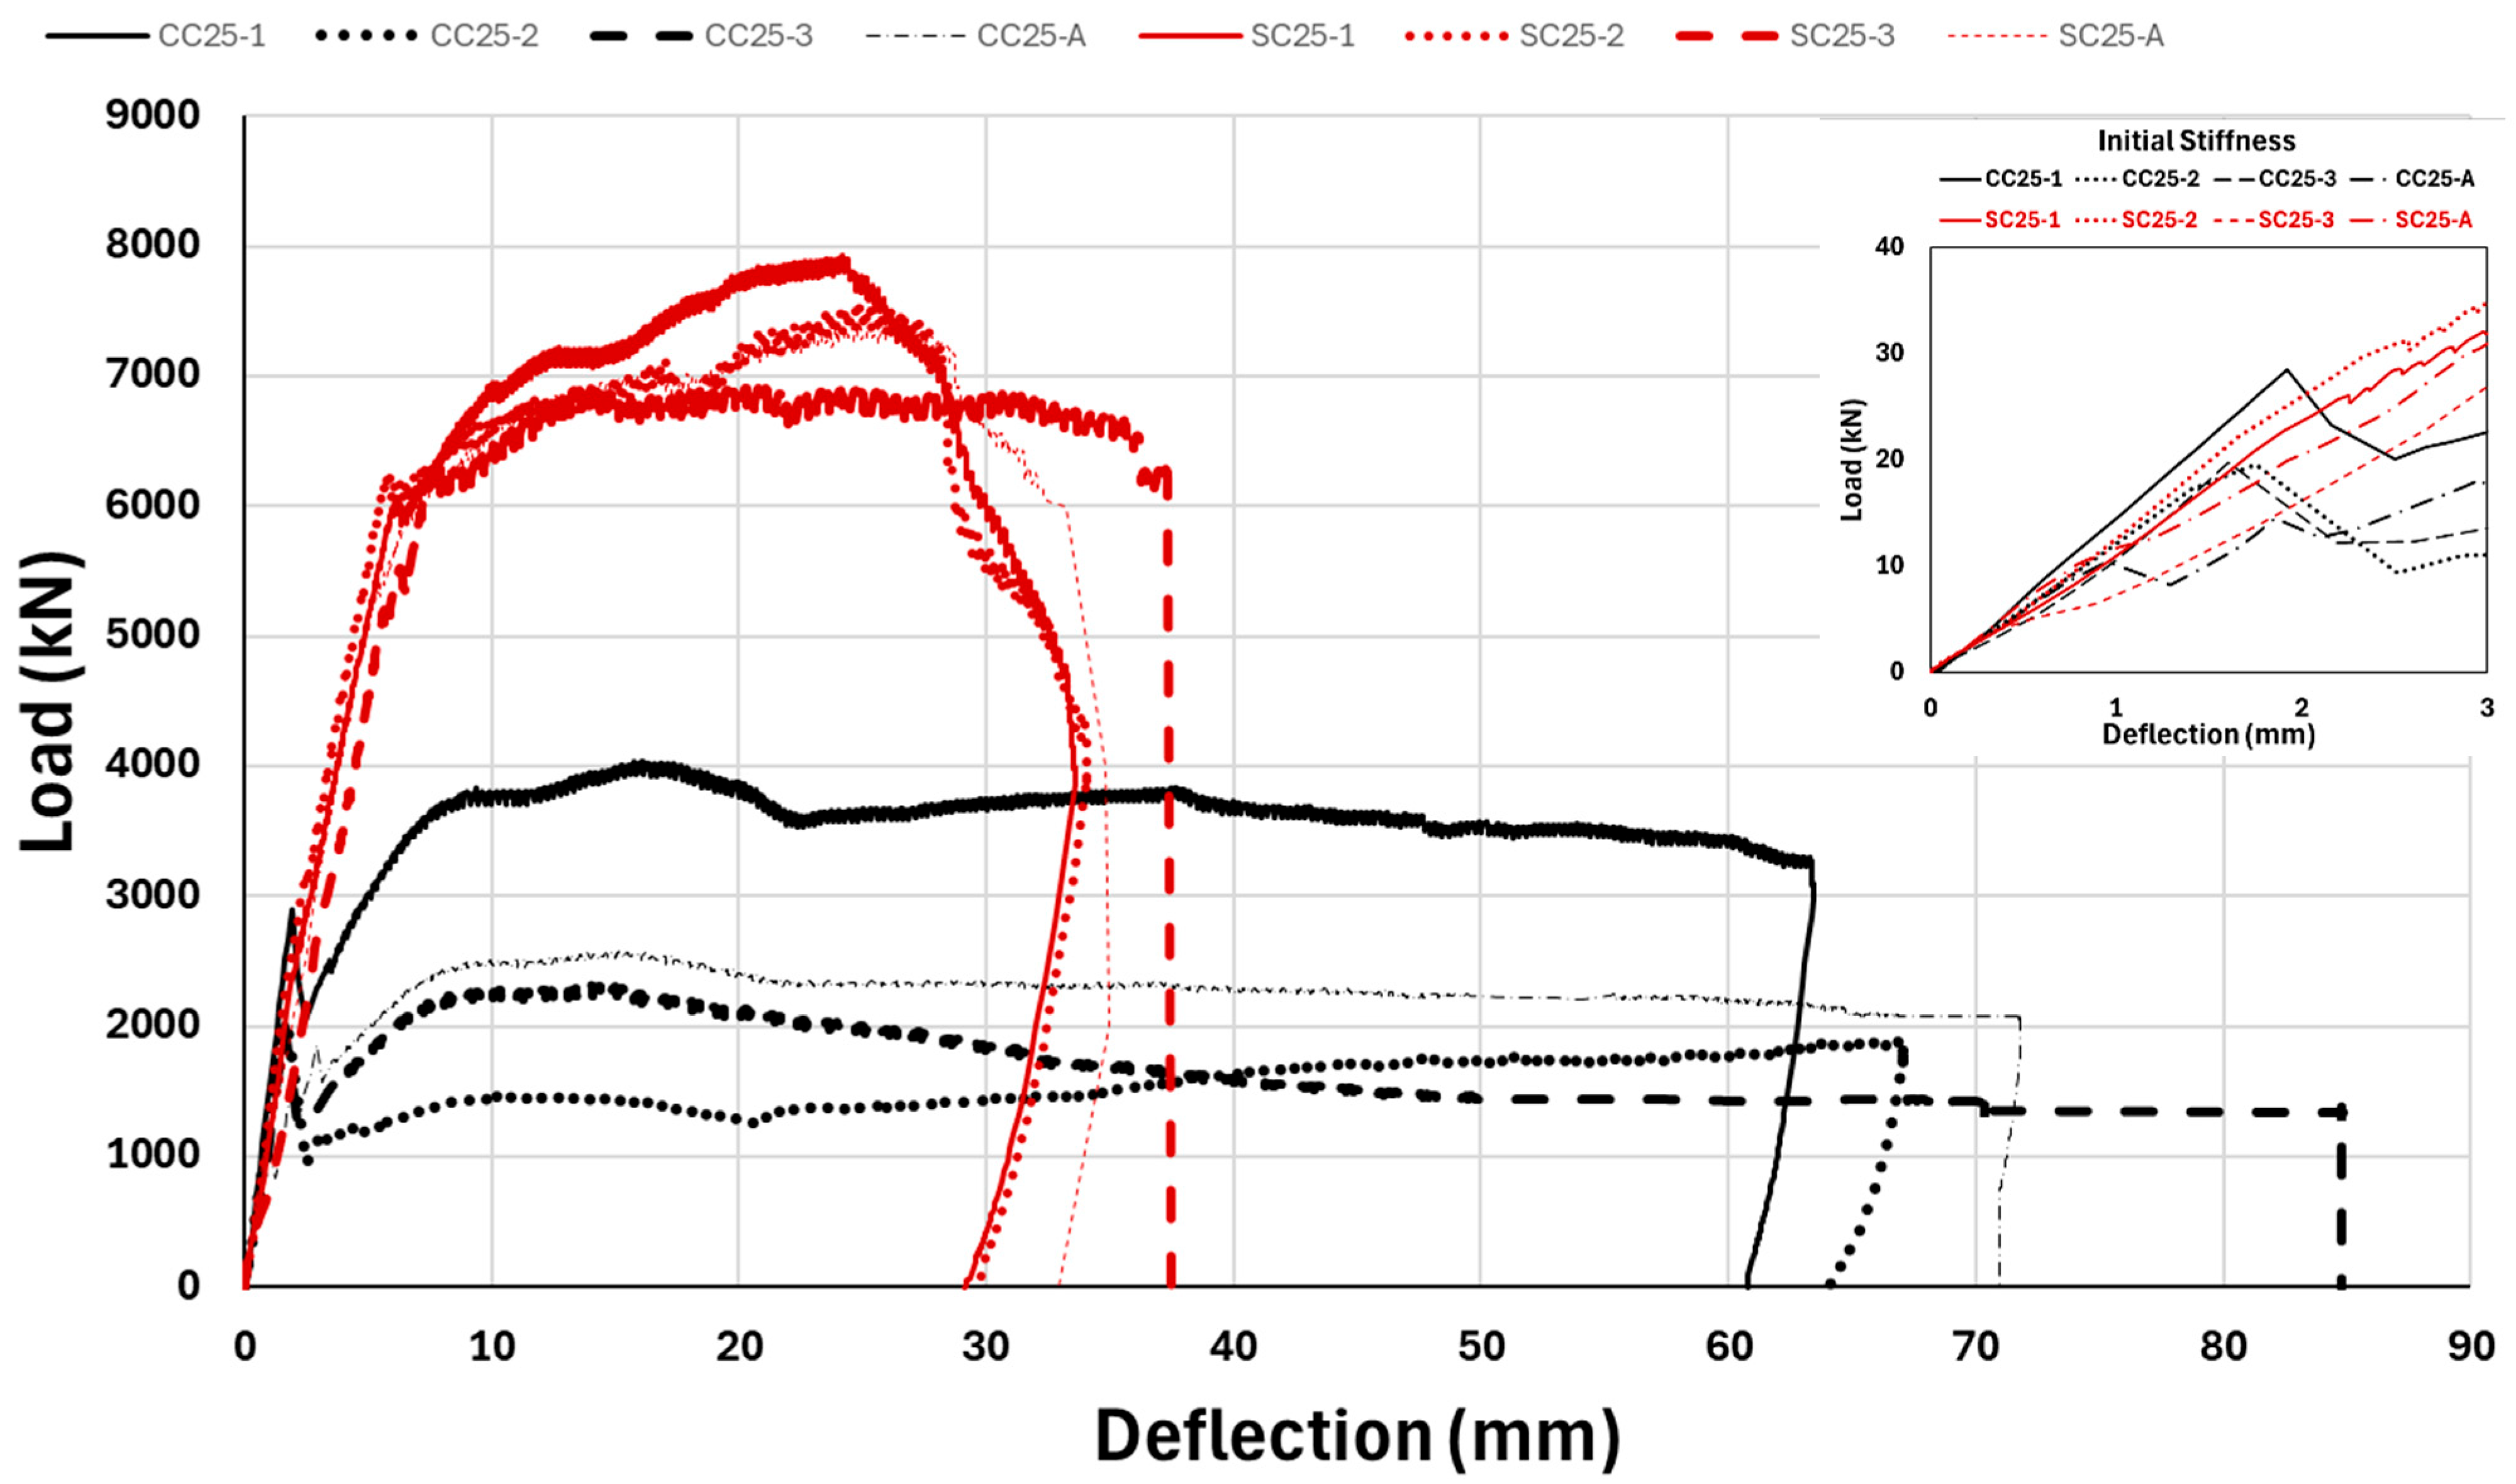
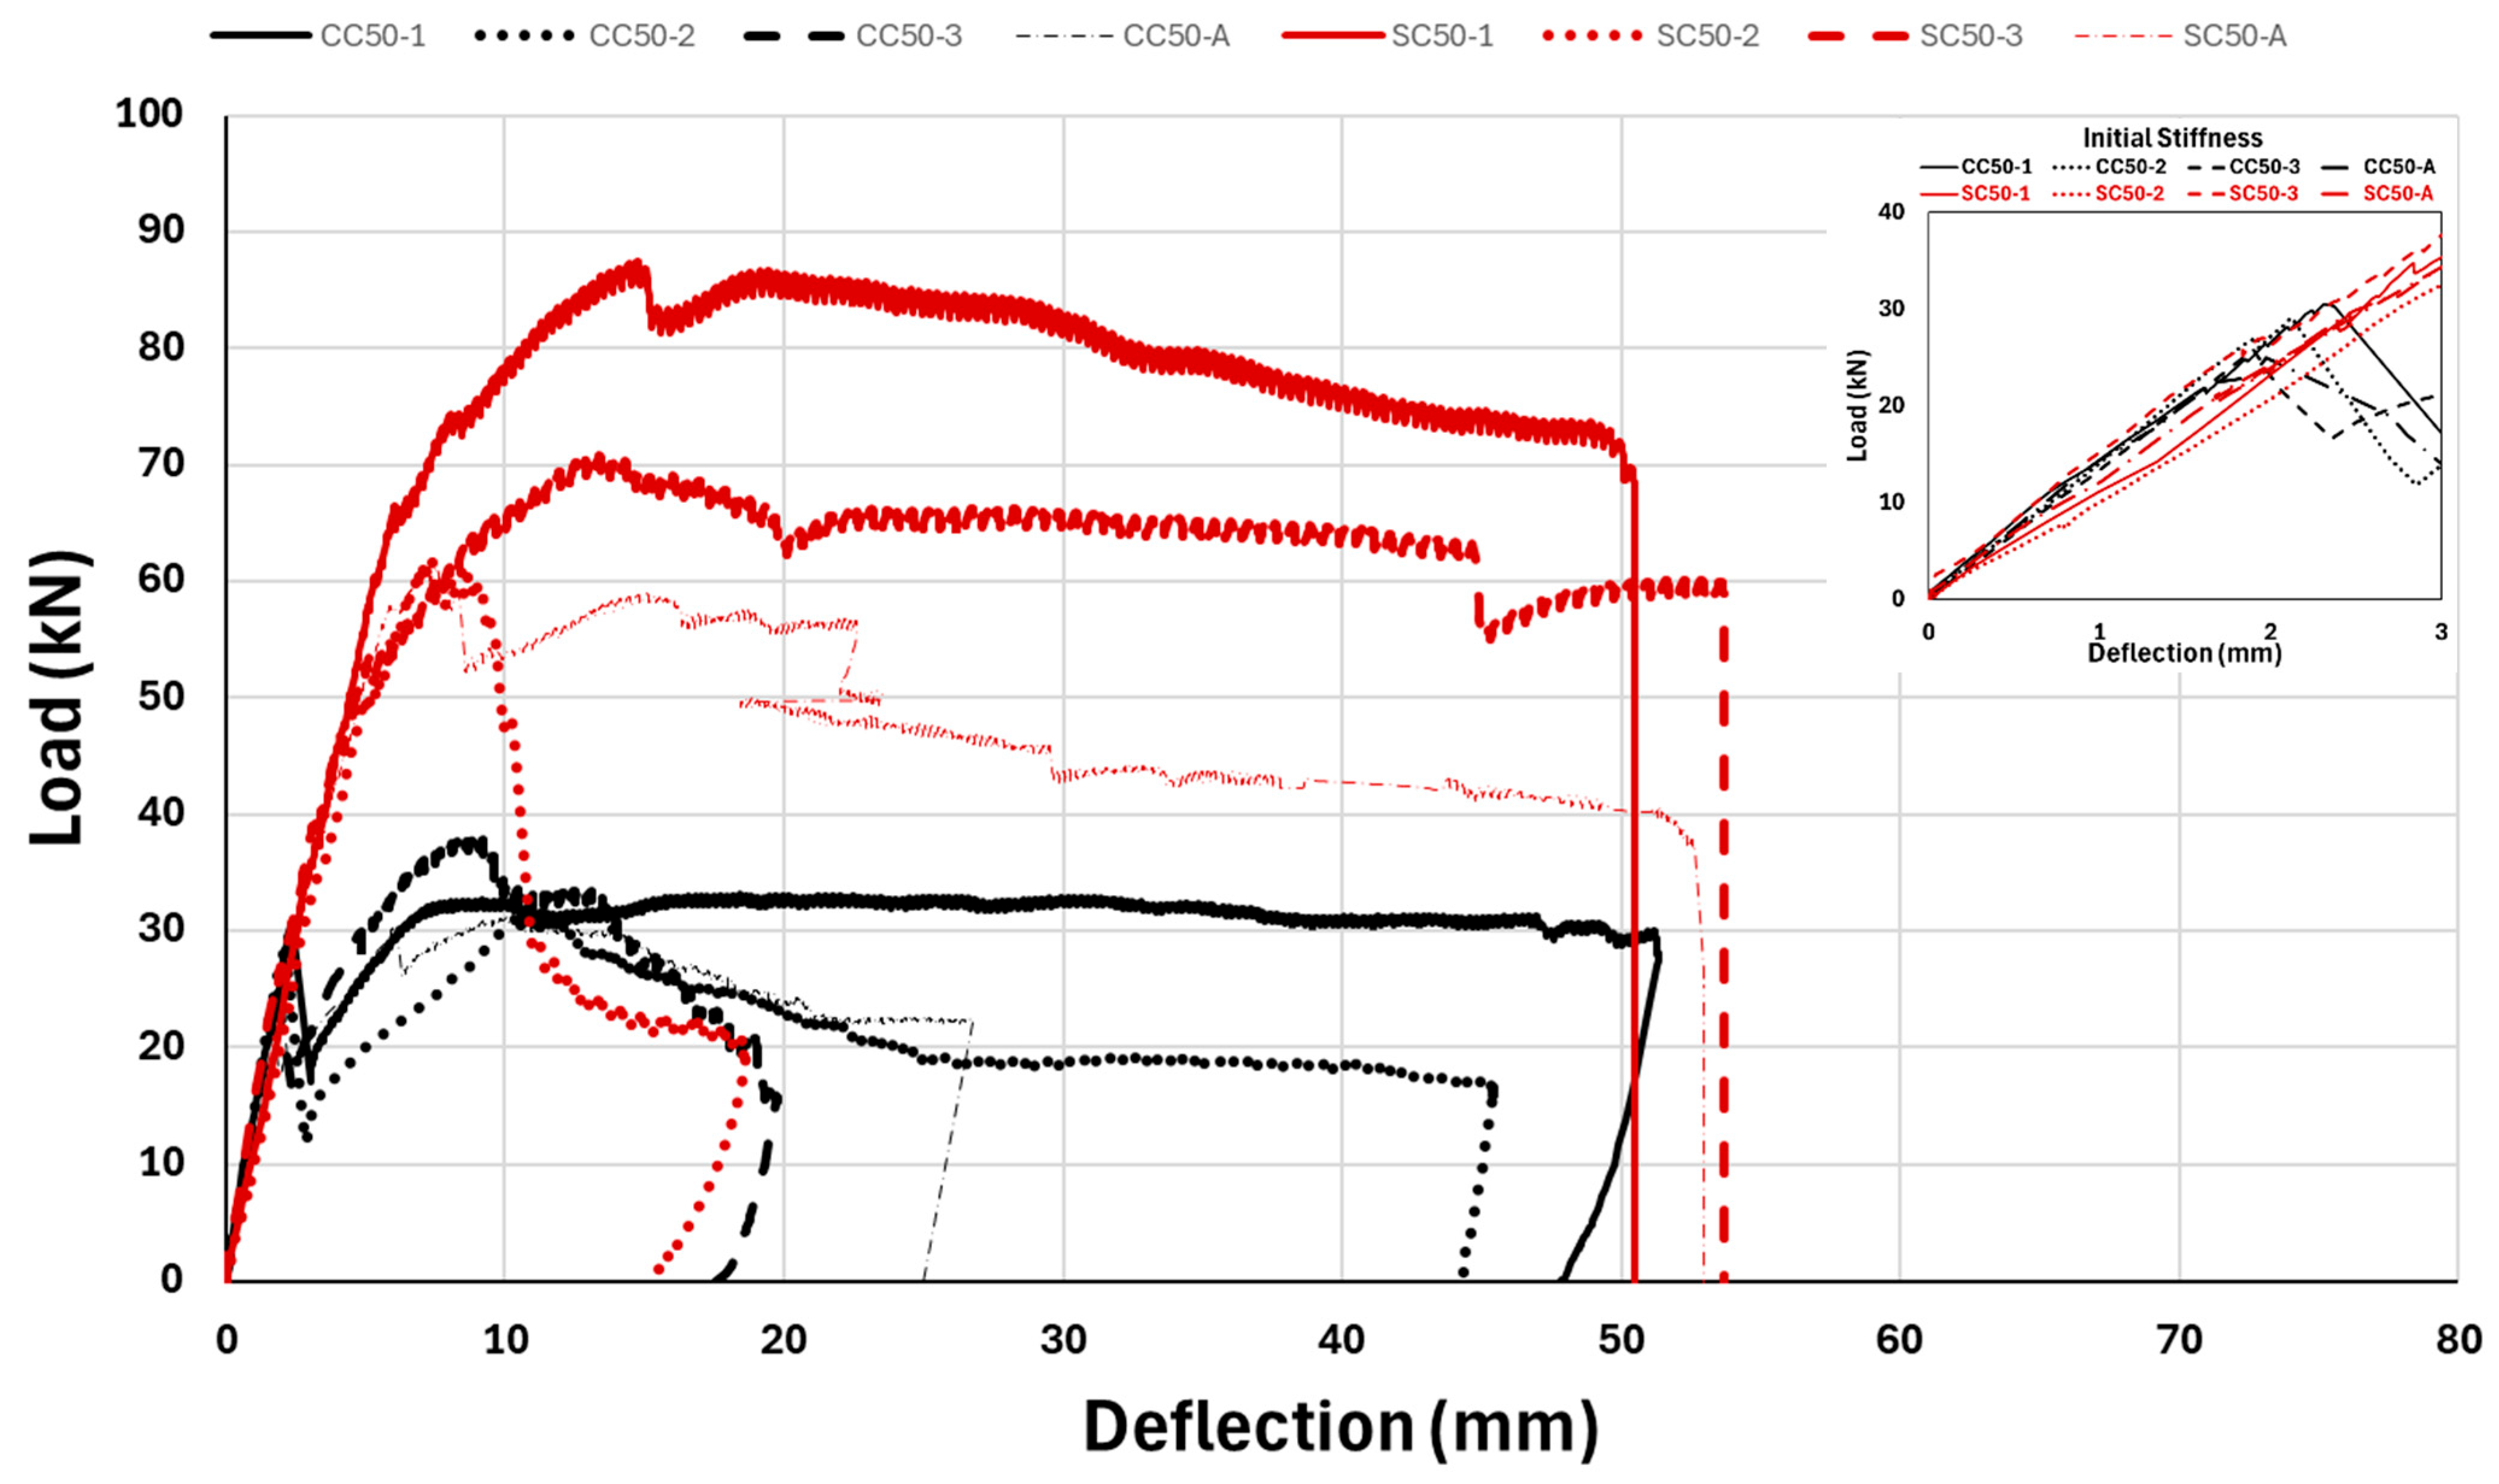
In the steel bar-reinforced beams, a shear crack occurred in the beam named SC35-2 and exhibited brittle failure behavior. Two beams with steel bar reinforcement, coded SC35-1 and SC35-3, in the C35 series with moderate concrete strength, failed due to flexural shear cracks. Similarly to shear cracking, flexural-shear cracking behavior is an undesirable failure condition in structural elements. Among the C50 series GFRP bar-reinforced beams classified as having high concrete compressive strength, CC50-1 and CC50-2 beams failed with the desired flexural cracks, while only the CC50-3 beam indicated flexural shear crack behavior. While SC50-2, one of the steel-reinforced beams of the C50 series with high concrete strength, experienced brittle failure with shear cracking; SC50-1 and SC50-3 beams exhibited undesirable flexural shear cracking behavior as displayed in Figure 5. It is revealed that all but one of the nine composite GFRP rebar-reinforced beams showed ductility under flexural cracking and exhibited a load–deflection failure performance compatible with concrete from a structural perspective. However, five of the conventional steel-reinforced beams failed with brittle shear cracking, while the other four exhibited non-ductile behavior with flexural shear cracking, which is also an undesirable failure mode. It was determined that the ultimate load-carrying capacities of steel-reinforced beams in three series with low, moderate and high concrete strength were higher than those with GFRP reinforcement. The load–deflection curves and initial stiffnesses of the C25 series reinforced concrete beams are presented in Figure 6.
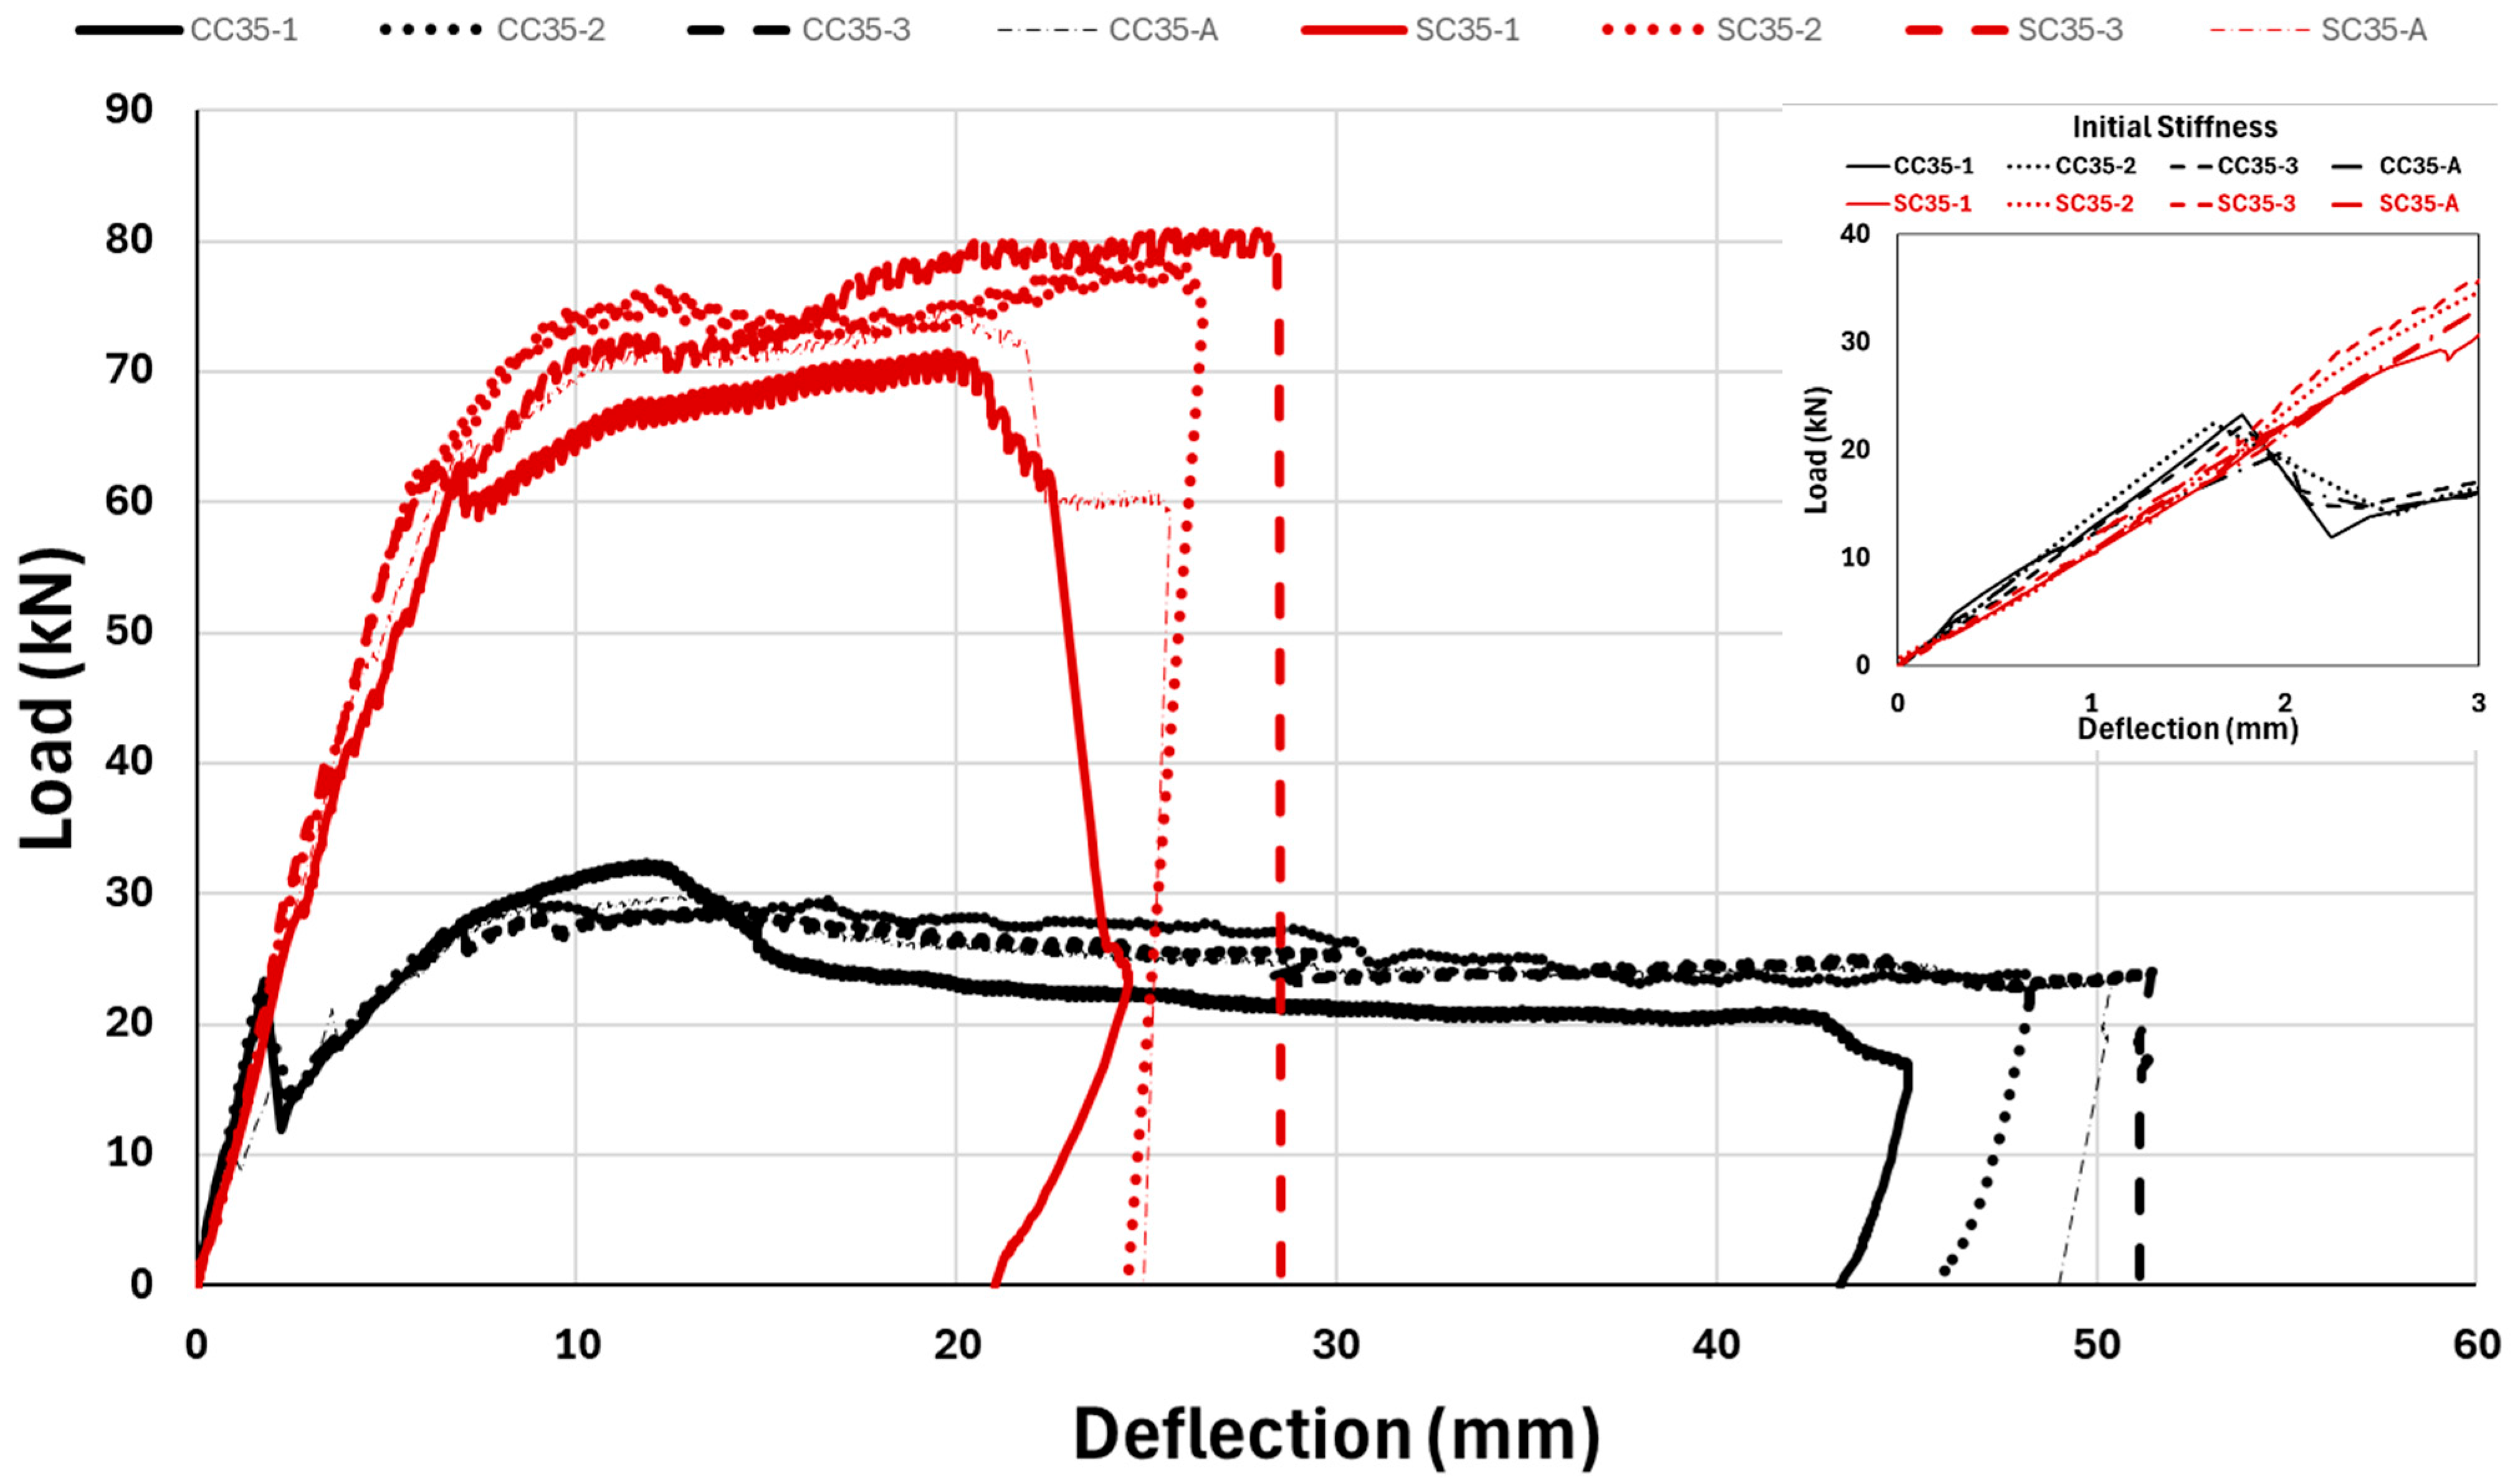
It is observed that composite beams with similar initial stiffness behavior exhibit nonlinear behavior after the first rupture. Furthermore, it is determined that the initial stiffness values of steel-reinforced beams are closer to each other. However, it is seen that the largest initial stiffness value belongs to the GFRP bar-reinforced beam named CC25-1. In terms of ultimate load-carrying capacity, the highest value is 77.75 kN, for the SC25-1-coded beam. The highest deflection value measured from the midpoint of the reinforced concrete beams is obtained from the beam with code CC25-3 as 84.80 mm. While the initial crack load value of the C25 series low-concrete-strength beams with GFRP reinforcement is obtained as approximately 21 kN, the average of this value in the steel-reinforced beams is around 57 kN. It is determined that the average mid-point deflection values of the GFRP-reinforced C35 series beams with moderate concrete strength were lower than those of the GFRP-reinforced C25 series beams but higher than those of the C50 series beams with high concrete strength. When Figure 6, Figure 7 and Figure 8 are compared, it is determined that as the concrete compressive strength increases, the deflection value of the GFRP-reinforced beams decreases, but the ultimate load-carrying capacity of the beams increases by 10–15%.
It is determined that the initial stiffness distinction in beams with low concrete strength and steel and GFRP reinforcement are greater than those in beams with moderate and high concrete strength. When Figure 6 and Figure 7 are compared, the average initial crack load values of GFRP-reinforced beams are enhanced from 21.79 kN to 22.72 kN, while this value increases from 57.18 kN to 62.46 kN in steel-reinforced ones.
Similarly, the increase in the concrete compressive strength level of the beams from C25 to C35 is effective in the ultimate load-carrying capacities and increases the failure load values. When the concrete compressive strength increases up to C50 level, a significant decrease can be observed in the midpoint deflection values of GFRP-reinforced beams in Figure 8. Among the 18 beams, the beam with the highest ultimate load-carrying capacity is the steel-reinforced SC50-1-coded beam from the C50 series, reaching a value of 87.46 kN. The lowest midpoint deflection value is the beam coded SC50-2, which is steel-reinforced and exhibits brittle failure behavior with a deflection of 18.61 mm. In GFRP-reinforced concrete beams, as the concrete compressive strength increases, the ultimate average load-carrying capacity increases, but this is not the same in steel-reinforced beams. It is revealed that the ultimate load-carrying capacities of the steel-reinforced beams in the C35 series are higher than those of the beams in the C50 series. Table 4 provides detailed information about the bending tests of 18 reinforced concrete beams. The crack types occurring in the beams are categorized with the colors green, orange, and red, respectively, from safe to most dangerous. While flexural cracks are colored green because they exhibit ductile behavior, shear cracks are represented in red due to the fact that they can cause suddenly collapse. The averages of the experimental data given in Table 4 are presented in the rows with code A. Among the reinforced concrete beam series, the steel-reinforced beams in the C50 series with high concrete compressive strength are the group with the lowest initial crack load. In contrast with steel-reinforced beams, the C50 series has the highest initial crack load in GFRP bar-reinforced concrete beams.

3. Artificial Intelligence Investigation

Recently, the implementation of machine learning-based predictive models in structural engineering has attracted notable attention [46,47,48]. Specifically, establishing intelligent methods to forecast the structural and resilience qualities of advanced construction materials is one of the most important and innovative aims in this field. In the latest research carried out with machine learning method regression analysis on the load–deflection capacity curves of reinforced concrete beams, over 80% accuracy and quite consistent prediction results were obtained [49,50,51]. The results indicated that ensemble models based on boosting and tree-based methods (AdaBoost, GBDT, and XGBoost) exhibited higher and better prediction accuracy.
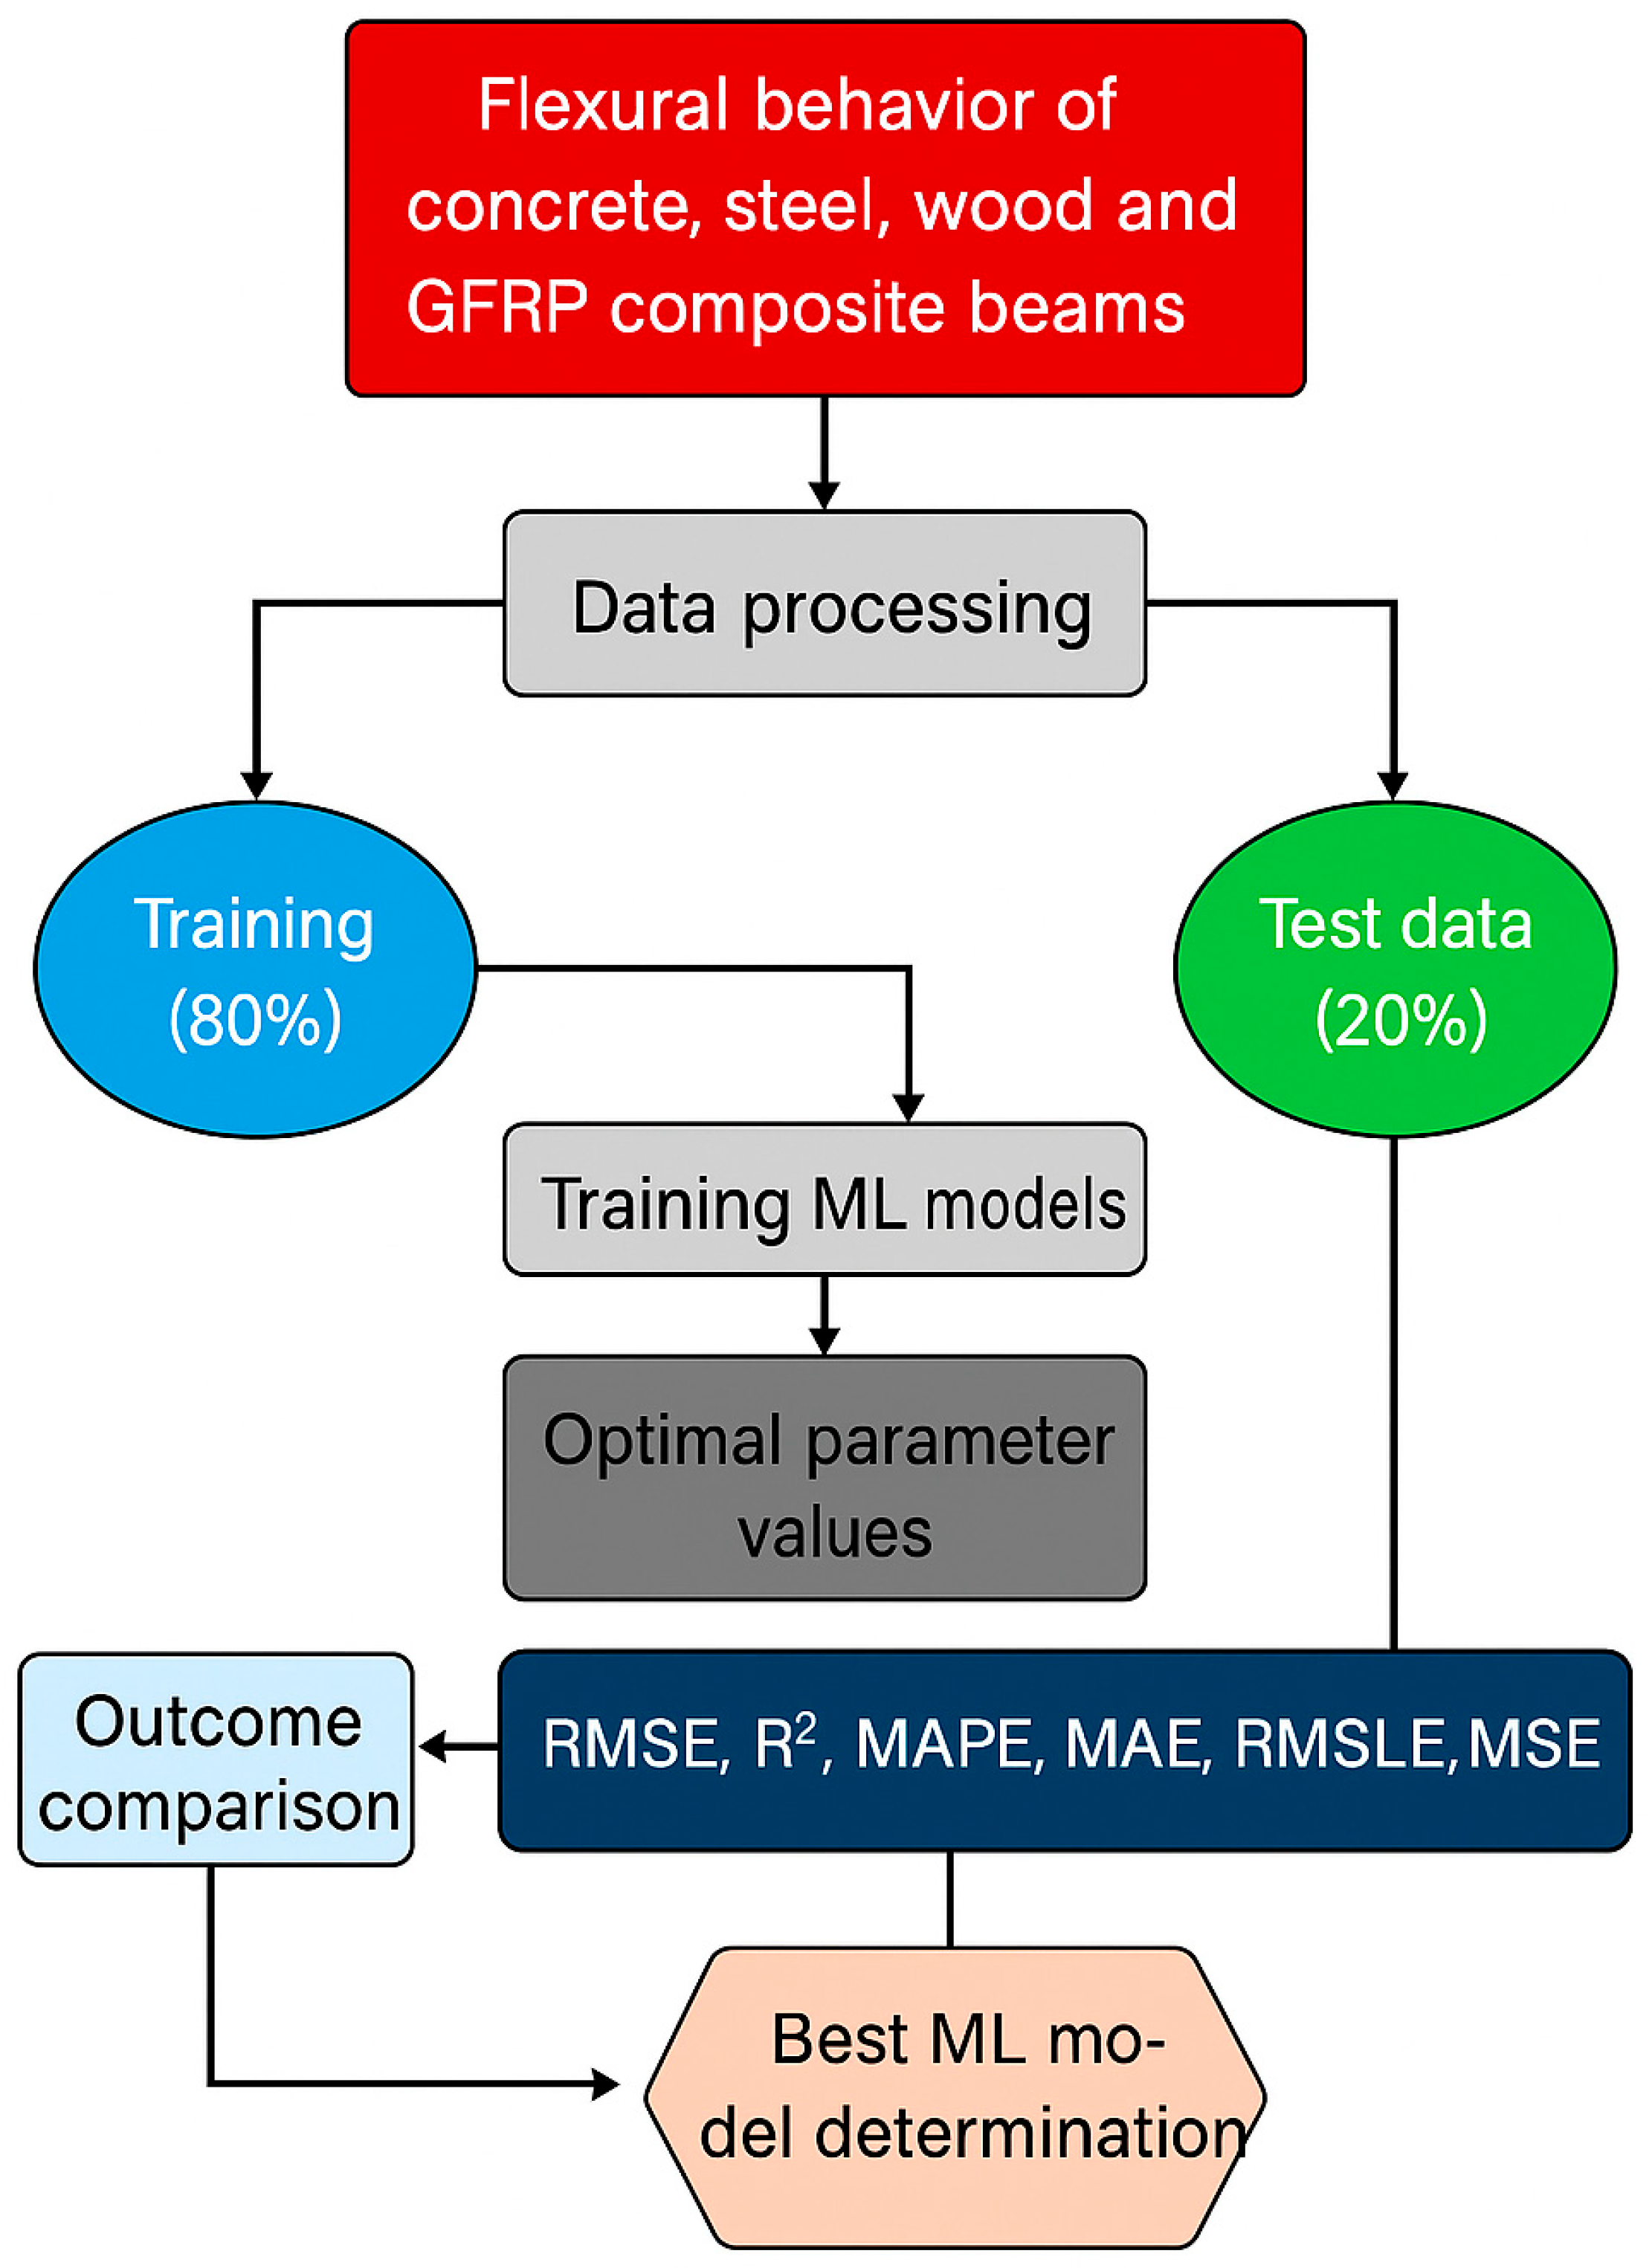
This paper explores the development of the most appropriate machine learning models for predicting the flexural capacity of steel- and GFRP (glass fiber-reinforced polymer) bar-reinforced fresh concrete LMHCS (low-, moderate-, and high-compressive-strength) beams. Regression analysis is performed using the python programming language via Jupyter notebook, using the pycaret library, which is a subset of artificial intelligence (AI), utilization machine learning (ML) methods. In the analyses performed, the load–deflection data sets of 3-point bending tests of reinforced concrete beams were trained with 10-fold cross-validation after being separated into 80% training and 20% test data. During the training, the load values in the data set were utilized to estimate the deflection values. The performances of 18 ML models obtained after the training process were compared, and the model that obtained the best R2 result for each data set was determined. The names and abbreviations of the ML 18 models utilized in machine learning regression analyses are given in Table 5. Figure 9 presents the flow chart of ML regression models.

3.1. Overview of Machine Learning Algorithms

Table 5 presents the 18 machine learning regression models employed in the investigation of ultimate load–deflection capacity, based on experimental results from steel- and GFRP-reinforced concrete beams. The study considers a range of parameters, including concrete compressive strength, reinforcement material type, beam cross-sectional width and height, effective depth, and reinforcement ratios.

3.2. Assessment Metrics

In statistical computation, the effectiveness of a machine learning algorithm is commonly assessed using metrics such as Root Mean Squared Log Error (RMSLE), Root Mean Square Error (RMSE), Mean Absolute Error (MAE), Mean Squared Error (MSE), the Coefficient of Determination (R2), and Mean Absolute Percentage Error (MAPE). These evaluation metrics provide an objective measure of the proximity between the predictions of the ML regression model and the actual experimental values. For a well-performing model, lower values of RMSE, MAE, and MAPE indicate superior accuracy, whereas R2 values approaching 1.00 reflect a better fit [49]. The corresponding evaluation equations are presented in Equations (5)–(8) [50].
R M S E = i = 1 n ( x i x i ) 2 N
M A E = 1 N i = 1 n x i x i  
R 2 = 1 i = 1 n   ( x i x i ) 2 i = 1 n   ( x i x i )
M A P E = i = 1 n 1 N x i x i x i  
The estimation of strength, ultimate load-carrying capacity, and deflection values of composites using PyCaret regression analysis has been investigated to a limited extent; however, the available findings demonstrate high consistency [50]. For the prediction of ultimate load–deflection curves of reinforced concrete beams, 18 different regression analyses were performed, and the performance of each model was evaluated using MAE, MSE, R2, RMSE, and RMSLE metrics. The regression models that yielded the most accurate predictions in each analysis were identified as reference models, with their names and the frequency of best performance illustrated in Figure 9. Table 6 presents the input and output parameters employed in the machine learning regression models. Among the input values in Table 6, the compressive strengths of concrete (fc′) were considered separately for the C25, C35, and C50 series, based on 7-day cube sample results of fresh concrete. The tensile yield strength of steel reinforcement (fy) was fixed at 420 MPa, while the beam width, height, length, and effective depth were also treated as constants. In contrast, the tensile strengths of GFRP bars (ff) were varied between 489 MPa and 651 MPa. The ultimate load-carrying capacities (F) of reinforced concrete beams obtained from three-point bending tests ranged from 19.57 kN to 87.46 kN across the ML regression analyses. Additionally, reinforcement ratios (ρf, ρb) were incorporated into the analysis, spanning their full range from the lowest to highest values.

3.3. Machine Learning Analysis Results

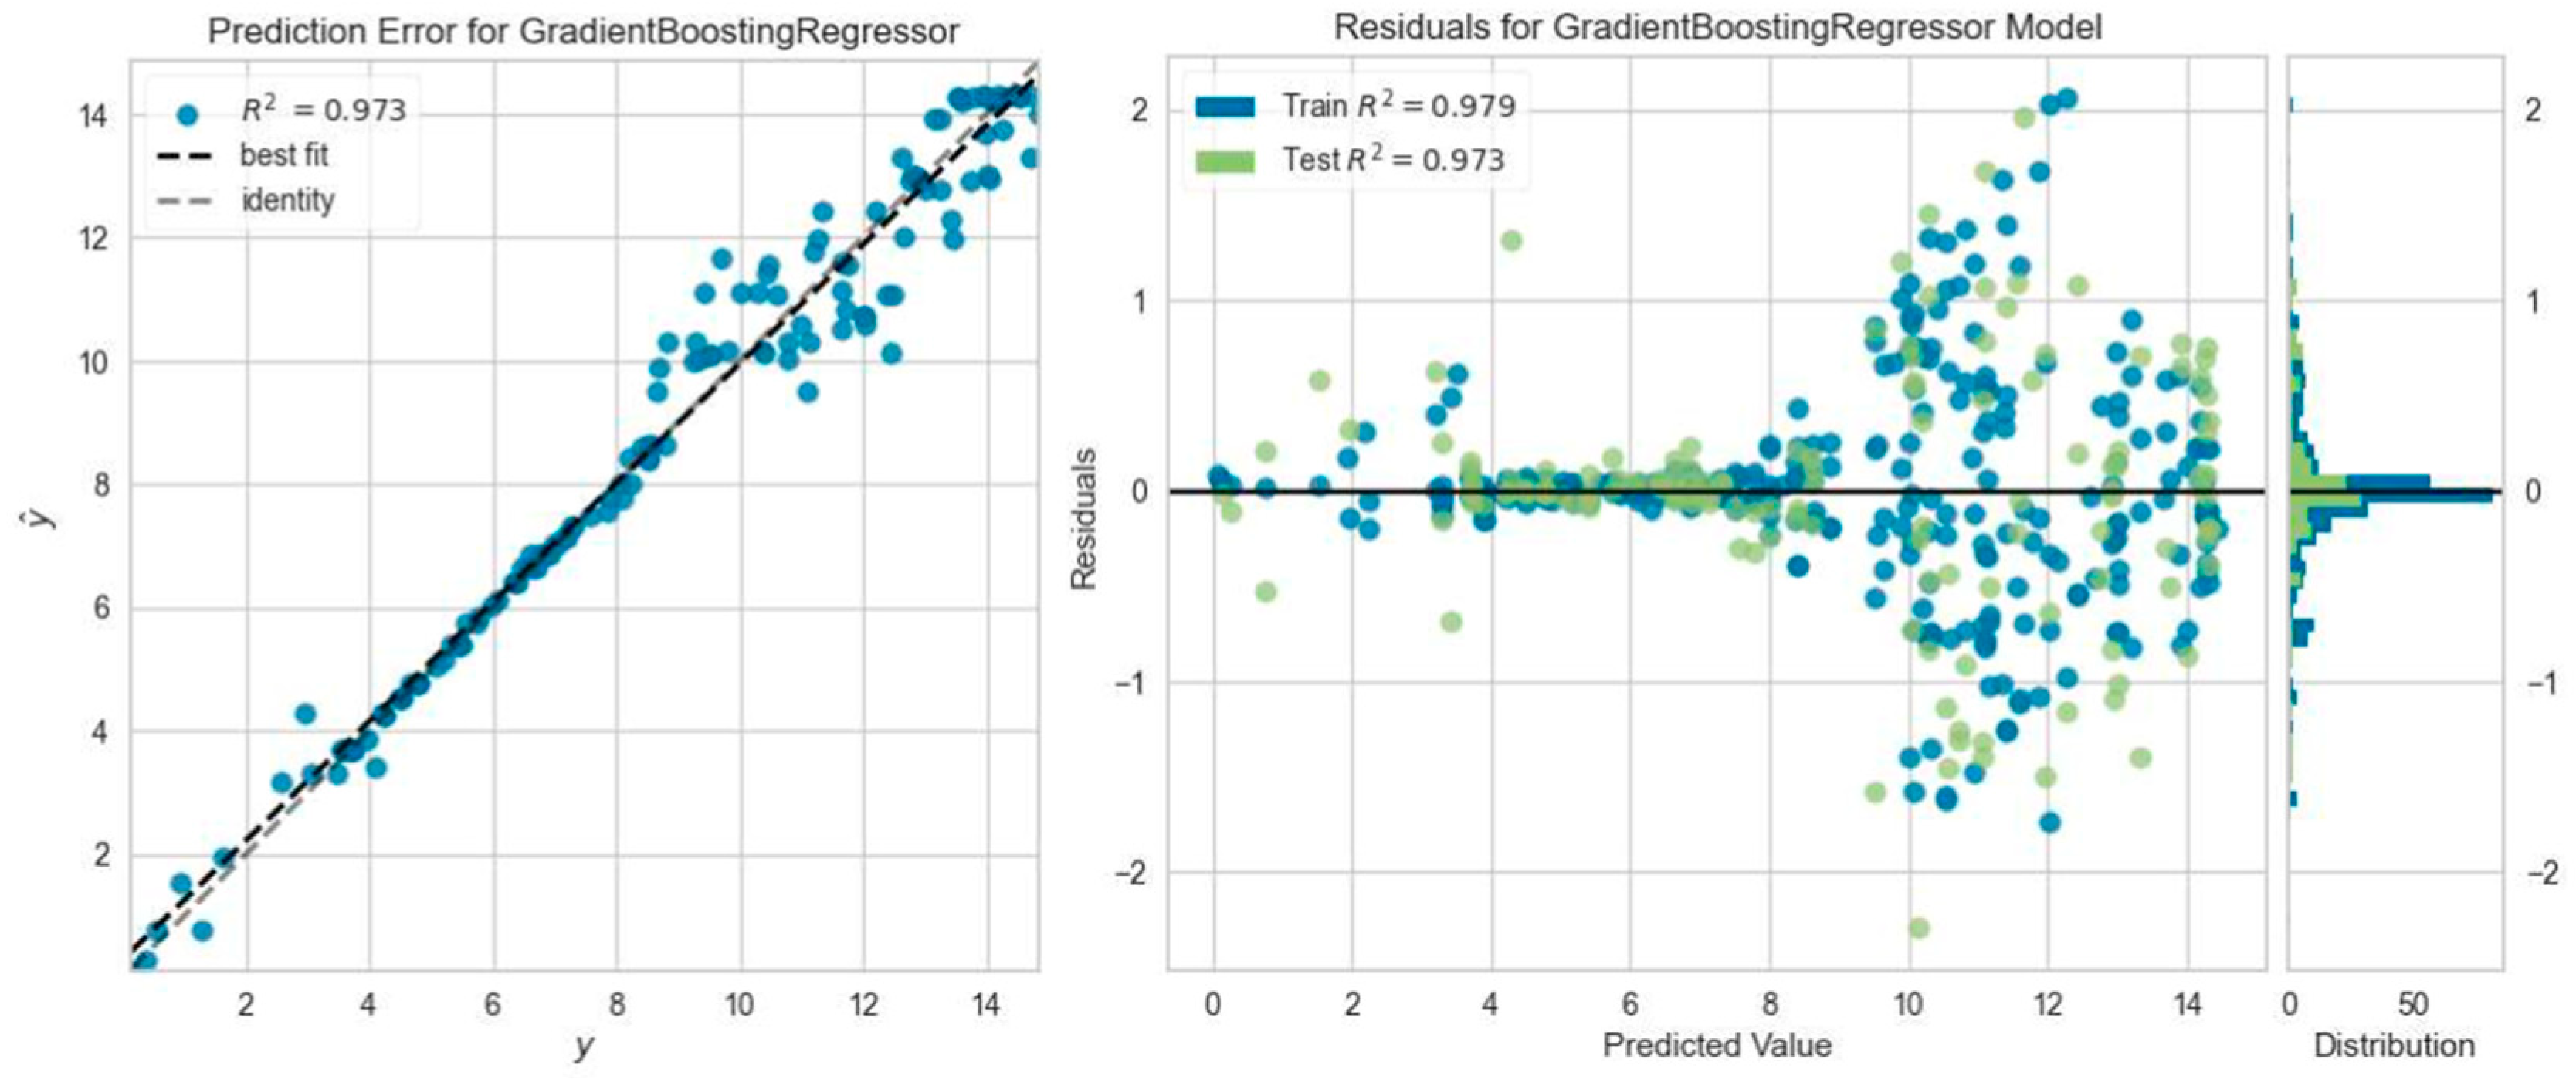
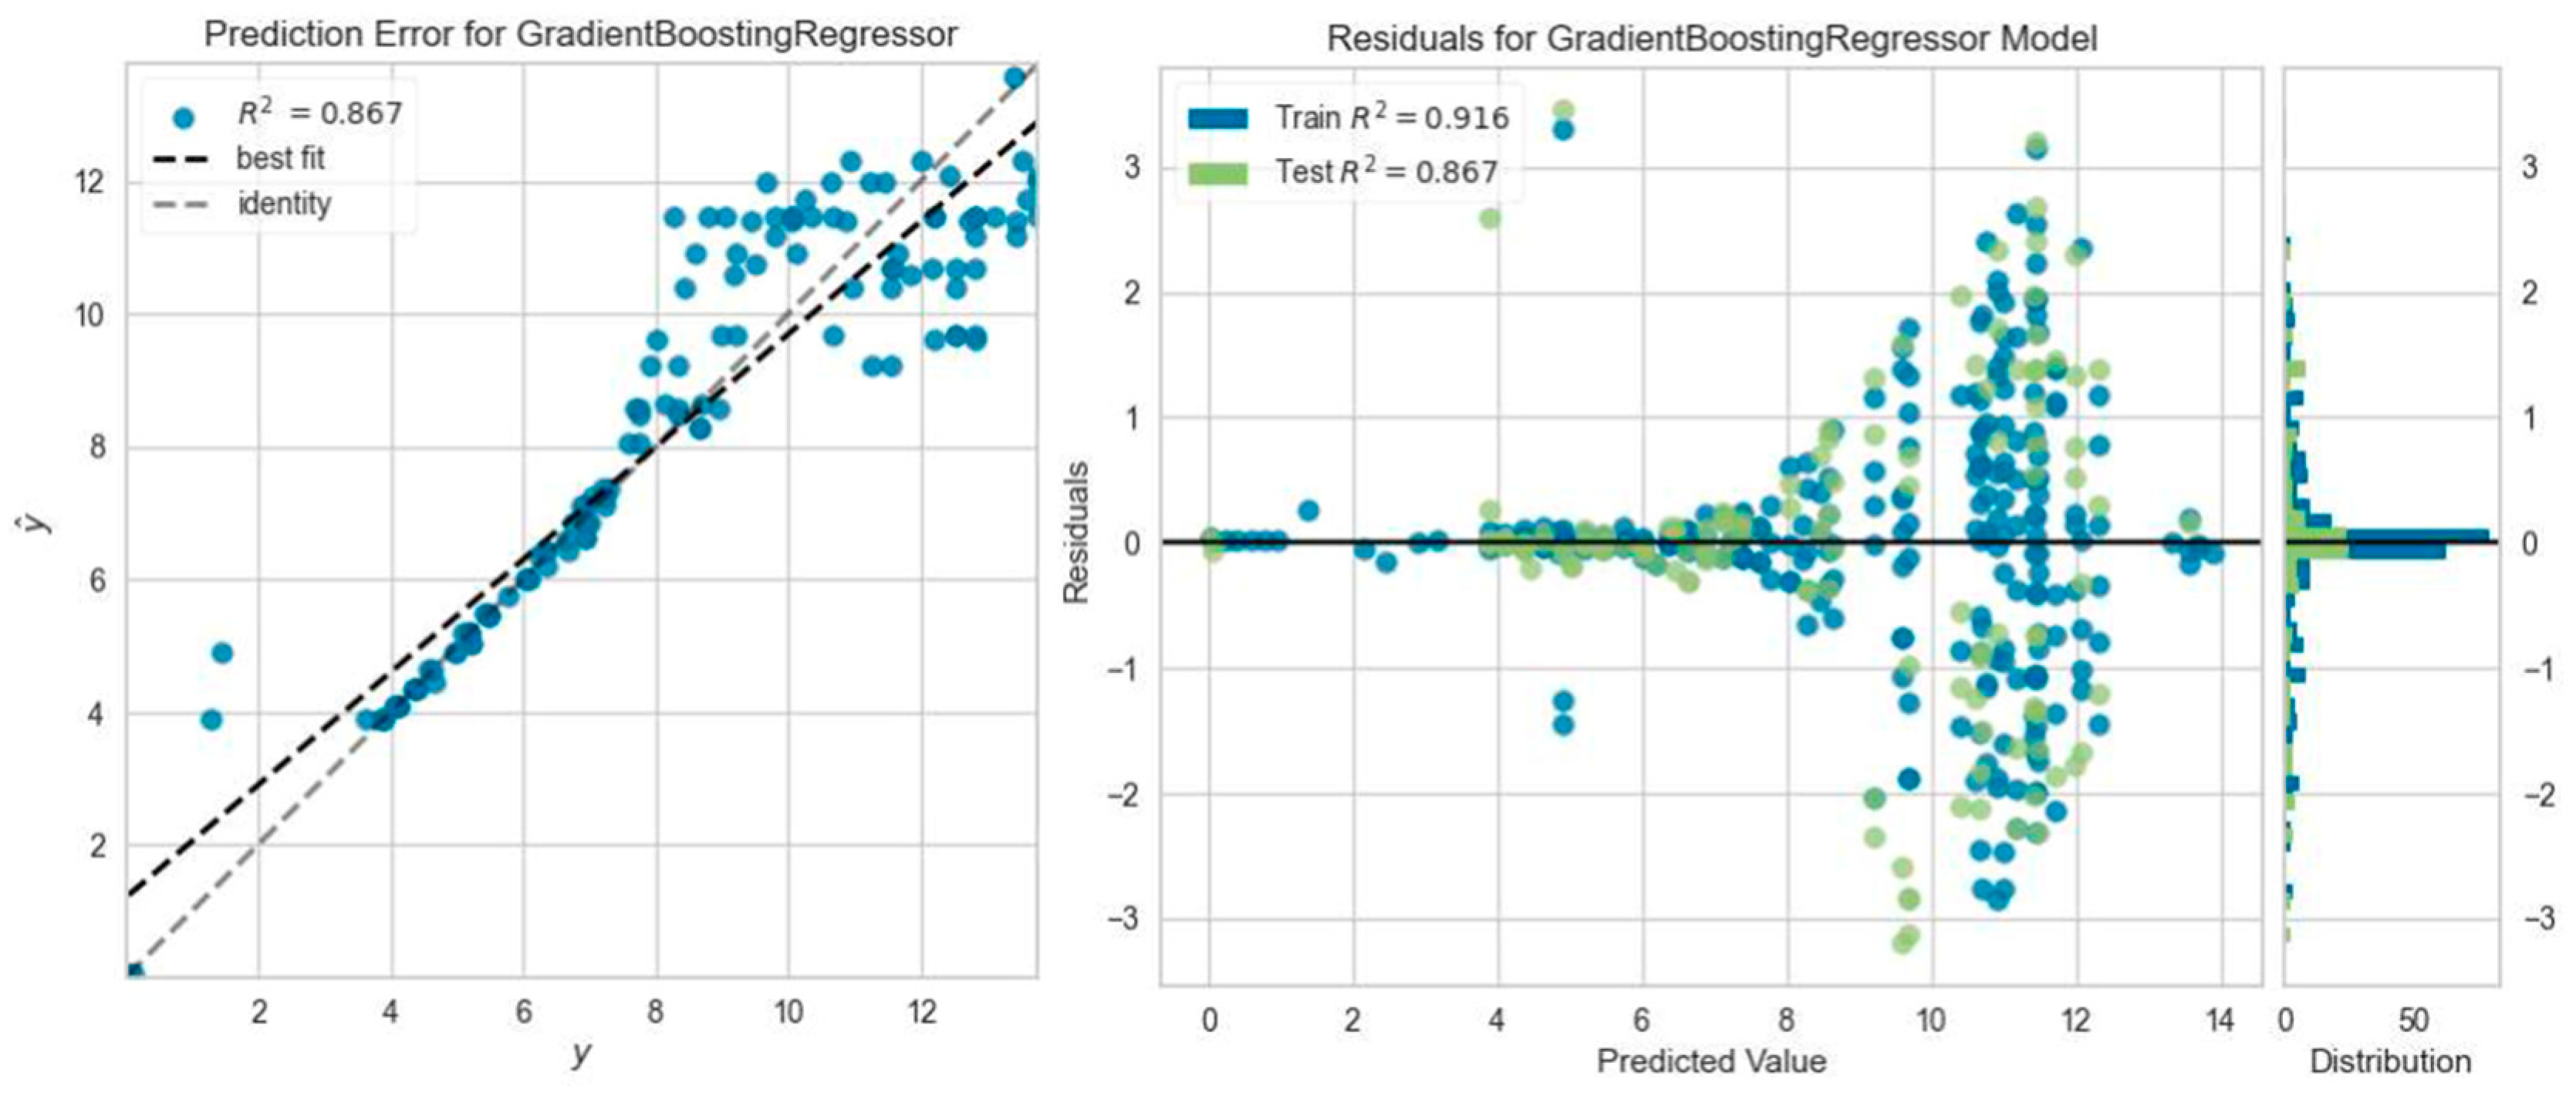
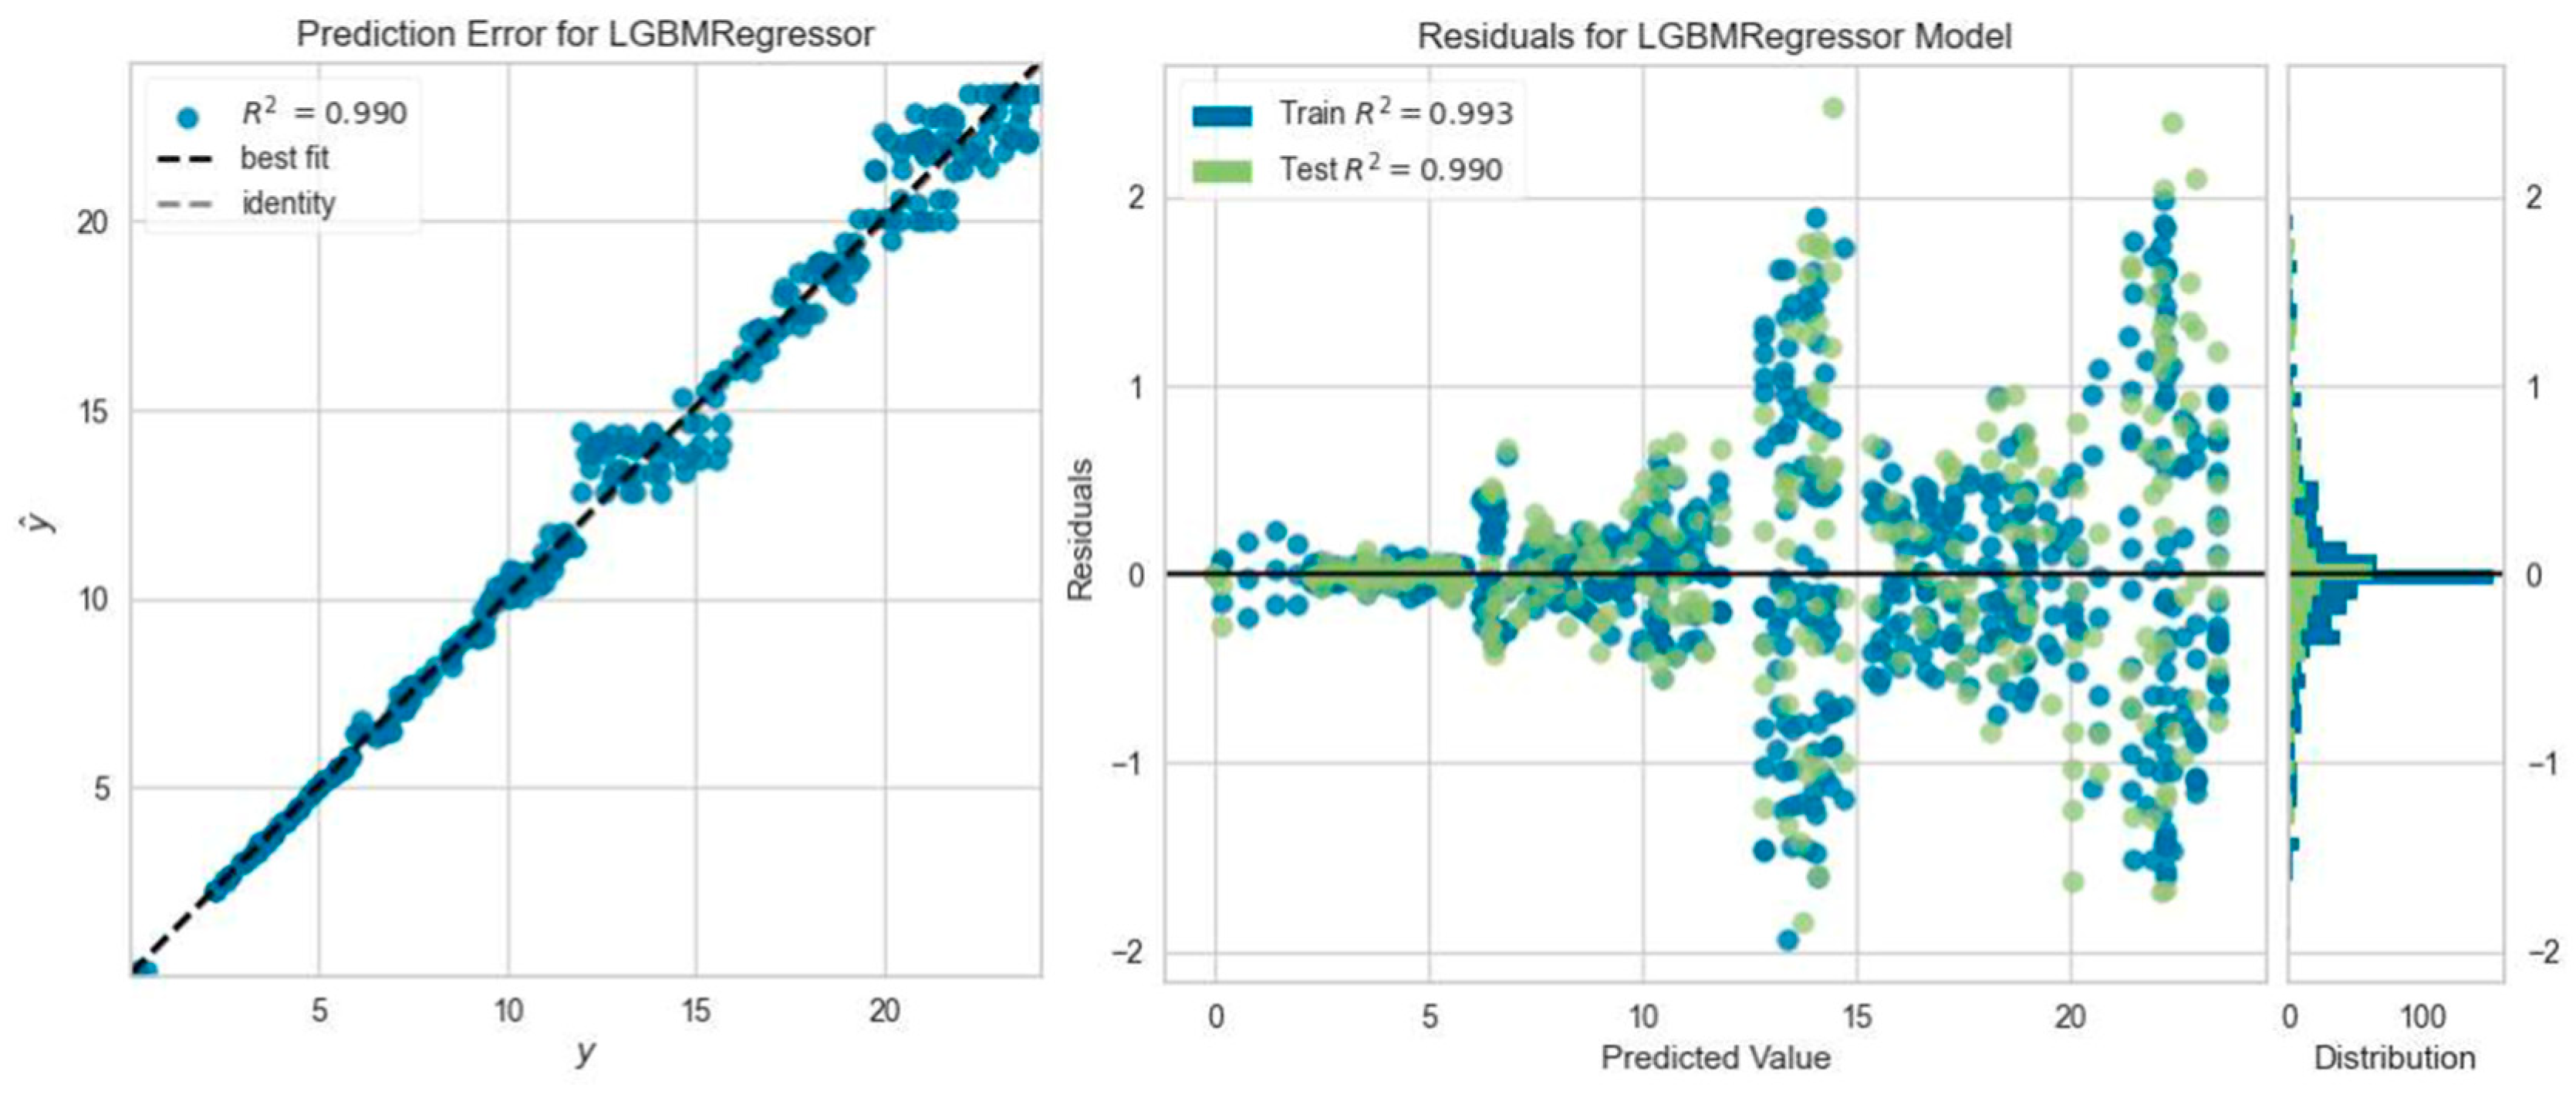
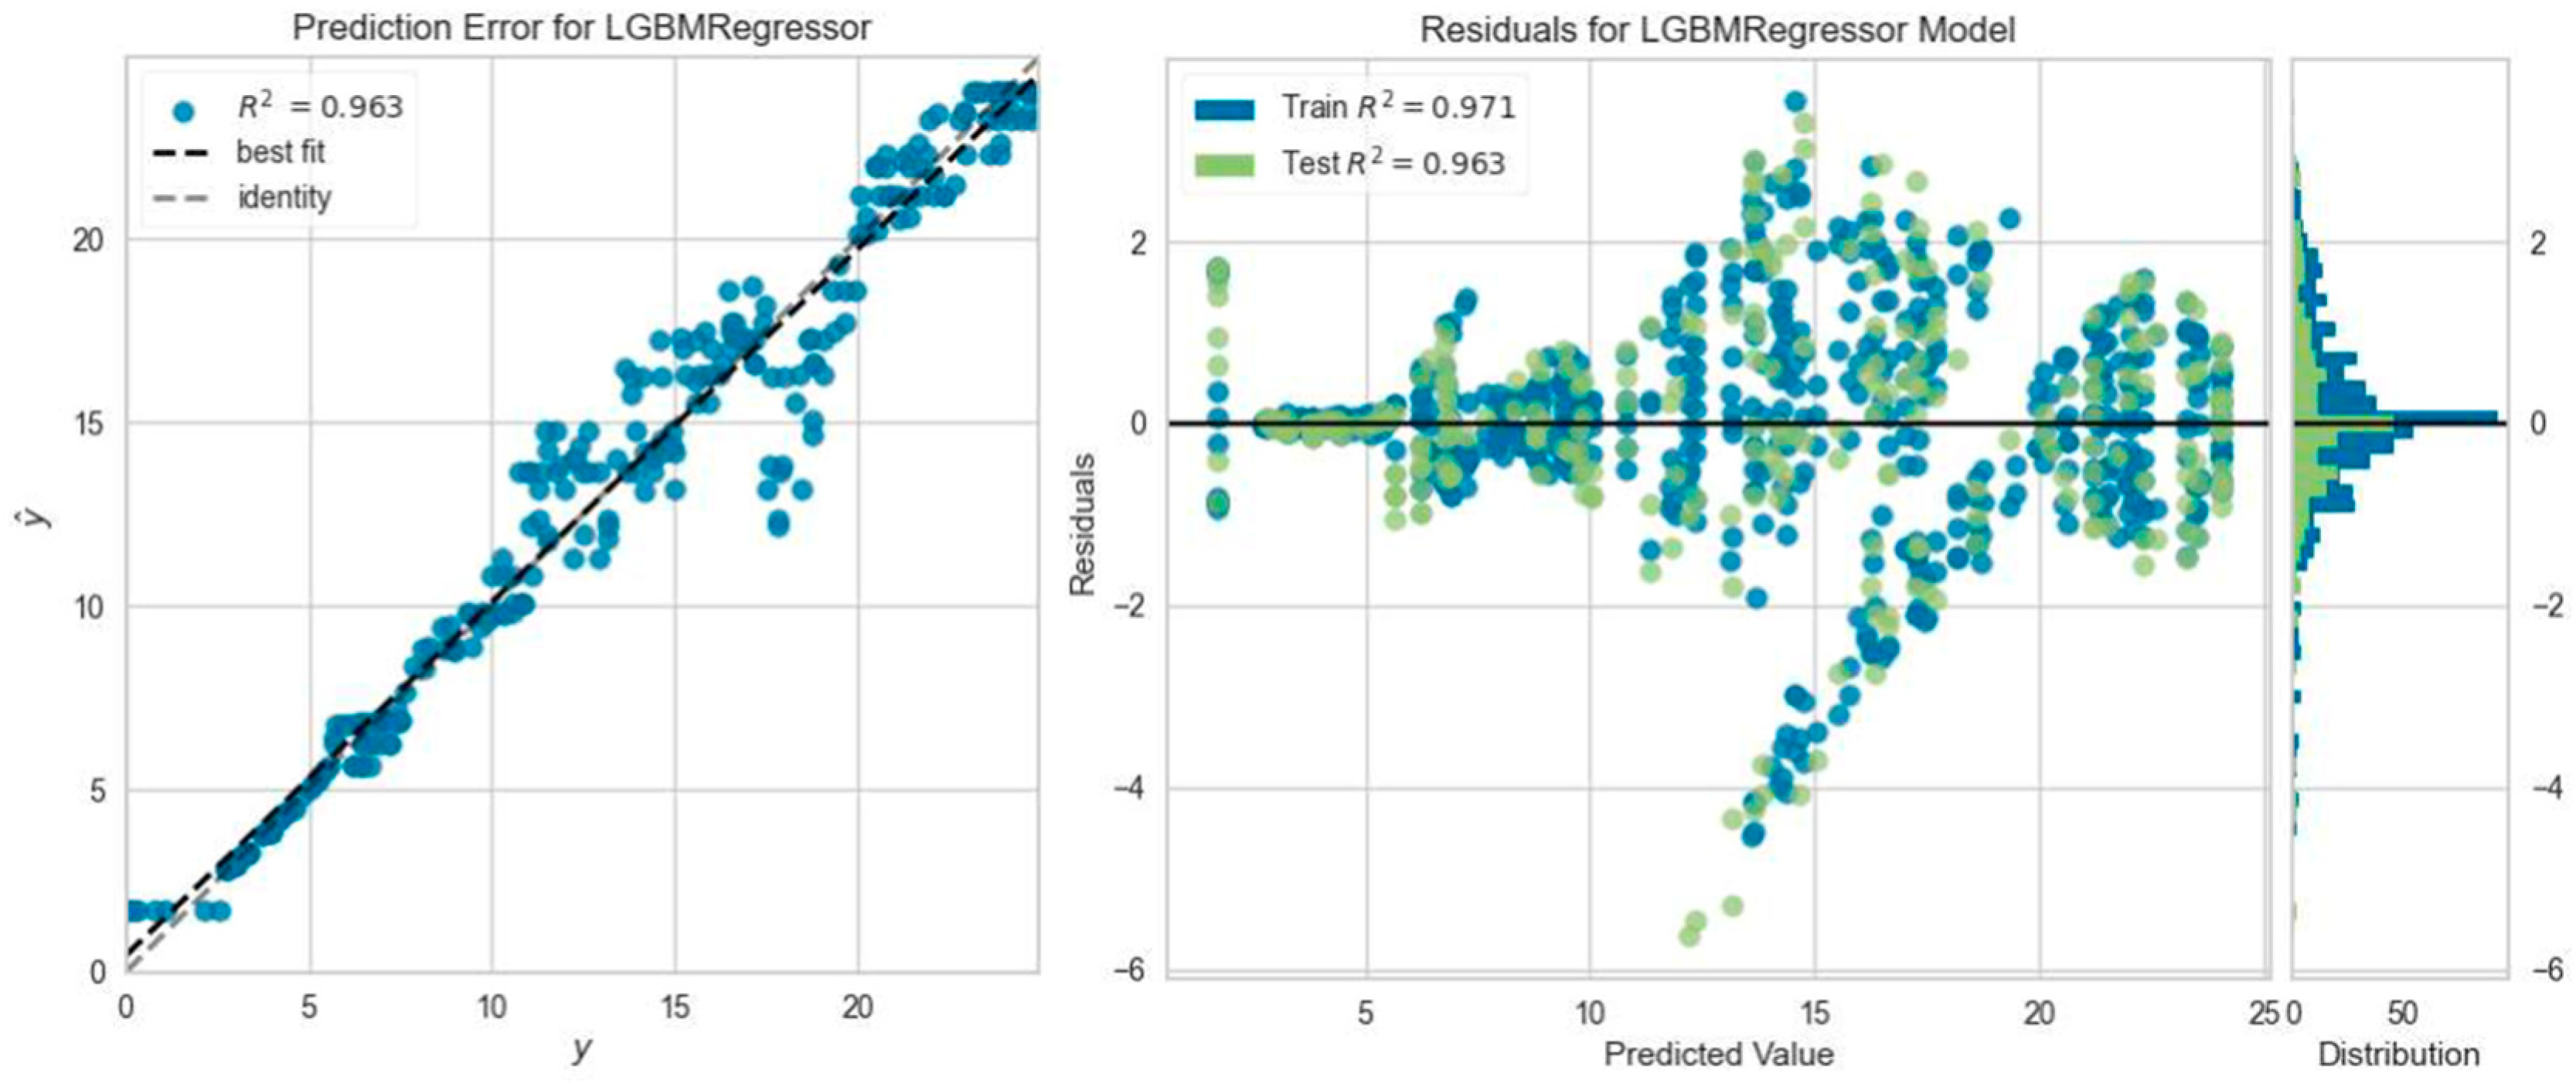
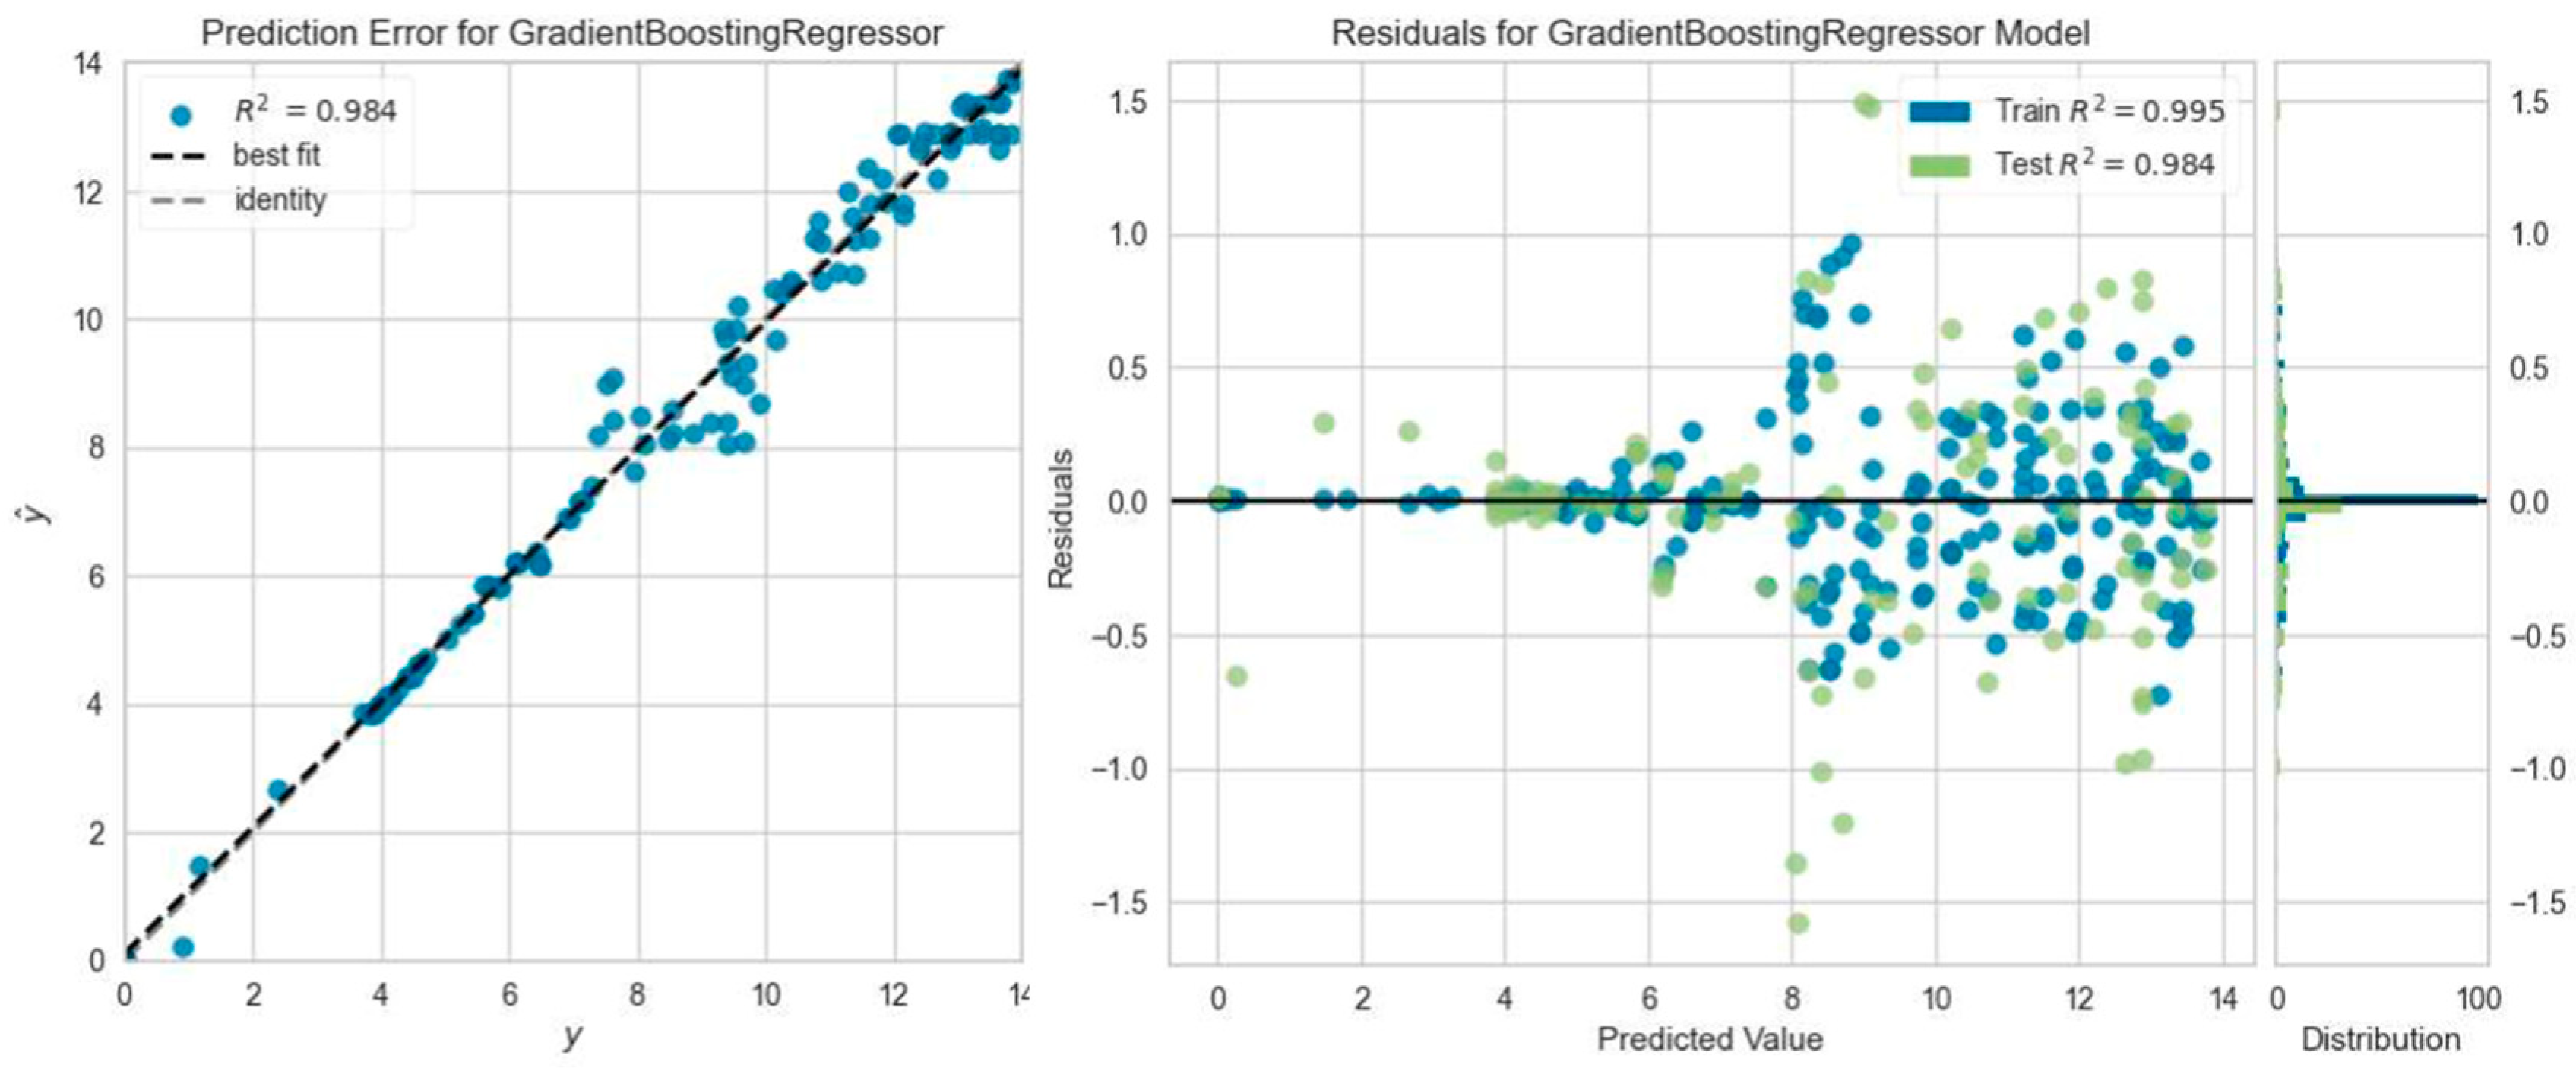
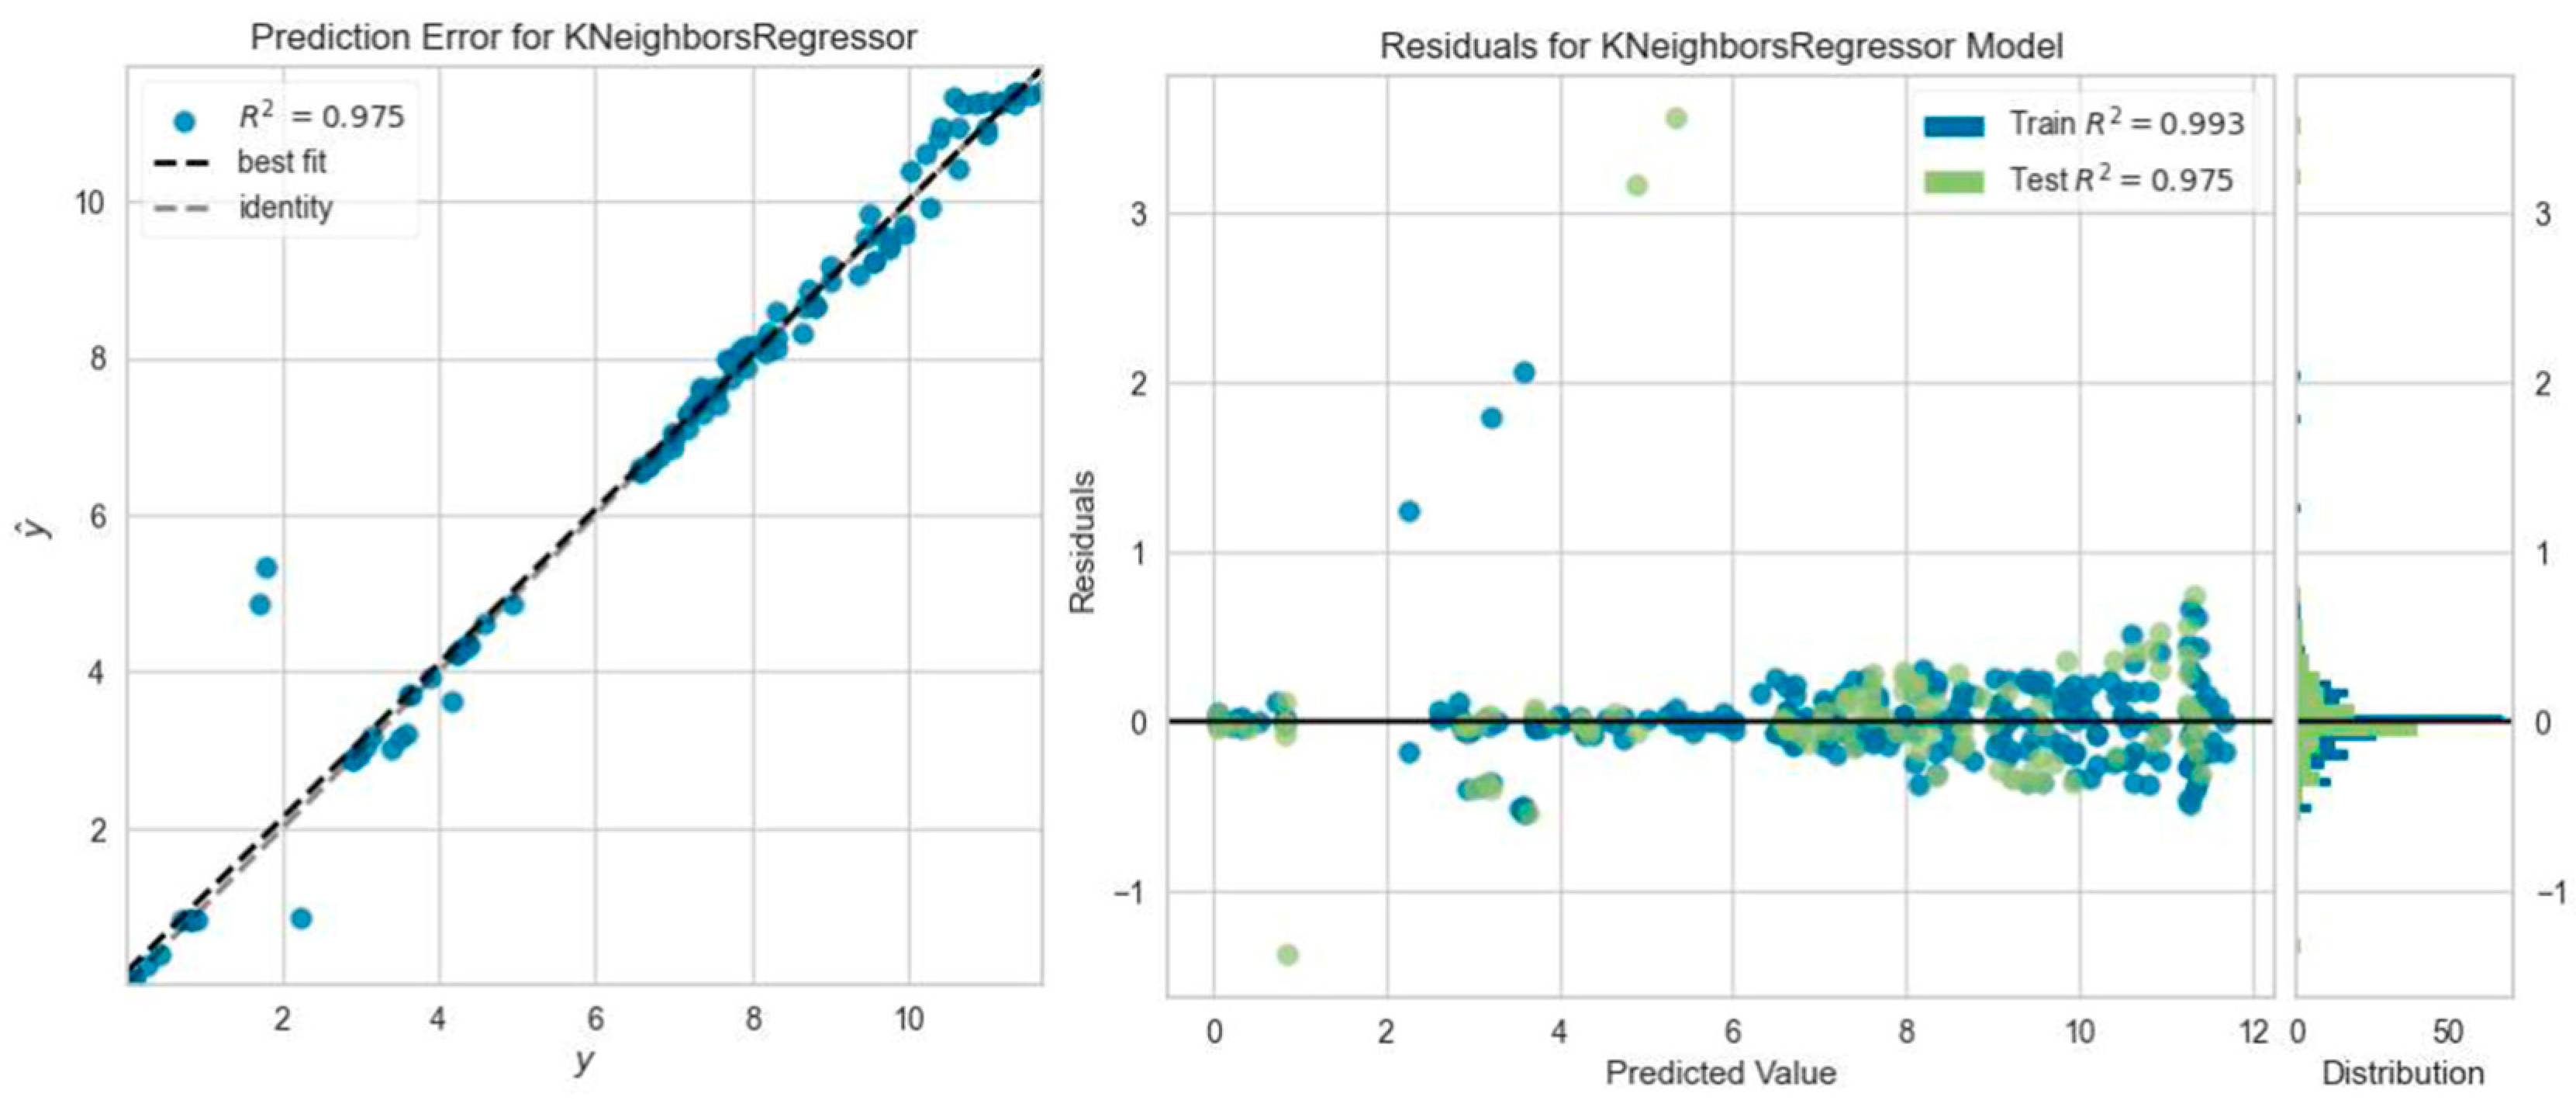
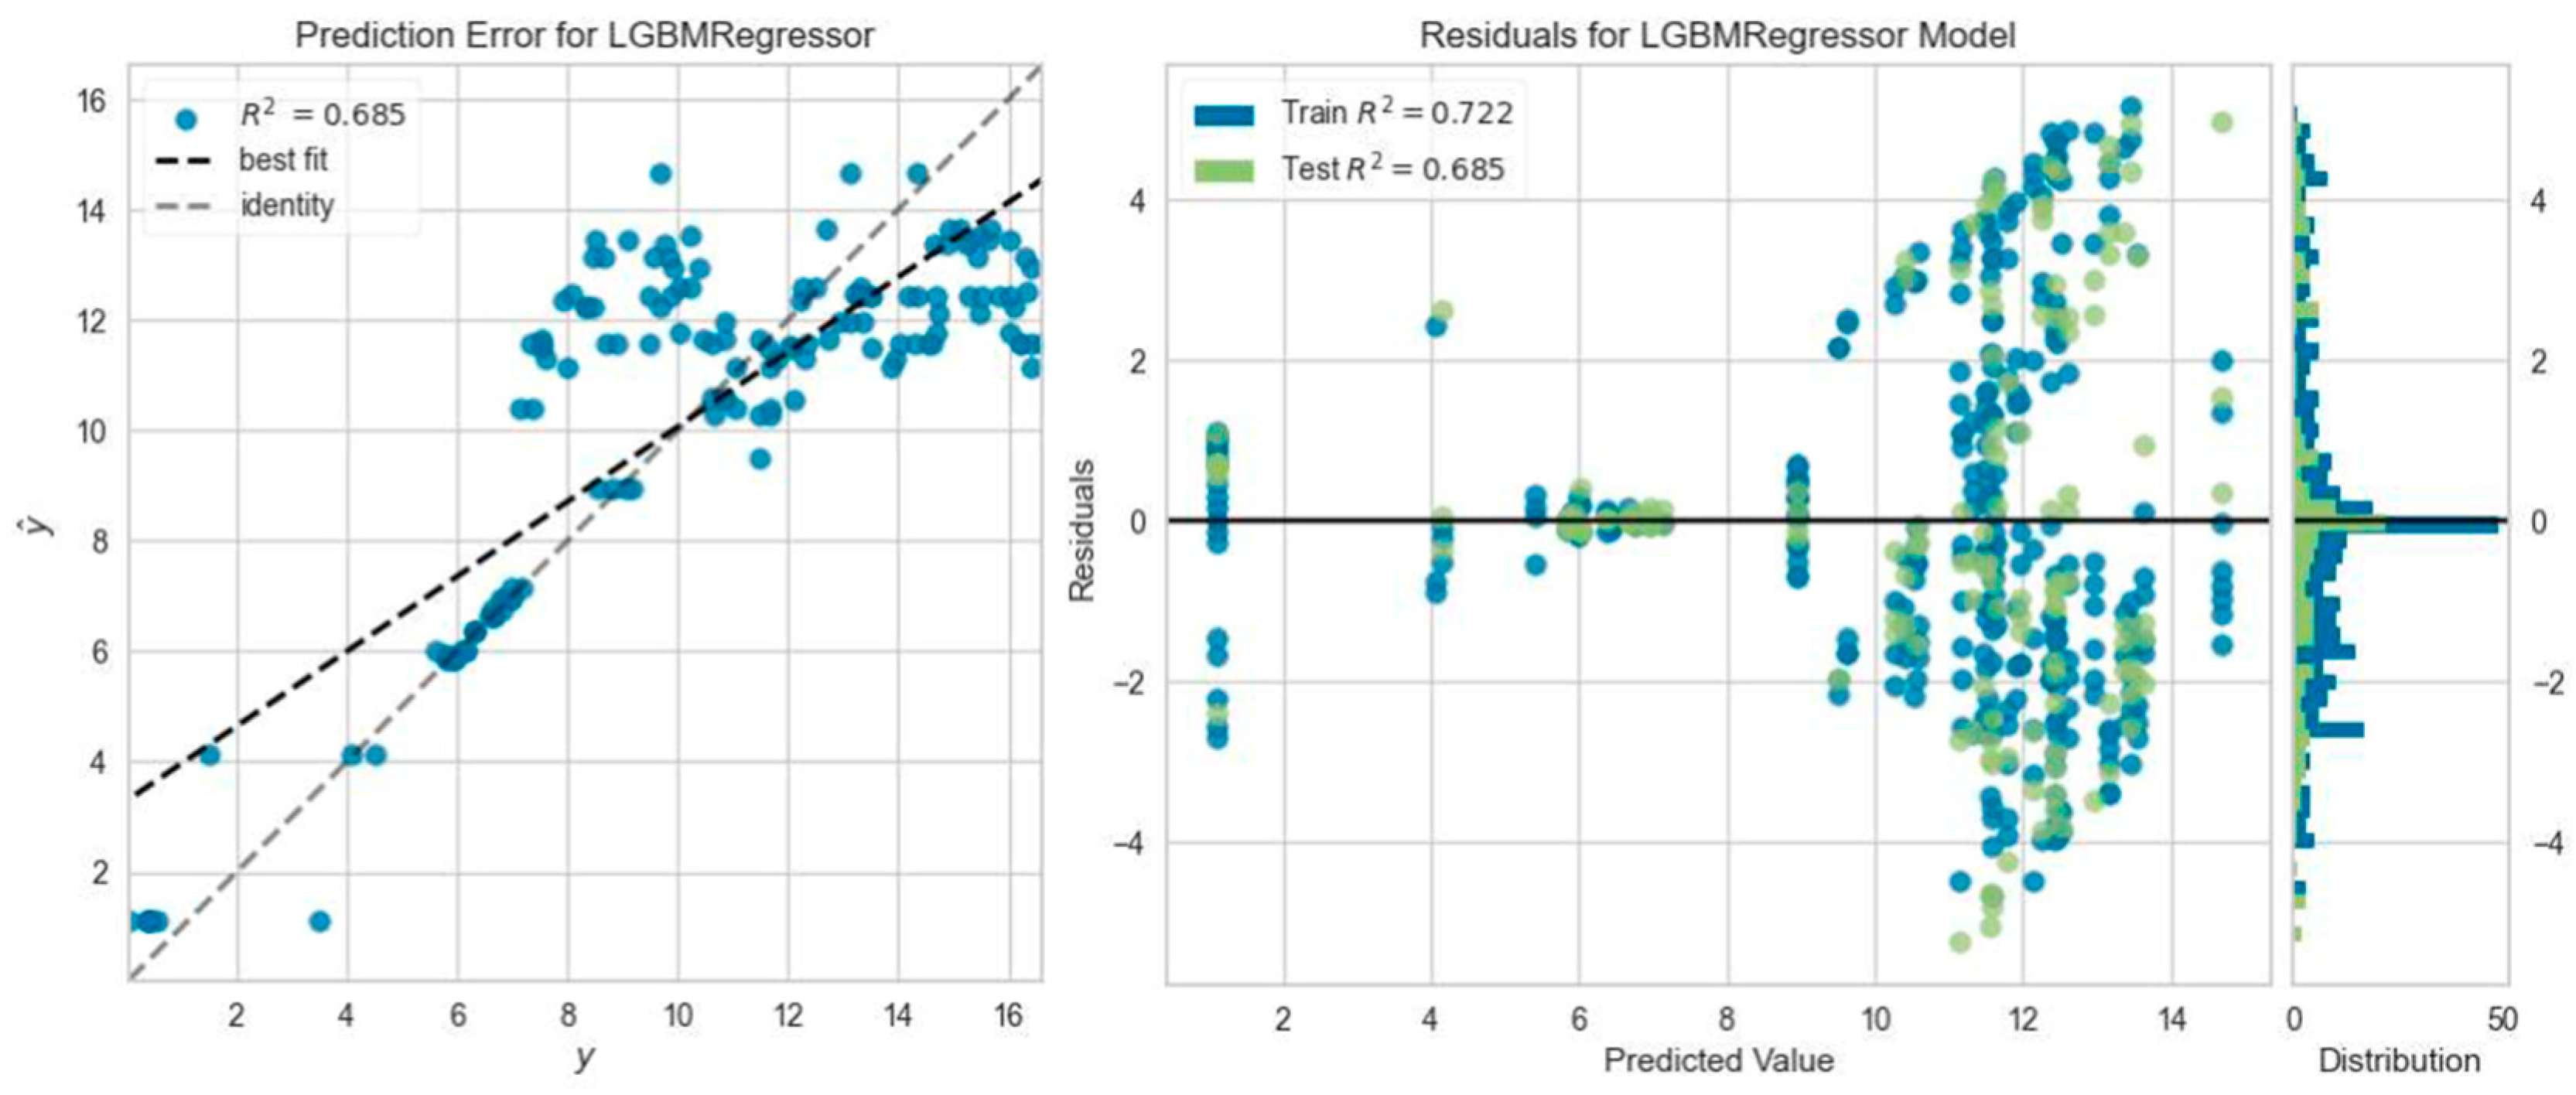
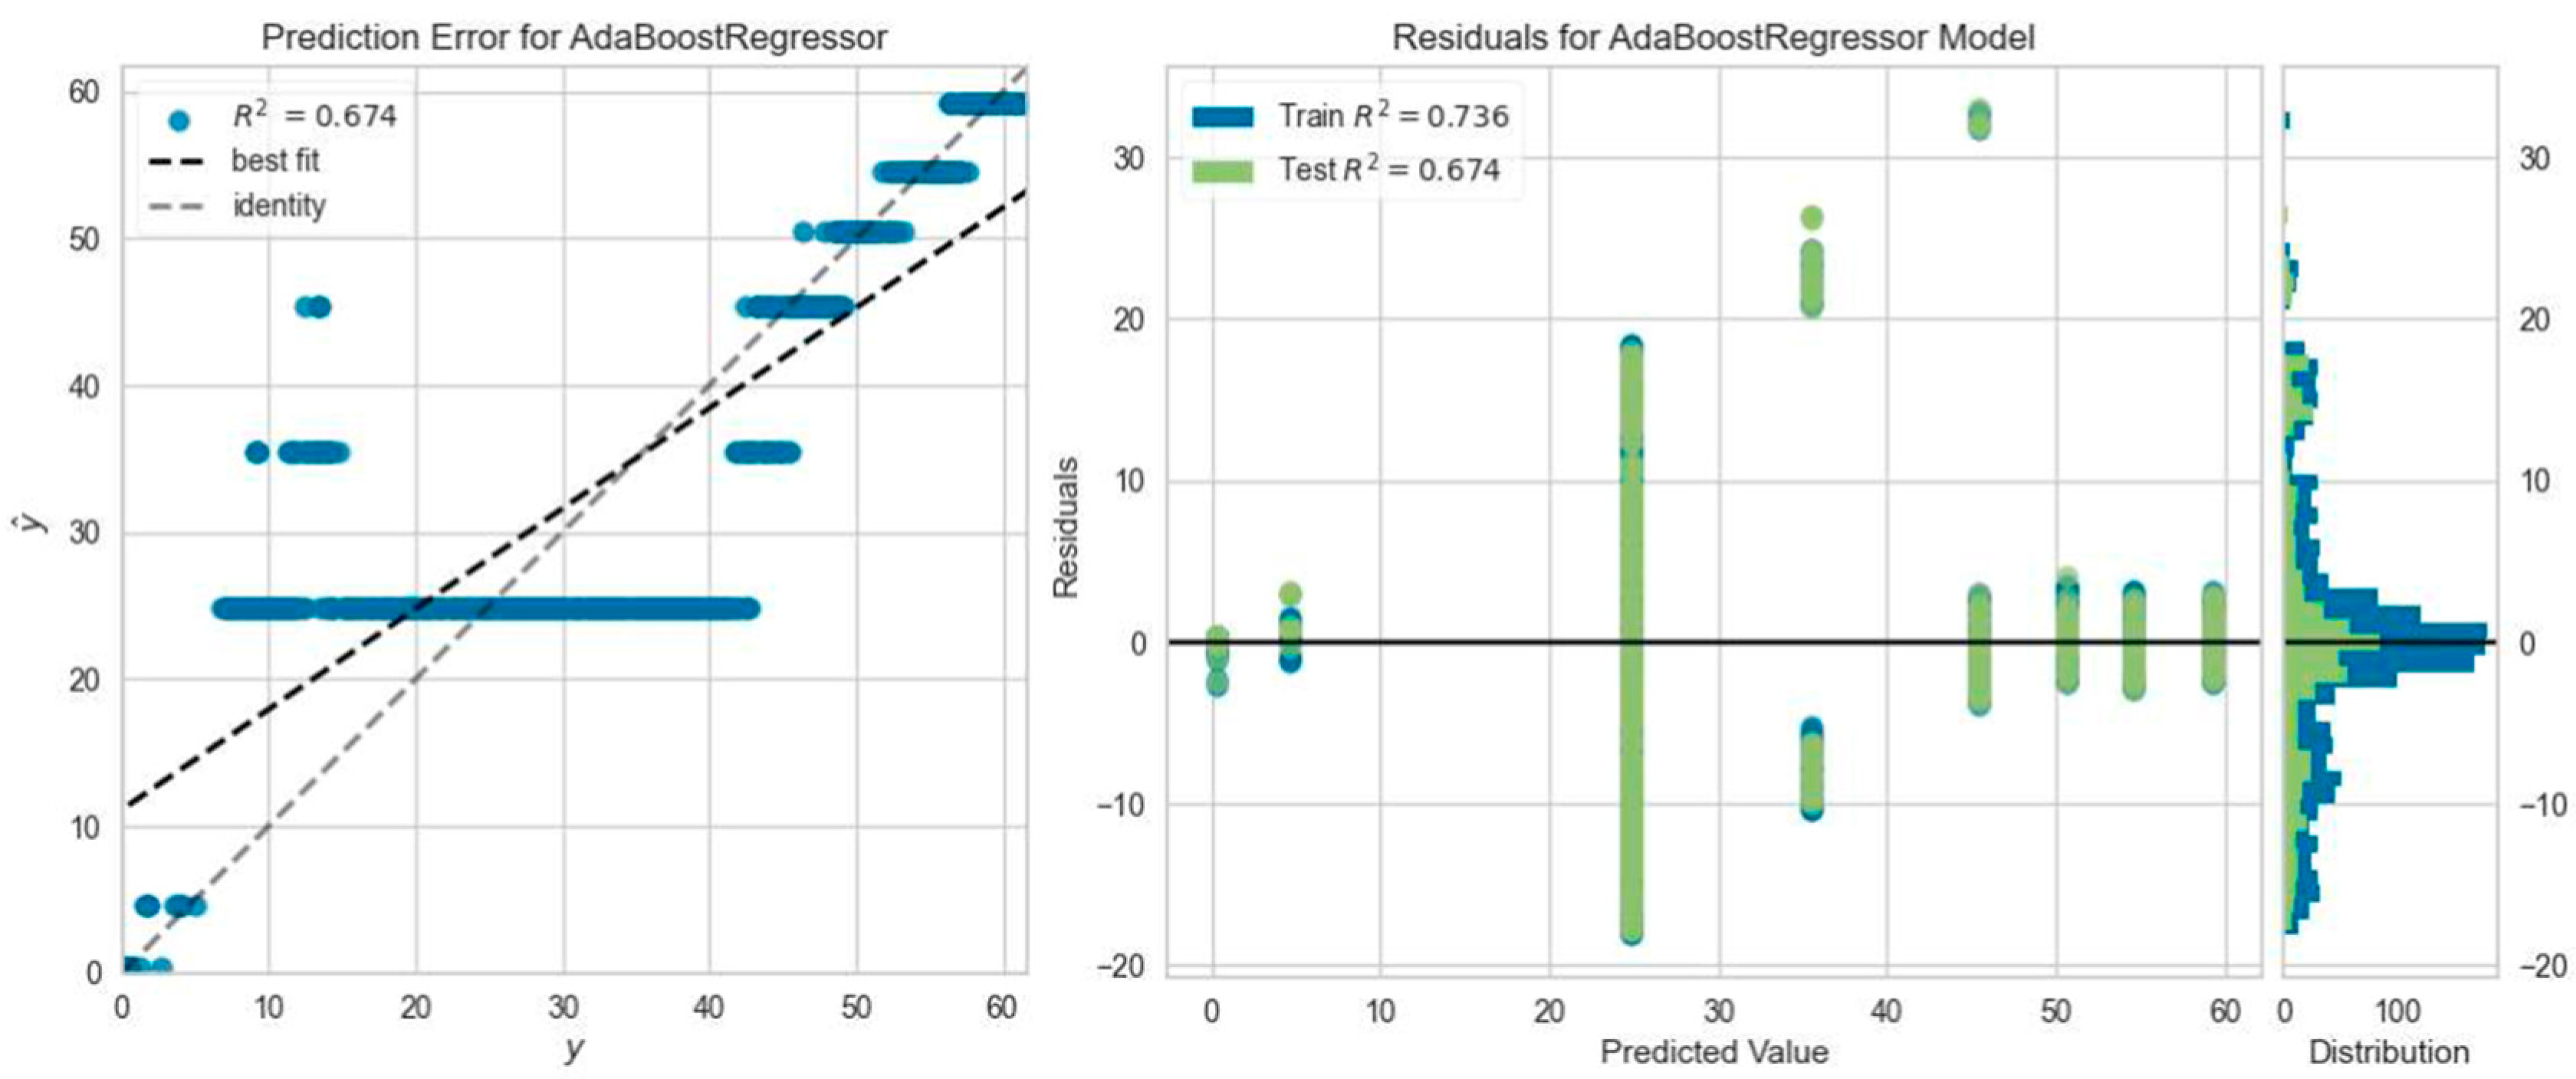
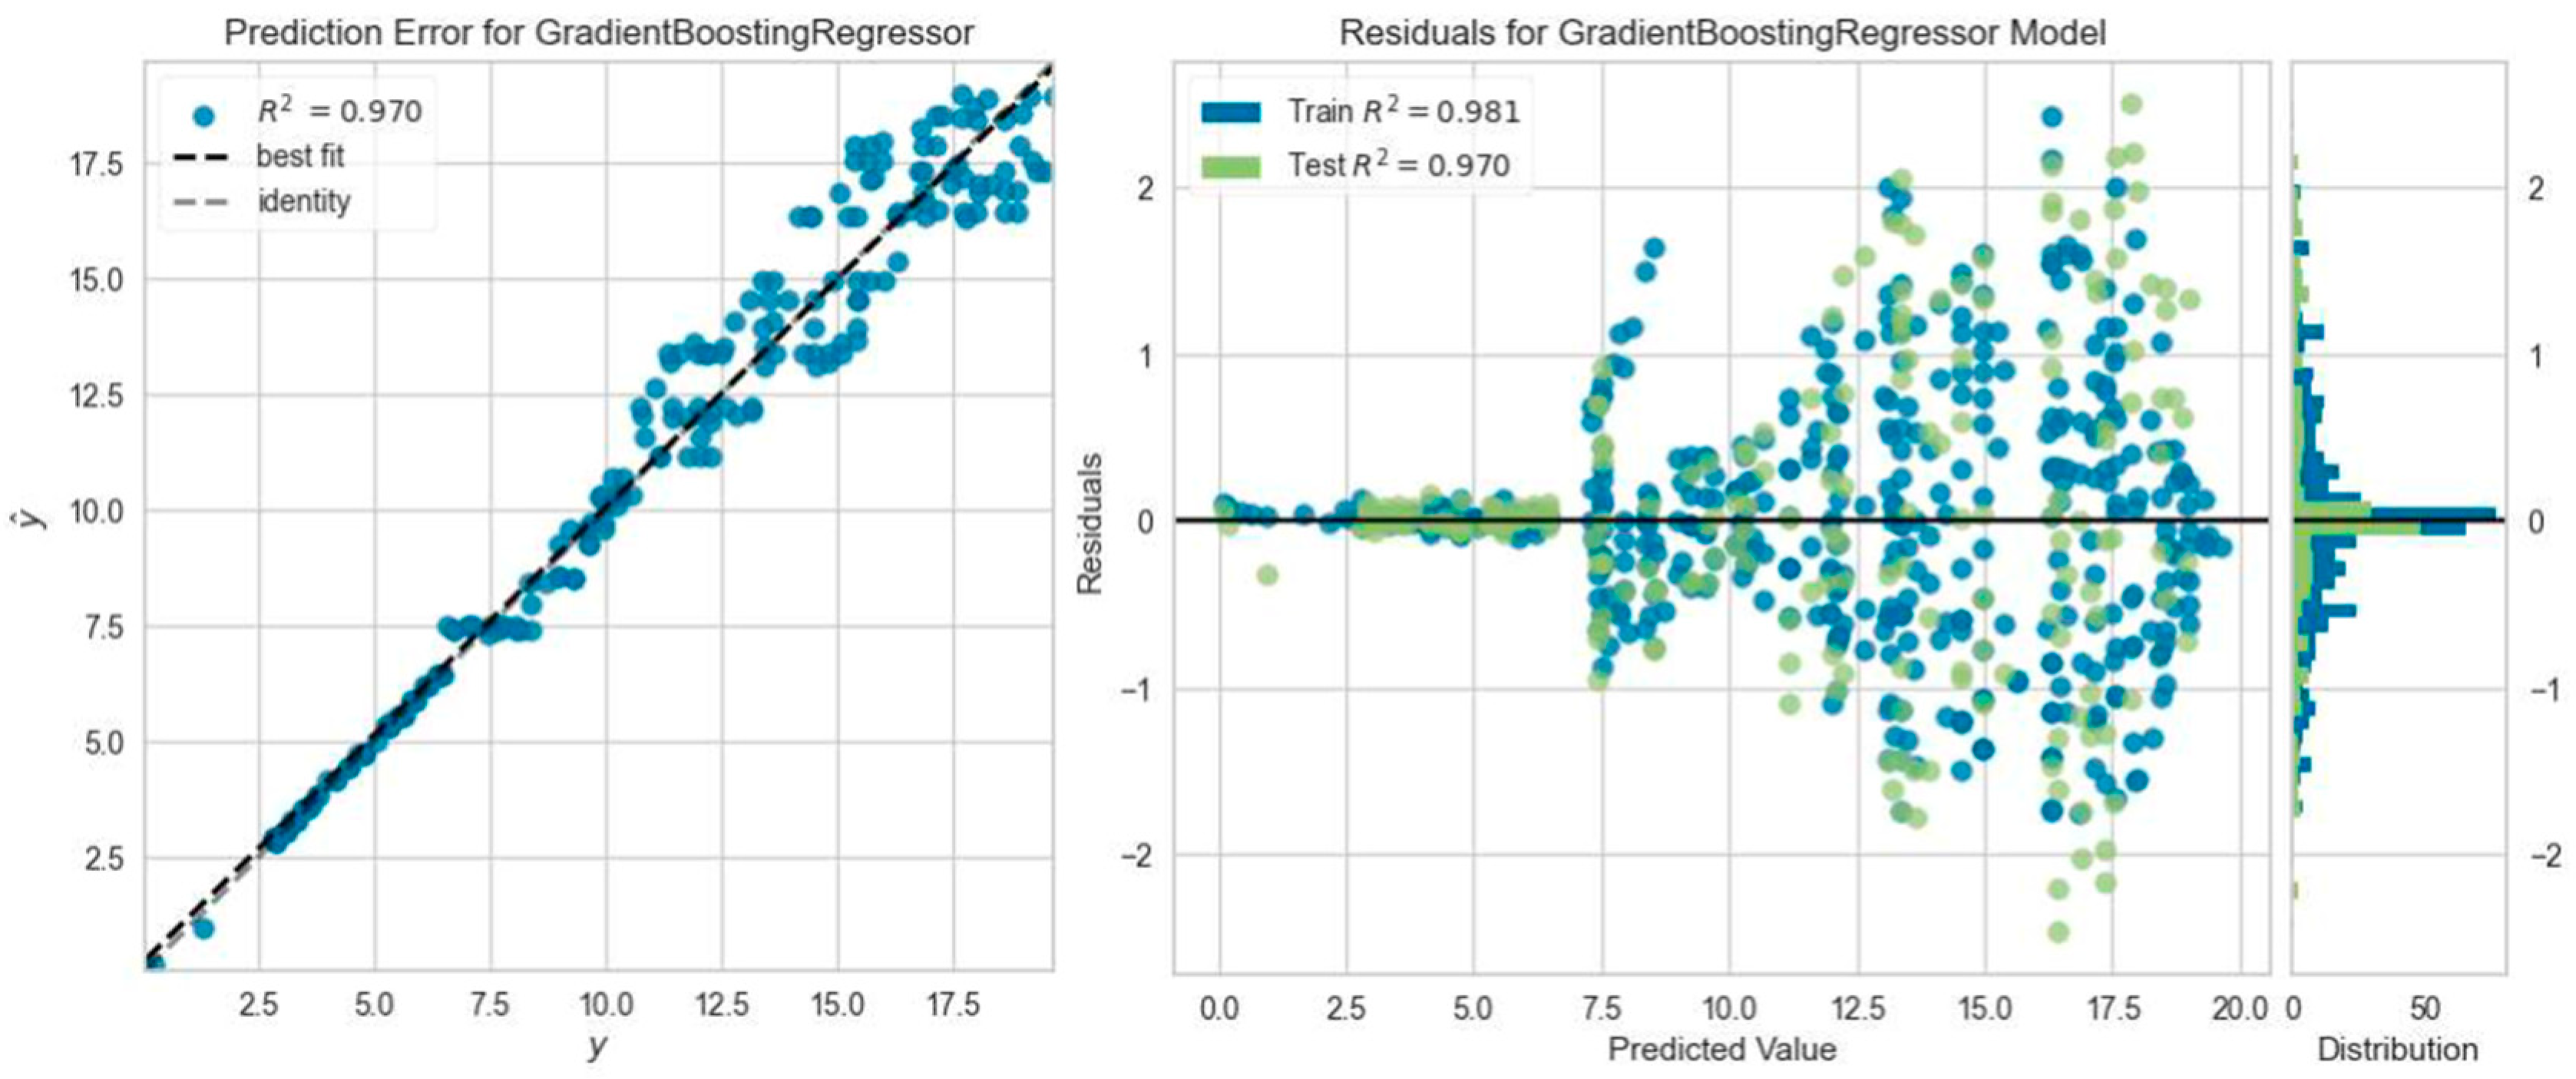
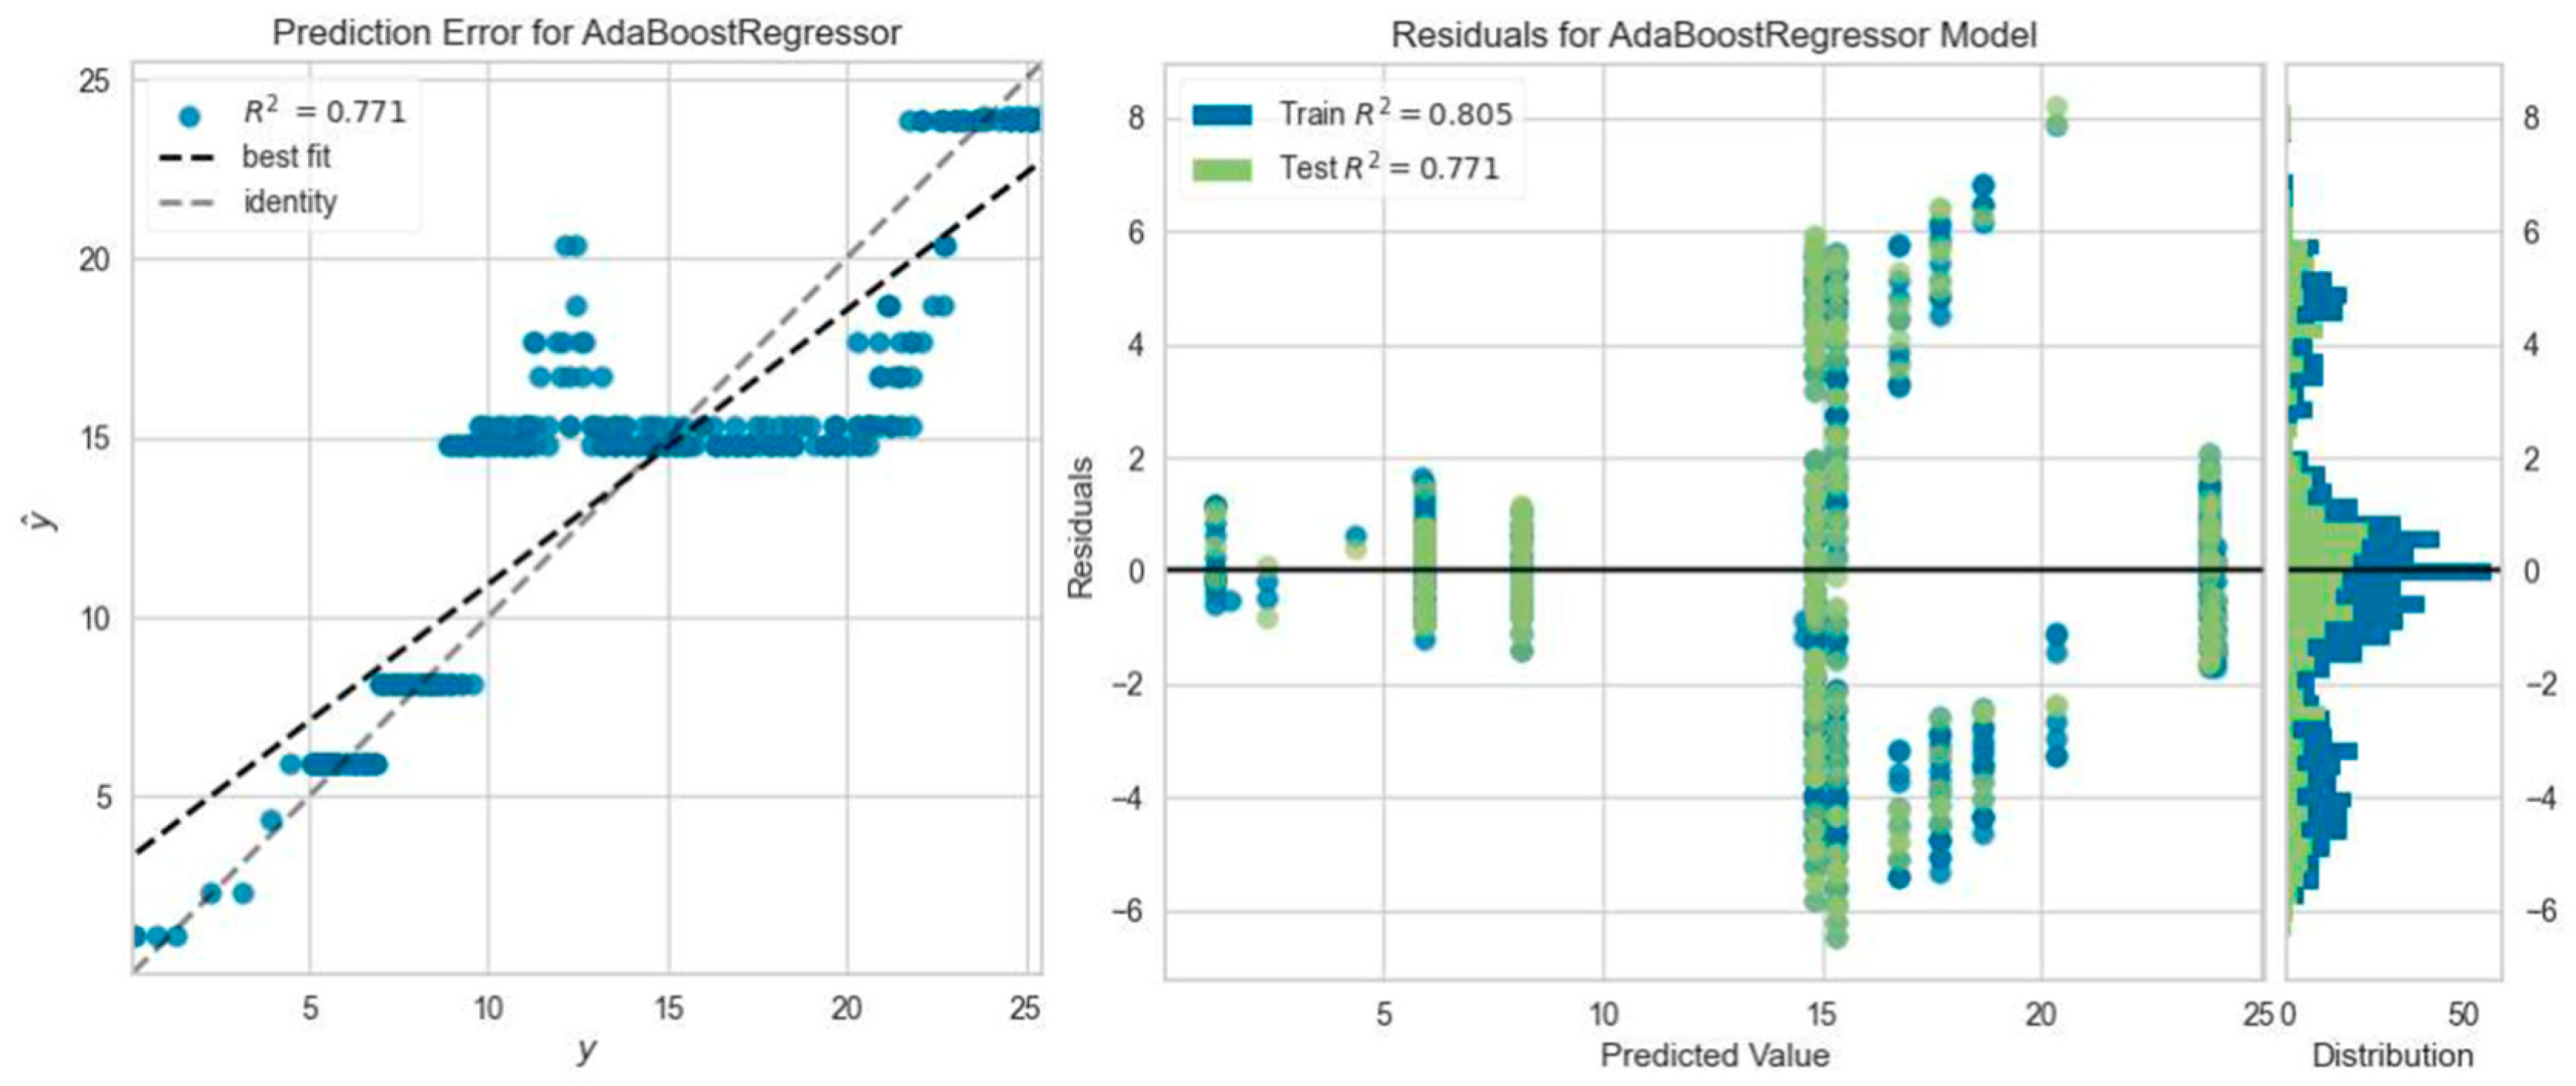
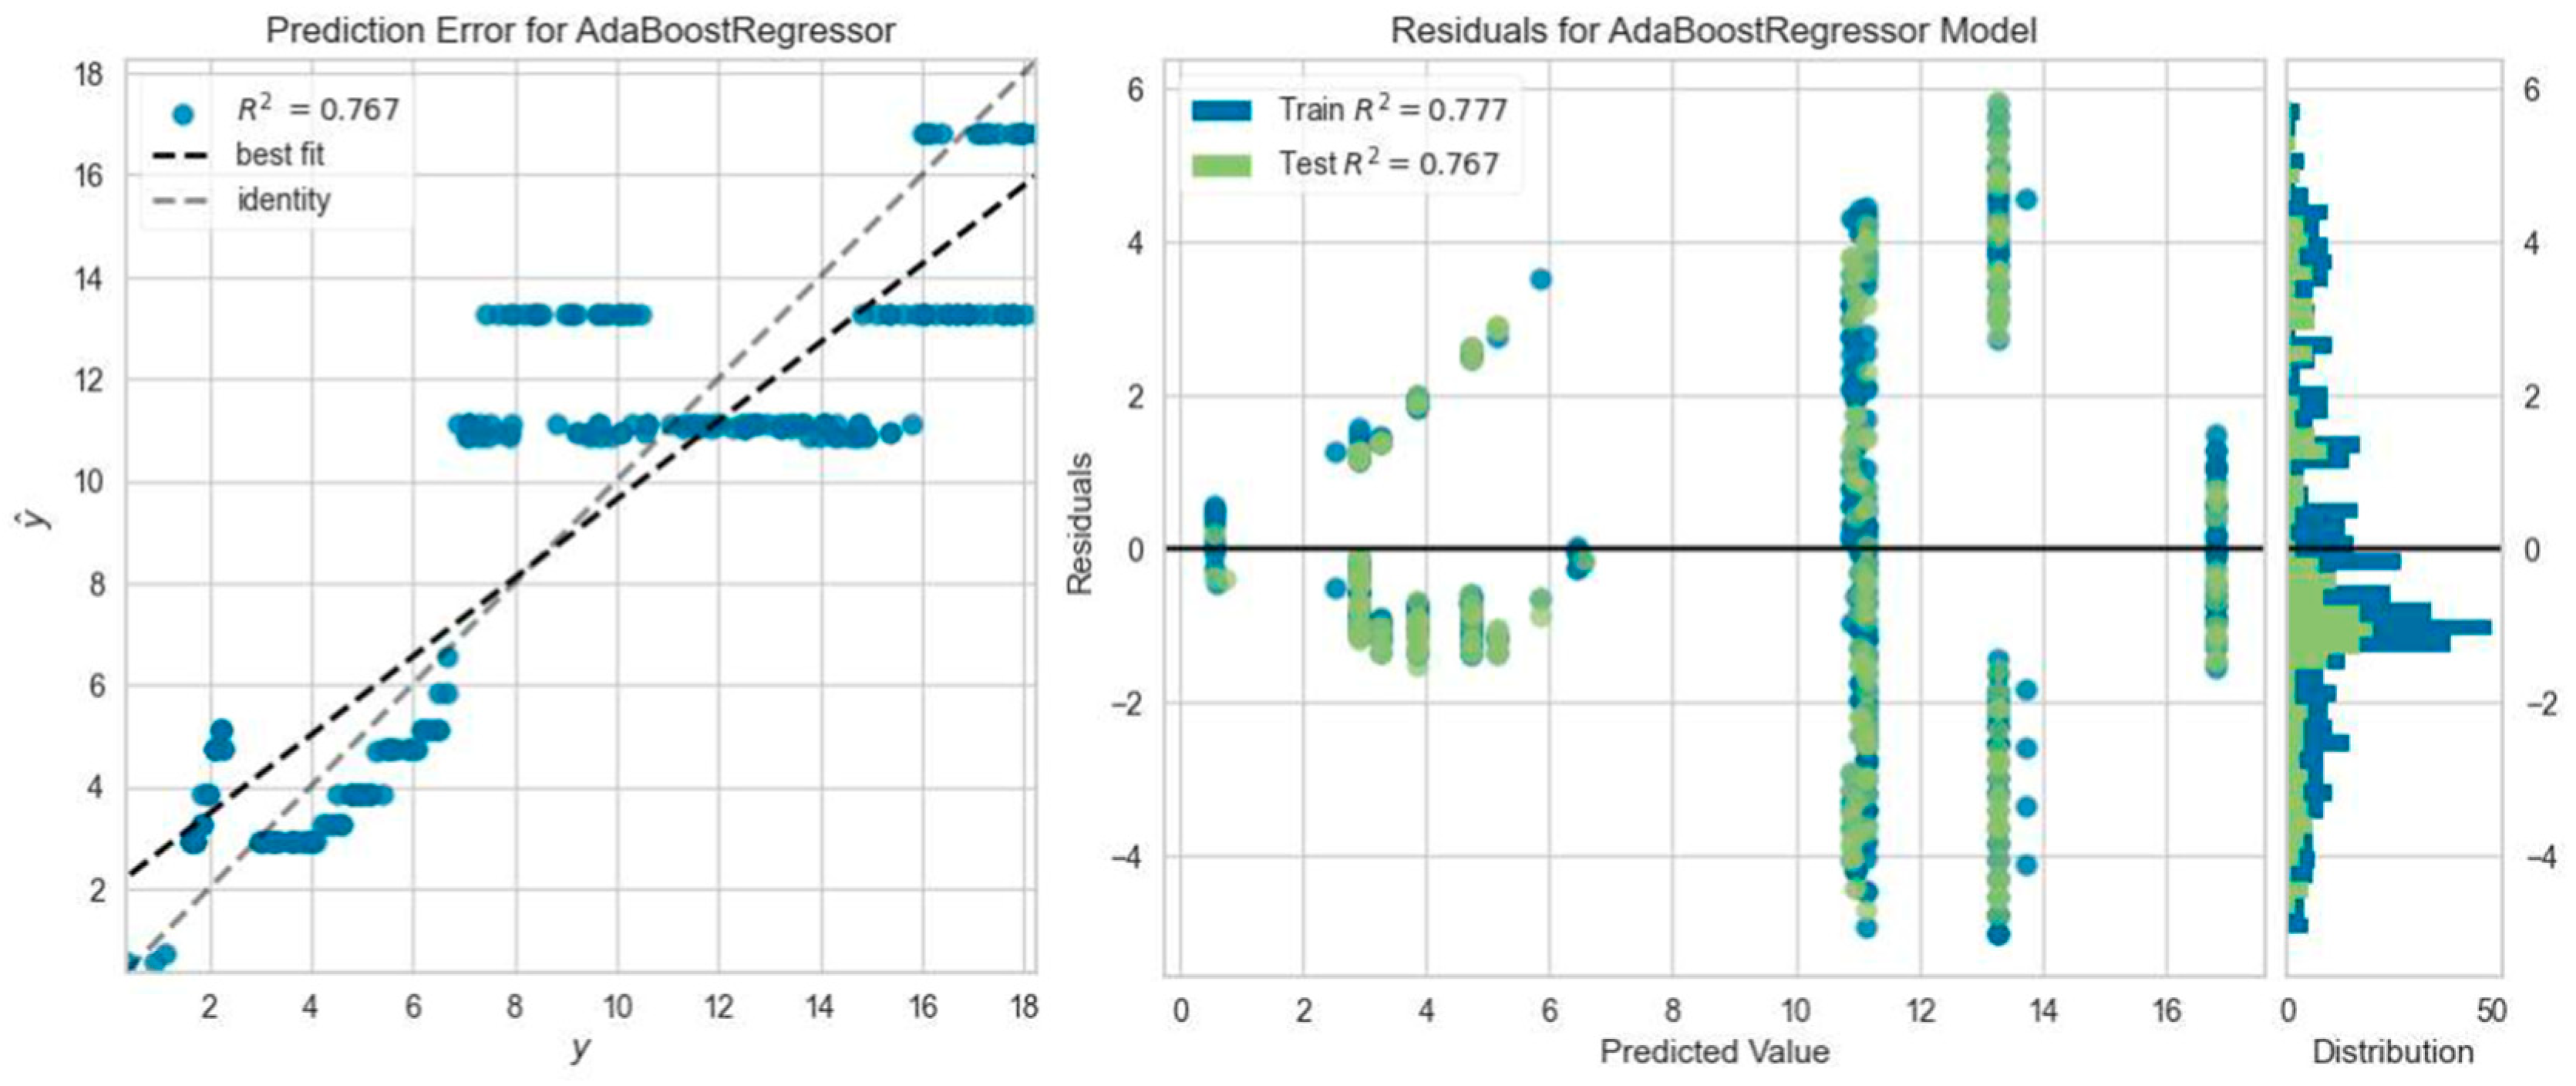
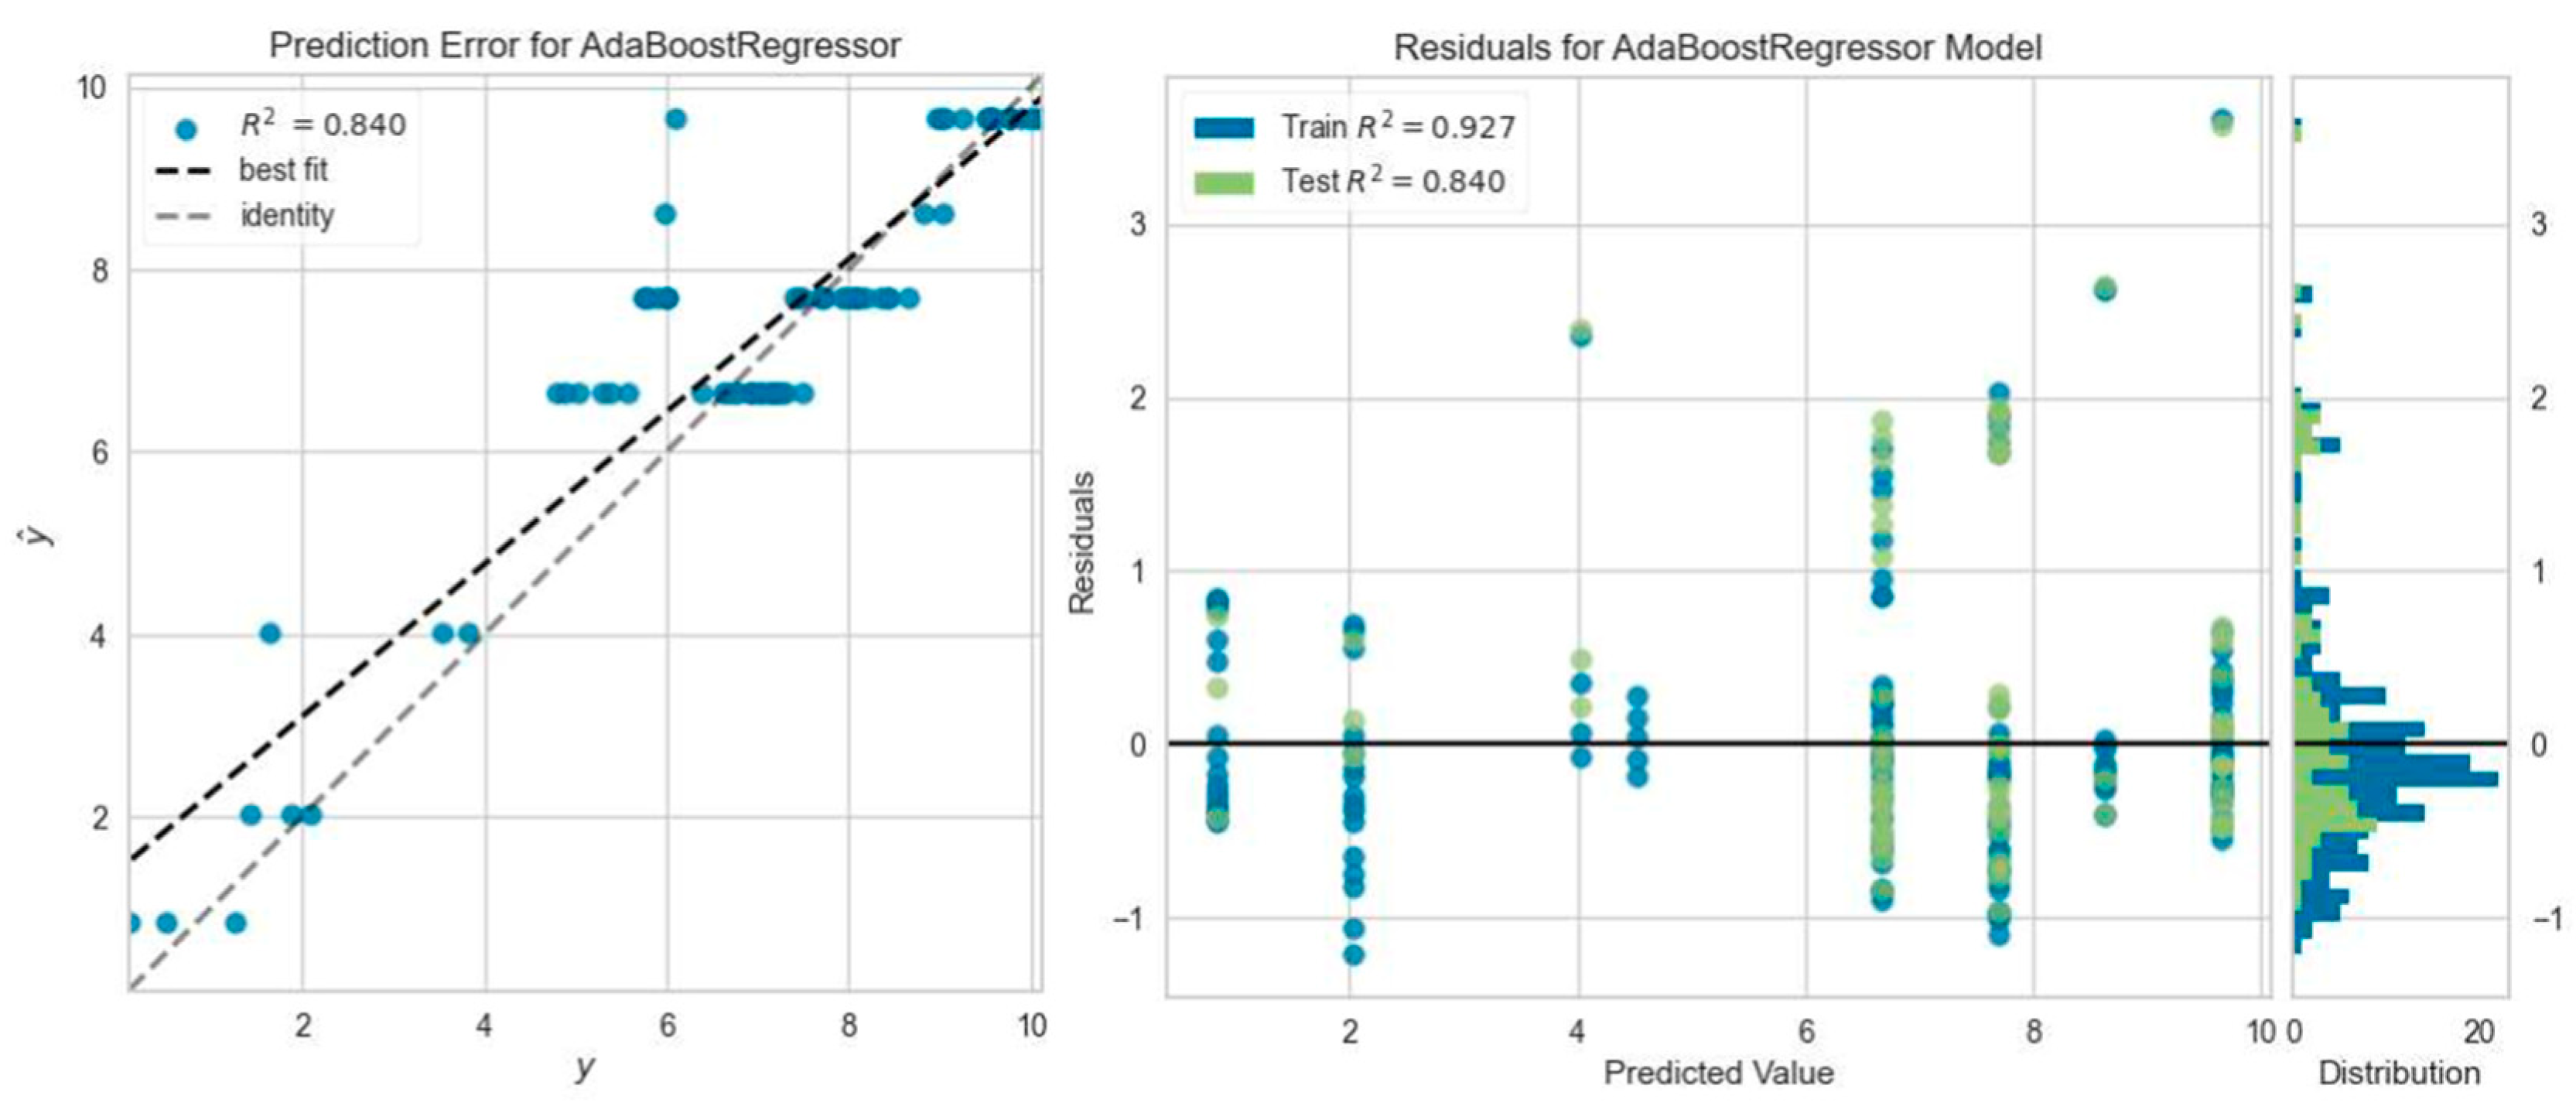
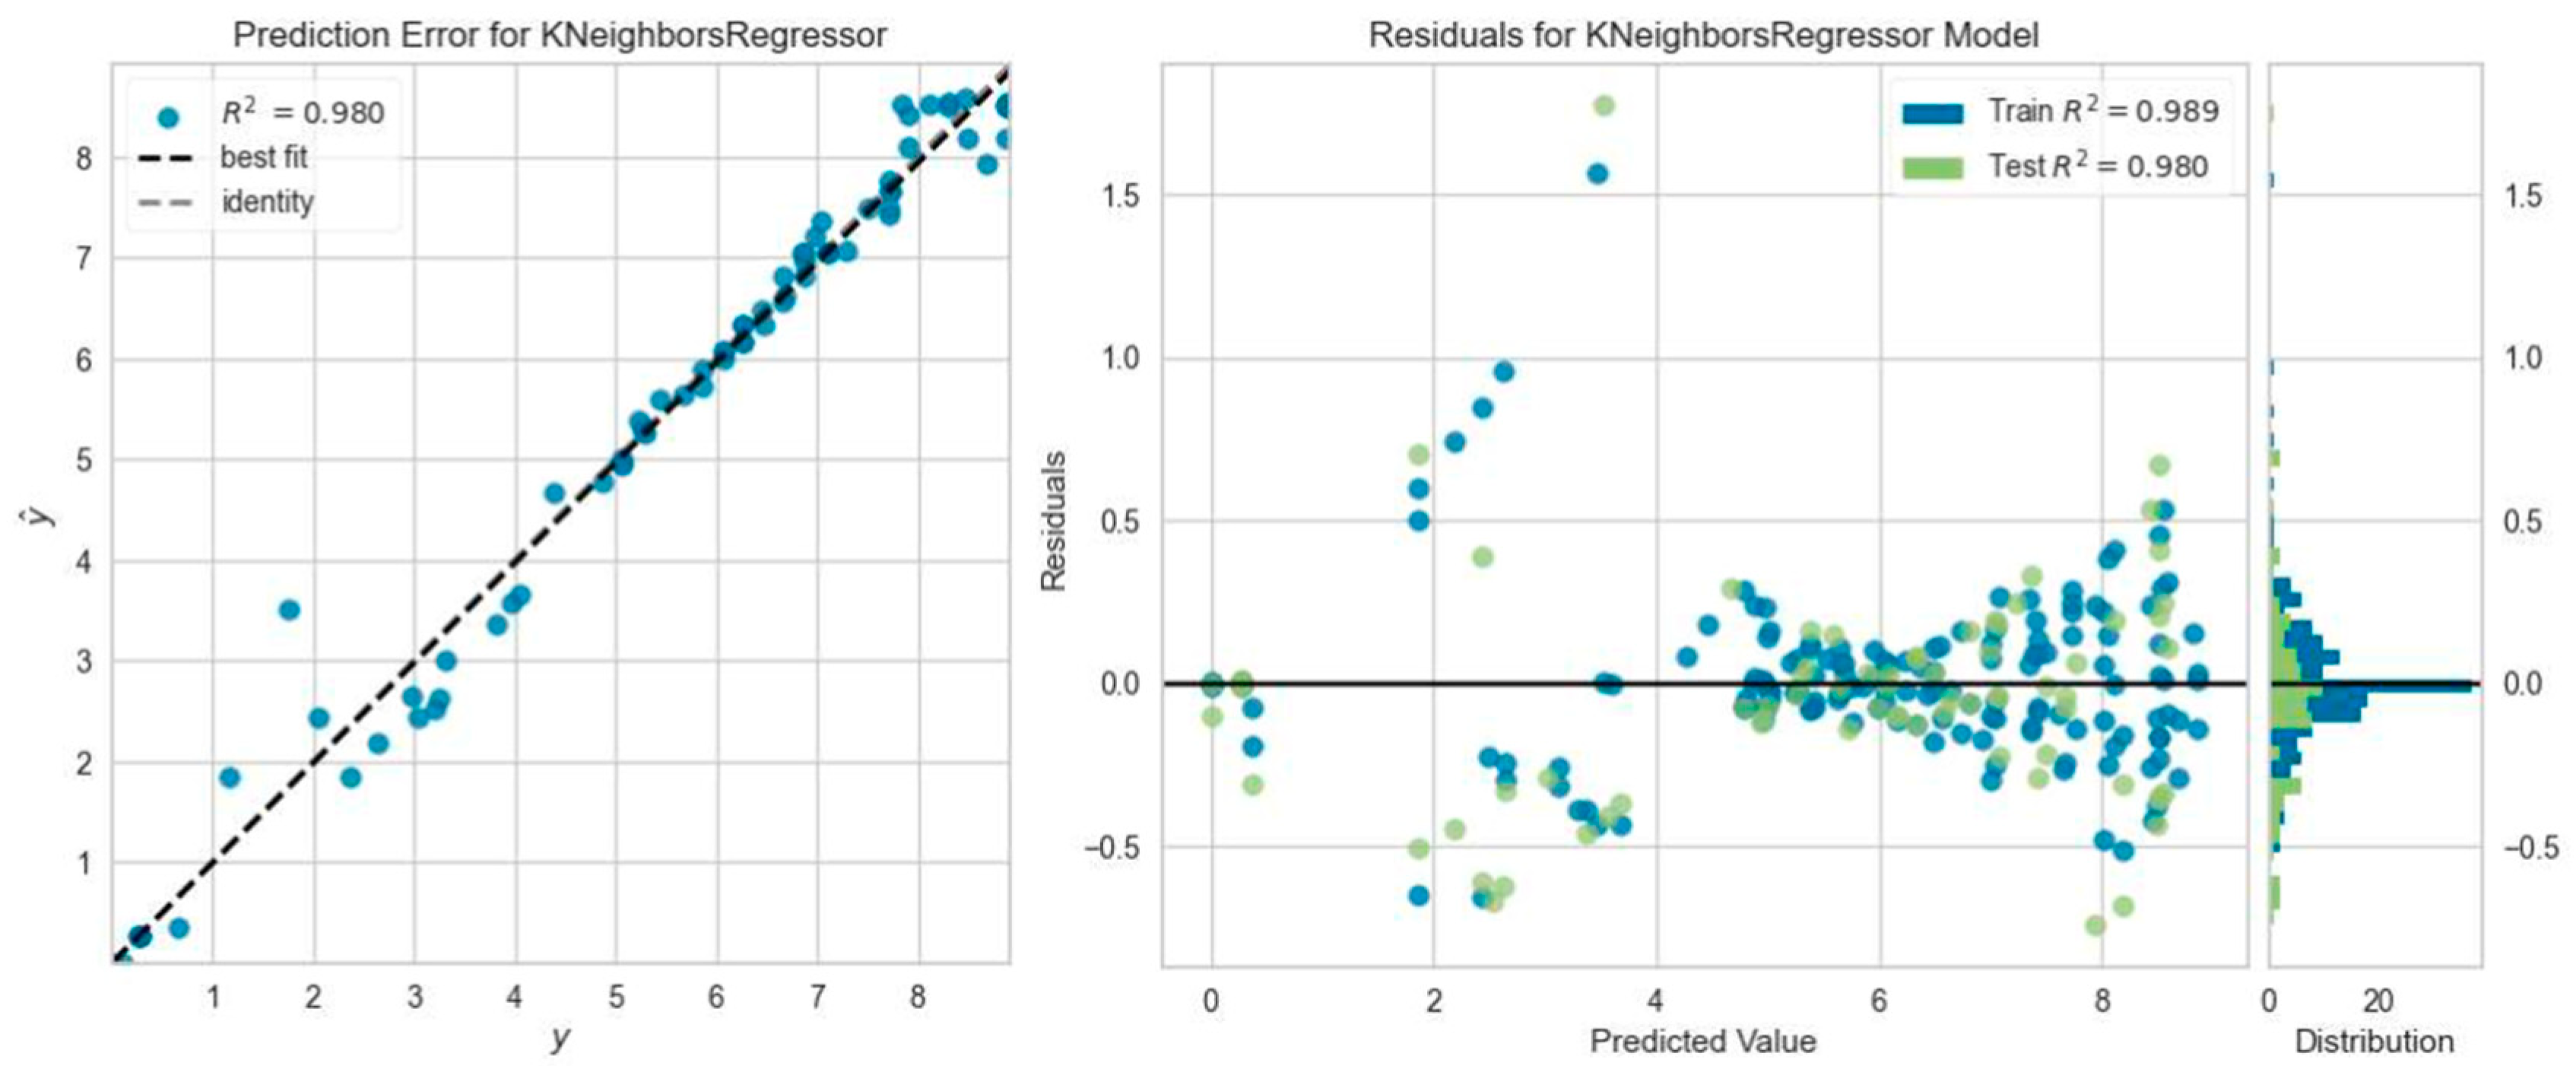
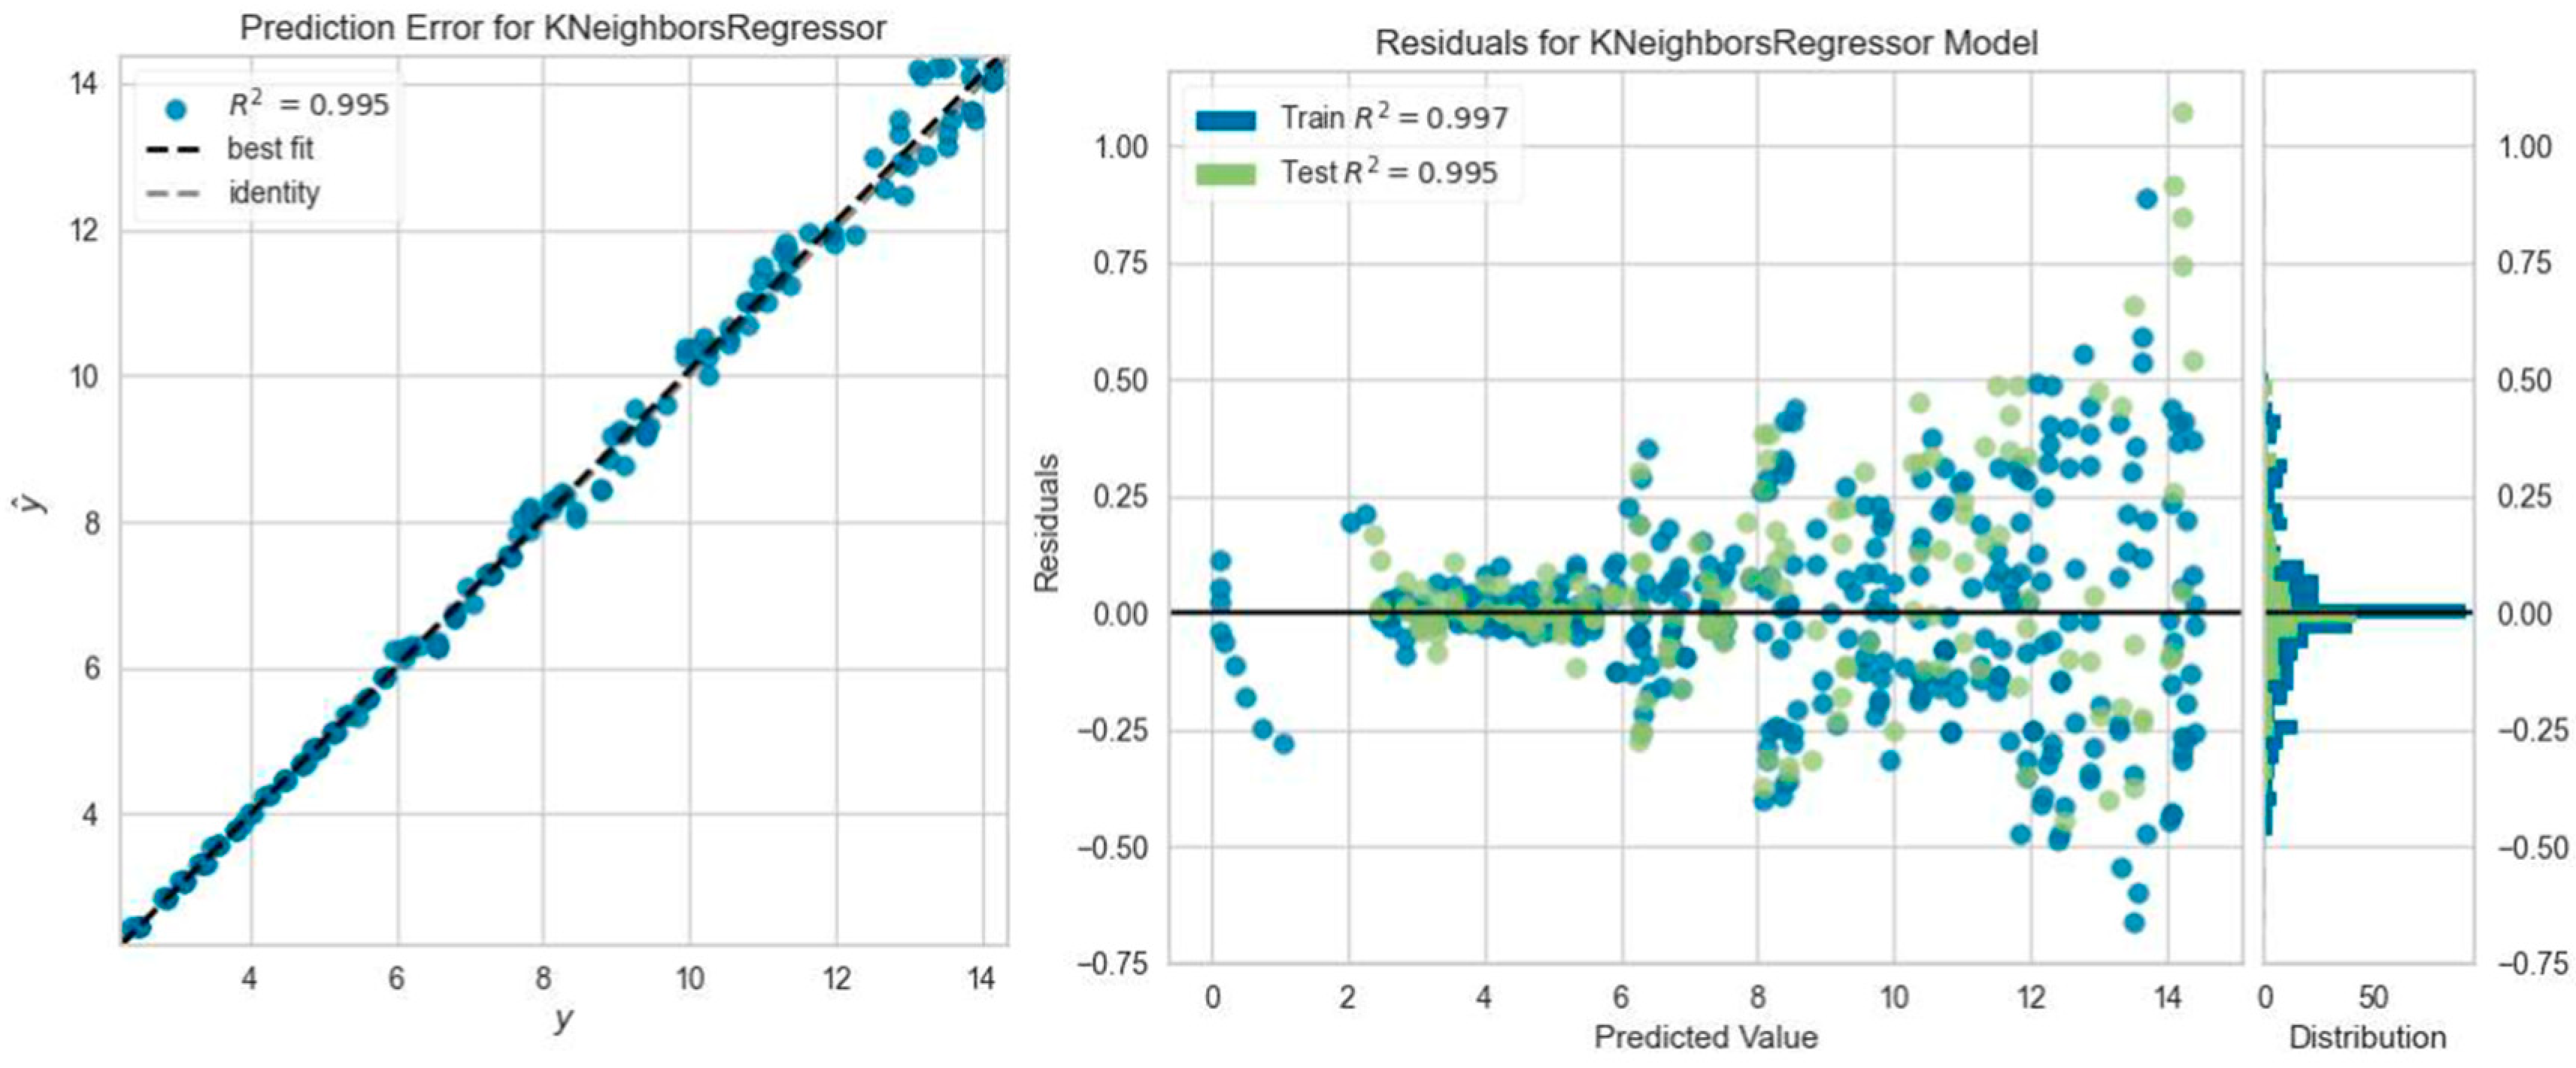
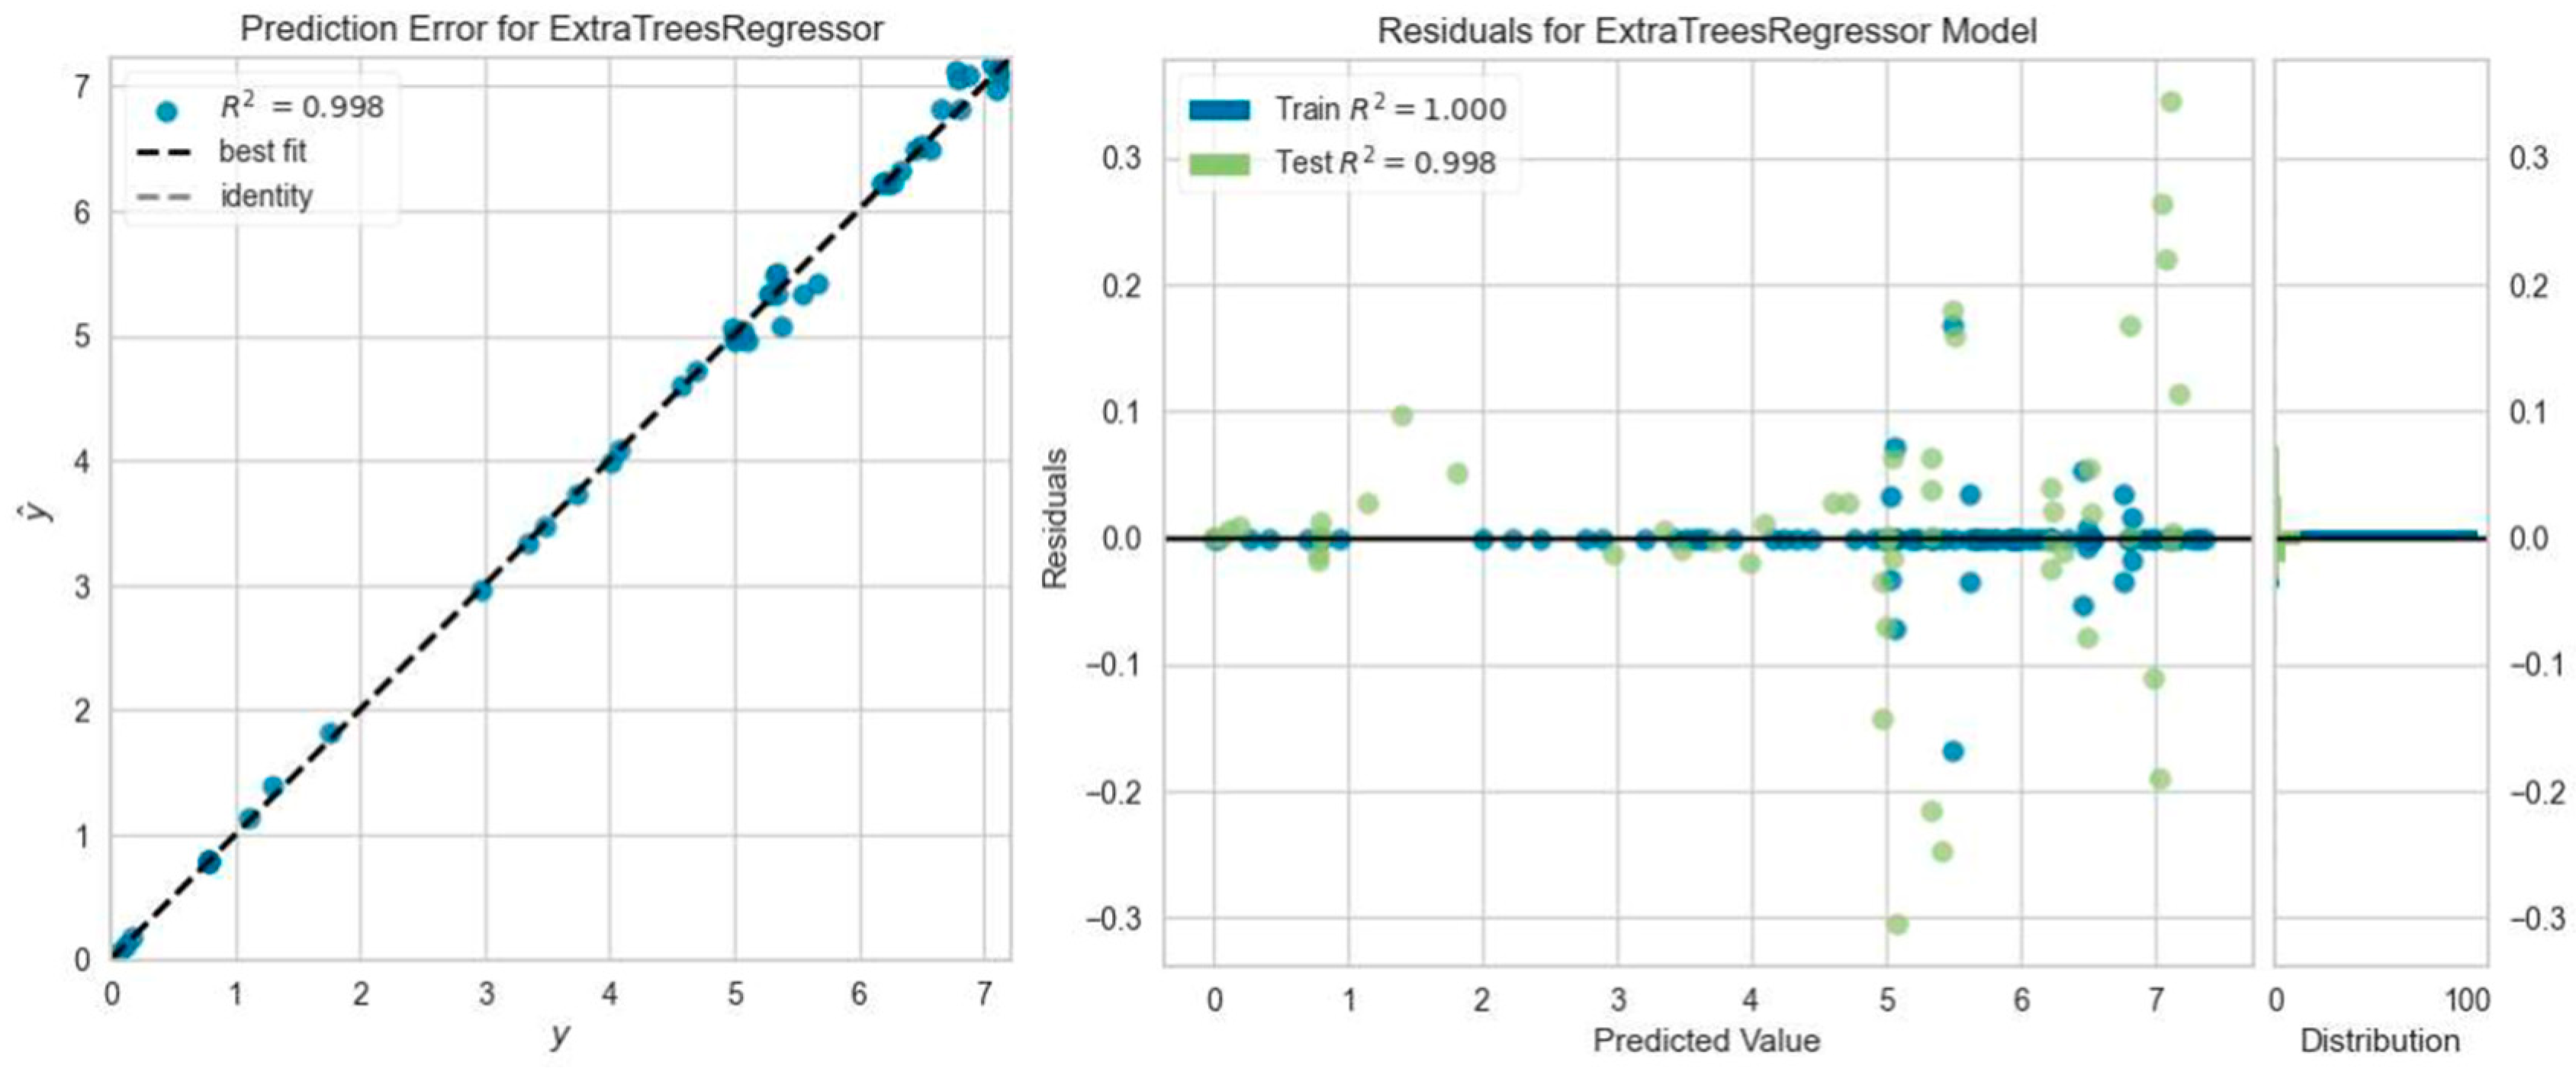
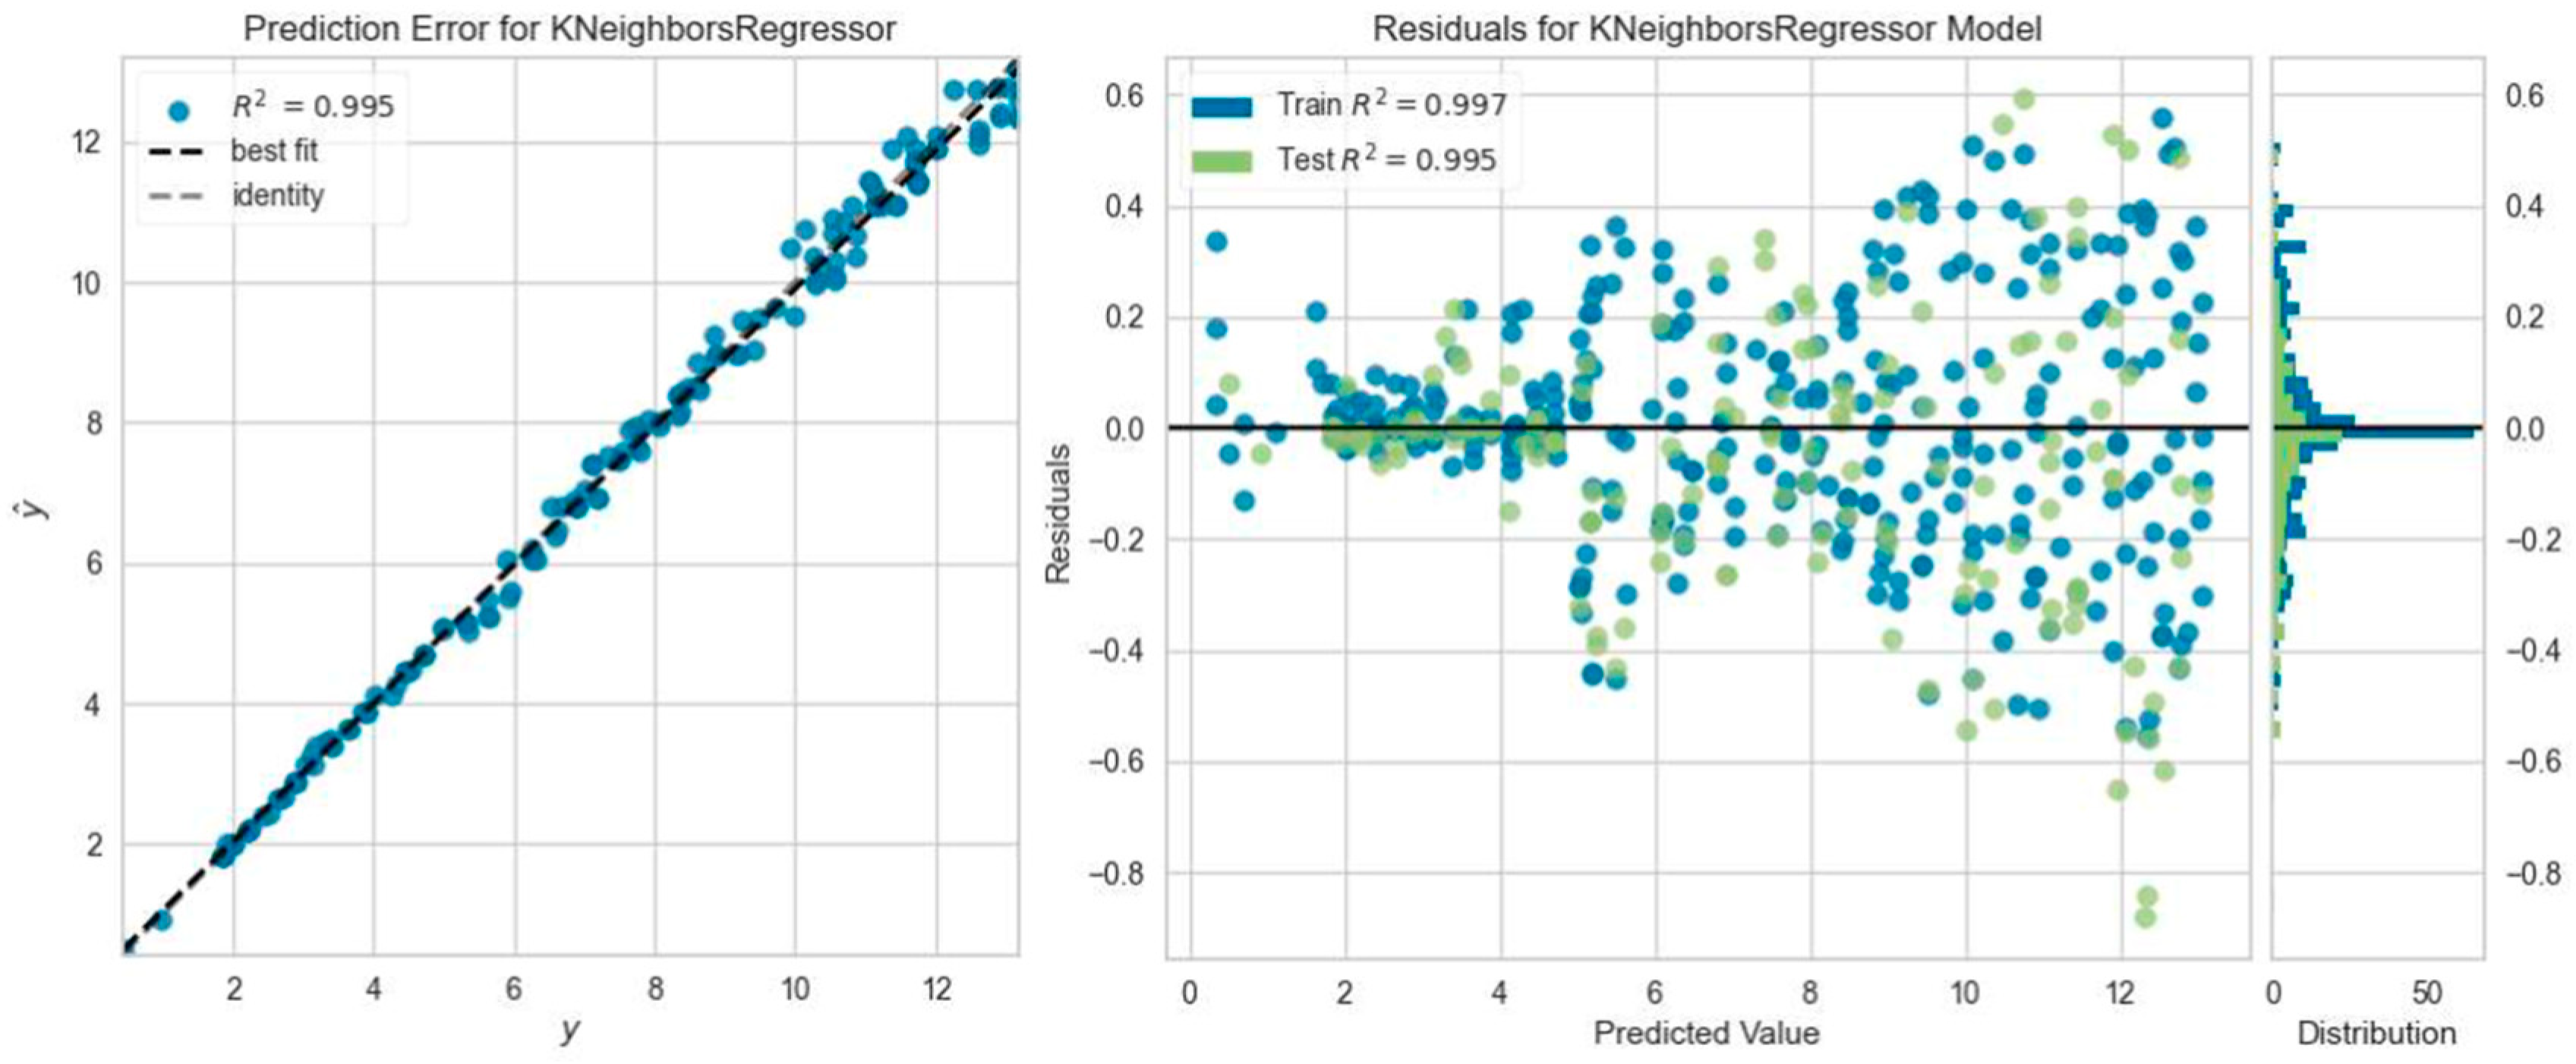
The models that revealed the most accurate deflection R2 result under ultimate load from 18 diverse regression model analyses are presented for each reinforced concrete beam in this section. In addition, the prediction error graph of the model that revealed the best result and the residual graph indicating the residual value that gives the difference between the experimentally measured value and the predicted value were created. These graphs are displayed below in Figure 10, Figure 11, Figure 12, Figure 13, Figure 14, Figure 15, Figure 16, Figure 17, Figure 18, Figure 19, Figure 20, Figure 21, Figure 22, Figure 23, Figure 24, Figure 25, Figure 26 and Figure 27 for all reinforced concrete beams.
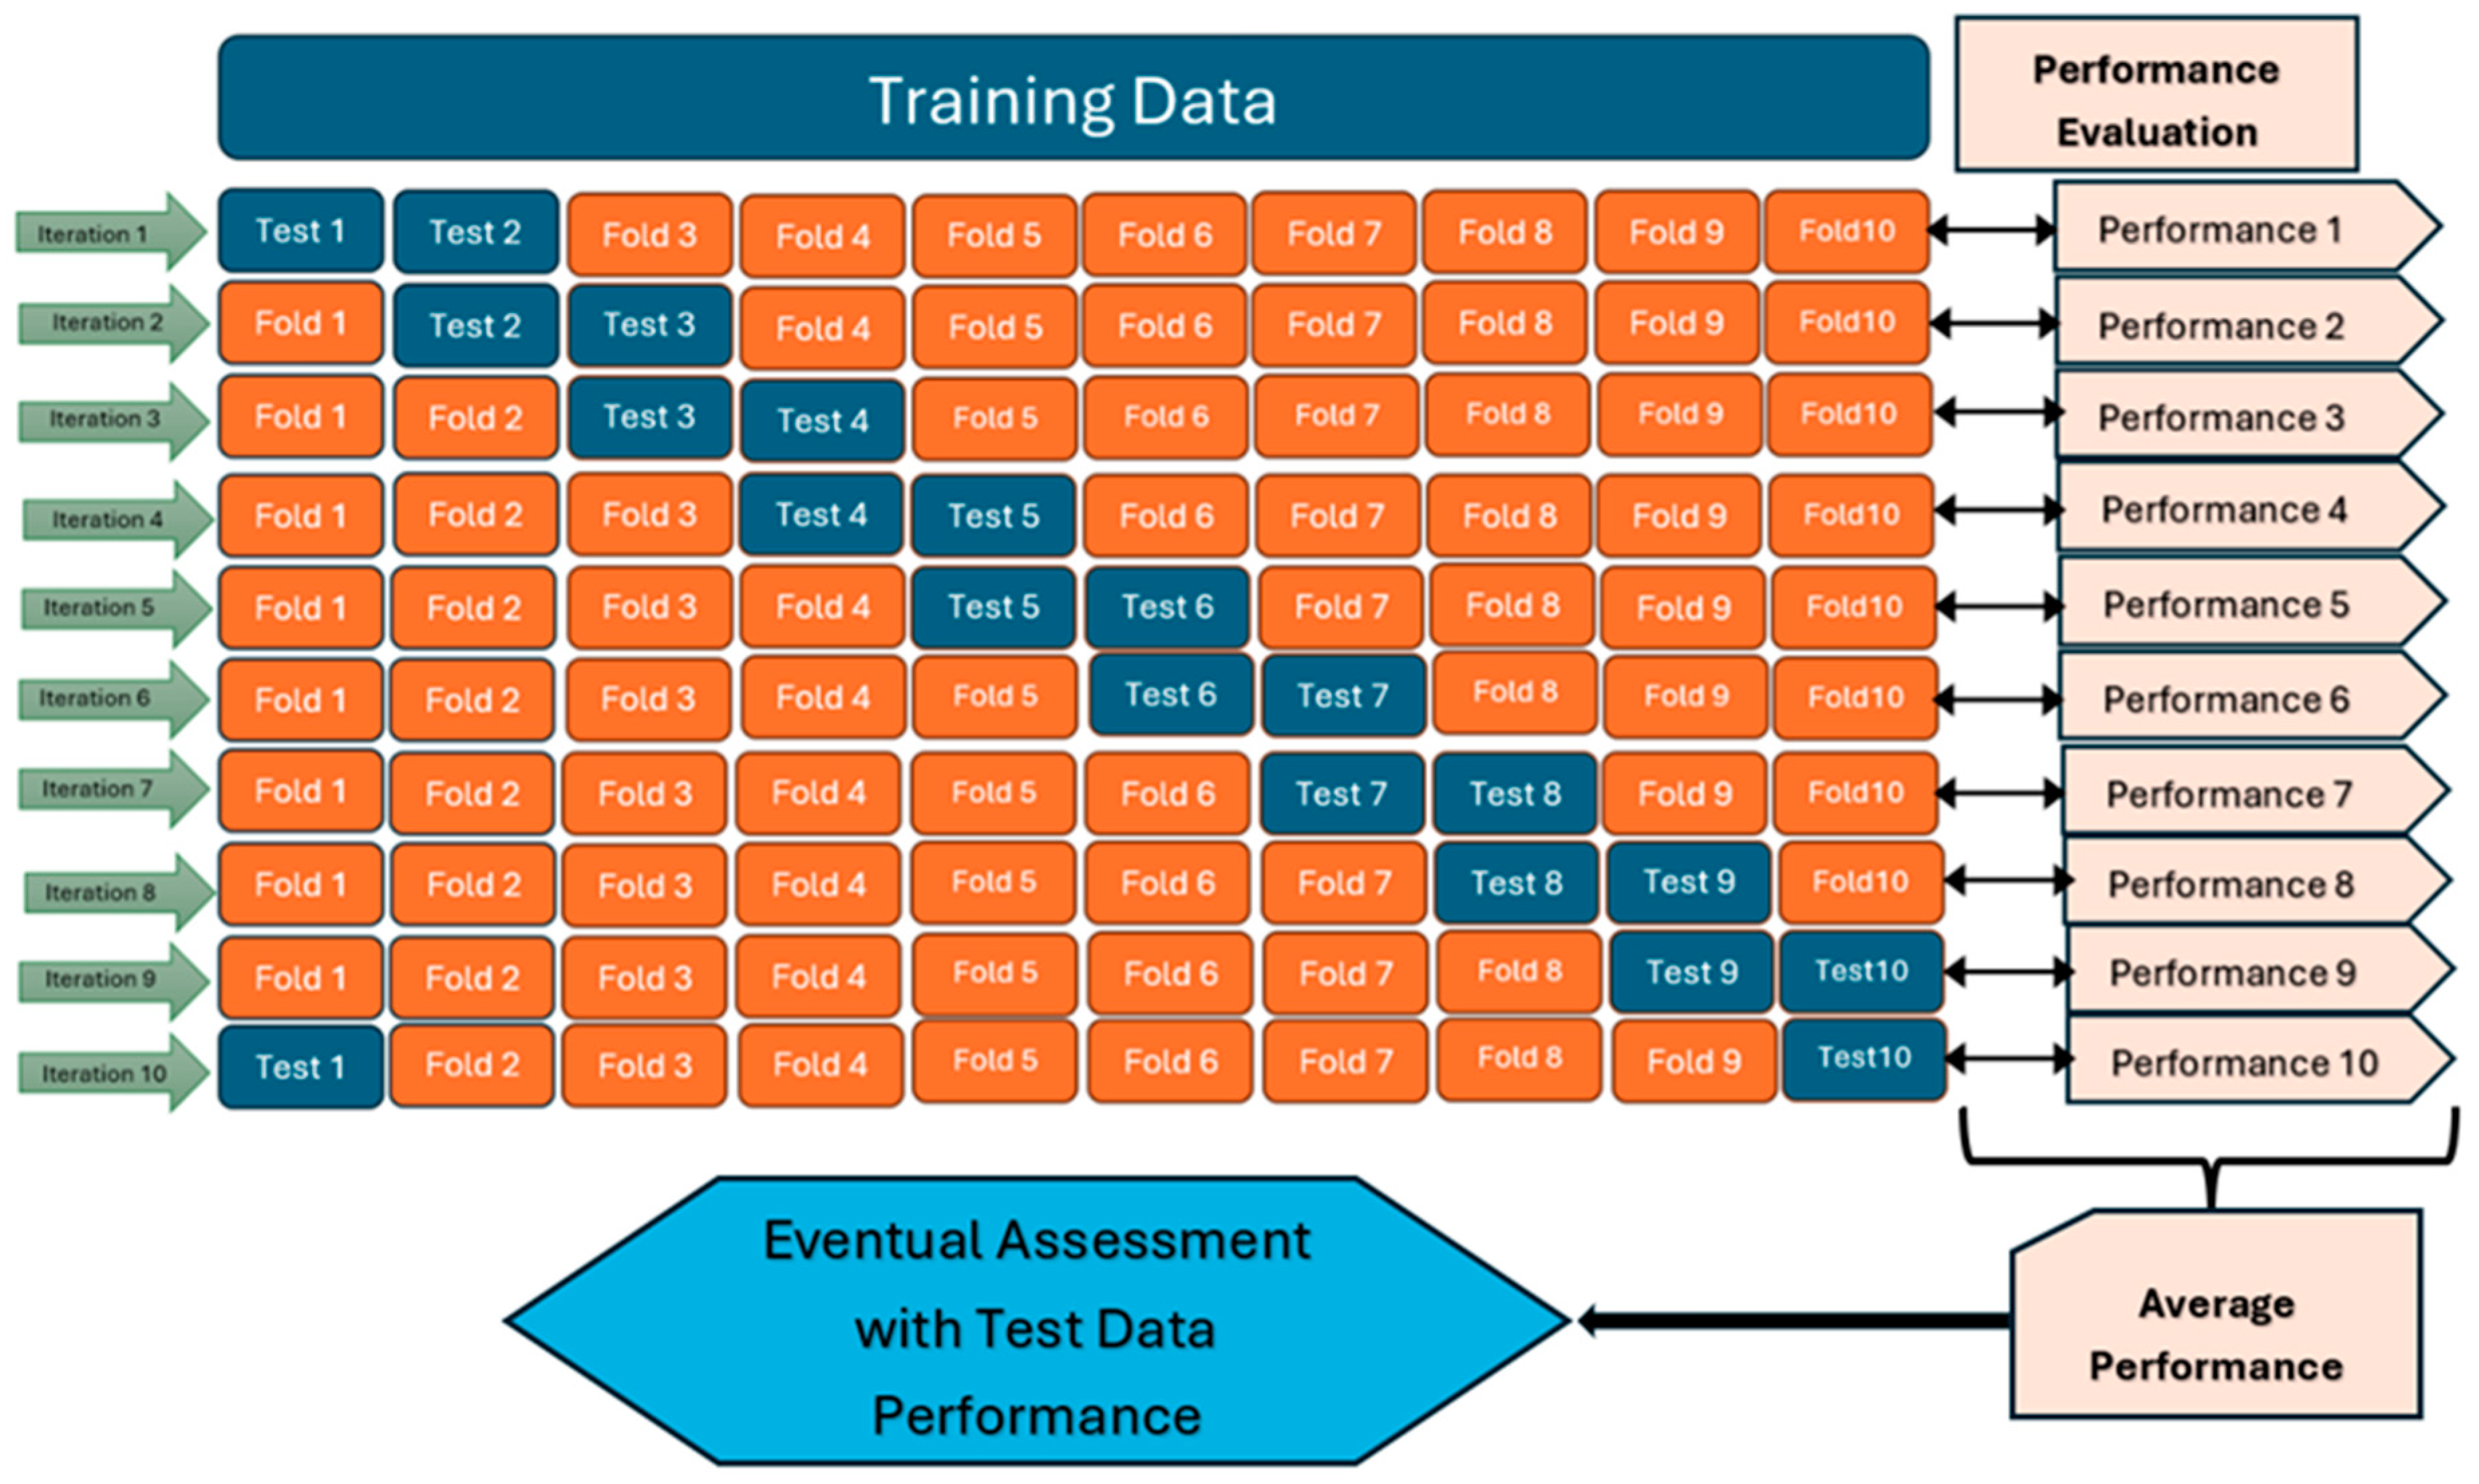
The PyCaret library simplifies model accuracy evaluation through six distinct statistical metrics, which substantially quantify the cumulative error between predictions and actual measurements [51]. Confirmation and testing of the eventual models are carried out using k-fold cross-validation, as illustrated in Figure 28.
The 10-fold cross-validation results of the model that produced the best result are presented in Table 7.
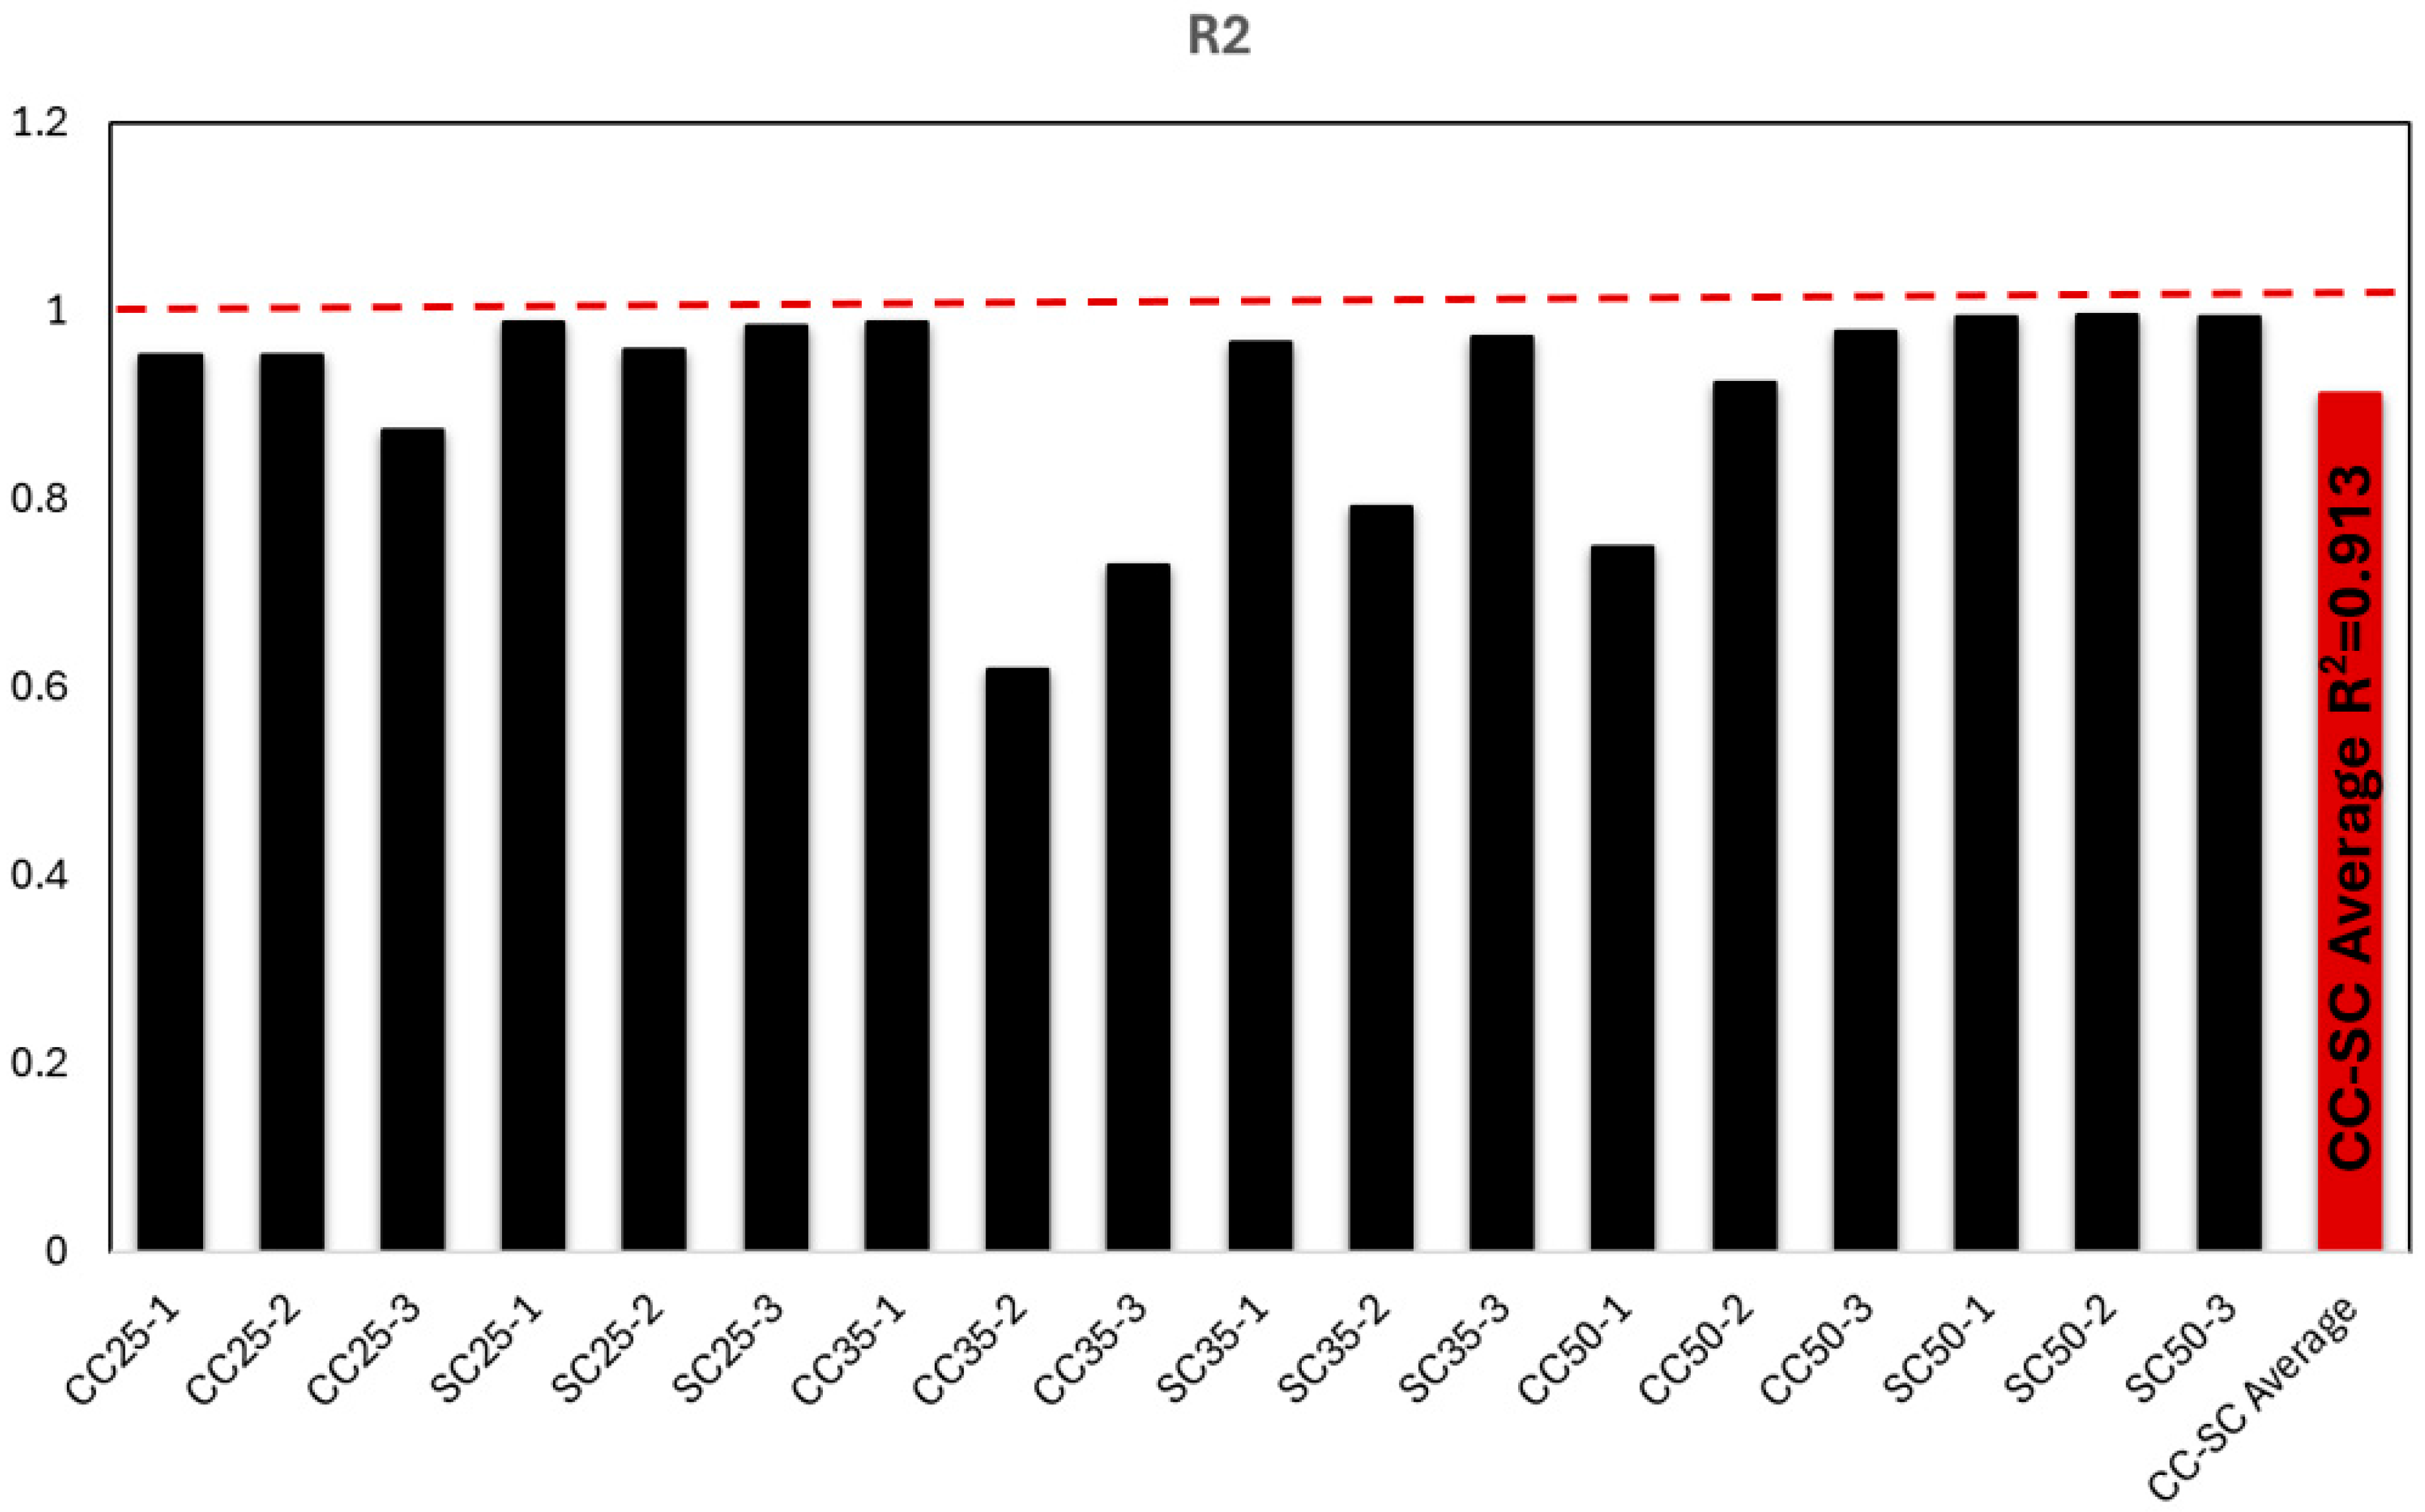
In the machine learning regression modeling prediction analyses conducted for ultimate load deflection values, the highest R2 value of 0.9964 is obtained for the beam coded SC50-2. Steel-reinforced and SC50-coded beams with high concrete compressive strength were generally the group with the highest estimated values. The lowest R2 estimated value was obtained in the CC35-2-coded GFRP bar-reinforced and medium-level-concrete-compressive-strength beam. In general, it is observed that machine learning-predicted deflection values have significantly high agreement with experimental data.
The results of the machine learning regression analysis performed for the deflection predictions of the tested reinforced concrete beams according to the ultimate load capacity are presented in Figure 29. The average R2 value of all GFRP bar composite- and steel-reinforced beams was obtained as 0.913, which is very important in the deflection capacity prediction of structural beam elements in Figure 29.
Among the 18 PyCaret library regression models utilized to estimate the deflection capacities of reinforced concrete beams from machine learning regression models, the most appropriate ones for load–deflection studies are indicated in Figure 30. In light of the data obtained by comparing experimental and AI prediction methods, the Gradient Boosting Regressor model exhibited the ability to predict with the highest accuracy. Following this, three machine learning models predicted the same number of deflection values with the highest accuracy; these models are the Light Gradient Boosting Machine, K Neighbors Regressor, and Ada Boost Regressor models. The Extra Trees Regressor model was the model that could best predict a small number of variables overall, but it predicted the highest R2 value.

4. Discussion

By comparing the machine learning analyses and experimental results, this study investigates which ML regression models provide the most accurate predictions of load-induced deflections in fresh concrete beams and examines their consistency. The findings demonstrate that the load–deflection capacities and evaluations of reinforced concrete beams in existing or newly designed structures can be accurately assessed. Moreover, the study offers the opportunity to perform safety comparisons in accordance with the design codes and standards adopted by different countries.
In addition, this study considered not only conventional concrete and steel-reinforced beams but also GFRP-reinforced beams, which are regarded as a potential alternative to steel reinforcement in the coming years, under three different concrete compressive strengths. Predictions were made using ML models for beams with low (C25), moderate (C35), and high (C50) compressive strengths, and highly satisfactory results were obtained.

5. Conclusions

Research was conducted on GFRP bar- and steel-reinforced fresh concrete beams under static loading and three-point bending by utilizing experimental and regression modeling (machine learning) prediction analyses. In the experimental part of the research, a total of eighteen (18) geometrically identical beams with dimensions of 150 × 200 × 1100 mm were tested. To compare the effects of steel and GFRP bars on reinforced concrete beam behavior, nine beams steel and composite reinforcement (SC-CC) from each material were produced and tested under the same conditions. In the research, not only the effect of steel and GFRP bars on the beam load–deflection behavior was investigated but also the behavior of the beams in 7-day fresh concrete was considered in the C25, C35, and C50 series for low, moderate, and high concrete compressive strengths, respectively. Six reinforced concrete beams were tested in the series named C25, which is classified as having low concrete compressive strength; three of them are steel longitudinally reinforced and coded SC25, while the ones with GFRP composite reinforcement are coded CC25. The beam series with moderate concrete compressive strength are coded SC35 and CC35 and consist of three beams for each group. The same number of beams were produced in the high-strength C50 series as well as the low- and medium-compressive-strength beam series and were labeled CC50 and SC50. In the experimental part of the study, the failure mechanisms of the beams were interpreted according to the crack types, and the load–deflection capacities and ductile and brittle behaviors were examined according to the concrete strength classes and reinforcement distinction.
Another novel and innovative aspect of the research is that 18 machine learning (ML) regression models were utilized to predict beam deflections using unique experimental data sets in this research via artificial intelligence (AI). In ML regression models, 20% of thousands of rows of data were utilized for testing, and 80% were used for training. In estimating the models, the data was studied with 10-fold cross-validation (k-fold). In the ML regression model analyses investigating the deflection values for ultimate load capacities, a significantly high level of accuracy in prediction ability was demonstrated. Regression models with high levels of predictive accuracy are presented.
  • GFRP composite bar-reinforced concrete beams indicated more ductile behavior and exhibited fracture mechanism behavior with flexural cracks.
  • It was determined that fresh concrete and steel-reinforced beams exhibited very brittle behavior and failed under shear cracks.
  • Although fresh concrete steel- and GFRP bar-reinforced beams generally failed under shear and flexural cracking, respectively, it was observed that different flexural behaviors could occur in the same group of beams in short-term tests due to the effect of fresh concrete.
  • According to Table 4, the ultimate load-carrying capacity averages of composite GFRP rebar-reinforced concrete beams increase as the concrete compressive strength increases, but the ultimate load-carrying capacity averages of steel-reinforced beams were found to be lower in C50 concrete than in C35 concrete. This situation reveals that composite reinforcements are more compatible with the increase in concrete compressive strength levels.
  • Failure and cracking behaviors of reinforced concrete beams were examined; no shear cracking and sudden rupture failure behavior occurred in composite GFRP-reinforced beams. Eight of the GFRP-reinforced concrete beams failed under flexural cracking and behavior, which represents the desired failure behavior feature in this structural element.
  • It was found that the ML regression models predicted the deflection values of the beams under ultimate load with an average accuracy of 91.3%.
  • It is seen that regression models provide higher prediction accuracy calculation capability in load–deflection curves for steel-reinforced beams. This situation is thought to be caused by the sudden rupture failure of GFRP composite reinforcement and the nonlinear behavior of the part.
  • The regression models that predicted the reinforced concrete beam deflection most accurately were the Gradient Boosting Regressor model five times, the Light Gradient Boosting Machine, K Neighbors Regressor, and Ada Boost Regressor model four times, and the Extra Trees Regressor model one time. However, among all ML analyses, the highest R2 result was obtained with Extra Trees Regressor model prediction, which was consistent with the experimental outcome of the SC50-2 beam, i.e., 0.9964.
  • The Gradient Boosting Regressor model, which offers the highest number of prediction capabilities with experimental results in the load–deflection analysis calculations of reinforced concrete beams, is recommended for researchers.
  • Further analysis and improvement of regression models for the prediction of deflection capacities of composite-reinforced beams are recommended based on the results of this research.
  • In addition, the results of finite element analysis and machine learning regression model analysis should be compared in further studies.
  • It was determined that steel rebar-reinforced concrete beams carried more loads than composite GFRP-reinforced beams, but almost all the beams indicated brittle failure behavior, which is a structurally undesirable failure mode.
  • In addition, it should be considered that the ultimate load-carrying capacity of steel-reinforced structural elements will decrease significantly over time due to corrosion, and GFRP bars have a much longer service life.

Funding

This research received no external funding.

Data Availability Statement

The experimental data is available upon request.

Acknowledgments

The author is grateful to Zonguldak Bulent Ecevit University and Sakarya University for sample preparation, experiments, and analysis; MİTAŞ Composite Company in Ankara-Turkey for composite material support; and SAYILI BETON and TEFYAP Companies in Zonguldak-Turkey for their concrete and steel reinforcement support.

Conflicts of Interest

The author declares that they have no known competing financial interests or personal relationships that could have appeared to influence the work reported in this paper.

Notations

⍴: reinforcement ratio (%) σ m a x : Max Bending Stress (MPa)
⍴f: GFRP reinforcement ratio (%) M m a x : Max Bending Moment (kNm)
⍴fb: Balance GFRP reinforcement ratio (%) τ m a x : Max Shear Stress for solid section (MPa)
fc′: Concrete compressive strength at 7 days (MPa)I: Moment of Inertia (mm4)
fc: Concrete compressive strength at 28 days (MPa) F : Load at span center (kN)
fy: yield strength of steel M : Bending moment (kNm)
ff: Tensile strength of GFRP composite h : height of specimen (mm)
Δ: Deflection (mm) w -width of specimen (mm)
Ec: Modulus of elasticity of concrete (GPa) x i = a c t u a l   o b s e r v a t i o n   t i m e   s e r i e s
Fcr: Initial Cracking Load, (kN) x i = e s t i m a t e d   t i m e   s e r i e s
Fexp: Failure Load (kN) i = v a r i a b l e   i
Mexp: Failure Moment (kNm) N = n u m b e r   o f   n o n   m i s s i n g   d a t a   p o i n t s

References

  1. Alsayed, S.H. Flexural behaviour of concrete beams reinforced with GFRP bars. Cem. Concr. Compos. 1998, 20, 1–11. [Google Scholar] [CrossRef]
  2. Ravindra, D.; Martyn, J. Concrete 2000: Economic and Durable Construction Through Excellence; E & FN Spon: London, UK, 1993; pp. 229–238. [Google Scholar]
  3. Ma, K.; Ma, Y.; Liu, B. Experimental investigation on ultra high performance fiber reinforced concrete beams. Mech. Adv. Mater. Struct. 2023, 30, 1155–1171. [Google Scholar] [CrossRef]
  4. Han, S.; Fan, C.; Zhou, A.; Ou, J. Shear behavior of concrete beams reinforced with corrosion-resistant and ductile longitudinal steel-FRP composite bars and FRP stirrups. Eng. Struct. 2023, 278, 115520. [Google Scholar] [CrossRef]
  5. Al-Hamrani, A.; Alnahhal, W.; Elahtem, A. Shear behavior of green concrete beams reinforced with basalt FRP bars and stirrups. Compos. Struct. 2021, 277, 114619. [Google Scholar] [CrossRef]
  6. Hawileh, R.A.; Abdalla, J.A.; Naser, M.Z. Modeling the shear strength of concrete beams reinforced with CFRP bars under unsymmetrical loading. Mech. Adv. Mater. Struct. 2019, 26, 1290–1297. [Google Scholar] [CrossRef]
  7. Thomas, J.; Ramadass, S. Prediction of the load and deflection response of concrete deep beams reinforced with FRP bars. Mech. Adv. Mater. Struct. 2021, 28, 43–66. [Google Scholar] [CrossRef]
  8. Shabanlou, M.; Mofid, M.; Tavakoli, A. Post-fire performance of GFRP reinforced concrete deep beams: Experimental and numerical study. Struct. Infrastruct. Eng. 2024, 1–19. [Google Scholar] [CrossRef]
  9. Aslani, F.; Bastami, M. Relationship between deflection and crack mouth opening displacement of self-compacting concrete beams with and without fibers. Mech. Adv. Mater. Struct. 2015, 22, 956–967. [Google Scholar] [CrossRef]
  10. Ding, Y. Investigations into the relationship between deflection and crack mouth opening displacement of SFRC beam. Constr. Build. Mater. 2011, 25, 2432–2440. [Google Scholar] [CrossRef]
  11. Abdo, A.; Sharaky, I.A.; Eisa, A.; Ahmed, S. Flexural behavior of steel/GFRP reinforced concrete beams having layered sections integrated with normal and rubberized concrete. Structures 2024, 70, 107633. [Google Scholar] [CrossRef]
  12. Ahmed, S.; Sharaky, I.A.; El Sayed, S.; Hassan, H.; Abdo, A. Effect of rubberized concrete integrating uncoated and coated crumb rubber on the flexural behavior of the RC beams reinforced with steel and GFRP bars. Constr. Build. Mater. 2024, 426, 136192. [Google Scholar] [CrossRef]
  13. Nematzadeh, M.; Hosseini, S.A.; Ozbakkaloglu, T. The combined effect of crumb rubber aggregates and steel fibers on shear behavior of GFRP bar-reinforced high-strength concrete beams. J. Build. Eng. 2021, 44, 102981. [Google Scholar] [CrossRef]
  14. Imjai, T.; Aosai, P.; Garcia, R.; Raman, S.N.; Chaudhary, S. Deflections of high-content recycled aggregate concrete beams reinforced with GFRP bars and steel fibres. Eng. Struct. 2024, 312, 118247. [Google Scholar] [CrossRef]
  15. Gouda, O.; Hassanein, A.; Galal, K. Experimental and numerical study on the crack width and deflection performance of GFRP reinforced concrete beams. Eng. Struct. 2023, 283, 115721. [Google Scholar] [CrossRef]
  16. Ifrahim, M.S.; Sangi, A.J.; Ahmad, S.H. Experimental and numerical investigation of flexural behaviour of concrete beams reinforced with GFRP bars. Structures 2023, 56, 104951. [Google Scholar] [CrossRef]
  17. Huang, J.; Wang, P.; Shi, Q.; Rong, C.; Tao, Y. Flexural behavior and numerical simulation of reinforced concrete beams with a UHPC stay-in-place formwork. Structures 2024, 69, 107254. [Google Scholar] [CrossRef]
  18. Huang, J.; Xing, G.; Chang, Z. Experimental and numerical investigation on flexural behavior of concrete beams strengthened by different NSM tendons. Compos. Struct. 2023, 313, 116947. [Google Scholar] [CrossRef]
  19. Hasan, M.A.; Sheehan, T.; Ashour, A.; Elkezza, O. Flexural behaviour of geopolymer concrete T-Beams reinforced with GFRP bars. Structures 2023, 49, 345–364. [Google Scholar] [CrossRef]
  20. Le, D.D.; Nguyen, H.C.; Nguyen, T.A.; Nguyen, X.H. Investigating the Influence of Transverse Reinforcement Configuration on the Torsional Behavior of GFRP-Reinforced Concrete Beams: An Experimental and Numerical Analysis. KSCE J. Civ. Eng. 2024, 28, 5793–5809. [Google Scholar] [CrossRef]
  21. Alam, M.S.; Hussein, A. Finite element modelling of shear critical glass fibre-reinforced polymer (GFRP) reinforced concrete beams. Int. J. Model. Simul. 2021, 41, 11–23. [Google Scholar] [CrossRef]
  22. Metwally, I.M. Three-dimensional nonlinear finite element analysis of concrete deep beam reinforced with GFRP bars. HBRC J. 2017, 13, 25–38. [Google Scholar] [CrossRef]
  23. Salem, M.; Issa, M.S. Nonlinear finite element analysis of high and ultra-high strength concrete beams reinforced with FRP bars. HBRC J. 2023, 19, 15–31. [Google Scholar] [CrossRef]
  24. Zhu, Z.; Abdelbaset, H.; Li, X.; Tang, Q. Flexural behavior of long-term loaded RC beams strengthened by ultra-high performance concrete. Constr. Build. Mater. 2023, 407, 133428. [Google Scholar] [CrossRef]
  25. Van Tran, H.; Seo, S.Y.; Hanif, M.U.; Senghong, K. Time-dependent flexural behavior of the RC beams strengthened with FRP strips using different methods. Structures 2024, 65, 106655. [Google Scholar] [CrossRef]
  26. Mao, J.H.; Xu, F.Y.; Jin, W.L.; Zhang, J.; Wu, X.X.; Chen, C.S. Research on the Fatigue Flexural Performance of RC Beams Attacked by Salt Spray. China Ocean Eng. 2018, 32, 179–188. [Google Scholar] [CrossRef]
  27. Ren, F.; Chen, Z.; Xiong, M.X. Long-Term Behavior of FRP-Bar Reinforced Seawater Sea Sand Concrete Beams Under Load Sustaining and Environment Weathering. Int. J. Civ. Eng. 2024, 22, 491–504. [Google Scholar] [CrossRef]
  28. Nagy, I.E.; Asadian, A.; Galal, K. Fatigue life and behaviour of ribbed GFRP reinforced concrete beams. Eng. Struct. 2024, 309, 117989. [Google Scholar] [CrossRef]
  29. Zhao, J.; Li, G.; Wang, Z.; Zhao, X.L. Fatigue behavior of concrete beams reinforced with glass- and carbon-fiber reinforced polymer (GFRP/CFRP) bars after exposure to elevated temperatures. Compos. Struct. 2019, 229, 111427. [Google Scholar] [CrossRef]
  30. Ge, Z.; Huang, M.; Wang, Y. Fatigue behaviour of asphalt concrete beams reinforced by glass fibre-reinforced plastics. Int. J. Pavement Eng. 2014, 15, 36–42. [Google Scholar] [CrossRef]
  31. Xing, L.; Sun, S.; Mei, K.; Guo, Y.; Yang, Z. Research progress on short-term mechanical properties of FRP bars and FRP-reinforced concrete beams. J. Traffic Transp. Eng. (Engl. Ed.) 2024, 11, 245–270. [Google Scholar] [CrossRef]
  32. Salman, O.; Abed, F.; Alhoubi, Y. Shear performance of GFRP reinforced UHPC short beams. Compos. Struct. 2025, 351, 118637. [Google Scholar] [CrossRef]
  33. Iwama, K.; Kai, M.F.; Dai, J.G.; Zhang, P.; Wang, P.; Poon, C.S.; Leung, C.K.; Maekawa, K. Physicochemical-mechanical simulation of the short- and long-term performance of FRP reinforced concrete beams under marine environments. Eng. Struct. 2024, 308, 118051. [Google Scholar] [CrossRef]
  34. Miàs, C.; Torres, L.; Guadagnini, M.; Turon, A. Short and long-term cracking behaviour of GFRP reinforced concrete beams. Compos. Part B Eng. 2015, 77, 223–231. [Google Scholar] [CrossRef]
  35. Kazemi, F.; Asgarkhani, N.; Shafighfard, T.; Jankowski, R.; Yoo, D.Y. Machine-Learning Methods for Estimating Performance of Structural Concrete Members Reinforced with Fiber-Reinforced Polymers, No. 0123456789; Springer: Dordrecht, The Netherlands, 2024. [Google Scholar]
  36. Mahmoudian, A.; Tajik, N.; Taleshi, M.M.; Shakiba, M.; Yekrangnia, M. Ensemble machine learning-based approach with genetic algorithm optimization for predicting bond strength and failure mode in concrete-GFRP mat anchorage interface. Structures 2023, 57, 105173. [Google Scholar] [CrossRef]
  37. Huang, T.; Wan, C.; Liu, T.; Hao, D.; Miao, C. Machine learning prediction method for the interface bond strength between fiber reinforced polymer bars and concrete based on multi-feature driven analysis. Mater. Today Commun. 2024, 41, 110706. [Google Scholar] [CrossRef]
  38. Liu, K.; Wulan, T.; Yao, Y.; Bian, M.; Bao, Y. Assessment of damage evolution of concrete beams strengthened with BFRP sheets with acoustic emission and unsupervised machine learning. Eng. Struct. 2024, 300, 117228. [Google Scholar] [CrossRef]
  39. Anvari, A.T.; Babanajad, S.; Gandomi, A.H. Data-Driven Prediction Models For Total Shear Strength of Reinforced Concrete Beams With Fiber Reinforced Polymers Using An Evolutionary Machine Learning Approach. Eng. Struct. 2023, 276, 115292. [Google Scholar] [CrossRef]
  40. Rahman, J.; Arafin, P.; Billah, A.H.M.M. Machine learning models for predicting concrete beams shear strength externally bonded with FRP. Structures 2023, 53, 514–536. [Google Scholar] [CrossRef]
  41. Karabulut, M. Nonlinear Load-Deflection Analysis of Steel Rebar-Reinforced Concrete Beams: Experimental, Theoretical and Machine Learning Analysis. Buildings 2025, 15, 432. [Google Scholar] [CrossRef]
  42. Karabulut, M. Machine Learning-Driven Flexural Performance Prediction and Experimental Investigation of Glass Fiber-Reinforced Polymer Bar-Reinforced Concrete Beams. Polymers 2025, 17, 713. [Google Scholar] [CrossRef] [PubMed]
  43. Ge, W.; Zhang, F.; Wang, Y.; Ashour, A.; Luo, L.; Qiu, L.; Fu, S.; Cao, D. Machine learning predictions for bending capacity of ECC-concrete composite beams hybrid reinforced with steel and FRP bars. Case Stud. Constr. Mater. 2024, 21, e03670. [Google Scholar] [CrossRef]
  44. Moein, M.M.; Saradar, A.; Rahmati, K.; Mousavinejad, S.H.G.; Bristow, J.; Aramali, V.; Karakouzian, M. Predictive models for concrete properties using machine learning and deep learning approaches: A review. J. Build. Eng. 2023, 63, 105444. [Google Scholar] [CrossRef]
  45. Karabulut, M. Investigation of the Bending Strength of Glass Fiber-Reinforced Polymer (GFRP) Bars Exposed to Thermal Stress. J. Struct. Eng. Appl. Mech. 2025, 8, 1–12. [Google Scholar] [CrossRef]
  46. Kina, C.; Turk, K.; Atalay, E.; Donmez, I.; Tanyildizi, H. Comparison of extreme learning machine and deep learning model in the estimation of the fresh properties of hybrid fiber-reinforced SCC. Neural Comput. Appl. 2021, 33, 11641–11659. [Google Scholar] [CrossRef]
  47. Tuken, A.; Abbas, Y.M.; Siddiqui, N.A. Efficient prediction of the load-carrying capacity of ECC-strengthened RC beams—An extra-gradient boosting machine learning method. Structures 2023, 56, 105053. [Google Scholar] [CrossRef]
  48. Wakjira, T.G.; Al-Hamrani, A.; Ebead, U.; Alnahhal, W. Shear capacity prediction of FRP-RC beams using single and ensenble ExPlainable Machine learning models. Compos. Struct. 2022, 287, 115381. [Google Scholar] [CrossRef]
  49. Xiong, Z.; Li, J.; Zhu, H.; Liu, X.; Liang, Z. Ultimate Bending Strength Evaluation of MVFT Composite Girder by using Finite Element Method and Machine Learning Regressors. Lat. Am. J. Solids Struct. 2022, 19, e438. [Google Scholar] [CrossRef]
  50. Le Nguyen, K.; Trinh, H.T.; Nguyen, T.T.; Nguyen, H.D. Comparative study on the performance of different machine learning techniques to predict the shear strength of RC deep beams: Model selection and industry implications. Expert Syst. Appl. 2023, 230, 120649. [Google Scholar] [CrossRef]
  51. Gad, M.A.; Nikbakht, E.; Ragab, M.G. Predicting the compressive strength of engineered geopolymer composites using automated machine learning. Constr. Build. Mater. 2024, 442, 137509. [Google Scholar] [CrossRef]
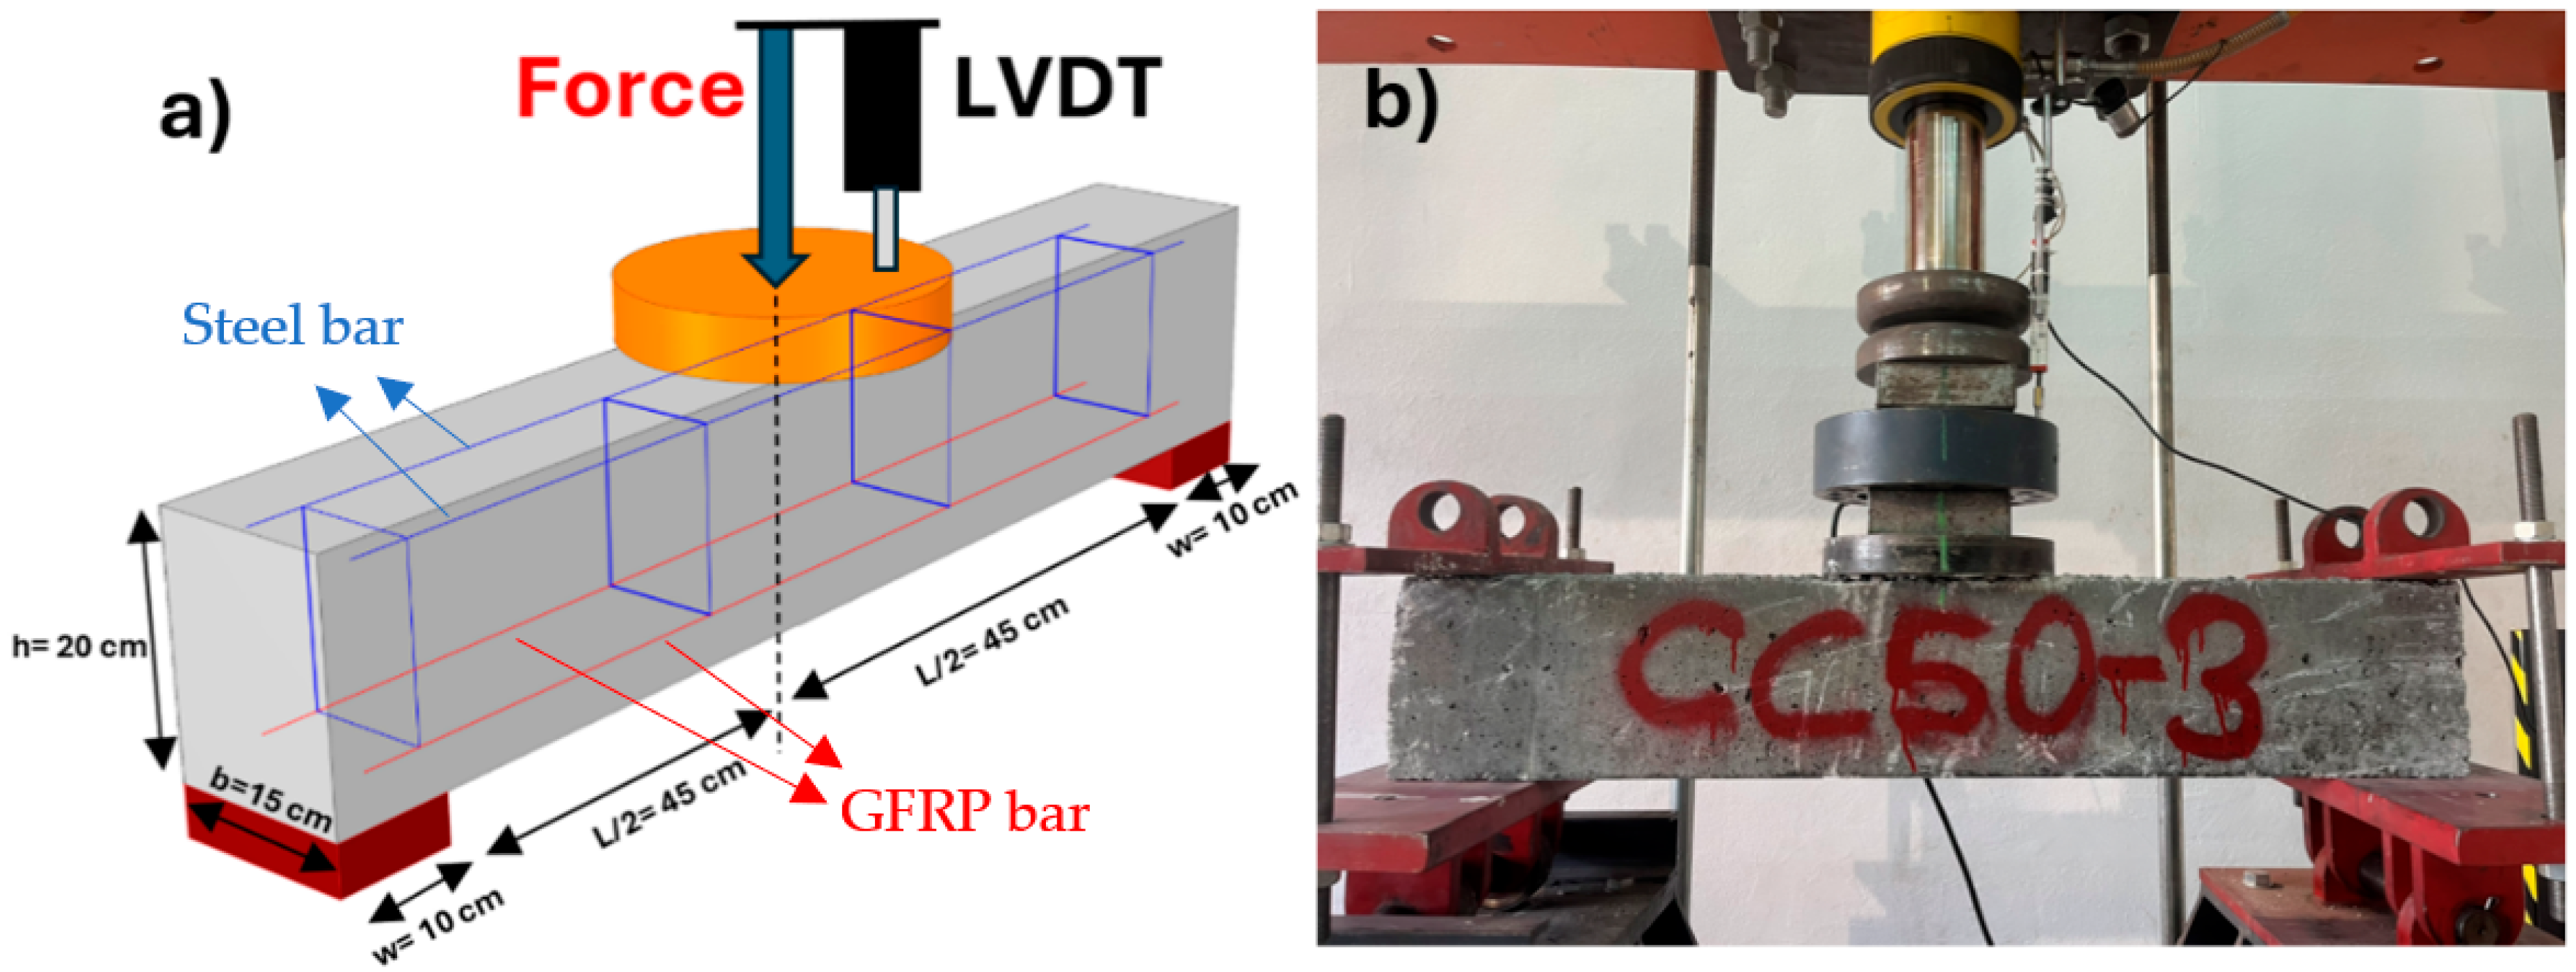
Figure 1. Three-point bending test of RC beams: (a) schematic and (b) photograph.
Buildings 15 04049 g001
Figure 2. Production stages of reinforced concrete beams.
Buildings 15 04049 g002
Figure 3. C25 series bending tests.
Buildings 15 04049 g003aBuildings 15 04049 g003b
Figure 4. C35 series bending tests.
Buildings 15 04049 g004aBuildings 15 04049 g004b
Figure 5. C50 series bending tests.
Buildings 15 04049 g005
Figure 6. C25 beam series flexural tests.
Buildings 15 04049 g006
Figure 7. C35 beam series flexural tests.
Buildings 15 04049 g007
Figure 8. C50 beam series flexural tests.
Buildings 15 04049 g008
Figure 9. Overall structure of the developed ML models.
Buildings 15 04049 g009
Figure 10. Prediction error and residual plots of CC25-1 beam.
Buildings 15 04049 g010
Figure 11. Prediction error and residual plots of CC25-2 beam.
Buildings 15 04049 g011
Figure 12. Prediction error and residual plots of CC25-3 beam.
Buildings 15 04049 g012
Figure 13. Prediction error and residual plots of SC25-1 beam.
Buildings 15 04049 g013
Figure 14. Prediction error and residual plots of SC25-2 beam.
Buildings 15 04049 g014
Figure 15. Prediction error and residual plots of SC25-3 beam.
Buildings 15 04049 g015
Figure 16. Prediction error and residual plots of CC35-1 beam.
Buildings 15 04049 g016
Figure 17. Prediction error and residual plots of CC35-2 beam.
Buildings 15 04049 g017
Figure 18. Prediction error and residual plots of CC35-3 beam.
Buildings 15 04049 g018
Figure 19. Prediction error and residual plots of SC35-1 beam.
Buildings 15 04049 g019
Figure 20. Prediction error and residual plots of SC35-2 beam.
Buildings 15 04049 g020
Figure 21. Prediction error and residual plots of SC35-3 beam.
Buildings 15 04049 g021
Figure 22. Prediction error and residual plots of CC50-1 beam.
Buildings 15 04049 g022
Figure 23. Prediction error and residual plots of CC50-2 beam.
Buildings 15 04049 g023
Figure 24. Prediction error and residual plots of CC50-3 beam.
Buildings 15 04049 g024
Figure 25. Prediction error and residual plots of SC50-1 beam.
Buildings 15 04049 g025
Figure 26. Prediction error and residual plots of SC50-2 beam.
Buildings 15 04049 g026
Figure 27. Prediction error and residual plots of SC50-3 beam.
Buildings 15 04049 g027
Figure 28. K-fold cross-validation method (K = 10) [41].
Buildings 15 04049 g028
Figure 29. The results of the machine learning regression analysis performed for the deflection.
Buildings 15 04049 g029
Figure 30. Prediction numbers of the most optimal predictive ML regression models.
Buildings 15 04049 g030
Table 1. Experiment matrix.
SeriesBeam No.Cros Section (Unit: mm)Tensile ReinforcementReinforcement Ratio, ⍴ (%)Cube Sample fc′ (MPa)a/d Ratio
Width, bHeight, hEffective Depth, d Length, l
C25CC25-115020016211002–10 mm GFRP bars0.6533.762.78
CC25-2
CC25-3
SC25-12–10 mm steel bars
SC25-2
SC25-3
C35CC35-115020016211002–10 mm GFRP bars0.6539.272.78
CC35-2
CC35-3
SC35-12–10 mm steel bars
SC35-2
SC35-3
C50CC50-115020016211002–10 mm GFRP bars0.6553.762.78
CC50-2
CC50-3
SC50-12–10 mm steel bars
SC50-2
SC50-3
Table 2. Reinforcement information.
SeriesBeam No.Longitudinal ReinforcementTransverse Reinforcement
MaterialNum of BarsBar Dia (mm)⍴f-⍴b (%)⍴f/⍴fb or ⍴/⍴b (%)MaterialBar Dia (mm)Spacing (mm)
C25CC25-1GFRP2100.60107.67Steel bars8300
CC25-2
CC25-3
SC25-1Steel2.1729.76Steel bars
SC25-2
SC25-3
C35CC35-1GFRP2100.7882.82Steel bars8300
CC35-2
CC35-3
SC35-1Steel2.8222.95Steel bars
SC35-2
SC35-3
C50CC50-1GFRP2100.9965.40Steel bars8300
CC50-2
CC50-3
SC50-1Steel3.5718.12Steel bars
SC50-2
SC50-3
Table 3. Mechanical properties of GFRP bars.
Test Specimen NameGFRP Bar Diameter (mm)Cross-Sectional Area (mm2)GFRP Bar Sample Length (mm)Max Tensile Strength (MPa)Max Bending Load (kN)Max. Bending Strength (MPa)Ultimate Deflection Δ (mm)Weight
(gr/cm)
10-11078.541468533.15040.1161.61
10-21078.541488962.90036.9231.57
10-31078.541479162.95037.5651.58
10-A1078.54147888338.204.671.59
Table 4. Experiment results.
SeriesBeam No.RC Beam Failure BehaviorInitial Cracking Load, Fcr (kN)Failure Load, Fexp (kN)Maximum Mid-Span Deflection, Δ exp (mm)Failure Moment, Mexp (kN.m)
C25CC25-1FC28.4839.5863.3017.81
CC25-2FC17.1819.5767.028.81
CC25-3FC19.722.7084.8010.22
CC25-A-21.7927.2871.7112.28
SC25-1SC59.0577.7534.0334.99
SC25-2SC61.5173.9534.0233.28
SC25-3SC50.9767.7937.2230.51
SC25-A-57.1873.1636.6232.92
C35CC35-1FC23.3032.3844.9914.57
CC35-2FC22.5029.6947.9313.36
CC35-3FC22.3633.3262.2914.99
CC35-A-22.7231.8051.7414.31
SC35-1SC62.7471.5224.5432.18
SC35-2FSC61.7778.6926.4735.41
SC35-3FSC62.8880.9127.5036.41
SC35-A-62.4677.0426.1734.67
C50CC50-1FC30.5033.0951.3414.89
CC50-2FC28.9231.3745.4114.12
CC50-3FSC25.8037.8319.7417.02
CC50-A-28.4134.1038.8315.35
SC50-1FSC66.1187.4650.839.36
SC50-2SC49.8062.0418.6127.92
SC50-3FSC53.6070.8554.331.88
SC50-A-56.5073.4541.2433.05
FC: flexural crack; FSC: flexural–shear crack; SC: shear crack; A: average of 3 tests for each group (CC25-1,CC25-2 and CC25-3; SC25-1; SC25-2 and SC25-3).
Table 5. ML regression models.
ML Model No.ML Regression Model NameML Model Name Code
1Gradient Boosting Regressorgbr
2K Neighbors Regressorknn
3Ada Boost Regressorada
4Random Forest Regressorrf
5Light Gradient Boosting Machinelightgbm
6Extra Trees Regressoret
7Decision Tree Regressordt
8Lasso List Angle Regressorllar
9Ridge Regressionridge
10Bayesian Ridgebr
11Orthogonal Matching Pursuitomp
12Elastic Neten
13Least Angle Regressionlar
14Lasso Regressionlasso
15Linear Regressionlr
16Huber Regressionhuber
17Passive Aggressive Regressorpar
18Dummy Regressordummy
Table 6. Statistical details of the parameters in the database.
FeatureTypeCminCmaxAve
fc′
(MPa)
Input33.7653.7642.26
fy (MPa)Input420420420
ff (MPa)Input489651578
b (mm)Input150150150
h (mm)Input200200200
d (mm)Input162162162
L (mm)Input110011001100
⍴f (%)Input0.60.990.79
⍴b (%)Input2.173.572.85
F (kN)Input19.5787.4652.805
Δ (mm)Output18.6184.8044.1925
Table 7. Performance metrics of ML regression model.
Beam NameBest Predictive ML ModelMAEMSERMSER2RMSLEMAPE
CC25-1Gradient Boosting Regressor0.53690.70030.83220.95480.09560.0767
CC25-2Gradient Boosting Regressor0.47780.56050.73870.95470.07190.0657
CC25-3Gradient Boosting Regressor0.71911.25561.11130.87370.11650.1535
SC25-1Light Gradient Boosting Machine0.43720.45080.66500.99010.04480.2825
SC25-2Light Gradient Boosting Machine0.91651.75051.31700.95950.12803.7866
SC25-3Gradient Boosting Regressor0.27500.18780.42610.98550.04250.0391
CC35-1K Neighbors Regressor0.18730.10210.29780.98920.05990.0676
CC35-2Light Gradient Boosting Machine1.83595.70422.38120.62040.24790.5265
CC35-3Ada Boost Regressor6.367576.00328.69910.73090.39190.3811
SC35-1Gradient Boosting Regressor0.62700.76930.87490.96840.06320.0541
SC35-2Ada Boost Regressor2.24178.76382.95040.79300.19550.8460
SC35-3Light Gradient Boosting Machine0.81201.41751.18280.97380.09910.1561
CC50-1Ada Boost Regressor1.91445.98102.44120.75060.26110.3005
CC50-2Ada Boost Regressor0.56240.56960.74090.92430.13980.6395
CC50-3K Neighbors Regressor0.19650.10070.30110.98030.07660.3933
SC50-1K Neighbors Regressor0.16650.05650.23600.99590.03230.0387
SC50-2Extra Trees Regressor0.05480.00710.08000.99640.01270.195
SC50-3K Neighbors Regressor0.1780.05910.24130.99510.03380.0312
Disclaimer/Publisher’s Note: The statements, opinions and data contained in all publications are solely those of the individual author(s) and contributor(s) and not of MDPI and/or the editor(s). MDPI and/or the editor(s) disclaim responsibility for any injury to people or property resulting from any ideas, methods, instructions or products referred to in the content.