Article

Sensitivity Analysis of Foundation Soil Physical–Mechanical Properties on Pile Foundation Stability

1
School of Water Conservancy and Architectural Engineering, Tarim University, Alar 843300, China
2
South Xinjiang Geotechnical Engineering Research Center, Tarim University, Alar 843300, China
3
Infrastructure Department, Xinjiang Vocational University of Technology, Kashkar 844200, China
*
Author to whom correspondence should be addressed.
Buildings 2025, 15(21), 4001; https://doi.org/10.3390/buildings15214001
Submission received: 23 September 2025 / Revised: 26 October 2025 / Accepted: 3 November 2025 / Published: 6 November 2025
(This article belongs to the Section Building Structures)

Abstract

The stability of pile foundation is influenced by many interacting factors, particularly geological conditions. Quantifying the impact of physical and mechanical soil properties on pile stability is critical for achieving optimal design outcomes. This study investigates the sensitivity of key soil parameters and validates the findings with a case study of a university building in Kashkar, Xinjiang, China. A three-dimensional pile–soil model was developed in Abaqus and calibrated with static load test data. Variable control and orthogonal experiments were conducted to examine settlement patterns and ultimate bearing capacity under varying soil parameters. Settlement and ultimate bearing capacity were adopted as stability indicators. Sensitivity analysis was performed through multi-factor variance analysis, sensitivity analysis of factors (SAF), and variance inflation factor (VIF) collinearity analysis. The results show that the most influential parameters are the friction coefficient of the soil above the pile tip, the Poisson’s ratio of the pile-end soil, the Poisson’s ratio of the soil above the pile tip, the friction coefficient of the pile-end soil, and the elastic modulus of the pile-end soil. These findings provide a quantitative basis for optimizing design parameters and improving the efficiency and reliability of pile foundation design in sandy soil regions.

1. Introduction

The load-bearing performance of cast-in-place piles primarily relies on the shaft side resistance generated by displacement between the rough and uneven pile surface and the surrounding soil, which counteracts loads from the superstructure. Due to the diversity and uncertainty of geological conditions, the settlement and ultimate bearing capacity of pile foundations are difficult to predict accurately, leading to prevalent adoption of high safety reserves in pile design [1]. This results in extended construction periods and excessive material consumption. In the widely distributed sandy soils of Southern Xinjiang, China, the low bearing capacity makes the influence of physical–mechanical properties of each soil layer on the stability of pile foundation significant. Therefore, quantifying the degree of influence of physical–mechanical properties of various soil layers on pile foundation stability forms the crucial foundation for advancing pile design from “experience-dependent” to “precision-prediction” approaches [2,3].
Numerous experimental studies have demonstrated that current pile foundation design is generally conservative [4,5,6], and a clear correlation exists between geological conditions and pile failure mechanisms [7]. Through reduced-scale tests, Xi W [8] found that sand density significantly affects the ultimate bearing capacity of single piles, with medium-dense and dense sand exhibiting 80% and 260% higher capacity, respectively, compared to loose sand. Qin S, Sun J, Lee C.J., et al. [9,10,11] demonstrated through static load tests and ABAQUS that the pile–soil interface friction coefficient substantially influences the load–settlement curve. Bai F [12] observed through scale tests that the Q-S curve displays steep drop characteristics in sandy soil foundations. Fan X’s investigation [13], combining static load tests and ABAQUS, revealed that the elastic modulus of the pile-end soil is the key factor determining pile head settlement. Sun Z. et al. [14] utilized ABAQUS to demonstrate that the physical–mechanical properties of the pile-end soil significantly affect pile settlement. In summary, while existing research has confirmed the substantial influence of foundation soil parameters—including elastic modulus, Poisson’s ratio, cohesion, and pile–soil friction coefficient—on pile foundation stability, there remains a lack of targeted studies addressing regional sandy soils like those in Southern Xinjiang [14,15,16]. Furthermore, systematic quantitative analyses are currently insufficient regarding both the sensitivity of pile head settlement to variations in physical–mechanical properties across soil layers under changing loads and the sensitivity of ultimate bearing capacity to these parameters [17].
To accurately predict the settlement and ultimate bearing capacity of pile foundations, conducting a sensitivity analysis of the physical–mechanical parameters of foundation soils is essential. The approach combining the variable control experimental with orthogonal experimental design provides a comprehensive and efficient methodology for quantifying parameter sensitivity. Researchers including Li H, Feng C, and Sun Z, et al. [14,18,19] have successfully applied this approach to quantify the influence degree and determine the primary–secondary order of various parameters, thereby establishing a reliable reference framework for sensitivity quantification studies.
Currently, the primary technical approaches for determining the ultimate bearing capacity and settlement of pile foundations, as well as investigating their bearing characteristics, include [16,20]: (1) theoretical analytical methods; (2) in situ testing; (3) scaled experiments; (4) numerical simulation analysis; and (5) machine learning simulations. Among these, in situ testing can accurately reflect the actual bearing performance of foundation piles and is recognized as the primary evaluation criterion in current codes worldwide [14,20,21,22]. However, the complex diversity of pile foundation design forms and the limitations of in situ testing costs pose challenges. Numerical simulation, calibrated against in situ test data, can back-calculate the actual mechanical properties of the soil surrounding the pile. Based on constitutive equations, it predicts load transfer under different loading conditions [23,24,25], overcoming the scale effects inherent in scaled experiments, the regional limitations of theoretical analytical methods, and the black-box nature of machine learning simulations.
Based on the aforementioned research findings and current status, this study takes a training building at a university in the Kashgar region of Xinjiang as a case study. A multilayered soil-pile model was established in ABAQUS and calibrated against the Q-S curve from static load tests. Through single-factor controlled variable experiments with settlement as the evaluation indicator, the Sensitivity Analysis of Factors (SAF) was introduced to quantify the influence of the elastic modulus, Poisson’s ratio, internal friction angle, and pile–soil friction coefficient of various soil layers on settlement under different load levels. Combined with orthogonal experiments, the ultimate bearing capacity was selected as the evaluation indicator. Multi-factor analysis of variance and collinearity analysis using Variance Inflation Factors (VIFs) were applied to identify the dominant and secondary factors affecting the ultimate bearing capacity of the pile foundation.
This study integrated the variable control experiments and orthogonal experiments through different load variations, systematically analyzing the dynamic sensitivity of physical–mechanical parameters in each soil layer to pile foundation stability during the loading process. It further investigated whether the degree of sensitivity is influenced by soil layer thickness. The research clarifies the sensitivity of physical–mechanical properties of various soil layers to the bearing performance of pile foundations in the sandy soil region of Southern Xinjiang. The findings provide a reference for the selection of Mohr–Coulomb parameters in numerical simulations of pile–soil interaction in this region, offer an optimized approach for model calibration and parameter inversion, and supply theoretical support and practical guidance for the optimized design of pile foundations.

2. Research Background and Study Site

2.1. Engineering Geology

The study site is in Kashgar Prefecture, Xinjiang, China, on the western margin of the Tarim Basin within the central Kashgar River alluvial plain. Surface cover is predominantly cultivated soils. The shallow subsurface comprises fine-grained deposits, transitioning to fine sands at greater depth—typical of an alluvial sandy profile.

2.2. Test Pile Installation

Given the local stratigraphy and foundation soil properties, reinforced-concrete bored cast-in-place piles (C50 concrete) were adopted. The design pile diameter is 1.0 m, and the nominal length is 20 m. The intended bearing horizon is a fine-sand stratum at approximately 25.0–35.0 m depth (see Figure 1).

2.3. Engineering Test Data and Result Analysis

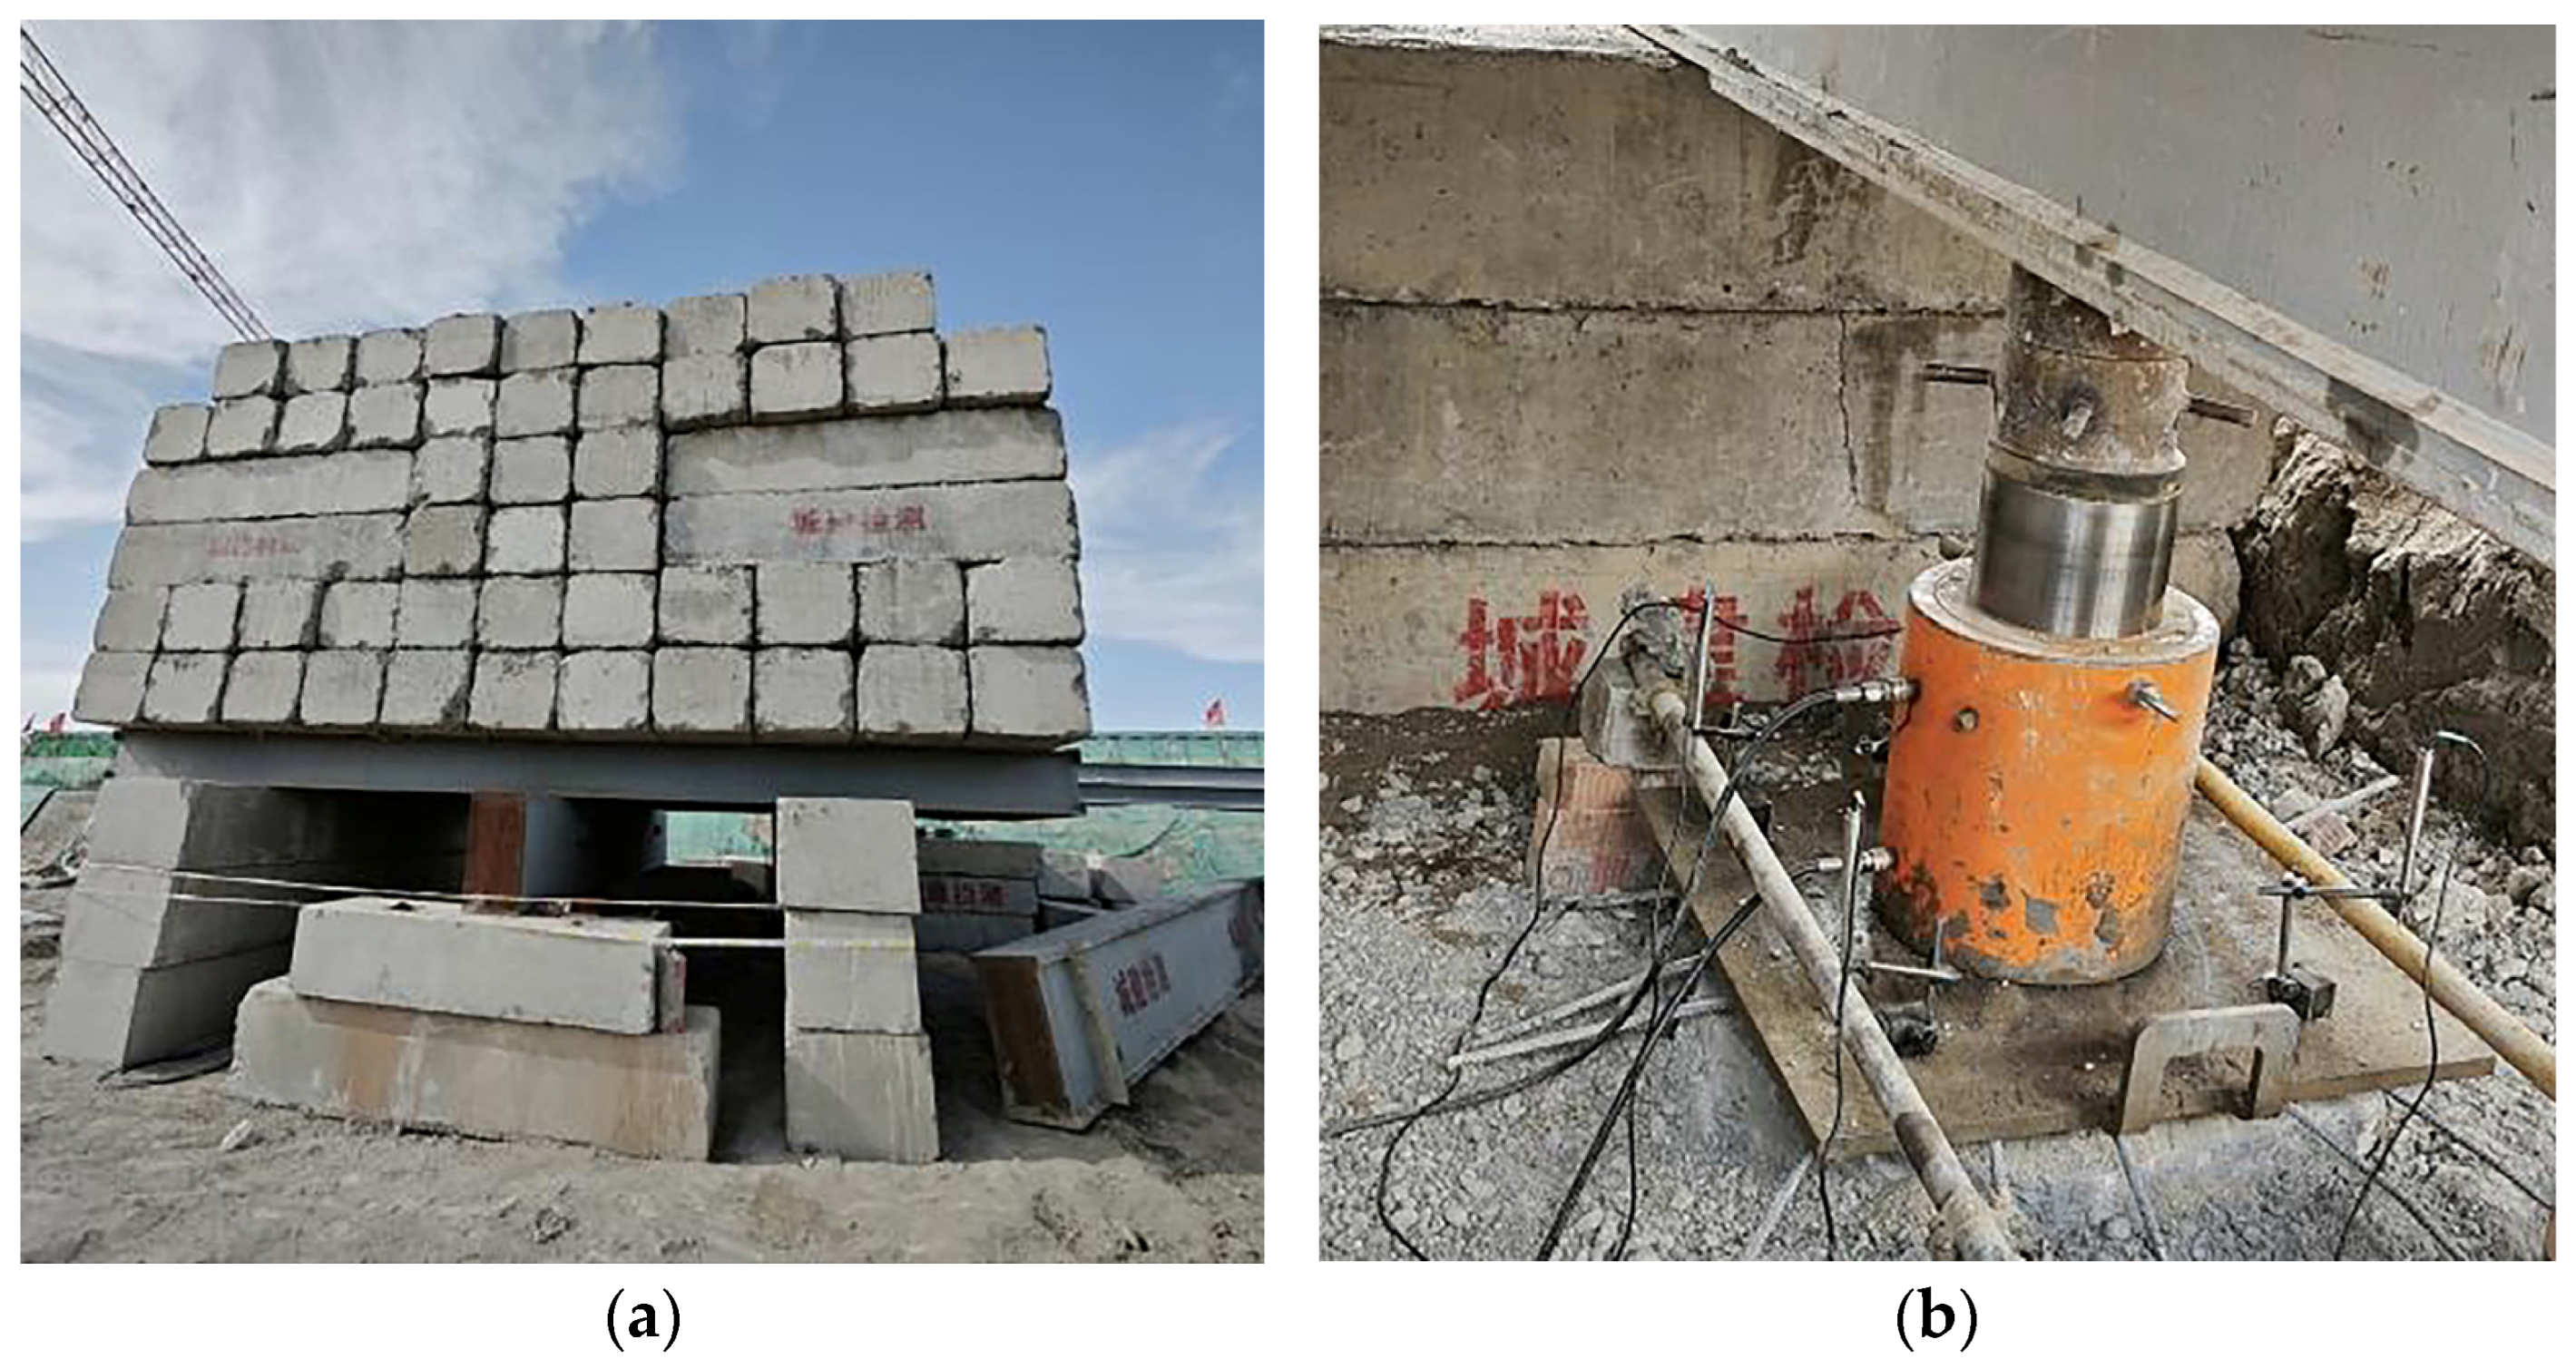
Static load tests can faithfully reflect the bearing behavior of pile foundations under pile–soil interaction, identify failure modes, and reveal anomalous bearing behaviors under special geological conditions, serving as a critical basis for verifying the reliability of finite element models. Therefore, slow-load static tests were conducted in this study in strict accordance with the Technical Code for Testing of Building Foundation Piles (JGJ106–2014) [26]. A counterweight platform reaction device was employed, utilizing stacked concrete blocks to provide the required reaction force (see Figure 2a). Graded loading was applied using a hydraulic jack, with its centerline aligned precisely with the centroid of the pile cross-section. The applied load was indirectly measured by monitoring the oil pressure using a sensor integrated into the hydraulic circuit of the jack.
As shown in Figure 2b, pile settlement was quantified using four displacement transducers mounted symmetrically along two orthogonal directions at the pile head. According to the code requirements, the total test load must reach at least twice the design characteristic value of the single-pile bearing capacity—corresponding to a minimum value of 5020 kN in this experiment. The loading process was carried out in 9 stages using the slow-load technique. Each load increment was equal to one-tenth of the maximum test load, with the initial load set at twice the incremental value. Subsequent load levels were applied only after the pile foundation had stabilized under the previous load. Settlement readings were recorded at 5 min after load application within the first hour, followed by readings at 15-min intervals. Beyond one hour, measurements were taken every 30 min. The settlement was considered stable when the rate did not exceed 0.1 mm within one hour, and this condition was met for two consecutive readings. At that point, the criterion for relative stability was deemed satisfied. soils, thereby reducing simulation fidelity [27].
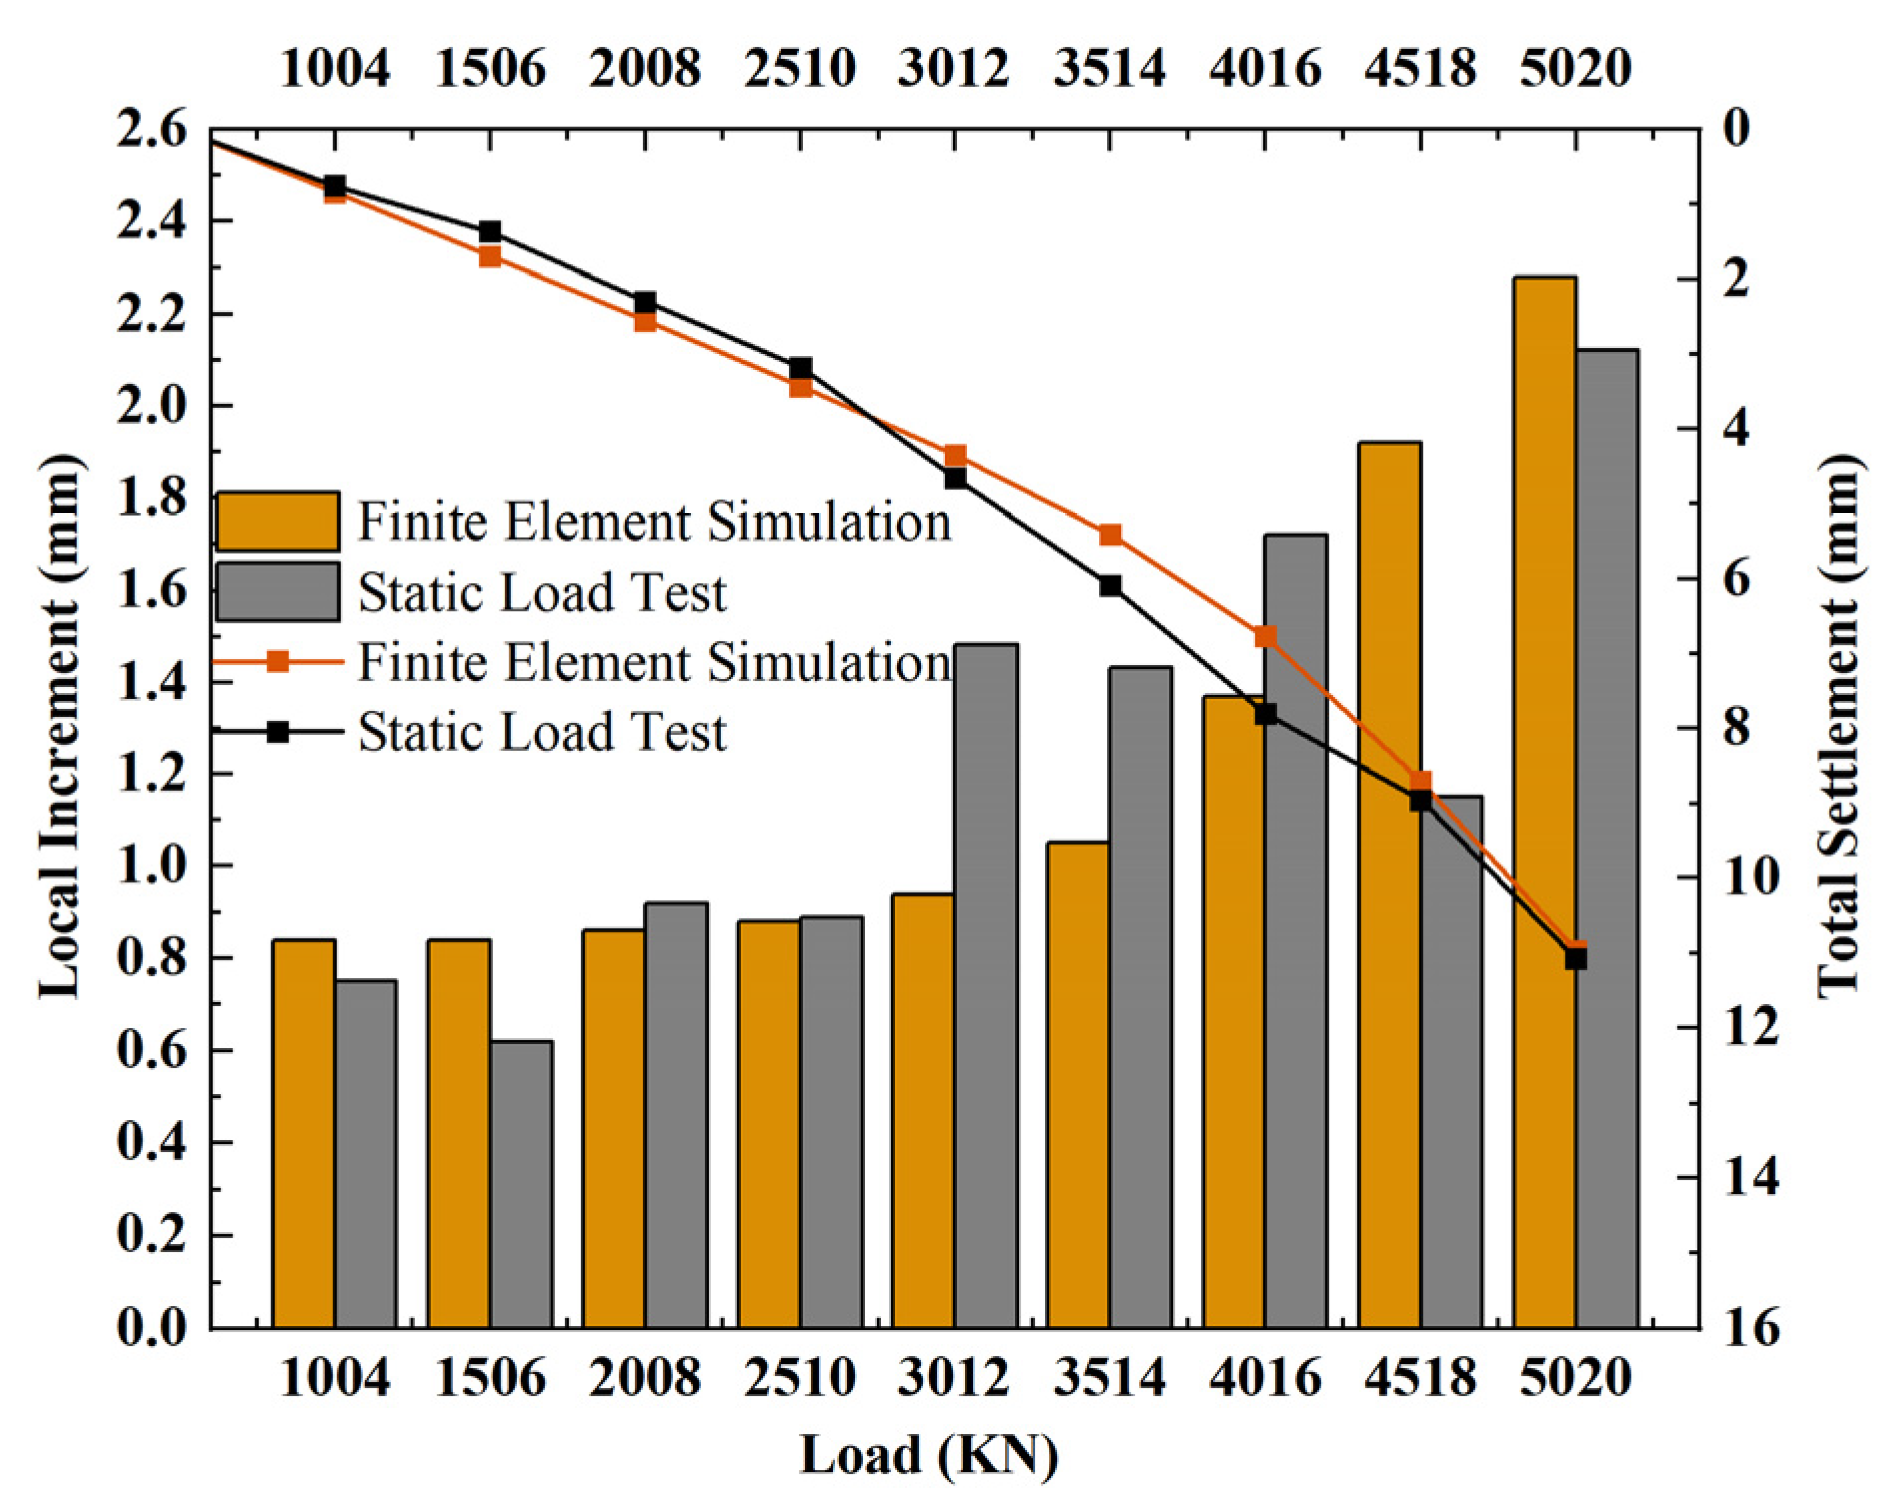
The test results are presented in Table 1. Under twice the characteristic load, the cumulative settlement at the pile head reached 11.08 mm. The settlement at each incremental load stage showed no abrupt changes and exhibited a linear growth trend, indicating that the shaft side resistance was being progressively mobilized and that the pile foundation remained in the elastic stage.
Static load tests provide clear directions for the optimization and sustainable design of pile foundations in this region:
(1)
Under twice the characteristic load, the settlement was significantly lower than the code-specified limit (40 mm), with the pile foundation remaining in the linear elastic stage and demonstrating highly predictable behavior. This offers a reference for optimizing pile dimensions and precisely controlling settlement.
(2)
The results indicate favorable geological conditions of the bearing stratum at the pile tip (sandy soil) in this area. Based on an accurate assessment of the mechanical properties of the soil layers, there exists potential for optimizing pile foundation design by reducing pile length.
(3)
The findings reveal that the current design methodology in this region tends to be conservative in its empirical correlation between soil physical–mechanical properties and pile bearing capacity.

3. Establishment of the Pile–Soil Model

3.1. Geometric Model

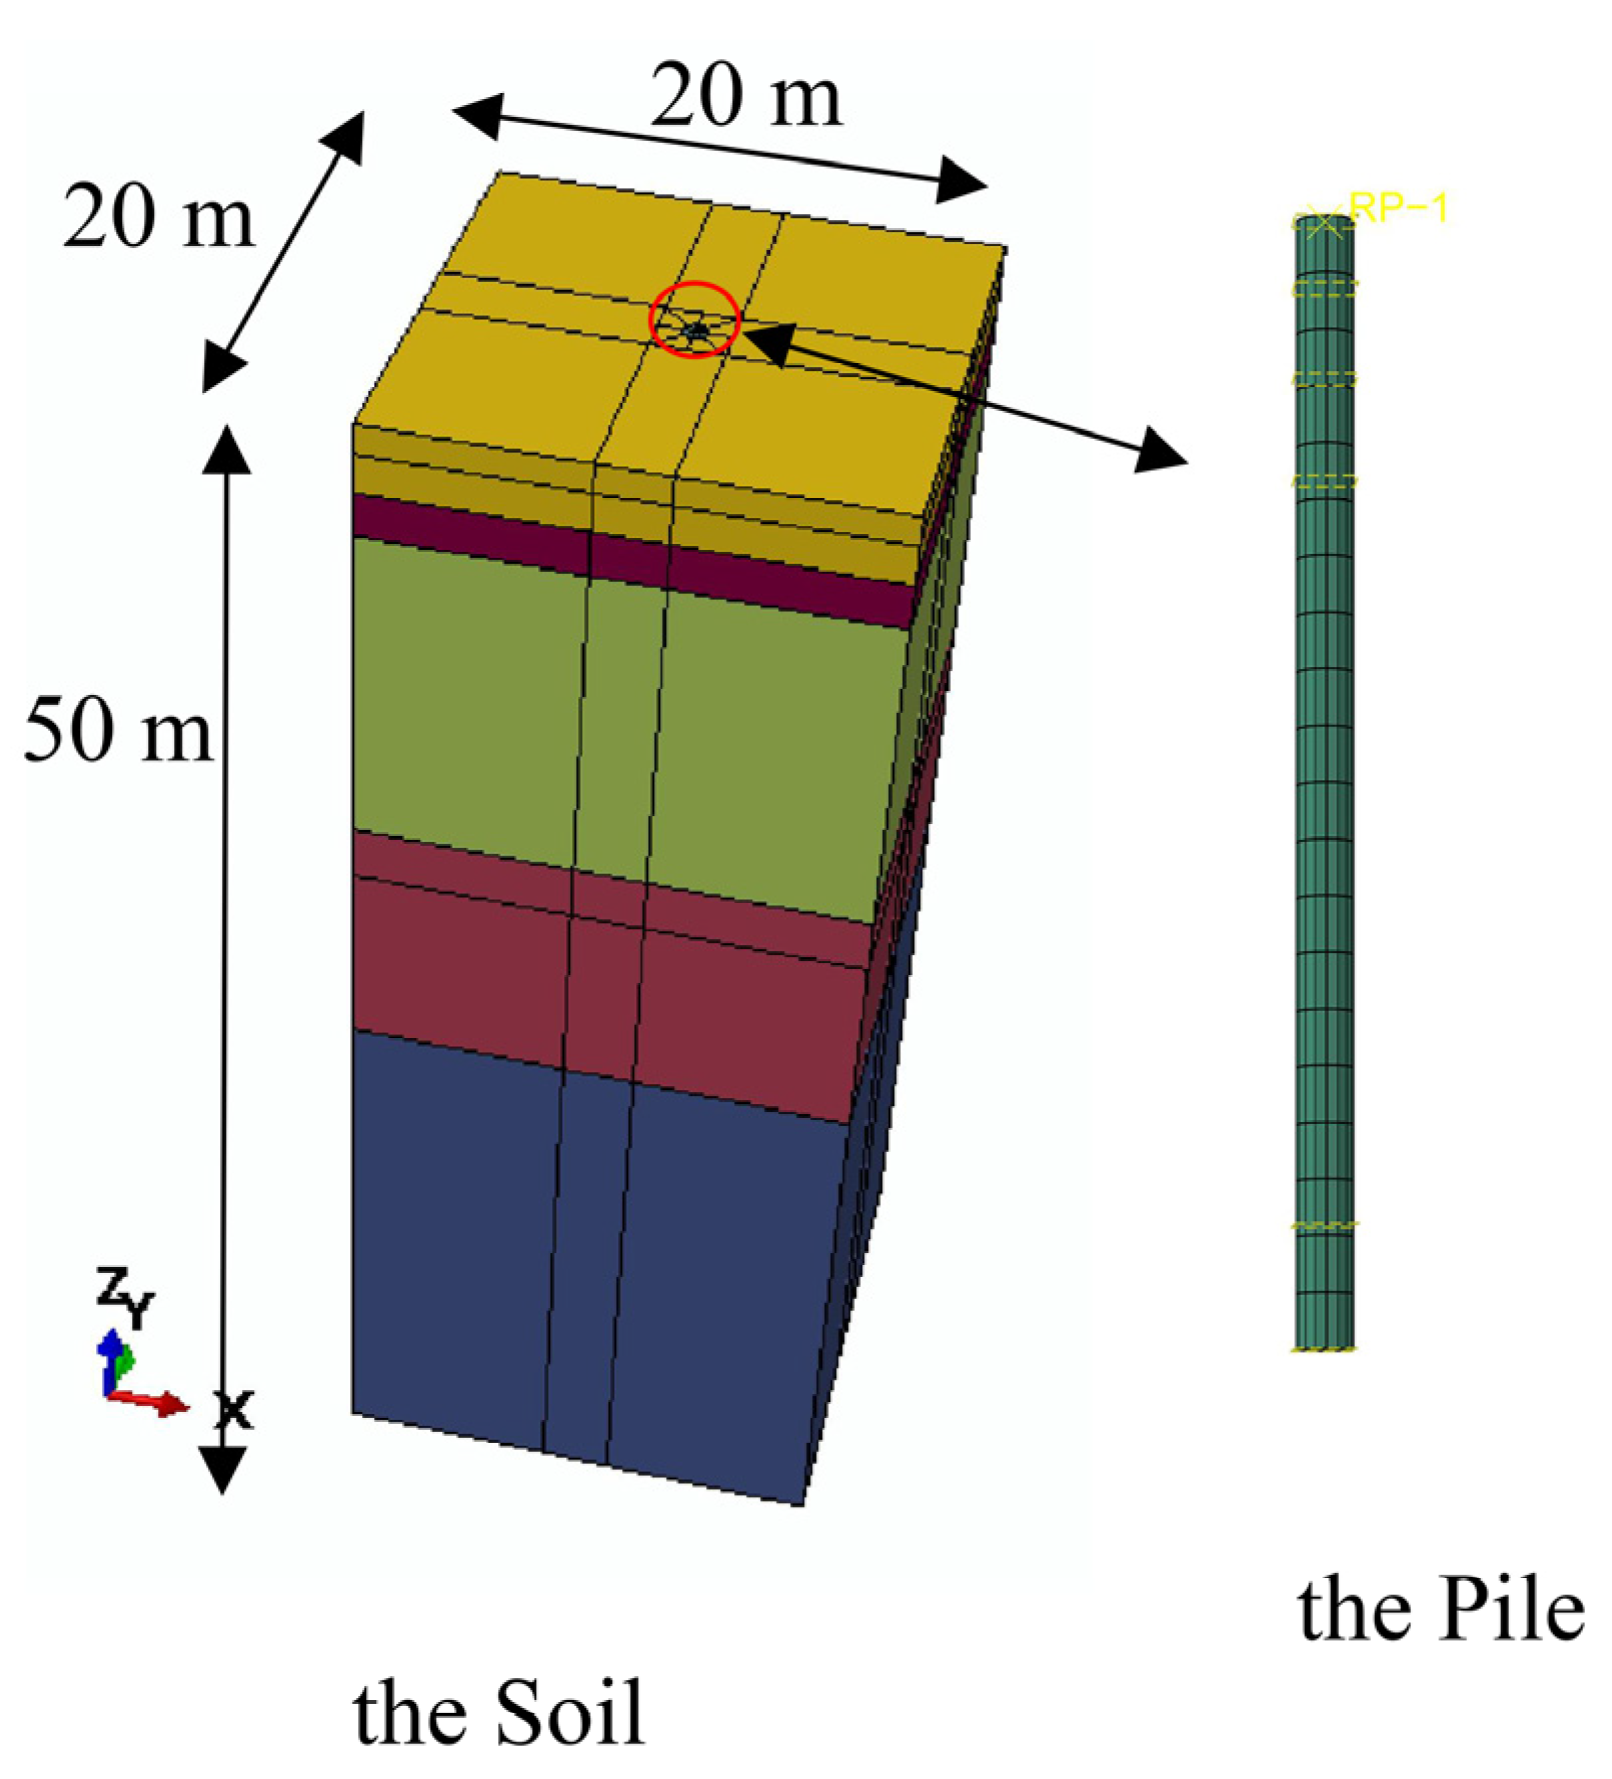
The model integrates two components into a unified system: the pile (Part 1) and the surrounding soil (Part 2). The soil stratum beneath the pile tip was assigned a thickness of 1.5 times the pile length, while the lateral extent of the soil domain around the pile was defined as 20 times the pile diameter [24,28]. The overall dimensions of the model were 20 m × 20 m in plan and 50 m in height. These dimensions were selected to fully capture the influence zone of pile–soil interaction and minimize boundary effects. The pile–soil model is shown in Figure 3.
To ensure that the selected dimensions were sufficient to eliminate boundary effects and guarantee the reliability of the computational results, two additional comparative models with dimensions of 10 m × 10 m × 40 m (smaller) and 30 m × 30 m × 60 m (larger) were established. When the model size was increased from 10 m × 10 m × 40 m to 20 m × 20 m × 50 m, the pile head settlement decreased by 3.02 mm, indicating that the boundary effects in the smaller model are non-negligible. A further increase in model size from 20 m × 20 m × 50 m to 30 m × 30 m × 60 m resulted in a settlement reduction of only 0.47 mm, representing a change of less than 2% of the total settlement. This convincingly demonstrates that the adopted model dimensions of 20 m × 20 m × 50 m are adequate to eliminate boundary effects and ensure the reliability of the computational results.

3.2. Constitutive Model

3.2.1. Pile

Under the pressure of vertical, the concrete in the bored pile provides the primary load-bearing area and plays a pivotal role, while the longitudinal reinforcement mainly enhances structural ductility to prevent brittle failure. Considering that the study focuses on the settlement under the normal service limit state, where the pile stress remains within the elastic stage, the pile was modeled as a linear elastic material.
The material properties of the pile were derived through an equivalent simplification of the actual mechanical parameters of the concrete and steel reinforcement. The actual bored pile utilized HRB400 longitudinal reinforcement, HPB300 stirrups, and C50 concrete, with the following material properties: Es = 200 GPa, ρs = 7850 kg/m3, As = 0.003216 m2 for the steel reinforcement, Ec = 34.5 GPa, ρc = 2450 kg/m3, and Ac = 0.781 m2 for the concrete. Equivalent material properties for the reinforced concrete pile were calculated using Equations (1) and (2) [6,15,29,30], resulting in an equivalent density of 2472 kg/m3 and an equivalent elastic modulus of 35.178 GPa.
E = E s A s + E c A c A
ρ = ρ s V s + ρ c V c A
where Ec represents concrete elastic modulus, and Ac indicates concrete cross-sectional area. Es stands for steel reinforcement elastic modulus, and As denotes steel reinforcement cross-sectional area. ρs represents reinforcing bar density, ρc indicates concrete density, Vs stands for reinforcing bar volume, and Vc denotes concrete volume.
To validate the reliability of the equivalent simplification, the compressive stress distributions along the pile shaft obtained from the equivalent model and the reinforced concrete model were compared at settlement values of 1 cm and 4 cm (Figure 4). The results demonstrated consistent stress distributions between the two models with only minor discrepancies in compressive stress values, confirming the high reliability of the equivalent simplification approach.

3.2.2. Soil

The pile–soil interaction is predominantly governed by shear behavior, and the Mohr–Coulomb model effectively predicts soil shear failure based on the maximum and minimum principal stresses (σ1 and σ3). Although models such as the Duncan–Chang and Hardening Soil offer advantages in capturing stiffness nonlinearity and dilatancy [31], the parameters they require (e.g., Kᵤᵣ, Rf, m) are difficult to obtain accurately for the conditions of this site. In contrast, the parameters needed for the Mohr–Coulomb model are commonly available in engineering geological survey reports or can be reliably determined through well-established empirical equations, making it more suitable for practical engineering applications. Moreover, considering that the study focuses on predicting pile settlement and ultimate bearing capacity, the soil model only needs to simulate the actual stiffness of the foundation soil and determine the critical value for shear failure. Therefore, the soil was simulated using the Mohr–Coulomb model, with the computational parameters for the constitutive model of each soil layer provided in Table 2.

3.3. Contact Conditions

This model primarily incorporates two types of contact behaviors: the pile shaft-surrounding soil interface and the pile tip-bearing stratum interface. Currently, two main approaches are employed for simulating the pile–soil interface: one utilizes contact pairs defined at the interface, while the other adopts rigid connections, indirectly representing the interface behavior through constitutive models [32]. Given that the Mohr–Coulomb model used in this study possesses inherent limitations in capturing complex mechanical behaviors such as dilation, contraction, and strain softening—thereby failing to accurately represent the actual interface response—the contact pair approach was selected to define the pile–soil interaction. Specifically, surface-to-surface contact was defined, adhering to the principle of assigning the stiffer surface as the master; thus, the pile surface was designated as the master surface and the soil surface as the slave surface [13,24]. The contact behavior was modeled with a “hard contact” in the normal direction and a Mohr–Coulomb constitutive model in the tangential direction [6,33]. The friction coefficient μ at the pile–soil interface constitutes a critical parameter in this model and forms the foundation for investigating pile foundation stability. Based on recent research findings [34,35,36], the pile–soil interface friction coefficient μ can be calculated using Equation (3) in conjunction with a correction factor k. The recommended values for k are calculated by Equation (4) or directly set to 0.75 and 1.0, respectively. This study defines three working conditions, K1–K3, corresponding to these three k values. The specific friction coefficients and corresponding computational results are summarized in Table 3. The results indicate that the simulated values under the K3 condition show the smallest error.
μ = tan K × φ
where μ represents the pile–soil interface frictional coefficient, φ denotes the soil internal friction angle, and K indicates the correction factor.
K = tan 1 sin φ cos φ 1 + sin 2 φ
where φ denotes the soil internal friction angle.
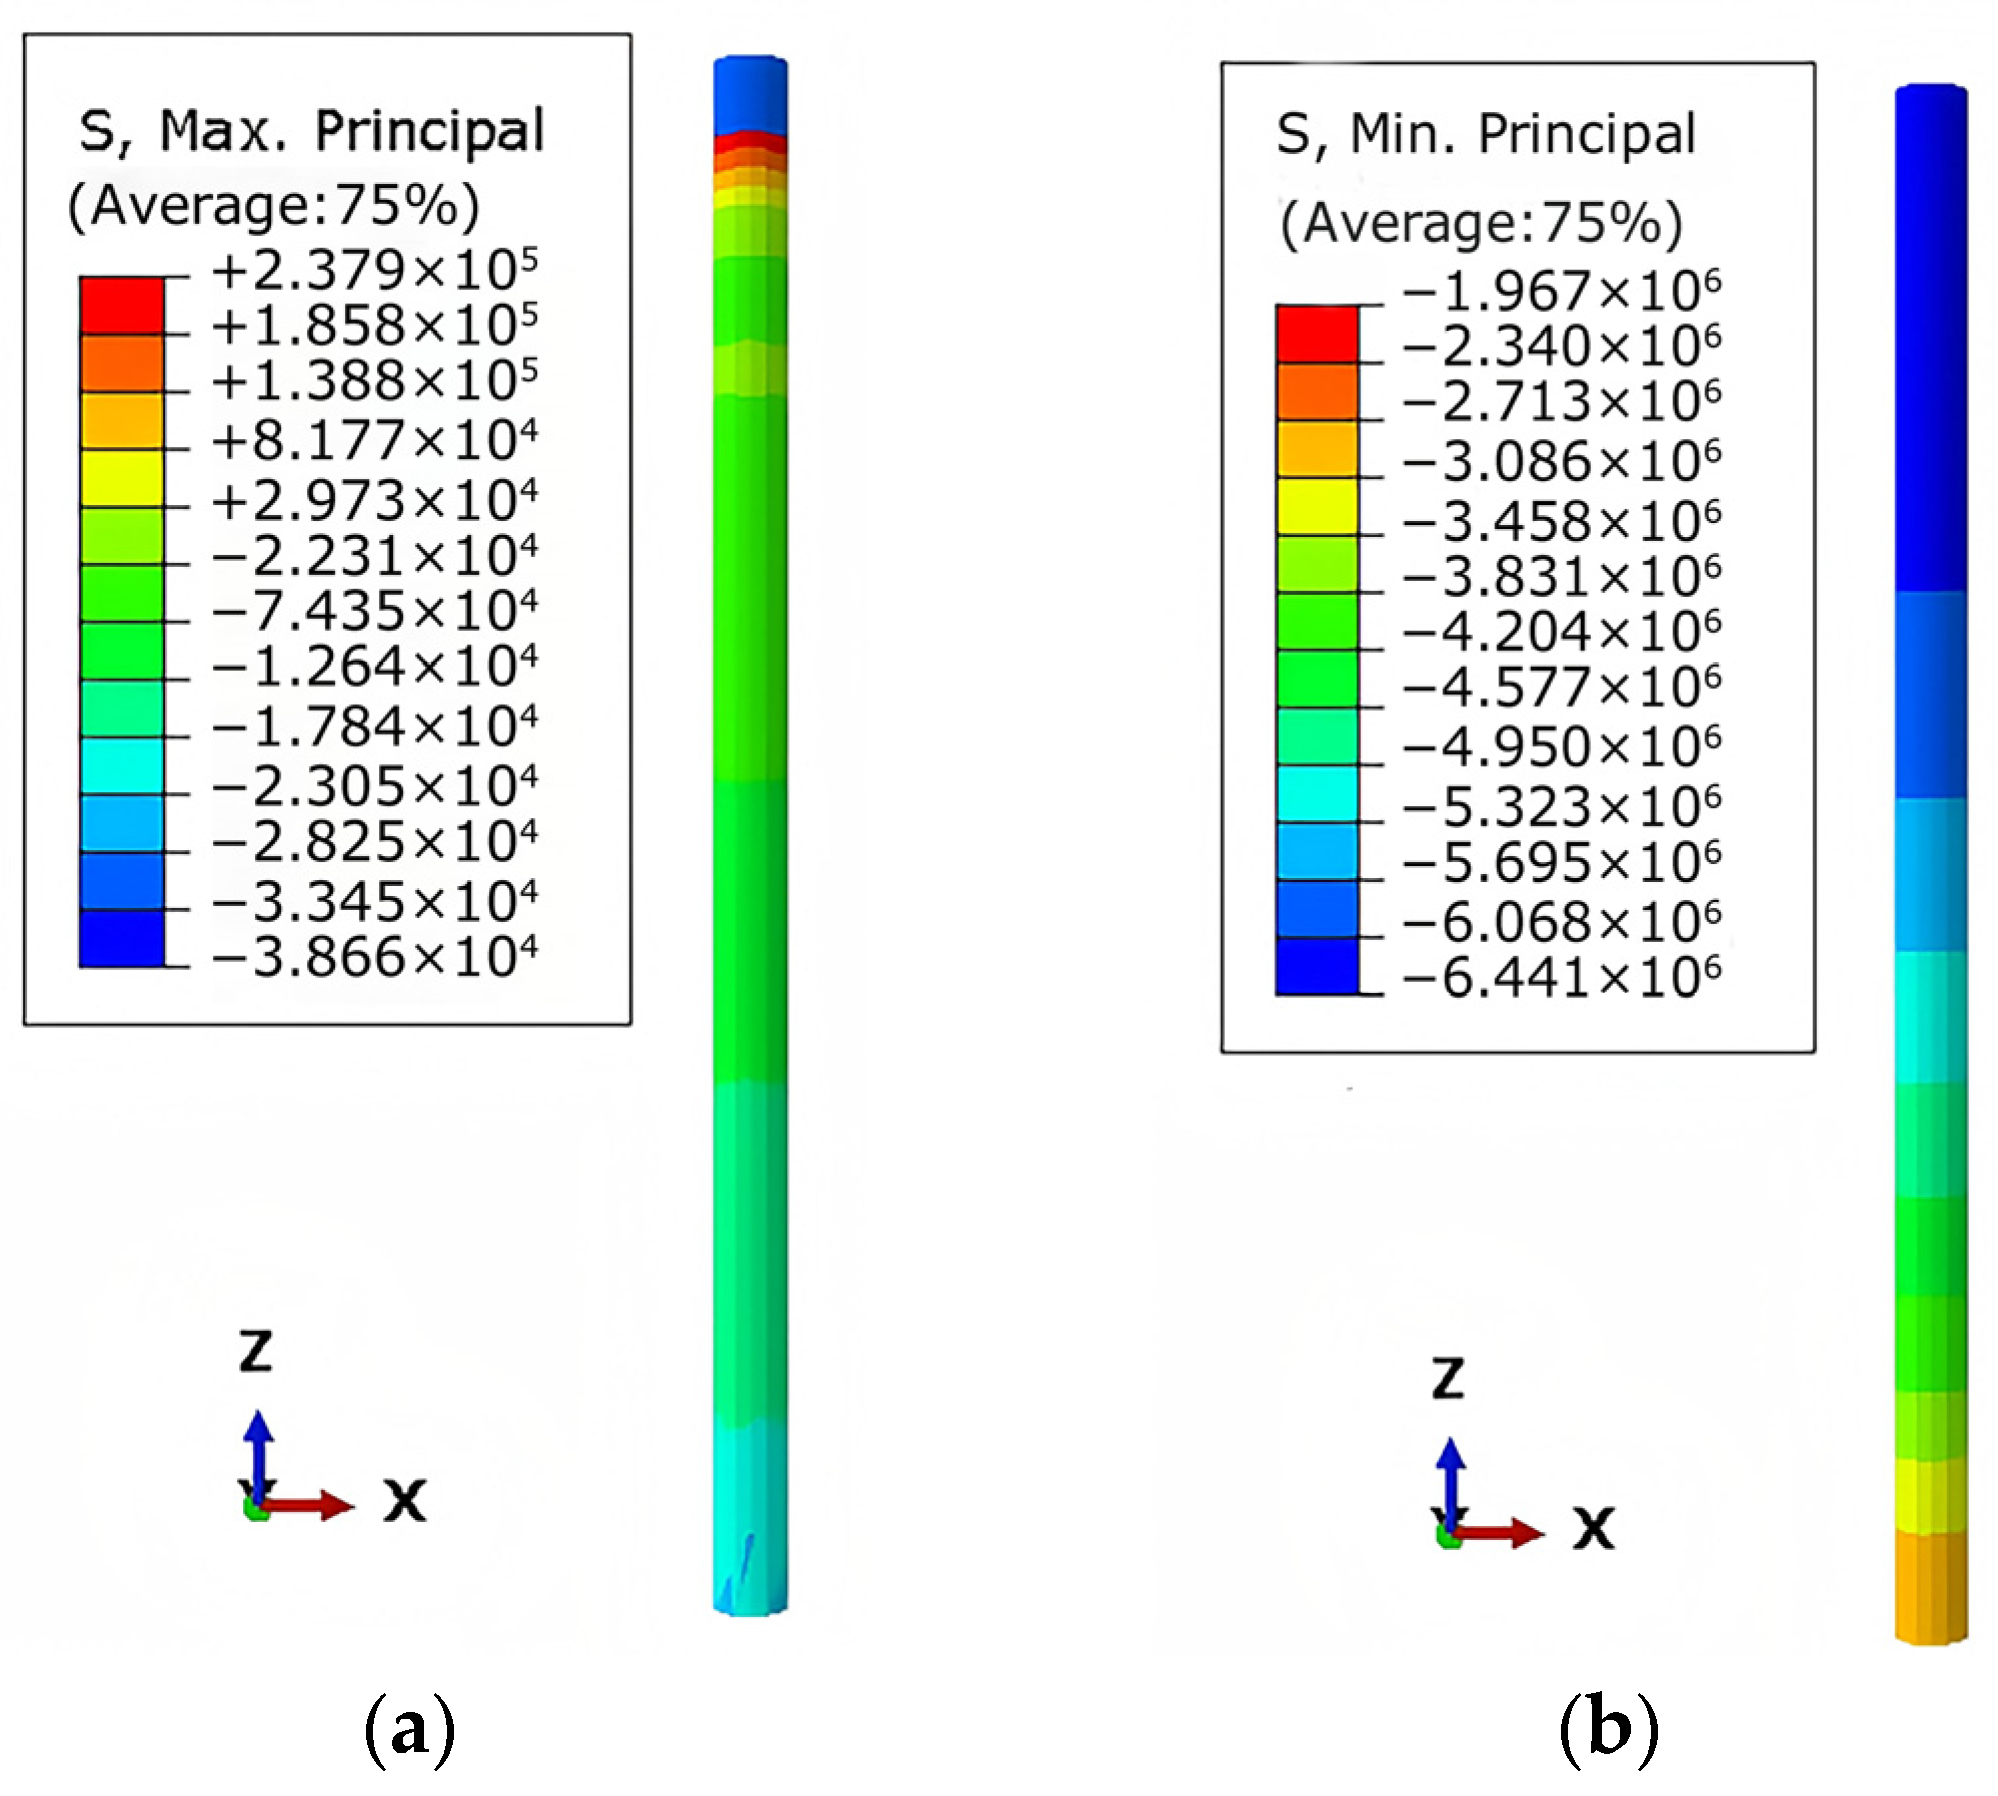
When k = 1, the stress nephogram of the test pile is shown in Figure 5. The maximum compressive stress is 0.3866 × 10⁶ Pa, which is significantly lower than the compressive elastic limit of concrete [37], indicating that the test pile remains in the elastic working stage. Therefore, setting the correction factor k for the pile–soil friction coefficient to 1 is demonstrated to be reliable.

3.4. Boundary Conditions

The boundary conditions in the numerical model were set as follows:
(1)
In the soil model, all nodes on the lateral boundary planes parallel to the x-direction were constrained against displacement in the transverse direction (y-direction) [32].
(2)
In the soil model, all nodes on the lateral boundary planes parallel to the y-direction were constrained against displacement in the transverse direction (x-direction).
(3)
In the soil model, all nodes on the bottom boundary plane were constrained in all translational degrees of freedom (X, Y, and Z directions) [22,38].
(4)
At the pile–soil interface, constraints in both X and Y directions were applied to the soil prior to the activation of the pile model.

3.5. Mesh Generation and Independence Verification

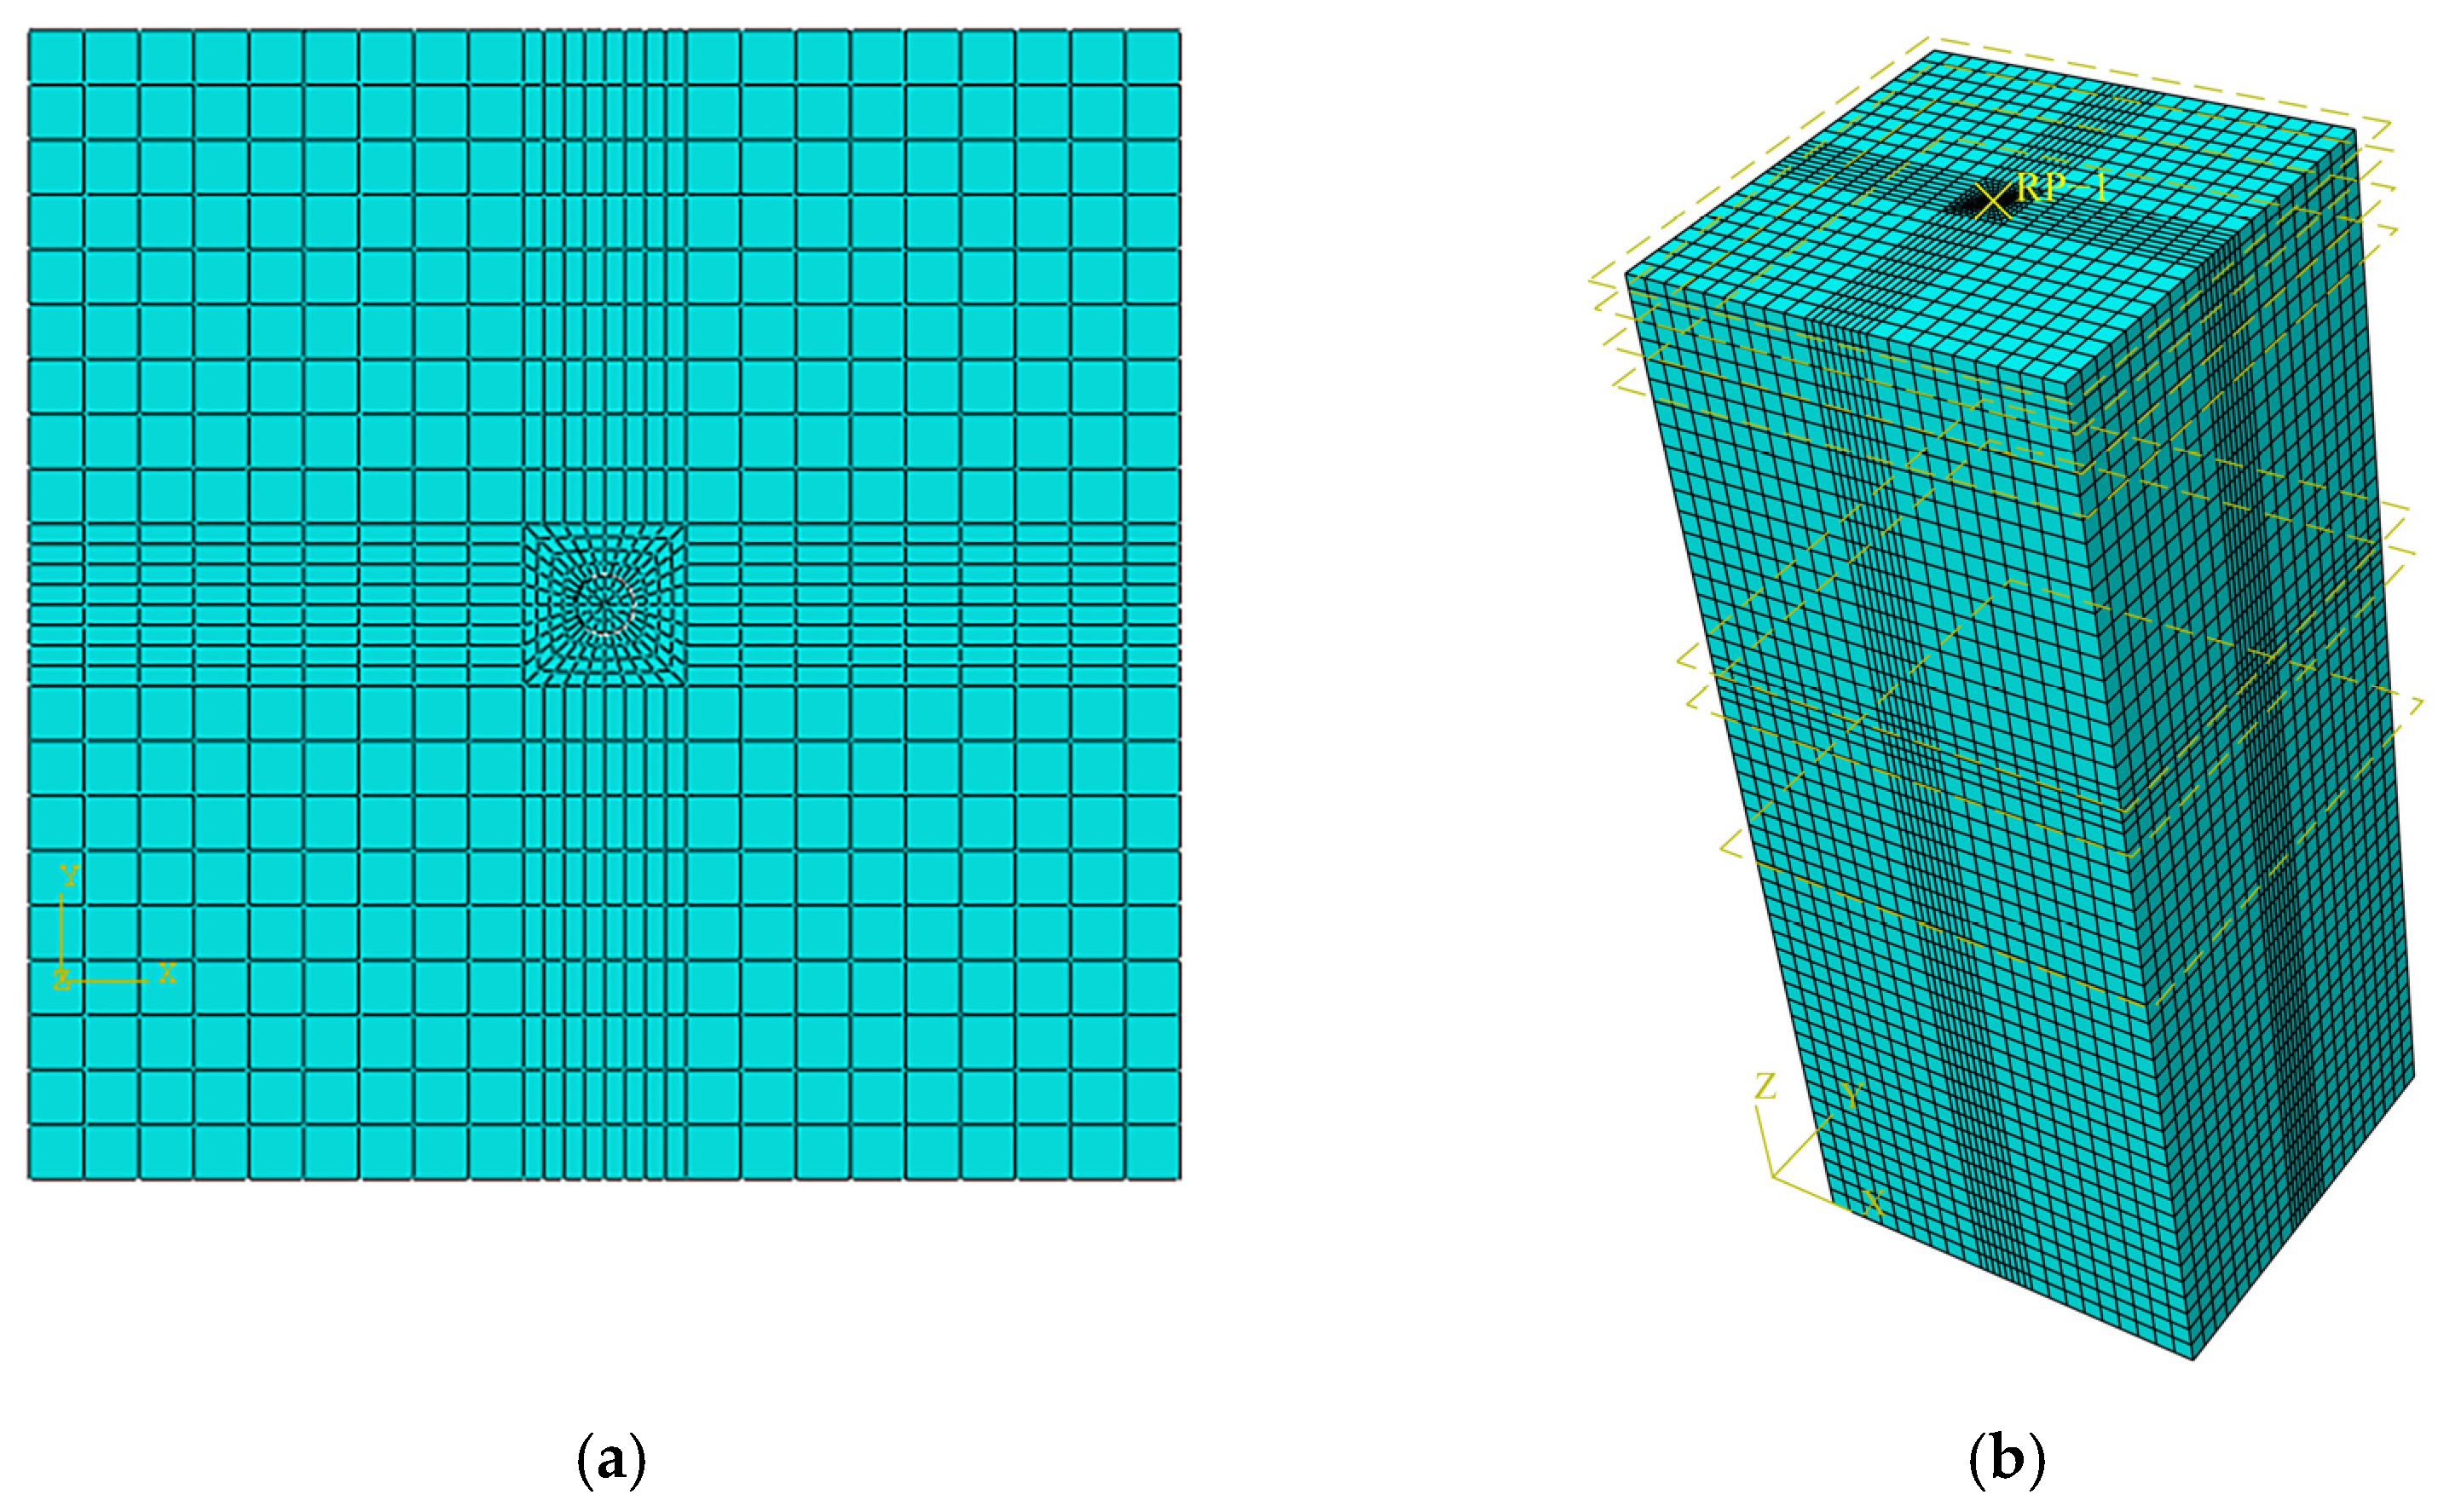
The mesh configuration is illustrated in Figure 6. The model was discretized using partitioning and structured meshing techniques for both the pile and surrounding soil, employing optimized C3D8R elements. This study adopted a refined strategy similar to that of Mohsen Bagheri et al. [39] for mesh generation and calibration, implementing local refinement in soil regions around the pile tip and along the pile shaft following the principle of “denser mesh on master surfaces and coarser mesh on slave surfaces.” Specifically, an element size of 0.4 was adopted for the pile cross-section, 0.1 for adjacent soil domains, and 1.0 for remaining regions, resulting in a mesh comprising 42,580 nonlinear solid elements (C3D8R).
To ensure accurate resolution of displacements and forces at the pile–soil interface while maintaining computational efficiency, a mesh independence study was conducted using three different mesh sizes. Table 4 summarizes the cumulative settlements under 5020 kN loading for various mesh densities, showing negligible variation in results with increasing mesh refinement. After balancing computational cost and accuracy, the configuration with 42,580 elements was selected. Subsequent mesh quality evaluation based on aspect ratio and maximum corner angle criteria confirmed zero poorly shaped elements, thereby ensuring the reliability of finite element simulation results.

3.6. Analysis Step

The numerical analysis procedure comprised eleven sequential steps: the first step was the geostatic equilibrium analysis, which was conducted using the birth–death element method; the second step involved the activation of the pile; and steps three through eleven were employed to simulate the actual static load test process.

3.7. Comparison and Verification of Test Results

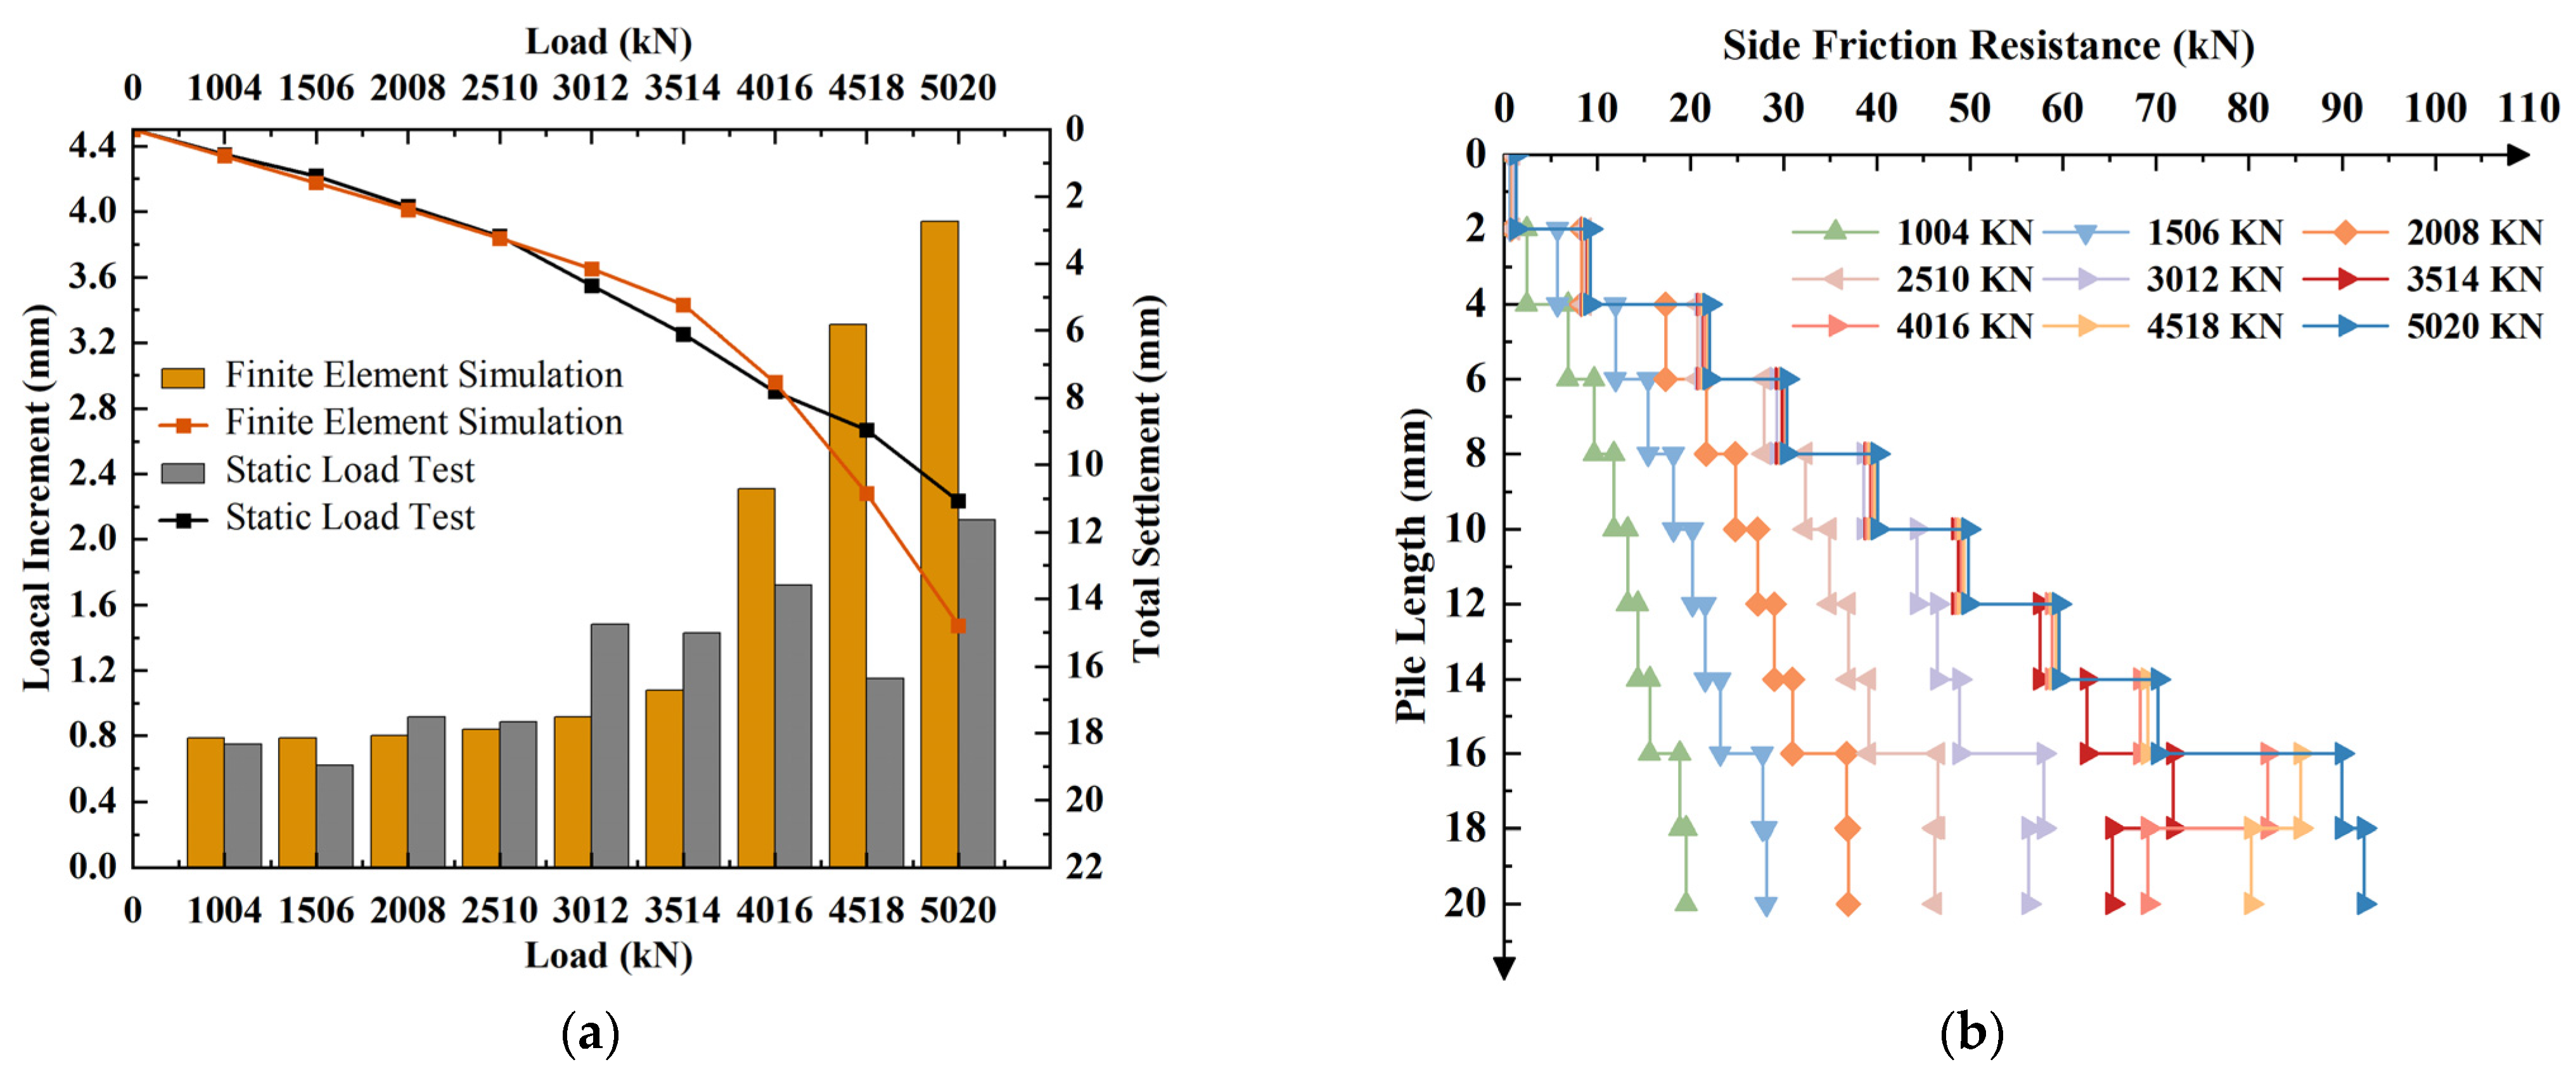
The models were validated by comparing the load–settlement curves obtained from static load tests and finite element simulations. As shown in Figure 7a, when the applied load was less than 4016 kN, the measured and simulated load–settlement curves closely matched, demonstrating good predictability. However, once the load exceeded 4016 kN, the simulated load–settlement curve exhibited a sharply decreasing trend, with the discrepancy between results progressively increasing. The distribution of shaft side friction resistance under various loading conditions is depicted in Figure 7b. As illustrated, when the load exceeded 3514 kN, the load transfer characteristics remained consistent within the pile depth range of 0–14 m, reaching its maximum side friction resistance within the 16–18 m depth interval. The distribution curve of the shaft-side friction resistance conforms to the load-transfer mechanism, indicating that the Mohr–Coulomb model can correctly capture the load-transfer process of the pile. This confirms the reliability of the Mohr–Coulomb model in simulating pile–soil interaction, while also revealing that its limitations in sandy soil regions primarily stem from empirical parameters failing to fully reflect the soil stiffness.
Based on the above analysis, this study will proceed to quantify the influence of physical–mechanical properties of each soil layer on pile settlement under various load conditions, calibrate region-specific empirical parameters, and optimize the numerical model, thereby achieving reliable prediction of the ultimate bearing capacity of the pile foundation.

4. Sensitivity of Pile Stability to Soil Parameters

4.1. Selection of Factors and Evaluation Indicators

As shown in the engineering geological column (Figure 1), the foundation soil consists of five distinct strata: ② silt (above 10.0 m, S1), ② silt (below 10.0 m, S2), ③ fine sand (above 25.0 m, S3), ③ fine sand (25.0–35.0 m, S4), and ③ fine sand (below 35.0 m, S5) is located at the pile tip. The stratum ③ fine sand (25.0–35.0 m) is treated as the pile end; fine sand (below 35.0 m) has no friction surface with the pile. Previous research has confirmed that the elastic modulus, internal friction angle, Poisson’s ratio, pile–soil friction coefficient, and cohesion influence the bearing behavior of pile foundations. Considering the specific engineering geological conditions of this site, with the pile head located at a depth of −7.2 m and surrounded by two relatively thin silt layers (2.8 m and 1.8 m thick, respectively), and given that the cohesion of the primary sand layers traversed by the pile shaft is zero (see Table 2), cohesion was therefore excluded as an influencing factor. Consequently, this study selected the Poisson’s ratio, internal friction angle, and elastic modulus of soil layers S1–S5, along with the pile–soil friction coefficient of layers S1–S4, as candidate parameters, while adopting settlement as the response (evaluation) metric. Due to the inconsistent units and scales of the selected parameters, this study used a variable-control scheme in which selected parameters were perturbed proportionally prior to quantitative sensitivity analysis.

4.2. Variable-Control Experimental Design

(1)
Preliminary experiments: Each selected factor was reduced by 20% relative to its baseline value to identify insensitive variables.
(2)
Refined experiments: Factors deemed insensitive in the preliminary step were discarded. For the remaining factors, controlled tests were performed with baseline values taken from the engineering data and allowable fluctuations constrained within ±20%. Each experimental group included five variables, and the uniform variation rate of 10% applied to each independent variable.

4.3. Data Processing and Results

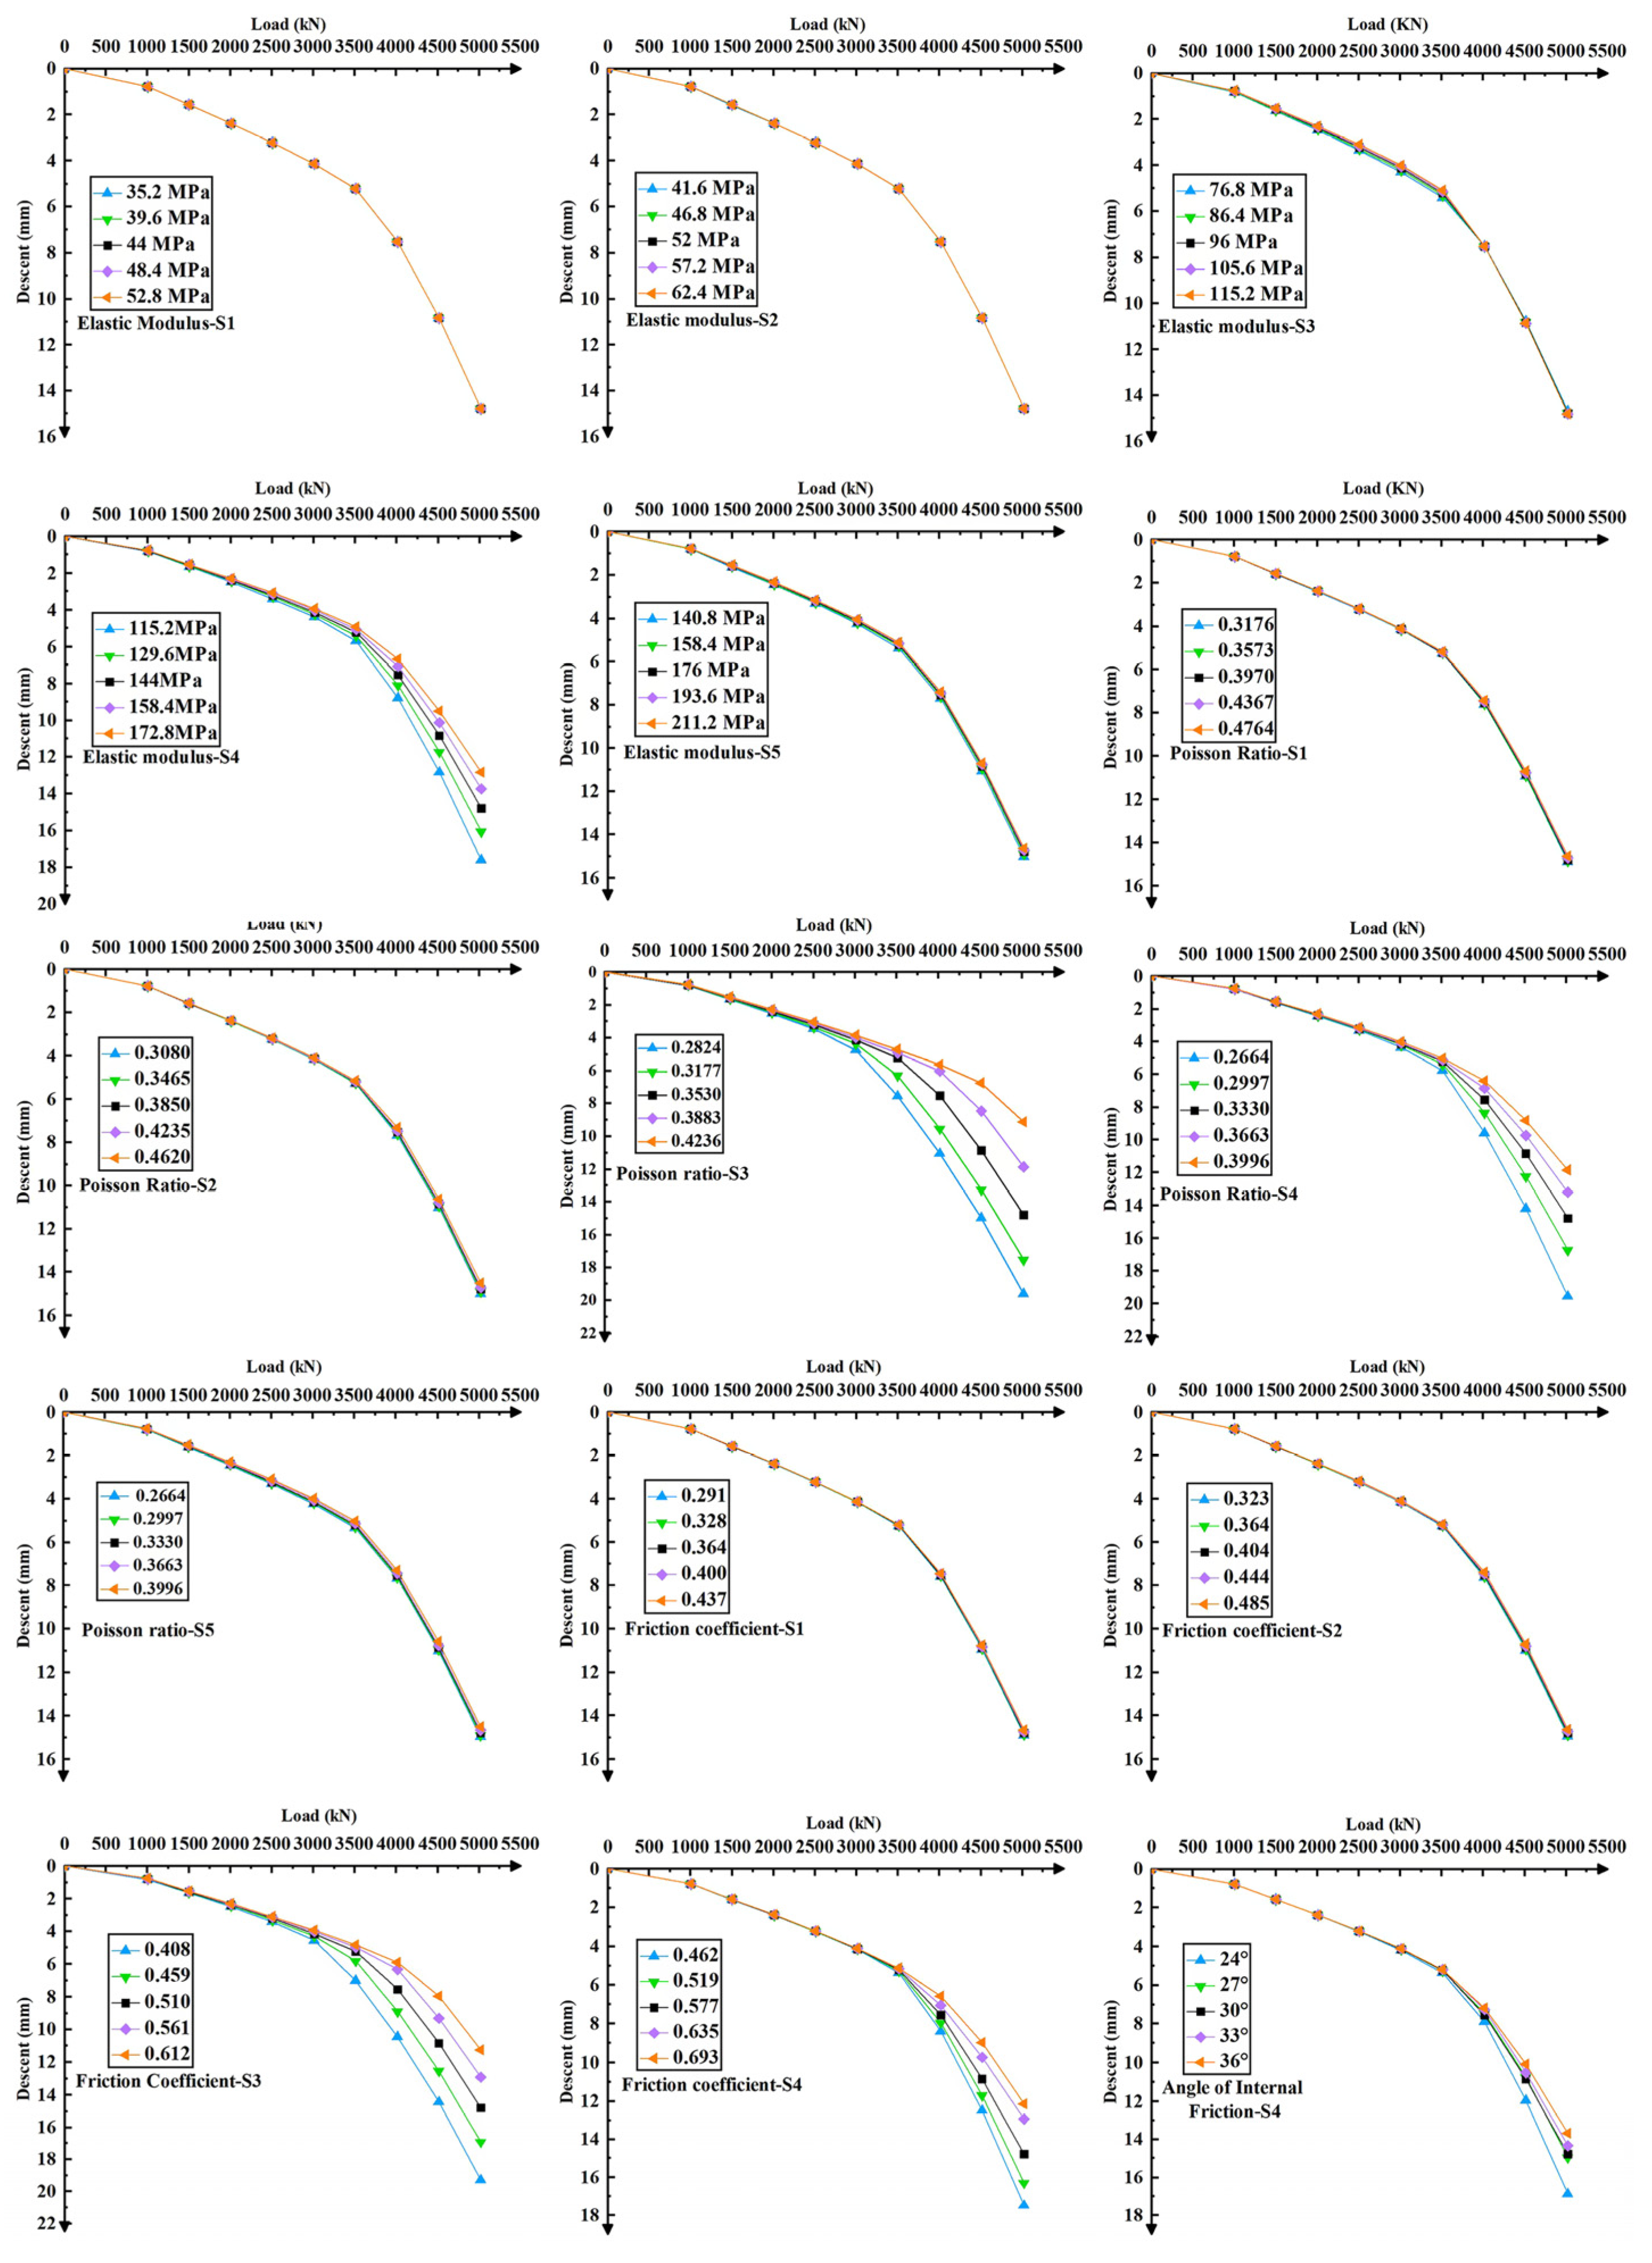
Preliminary load–settlement comparisons are summarized in Table 5. Except for S4 (pile-end soil), reductions in internal friction angles for S1, S2, S3, and S5 produced negligible changes in settlement at all load levels. Based on the above analysis results, the number of parameters carried forward was reduced from 19 to 15. Results of the refined tests are presented in Figure 8.
To quantify the influence of each mechanical parameter on settlement, we defined the incremental settlement difference di as follows:
d i   = S i + 1 S i ( i = 1 5 )
where Si is the settlement from the i-th test.
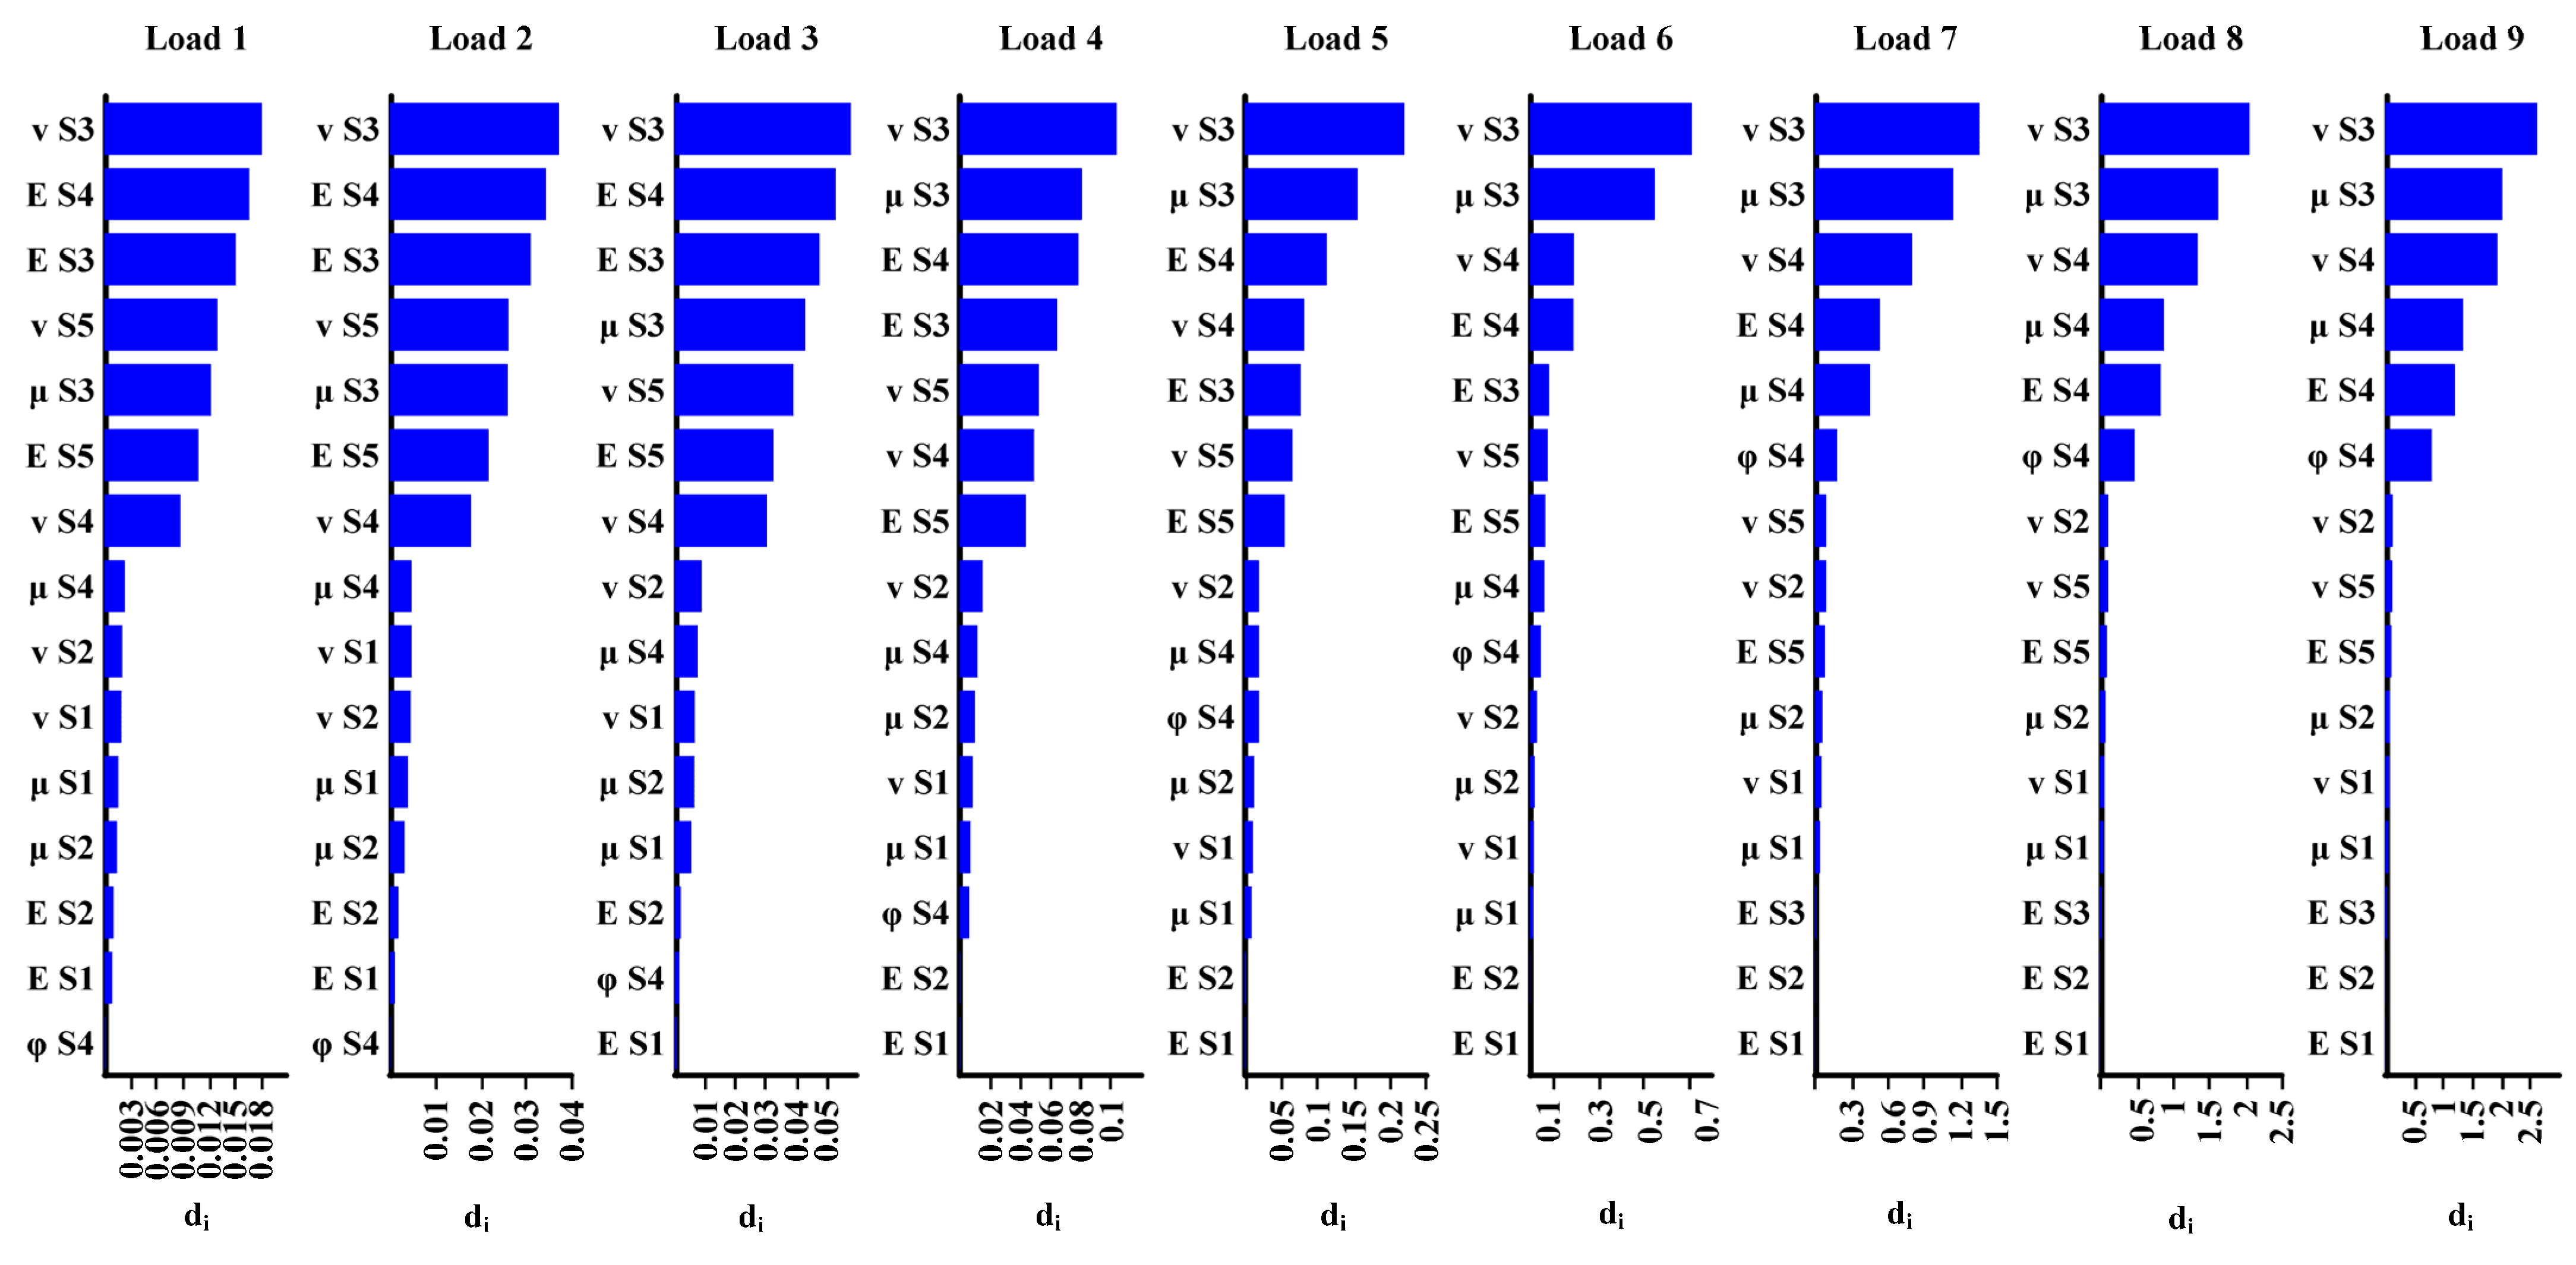
The di values (Figure 6) allow for a visual assessment of how factor sensitivity evolves with increasing load, providing a clear and preliminary understanding of the varying influence of different parameters on settlement under different loading conditions. Based on the criterion of maximum mean di value, the most sensitive factors significantly affecting settlement at each load level were identified.
As illustrated in Figure 9, the physical–mechanical properties of the pile-end soil and its adjacent soil strata (both above and below) exhibit relatively high sensitivity to the settlement. In the early loading stage, the five most sensitive factors influencing settlement are v-S3, E-S4, E-S3, v-S5, and μ-S3. By the ninth load level, the key factors become v-S3, μ-S3, v-S4, μ-S4, and E-S4. Among them, v-S3 remains the most sensitive factor throughout all loading stages. As the load increases, the influence of E-S4, E-S3, v-S5, and E-S5 gradually decreases, while the influences of φ-S4, μ-S4, μ-S3, and v-S4 become more pronounced. This suggests that the friction coefficient and Poisson’s ratio play an increasingly significant role in settlement behavior under higher loads.
Sun [14] reported that, for the pile-end soil, the most sensitive factors include the internal friction angle, Poisson’s ratio, friction coefficient, and elastic modulus. Our results concur for the pile-end stratum and further show that the overlying stratum above the pile tip (S3) contributes substantially via its friction coefficient and Poisson’s ratio. As the pile-end stratum is relatively thin compared with the overlying layer, thickness appears to have little effect on the sensitivity of the internal friction angle and elastic modulus, but it does affect the influence of the friction coefficient and Poisson’s ratio.
For comparability across factors, we also computed a sensitivity coefficient (SAF) as:
SAF   =   A A / F F
where △A/A is the relative change in the factor, and △F/F represents the change rate of the factor.
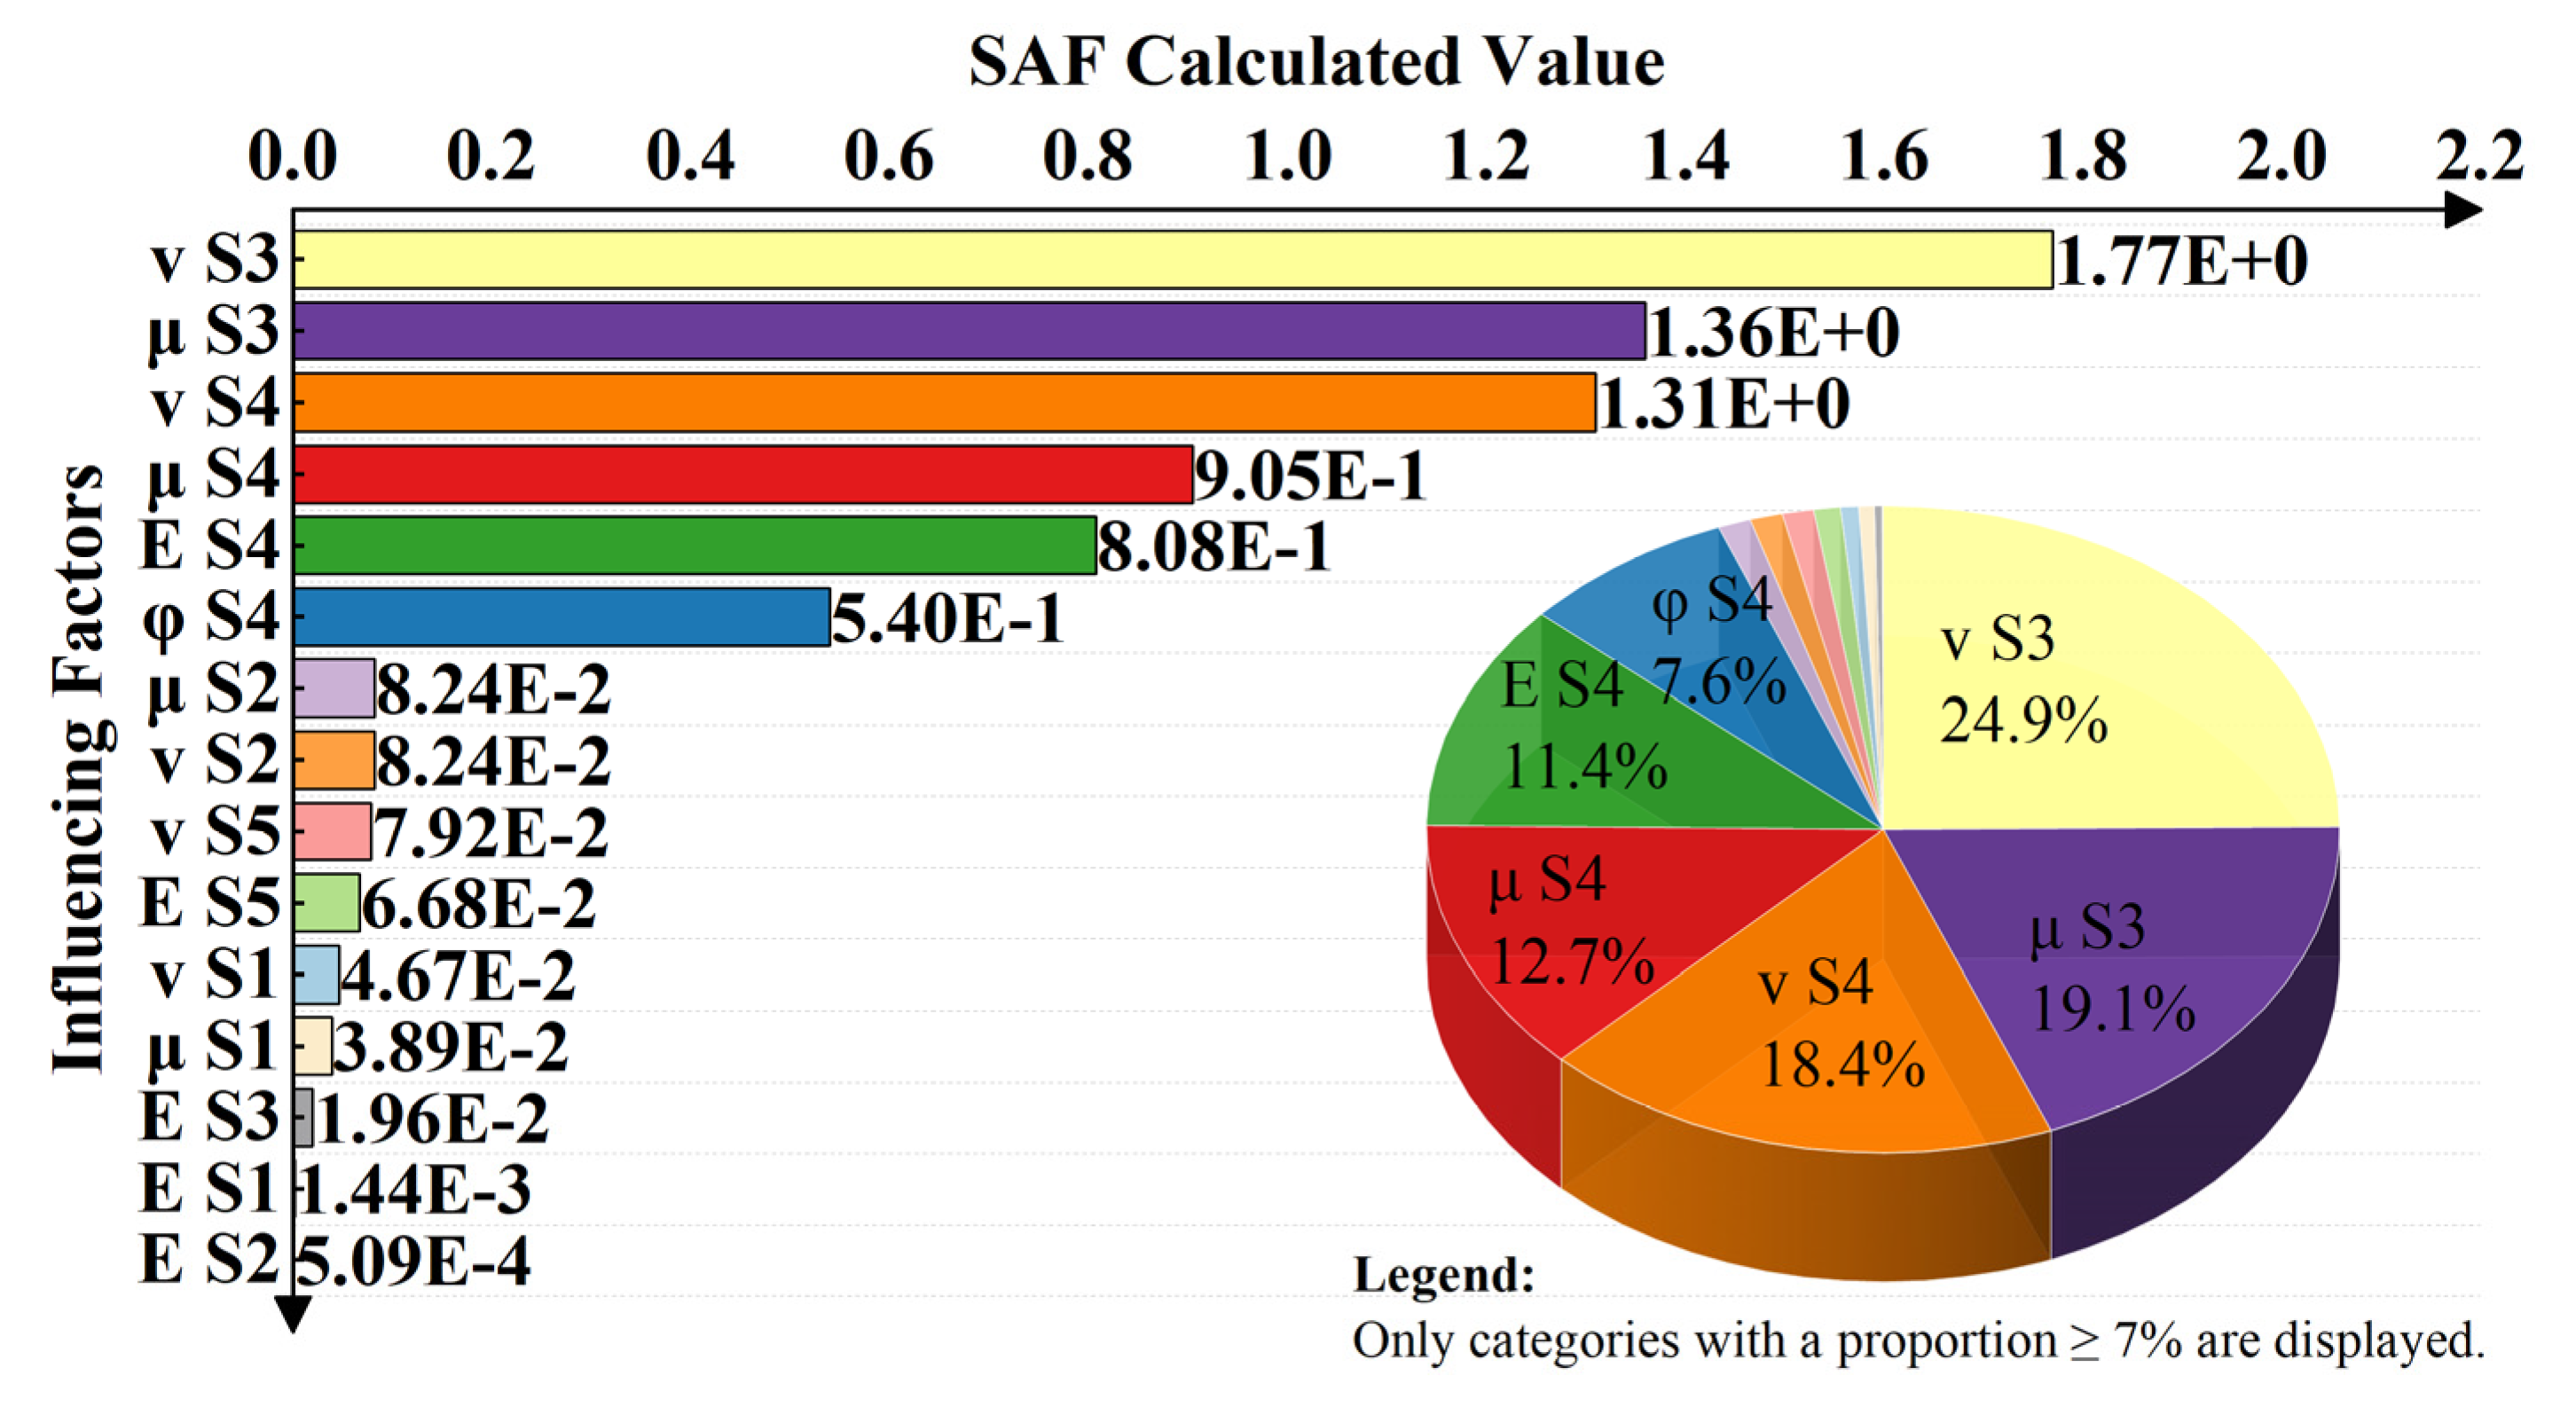
The larger SAF, the more sensitivity. the evaluation index A is to the factor F. To more intuitively illustrate the sensitivity of the physical–mechanical properties of each soil stratum to settlement, the mean sensitivity coefficients of each parameter are presented using a combined bar and pie chart (Figure 10). Under the condition of variable control experiments, sensitivity analysis was conducted for the above 15 selected parameters using settlement as the evaluation index. The results show the sensitivity ranking of mechanical parameters of each soil stratum in sandy soil areas with respect to settlement was as follows: v-S3, μ-S3, v-S4, μ-S4, E-S4, and φ-S4.

5. Sensitivity of Soil-Property Effects on Ultimate Bearing Capacity

5.1. Pile–Soil Model Valication

Based on the variable control test results, it is recommended to set the elastic modulus of the sandy soil in this region as 8 times the compression modulus and to prioritize proportional adjustments of the friction coefficient, elastic modulus, and Poisson’s ratio of the pile-end soil for model optimization. In the optimized pile–soil model, the elastic modulus of the sandy soil was adjusted to 8 times the compression modulus, with key parameters of the pile-end soil layer (S4) modified as follows: the friction coefficient and Poisson’s ratio were increased to 1.2 times their original values (μ-S4 = 0.693, v-S4 = 0.4), while the elastic modulus was set to 0.875 times the adjusted value (E-S4 = 126 MPa). A comparison between the optimized simulation results and the experimental measurements is presented in Figure 11. The final measured settlement was 11.08 mm, while the simulated settlement was 10.98 mm. The difference between the finite element simulation results and the measured data was 0.1 mm, with an error of 3%. The calibrated pile–soil model more accurately captures the settlement response across various load levels during static load tests and better reflects the true mechanical strength and stiffness characteristics of the soils surrounding the pile. To comprehensively evaluate the predictive performance of the pile–soil model, this study selected the root mean square error (RMSE), mean relative error (MRE), and coefficient of determination (R2) as regression evaluation metrics. The results on the validation set demonstrate excellent performance: R2 = 0.99, MRE = 0.099, and RMSE = 0.4633, confirming that the calibrated pile–soil model achieves high predictive accuracy. These results demonstrate that the optimized model ensures the reliability of subsequent parametric analyses of the ultimate bearing capacity of the pile.

5.2. Orthogonal Test Design and Result Analysis

Based on the screening in Section 4, five influencing factors were selected: v-S3, μ-S3, v-S4, μ-S4, and E-S4. This study employed a five-factor, five-level L25 (55) orthogonal design with the ultimate bearing capacity as the evaluation index. The factor levels are shown in Table 6, and the specific test combinations are summarized in Table 7.
The experimental results each treatment in the orthogonal experimental design are summarized in Table 8, where the ultimate bearing capacity of each level is denoted as N-max. With μ-S3, v-S4, v-S3, μ-S4, and E-S4 as fixed factors, and the ultimate bearing capacity as the response variable, a multi-factor analysis of variance (ANOVA) was conducted. To evaluate potential multicollinearity, the variance inflation factor (VIF) was employed. [19] The VIF, calculated using Equation (7), where R2 denotes the multiple correlation coefficient among the independent variables, is a widely used measure for assessing the severity of multicollinearity.
VIF = 1 1 - R i 2
Table 9 summarized the findings derived from the multivariate variance analysis. All parameters exhibited VIF values below 10, confirming the absence of significant multicollinearity among μ-S3, v-S4, v-S3, μ-S4, and E-S4, and validating the results of the single-factor sensitivity analysis. Furthermore, all factors yielded P-values below 0.05, indicating that each factor significantly influences the outcome. By comparing the F-values and mean square values, the primary factors influencing the stability of the pile foundation were identified as μ-S3, v-S4, v-S3, μ-S4, and E-S4.

6. Discussion

The Kashgar Region is located in southern Xinjiang, China. This area lies south of the Tianshan Mountains and north of the Kunlun Mountains, featuring the Tarim Basin and Taklamakan Desert in between. Oasis cities are distributed around the Tarim Basin, forming Quaternary strata predominantly composed of silt and sand. The Quaternary loose sedimentary layer exceeds 500 m in thickness, with the upper 300 m consisting mainly of Middle-Upper Pleistocene fine sand and medium-fine sand layers, making it a typical sandy soil region.
This study innovatively advances traditional static parameter sensitivity analysis to dynamic analysis and, for the first time, reveals the dynamic sensitivity patterns of physical–mechanical parameters in various soil layers to pile foundation stability during loading processes in the Kashgar sandy soil region, while further investigating whether the sensitivity degree is influenced by soil layer thickness. It established the selection criteria for Mohr–Coulomb parameters and optimization pathways for numerical modeling. The research outcomes enable more targeted and accurate assessment of pile foundation stability and bearing capacity in the sandy soil regions of Southern Xinjiang and broader northwestern China compared to conventional empirical methods, while providing direct design guidance.
It should be noted that the “dynamic parameter sensitivity patterns” revealed in this study and their relationship with soil layer thickness are principally applicable to various soil types. However, in practical applications, the engineering characteristics of different soil masses must be fully considered. For instance, the influence of cohesion should be accounted for in cohesive soils, while the controlling role of rock mass physical–mechanical parameters deserves particular attention in strata containing rock layers.

7. Conclusions

(1)
For the M-C model applied to sandy soils in the Kashgar region of Xinjiang, China, it is recommended to set the elastic modulus at eight times the compression modulus. Accordingly, during model optimization, priority should be given to the proportional adjustment of the friction coefficient, elastic modulus, and Poisson’s ratio of the pile-end soil.
(2)
The physical–mechanical properties of the pile-end soil and the adjacent strata (both above and below) exhibit relatively high sensitivity to settlement. As the load increases, the influence of the friction coefficient and Poisson’s ratio on settlement becomes more pronounced, while the sensitivity of the elastic modulus gradually decreases.
(3)
The sensitivity of the internal friction angle and the elastic modulus is independent for soil stratum thickness; only the values corresponding to the pile-end soil significantly affect settlement. In contrast, the sensitivity of the friction coefficient and Poisson’s ratio is influenced by the thickness of both the pile-end soil and the overlying adjacent strata.
(4)
A sensitivity analysis was conducted using orthogonal experimental design, with the ultimate bearing capacity of the pile foundation as the evaluation index. Results from multi-factor ANOVA, sensitivity analysis factor (SAF), and variance inflation factor (VIF) collinearity analysis showed that all P-values were below the 0.05 significance level, confirming the statistically significant influence of each parameter. All VIF value remained below 10, indicating an absence of serious multicollinearity between parameters. Based on the experimental outcomes, the sensitivity ranking of physical–mechanical properties affecting settlement is as follows: friction coefficient S3, Poisson’s ratio S4, Poisson’s ratio S3, friction coefficient S4, and elastic modulus S4.

Author Contributions

Conceptualization, R.G. and D.F.; methodology, Y.M.; software, Y.M.; validation, Y.M.; formal analysis, F.L. and S.L.; investigation, X.H.; resources, X.H.; writing—original draft preparation, Y.M.; supervision, R.G. and D.F.; project administration, X.H.; funding acquisition, Y.G. All authors have read and agreed to the published version of the manuscript.

Funding

This research was funded by the National Natural Science Foundation of China, grant number 52068062.

Data Availability Statement

The original contributions presented in the study are included in the article, further inquiries can be directed to the corresponding author.

Conflicts of Interest

All authors certify that they have no affiliations with or involvement in any organization or entity with any financial or non-financial interest in the subject matter or materials discussed in this manuscript.

References

  1. Zhao, Z.; Duan, W.; Cai, G.; Zhang, L.; Zou, H.; Liu, S. Robust geotechnical design of piles incorporating system reliability. J. Geotech. Geoenviron. Eng. 2025, 151, 04025012. [Google Scholar] [CrossRef]
  2. Das, S.K.; Suman, S. Prediction of lateral load capacity of pile in clay using multivariate adaptive regression spline and functional network. Arab. J. Sci. Eng. 2015, 40, 1565–1578. [Google Scholar] [CrossRef]
  3. Ahmed, M.N.; Amr, F.E.; Mohamed, I.A. Soil stiffness from back-analysis of pile load tests in Al burrullus. Ain Shams Eng. J. 2022, 13, 101784. [Google Scholar] [CrossRef]
  4. Randolph, M.F. Science and empiricism in pile foundation design. Géotechnique 2003, 53, 847–875. [Google Scholar] [CrossRef]
  5. Comodromos, E.M.; Papadopoulou, M.C.; Rentzeperis, I.K. Pile foundation analysis and design using experimental data and 3-D numerical analysis. Comput. Geotech. 2009, 36, 819–836. [Google Scholar] [CrossRef]
  6. Yan, N.; Hao, Z.; Bai, X.; Cui, L.; Yin, J.; Liu, C.; Zhang, Y. Load-bearing characteristics and optimization design for rock-socketed bored piles in sandy silty clay in coastal areas. Soil Dyn. Earthq. Eng. 2025, 190, 109207. [Google Scholar] [CrossRef]
  7. Liu, H.; Yan, X.; Zhang, N.; Guo, L.; Wang, Z.; Zhou, F. Bearing capacity design of strength composite piles considering dominant failure modes and calibrated adjustment coefficients. Appl. Sci. 2025, 15, 10313. [Google Scholar] [CrossRef]
  8. Wang, Z.; Zhou, H.; Gao, L.; Zhu, F. Experimental study on vertical loading model of single pile and group pile in sandy soil under scouring conditions. J. Civ. Environ. Eng. 2023, 280, 114672. [Google Scholar] [CrossRef]
  9. Qin, S.; Gao, L.; Wei, B.; QIan, J. Bearing characteristics of cast-in-place piles based on optical fiber technology and finite element calculation. Sci. Technol. Eng. 2023, 23, 5685–5692. [Google Scholar]
  10. Lee, C.J.; Bolton, M.D.; Al-Tabbaa, A. Numerical modelling of group effects on the distribution of dragloads in pile foundations. Géotechnique 2002, 52, 325–335. [Google Scholar] [CrossRef]
  11. Sun, Z.; Han, Y.; Liu, F.; Wang, Q. Safety study and analysis of the value of friction coefficient of embedded rock piles on their bearing characteristics. Ce/papers 2025, 8, 710–719. [Google Scholar] [CrossRef]
  12. Bai, F.; Lu, Y.; Yang, J. Multi-scale investigation on bearing capacity and load-transfer mechanism of screw pile group via model tests and DEM simulation. Buildings 2025, 15, 3581. [Google Scholar] [CrossRef]
  13. Fan, X. Analysis of Bearing Capacity of Large Diameter Long Pile Group in Water-Rich Sand Area. Master’s Thesis, Xi’an University of Architecture and Technology, Xian, China, 2024. [Google Scholar]
  14. Sun, Z.; Wang, Q.; Min, R.; Duan, Q. Sensitivity analysis of influencing factors of pile foundation stability based on field experiment. Structures 2023, 54, 14–22. [Google Scholar] [CrossRef]
  15. Qu, T.; Xu, J.; Shi, Y. Equivalent elastic modulus of reinforced concrete members under different stQU tiejunress states. Concrete 2016, 11, 119–122. [Google Scholar] [CrossRef]
  16. Sun, Z.; Liu, F.; Han, Y.; Min, R. Prediction of ultimate bearing capacity of rock-socketed piles based on GWO-SVR algorithm. Structures 2024, 61, 106039. [Google Scholar] [CrossRef]
  17. Li, G.; Zhang, J.; Liu, J.; Li, H. Study on the uplift bearing capacity of rock-socketed piles. Soil Mech. Found. Eng. 2021, 58, 203–208. [Google Scholar] [CrossRef]
  18. Cheng, F.; Li, M.; Li, Q. Multi-method sensitivity analysis of influencing factors on the lateral displacement of retaining piles in asymmetric excavations in soft soil areas. Symmetry 2025, 17, 1525. [Google Scholar] [CrossRef]
  19. Li, H.; Wang, F.; Zhang, J.; Liang, R.; Wen, Y. Sensitivity analysis and determination of some parameters of the rock RHT model. Chin. J. High Press. Phys. 2025, 39, 66–76. [Google Scholar] [CrossRef]
  20. Basha, A.; Tayehand, B.A.; Maglad, A.M.; Mansour, W. Feasibility of improving shear performance of RC pile caps using various internal reinforcement configurations: Tests and finite element modelling. Eng. Struct. 2023, 289, 116340. [Google Scholar] [CrossRef]
  21. Ali, D.; Mahdy, K.; Shin, T.A.; Danial, J.A. Estimation of ultimate bearing capacity of driven piles in c-φ soil using MLP-GWO and ANFIS-GWO models: A comparative study. Soft Comput. 2020, 25, 4103. [Google Scholar] [CrossRef]
  22. Zhu, H.; Ding, C.; Lu, Y.; Li, G. Analysis of bearing-settlement characteristics of extra-long bored piles in URT deep soft stratum underground station. Urban. Mass. Transit. 2024, 27, 143–148. [Google Scholar] [CrossRef]
  23. Chopra, M.B.; Dargush, G.F. Finite-element analysis of time-dependent large-deformation problems. Int. J. Numer. Anal. Methods Geomech. 1992, 16, 101–130. [Google Scholar] [CrossRef]
  24. Kaur, A.; Singh, H.; Jha, J.N. Numerical study of laterally loaded piles in soft clay dense sand. Civ. Eng. J.-Tehran 2021, 7, 730–746. [Google Scholar] [CrossRef]
  25. Wang, H.; Wang, L.; Hong, Y.; He, B.; Zhu, R. Quantifying the influence of pile diameter on the load transfer curves of laterally loaded monopile in sand. Appl. Ocean Res. 2020, 101, 102196. [Google Scholar] [CrossRef]
  26. JGJ 106-2014; Technical Code for Testing of Buliding Foundation Piles. Ministry of Housing and Urban-Rural Development of the People’s Republic of China: Beijing, China, 2014.
  27. Hooman, H.; Mohammad, M.T.; Vahid, T. Application of improved ANFIS approaches to estimate bearing capacity of piles. Soft Comput. 2019, 23, 9537–9549. [Google Scholar] [CrossRef]
  28. Gogot, S.B.; Melisa, K.; Dewi, H.W. Bearing capacity of pile foundations embedded in clays and sands layer predicted using PDA test and static load test. Procedia Eng. 2015, 125, 406–410. [Google Scholar] [CrossRef]
  29. Zhang, X.; Wu, Y.; Tang, L.; Liu, Z.; Jiang, Z.; Liu, Y.; Xi, H. Modeling and computing parameters of three-dimensional voronoi models in nonlinear finite element simulation of closed-cell metallic foams. Mech. Adv. Mater. Struct. 2018, 25, 1265–1275. [Google Scholar] [CrossRef]
  30. Chung, S.; Yang, S. Numerical analysis of small-scale model pile in unsaturated clayey soil. Int. J. Civ. Eng. 2016, 15, 877–886. [Google Scholar] [CrossRef]
  31. Zhang, R.; Tu, J.; Wang, D.; Fang, L.; Xie, M. Vertical bearing behavior of reinforced composite piles in dense sandy soils. Buildings 2025, 15, 3650. [Google Scholar] [CrossRef]
  32. Asgari, A.; Bagheri, M.; Hadizadeh, M. Advanced seismic analysis of soil-foundation-structure interaction for shallow and pile foundations in saturated and dry deposits: Insights from 3D parallel finite element modeling. Structures 2024, 69, 107503. [Google Scholar] [CrossRef]
  33. Alisawi, A.T.; Collins, P.E.F.; Cashell, K.A. Nonlinear numerical simulation of physical shaking table test, using three different soil constitutive models. Soil. Dyn. Earthq. Eng. 2021, 143, 106617. [Google Scholar] [CrossRef]
  34. Zhao, H.; Tian, F.; Huang, Z.J.; Zeng, Z.R.; Qiu, J.S. Experiment study on horizontal bearing characteristics of monopile under multi-layer foundation conditions. Actaenergiae Sol. Sol. Sin. 2025, 46, 134–139. [Google Scholar] [CrossRef]
  35. Fei, K.; Zhang, J. Application of ABAQUS in Geotechnical Engineering; China Water & Power Press: Beijing, China, 2010. [Google Scholar]
  36. Du, P.; Liu, X.; Zhou, D.; Feng, C. Influence and bearing mechanisms of thorn shape on compressive characteristics of thorn piles. Buildings 2025, 15, 3328. [Google Scholar] [CrossRef]
  37. JGJ 138-2016; Code for Design of Concrete Structures. Ministry of Housing and Urban-Rural Development of the People’s Republic of China: Beijing, China, 2016.
  38. Kong, D.; Liu, Y.; Deng, M.; Zhao, X. Analysis of influencing factors of lateral soil resistance distribution characteristics around monopile foundation for offshore wind power. Appl. Ocean Res. 2020, 97, 102106. [Google Scholar] [CrossRef]
  39. Bagheri, M.; Malidarreh, N.R.; Ghaseminejad, V.; Asgari, A. Seismic resilience assessment of RC superstructures on long–short combined piled raft foundations: 3D SSI modeling with pounding effects. Structures 2025, 81, 110176. [Google Scholar] [CrossRef]
Figure 1. Engineering geological column.
Buildings 15 04001 g001
Figure 2. (a) Counterweight platform reaction device; (b) Load–settlement measurement device.
Buildings 15 04001 g002
Figure 3. Pile–soil model diagram.
Buildings 15 04001 g003
Figure 4. Stress nephograms: (a) Stress distribution in the equivalent model at a settlement of 1 cm; (b) Stress distribution in the reinforced concrete model at a settlement of 1 cm; (c) Stress distribution in the equivalent model at a settlement of 4 cm; (d) Stress distribution in the reinforced concrete model at a settlement of 4 cm.
Buildings 15 04001 g004
Figure 5. Nephogram of pile–soil friction coefficient analysis (stress unit: Pa): (a) the maximum compressive stress; (b) the minimum compressive stress.
Buildings 15 04001 g005
Figure 6. Schematic view of mesh division: (a) details of the mesh generation; (b) global mesh configuration.
Buildings 15 04001 g006
Figure 7. (a) Comparison of settlement; (b) Distribution of pile side friction resistance.
Buildings 15 04001 g007
Figure 8. Results of deepening experiments.
Buildings 15 04001 g008
Figure 9. Graded load-influencing factor di matrix plot.
Buildings 15 04001 g009
Figure 10. Pie chart of SAF calculation result distributions.
Buildings 15 04001 g010
Figure 11. Settlement comparison after model optimization.
Buildings 15 04001 g011
Table 1. Static load settlement data for the test pile.
Load:
kN
Local Increment: mmTotal Settlement: mmLoad:
kN
Local Increment: mmTotal Settlement: mm
10040.750.7535141.436.09
15060.621.3740161.727.81
20080.922.2945181.158.96
25100.893.1850202.1211.08
30121.484.66
Table 2. Values of soil strata physical–mechanical properties.
Soil Stratum γ   ( kN · m−3) E s   (MPa)ν c   (KPa)φ (°)μ
② silt (above 10.0 m)17.05.50.39712200.364
② silt (below 10.0 m)17.56.50.38514220.404
③ fine sand (above 25.0 m)18.0120.3530270.510
③ fine sand (25.0–35.0 m)18.5180.3330300.577
③ fine sand (below 35.0 m)19.0220.333030-
Note: γ represents soil bacterial diversity, Es indicates compression modulus, ν stands for Poisson’s ratio, c denotes cohesion, φ represents internal friction angle, and μ indicates friction coefficient.
Table 3. Simulated Settlement under Different Friction Coefficients.
NoS1S2S3S4S5Load
/kN
Settlement
/mm
Difference
/mm
K10.2880.3050.3350.3460.346502029.5118.43
K20.2680.2960.3690.4140.414502026.3915.32
K30.3640.4040.5100.5770.577502014.803.72
Note: ② silt (above 10.0 m, S1), ② silt (below 10.0 m, S2), ③ fine sand (above 25.0 m, S3), ③ fine sand (25.0–35.0 m, S4), and ③ fine sand (below 35.0 m, S5). The difference represents the deviation between the simulated value and the measured value.
Table 4. Settlement Simulations for Different Mesh Densities.
Element QuantityTotal Settlement (Cumulative): mm
20,08014.791
42,58014.782
57,68014.705
Table 5. Preliminary experimental results.
Influencing FactorsS1S2S3S4S5
elastic modulus14.801714.795214.813717.639115.0325
Poisson’s ratio14.914215.004519.620619.593519.9884
friction coefficient14.908514.954419.317517.4931-
internal friction angle14.795814.795814.795816.897814.7958
Table 6. Factor level table.
Codev-S3μ-S3v-S4μ-S4E-S4Codev-S3μ-S3v-S4μ-S4E-S4
10.3180.4590.360.624129.640.3710.5360.420.728151.2
20.3350.4850.380.658136.850.3880.5610.440.762158.4
30.3530.510.400.693144
Table 7. Factors and Levels of the Orthogonal Array.
CodeFactorLevel
12345v-S3μ-S3v-S4μ-S4E-S4
1111110.3180.4590.360.624113.4
2123450.3180.4850.400.728138.6
3135240.3180.510.440.658132.3
4142530.3180.5360.380.762126
5154320.3180.5610.420.693119.7
6215430.3350.4590.440.728126
7222220.3350.4850.380.658119.7
8234510.3350.510.420.762113.4
9241350.3350.5360.360.693138.6
10253140.3350.5610.400.624132.3
11314250.3530.4590.420.658138.6
12321540.3530.4850.360.762132.3
13333330.3530.510.400.693126
14345120.3530.5360.440.624119.7
15352410.3530.5610.380.728113.4
16413520.3710.4590.400.762119.7
17425310.3710.4850.440.693113.4
18432150.3710.510.380.624138.6
19444440.3710.5360.420.728132.3
20451230.3710.5610.360.658126
21512340.3880.4590.380.693132.3
22524130.3880.4850.420.624126
23531420.3880.510.360.728119.7
24543210.3880.5360.400.658113.4
25555550.3880.5610.440.762138.6
Table 8. Orthogonal test results.
Code100415062008251030123514401645185020N-Max
10.8591.7242.6293.6705.0427.67810.99814.81319.3457458
20.7991.5992.4153.3084.3225.5997.3579.47212.2539540
30.7861.5732.3753.2434.2235.3946.9869.18211.38610,055
40.8081.6162.4383.3174.3035.4987.1629.34512.1799696
50.7971.5932.4043.2634.2225.3446.8138.98311.18912,399
60.7961.5932.4093.3064.3335.5877.1189.21511.5489845
70.8231.6492.4913.4124.4625.8518.32311.08014.4378536
80.8071.6142.4373.3224.3185.5067.0279.14411.6599626
90.7921.5822.3843.2214.1385.1916.7208.90811.7009672
100.7831.5642.3563.1794.0745.0786.3918.79911.37011,742
110.7821.5642.3613.2094.1495.2456.7818.95411.3219687
120.8001.6002.4133.2694.2155.3146.8319.13912.2209034
130.7911.5802.3833.2224.1415.1796.5158.62311.0239672
140.7771.5532.3413.1604.0535.0536.2418.20510.79510,114
150.8021.6032.4153.2534.1615.1676.3768.25910.67212,094
160.8011.6022.4173.2804.2345.3266.7498.81711.4159304
170.7861.5722.3723.2114.1345.1806.4628.27510.6349881
180.7761.5502.3343.1414.0074.9606.0948.24010.9149403
190.7601.5182.2863.0713.9064.8115.8217.0448.86711,031
200.7851.5682.3613.1684.0244.9556.0097.69810.25111,999
210.7851.5692.3643.1894.0825.0766.2688.20310.7999341
220.7731.5452.3293.1364.0064.9586.0587.81510.3559642
230.7941.5862.3903.2134.0915.0556.1547.70110.2269303
240.7851.5672.3613.1704.0314.9636.0067.3139.88410,047
250.7331.4632.2022.9513.7244.5485.4336.4047.55814,305
Table 9. Results of multivariate analysis of variance table.
FactorType III Sum of SquaresDegree of FreedomMean SquareFObviousVIF
v-S31,729,055.6484432,263.91233.8780.0021.0
μ-S337,866,578.17049,466,644.543741.9230.0001.0
v-S45,672,024.18841,418,006.047111.1320.0001.0
μ-S41,705,524.4784426,381.12033.4160.0021.0
E-S41,508,075.9374377,018.98429.5480.0031.0
Disclaimer/Publisher’s Note: The statements, opinions and data contained in all publications are solely those of the individual author(s) and contributor(s) and not of MDPI and/or the editor(s). MDPI and/or the editor(s) disclaim responsibility for any injury to people or property resulting from any ideas, methods, instructions or products referred to in the content.