Abstract
The present article focuses on the assessment of the potential advantages and disadvantages of the utilisation of modern building inventory technologies in crisis situations, using a case study of Ukraine, currently engulfed in armed conflict. The following methods are described in detail: laser scanning, 360-degree camera images, and photo series. The authors conducted an in-depth SWOT/TOWS analysis, adapted to the specifics of the post-conflict environment, with a view to the future reconstruction of damaged buildings. The originality of the study lies in the use of a modified, quantitative version of the conventional SWOT analysis, supplemented with a weighting and rating system, which allowed for a more accurate assessment of the effectiveness of various technologies, including laser scanning. While the study focuses on the Ukrainian context, the authors emphasise that the developed methodology is universal and can be successfully applied to other critical areas, such as regions affected by earthquakes, floods, fires, or technological disasters. A modified SWOT/TOWS analysis can serve as a valuable tool in crisis management and infrastructure reconstruction during emergencies, providing the data necessary for making rational and effective decisions regarding the use of modern technologies in construction. The analysis revealed that, of the analysed inventory strategies, only laser scanning technology fits the so-called “maxi-maxi” strategy, a scenario in which both internal resources and external capabilities are maximised. The remaining two strategies were designated as “maxi-mini,” signifying that their implementation is associated with elevated levels of risk despite their inherent advantages. It is imperative to acknowledge the existence of substantial external threats that persist. Nevertheless, this does not constitute a complete rejection of the concept. This study examines armed conflict as a research context for a selection of buildings in Ukraine. The analysis was constrained to the three most prevalent methods: The use of TLS, SfM, and 360-degree cameras is also a key component of the methodology.
1. Introduction
The significance of architectural heritage lies not only in its capacity to serve as a chronicle of past eras and customs, but also in its role as a constituent of contemporary cultural identity. In view of the growing threats to the built environment, including the natural degradation of building materials, urbanisation processes, climate change, and random disasters (cataclysms, armed and political conflicts), there is an increasing need to introduce modern tools for the inventorying and documenting of existing buildings. In this context, the development of 3D scanning, photogrammetry and spatial information systems is becoming a prerequisite for the survival of many architectural structures. Indeed, without such documentation, or with documentation in traditional forms, these structures would not have a chance for such accurate and permanent representation. Digital documentation and contemporary inventory methodologies are effecting profound changes in the manner in which architecture is both studied and protected. Furthermore, these methodologies are also having a significant impact on the reconstruction and dissemination of architecture within the social sphere.
Traditionally, architectural documentation has consisted of technical drawings, written descriptions and manual measurements. While these methods are still valuable, they have proven insufficient for complex structures that undergo deformation and deterioration over time. Digital documentation enables much more comprehensive capture of the existing condition by integrating geometric and material information. It is particularly important for architectural structures that are under threat from natural disasters or warfare. Digital reconstructions can often be the only evidence of destroyed buildings, and can support reconstruction processes in the future. In this way, digital documentation serves as both a tool for heritage protection and a medium for cultural communication that allows knowledge about architecture to be disseminated in virtual space.
An example of losses related to national heritage can be seen in the destruction caused in Ukraine by the ongoing armed conflict there. Almost two years after Russia’s comprehensive military incursion into Ukraine, the revised joint Rapid Damage and Needs Assessment (RDNA3) [1], published by the Government of Ukraine, the World Bank Group, the European Commission and the United Nations, estimates that, as of 31 December 2023, the total cost of reconstruction and rehabilitation in Ukraine will be $486 billion over the next decade. However, the issue is not merely the financial outlay, but also the implementation of reconstruction projects. It seems reasonable to posit that some building structures will be designed from scratch. Consequently, new edifices and infrastructure will be erected, distinct from the existing structures that were damaged during the conflict. Nevertheless, a proportion of the buildings will require reconstruction due to their historical and cultural significance, their long-term integration into the urban and architectural landscape, or because of the relatively minor extent of damage and the potential for restoration. The creation of documentation through traditional means can be a challenging and time-consuming process. The utilisation of modern technology can provide a solution to this issue.
The advent of modern digital technologies has rendered precise reproduction of the actual form and structure of architectural objects possible. Consequently, these technologies have evolved into more than mere tools for protection; they have become indispensable for the survival of architectural objects. Digital documentation facilitates the preservation of a building’s external profile, structural components, materials, and decorative elements, which are of paramount importance in conservation processes. For instance, in a study documenting Kunerad Mansion in Slovakia, the authors describe the use of terrestrial laser scanning (TLS), terrestrial photogrammetry and UAV, and HBIM (Historical BIM) to create a photorealistic, detailed digital model of the building for the purpose of documenting its current condition, analysis and promotion of heritage [2]. A review of literature from 2005 to 2024 revealed key technologies such as TLS, photogrammetry, BIM and HBIM, which provide a solid foundation for the precise documentation of architectural heritage [3]. The role of future technologies is also becoming increasingly important. This is evident in the development of digital twins, the Internet of Things (IoT), artificial intelligence (AI) and immersive technologies (e.g., virtual reality (VR) and augmented reality (AR)). These technologies are transforming static documentation into an interactive, dynamic cultural message.
Digital documentation and contemporary inventory methodologies, notably laser scanning, photogrammetry, BIM/HBIM, and digital twins, are profoundly impacting the manner in which architectural heritage is safeguarded. These technologies facilitate the precise mapping, analysis, reconstruction, and popularisation of historic buildings on an unprecedented scale. When combined with smart and interactive technologies, they engender a novel perspective on preservation—one that is more dynamic, educational and accessible. However, in order to take full advantage of these tools, appropriate regulations, standards, and digital heritage management strategies are essential. The overarching objective is to guarantee that architectural heritage is preserved not only as a remembrance, but as a living, digitally accessible asset for posterity.
The objective of this article is to identify contemporary inventory methods that may prove beneficial in the context of post-war building reconstruction, taking into account their simplicity, speed of execution and usefulness in the construction process. The effectiveness of these measures will be assessed against a set of evaluation criteria. The objective of this study is to analyse the role of digital documentation and contemporary inventory methods in the process of protecting architectural cultural heritage. The study will place particular emphasis on the strategic importance of these methods for construction and architecture. The article seeks to address the question of which digital technologies have the capacity to preserve the material traces of the past, while also actively supporting their reconstruction, revitalisation and popularisation. The case study employed in the article functions as a point of reference, thereby enabling the demonstration of the potential of these tools from a practical perspective.
1.1. Digital Documentation as a Prerequisite for the Survival of Cultural Heritage
The contemporary approach to building resource management is characterised by an increasing emphasis on the importance of comprehensive preservation of information about buildings in historical, technical and social contexts. It is becoming increasingly evident that technical documentation, digital information models (BIM), and information regarding the intangible values of buildings, are becoming essential elements in both conservation processes and sustainable urban planning. As Lian and Xie [4] have noted, ‘Digital technologies enhance cultural heritage communication by driving innovations in preservation, information management, and digitisation’.
Preserving information about buildings is of crucial importance from a number of perspectives. Firstly, the documentation of historic buildings facilitates their reconstruction and conservation, thereby supporting revitalisation processes and the protection of cultural identity [5]. Secondly, the creation of comprehensive technical documentation of buildings—encompassing structural, installation and operational data—is imperative for ensuring public safety, facilitating effective emergency response, and optimising infrastructure management [6].
One of the most significant and noteworthy contexts in which the importance of information about buildings becomes particularly evident is in cases of destruction caused by wars, natural disasters or deliberate demolition. The absence of documentation prior to the acquisition of an object results in the irreversible loss of knowledge concerning its cultural, urban or technical value. For instance, the war in Syria and the destruction of Aleppo resulted in the loss of numerous invaluable historical buildings without prior scanning or inventorying [7]. Currently, endeavours are underway to recover some of the data from photographs or camera recordings [8]. A similar situation was observed in the aftermath of the 2015 earthquake in Nepal, where challenges arose during the reconstruction of historic buildings due to the absence of digital documentation. The reconstruction of heritage buildings is a challenging undertaking, primarily due to the absence of comprehensive inventories, encompassing historical records, data, images, and architectural drawings. The process of reconstruction necessitates meticulous study, consultation with relevant experts, the creation of high-quality documentation, and meticulous planning prior to the commencement of reconstruction work. In many cases, reconstruction is challenging due to the absence of adequate inventory [9].
1.2. A Short Review of the Literature on the Use of Modern Inventory Methods
Digital documentation has become imperative for the preservation of architectural heritage. The integration of 3D laser scanning, photogrammetry (close-range, terrestrial and UAV) and BIM/HBIM environments enables the establishment of a reliable knowledge base that supports inventory, diagnostics, conservation design and education. In recent years, a substantial number of reviews and case studies have been published that confirm HBIM as the basis for integrating geometric and non-geometric data. Furthermore, there has been an expansion of HBIM towards digital twins and condition monitoring of objects [10,11,12].
In response to these challenges, methods for mapping and documenting damaged buildings are being developed around the world. The aim of these methods is twofold: firstly, to preserve heritage, and secondly, to facilitate urban reconstruction. The most common methods employed are as follows:
- The following article provides a comprehensive overview of the utilisation of photogrammetry as a constituent element of a suite of digital methodologies employed for the documentation and analysis of damaged heritage sites in the Kathmandu Valley following the seismic event of 25 April 2015 [13].
- Laser scanning (LiDAR) is a process that requires the creation of an accurate 3D digital model in order to accurately reconstruct and document heritage buildings. This process incorporates advanced photogrammetry, laser scanning, and BIM [14].
- The utilisation of digital reconstruction from archival and social media (crowdsourcing) is a method that has been employed to facilitate the reconstruction of historical edifices. The use of architectural plans, maps, manuscripts, museum and archival photographs has also been demonstrated to be a fruitful approach in this endeavour. For instance, the community and experts utilised over 3000 photographs to reconstruct the temples of Palmyra after their destruction by ISIS [15].
- The integration of geographic information systems (GISs) with satellite data facilitates spatial analysis at the urban scale. This approach enables the assessment of damage distribution, urban reconstruction planning, and the management of heritage data. This approach facilitates the assessment of seismic risk and the coordination of activities among diverse stakeholders [16].
- The following essay will explore the application of Building Information Modelling (BIM) technology in the context of heritage conservation. The HBIM system has been developed as a management system for heritage structures, with the purpose of storing integrated three-dimensional models and their historical semantic information [17].
The necessity to conserve information regarding edifices—including those that have been demolished—arises from the conviction that architecture constitutes not merely a physical structure, but also a conduit for collective memory, engineering knowledge, and social identity. The demolition of a building without the requisite documentation can be considered to entail not only the physical destruction of the structure, but also the concomitant cultural erasure.
Despite the growing awareness of the need for documentation, significant research and normative gaps remain. As Volk, Stengel, and Schultmann (2014) [18] have observed, data fragmentation, the absence of standardised formats, and the ambiguity surrounding the allocation of responsibility for updating and maintaining documentation over the long term persist as significant challenges. In legal contexts, many countries still lack a coherent framework for comprehensively managing building data throughout its lifecycle—from design, through operation, to demolition or destruction.
In light of the aforementioned challenges, the objective of this article is to analyse contemporary methodologies for the preservation of building information from a technical, cultural and normative perspective, with a particular emphasis on cases of destruction and global methods of documenting them. The article further seeks to ascertain effective practices and significant lacunae that ought to be addressed in both the domain of public policy and engineering praxis.
The importance of architectural documentation and building inventories, both extant and destroyed, in cultural heritage management, post-war reconstruction, and urban analysis, is paramount. In recent decades, digital methodologies such as laser scanning, photogrammetry, and 360-degree spherical recording have gained importance as tools for the rapid and precise documentation of the geometry and condition of buildings.
Laser scanning, particularly terrestrial laser scanning (TLS), has become the standard for precise architectural surveys, enabling the acquisition of dense point clouds with high accuracy (down to the millimetre). As Grussenmeyer et al. (2008) [19] observe, the merits of this imaging modality encompass its capacity for intricate detail, economic viability, portability, its aptitude for operation in confined spatial domains, and its expeditious data collection capabilities. However, disadvantages arise in post-production when the object’s texture is poor. In the context of cultural heritage and humanitarian crises, LiDAR has been employed by organisations such as CyArk for the documentation of endangered or destroyed historical sites in Syria, Iraq, and Afghanistan.
Photogrammetry, both classical methods and those based on processing serial images using Structure from Motion (SfM) algorithms, offers an alternative to more expensive laser scanning technologies. This method is particularly useful in conflict situations where access to advanced equipment is limited. Projects such as #NewPalmyra [20] and Reconstructing Kathmandu after the 2015 earthquake [13] have demonstrated that amateur photographs (e.g., taken by tourists or residents) can be used to recreate digital documentation of lost buildings. This makes photogrammetry a useful tool in post-conflict operations. However, the quality of documentation provided is not the same as that of laser scans.
Rapid documentation of interiors and enclosed spaces is becoming increasingly dependent on 360° cameras. According to Bolognesi and Fiorillo (2021) [21], spherical imaging can be used for BIM and virtual reconstructions for educational and archival purposes. 360° cameras are characterised by their portability and accessibility, as well as their ability to integrate with GISs and 3D models. However, their additional geometry is lower than that of TLS or SfM.
In the domain of registration methods, two predominant trends are observed: terrestrial laser scanning (TLS) and photogrammetry (SfM/MVS). Furthermore, hybrid methods combining Unmanned Aerial Vehicles (UAVs) and mobile LiDAR are becoming increasingly prevalent. It is evident that TLS remains the gold standard for detail inventory, as has been confirmed by a number of review papers and practical guidelines that have been specifically addressed to heritage documentation teams. Concurrently, the extant literature underscores the challenges of point data interoperability and the automation of the ‘scan-to-HBIM’ transition, wherein the role of machine learning methods in point cloud semantisation is escalating [22,23,24].
In the context of urban and landscape scale, there is a strong convergence between heritage research and territorial remote sensing. Multi-scale analyses—ranging from individual parcels to entire regions—employ multi-temporal LiDAR data, satellite imagery, and hyperspectral images to identify changes in land cover, erosion, hydrological hazards, and urbanisation pressure. This broadening of perspective is crucial, as architectural objects function in a dynamic natural and anthropogenic environment, the monitoring of which informs conservation priorities, adaptive planning and risk management. Research findings indicate the efficacy of LiDAR and sea level rise models in assessing the vulnerability of coastal resources. Furthermore, the integration of multi-resolution data facilitates the monitoring of coastal destruction and vertical urban growth [25,26,27,28].
Photogrammetric methods supported by Unmanned Aerial Vehicles are also shown in [29,30], while the use of laser scanning and photogrammetry methods for facades is described by the authors in [31]. Integration of laser scanning, digital photogrammetry and BIM Technology on the example of historic buildings can also be found in [32].
1.3. Comparison of Modern Inventory Methods—A Short Overview
Numerous international studies are currently examining comparisons of inventory methods.
Kalvoda et al. (2020) [33] conducted a comparison of mobile laser scanning (MLS) and mobile photogrammetry (SfM) using reference data provided by a GNSS/total station geodetic system, focusing primarily on measurement accuracy. Mobile MLS achieves an accuracy of ~0.017 m (≈17 mm) in 3D, while SfM achieves an accuracy of ~0.061 m (≈61 mm). Mobile laser scanning is significantly more precise than mobile SfM.
Similarly, other studies focus on cost and measurement precision. Surface laser scanning (TLS) is one of the most precise methods of 3D documentation. It provides high data density and accuracy on the order of several millimetres [34], making it the standard method for documenting cultural heritage and engineering works that require high precision. Disadvantages of this method include relatively high equipment costs and lengthy measurement and data processing times [35].
There is a growing body of literature suggesting that handheld SLAM (mobile LiDAR) is an effective alternative to static scanning. It offers portability and speed, and is accurate enough for many applications.
For instance, Conti et al. (2024) [36] compared the Leica BLK360 and BLK2GO for heritage documentation, achieving an accuracy of ~2–3 cm for handheld scanning. However, TLS provides higher data density and precision.
Alteirac et al. (2021) [37] demonstrated that SLAM can achieve an accuracy of ≈3 cm in building interiors when properly registered with static stations. A case study indicates that the differences between the handheld model and the TLS were ±39 mm at a distance of ~57 m, which was deemed acceptable for renovation documentation purposes.
However, 360° photogrammetry (using spherical cameras with Structure from Motion (SfM) algorithms) has not yet been the subject of direct comparative academic research. Available industry studies suggest that, despite its high speed and simplicity, it lacks measurement accuracy and is unsuccessful in difficult lighting conditions. The results are only useful for visual applications and for low-precision tasks such as QA/QC and inspection [38].
Despite the large number of studies focusing on individual methods or their accuracy, a clear and practical decision-making framework for selecting the most appropriate method for inventorying buildings damaged by armed conflict still remains elusive. Such a framework would take into account not only precision, but also site, economic, security and human resource constraints.
Global studies primarily focus on measurement accuracy and pay less attention to cost. They also fail to consider other parameters and the specific circumstances in which measurements are taken. Authors primarily discuss the importance of digitising documentation in the context of disasters and armed conflicts to avoid the irreversible loss of cultural heritage. It could be argued that there is a significant research gap in this area.
Existing comparisons do not integrate strategic analysis tools such as SWOT/TOWS, which would enable the strengths and weaknesses of technologies to be assessed in various field scenarios. There is therefore a need to develop a comparative methodology combining technical, operational, and strategic analysis, which is particularly important in the context of post-war inventories where decisions about documentation must be made quickly in conditions of limited resources.
1.4. Using SWOT in the Assessment of Inventory Methods
In recent years, there has been an increasing interest in the use of strategic analyses, such as SWOT and its extension TOWS, in the context of architectural heritage conservation and documentation. These analyses have been employed to systematise methodological decisions. This approach enables researchers to compare available digital documentation technologies, assess their strengths and weaknesses, and identify the opportunities and threats associated with their use in a specific conservation or urban planning context.
In an academic paper [39] on the utilisation of unmanned aerial vehicles (UAVs) in the domain of industrial heritage research, the authors conducted a SWOT analysis on the use of UAVs. As posited by the authors, the utilisation of UAVs facilitates superior image acquisition capabilities in comparison to conventional technologies. Nevertheless, it is asserted that both technologies can be complementary in nature. The following essay will provide a comprehensive overview of the relevant literature on the subject. The strengths (mobility, wider range) were weighed against the weaknesses (regulatory constraints, weather conditions) and integration opportunities (complementarity with traditional methods).
In an analysis conducted in [40], SWOT was used to evaluate HBIM technology, thereby identifying strengths in the form of support for heritage preservation and opportunities for interdisciplinary exchange, as well as weaknesses and threats that can be overcome through strategic planning.
In a study of the ancient city of Ibb in Yemen, the authors employed a hybrid GIS + SWOT-AHP analysis, thereby demonstrating the efficacy of strategy analysis (the identification of risk factors and adaptation opportunities) in planning more effective protective measures against natural and anthropogenic hazards [41].
The employment of SWOT/TOWS analysis in this study provides a strategic rationale for the selection of the methodology. It has been demonstrated that the selection of inventory technology is not solely contingent on its availability; rather, it is the result of a deliberate evaluation of its respective strengths and weaknesses, in addition to the identification of opportunities and threats within a particular research context.
This methodological approach is predicated on the notion of adaptability and consciousness, whereby the documentation of architectural objects is not merely a passive exercise, but rather a dynamic instrument that facilitates long-term management planning, particularly in the context of environmental and urban transformations.
SWOT analysis (Strengths, Weaknesses, Opportunities, Threats) and its extension, TOWS, are tools that are utilised extensively in the domain of architectural heritage documentation and conservation as part of a strategic planning methodology. The primary objective of these entities is to organise information and facilitate informed choices regarding research methodologies. These choices are informed by an analysis of the strengths and weaknesses of technologies, as well as a comprehensive examination of opportunities and threats posed by the external environment.
The merits of utilising SWOT/TOWS analysis in the context of evaluating inventory methodologies are as follows:
- The systematisation of decisions facilitates the comparison of disparate technologies (TLS, UAV photogrammetry, HBIM) within a uniform framework, thereby enabling the identification of optimal solutions.
- The interpretive process is rendered straightforward by the SWOT/TOWS results, which can be presented in the form of a matrix or narrative. This facilitates discussion between interdisciplinary teams.
- The application is characterised by its flexibility, with the capacity to encompass both individual objects and multi-scale systems, whether in the context of urban or environmental settings.
- The integration of internal and external factors is achieved by combining technology assessment (precision, cost, mobility) with environmental, legal and social factors (e.g., access to location, weather conditions, legal regulations).
The TOWS method is a valuable tool for translating SWOT diagnoses into specific actions, with the aim of facilitating the implementation of adaptation strategies. One such strategy could involve the combination of technologies in order to minimise limitations or threats.
The following discussion will outline the disadvantages and limitations of SWOT/TOWS in the assessment of inventory methods.
- The subjective nature of assessment is a well-documented phenomenon, with the results of an assessment often being contingent on the experience of the team conducting it and the quality of the data available. Furthermore, different experts may assess strengths and weaknesses in different ways.
- The absence of precise quantification is a key limitation of SWOT/TOWS analysis, which is designed to facilitate qualitative analysis. However, it does not provide accurate numerical or statistical data.
- The method exhibits limited capacity to accommodate technological and environmental shifts that transpire subsequent to the analysis’s formulation.
- The potential for oversimplification is evident when a substantial number of technologies or criteria are considered. In such cases, SWOT/TOWS analyses may fail to account for the intricacies and interrelationships between factors, resulting in a lack of comprehensive consideration.
Notwithstanding these limitations, SWOT/TOWS remains a useful tool for supporting the selection of inventory methods, especially in projects where different technologies need to be combined under financial, terrain or regulatory constraints. Furthermore, it facilitates the selection of methods through a transparent and systematic process, which is crucial for the justification of decisions within scientific work and conservation projects.
2. Modern Methods for Building Inventories
In the case of Ukraine, for example, it is necessary to rapidly inventory and assess the technical condition of buildings in order to determine their suitability for reconstruction. This must be done in the context of ongoing warfare, which presents a number of challenges. In the event of a structural catastrophe, such as the partial collapse of a building, an accurate inventory and analysis of the remaining structures is crucial for a prompt and effective response. Technological advancements in science and instrumentation now enable the utilisation of photogrammetric methods or laser scanning for inventory purposes.
The presentation of contemporary techniques that can be employed for the inventory of partially destroyed structures and undamaged structures can be mentioned, among others:
- laser scanning
- 360° cameras,
- photo or series of photos.
It is inevitable that the existing building stock will eventually require reconstruction, and the extent of the damage may be considerable. Photos taken in Kiev (Figure 1 and Figure 2) illustrate examples of damage to buildings resulting from the ongoing hostilities in Ukraine.
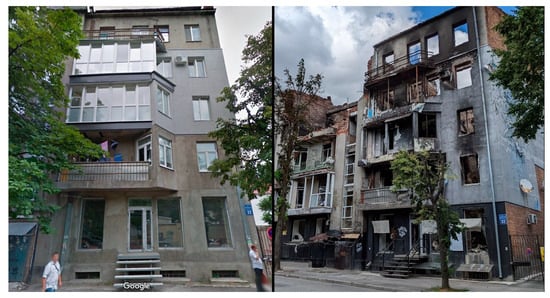
Figure 1.
Kharkiv residential building, Myronosytska 32—original state (left) photo: source Google Street View) and the state after the destruction (right) photo made by Viktor Proskuryakov).
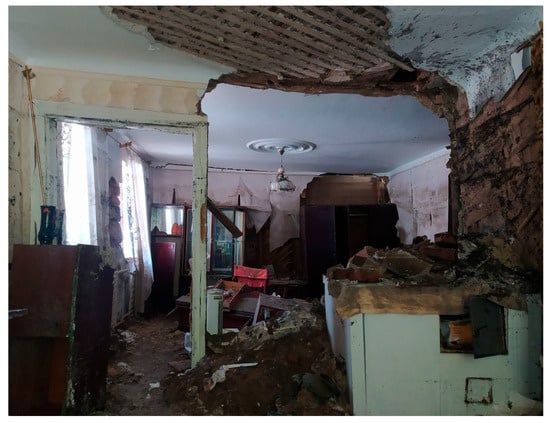
Figure 2.
Interior of an example of a dilapidated detached house (photo made by Viktor Proskuryakov).
2.1. Laser Scanning for Building Inventory
The use of 3D laser scanning technology for building measurement allows us to obtain a point cloud and, subsequently, generate digital documentation that would make it possible to create a BIM (Building Information Modelling) model of a scanned object [42]. Laser scanning can be employed in the documentation of buildings in Ukraine with the objective of creating a comprehensive database. The images produced by the scanning process are used to collect information about the buildings in question, including details of their technical conditions, and to create maps and architectural plans.
The laser scanning technology in question has had a revolutionary impact on the field of building inventory management, enabling the collection of data with precision and efficiency. Laser scanning utilises laser beams to create a point cloud containing millions of points, thus mapping a building object. The use of laser scanning in building inventory offers numerous benefits, including:
- rapid data acquisition,
- high accuracy of measurement and object shape reproduction,
- ability to capture intricate details that may be missed by traditional measurement methods,
- the possibility to use point cloud data for various purposes (3D model, BIM model, simulations, etc.).
Laser scanning technology allows the creation of comprehensive inventories, which can also be used for various purposes, such as:
- conservation of buildings,
- planning renovation or reconstruction,
- responding to emergencies and disasters.
The principal benefit of laser scanning technology is that it does not require contact between the scanner and the object being measured. This non-destructive measurement method ensures quality and accelerates the data acquisition process, rendering it an indispensable tool in industries that require accurate and detailed information for decision-making and project implementation, including the construction industry. Laser scanning technology has had a profound impact on building inventory management processes, offering a multitude of benefits to a diverse range of industries. Laser scanning enables the effective collection of highly accurate measurements of various building components, as well as building equipment. The data obtained through laser scanning is converted into 3D or BIM models, providing relevant information and streamlining building inventory management processes. Furthermore, laser scanning facilitates the creation of accurate as-built drawings and documentation for renovations, adaptive conversions and other remodelling projects, enabling architects, engineers and facilities managers to plan with greater precision.
Laser scanning is capable of distributing laser beams over a wide range both vertically and horizontally, calculating distances and angles to produce millions of data points per second with millimetre accuracy. This unparalleled ability to generate comprehensive 3D models covering all existing architectural, MEP and structural elements is a significant benefit of laser scanning. However, there are also challenges to be aware of, such as cost, technological limitations and expertise requirements.
In conclusion, the utilisation of building experts allows for the inventorying and assessment of damage, offering a precision, speed and comprehensiveness of data that is unattainable by traditional methods. The following section outlines the principal elements of modern building and disaster site inventories utilising this innovative technology. Additionally, 3D laser scanning is a valuable tool in the process of securing evidence following a disaster. By creating precise digital models, it is possible to preserve the condition of the object at the time of the survey, which can be crucial in the subsequent investigative process. Furthermore, the technology enables detailed damage analysis in parts of buildings that are difficult to access. 3D laser scanning allows for spatial imaging and the creation of comprehensive models of objects without the need for direct access to all of its components.
The utilisation of comprehensive digital models enables the evaluation of the technical condition of the structure and its constituent components, facilitating the determination of the viability of structural repairs and reinforcements. This constitutes a pivotal component of disaster reconstruction planning. The data obtained through 3D laser scanning can be readily incorporated into BIM (Building Information Modelling) systems, facilitating the effective planning of repair, rectification and reconstruction work while accounting for the precise condition of the existing structure. The utilisation of this technology enables not only a rapid and precise response in emergency scenarios, but also the effective planning of repair operations, thereby enhancing the safety and protection of the built environment. An exemplar of a point cloud for a building undergoing renovation and modernisation is illustrated in Figure 3.
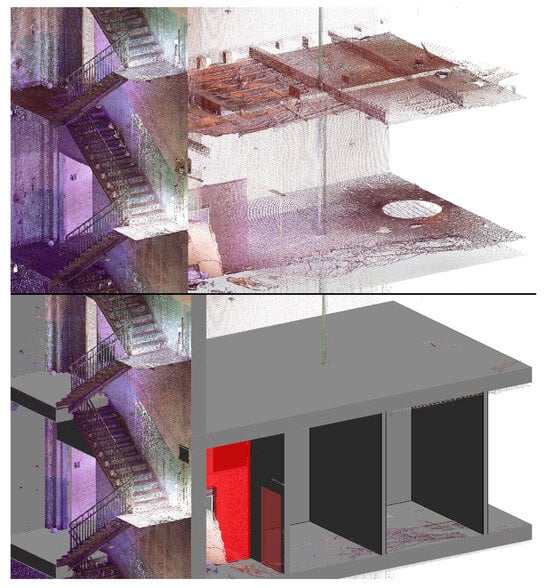
Figure 3.
Object to be renovated and upgraded: point cloud—top and partially modelled—bottom (source: own).
2.2. 360 Cameras
The process of inventorying is of significant importance within the construction industry. It entails the precise documentation and cataloguing of the diverse elements and components inherent to a construction project. This provides a comprehensive record of all elements and components involved in the construction process, which can be useful for future reference, maintenance and potential legal or insurance purposes. In recent years, the utilisation of a 360 camera for inventory purposes has gained considerable traction. A 360 camera is defined as a camera capable of capturing a comprehensive 360-degree view of the surrounding environment. This technology has demonstrated remarkable efficacy in capturing intricate details of construction sites and buildings, rendering it an optimal instrument for inventory documentation.
The 360-degree camera inventory method presents a number of advantages over more traditional inventory methods. Firstly, it permits a more efficient and accurate documentation process. The utilisation of a 360-degree camera enables the comprehensive documentation of an entire construction site or building, obviating the necessity for the capture of multiple individual images. This not only results in a reduction in the time required for the inventory process, but also in a reduction in the risk of omissions. Furthermore, the utilisation of 360-degree cameras facilitates the capture of intricate details and images of exceptional clarity. The images captured by these cameras have a high resolution, which enables the recording of even precise details in the image. This includes the materials used, architectural elements and installed equipment. Furthermore, 360-degree camera inventories offer a safer alternative to traditional methods. Construction sites are inherently dangerous, and manually documenting every element while construction work is in progress, or in warfare, for example, can expose workers to significant risk. By employing 360-degree camera technology, it is possible to inventory buildings and infrastructure from a safe distance, thereby reducing the risk of accidents.
It is important to emphasise the long-term benefits of utilising a 360-degree camera inventory. The comprehensive photographic documentation generated can serve as a valuable resource for future use, as it allows for the straightforward retrieval of information about a building or infrastructure facility. This can be beneficial for maintenance, repair or renovation purposes. Additionally, the documentation can also be crucial in legal or insurance matters, as it can provide evidence of damage to buildings.
2.3. Picture or Series of Pictures
The act of capturing a single image or a series of images can be considered a comparable method to that employed by 360-degree camera technology. Although this approach may appear to require a greater investment of time, it can yield outcomes that are analogous to those achieved through the use of 360-degree camera technology. It is essential to recognise that advancements in digital photography technology warrant close observation. In practice, there are a number of factors that must be taken into account when capturing digital images, including:
- photographic techniques,
- camera functions,
- types of lenses,
- dragging modes,
- settings related to the shooting environment,
- photo processing and editing.
Photographs can provide significant benefits for building projects and their inventory. This is evident in a number of contexts, including building renovation, environmental plan preparation, landscape and urban design projects, facade rehabilitation preparation, and urban modelling. To illustrate, in [43], the authors investigated the use of normal and convergent stereophotographic techniques to determine the physical condition of a building. They also compared the errors obtained with a non-specialised digital camera and considered the use of these methods in property inventory and certification.
It is evident that the utilisation of photographic imagery may not be optimal when the necessity for precise measurement arises. Errors may arise due to factors such as poor perspective or the angle of the photographs. A study [44] has analysed the geometric method employed to obtain rectified images, which are then used as a basis for drawing building elevations. The outcome of this transformation is the elimination of perspective errors present in the merged image, thus providing an orthogonal view. Following the transformation of the image, the differences range from 2.5 to 5.0 mm.
The creation of three-dimensional models can be achieved through the use of photographs and photographic series. The utilisation of specialized software enables the generation of a three-dimensional image of a given component from a single photograph. An illustrative example of this process is demonstrated in Figure 4, which depicts the creation of a three-dimensional window model from a two-dimensional photograph. A free online tool ‘Image to STL’ for converting STL images was used to convert a JPG image of a window in a building into a Standard Triangle Language (STL) mesh/3D model file.
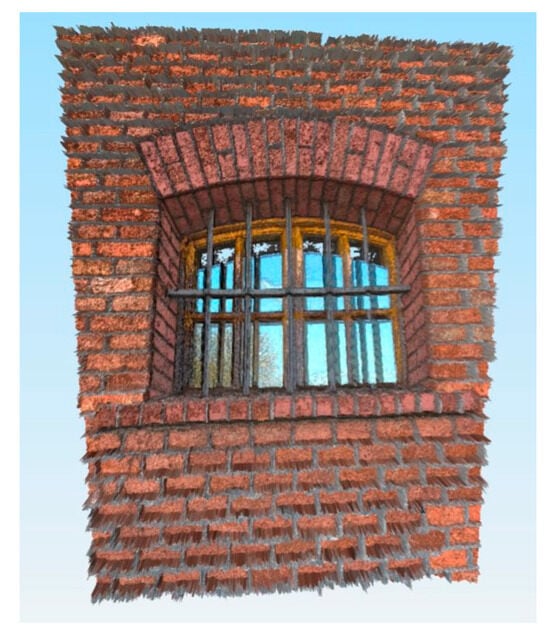
Figure 4.
3D model of a building window created from a flat image in Image to STL (source: own).
Conversely, the utilisation of a series of photographic images, ideally accompanied by GPS data, enables the generation of a 3D model encompassing the entire building structure at a relatively modest cost and within a concise timeframe. An exemplar of a constructed building model is illustrated in Figure 5. The photographic images were obtained from a ground-level perspective. The deployment of unmanned aerial vehicles (UAVs) facilitates the modelling of the entire building, including the roof. Images of the ‘Kotłownia’ building at the Cracow University of Technology were taken at a density of 0.5 metres using a DJI Mavic 3 Classic (RC) drone (DJI Poland. Krakow, Poland). These images were then combined and processed using RealityCapture 1.4 software.
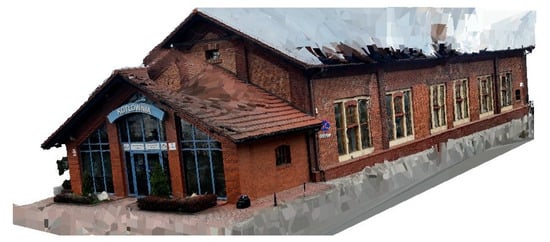
Figure 5.
3D model of the building made from a series of ground photos in RealityCapture 1.4 (source: own).
3. SWOT/TOWS Analysis of Selected Inventory Methods
3.1. Stages of the Research Procedure
The main aim of the methodology is to develop a decision-making tool that supports the selection of the most appropriate method for documenting damaged buildings in crisis situations, such as war. To this end, a SWOT (strengths, weaknesses, opportunities, threats) analysis was conducted, supplemented by a TOWS analysis to formulate a strategy for method selection based on the SWOT results.
The method has been adapted to the conditions of the conflict in Ukraine and takes into account the following:
- Access restrictions (fire zones, mined areas);
- Lack of technical infrastructure;
- Documentation objectives (evidence, preservation and technical);
- Resource constraints (personnel, equipment, time and funding).
The research framework, shown in Figure 6, comprises six sequential stages that are aimed at assessing modern inventory methods within the context of post-war documentation.
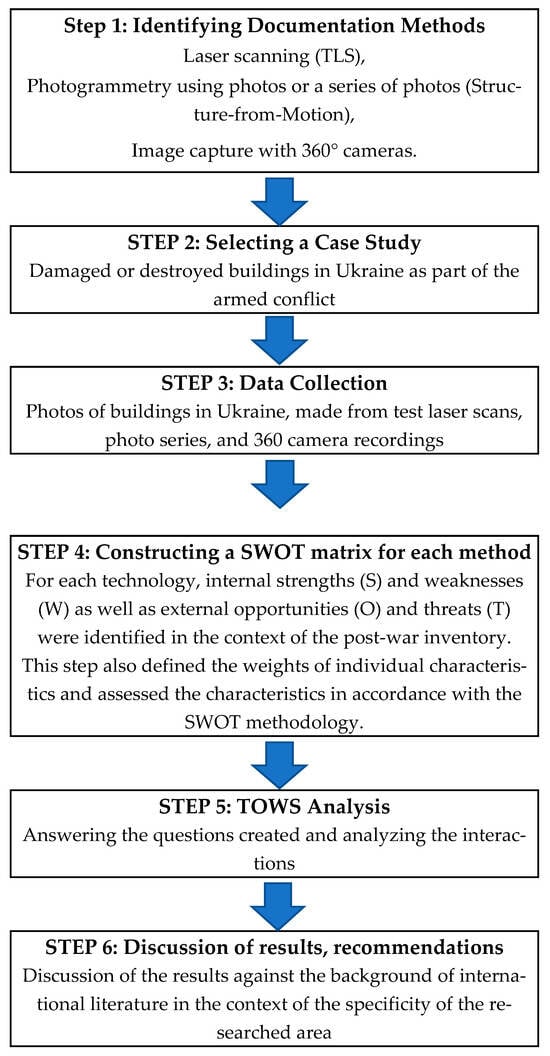
Figure 6.
The adopted research scheme (source: own).
- Step 1: Identification of Documentation Methods
The first stage involves identifying the three main technologies used to record damage: laser scanning (TLS), photogrammetry using photographs or a series of photographs (structure from motion), and image capture using 360° cameras. These technologies are described in more detail in Section 2.1, Section 2.2 and Section 2.3.
- Step 2: Selecting a case study
Buildings damaged or destroyed as a result of the war in Ukraine were selected as the case study, providing a current and meaningful context for the analysis. This context is described in more detail in Section 3.1. This selection has significant international significance, as Ukraine has become a symbol of the massive destruction of civilian infrastructure in the 21st century. This case study not only allows for testing methods in real-world extreme conditions but also contributes to the global discussion on digital heritage documentation in crisis situations.
- Step 3: Data Collection
The source material was collected in the form of photographs, scans, and 360° recordings from actual measurements and field tests conducted in the study areas. Laser scanning tests, photographic series and manual measurements were carried out on a variety of objects, ranging from a simple livestock building, through a small conference building, to a complex church structure. The differentiation was intended to highlight the potential advantages and disadvantages of the technology, regardless of the complexity of the building structure. A selection of the obtained materials is presented in Section 2. The utilisation of these materials was instrumental in facilitating the authors’ comprehensive comprehension of diverse data inventory methodologies, which were subsequently disseminated to construction management experts. It is important to acknowledge the limited availability of field data in conflict zones, which reflects the practical challenges of inventory management in crisis-affected environments. Inventory work is also categorised as high risk. In instances where research is conducted in the context of conflict, the dissemination of certain materials may be facilitated through collaborative efforts with organisations engaged in the documentation of damage.
- Step 4: Developing a SWOT matrix for each method
A SWOT analysis was conducted for each of the three technologies, identifying their strengths and weaknesses (internal factors) as well as opportunities and threats (external factors) in the context of the post-war inventory. The SWOT method and its calculations are described in Section 3.3.
- Step 5: TOWS Analysis
A TOWS analysis was conducted on the basis of the SWOT matrix, thus enabling the examination of interrelationships between factors and the formulation of strategic conclusions. The TOWS method and calculations are presented in Section 3.3.
- Step 6: Discussion of Results and Recommendations
The results of the analysis were then compared with the international literature on the subject and discussed in light of the specific characteristics of the conflict zone. Consequently, conclusions and recommendations were formulated regarding the effective use of the discussed methods (see Section 4).
3.2. Description of the Research Concept
The ongoing armed conflict in Ukraine, particularly following the full-scale invasion in February 2022, has led to the destruction and damage of tens of thousands of residential, public and historic buildings across the country. According to United Nations Ukraine [45] data on Ukraine, by February 2024, over 2.5 million households (i.e., buildings or apartments) had been destroyed or seriously damaged.
Ukraine was chosen as a case study for several key reasons:
- The scale of the destruction: this conflict is one of the most destructive in Europe since World War II.
- The diversity of development types affected: the destruction has impacted both residential buildings (e.g., prefabricated apartment buildings) and historic buildings (e.g., churches, theatres, public buildings).
- The political and international importance of documentation: inventory materials are used not only for reconstruction, but also as evidence in war crimes proceedings.
- The active role of many institutions and communities in documenting losses.
- The strong need for reconstruction after the end of hostilities.
The damage ranges from localised damage, such as rocket fire on individual buildings, to widespread damage, such as entire districts of Mariupol being completely destroyed. Damaged buildings fall into three categories:
- Completely destroyed: in situ reconstruction impossible;
- Partially damaged—possible to repair and reconstruct;
- Intact but at risk: requiring security and digital preventive documentation.
From an inventory perspective, various documentation goals emerge:
- Technical goals include stability assessment and BIM reconstruction.
- Evidential (forensic documentation of war crimes).
- Cultural and archival: protection of material heritage.
- Planning goals include reconstruction management and urban reconstruction.
3.3. SWOT/TOWS Analysis
It is important to acknowledge the limitations of SWOT analysis. Firstly, the process is susceptible to subjectivity, with results often being perceived as obvious or leading to misinterpretations. Secondly, not all factors relevant to a company can be encapsulated in terms of advantages, disadvantages, opportunities and threats. Thirdly, despite previous assumptions, some companies do not utilise such a strategy at all. The SWOT analysis is commonly used in strategic management when building the strategy of a given organization. It is a kind of diagnostic tool, often used at the very beginning of the process of defining future strategic plans [46]. he SWOT analysis provides a clear structure to gather information from various sources and provides an overview of the internal (i.e., strengths and weaknesses) and external factors (i.e., threats and opportunities) that can affect the integration of new technologies [47].
A SWOT analysis comprises two dimensions: internal and external. The internal dimension encompasses organisational factors, delineating the organisation’s strengths and weaknesses. The external dimension, in contrast, focuses on environmental factors, encompassing opportunities and threats inherent to the external environment. The SWOT analysis identifies strengths and weaknesses in order to capitalise on opportunities and mitigate threats. Consequently, the two dimensions generate four categories of factors:
- External positive (Opportunities)
- Internal positive (Strengths)
- External negative (Threats)
- Internal negative (Weaknesses)
SWOT can effectively overcome disadvantages, seize construction opportunities, prevent process threats, and finally put forward practical development strategy [48].
The objective of the analysis conducted by the authors is to assess the potential benefits of utilising modern building inventory technologies in Ukraine, particularly in the context of ongoing warfare, for the subsequent reconstruction of damaged buildings. The objective is also to evaluate the potential risks and to examine the strengths and weaknesses of ongoing inventory activities utilising the aforementioned technologies. By integrating the strengths and weaknesses with the opportunities and threats in the analysis, it is possible to identify the most promising applications of the various survey technologies and to prioritise them in a way that allows the optimal one to be selected.
It is worth noting that for the purposes of obtaining more detailed results, the basic concept of the SWOT analysis can be modified, for example, by expanding TOWS links or creating a TOWS-SWOT hybrid, which is used in the assessment of activities related to construction projects implemented as part of innovative construction [49]. The SWOT-TOWS analysis can be a useful tool supporting the management of construction companies, but it should be used in conjunction with other analytical tools [50]. It was thus resolved to undertake an in-depth SWOT/TOWS analysis.
The following section presents the methodology employed in the analysis:
- STAGE I—The initial stage of the process involved the identification of the factors associated with the use of subsequent building inventory technologies, which were then evaluated on a numerical scale from 1 to 5 in accordance with their positive or negative impact in Ukrainian conditions. 1—indicates a minimal influence of factors, 5—indicates a significant influence of factors.
- STAGE II—An evaluation of the strategic situation for individual inventory methods.
- STAGE III—The identification of strategic tasks and actions is conducted through an analysis of the strengths and weaknesses, as well as the opportunities and threats, in order to achieve the greatest benefit from the opportunities presented by the environment. This is achieved by overcoming weaknesses through the utilisation of the opportunities present in the environment, employing the strengths of the individual inventory methods to circumvent threats from the environment, and minimising the impact of weaknesses to avoid threats from the environment.
Table 1 provides a SWOT/TOWS analysis for the use of laser scanning to inventory buildings in Ukraine. An analysis of key internal and external factors using the SWOT/TOWS method was carried out to determine what strategy the company under study uses. In order to further refine the SWOT analysis, a weighting system was employed in which each factor was assigned a numerical value reflecting its relative significance in the context of post-war heritage inventorying. The weights were derived from three sources: first, the authors’ experience; second, an expert assessment (interviews with 10 construction management experts from Poland and Ukraine); and third, a literature review. Each expert assigned a rating on a scale of 0–1, as did the authors of the article, based on their experience. The results of the ratings were then compared to the ratings found in the literature. The weights resulting from the assessment of experts and authors (the assessments were averaged and rounded to the nearest whole number) were verified in relation to the descriptions or assessments found in the publications discussed. However, no significant differences were found between the weights resulting from expert assessments and the descriptions published in the analysed literature. The purpose of the comparison with the literature was solely for the purpose of verification.

Table 1.
SWOT analysis for the problem of using laser scanning in building inventory in Ukraine (source: own).
Furthermore, a rating system was employed in order to indicate the strength of each factor’s influence on the effectiveness of the technology. A comparison of the strengths and weaknesses of each method was facilitated by the calculation of summary values, thus allowing for an evaluation of their impact on potential applications. This approach thus transforms the classic qualitative SWOT analysis into a more structured form that supports strategic decisions. To this end, Table 1, Table 2 and Table 3 were first developed, where the most important internal and external factors were summarised and assigned specific weights. The sum of the weights for each set of factors is 1. All calculations were performed using an MS EXCEL spreadsheet.
Table 2.
SWOT analysis for the problem of using 360 cameras in building inventories in Ukraine (source: own).
Table 3.
SWOT analysis for the problem of using a series of photographs in building inventories in Ukraine (source: own).
The internal strength measure SP, the strategic attractiveness score AS and the probability of strategic success Pss were also calculated according to the formulas below and showed in Table 4:
Table 4.
Indicator measures for the different inventory methods (source: own).
Calculations were then made to determine the implementation strategies of the studied stock technologies as the difference in the product of weights and ratings of strengths and weaknesses (x-axis) and opportunities and threats (y-axis). The results of the calculations for the 3 technologies analysed and their categorisation into management strategies are shown in Figure 7.
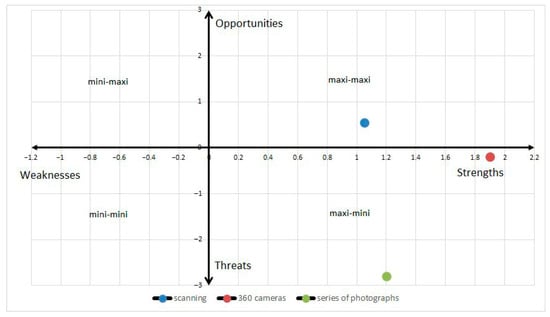
Figure 7.
Diagram illustrating the strategies for the inventory technologies analysed (source: own).
An analysis of Figure 7 shows that the use of laser scanning in building inventory in Ukraine is characterised by strengths over weaknesses and opportunities over threats. This means that the strategic position of laser scanning is in the first quadrant of the Cartesian system, indicating a maxi-maxi (aggressive) strategy [51]. Many factors contributed to these analysis results. Among the strengths, factors S1, S3, S4, S5 deserve special attention. These factors are related to the short execution time of the inventory, the high quality of the obtained model of the building object and the non-contact, non-invasive work on the building. This is important in view of the potential difficulties of conducting inventories under the conditions of ongoing hostilities in Ukraine and the high quality of documentation required especially for historic buildings. Weaknesses include poor training and lack of qualified staff, which can be improved. The cost of the scanner and the associated inventory costs may also be an issue.
For the other two technologies, a maxi-mini strategy is suggested. ST dominant state (strengths-threats)—a conservative strategy defined as maxi-mini corresponds to high risk. Despite the strong internal potential, there are a large number of external threats that potentially place the project in a very high-risk area. The aim should therefore be to maximise the use of internal strengths to minimise external risks [52].
Both SWOT and TOWS analyses took place in four successive stages, exploring the interrelationship of the various factors with each other. The SWOT analysis started by answering the questions:
- ‘Does a particular strength make it possible to exploit a given opportunity?’.
- ‘Does the identified strength limit the given threat?’.
- ‘Does the identified weakness limit the ability to exploit a given opportunity?’.
- ‘Are there links between the company’s weaknesses and existing threats in its environment?’.
The answers to the question ‘Does a particular strength make it possible to exploit a given opportunity?’ are presented in Table 5, using the values ‘1’ and ‘0’. A value of ‘1’ indicates that the strength influences the exploitation of the external opportunity, while a value of ‘0’ indicates that there is no relationship between the examined environmental elements. For the purposes of the analysis, the number of interactions (linkages) that occurred was summed and the products of the interaction numbers and weights were calculated.
Table 5.
SWOT analysis for laser scanning—checking the interaction between Opportunities and Strengths (source: own).
Opportunities with symbols O1 and O4 have the most interactions with the strengths. None of the strengths have an association with the opportunity with symbol O2. The sum of all interactions between factors was 20, and the sum of the products of the weights with the number of interactions was 4.4. Similar analyses were carried out for the other questions, analysing the interactions between strengths and threats, weaknesses and opportunities, and weaknesses and threats. Analyses were also carried out for the use of 360 cameras and a series of photographs.
The TOWS analysis followed an identical sequence (stages) to the SWOT analysis, but using the principle of the inverted form of the questions. Links relating to the questions were indicated:
- ‘Does a specific opportunity amplify a given strength?’,
- ‘Does a specific threat limit a given strength?’,
- ‘Does a specific opportunity overcome a given weakness?’,
- ‘Does a specific threat enhance a given weakness?’.
The results of the analysis for an example comparison between Opportunities and Strengths are shown in Table 6.
Table 6.
TOWS analysis for laser scanning—checking interaction between Opportunities and Strengths (source: own).
The strength with the symbol S1 has the most interaction with the opportunities. None of the opportunities has an association with the strength with the symbol S2. The sum of all interactions between the factors was 20 and the sum of the products of the weights with the number of interactions was 4.1. Similar analyses were carried out for the other questions, analysing the interactions for the other SWOT elements. Analyses were also carried out for the use of 360 cameras and a series of photographs. Table 7 summarises the results of the SWOT/TOWS analysis.
Table 7.
The results of the SWOT/TOWS analysis (source: own).
The summary results of the SWOT/TOWS analysis for laser scanning showed that the highest numerical values occurred between the strengths and opportunities generated by the external environment: 40—number of interactions, 8.5—weighted number of interactions.
4. Discussion
The present study proposes a decision-making framework based on SWOT/TOWS analysis for selecting methods for inventorying buildings damaged by armed conflict. This approach, while innovative in its application to war situations, requires comparison with previous research in this area and consideration of significant limitations.
4.1. A Comparison with the Literature Is Presented Herein
A body of previous research on the documentation of building damage has focused primarily on the technical aspects of specific methods.
Chiabrando et al. [53] conducted a comparative analysis of terrestrial (static) laser scanning and manual scanning techniques for the documentation of an architectural complex in northern Italy. The authors observed that terrestrial laser scanning yielded higher point cloud density and accuracy, particularly with regard to architectural details. Conversely, manual scanning necessitated optimal lighting conditions and uniform textures to attain comparable model quality. The conclusion drawn from this analysis was that terrestrial scanning was a more reliable and precise method for conservation documentation, despite the fact that manual scanning was a less expensive alternative.
In Remondino and Campana’s paper [54], three documentation methods were compared: laser scanning, photogrammetry, and UAV-assisted photogrammetry in the context of archaeology and heritage. Terrestrial laser scanning was found to be the most effective method in terms of geometric precision, with an error margin of less than 5 mm. Photogrammetry and UAV were effective in large open spaces, but less accurate when documenting complex structures. Photogrammetry has been observed to encounter difficulties when dealing with objects characterised by poor texture or reflective surfaces. The authors recommended laser scanning as the optimal tool for the detailed documentation of architectural details.
In their study, Fassi et al. [55] sought to evaluate the efficacy of laser scanning in the documentation of a series of images of the Milan Cathedral. The conclusions drawn from this study indicated that laser scanning exhibited superior precision and reduced error variability, particularly in the context of complex structures and elevated surfaces. Photogrammetry was found to be challenging when attempting to capture recesses, arcades and sculptures that were obscured. The authors have explicitly asserted that laser scanning should be regarded as the optimal method for the documentation of monuments characterised by a high degree of geometric complexity.
Kalvoda, Novák, and Vala [33] state that mobile laser scanning is significantly more precise than mobile handheld scanning. Mobile terrestrial scanning achieves an accuracy of approximately 0.017 m (17 mm), while handheld scanning achieves an accuracy of approximately 0.061 m (61 mm) in 3D.
Terrestrial laser scanning is regarded as one of the most precise methods of three-dimensional documentation [34]. This is due to the fact that it provides relatively high data density and accuracy. However, as Wilkinson et al. [35] have noted, the high cost of hardware and the lengthy measurement and data processing times are significant issues.
For instance, Conti et al. (2024) [36] also observed the superior precision of terrestrial laser scanning in comparison to manual scanning techniques. Alteirac et al. [37] posit that, notwithstanding discrepancies, manual scanning may also be deemed adequate in the digital documentation of objects.
A substantial body of research has demonstrated that terrestrial laser scanning is the most reliable and precise method for construction documentation. This is especially the case in situations involving complex geometry, high accuracy, limited access to the building structure, and high conservation requirements. Photogrammetry and UAVs have been demonstrated to complement terrestrial scanning, especially when documenting large outdoor facilities or projects with limited budgets.
The results of the authors’ research presented in the article, indicating that laser scanning has the fewest weaknesses and threats compared to other strategies, are strongly supported by the international literature. However, these studies primarily focus on two factors: measurement precision and measurement costs. In their article, the authors considered several factors, including technical, cost, legal regulations, application restrictions, work hours, education levels, and more, all in the context of crisis situations such as the war in Ukraine, which demonstrates the originality of the research.
A further area of global research focuses on the comparison of terrestrial laser scanning with drone scanning, handheld scanning, and photogrammetry. A paucity of research has been conducted on the use of 360-degree cameras in the documentation of buildings. Furthermore, researchers have consistently neglected to consider the implications of changing measurement conditions, objectives, and aspects in their studies. Despite the plethora of literature addressing the utilisation of contemporary methodologies in crisis situations, including construction disasters, earthquakes, and armed conflicts, there remains a paucity of substantiation regarding the application of these methodologies in decision-making processes.
4.2. Limitations of the Study
Notwithstanding the implementation of an integrated methodological approach, this study is subject to several limitations that must be considered when interpreting the results.
- 1.
- The present study examines armed conflict as a context for research:
The present study is exclusively concerned with the documentation of damage resulting from warfare (in the case of Ukraine). Consequently, the assumptions made (human risk, limited infrastructure, unstable political conditions) are not directly applicable to other cases—for example, natural disasters, urban disinvestment, or conservation documentation in peacetime.
- 2.
- Case study selection:
The present study concentrated on a selection of buildings in Ukraine that were destroyed as a consequence of Russian aggression. Whilst the selection was justified by the scale of destruction and the ease of access to documentary sources (including photographs, models and reports), it is important to note that this limits the generalizability of conclusions to other war theatres, such as the Gaza Strip, Syria, or Yemen, where the availability of data and technology may be even more limited.
- 3.
- The selection of technology:
The analysis was constrained to three types of methods (TLS, SfM, 360° camera), excluding other potentially valuable techniques such as photoluminescence, thermography, drones with multispectral sensors, and ground-based scanning from mobile platforms (MMS). While this choice was dictated by factors such as availability and practical application, it may result in a simplification of the actual spectrum of possibilities.
- 4.
- The absence of field validation, also referred to as ‘ground truth’, is a notable limitation of the study:
It is evident that, due to the inherent risks involved, no physical measurements or field validation of the obtained data were conducted. The conclusions drawn are based on a comprehensive literature analysis, case studies, and simulations. It is imperative that future comparative studies be conducted, incorporating empirical data to substantiate the findings.
4.3. Need for Further Research
In view of the aforementioned points, the following are necessary:
- The development of a universal methodological framework for the selection of documentation technologies in various crisis contexts is imperative.
- The integration of interdisciplinary approaches is imperative, encompassing the domains of technology, international law and cultural heritage.
- The present study aims to assess the efficacy of hybrid methodologies in real-time settings. Specifically, the investigation will encompass the integration of Structure from Motion (SfM) with artificial intelligence (AI) and terrestrial laser scanning (TLS) with satellite imagery, with the objective of determining the enhanced capabilities of these combined approaches.
- The validation of adopted decision matrices is to be conducted in operational conditions, in cooperation with local institutions.
5. Conclusions
The graph in Figure 7 shows that only the laser scanning strategy fits into the ‘maxi-maxi’ strategy. For the other two strategies examined, a ‘maxi-mini’ strategy was identified. However, such a strategy, despite its advantages, has a higher application risk. Despite the high internal potential, there are a number of external risks, but this does not mean that such strategies should be completely abandoned.
Among the strengths of laser scanning are the factors related to the short execution time of the inventory, the high quality of the obtained model of the building object and the non-contact, non-invasive work on the building. This is important in view of the expected difficulties in carrying out inventories in Ukraine and the high quality of documentation required especially for historical buildings. The results of the strategic analysis and choice of strategy are presented in Table 8.
Table 8.
Synthetic summary of the results of the strategic analysis (source: own).
The aggressive strategy for laser scanning is supported by the number of interactions between factors and the weighted number of interactions.
In summary, each of the modern inventory strategies has strengths that allow it to be considered for use even in harsh working conditions, but laser scanning potentially has the fewest weaknesses and risks, which argues in favour of using this strategy.
Author Contributions
Conceptualization: K.Z., Investigation: K.Z., J.G.-M. and V.P., Methodology: K.Z. and J.G.-M., Formal analysis: K.Z. and J.G.-M., Resources: V.P., Supervision: K.Z., Visualization: V.P., Writing—original draft: K.Z. and J.G.-M., Writing—review and editing: V.P. All authors have read and agreed to the published version of the manuscript.
Funding
This research received no external funding.
Data Availability Statement
The data presented in this study are available on request from the corresponding author. The data are not publicly available due to privacy.
Conflicts of Interest
The authors declare no conflicts of interest.
References
- World Bank Ukraine. Third Rapid Damage and Needs Assessment (RDNA3): February 2022–December 2023; World Bank Group: Washington, DC, USA, 2024. [Google Scholar]
- Palčák, M.; Kudela, P.; Fandáková, M.; Kordek, J. Utilization of 3D Digital Technologies in the Documentation of Cultural Heritage: A Case Study of the Kunerad Mansion (Slovakia). Appl. Sci. 2022, 12, 4376. [Google Scholar] [CrossRef]
- Wang, J.; Zakaria, S.A. Design Application and Evolution of 3D Visualization Technology in Architectural Heritage Conservation: A CiteSpace-Based Knowledge Mapping and Systematic Review (2005–2024). Buildings 2025, 15, 1854. [Google Scholar] [CrossRef]
- Lian, Y.; Xie, J. The Evolution of Digital Cultural Heritage Research: Identifying Key Trends, Hotspots, and Challenges through Bibliometric Analysis. Sustainability 2024, 16, 7125. [Google Scholar] [CrossRef]
- Van Tilburg, J.A.; Pakarati, C.A.; Hom, A.; Letellier, R. Mapping Features in: Recording, Documentation, and Information Management for the Conservation of Heritage Places; Illustrated examples Getty Conservation Institute: Los Angeles, CA, USA, 2007. [Google Scholar]
- Eastman, C.; Teicholz, P.; Sacks, R.; Liston, K. BIM Handbook: A Guide to Building Information Modeling; Wiley: Hoboken, NJ, USA, 2011. [Google Scholar]
- Dilsiz, A.; Haj Ismail, S. Documentation and assessment of war induced damage on historic buildings in Aleppo. J. Archit. Conserv. 2020, 26, 291–308. [Google Scholar] [CrossRef]
- Pavelka, K.; Šedina, J.; Raeva, P.; Hůlková, M. Modern processing capabilities of analog data from documentation of the great omayyad mosque in Aleppo, Syria, damaged in civil war. Int. Arch. Photogramm. Remote Sens. Spat. Inf. Sci. 2017, XLII-2/W5, 561–565. [Google Scholar] [CrossRef]
- Shrestha, R.; Shrestha, S.; Bhattarai, S.; Aryal, P. Status and Challenges of Reconstruction of Heritage Structures in Nepal After 2015 Gorkha Earthquake. In Proceedings of the 2nd International Conference on Natural Hazards and Disaster Management, Athens, Greece, 5–7 July 2022. [Google Scholar]
- Parente, M.; Bruno, N.; Ottoni, F. HBIM and Information Management for Knowledge and Conservation of Architectural Heritage: A Review. Heritage 2025, 8, 306. [Google Scholar] [CrossRef]
- Fattore, C.; Buldo, M.; Priore, A.; Porcari, S.; Porcari, V.D.; De Fino, M. A Comprehensive Overview of Heritage BIM Frameworks: Platforms and Technologies Integrating Multi-Scale Analyses, Data Repositories, and Sensor Systems. Heritage 2025, 8, 247. [Google Scholar] [CrossRef]
- Ávila, F.; Blanca-Hoyos, Á.; Puertas, E.; Gallego, R. HBIM: Background, Current Trends, and Future Prospects. Appl. Sci. 2024, 14, 11191. [Google Scholar] [CrossRef]
- Shrestha, S.; Reina Ortiz, M.; Gutland, M.; Napolitano, R.; Morris, I.M.; Santana Quintero, M.; Erochko, J.; Kawan, S.; Shrestha, R.G.; Awal, P.; et al. Digital Recording and Non-Destructive Techniques for the Understanding of Structural Performance for Rehabilitating Historic Structures at the Kathmandu Valley after Gorkha Earthquake 2015. ISPRS Ann. Photogramm. Remote Sens. Spat. Inf. Sci. 2017, IV-2/W2, 243–250. [Google Scholar] [CrossRef]
- Wijekoon, C.; Manewa, A.; Ross, A.D. Enhancing the value of facilities information management (FIM) through BIM integration. Eng. Constr. Archit. Manag. 2018, 27, 809–824. [Google Scholar] [CrossRef]
- Denker, A. Rebuilding Palmyra virtually: Recreationof its former glory in digital space. Virtual Archaeol. Rev. 2017, 8, 20–30. [Google Scholar] [CrossRef]
- Sammartano, G.; Avena, M.; Fillia, E.; Spanò, A. Integrated HBIM-GIS Models for Multi-Scale Seismic Vulnerability Assessment of Historical Buildings. Remote Sens. 2023, 15, 833. [Google Scholar] [CrossRef]
- Khan, M.S.; Khan, M.; Bughio, M.; Talpur, B.D.; Kim, I.S.; Seo, J. An Integrated HBIM Framework for the Management of Heritage Buildings. Buildings 2022, 12, 964. [Google Scholar] [CrossRef]
- Volk, R.; Stengel, J.; Schultmann, F. Building Information Modeling (BIM) for existing buildings—Literature review and future needs. Autom. Constr. 2014, 38, 109–127. [Google Scholar] [CrossRef]
- Grussenmeyer, P.; Landes, T.; Voegtle, T.; Ringle, K. Comparison Methods of Terrestrial Laser Scanning Photogrammetry Tacheometry Data for Recording of Cultural Heritage Buildings. Int. Arch. Photogramm. Remote Sens. Spat. Inf. Sci. 2008, 37, 213–218. [Google Scholar]
- Wahbeh, W.; Nebiker, S.; Fangi, G. Combining Public Domain and Professional Panoramic Imagery for the Accurate and Dense 3D Reconstruction of the Destroyed Bel Temple in Palmyra. ISPRS Ann. Photogramm. Remote Sens. Spat. Inf. Sci. 2016, III-5, 81–88. [Google Scholar] [CrossRef][Green Version]
- Bolognesi, C.; Fiorillo, F. Virtual reconstruction from scan to VR of architecture and landscape of a monumental park. In Dialoghi. Visioni e Visualità. Testimoniare Comunicare Sperimentare. Atti del 43° Convegno Internazionale dei Docenti delle Discipline della Rappresentazione/Dialogues. Visions and Visuality. Witnessing Communicating Experimenting. Proceedings of the 43rd International Conference of Representation Disciplines Teachers; Battini, C., Bistagnino, E., Eds.; FrancoAngeli: Milan, Italy, 2022; pp. 1365–1373. [Google Scholar]
- Gil, A.; Arayici, Y.; Kumar, B.; Laing, R. Machine and deep learning implementations for heritage building information modelling: A critical review of theoretical and applied research. ACM J. Comput. Cult. Herit. 2024, 17, 1–22. [Google Scholar] [CrossRef]
- Liu, J.; Willkens, D.; Gentry, R. Developing a Practice-Based Guide to Terrestrial Laser Scanning (TLS) for Heritage Documentation. Heritage 2025, 8, 313. [Google Scholar] [CrossRef]
- Liu, J.; Azhar, S.; Willkens, D.; Li, B. Static Terrestrial Laser Scanning (TLS) for Heritage Building Information Modeling (HBIM): A Systematic Review. Virtual Worlds 2023, 2, 90–114. [Google Scholar] [CrossRef]
- Afzal, Z.; Balz, T.; Cigna, F.; Tapete, D. Monitoring Vertical Urban Growth in Rapidly Developing Cities with Persistent Scatterer Interferometry: A Multi-Temporal Assessment with COSMO-SkyMed Data in Wuhan, China. Remote Sens. 2025, 17, 1915. [Google Scholar] [CrossRef]
- Howey, M.C.L. Harnessing Remote Sensing Derived Sea Level Rise Models to Assess Cultural Heritage Vulnerability: A Case Study from the Northwest Atlantic Ocean. Sustainability 2020, 12, 9429. [Google Scholar] [CrossRef]
- Field, S.; Kuijt, I.; Lash, R.; Burke, T. Monitoring Irish Coastal Heritage Destruction: A Case Study from Inishark, Co. Galway, Ireland. Remote Sens. 2025, 17, 2709. [Google Scholar] [CrossRef]
- Chalkidou, S.; Georgiadis, C.; Roustanis, T.; Patias, P. A Methodology for Identifying Coastal Cultural Heritage Assets Exposed to Future Sea Level Rise Scenarios. Appl. Sci. 2024, 14, 7210. [Google Scholar] [CrossRef]
- Pashaei, M.; Starek, M.J.; Kamangir, H.; Berryhill, J. Deep Learning-Based Single Image Super-Resolution: An Investigation for Dense Scene Reconstruction with UAS Photogrammetry. Remote Sens. 2020, 12, 1757. [Google Scholar] [CrossRef]
- Hajjar, M.; Zappa, E.; Bolzon, G. The State of the Art and Potentialities of UAV-Based 3D Measurement Solutions in the Monitoring and Fault Diagnosis of Quasi-Brittle Structures. Sensors 2025, 25, 5134. [Google Scholar] [CrossRef]
- Kuçak, R.A.; Kiliç, F.; Kisa, A. Analysis of terrestrial laser scanning and photogrammetry data for documentation of historical artifacts. Int. Arch. Photogramm. Remote Sens. Spat. Inf. Sci. 2016, XLII-2/W1, 155–158. [Google Scholar] [CrossRef]
- Borkowski, A.S.; Kubrat, A. Integration of Laser Scanning, Digital Photogrammetry and BIM Technology: A Review and Case Studies. Eng 2024, 5, 2395–2409. [Google Scholar] [CrossRef]
- Kalvoda, M.; Novák, J.; Vala, M. Accuracy evaluation and comparison of mobile laser scanning and mobile photogrammetry data. IOP Conf. Ser. Earth Environ. Sci. 2020, 609, 012091. [Google Scholar] [CrossRef]
- Kurdi, F.T.; Reed, P.; Gharineiat, Z.; Arangjeb, M. Efficiency of Terrestrial Laser Scanning in Survey Works: Assessment, Modelling, and Monitoring. Int. J. Environ. Sci. Nat. Res. 2023, 32, 556334. [Google Scholar] [CrossRef]
- Wilkinson, M.; Westoby, M.J.; Glasser, N.F. A comparison of terrestrial laser scanning and structure-from-motion photogrammetry for change detection in glacial environments. Geosphere 2016, 12, 1865–1880. [Google Scholar] [CrossRef]
- Conti, A.; Pagliaricci, F.; Bonora, V.; Tucci, G. A comparison between terrestrial laser scanning and hand-held mobile mapping for the documentation of built heritage. ISPRS Arch. 2024, XLVIII–2/W4–2024, 141–148. [Google Scholar] [CrossRef]
- Alteirac, J.; Macher, H.; Landes, T. Evaluation of Mobile Mapping Systems for Indoor Surveys: Case Study and Accuracy Assessment. Int. Arch. Photogramm. Remote Sens. Spat. Inf. Sci. 2021, XLVI–4/W5–2021, 119–125. [Google Scholar] [CrossRef]
- Rashdi, R.; Martínez-Sánchez, J.; Arias, P.; Qiu, Z. Scanning Technologies to Building Information Modelling: A Review. Infrastructures 2022, 7, 49. [Google Scholar] [CrossRef]
- Martín-Béjar, S.; Claver, J.; Sebastián, M.A.; Sevilla, L. Graphic Applications of Unmanned Aerial Vehicles (UAVs) in the Study of Industrial Heritage Assets. Appl. Sci. 2020, 10, 8821. [Google Scholar] [CrossRef]
- Kömürcü, E. Historic Building Information Modelling (HBIM). Proc. Int. Conf. Contemp. Aff. Archit. Urban.-ICCAUA 2021, 4, 589–597. [Google Scholar] [CrossRef]
- Basema, Q.D.D.; Jian, D.; Dammag, A.Q. Cultural Heritage Sites Risk Assessment and Management Using a Hybridized Technique Based on GIS and SWOT-AHP in the Ancient City of Ibb, Yemen. Int. J. Archit. Herit. 2024, 19, 1537–1572. [Google Scholar] [CrossRef]
- Skrzypczak, I.; Oleniacz, G.; Leśniak, A.; Zima, K.; Mrówczyńska, M.; Kazak, J.K. Scan-to-BIM method in construction: Assessment of the 3D buildings model accuracy in terms inventory measurements. Build. Res. Inf. 2022, 50, 859–880. [Google Scholar] [CrossRef]
- Hubar, Y.; Sai, V.; Khavar, Y.; Vynarchyk, L.; Hulko, O. Normal and convergent methods of survey for inventory and certification of cultural structures. Geod. Cartogr. 2023, 49, 66–75. [Google Scholar] [CrossRef]
- Soycan, A.; Soycan, M. Perspective correction of building facade images for architectural applications. Eng. Sci. Technol. Int. J. 2019, 22, 697–705. [Google Scholar] [CrossRef]
- United Nations Ukraine. Available online: https://ukraine.un.org/en/289807-updated-ukraine-recovery-and-reconstruction-needs-assessment-released?utm_source=chatgpt.com (accessed on 27 July 2025).
- Zima, K.; Plebankiewicz, E.; Wieczorek, D. A SWOT Analysis of the Use of BIM Technology in the Polish Construction Industry. Buildings 2020, 10, 16. [Google Scholar] [CrossRef]
- Farrokhnia, M.; Banihashem, S.K.; Noroozi, O.; Wals, A. A SWOT analysis of ChatGPT: Implications for educational practice and research. Innov. Educ. Teach. Int. 2023, 61, 460–474. [Google Scholar] [CrossRef]
- Xiong, W. Construction of Non-inherited Digital Platform based on PEST-SWOT Model. Appl. Math. Nonlinear Sci. 2023, 8, 1819–1828. [Google Scholar] [CrossRef]
- Miszewska, E.; Niedostatkiewicz, M. Dobór analizy strategicznej przedsięwzięć budowlanych w aspekcie zrównoważonego rozwoju [Selection of a strategic analysis of construction projects in terms of sustainability]. Przegląd Bud. 2020, 6, 21–25. [Google Scholar]
- Brycht, N.; Ulewicz, M. Application of the SWOT-TOWS analysis as a supporting tool when selecting a strategy for the implementation of local concrete roads. Sci. Pap. Silesian Univ. Technol. Organ. Manag. Ser. 2023, 172, 61–71. [Google Scholar] [CrossRef]
- Klimecka-Tatar, D.; Ingaldi, M.; Obrecht, M. Sustainable developement in logistic—A strategy for management in terms of green transport. Manag. Syst. Prod. Eng. 2021, 29, 91–96. [Google Scholar] [CrossRef]
- Deptuła, A.M.; Stosiak, M.; Deptuła, A.; Lubecki, M.; Karpenko, M.; Skačkauskas, P.; Urbanowicz, K.; Danilevičius, A. Risk Assessment of Innovation Prototype for the Example Hydraulic Cylinder. Sustainability 2023, 15, 440. [Google Scholar] [CrossRef]
- Chiabrando, F.; Lo Turco, M.; Rinaudo, F. Modeling the decay in an HBiM starting from 3D point clouds. A followed approach for cultural heritage knowledge, Int. Arch. Photogramm. Remote Sens. Spat. Inf. Sci. 2017, XLII-2/W5, 605–612. [Google Scholar] [CrossRef]
- Remondino, F.; Campana, S. 3D Recording and Modelling in Archaeology and Cultural Heritage Theory and Best Practices; BAR International Series; Archaeopress BAR: Oxford, UK, 2014. [Google Scholar]
- Fassi, F.; Fregonese, L.; Ackermann, S.; De Troia, V. Comparison between laser scanning and automated 3D modelling techniques to reconstruct complex and extensive cultural heritage areas, Int. Arch. Photogramm. Remote Sens. Spat. Inf. Sci. 2013, XL-5/W1, 73–80. [Google Scholar] [CrossRef]


Disclaimer/Publisher’s Note: The statements, opinions and data contained in all publications are solely those of the individual author(s) and contributor(s) and not of MDPI and/or the editor(s). MDPI and/or the editor(s) disclaim responsibility for any injury to people or property resulting from any ideas, methods, instructions or products referred to in the content. |
© 2025 by the authors. Licensee MDPI, Basel, Switzerland. This article is an open access article distributed under the terms and conditions of the Creative Commons Attribution (CC BY) license (https://creativecommons.org/licenses/by/4.0/).