1. Introduction
For centuries, practically every civilization in the world has employed natural stones. These stones have been used as both aggregate materials and decorative stones. These stones come in a variety of forms, including marble, granite, limestone, sandstone, slate, and travertine [
1]. The accelerating pace of modernization and population growth in recent decades has driven a significant increase in the consumption of concrete and the need for its constituent materials. The significant rise in demand for aggregates has led to a notable depletion of natural resources utilized as fundamental components of concrete [
2]. Granite waste powder (GWP) is produced during the cut and polish processes in stone industries [
3]. The significantly expanded stone industry produces large quantities of waste, which remains unused and is stored in piles [
4,
5]. The improper disposal of untreated granite waste leads to detrimental environmental consequences [
6]. Researchers are exploring methods to utilize this waste, including the incorporation of GWP in concrete [
7,
8,
9].
The use of GWP in concrete is determined by how GWP affects the characteristics of concrete mixes. It is crucial to find the best GWP addition that improves concrete’s mechanical properties and durability [
10]. The effects of GWP on the characteristics of cementitious mortars have been examined by Gupta and Vyas [
11]. The properties of GWP received particular attention. The characteristics of GWP grains directly influence the properties of mixtures and hardened concrete. Sadek et al. [
12] conducted a study on the sustainability of inclusion of MWP and GWP in cementitious composites. The inclusion of mineral powders significantly affects the properties of fresh mixes. Li et al. [
13] noted that GWP serves as a significant material for replacing cement. Furthermore, it was noted that GWP contributes to the observed improvement in compressive strength values of the composites. The utilization of GWP as a partial cement replacement material demonstrated the greatest increase in concrete strength with replacement ratios up to 10% [
14]. The effect of granite powder on the microstructure of cementitious composites has been investigated by Elyamany et al. [
15]. The study indicates that GWP presents significant potential for application as a filler in cementitious composites technology. Granite powder fills voids in the matrix of cementitious composites, significantly enhancing volume porosity and improving the durability of the composites.
Marble is one of the most widely used decorative stones in the construction industry, possessing both aesthetic and economic value. However, the cutting and polishing of marble blocks produce large quantities of waste sludge that pose serious environmental and economic challenges [
16]. The improper disposal of this waste often leads to contamination and land occupation, resulting in financial and ecological losses [
17,
18]. Repurposing discarded marble sludge as a raw material in other sectors, particularly in construction, offers both environmental and economic advantages by reducing waste generation and promoting sustainable resource utilization. In Egypt, marble processing plants generate nearly two million tons of marble debris annually, highlighting the urgency of adopting efficient waste recycling strategies [
1].
Marble waste powder (MWP) possesses a broad spectrum of industrial applications. Marble waste is employed not only as an ingredient in concrete but also in several other construction products. Nevertheless, none of these industries and materials adequately address the consumption of the existing waste powder, with the exception of the concrete industry [
16]. Corinaldesi et al. [
19] demonstrated in their research that MWP significantly enhances the cohesiveness of concrete and mortar. The incorporation of marble powder as an addition in composite cement production renders the manufacturing process more affordable, practicable, and environmentally sustainable [
20].
RSM is an effective technique that employs statistical and mathematical methods to determine a suitable functional relationship between independent parameters and a response, aiming to optimize the response [
21,
22]. One of the key advantages of using RSM approaches is that it minimizes the number of mix proportions required for an experimental investigation, saving time and money [
23,
24].
Elemam et al. [
25] utilized the RSM approach to optimize high-strength geopolymer concrete incorporating fine clay brick and clay brick powder. Dahish and Almutairi [
26] utilized Response Surface Methodology (RSM) to predict and optimize the compressive strength of concrete containing nano clay and nano silica under elevated temperature conditions. Dahish [
27] examined the influence of recycled aggregate and crumb rubber on the compressive strength of concrete through the application of Response Surface Methodology (RSM). Haque et al. [
28] utilized Response Surface Methodology (RSM) to predict and optimize the mechanical properties of concrete incorporating scrapped copper wire and granite dust. Essam et al. [
29] utilized RSM and ANN for predicting and optimizing the effect of MWP as a partial cement replacement on the mechanical properties of HPC.
The Neural Network Algorithm (NNA) is a recently developed cutting-edge metaheuristic optimization technique inspired by the structural and functional principles of biological and artificial neural networks [
30]. Unlike traditional Artificial Neural Networks (ANNs), which are primarily designed as predictive or classification models trained on input–output data, NNA does not aim to perform learning or pattern recognition. Instead, it exploits the conceptual elements of neural networks, such as weight matrices, transfer functions, bias operators, and feedback mechanisms, to guide the search for optimal solutions in complex and constrained optimization problems [
31]. In this framework, the “neurons” represent candidate solutions, the weight connections regulate the influence among solutions, and the feedback structure enables a dynamic balance between exploration and exploitation. While ANNs are dedicated learning models for prediction and classification, NNA is a population-based search algorithm tailored for global optimization tasks [
32]. Numerous previous studies have demonstrated the high efficiency of this approach in solving complex engineering optimization problems, particularly those involving nonlinear relationships, multi-objective trade-offs, and high-dimensional parameter spaces [
33,
34]. Its adaptive search capability and robust convergence behavior make it especially suitable for modeling and optimizing the intricate interactions among variables where traditional deterministic methods often fall short. Accordingly, the use of NNA in the present study provides an effective means to address complex multivariable challenges, such as the case under investigation, where the compressive strength of concrete exposed to elevated temperatures is influenced by several interdependent factors, including temperature level, duration of exposure, type of waste material incorporated, and varying replacement ratios with cement. Nevertheless, NNA can be indirectly linked to predictive applications when prediction is formulated as an optimization problem, for example, by using NNA to optimize the parameters of a mathematical or statistical model. In such cases, NNA does not act as a predictive model itself but rather as an optimization engine that enhances the accuracy of predictive frameworks.
This study used ML and RSM to simulate the combined effects of using GWP and MWP as partial replacements for cement in concrete exposed to elevated temperatures on the compressive strength of concrete. A dataset of 310 compressive strength results of concrete cubes from previous research [
35] was used to develop the prediction models through RSM and NNA, eliminating the need for additional experimental work. Despite the extensive research on sustainable concrete incorporating industrial waste materials, limited attention has been devoted to advanced mathematical modeling approaches capable of capturing the highly nonlinear and multivariable behavior of concrete under thermal exposure. Traditional statistical methods often lack the flexibility to address the complex interplay among temperature, mixture composition, and mechanical performance, leading to suboptimal predictive accuracy. To overcome these limitations, this study adopts a dual modeling framework that synergistically integrates RSM and NNA. RSM statistically quantifies the individual and interactive effects of key parameters and develops a quadratic predictive surface, while the NNA explores the solution space beyond the constraints of classical regression. The novelty of this research lies in the first-time application of NNA as an optimization-based modeling tool in the field of thermally exposed sustainable concrete, alongside its comparative evaluation with RSM to assess modeling robustness and predictive efficiency.
2. Materials and Methods
2.1. Materials
The experimental data comprises 310 compressive strength results includes four input parameters granite waste powder (GWP), marble waste powder (MWP), temperature (T), and duration (D), while the output was the concrete compressive strength. The replacement ratios of cement with GWP and MWP vary between 1 and 9% for individual replacement and up to 18% for hybrid replacement. The ranges of temperatures were (25, 200, 400, 600, 800 °C) and the durations were (one and two hours). The source of GWP and MWP was Shaq El Thuban industrial cluster in East Cairo, Egypt [
36]. The collected wastes were ground for 12 min using a vibratory pulverizing ring mill containing two rings and a puck, capable of reducing wet or dry samples to +400 mesh within one minute. The resulting powders were oven-dried at 120 °C for 2 h to remove moisture and ensure a consistent water–cement (w/c) ratio. Finally, the powders were re-vibrated for 5 min to disperse agglomerations and sieved through a No. 200 sieve (<75 μm) to obtain fine particles suitable for use as cement replacement materials.
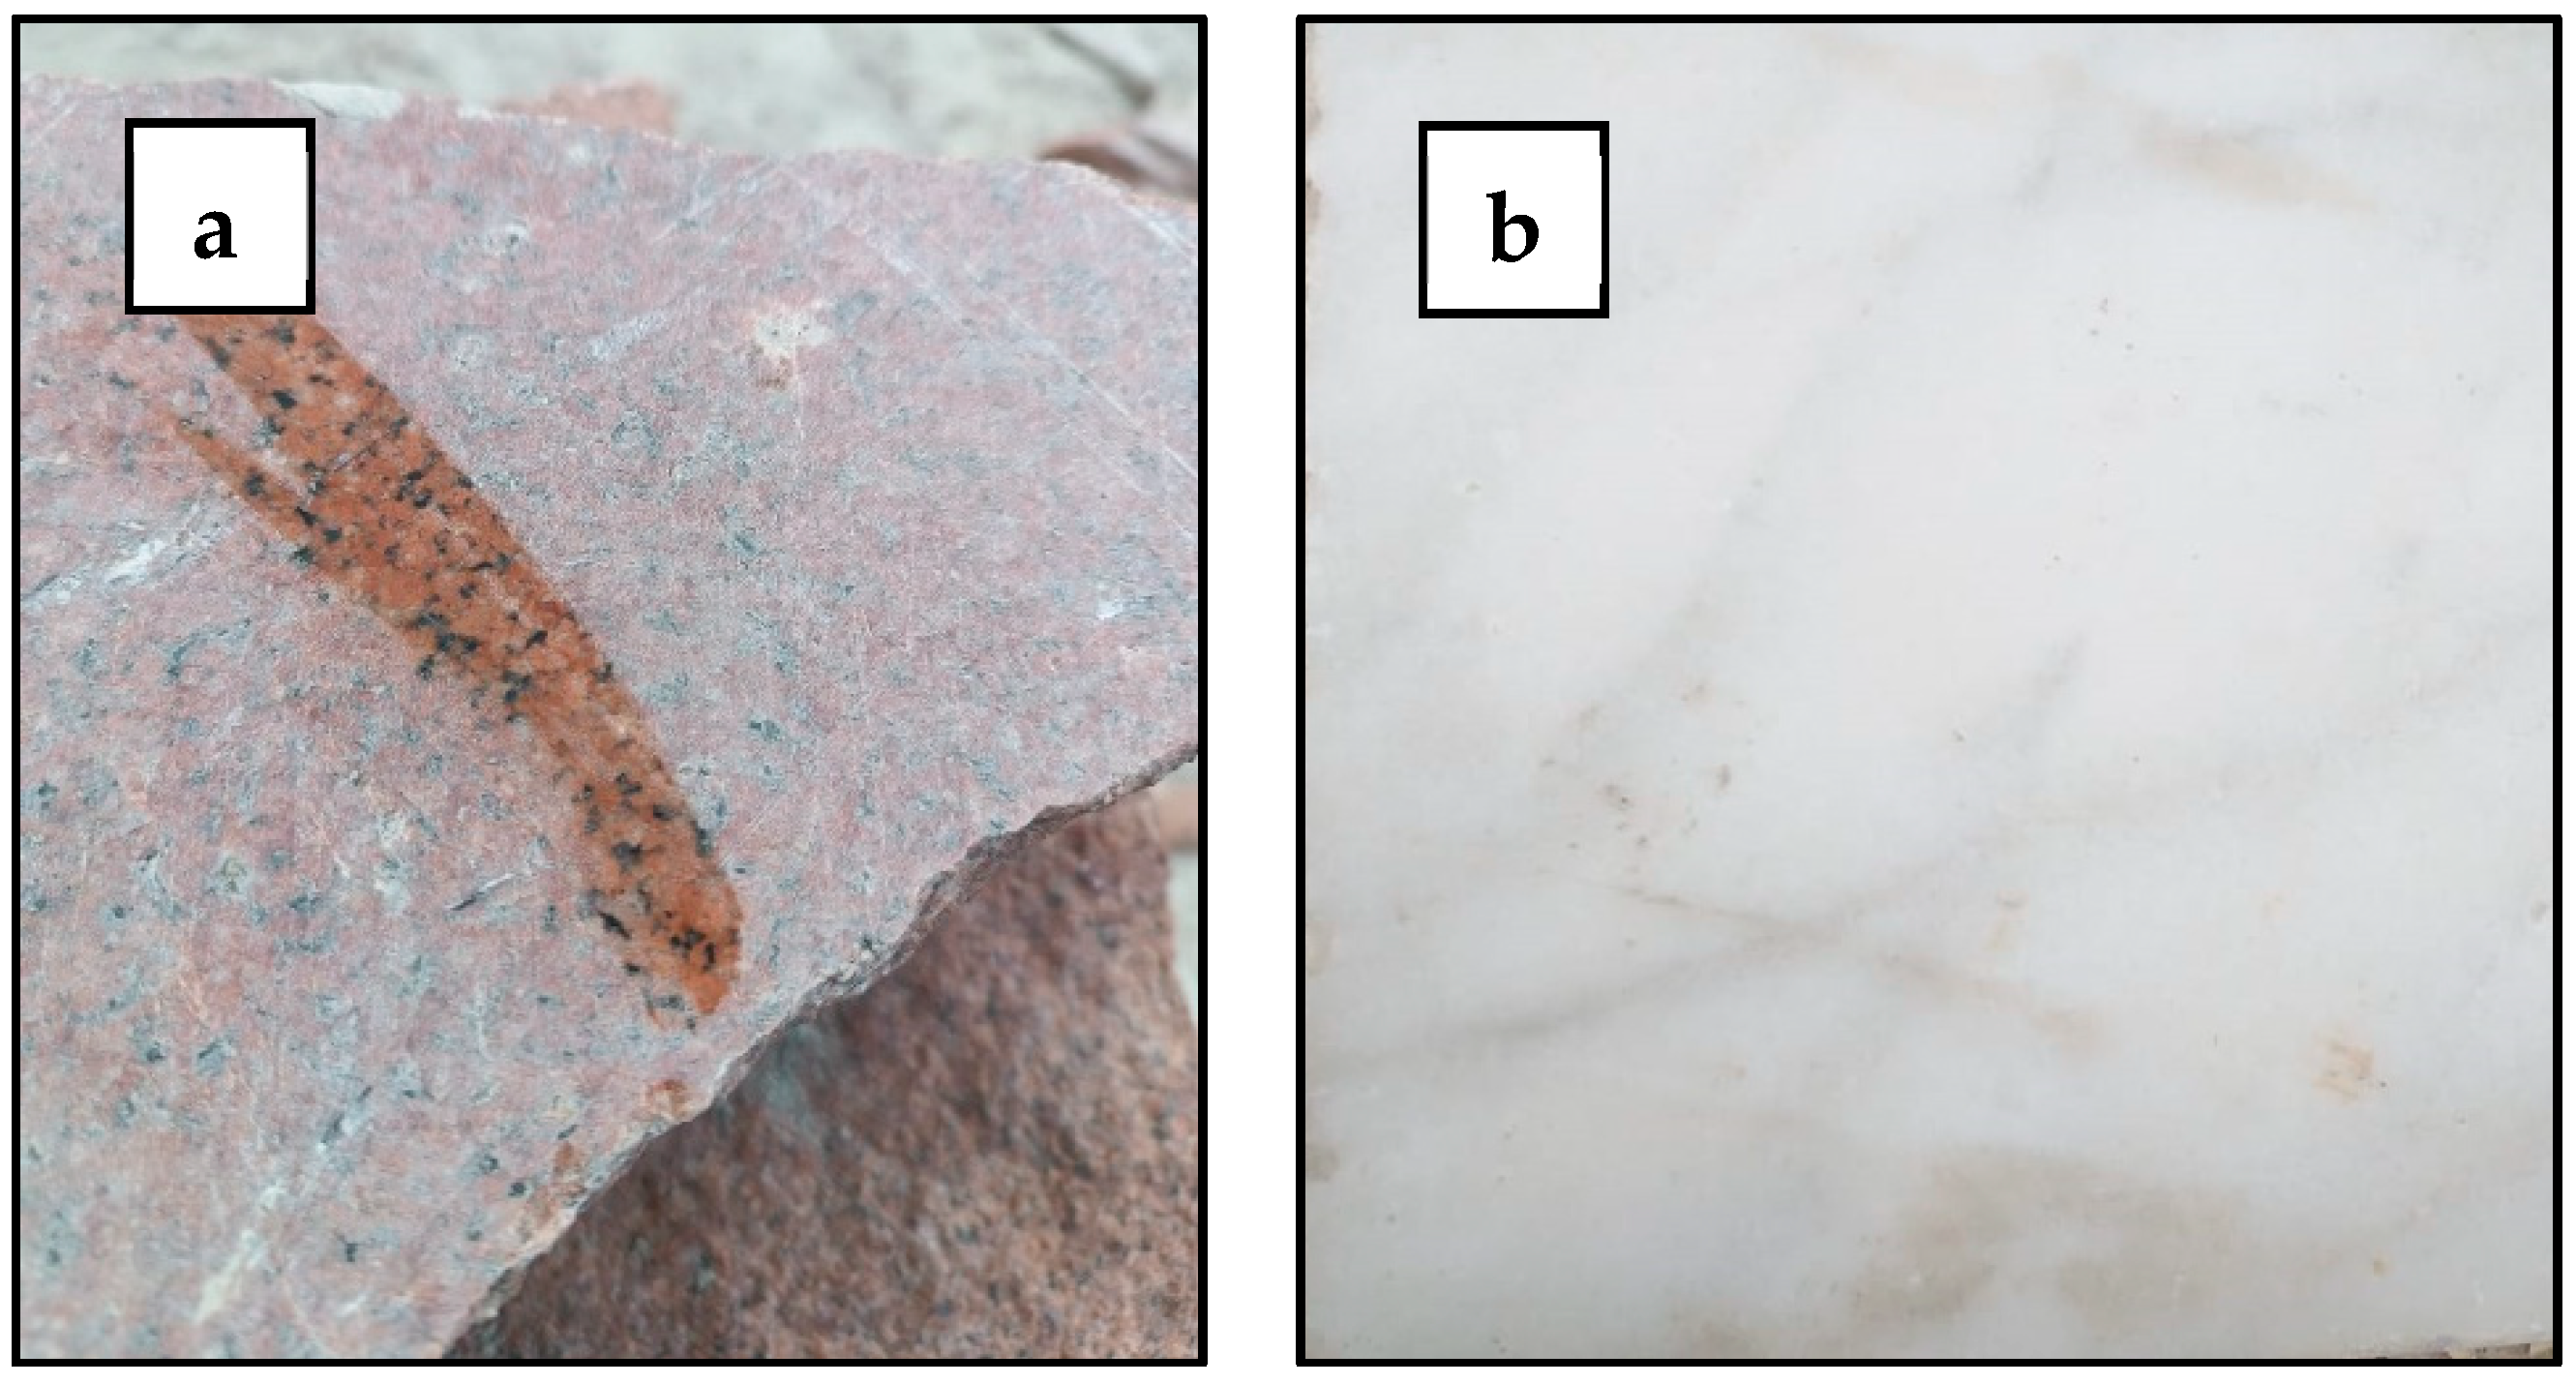
Figure 1 presents a visual representation of the granite and marble waste samples and
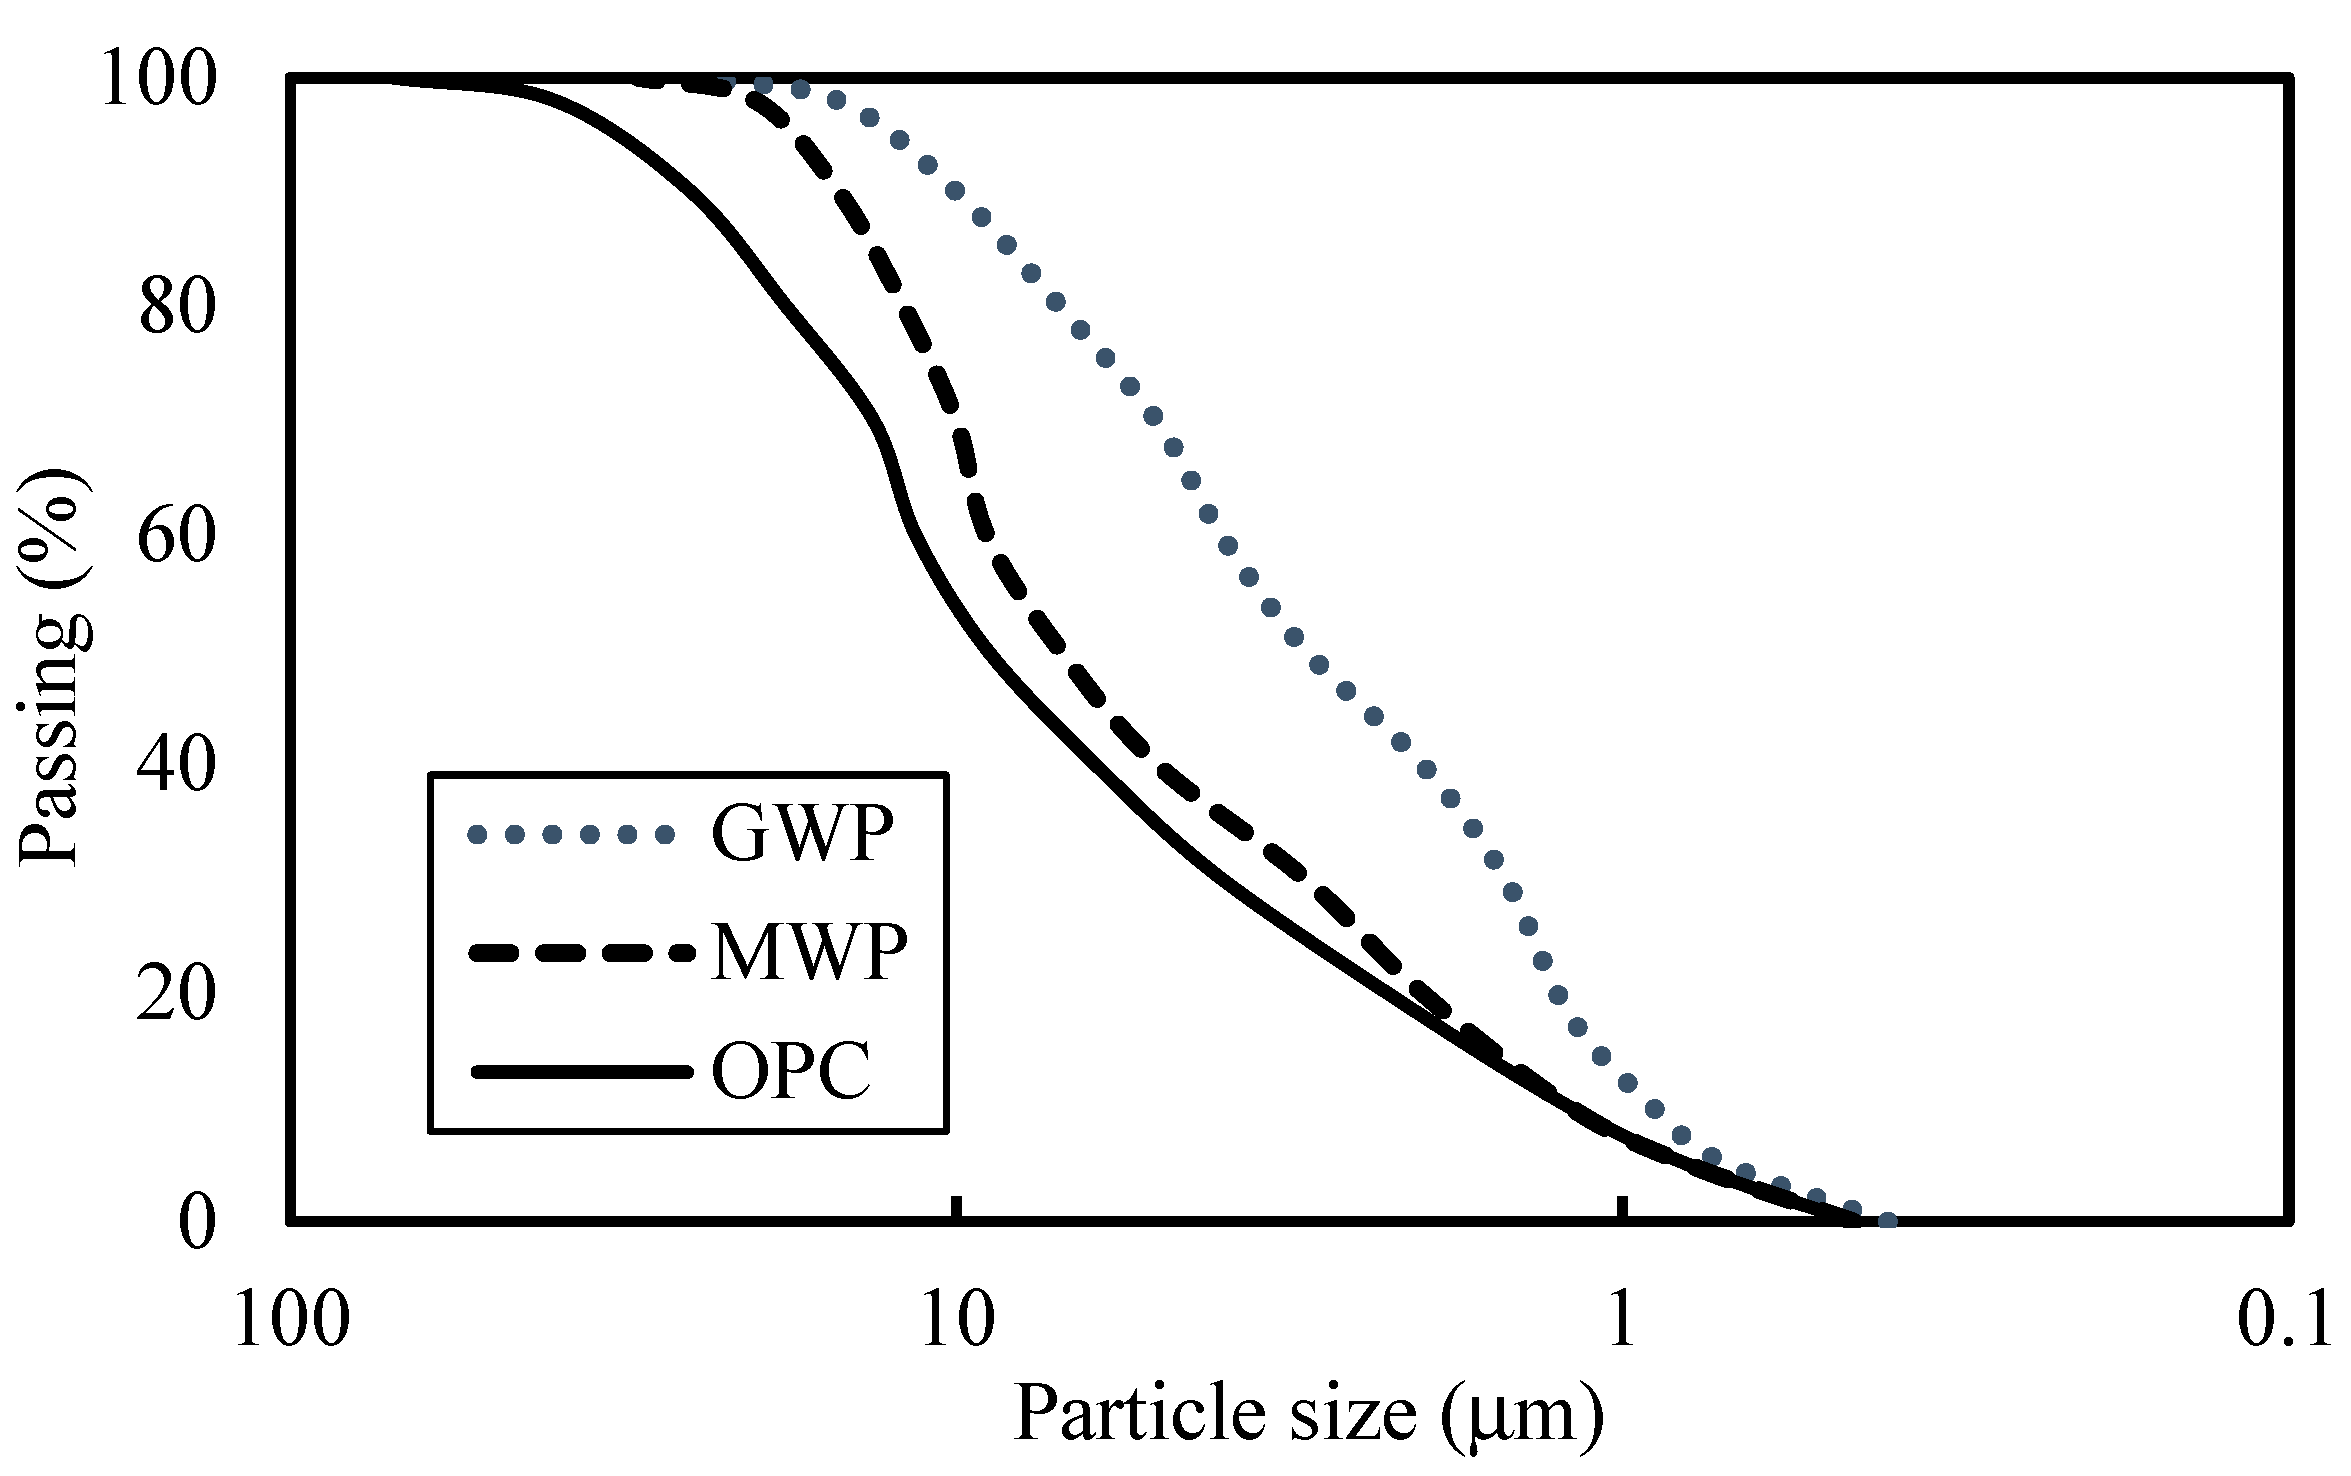
Figure 2 shows the dried powders. The particle size distributions of GWP and MWP are shown in
Figure 3. GWP was the finest material. MWP was finer than OPC.
The utilized cement was Ordinary Portland Cement (OPC) 42.5 N conforming to ASTM C150 [
37]. Dolomite aggregate was the coarse aggregate with a specific gravity of 2.67, a bulk density of 1668 kg/m
3, absorption of 0.55%, and a crushing value of 21%. The fine aggregate was natural sand with a specific gravity of 2.52 and a bulk density of 1728 kg/m
3, absorption of 0.85%, and a fineness modulus of 2.4.
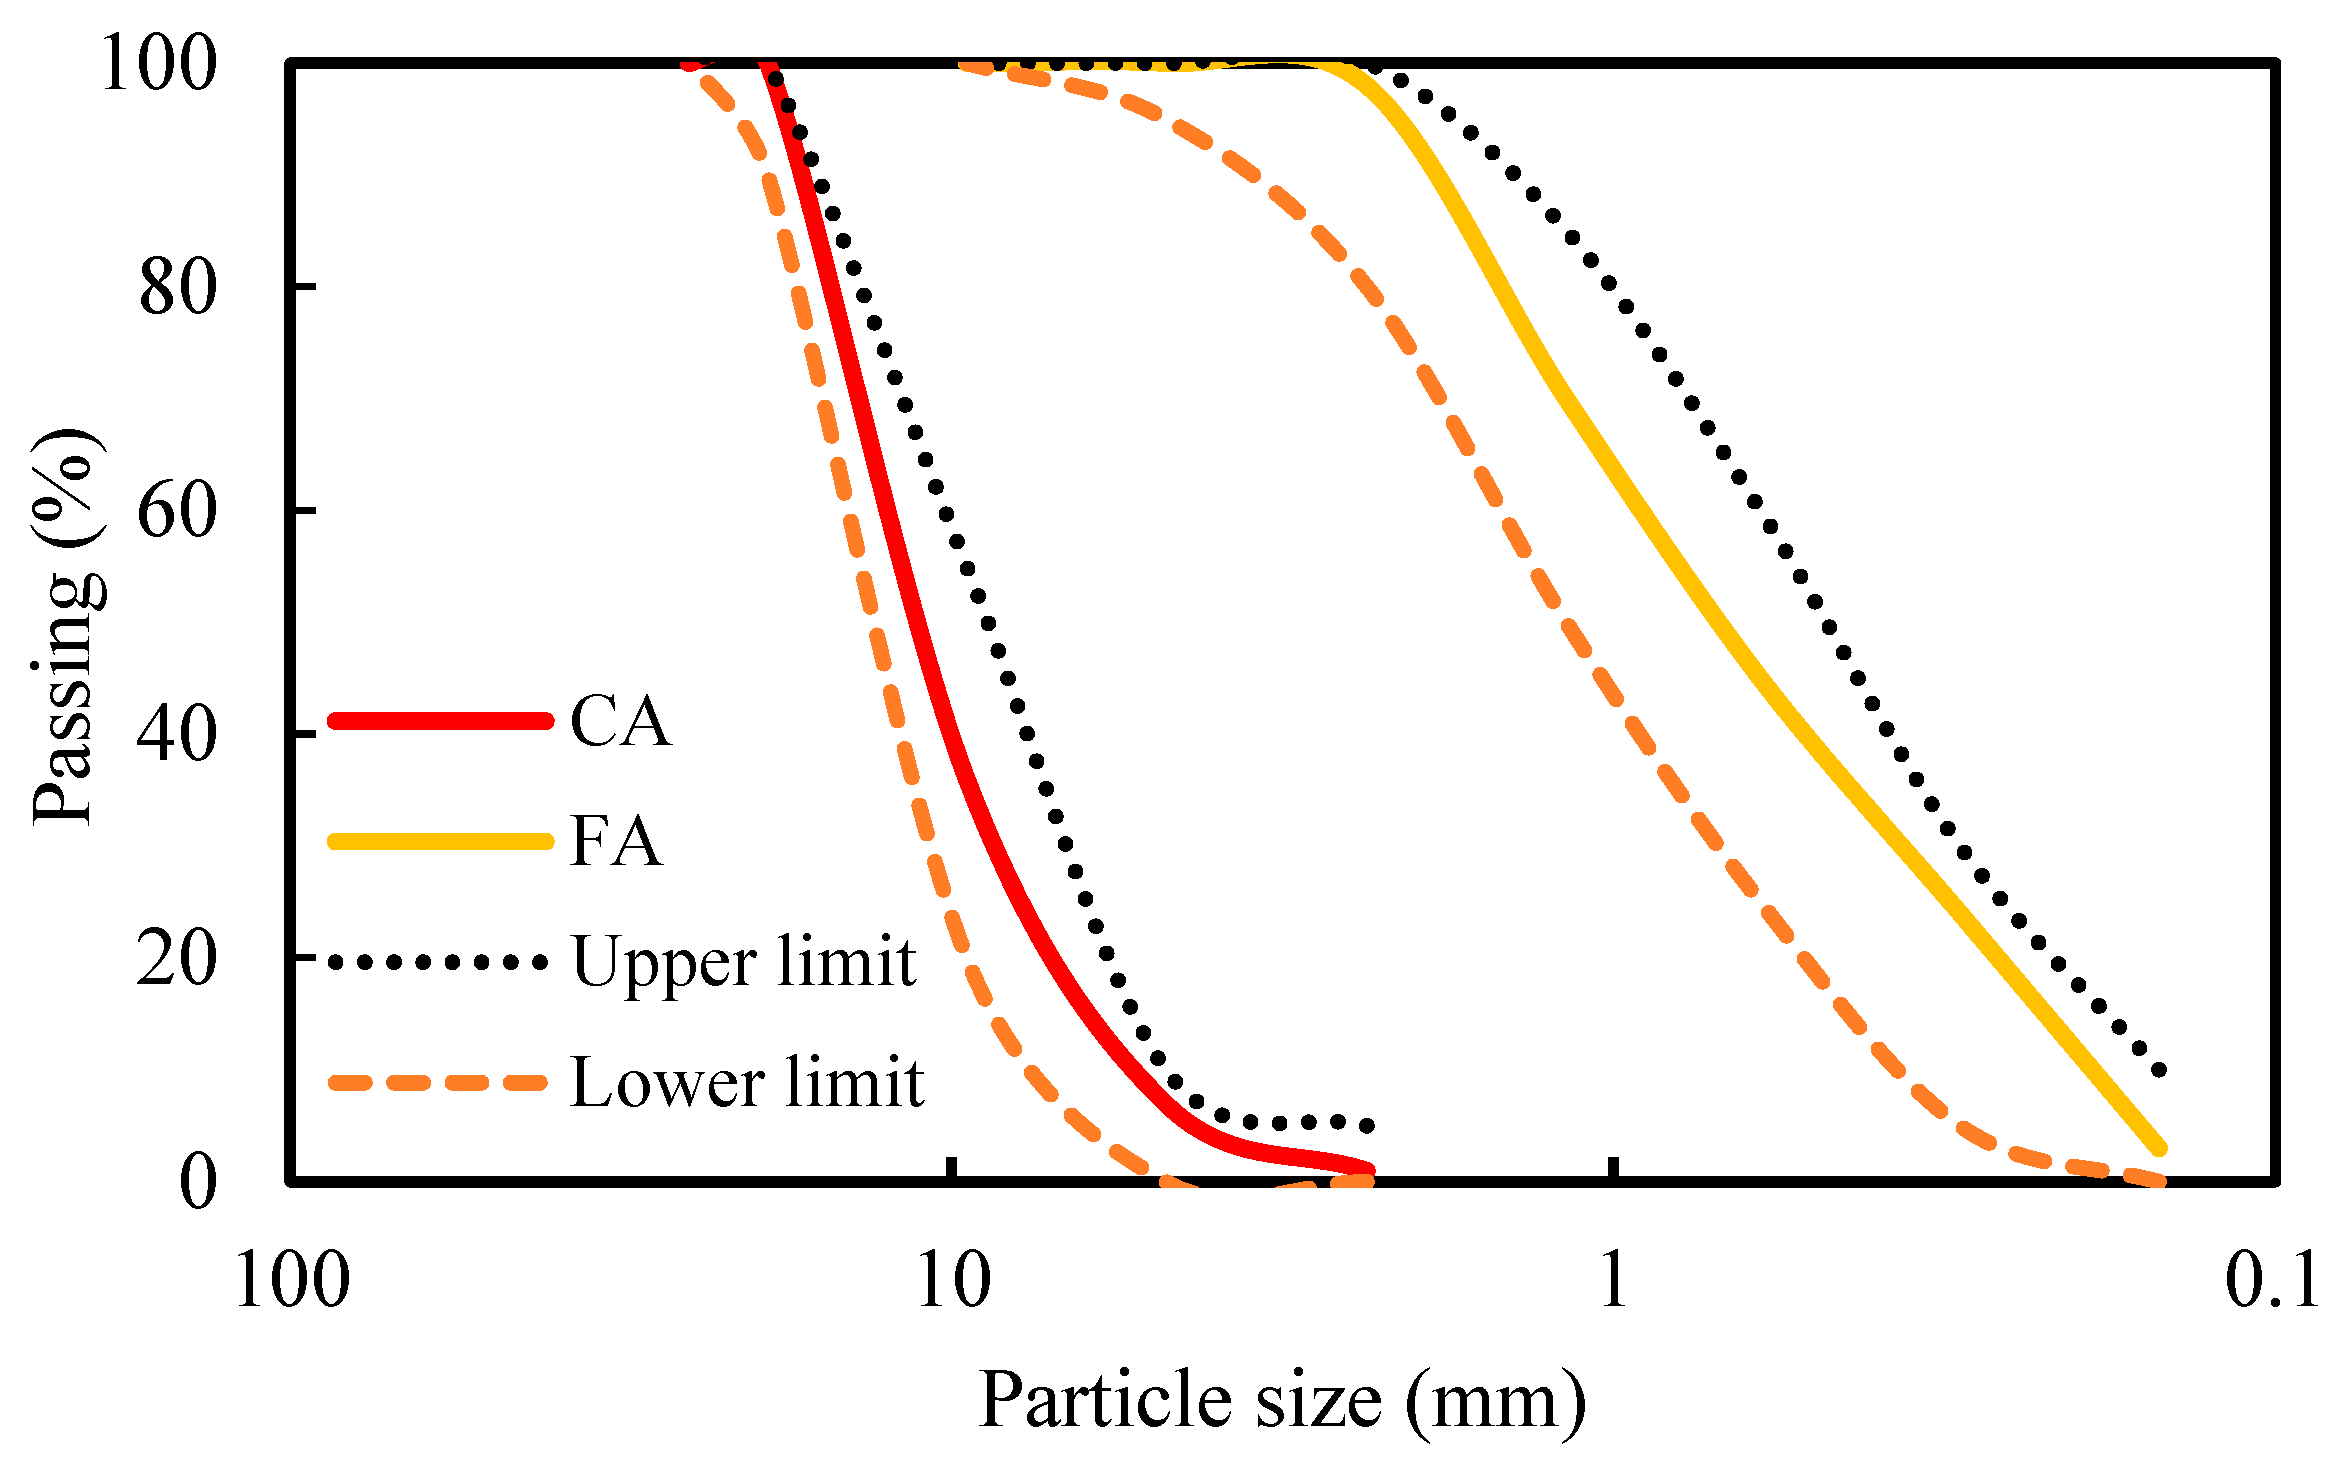
Figure 4 shows the particle size distributions for coarse aggregate (CA) and fine aggregate (FA).
The X-ray fluorescence (XRF) analysis shown in
Table 1 confirmed GWP is composed of over 80% silica and alumina, indicating pozzolanic activity. MWP, primarily CaCO
3, was selected for its potential filler effect.
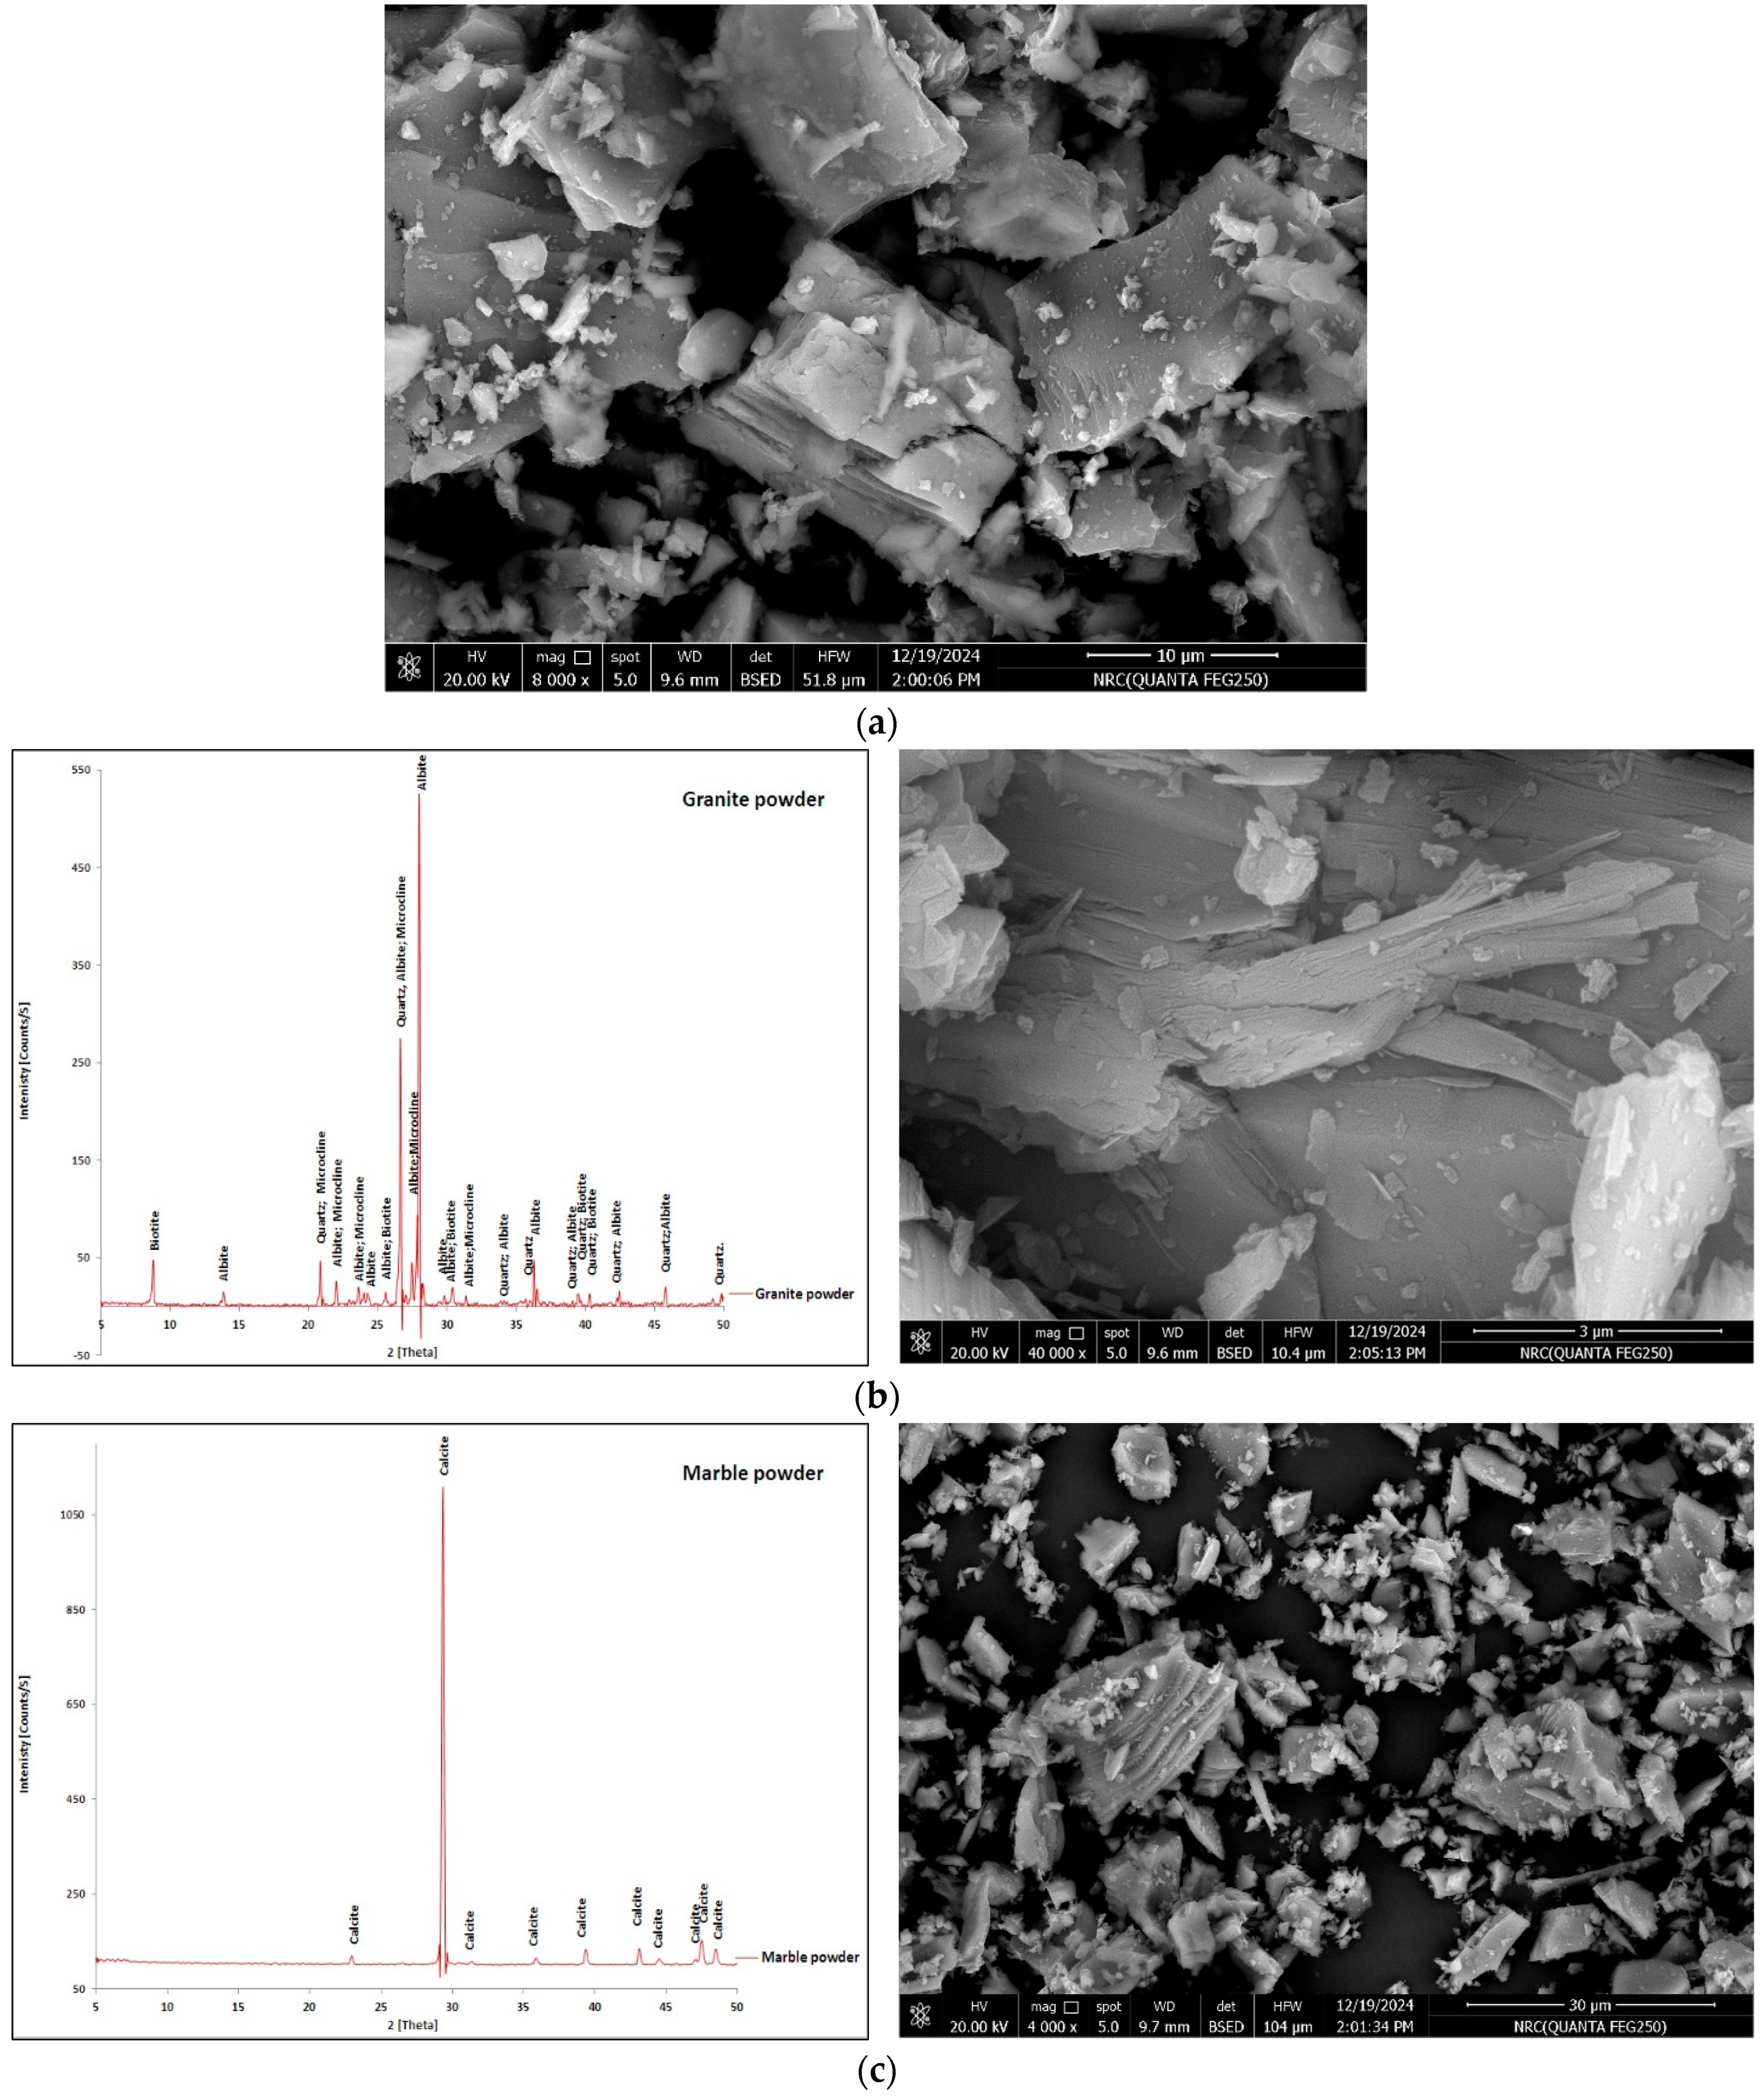
Figure 5a illustrates the scanning electron microscope (SEM) image of the used cement. The SEM image revealed that the cement exhibited an irregular, angular morphology with a wide range of particle sizes. GWP characterization is shown in
Figure 5b. X-ray diffraction (XRD) analysis revealed quartz, albite, and microcline as dominant phases. SEM imaging captured the particle morphology shaped by the grinding process.
Figure 5c shows that XRD for MWP confirmed calcite as the primary phase, and SEM revealed a relatively uniform particle size distribution with sub-angular morphology.
2.2. Description of Experimental Program
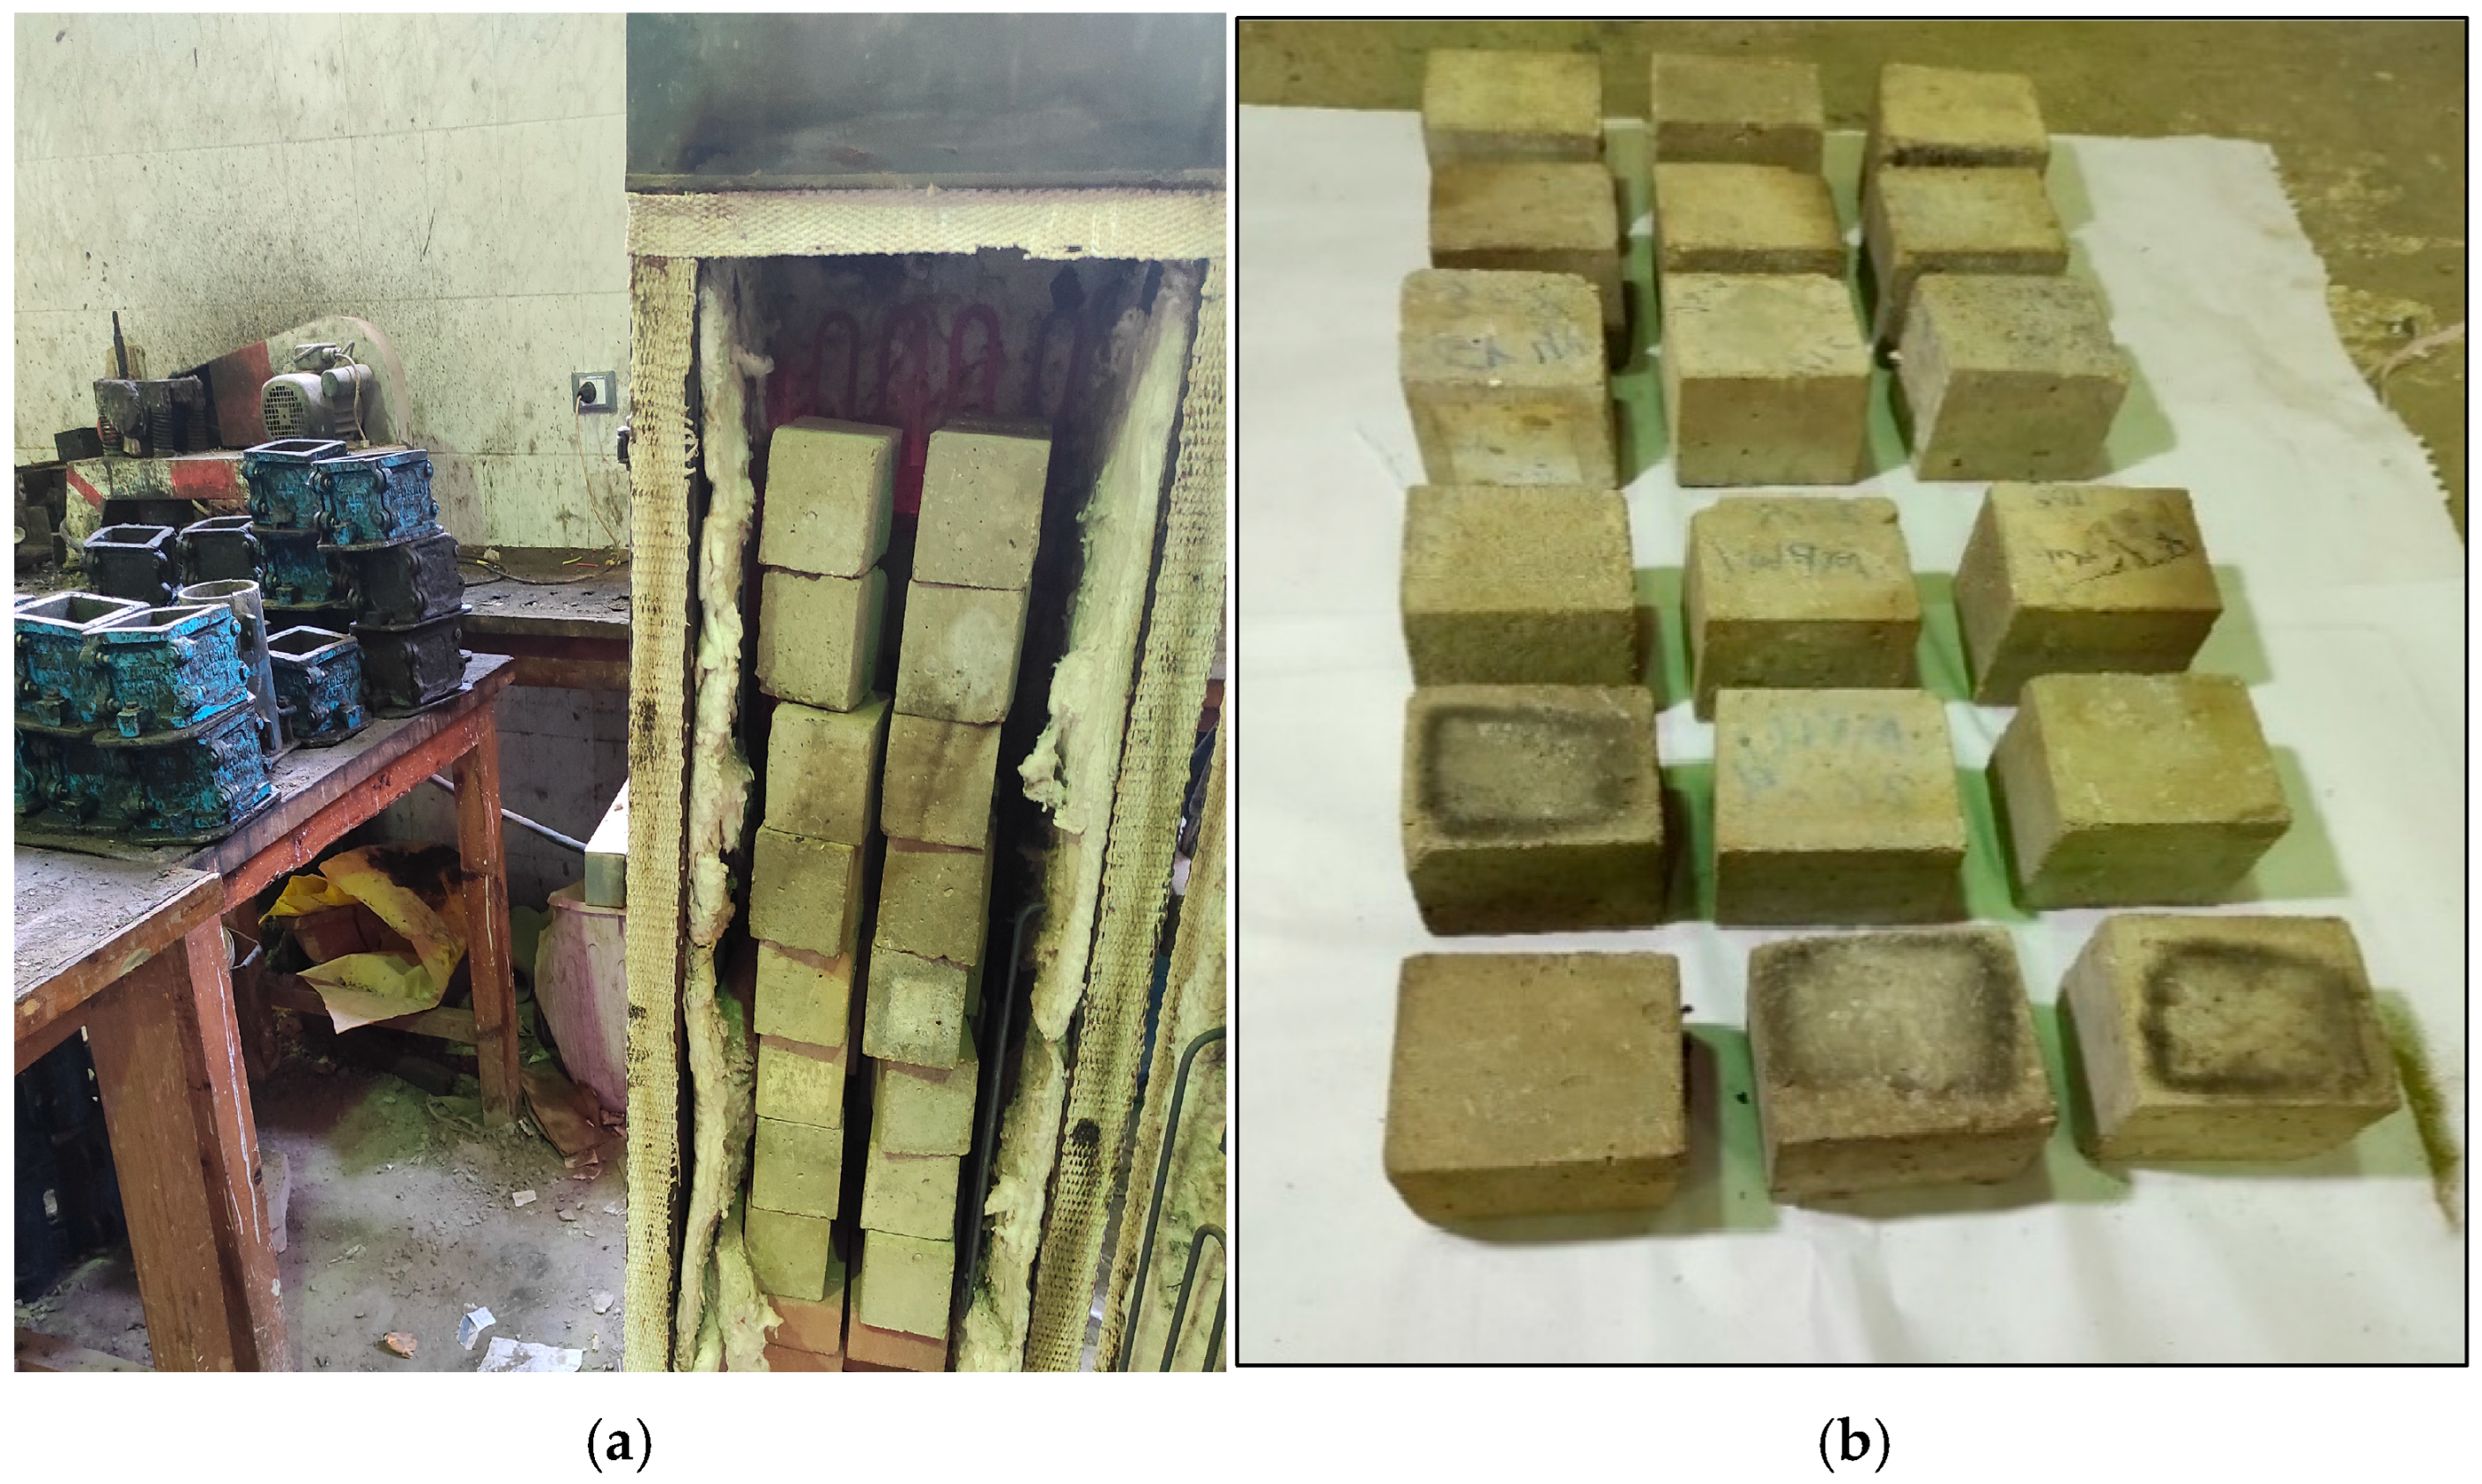
Specification of the control concrete mixture was achieved via the ACI 211.1 methodology. The composition per cubic meter included: 350 kg of cement, 1165 kg of coarse aggregate, 735 kg of fine aggregate, and 140 kg of water. A water-to-cement ratio (w/c) was fixed at 0.4. Additionally, a superplasticizer was integrated into all mixtures at a dosage equivalent to 0.4% of the cementitious materials’ total mass. Single replacement ratios of cement with marble waste powder and granite waste powder were used, ranging from 1% to 9% for each. Meanwhile, dual replacement mixes were designed to include all the investigated ratios of both materials up to 18% in hybrid mixtures. After 28 days of curing in clean water, the specimens were dried before measuring the compressive strength, either under normal conditions or after exposure to elevated temperatures for different durations of one and two hours. Compressive strength of the diverse concrete mixtures containing waste material additives was evaluated using cubic concrete specimens of 100 mm side length. The specimens were placed inside a custom-built electric furnace, as shown in
Figure 6a. The furnace was constructed using two welded steel plates with a 7 cm layer of glass wool insulation between them. The interior dimensions were 45 cm × 45 cm × 120 cm. The system included eight electric heaters capable of reaching temperatures up to 1200 °C and a thermocouple connected to an automated control unit with a digital temperature display.
Figure 6b shows the concrete specimens after temperature exposure in an electrical furnace. The temperature regimes followed the ISO 834 fire resistance curve. Specimens were exposed to temperatures of 200, 400, 600, and 800 °C for durations of one and two hours. Air cooling was applied to the specimens before conducting the compressive strength test to determine the residual strength after exposure to elevated temperatures.
2.3. XRD Analysis
XRD analysis is a powerful tool for determining the crystalline structure of materials [
38]. By analyzing diffraction patterns, detailed information regarding the mineralogical composition and structural characteristics of a sample can be obtained, enabling a comprehensive understanding of its constituent phases [
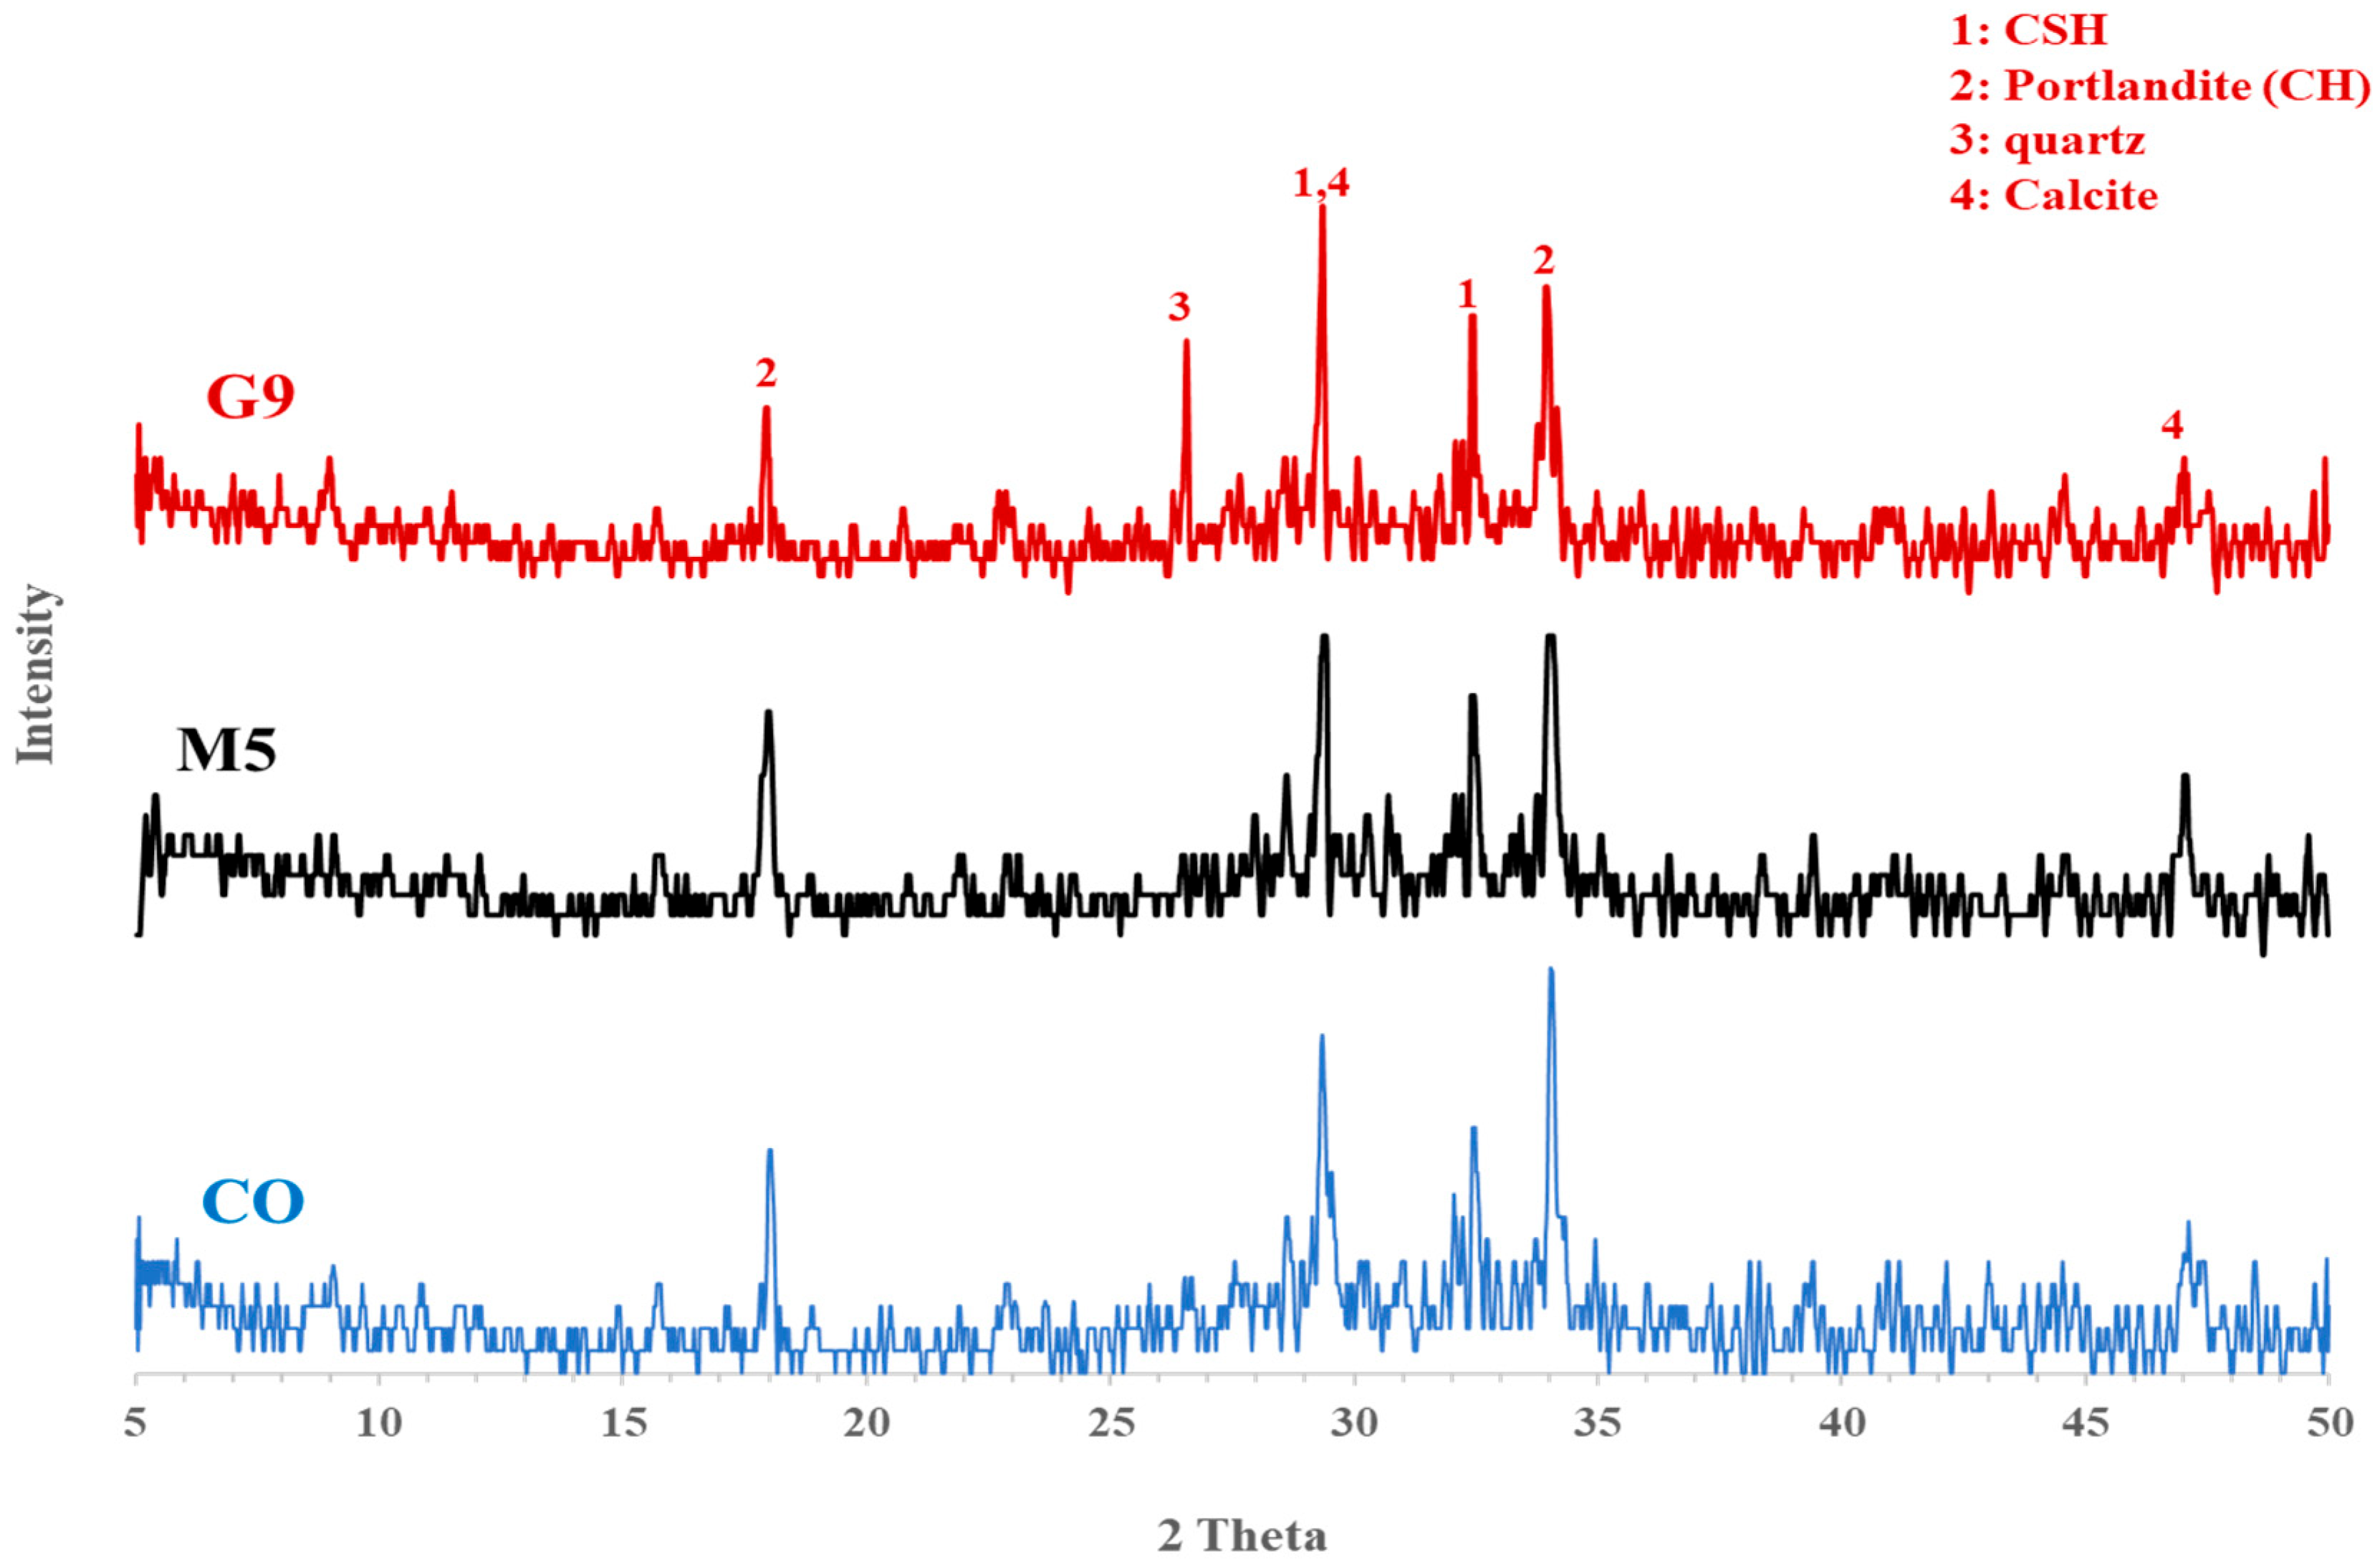
39]. XRD analysis was conducted on cementitious mortar specimens representing the control mix (CO) and the optimum substitution levels that exhibited the best mechanical performance at 9% granite waste powder (G9) and 5% marble waste powder (M5). Each specimen was crushed and ground to a fine powder with a particle size below 75 μm to ensure homogeneity and sufficient fineness for accurate diffraction measurements. The prepared powders were then subjected to X-ray diffraction using a PANalytical X’Pert PRO diffractometer. As expected, the XRD patterns confirmed the presence of calcium silicate hydrate (CSH) and portlandite in all mixes, consistent with their characteristic roles in cement hydration. Quartz and calcite were also detected, corresponding to the mineralogical constituents of granite and marble waste powders, respectively. The obtained results, shown in
Figure 7, illustrate the distinct mineralogical phases of the control and optimized mixes. Results showed that the G9 paste exhibited a notable increase in CSH peak intensity compared to CO, indicating enhanced CSH formation, which contributes to increased mechanical strength. Concurrently, a reduction in portlandite peak intensity suggests its consumption through pozzolanic reactions with the high-silica content of G9, consistent with findings by Abouelnour (2024) [
40]. This is consistent with the pozzolanic activity of granite powder, which involves its reaction with calcium hydroxide to form supplementary calcium-silicate-hydrate (C-S-H) gel. The higher unreacted quartz peak in G9, relative to CO, reflects the inherent quartz content of granite, as corroborated by Abd Elmoaty (2018) [
3]. The M5 paste’s XRD pattern displayed similar peaks to CO, with notable differences in calcite and CSH intensities. A significant increase in calcite peaks was observed. The increased calcite peak in M5 is attributed to the inherent calcite content of marble powder and potential portlandite carbonation, as reported by Kechagia (2021) [
41]. The slight rise in the C-S-H peak intensity observed in M5 is likely due to the filler effect of the marble particles, contributing to a denser and more compacted microstructure.
2.4. Methodology
The study investigated the impacts of GWP and MWP as SCMs on compressive strength, evaluating performance under both conditions of ambient and elevated temperatures.
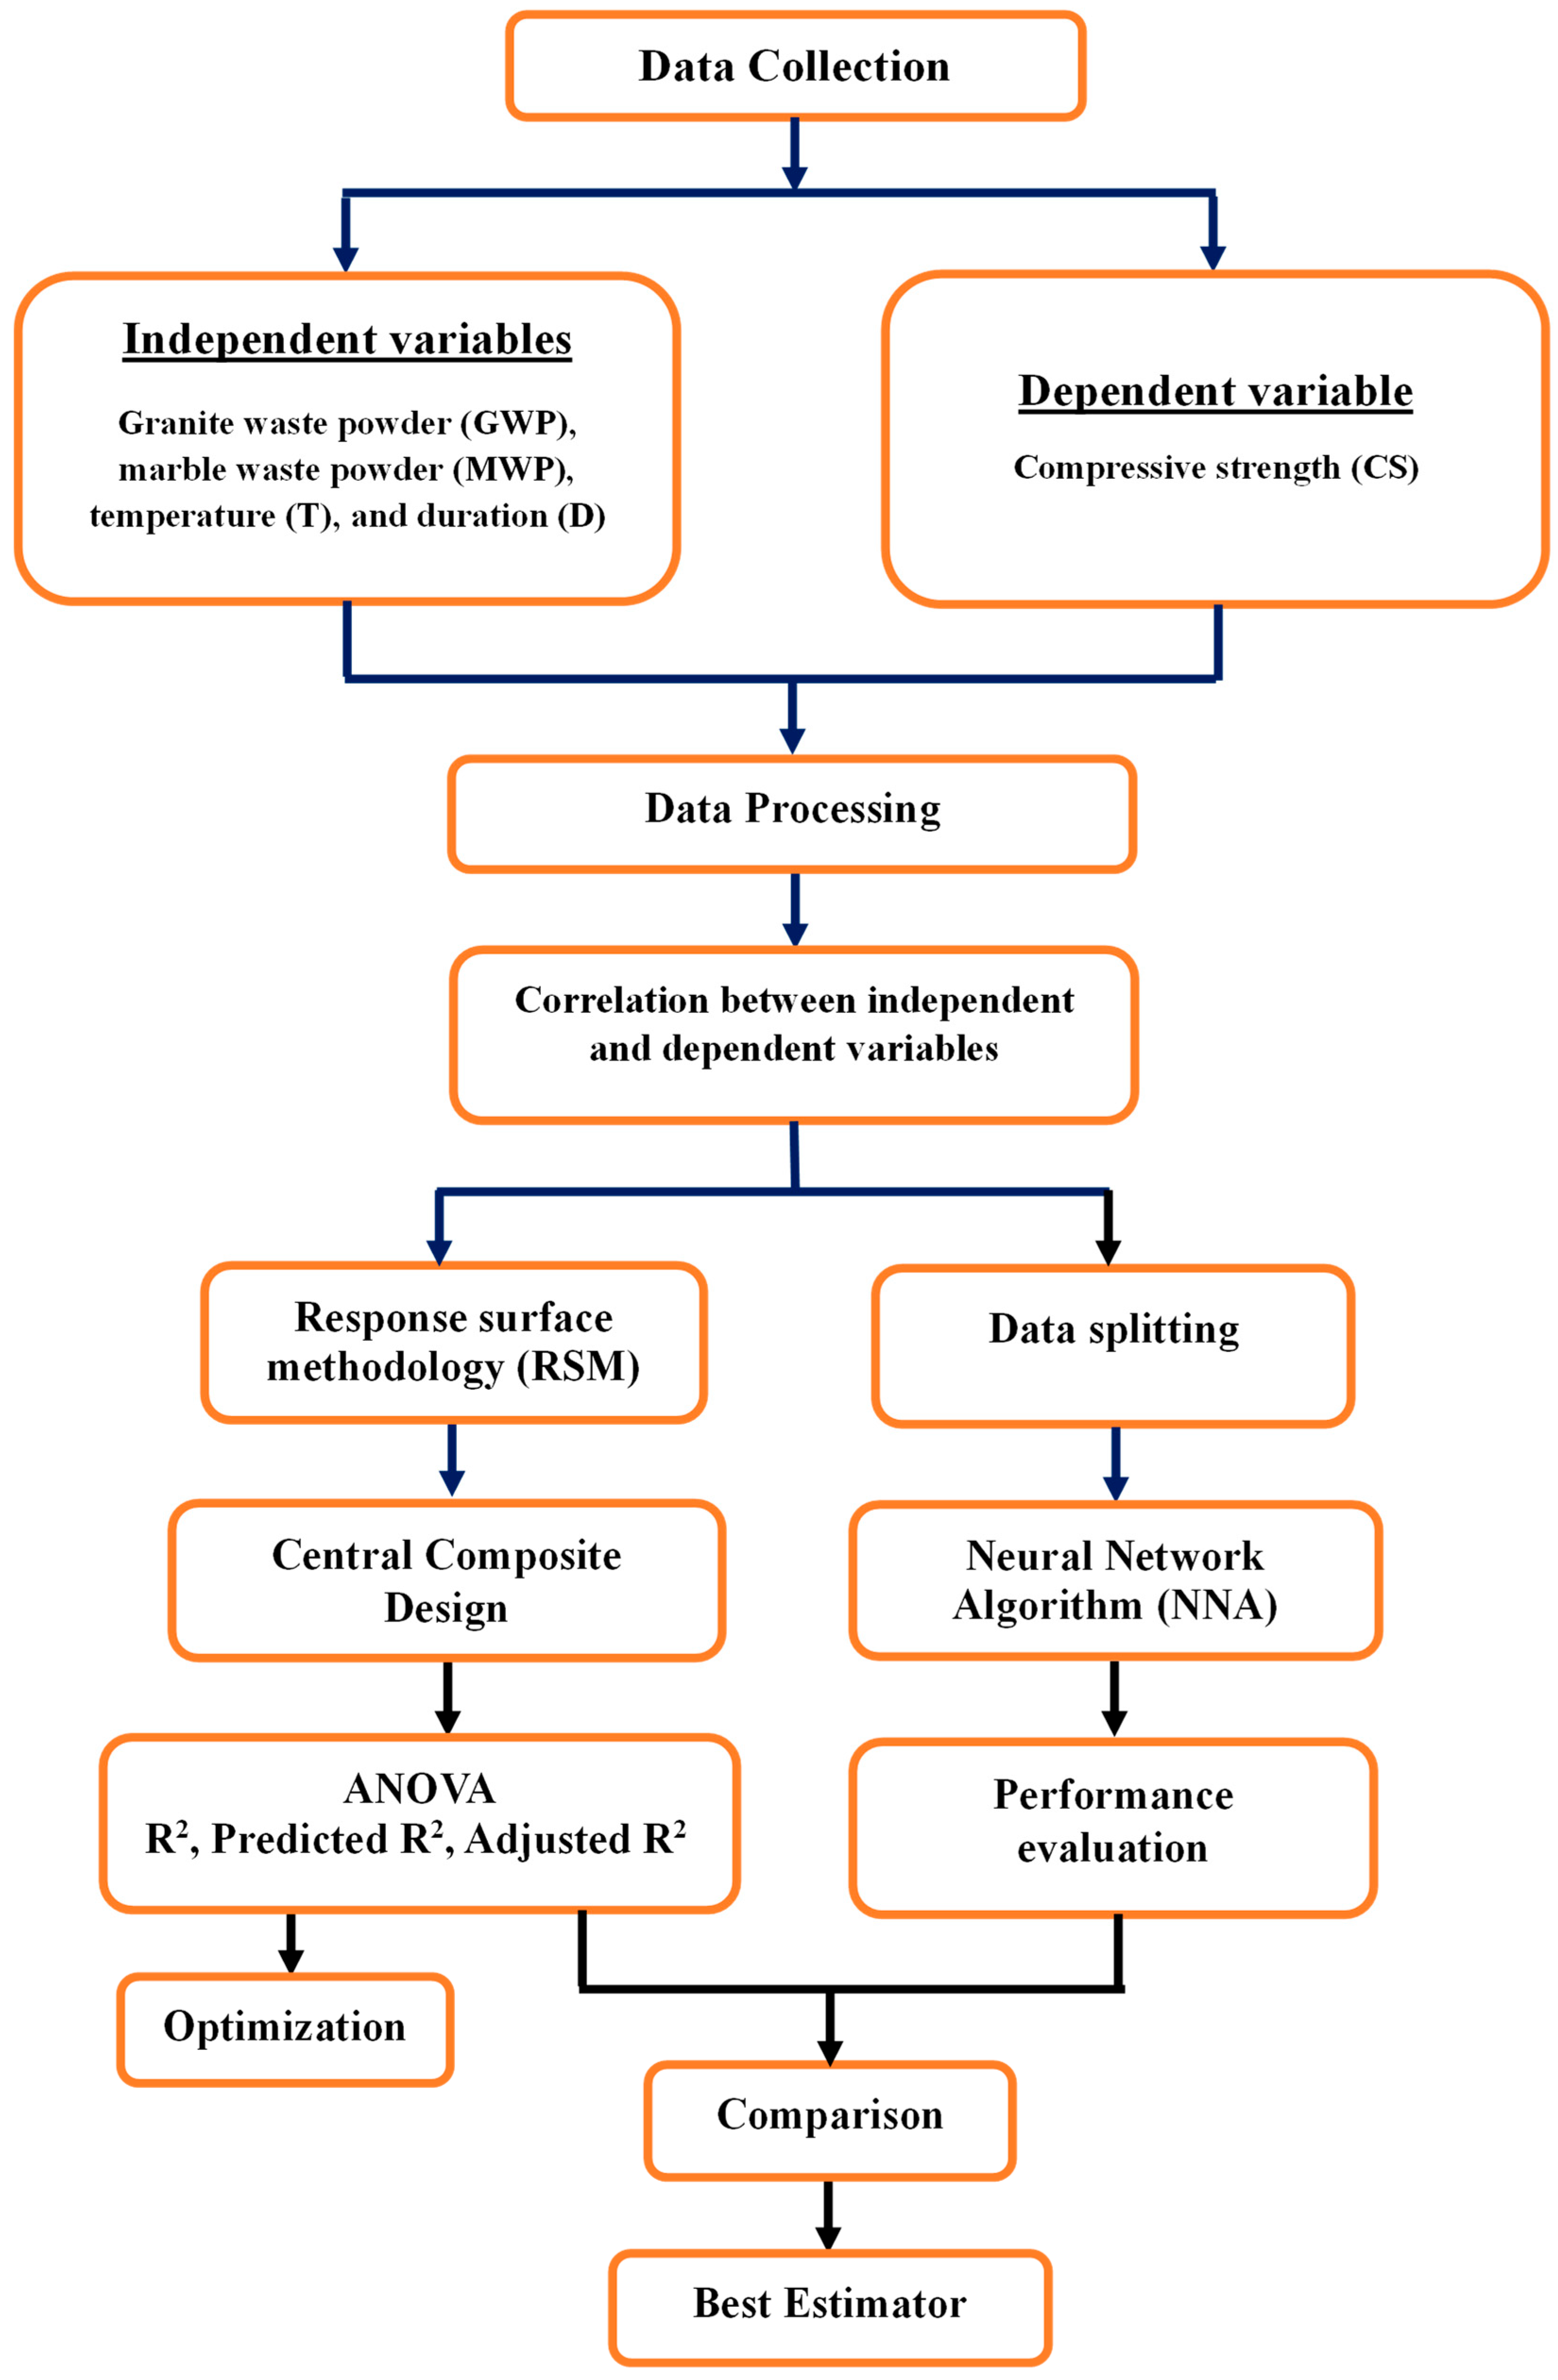
Figure 8 shows the methodology used in this study. The adopted research methodology integrates both experimental data analysis and advanced computational modeling approaches, combining Response Surface Methodology (RSM) and Neural Network Algorithm (NNA) to predict the compressive strength of concrete incorporating granite and marble waste powders under elevated temperatures. The investigation begins with a systematic Data Collection phase, where the independent variables—namely Granite Waste Powder (GWP), Marble Waste Powder (MWP), Temperature (T), and Duration (D)—are identified and varied to observe their effect on the dependent variable, Compressive Strength (CS). Following data acquisition, the Data Processing stage involves an initial analysis to determine the Correlation between these independent factors and the compressive strength, providing preliminary insights into their relationships. The core of the experimental design is structured around the Response Surface Methodology (RSM), specifically utilizing a Central Composite Design (CCD), to efficiently explore the variable space and model the response surface with a polynomial equation. This model is rigorously validated using ANOVA to assess statistical metrics such as R
2, Adjusted R
2, and Predicted R
2, ensuring its accuracy and predictive capability. To further enhance the modeling robustness, the dataset undergoes Data Splitting into training and testing sets. Alongside RSM, a Neural Network Algorithm (NNA) is employed to capture potential complex, nonlinear interactions between the input variables and the compressive strength that the RSM model might miss. The performance of both the RSM and NNA models is then subjected to a thorough Performance Evaluation, comparing their effectiveness in predicting the outcome. Subsequently, an Optimization process is conducted, likely using desirability functions or other numerical techniques, to identify the ideal combination of GWP, MWP, T, and D that maximizes compressive strength. The methodology culminates in a Comparison of the results from the RSM and NNA approaches, leading to the selection of the Best Estimator—the model that demonstrates superior predictive performance and reliability for determining the optimal conditions for achieving the highest compressive strength. This integrated approach ensures a robust analysis, leveraging the strengths of both traditional statistical design and modern artificial intelligence for a thorough investigation.
2.5. Data Statistics
Table 2 provides a comprehensive overview of the descriptive statistics for the key variables in the dataset (N = 310 for all), offering crucial insights into their central tendencies, variability, and distributional shapes. The data reveals that the mixture constituents, marble waste powder (MWP) and granite waste powder (GWP), were tested across their full potential range of 0% to 9%, with mean incorporation levels of 4.17% and 4.30% and nearly identical standard deviations of approximately 3.20, indicating a symmetric and widespread distribution of data points around the mean for both materials. The experimental conditions were severe, with Temperature (T) ranging from 25 °C to 800 °C (a 775 °C range) and a mean exposure of 436.45 °C, while the curing duration (D) spanned from 0 to 2 h with a mean of 1.32 h. The resulting compressive strength (CS) values exhibited a considerable range from 17.7 MPa to 39.4 MPa, with a mean strength of 30.72 MPa and a standard deviation of 5.07 MPa. Critically, the skewness and kurtosis statistics illuminate the nature of each variable’s distribution. The near-zero skewness values for MWP, GWP, and T (0.151, 0.106, and −0.025, respectively) suggest highly symmetrical distributions. In contrast, the negative skewness for duration (−0.47) and, more notably, for compressive strength (−0.63) indicates a distribution where the data is slightly pulled towards the higher end, meaning a clustering of values above the mean. Furthermore, the negative kurtosis values for all variables (ranging from −1.37 for MWP to −0.45 for CS) consistently describe platykurtic distributions that are flatter and more dispersed than a normal distribution, implying a lower peak and lighter tails, which reduces the likelihood of extreme outliers and suggests a broader, more uniform spread of data across the tested ranges.
2.6. Response Surface Methodology (RSM)
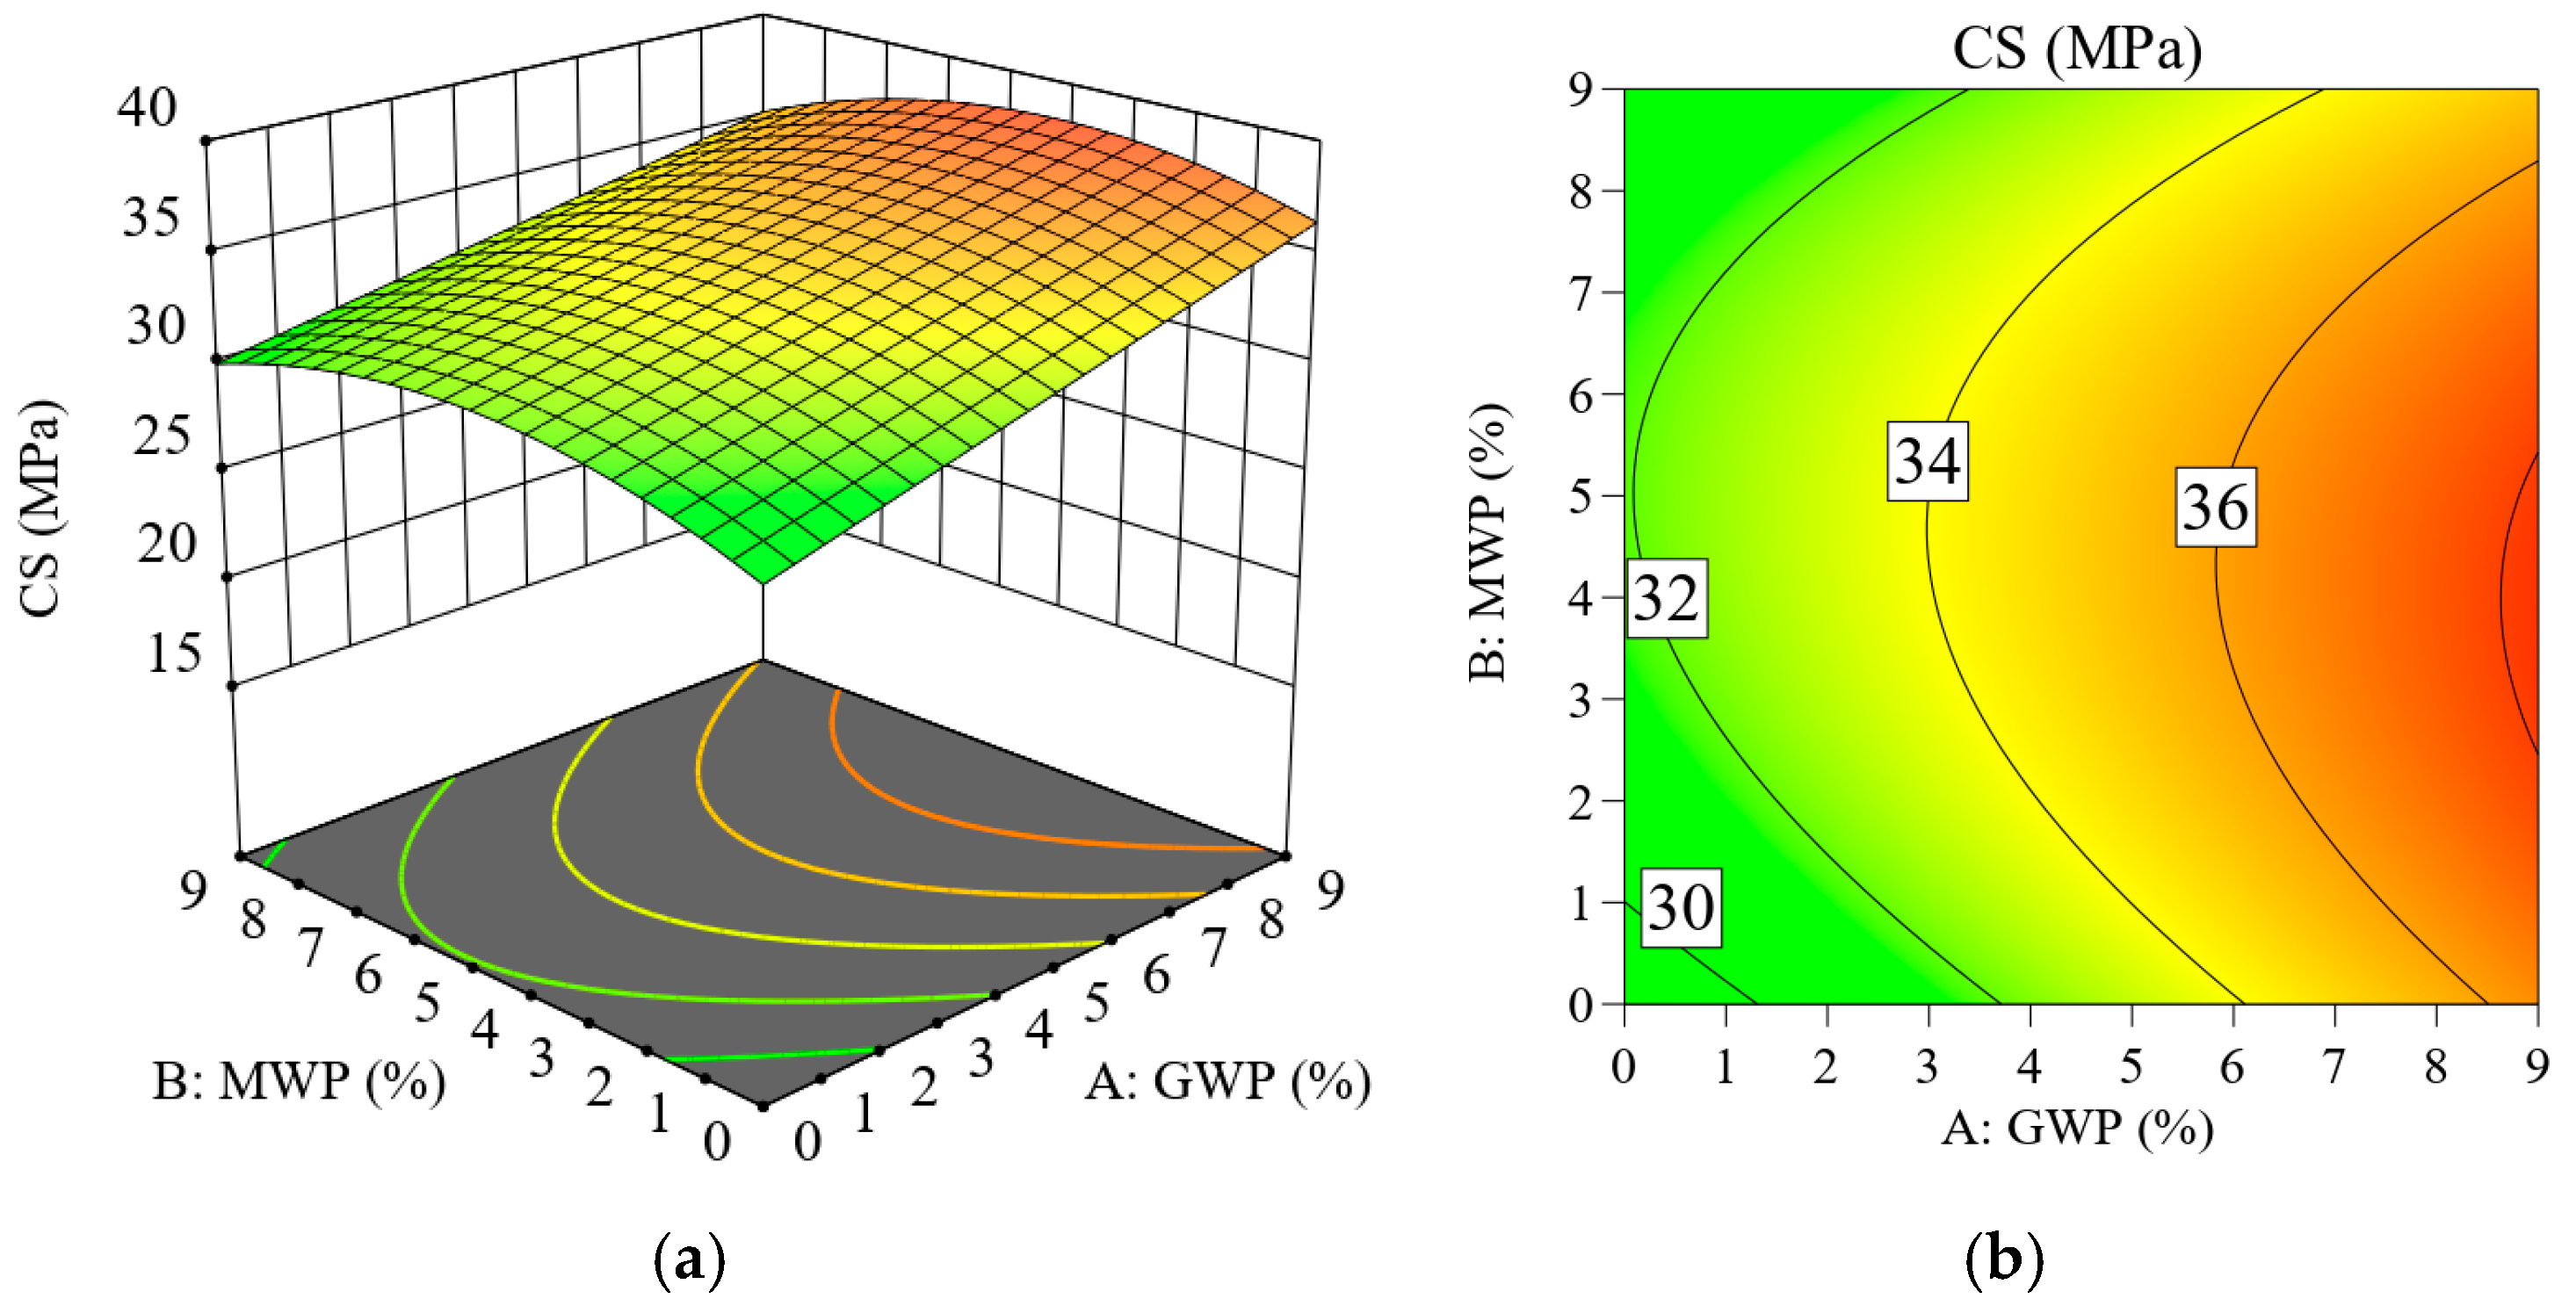
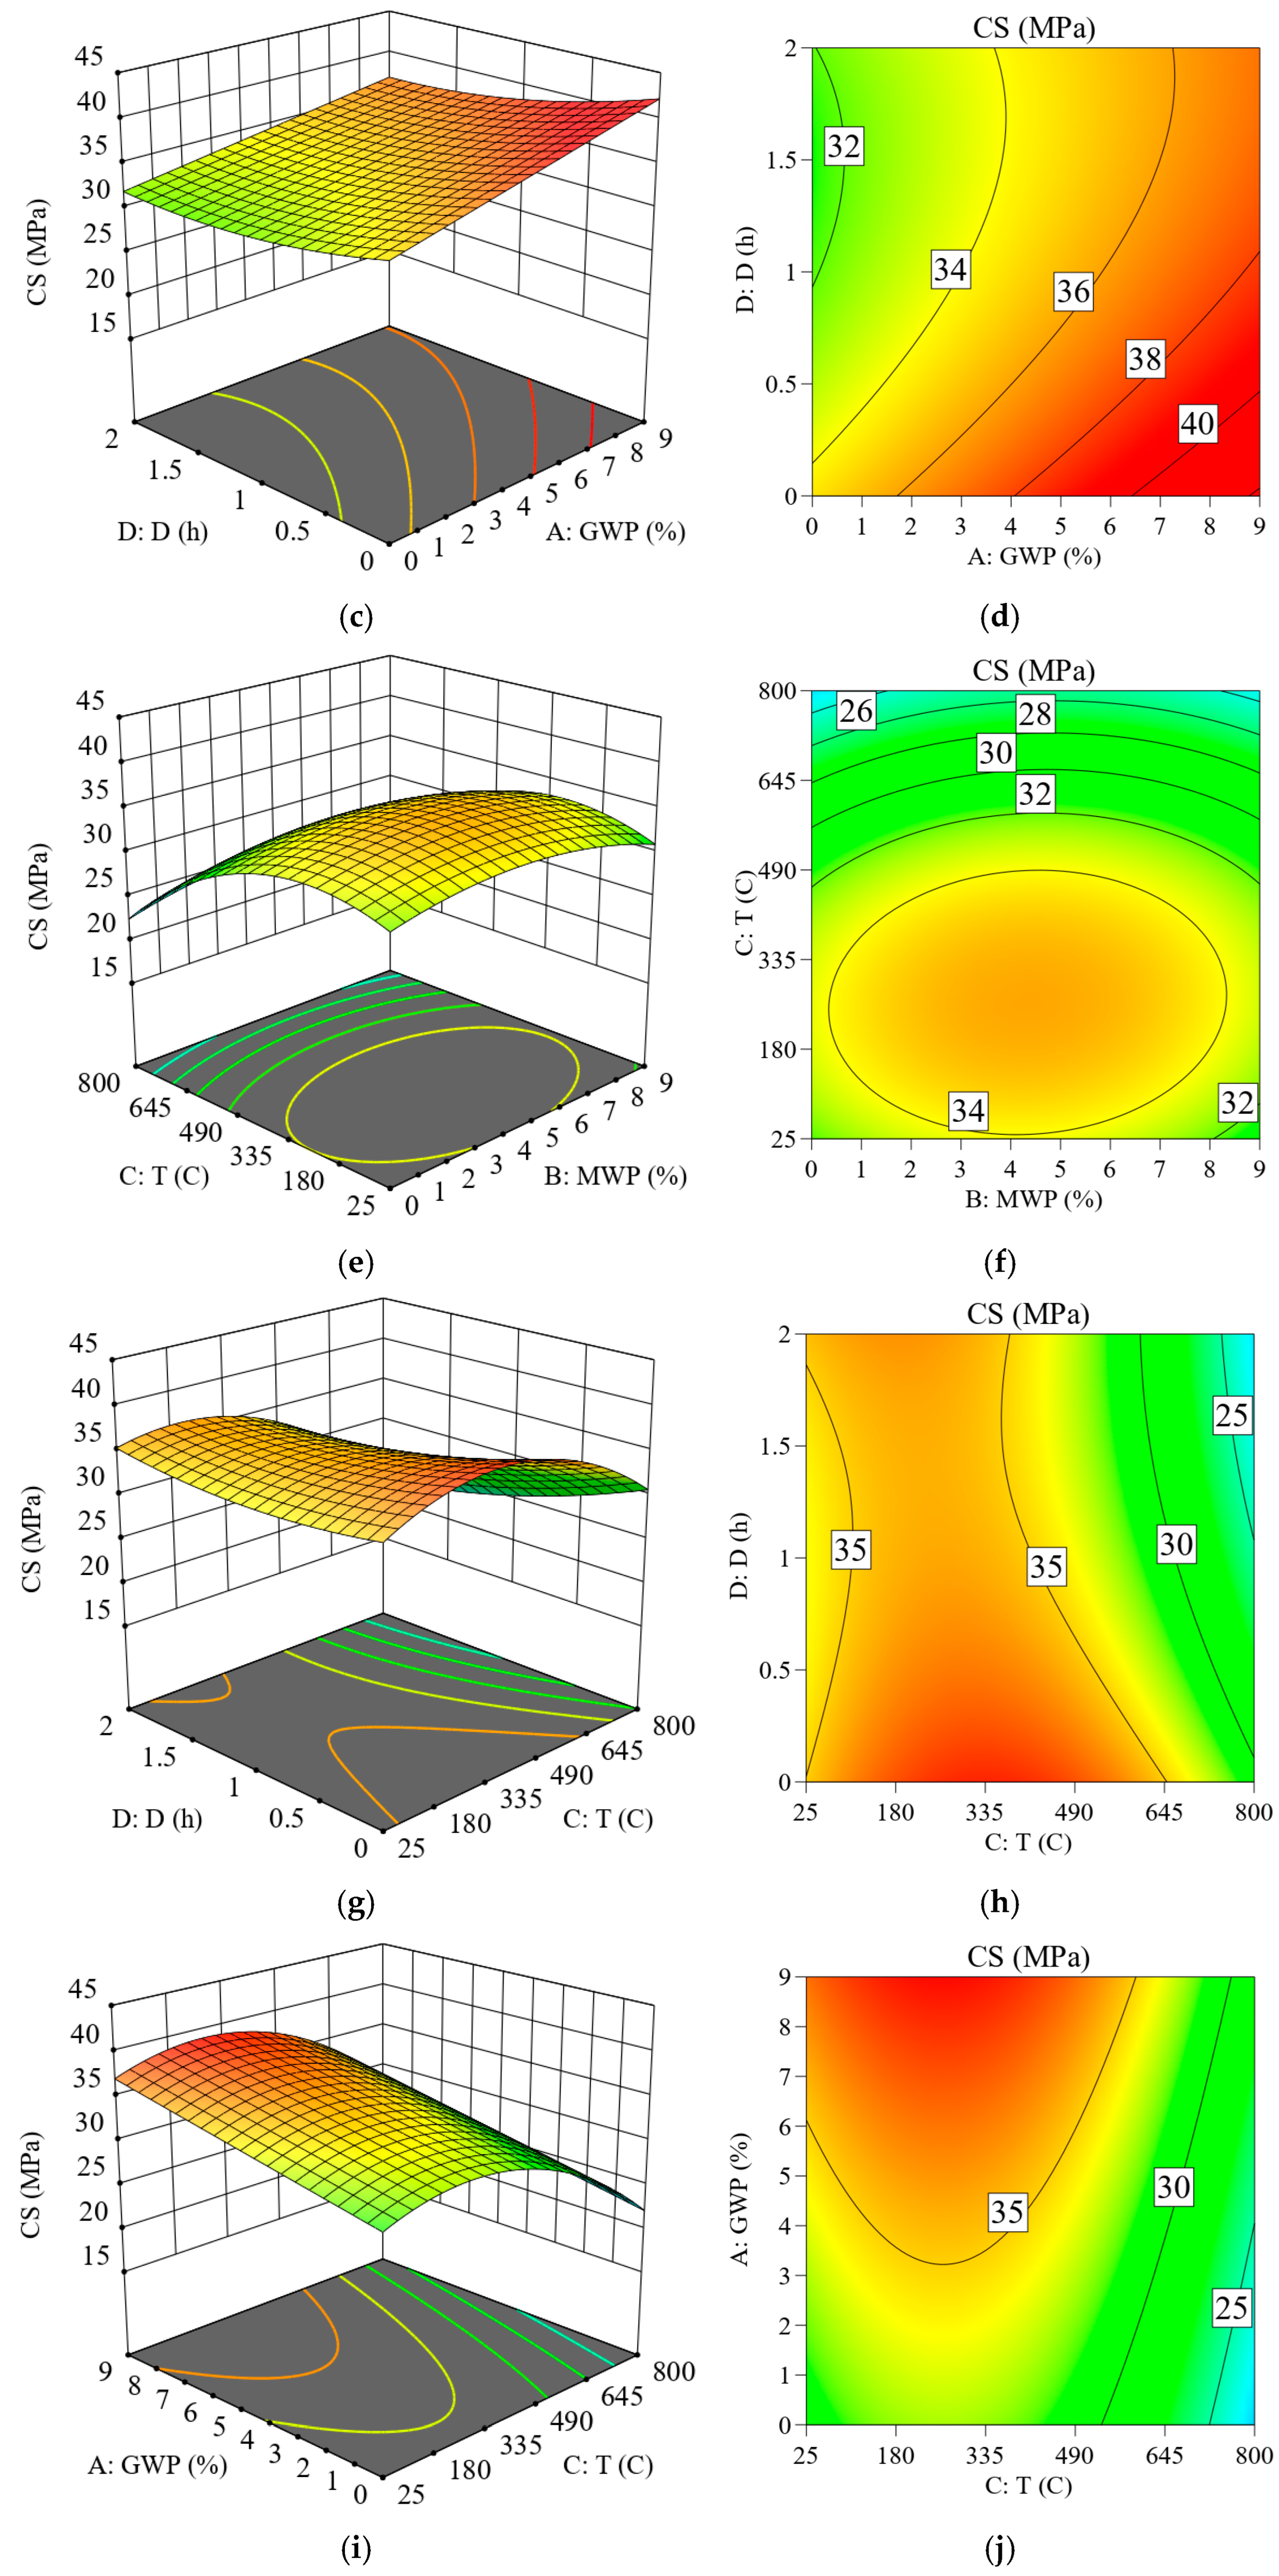
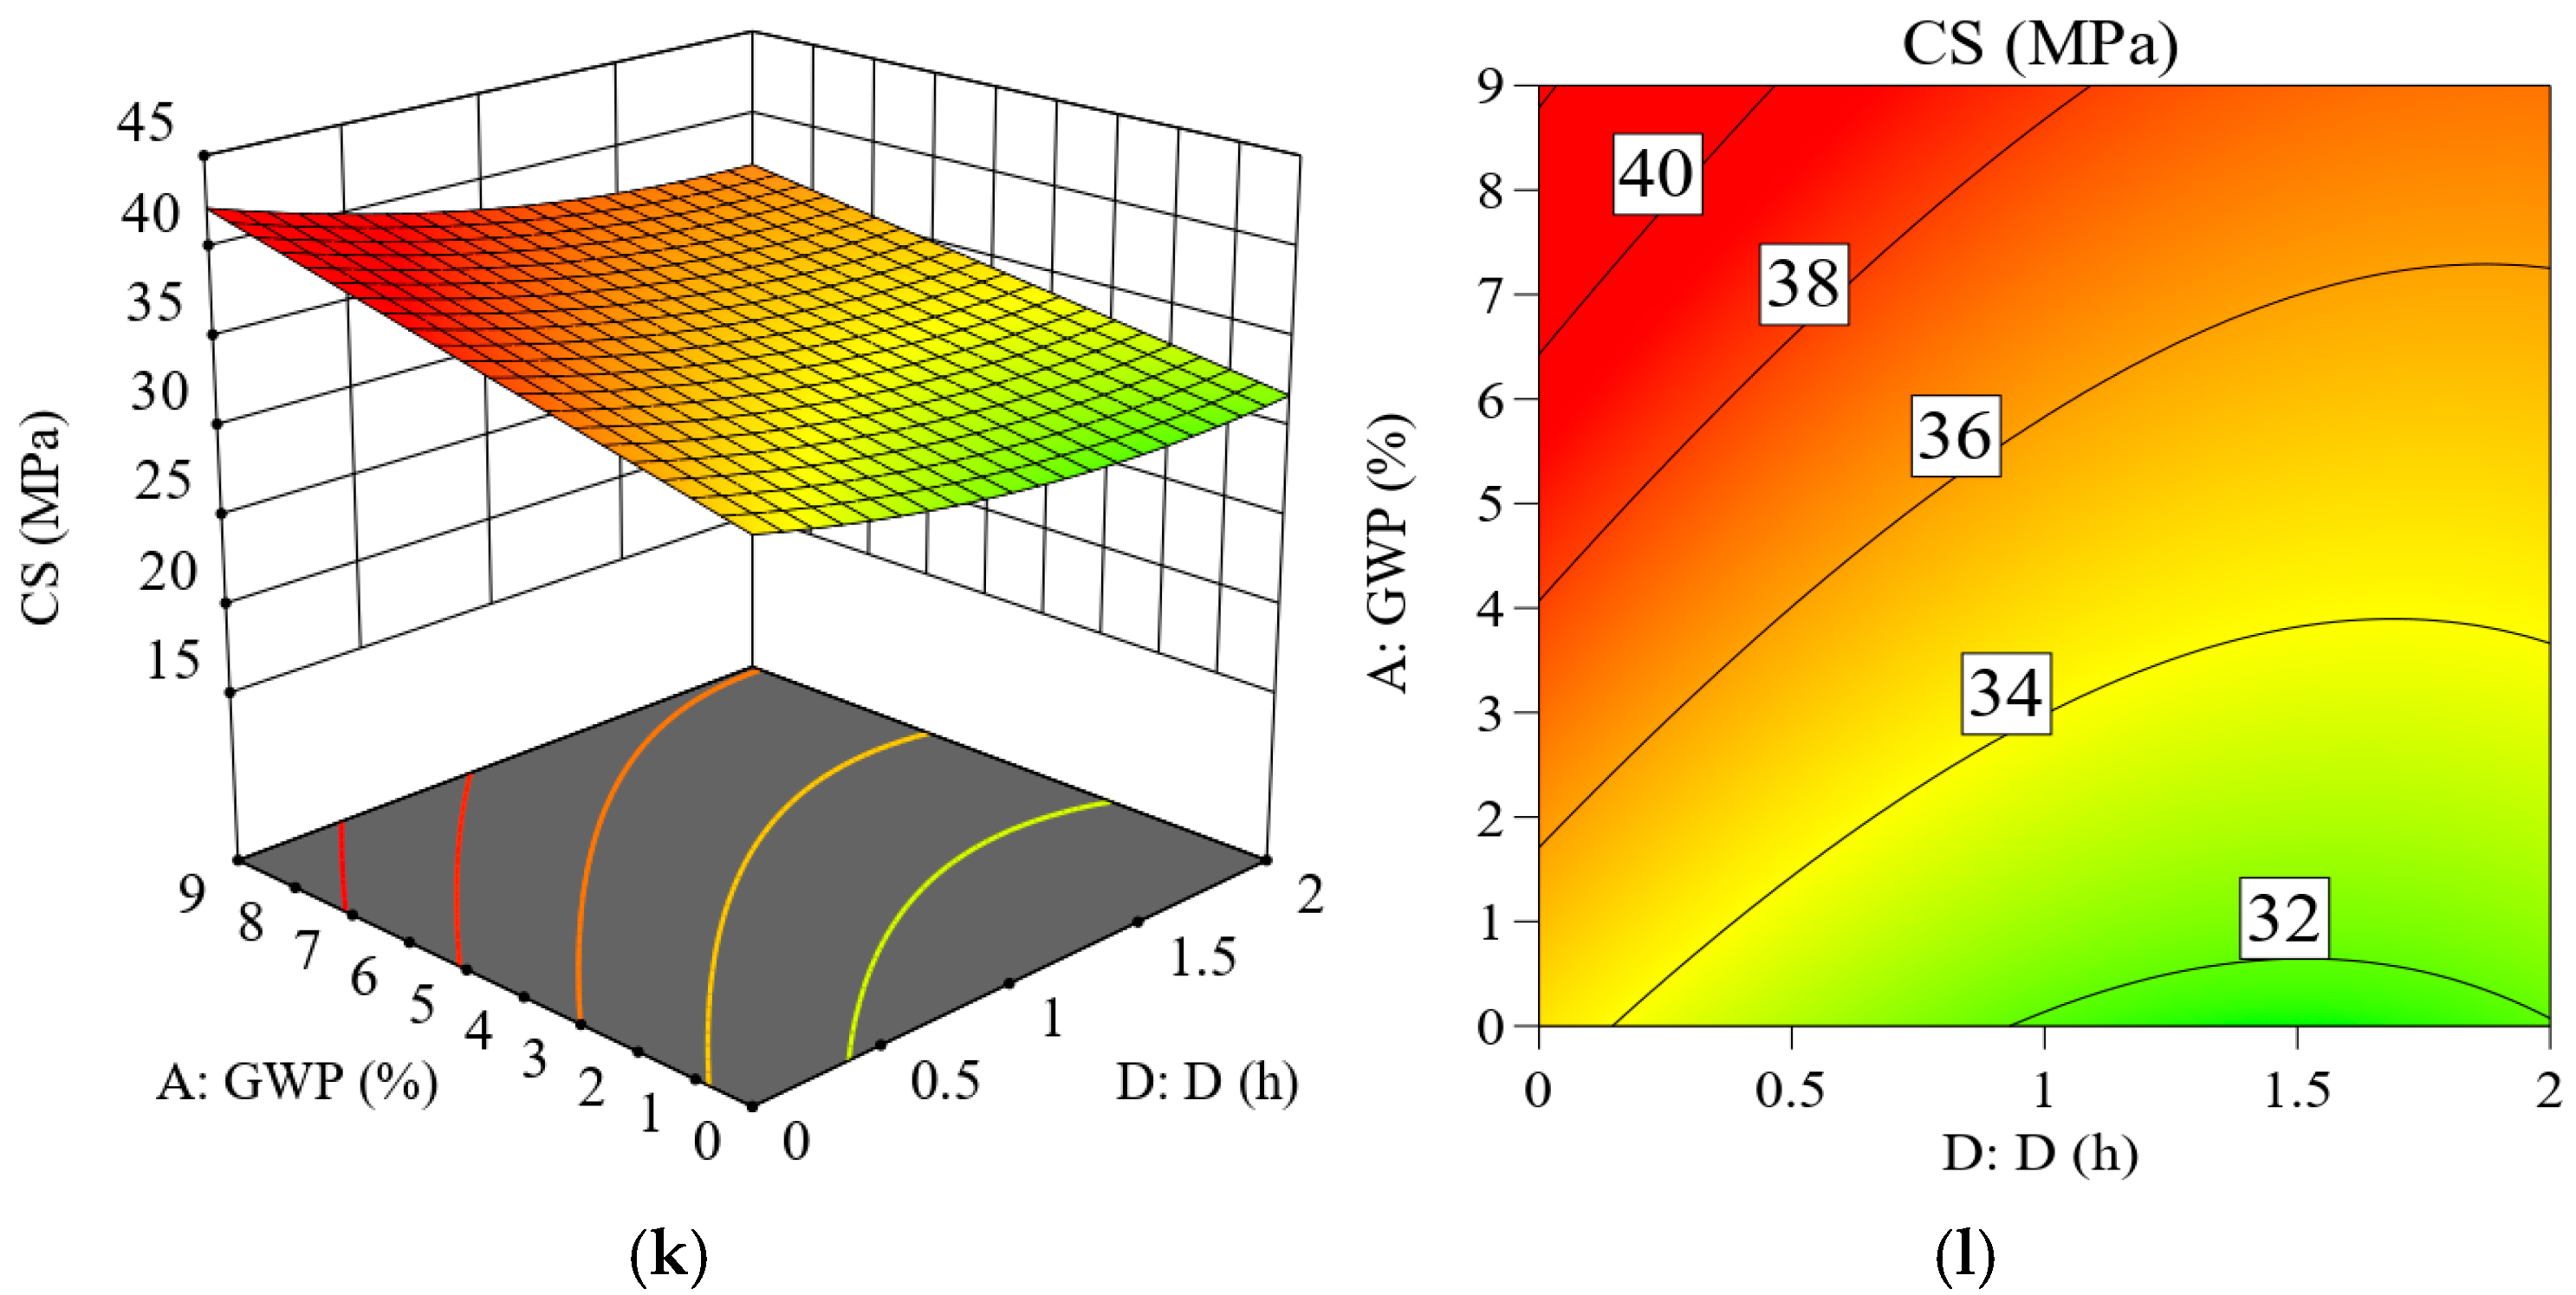
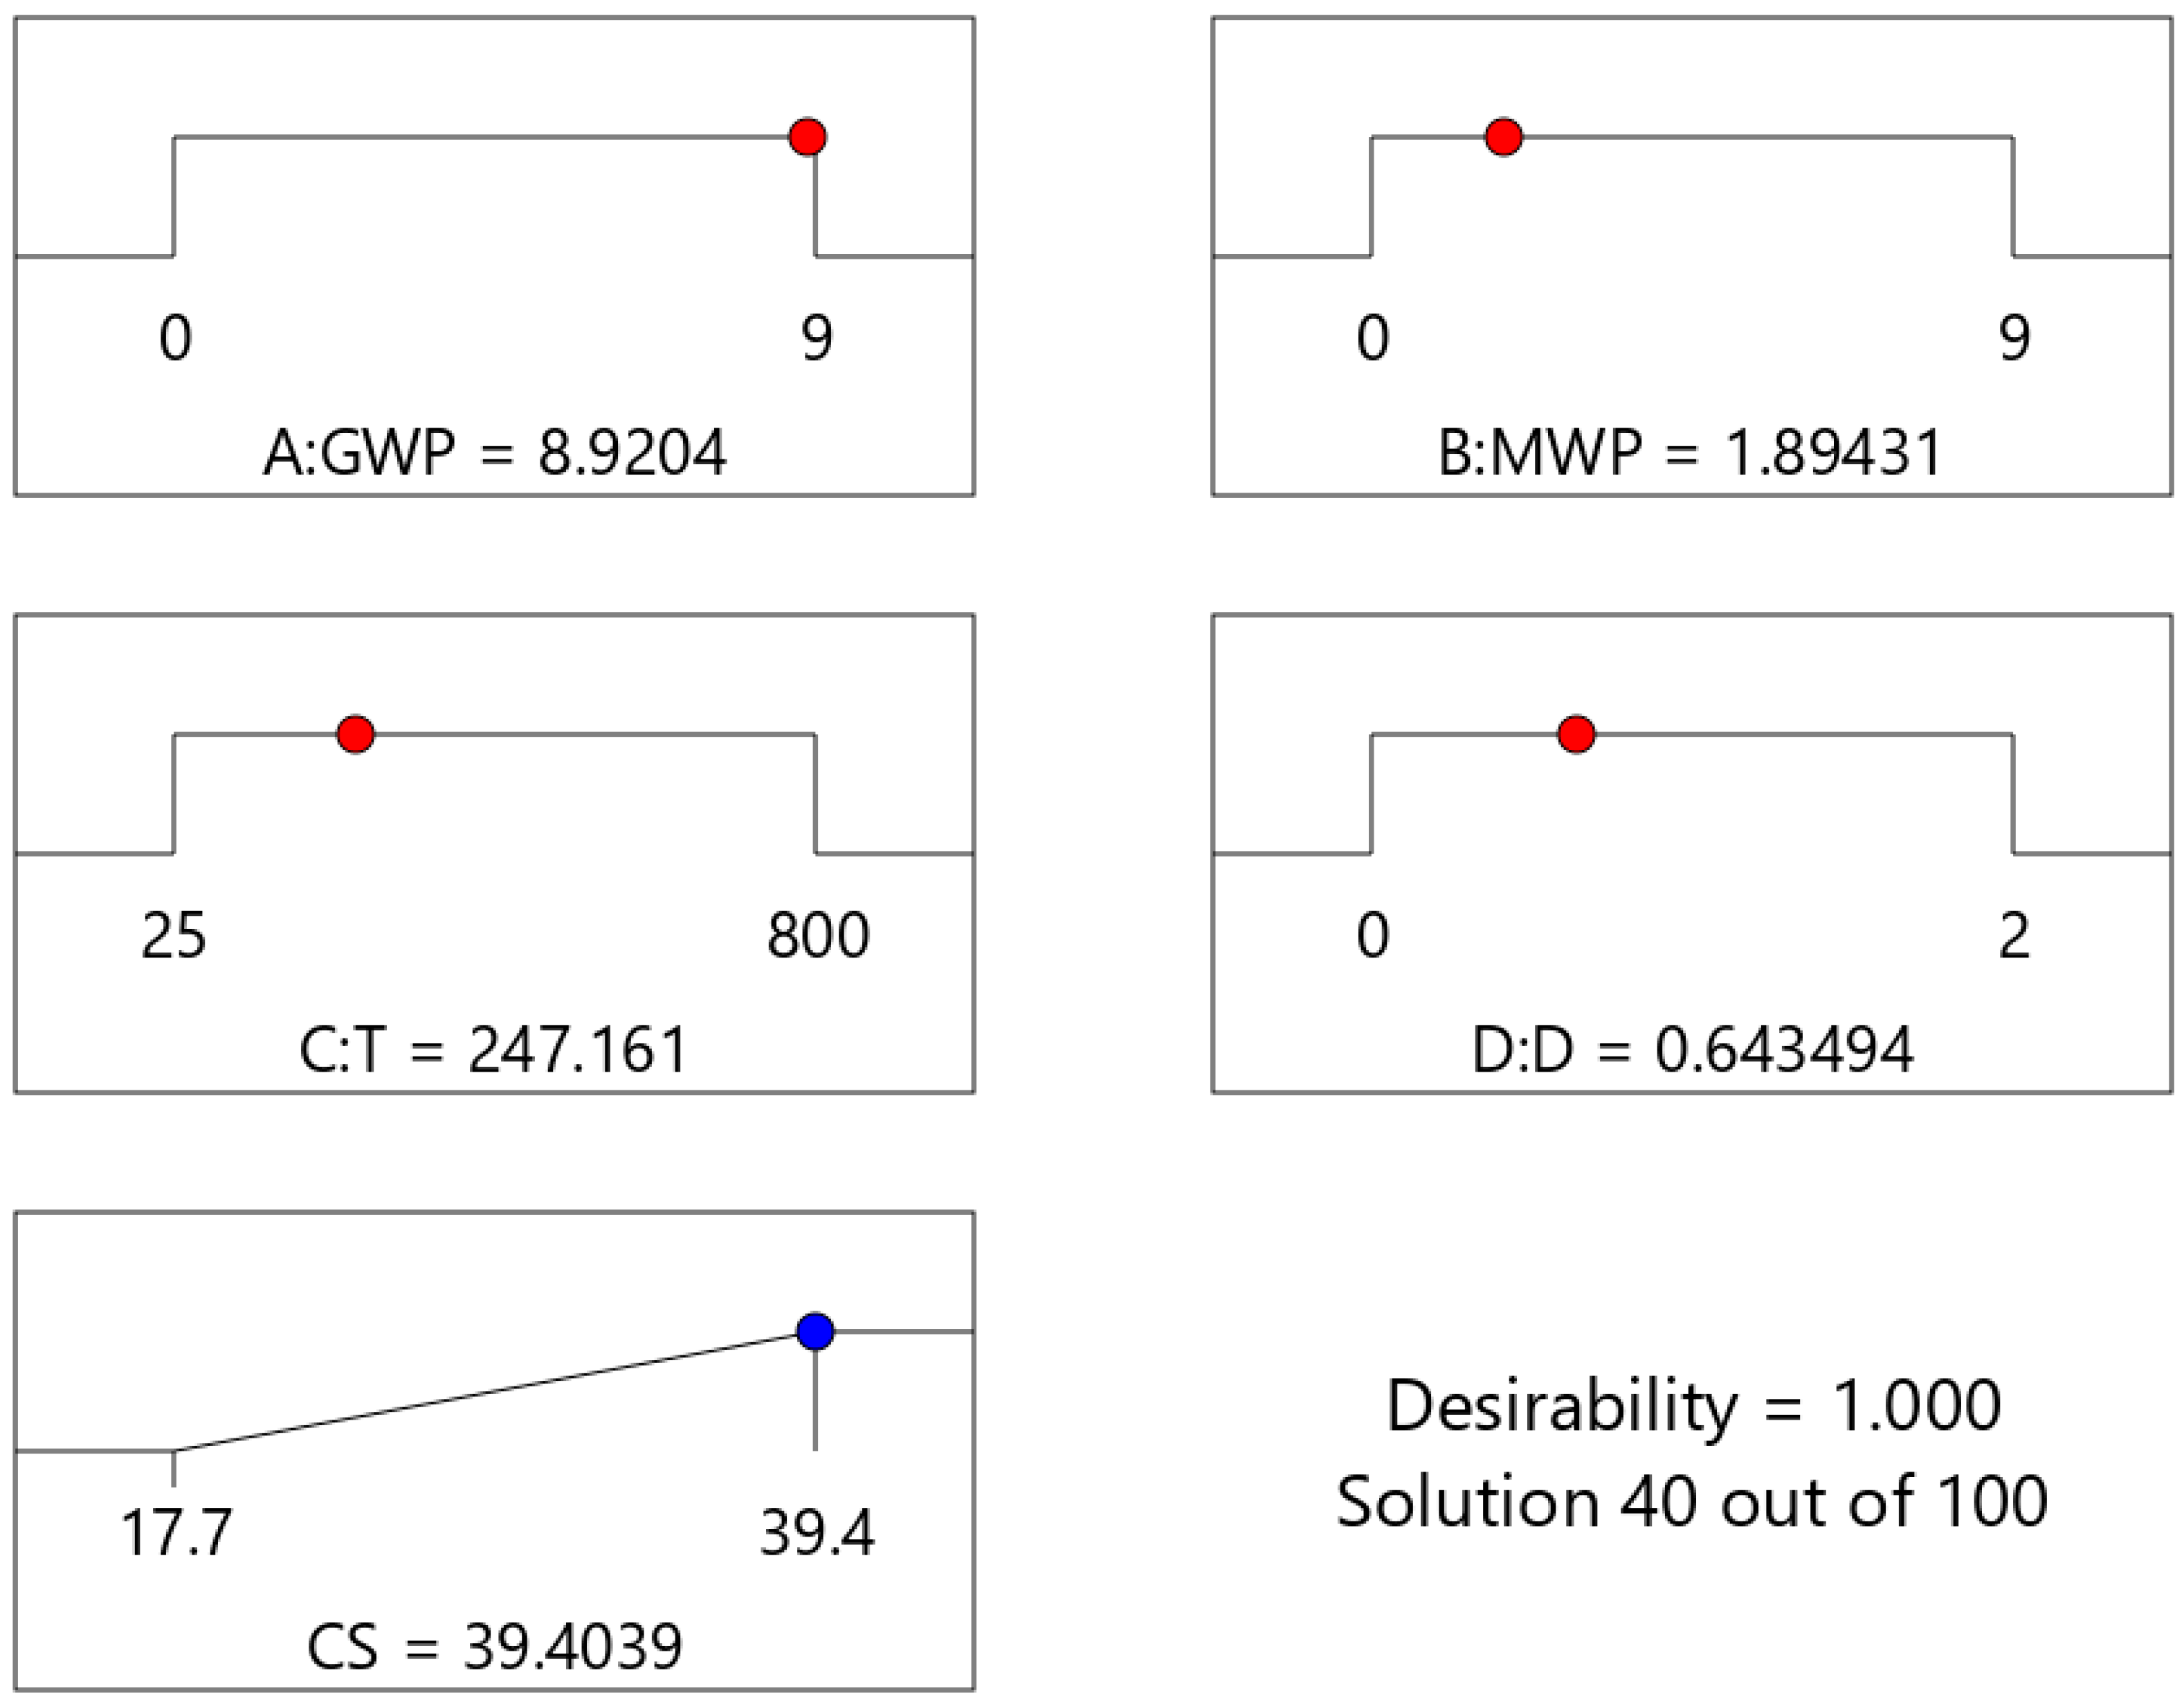
RSM, specifically using a central composite design (CCD), was utilized to develop models for predicting the compressive strength of concrete samples incorporating MWP and/or GWP. RSM was employed to investigate the impacts of inclusion of these wastes in concrete on its strength when exposed to high temperatures utilizing Design-Expert software (Version 13). The used models were linear when the curvature did not exist or polynomials of higher degree when curvature was present. The general formulas for linear and quadratic models are presented in Equations (1) and (2). The optimization in RSM was employed by maximizing the response and using the values in ranges for all independent parameters.
where R is the response, r
0 is the intercept, r
i is the variable coefficient, X
i and X
j are the inputs, i and j are the coded values of input, n is the number of inputs, and the error is ε.
2.7. Neural Network Algorithm (NNA)
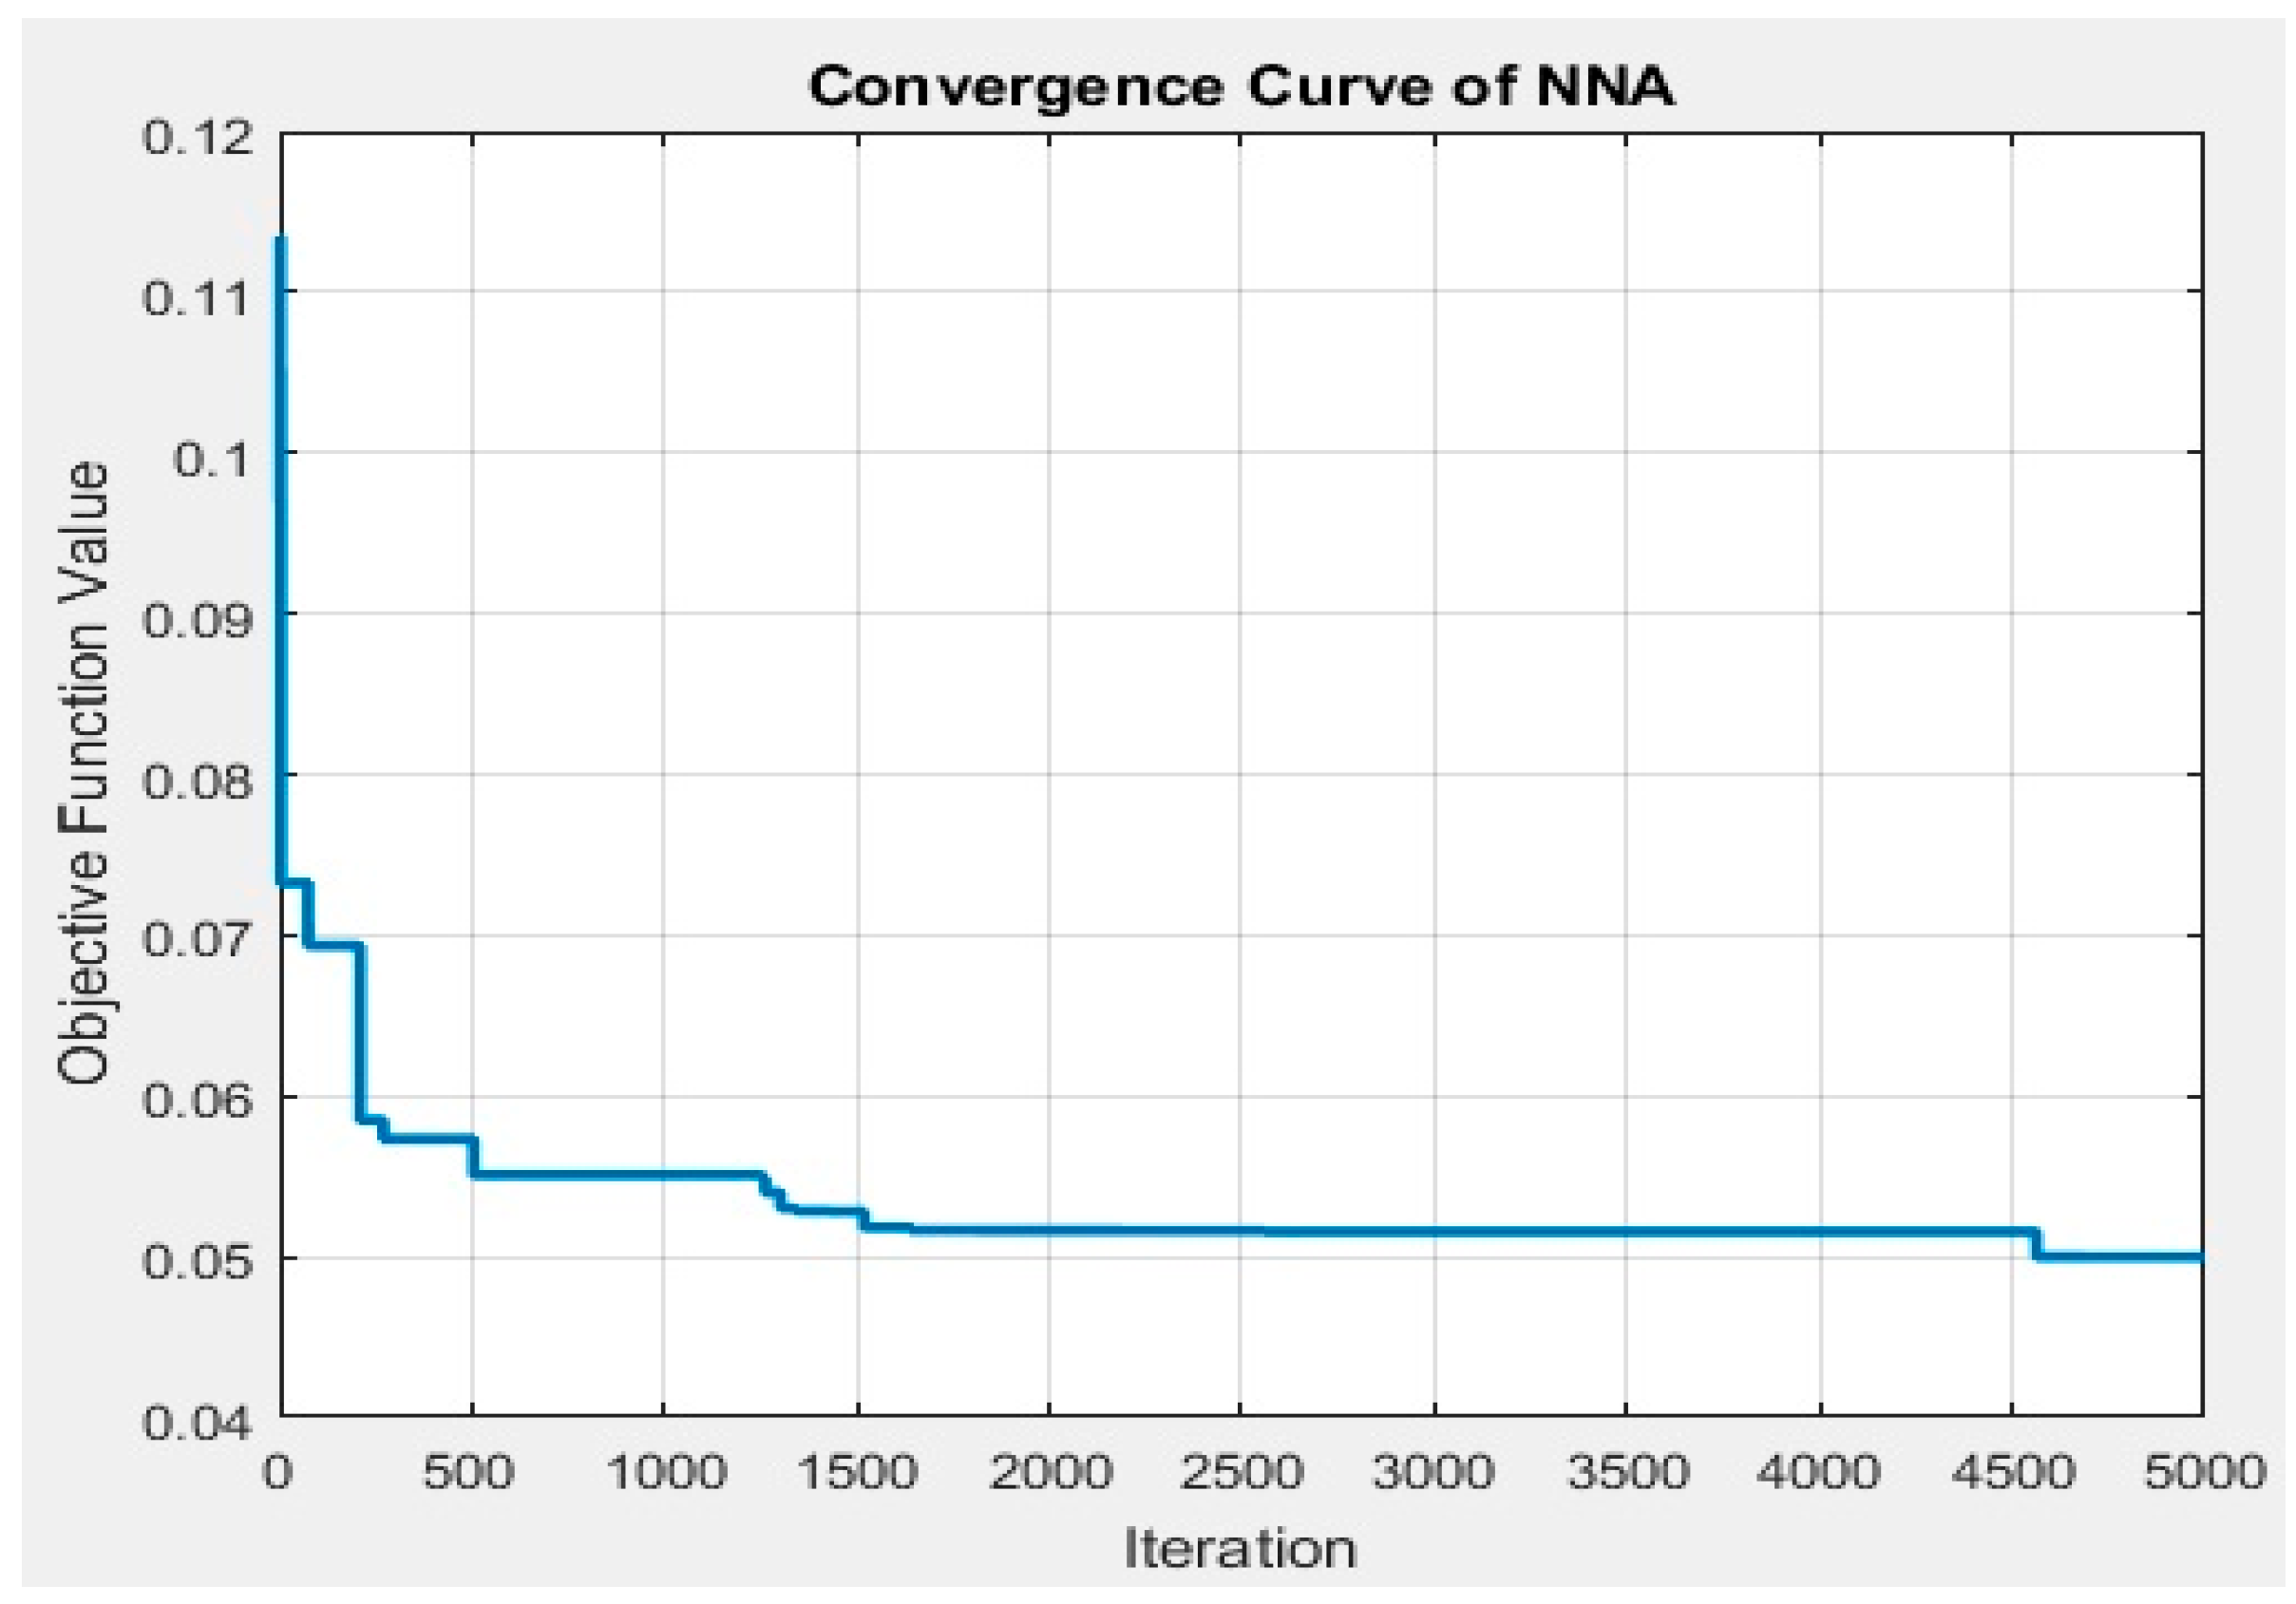
As mentioned earlier, NNA is a population-based metaheuristic optimization technique inspired by the information-processing mechanisms of biological neural systems. Its practical implementation follows a systematic workflow that begins with problem formulation, where the decision variables, objective function, associated constraints, and permissible bounds of each variable are clearly defined. Once the problem is set, the algorithm is initialized by specifying the population size and the maximum number of iterations, after which an initial population of random candidate solutions is generated. During each iteration, the objective function and constraint violations of all solutions are evaluated, and the best solution is designated as the Target Solution. The algorithm employs a weight matrix to mix and update the solutions through iterative learning, where new candidate solutions are generated by combining existing ones according to adaptive weights. Two key operators of the transfer function and the bias operator are then applied where the transfer function guides solutions toward the target, while the bias introduces controlled randomness to maintain diversity and avoid premature convergence. The bias gradually decreases across iterations to enhance convergence toward the optimal solution while preserving exploration in earlier stages. Solutions are subsequently classified into feasible and infeasible groups, with feasible ones prioritized, and the best subset is retained to form the new population. This iterative process continues until the stopping criterion is satisfied, typically when the maximum number of iterations is reached or the solutions converge. In this work, NNA was integrated with a customized cost function (COST), where each candidate solution represents a structural combination of transformed input variables. For every solution, the COST function fits a simple linear regression (scaling with coefficients α and β) between the generated feature and the observed compressive strength (CS), computing the root mean square error (RMSE) as the fitness value. The algorithm iteratively minimizes this RMSE, thereby identifying the most suitable mathematical form to predict CS with high accuracy. The final outputs of the NNA include the optimum values of the decision variables, the corresponding minimum (or maximum) value of the objective function, and the degree of constraint satisfaction, often illustrated by convergence curves. This hybrid approach combines the global search ability of NNA with the analytical fitting strength of regression to achieve reliable predictive models.
The application of NNA in this study begins with the definition of the problem where the decision variables are the key experimental factors, namely temperature, exposure time, WGP replacement ratio, and WMP replacement ratio, while the sole output is the measured CS. The dataset of 324 experimental records serves as the search space in which candidate solutions are represented as neurons within the algorithm. During each iteration, NNA evaluates the prediction error associated with the current solutions, selects the best-performing solution as the Target Solution, and updates the remaining candidates using its transfer function and bias operators, thereby ensuring a balance between exploitation of promising regions and exploration of new possibilities. Feasible solutions are prioritized based on their accuracy in minimizing prediction error, while infeasible ones with higher deviations are gradually eliminated. The iterative process continues until convergence or until the maximum number of iterations is reached, resulting in an optimized predictive model for CS.
For consistency and improved performance of the developed AI models, it is crucial to scale the study’s inputs and outputs with varying ranges to a uniform range [
42]. Accordingly, to ensure optimal predictive accuracy of the NNA model, data scaling was applied to the dataset used in the present study. This preprocessing step was essential to normalize the independent variables, including temperature, exposure time, waste marble content, and waste granite content, within a consistent range of [0.1–0.9], thereby enhancing the model’s learning efficiency and ensuring that all input features contribute equally to the prediction process. Such normalization ensures that all features contribute proportionally during the learning process, preventing variables with larger magnitudes from dominating the optimization and biasing the model’s outcomes [
43]. In addition, scaling enhances the numerical stability of the computations, accelerates the convergence of gradient-based optimization, and mitigates issues of overflow or underflow that may arise during iterative updates. It also ensures consistent regularization and comparability among model coefficients. By applying this scaling procedure, the developed model can achieve smoother training dynamics, faster convergence, and improved predictive accuracy, thereby enhancing the reliability and robustness of the established compressive strength prediction relationship. The used scaling (normalization) equation, proposed by Sobhani et al. (2010) [
44] is shown in Equation (3):
where i represents the raw data, Sᵢ denotes the scaled (normalized) data, and iₘₐₓ and iₘᵢₙ correspond to the maximum and minimum values of the raw data, respectively. The normalization process ensures that the data fall within the same range, facilitating fair comparison and stable model training.
2.8. Evaluation Metrics for Developed Models
The predictive performance of both the NNA and SRM models was assessed using several well-established statistical evaluation metrics, including the coefficient of determination (R
2), mean absolute error (MAE), mean absolute percentage error (MAPE), and root mean square error (RMSE). These measures collectively provide a comprehensive assessment of the models’ accuracy, reliability, and predictive capability. The mathematical formulations of these metrics are presented in Equations (4)–(7). Generally, higher R
2 value and lower MAE, RMSE, and MAPE values indicate stronger predictive performance and closer agreement between the experimental and model-predicted results.
4. Model Performance Evaluation and Comparative Analysis
Based on the statistical metrics presented in
Table 5, a clear hierarchy of model performance emerges, with the Quadratic model demonstrating superior predictive accuracy and reliability for forecasting compressive strength. The Linear model, while providing a foundational understanding with a respectable R
2 of 0.7703, exhibits significant predictive errors, as indicated by its high MAE (1.9098 MPa), RMSE (2.4253 MPa), and MAPE (6.71%). These substantial error metrics suggest that the relationship between the input variables and compressive strength is too complex to be adequately captured by a simple linear function, leading to less precise estimations. In stark contrast, the Quadratic model shows exceptional performance, achieving a near-perfect R
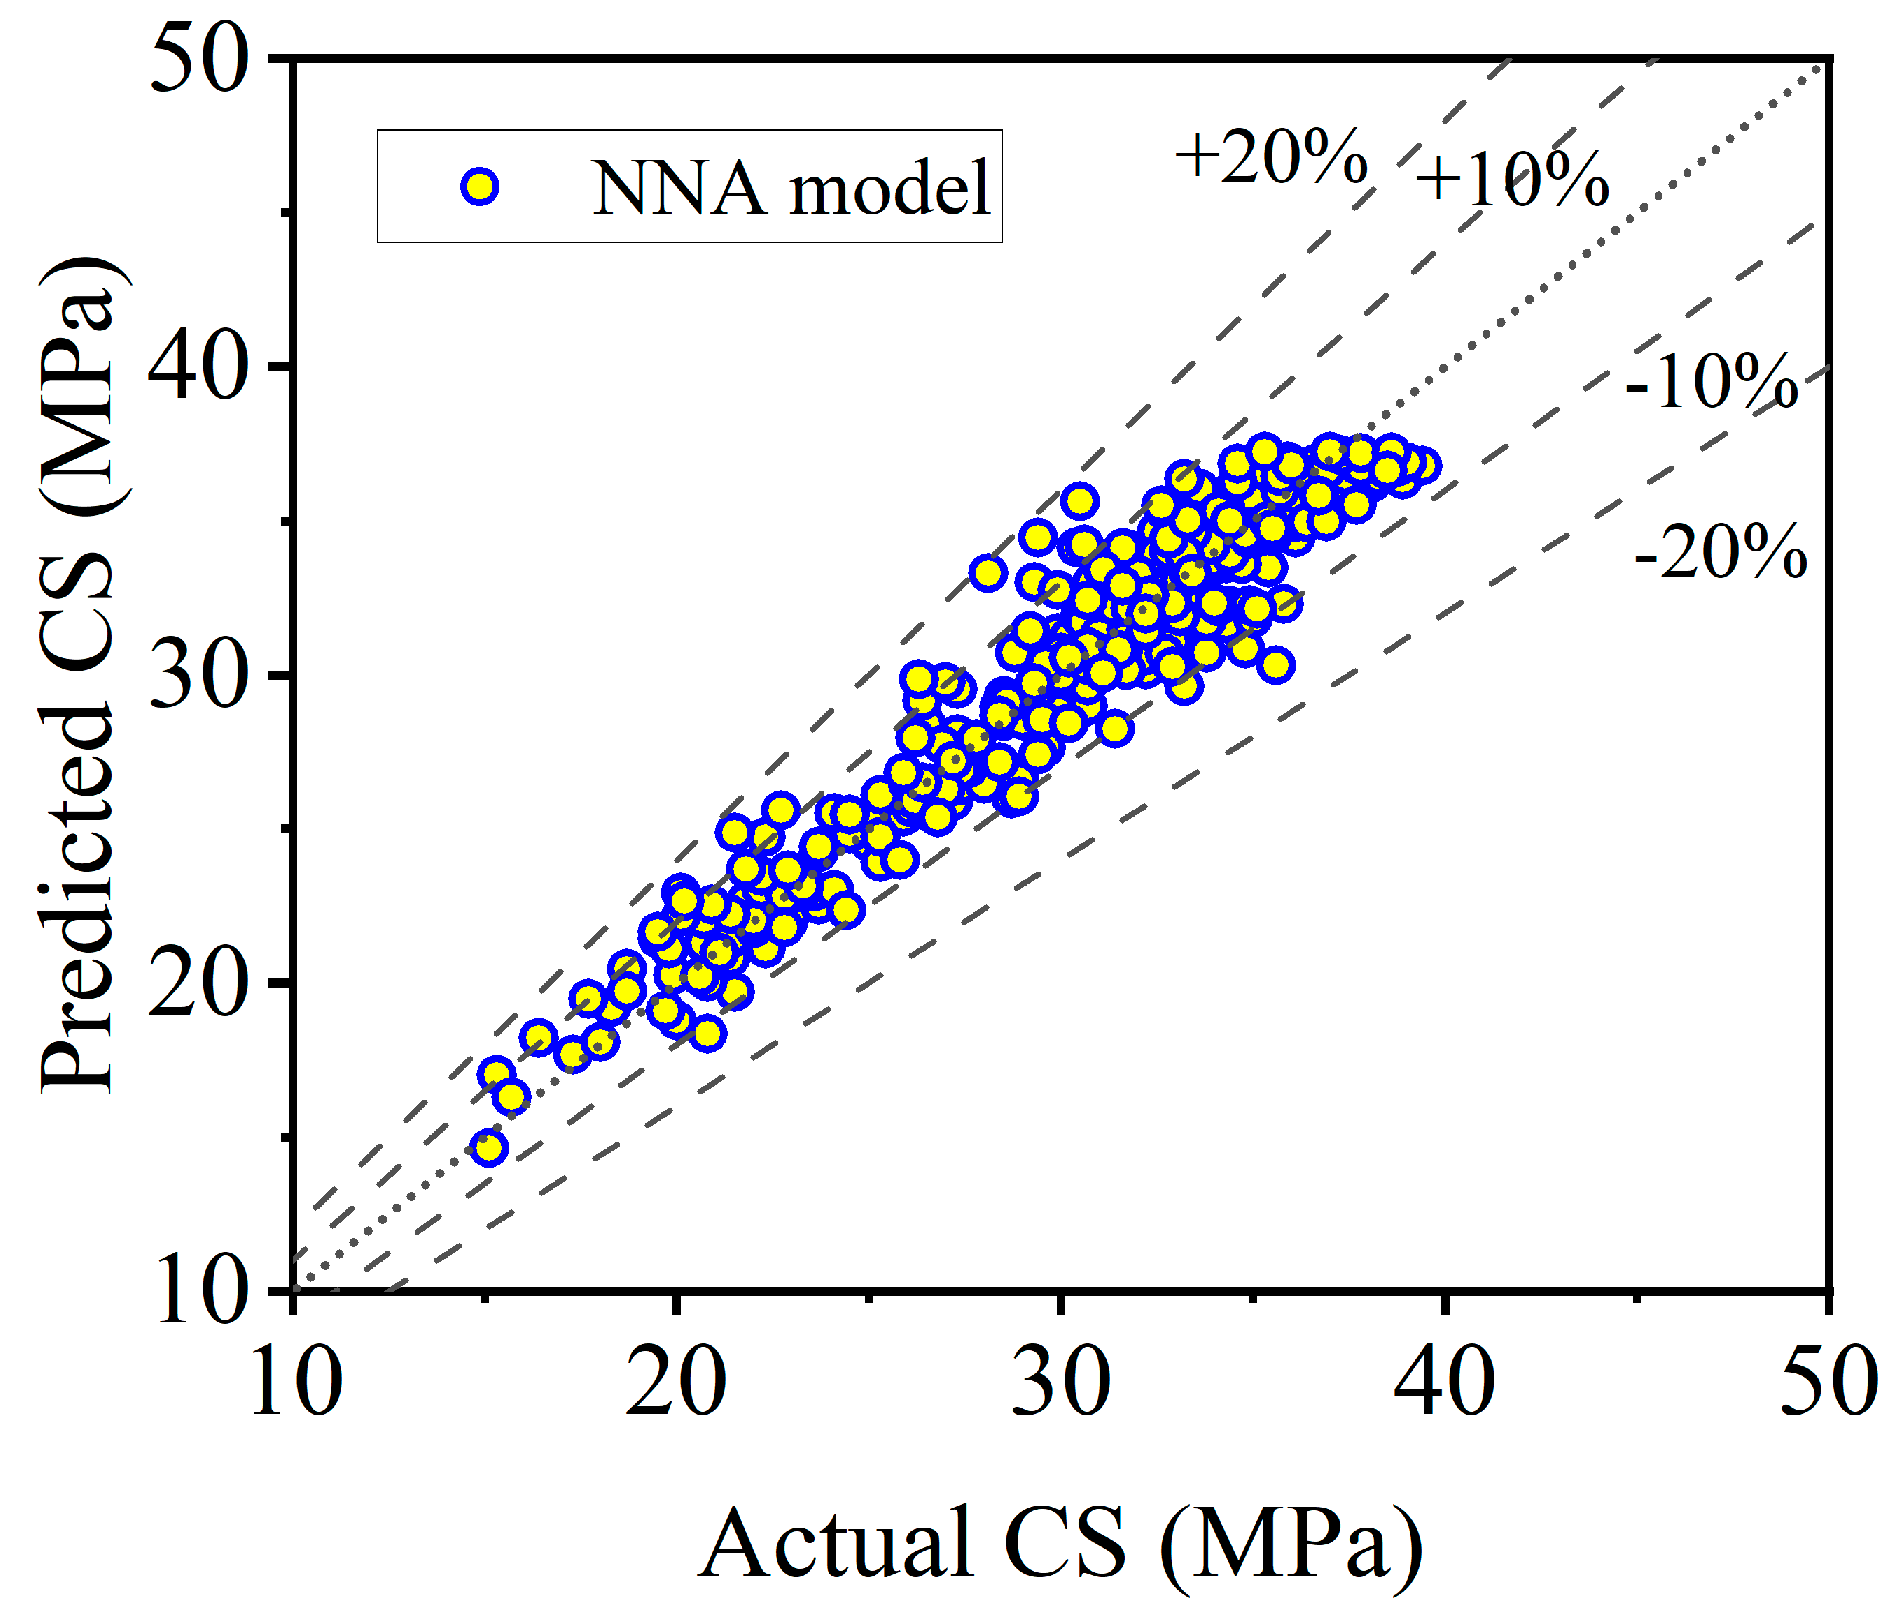
2 value of 0.9806, which signifies that over 98% of the variance in compressive strength is explained by the model. This is further corroborated by its remarkably low error values—an MAE of 0.5876 MPa, an RMSE of 0.7235 MPa, and a MAPE of just 2.00%—collectively indicating that its predictions are, on average, highly accurate with minimal deviation from the actual experimental values. The Neural Network Algorithm (NNA) model performs commendably, achieving a high R
2 of 0.9494, which confirms its strong capability to model the complex, nonlinear interactions within the data. However, with an MAE of 1.1590 MPa, an RMSE of 1.5297 MPa, and a MAPE of 3.97%, its predictive accuracy and precision are demonstrably lower than those of the Quadratic model, though still vastly superior to the Linear model. The RMSE, which penalizes larger errors more heavily, is notably higher for the NNA, implying it produced more significant outliers in its predictions compared to the Quadratic model. In conclusion, while the NNA proves to be a powerful tool, the Quadratic model derived from Response Surface Methodology stands out as the most robust and accurate predictor for CS of concrete.
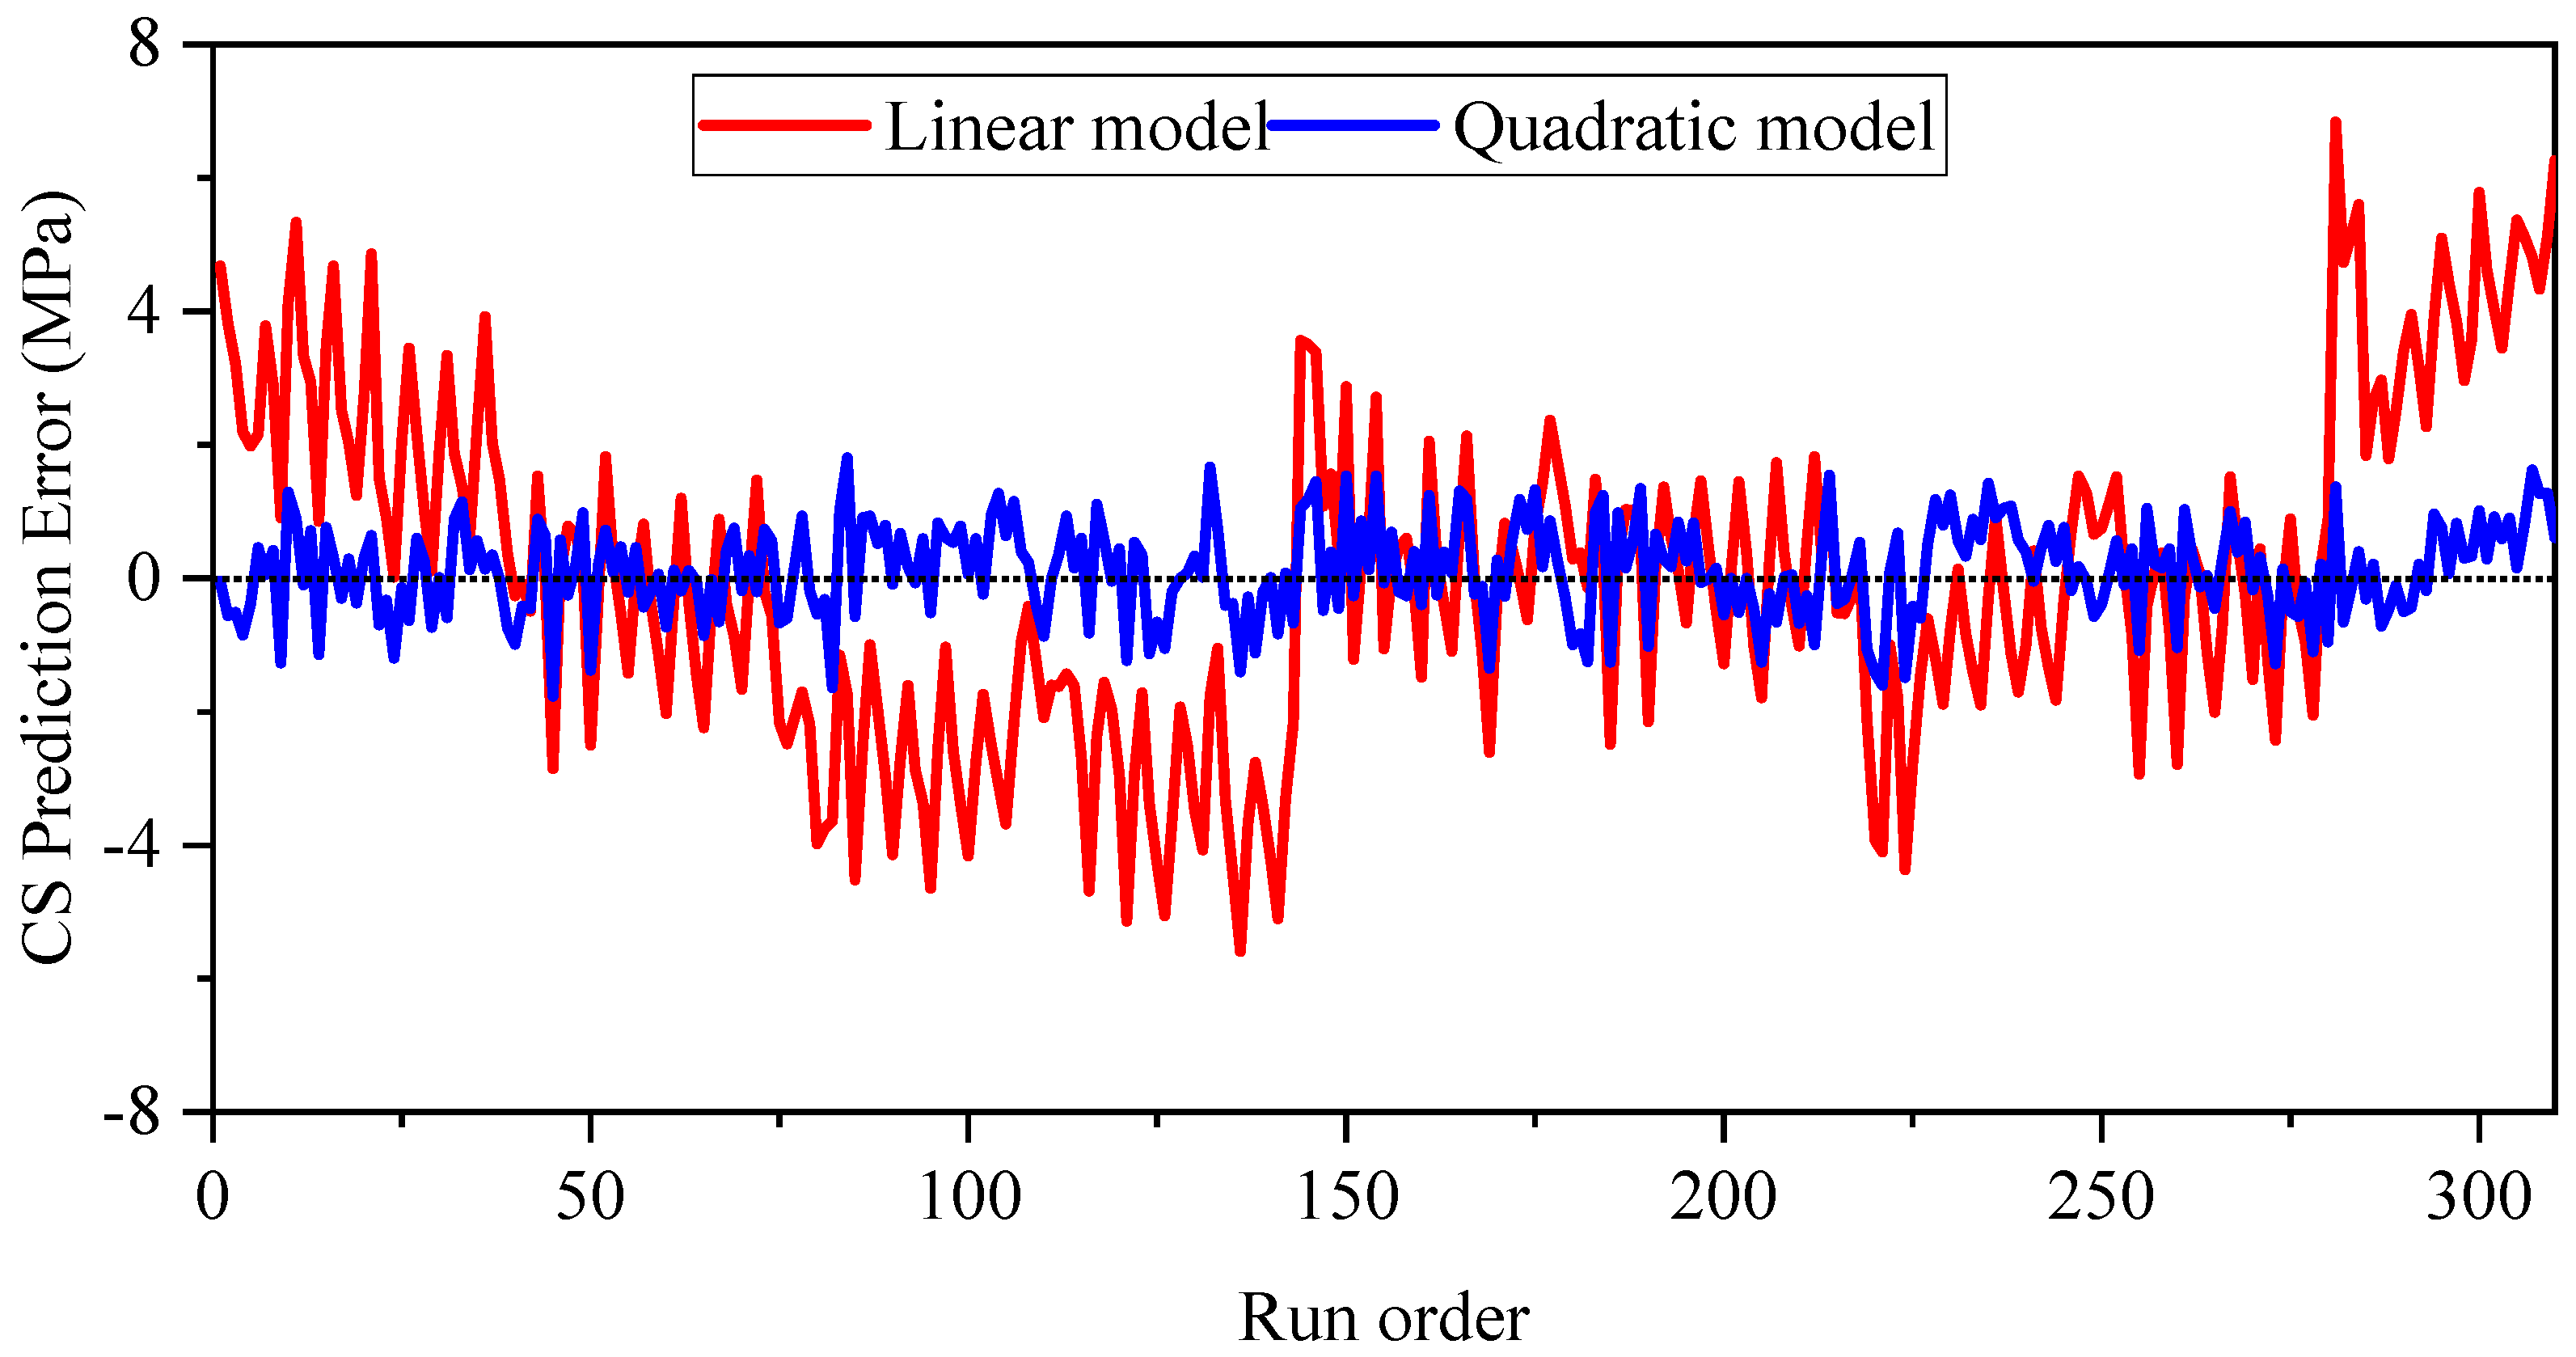
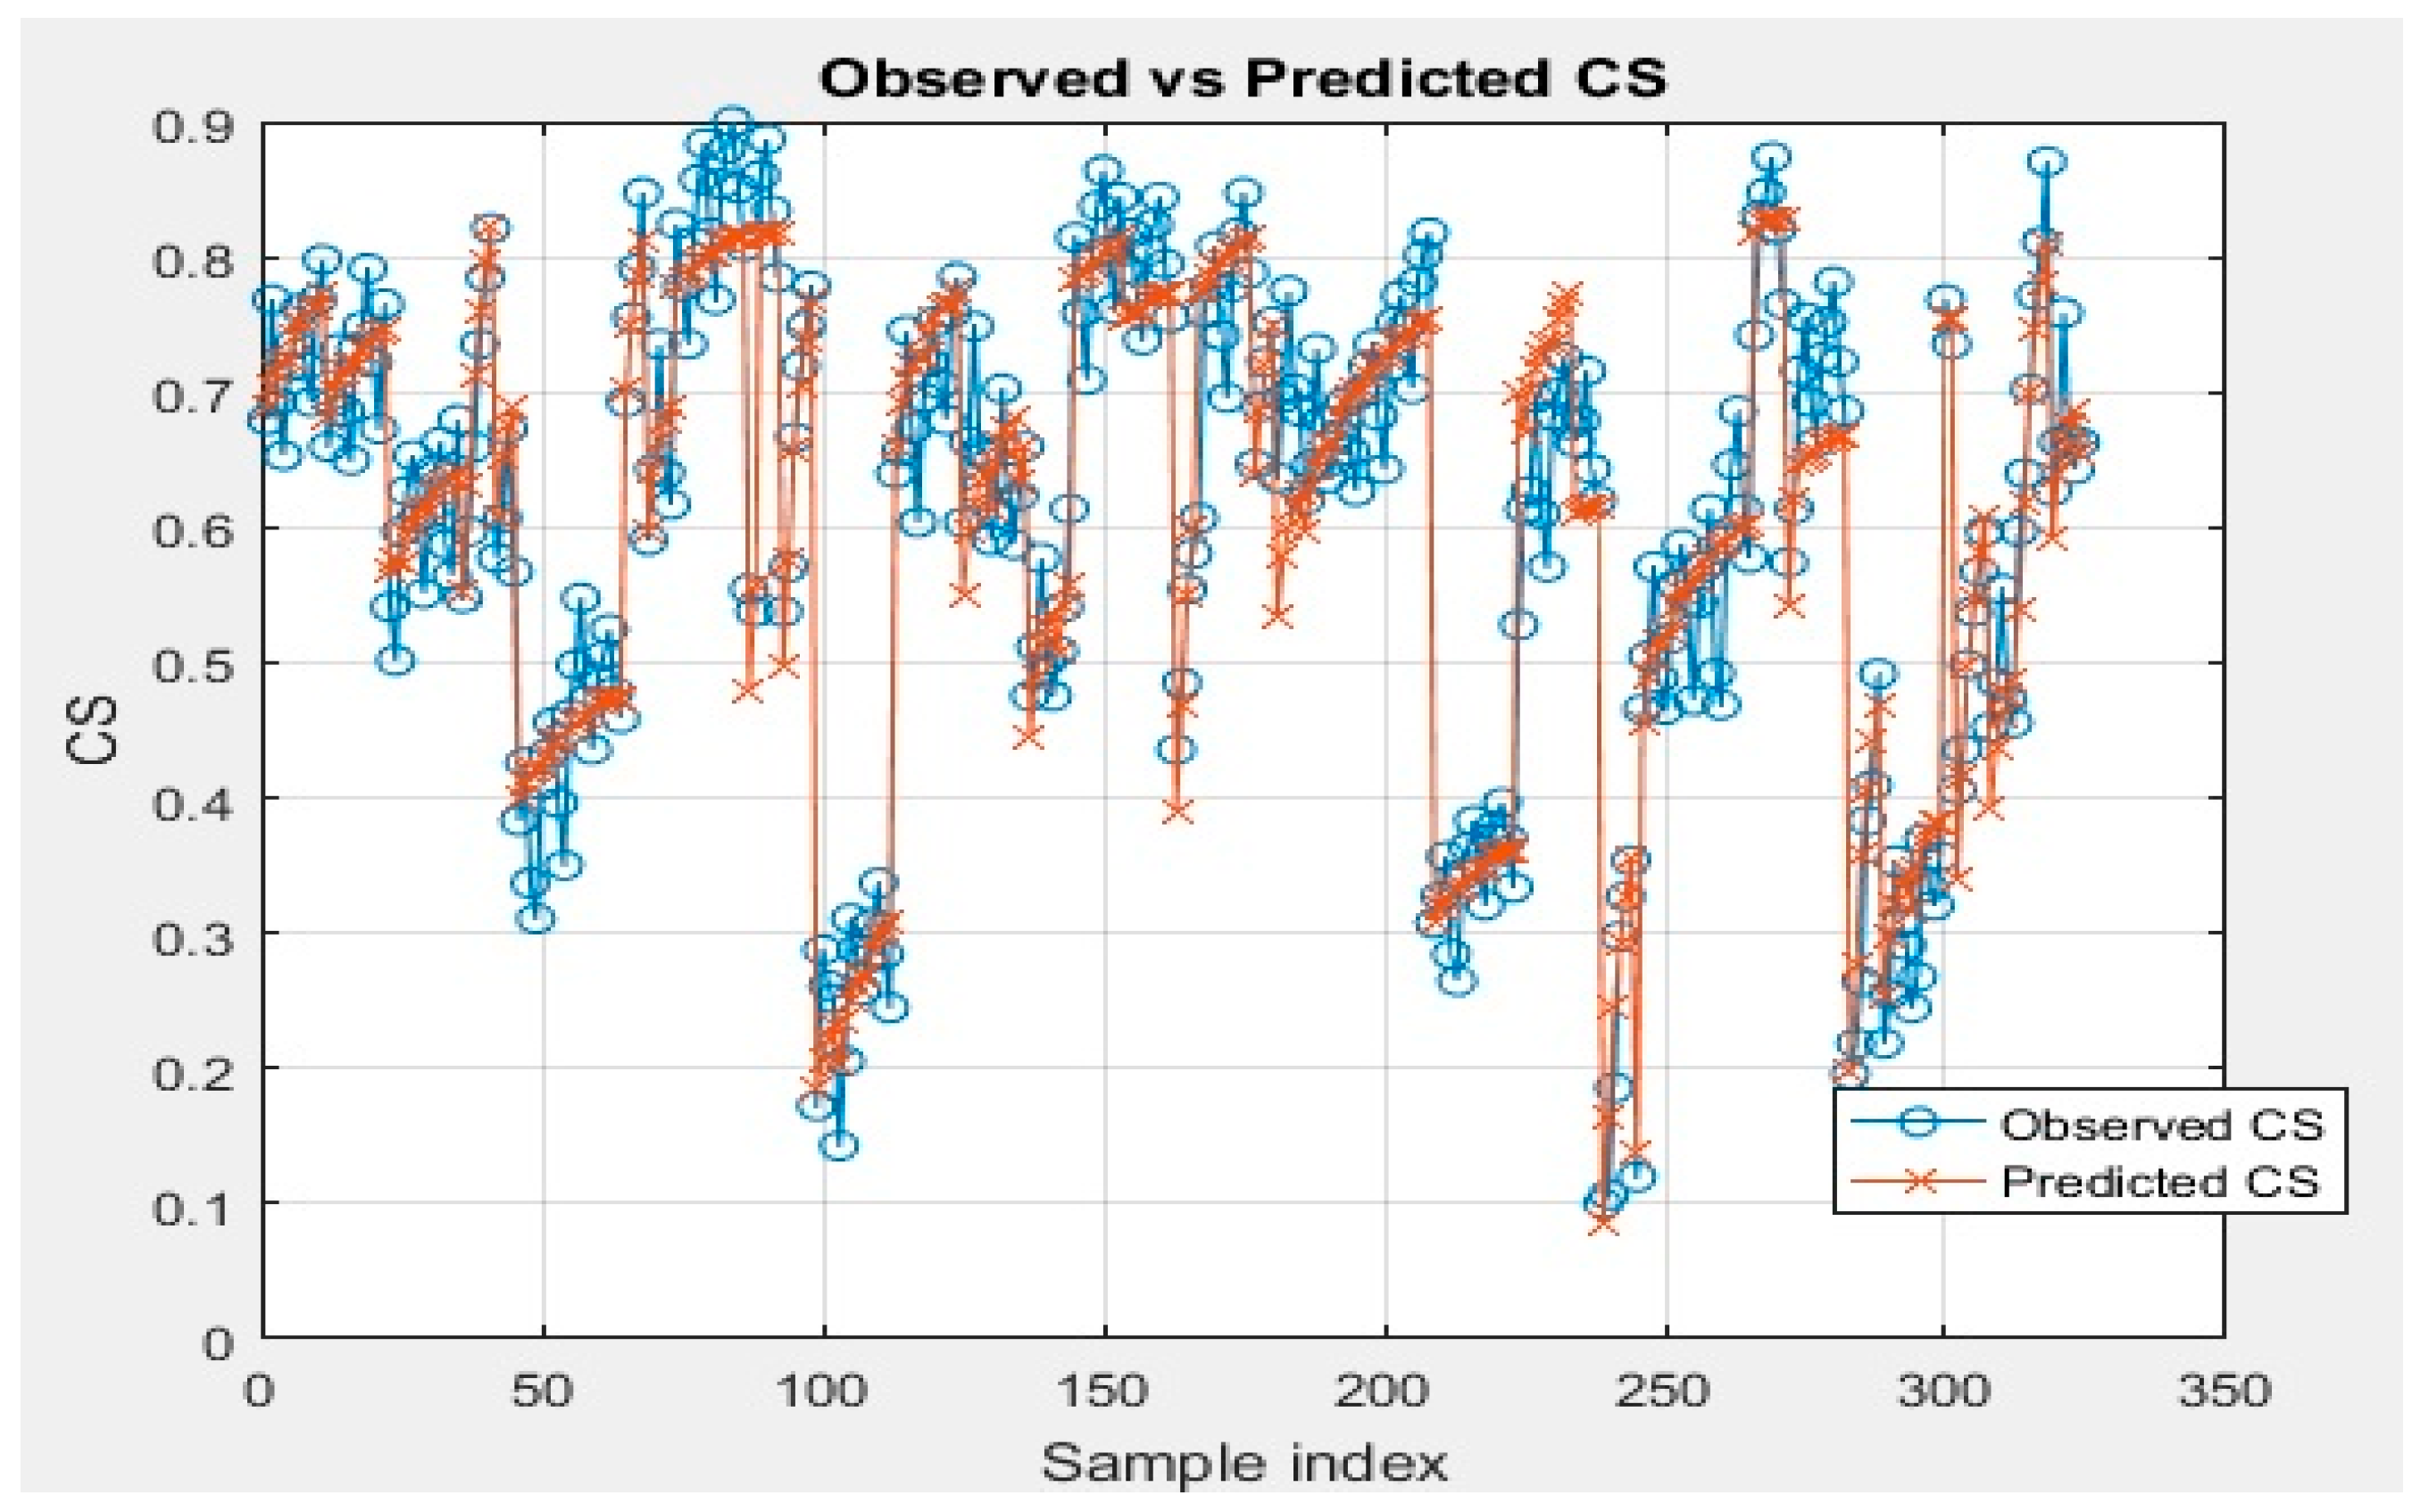
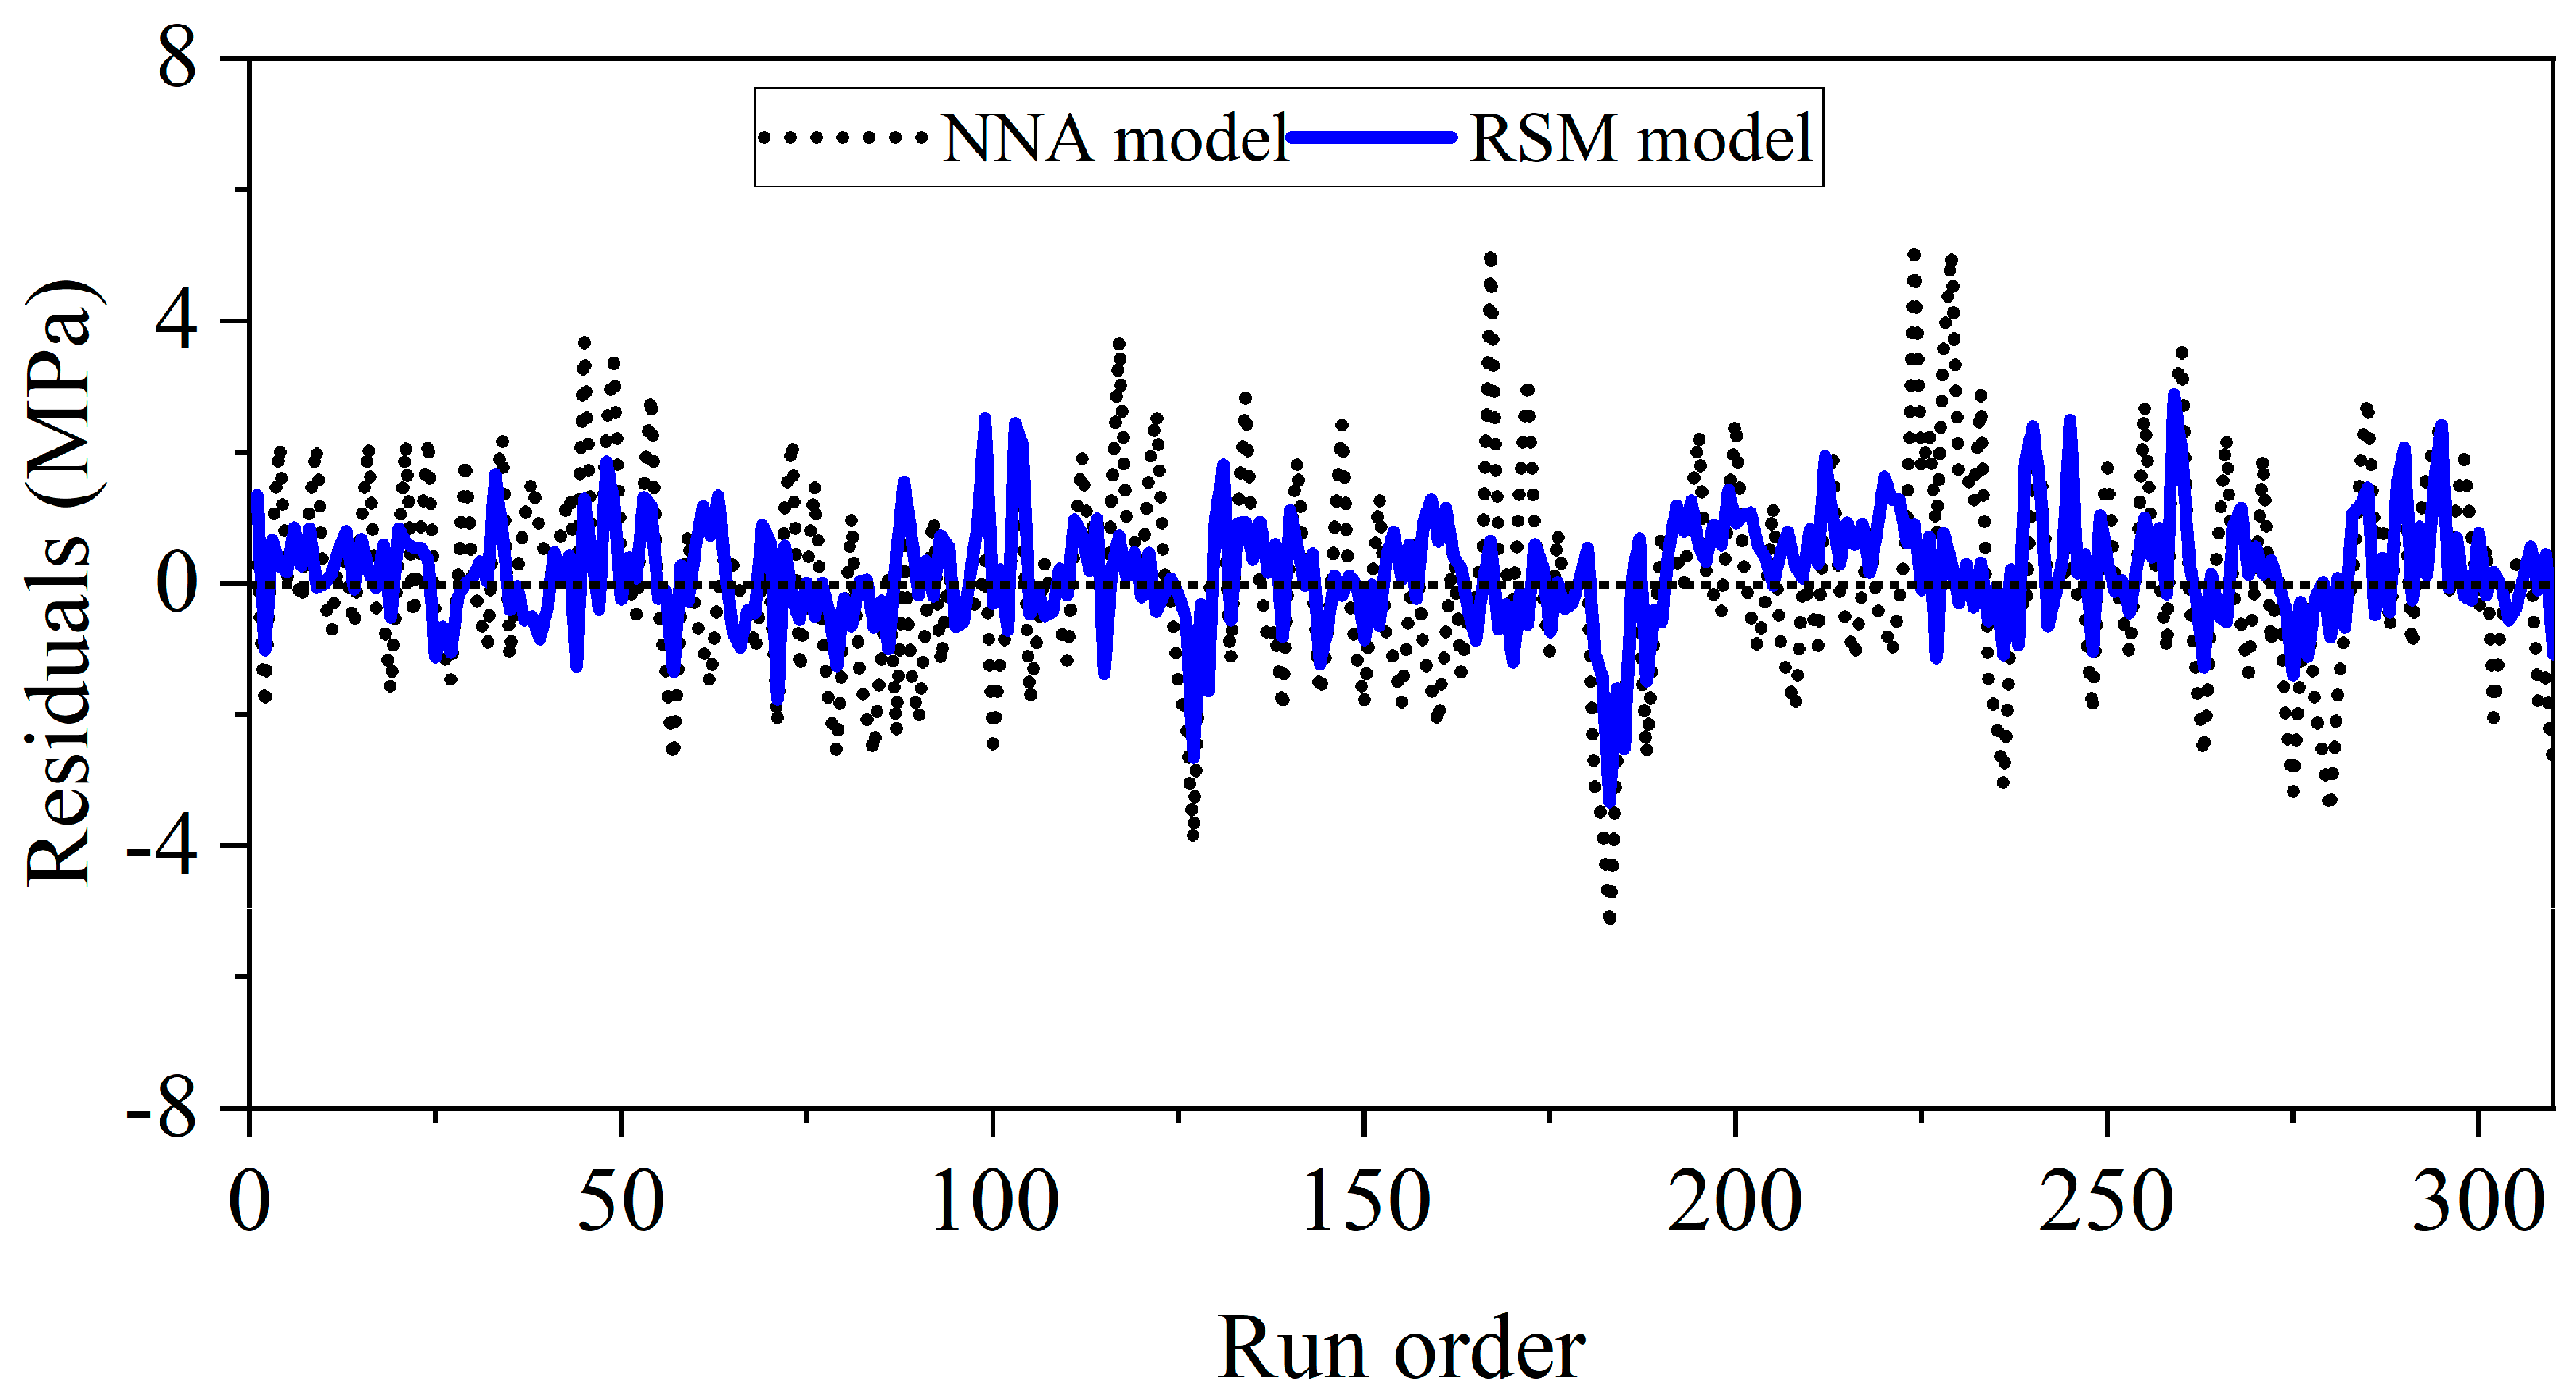
Based on the run-order residual plot shown in
Figure 16 for CS, the predictive performance and error patterns of the NNA and RSM models can be comprehensively evaluated. The plot illustrates the distribution of residuals—the differences between the actual measured compressive strength values and the model-predicted values—across the experimental run sequence. Both models maintain residuals within a relatively tight band around zero, indicating consistent over-prediction/under-prediction across the entire dataset. However, closer inspection reveals distinct patterns in their error behavior. The RSM model demonstrates a more consistent and stable residual distribution, with its errors clustered more tightly and showing less scatter, which aligns with its previously reported superior statistical metrics like a lower RMSE. In contrast, the NNA model, while also generally accurate, appears to display slightly greater variability in its residuals. This suggests that the NNA, despite its capacity for capturing complex nonlinearities, might be slightly less precise than the RSM model for certain experimental conditions in the run order. Overall, the residual analysis confirms that the RSM model provides a more robust and reliable prediction with less volatility in its errors, while the NNA model remains a strong but slightly less consistent performer.
5. Limitations and Suggested Future Studies
Although this study provides valuable insights into the influence of GWP and MWP on the compressive strength of concrete exposed to elevated temperatures, certain limitations should be acknowledged. Firstly, the investigation was restricted to a maximum replacement level of 9% for each waste powder and exposure temperatures up to 800 °C, which may not fully capture the material performance under higher substitution ratios or more extreme fire scenarios. Secondly, only compressive strength was considered as the response variable, whereas other key properties such as tensile strength, flexural strength, durability indicators, and microstructural changes were not addressed. Additionally, the study focused on short-term exposure durations of one and two hours; however, real fire events or high-temperature service conditions may involve longer exposures or cyclic heating-cooling, which could influence material degradation differently. Furthermore, while the RSM provided accurate prediction models, its applicability is limited to the experimental range considered, and extrapolation beyond this range may reduce reliability. Similarly, despite NNA demonstrated high predictive performance within the studied dataset, it may exhibit reduced generalization capability when applied to data beyond the training range or under different environmental and compositional conditions.
Future research should therefore explore broader replacement ranges of GWP and MWP, incorporate additional mechanical and durability parameters, and investigate the microstructural evolution of modified concretes at high temperatures using advanced characterization techniques (e.g., SEM, XRD, and TGA). Long-term performance under repeated thermal cycling, fire-cooling scenarios, and varying cooling regimes (e.g., air cooling vs. water quenching) should also be studied to better simulate practical service conditions. Furthermore, integrating numerical modeling and simulation tools (e.g., finite element thermal–mechanical coupling) with experimental validation could enhance the understanding of stress–strain evolution, crack propagation, and thermal damage mechanics. In parallel, the integration of hybrid ML frameworks, ensemble learning, or physics-informed neural networks could further enhance predictive robustness and interpretability across wider design and environmental domains.
