Article

Post-Earthquake Damage Detection and Safety Assessment of the Ceiling Panoramic Area in Large Public Buildings Using Image Stitching

1
National Science Center for Earthquake Engineering, Tianjin University, Tianjin 300350, China
2
Key Laboratory of Coast Civil Structure Safety of China Ministry of Education, Tianjin University, Tianjin 300350, China
3
School of Civil Engineering, Tianjin University, Tianjin 300350, China
*
Author to whom correspondence should be addressed.
Buildings 2025, 15(21), 3922; https://doi.org/10.3390/buildings15213922
Submission received: 25 September 2025 / Revised: 19 October 2025 / Accepted: 28 October 2025 / Published: 30 October 2025
(This article belongs to the Special Issue Building Structure Health Monitoring and Damage Detection)

Abstract

With the development of artificial intelligence, intelligent assessment methods have been applied in post-earthquake emergency rescue. These methods enable rapid and accurate identification and localization of earthquake-induced damage to ceilings in large public buildings, which often serve as emergency shelters. However, in practical applications, challenges remain: damage recognition accuracy is low when using wide-field distant shots, while close-up local shots are unsuitable for identifying panoramic regional damage. As a result, high-precision intelligent safety assessment of the entire ceiling area cannot be achieved. Therefore, this study proposes a panoramic image stitching method based on SIFT feature point detection and registration, optimized by the RANSAC algorithm, to generate high-resolution, wide-angle panoramic images of ceilings in large public buildings. The BRISQUE values of the stitched images range between 20 and 30, indicating good stitching quality. Subsequently, by integrating damage recognition and image stitching techniques, a safety assessment test was conducted on 227 stitched images of earthquake-induced ceiling damage captured in real scenes, using evaluation indicators such as damage type and severity quantification. The safety assessment achieved an overall accuracy of 98.7%, demonstrating the effectiveness of ceiling damage detection technology based on image stitching. This technology enables intelligent post-earthquake safety assessment of ceilings in large public buildings across the entire area.

1. Introduction

In recent years, China’s rapid economic and social development has driven the accelerated construction of large public buildings. These structures not only reflect the level of development in areas such as the national and regional economy, culture, and transportation, but also play a significant role in post-earthquake emergency response and disaster relief. Located at the intersection of the Pacific Rim Seismic Belt and the Eurasian Seismic Belt, China is among the regions with the highest frequency of earthquakes and the most severe earthquake-related disasters [1]. Large public buildings such as stadiums, high-speed railway stations, airports, and exhibition centers are widely used as post-earthquake emergency shelters due to their structural and functional advantages. Multiple post-earthquake investigations have shown [2,3,4] that major structural failures or collapses in the main structures of large public buildings are rare during earthquakes. However, their non-structural components, especially suspended ceiling systems, often sustain varying degrees of damage and destruction, posing significant safety hazards to evacuees and affecting the smooth progress of rescue operations. Therefore, conducting scientific, rational, and rapid safety assessments of ceilings is a critical prerequisite for evaluating the suitability of large public buildings as emergency shelters following an earthquake.
Traditional post-earthquake safety assessments of ceilings rely on manual inspection and evaluation, which cannot meet the rapid response requirements of post-earthquake emergency rescue [5,6]. With the development of structural health monitoring and artificial intelligence technologies, advanced monitoring technologies and intelligent algorithms have been developed to identify and detect dynamic responses and damage in building structures [7,8]. Therefore, utilizing intelligent monitoring technologies to develop high-efficiency and rapid post-earthquake safety assessment methods for ceilings has become a research hotspot and a feasible technology for meeting the urgent response requirements of post-earthquake emergency rescue. Wang et al. [9] developed a method using Deep Convolutional Neural Networks (DCNN) for ceiling damage identification, achieving an accuracy of 86%. Additionally, they employed the Saliency-MAP feature visualization method to localize areas of the damaged ceiling. Test statistics revealed that non-ceiling regions in images have a significant impact on the accuracy of damage detection. When no non-ceiling areas are present, the accuracy of ceiling damage detection can reach as high as 98%. Based on the YOLOX method, Wang et al. [10] developed an intelligent detection method for earthquake-induced ceiling damage, which can effectively identify four types of ceiling damage: peeling, crack, distortion, and fall-off. The method achieved a mean average precision (mAP) of 75.28%, and the visualized detection results demonstrated strong adaptability in scenarios involving multiple targets, small targets, different shapes, and partial visual occlusion. Han et al. [11] proposed an intelligent post-earthquake safety assessment method for ceiling damage in large public buildings using semantic segmentation. This approach enables the identification, classification, and localization of earthquake-induced ceiling damage, as well as the geometric quantification of damaged areas. By considering indicators such as the hazard level of different damage types, the interactions between damage types, and the severity of the damage, the post-earthquake safety of ceilings can be effectively assessed. The detection accuracy and localization precision of this intelligent assessment method reached 97% and 85%, respectively, with a safety evaluation accuracy of 98%. This enables rapid detection, precise localization, and integrated safety assessment of ceiling damage. Although intelligent detection and safety assessment of post-earthquake ceiling damage in large public buildings have reached the stage of practical application, there are still some limitations. These include the low accuracy of damage recognition in wide-field distant shots and the inability of close-up local shots to support quantitative analysis of panoramic regional damage. Almost all large public buildings feature extensive open spaces with large ceiling areas. To capture the entire ceiling area in a single photograph, it is necessary to use a wide-angle lens for a distant view, which will affect the accuracy of detecting ceiling damage. On the other hand, using multiple close-up images can only identify and locate ceiling damage. Still, it cannot perform a quantitative analysis of the same scale, making it impossible to assess the safety of the entire ceiling area. Therefore, achieving both high accuracy in identifying ceiling damage and conducting quantitative analysis of overall area damage is crucial for realizing high-precision intelligent safety assessments of ceilings in large public buildings after earthquakes.
Image stitching [12] is a technique that combines multiple images with small fields of view and low resolution in overlapping regions into a single panoramic image with a wide field of view and high resolution. This process is essential for achieving high-precision image recognition in wide-area scenarios. Within image stitching technology, image registration is a crucial step in the stitching process, as it significantly impacts the quality of the resulting panoramic image. Among the various algorithms [13,14,15], the Scale-Invariant Feature Transform (SIFT) algorithm demonstrates outstanding accuracy and robustness, making it particularly well-suited for large-area damage detection that requires high-precision matching. With the continuous advancement of the SIFT algorithm, variants optimized by the RANSAC algorithm have been developed for SIFT [16,17]. In this approach, the SIFT algorithm is used to extract and match features between two images, generating initial candidate matches. The RANSAC algorithm then processes these SIFT matches to filter out a large number of outliers caused by incorrect matches and selects reliable corresponding points. The combination of the SIFT and RANSAC algorithms significantly enhances the accuracy and reliability of feature extraction and matching in images. At present, image stitching technology has been gradually applied to wide-area damage detection for large infrastructure in civil engineering, achieving excellent recognition accuracy and detection efficiency in applications such as surface damage detection of large-scale buildings [18,19,20], crack detection on bridge decks and large concrete columns [21,22,23,24], and long-distance damage detection in tunnels [25]. Therefore, given the successful application of image stitching technology for wide-area damage identification in civil and structural engineering, high-precision local damage detection techniques for ceilings can be integrated with image stitching methods to enable panoramic post-earthquake damage identification and safety assessment of ceilings in large public buildings.
This study proposed a panoramic image stitching method based on SIFT feature point detection and registration, optimized by the RANSAC algorithm. The quality of ceiling image stitching was validated using ceiling images from a stadium, demonstrating that high-resolution, wide-angle panoramic images of ceilings in large public buildings can be generated. Subsequently, based on the proposed image stitching method, 423 actual images of earthquake-induced ceiling damage were stitched to obtain 227 stitched images, and the stitching quality and its impact on the characteristics of ceiling damage were analyzed. Finally, by integrating damage recognition and image stitching techniques, a safety assessment test was conducted on 227 stitched images of earthquake-induced ceiling damage using evaluation indicators such as damage type and quantified severity. This verified the effectiveness and accuracy of ceiling damage detection technology based on image stitching, enabling intelligent post-earthquake safety assessments of ceilings in large public buildings across the entire area.

2. Image Stitching and Quality Evaluation Methods

2.1. Image Feature Extraction Algorithms

The most critical step in the image stitching method is image matching, which involves transforming images from different coordinate systems into the same coordinate system. In this study, the SIFT algorithm, which offers high-precision feature extraction and excellent anti-interference capability, is employed. The process of image feature extraction and matching comprises four steps: keypoint detection, feature point localization and orientation determination, feature descriptor generation, and feature vector matching [26].

2.1.1. Keypoint Detection

Typical corresponding features in two images are identified as keypoints. Using the Gaussian function in Equation (1) to construct different scale spaces by varying the scale parameter allows for the detection of candidate feature points at multiple scales,
G x , y , σ = 1 2 π σ 2 e x m / 2 2 + y m / 2 2 2 σ 2
where (x, y) represents the position of a pixel in the image, σ is the scale factor of the algorithm, and its value is proportional to the image scale. The scale-adaptive Gaussian differential function of the detected candidate feature points is then substituted into the Gaussian Blur algorithm, as shown in Equation (2).
L x , y , σ = G x , y , σ I x , y
where G(x, y, σ) denotes the scale-adaptive Gaussian function, I(x, y) is the input image, and L(x, y, σ) is the image at σ. Subsequently, the Difference of Gaussian (DoG) function, as given in Equation (3), is used to construct the DoG pyramid structure.
D x , y , σ = D x , y , k σ D x , y , σ I x , y = L x , y , k σ L x , y , σ
New values are obtained by calculating the difference between the results of two adjacent layers. After constructing the DoG pyramid structure, each candidate feature point in the pyramid is compared with its 26 neighboring points in the same, above, and below scales, as shown in Figure 1. The red dot represents the candidate point, and the blue dots represent the comparison points. Only if the red point is either greater than or less than all the blue points is it detected as a keypoint.

2.1.2. Feature Point Localization and Orientation Determination

Most of the keypoint detected in the scale space are discrete, with limited accuracy and stability, particularly in complex environments where ceilings have sustained damage caused by an earthquake, which exacerbates the decline in the accuracy and stability of keypoint detection. This is because ceiling damage has produced new features or obscured existing features for ceilings. For the three types of damaged ceilings caused by an earthquake [9]. As shown in Figure 2a, the ceiling fall-off will create large, dark areas and expose grid-patterned ceiling keels, introducing new features that are distinct from the ceiling’s light-colored, smooth surface. For the ceiling suspension, as shown in Figure 2b, the suspended portion of the ceiling will obscure the ceiling behind it, thereby creating interference. The crack damage will lead to a change in the ceiling arrangement pattern, as shown in Figure 2c.
To ensure the accuracy and stability of keypoint detection, curve fitting is applied to the Difference of Gaussian function to improve the localization accuracy of the keypoint’s position and scale. Meanwhile, the Hessian Matrix is used to eliminate feature points with strong edge responses and low contrast, mitigating the impact of isolated feature points. Then, a principal orientation is assigned to each feature point to enhance the rotational invariance of the feature descriptors, thus providing more robust features for subsequent operations involving transformations in direction and scale. A histogram is used to compute the magnitude and direction of the gradients of the pixels in the neighborhood of each feature point. The histogram functionality process is shown in Figure 3. Firstly, the gradient magnitude m(x, y) and direction θ(x, y) for each pixel are calculated using Equations (4) and (5). Then, the histogram is used to quantify the pixel gradient magnitude and direction values within the neighborhood. The histogram is divided into 36 intervals ranging from 0° to 360°. In the gradient histogram, the direction with the highest value represents the primary gradient direction near the keypoint, which is also the keypoint’s principal direction. When the magnitude of any other direction exceeds 80% of the principal direction, it is considered a secondary direction of the keypoint. Each keypoint has only one principal direction but may be supplemented by other secondary directions, thereby ensuring the stability of the feature descriptor. Through the above calculations, the coordinate, scale, and direction information of each keypoint can be uniquely determined.
m x , y = L x + 1 , y L x 1 , y 2 + L x , y + 1 L x , y 1 2
θ x , y = arctan L x , y + 1 L x , y 1 L x + 1 , y L x 1 , y

2.1.3. Generation of Feature Descriptors

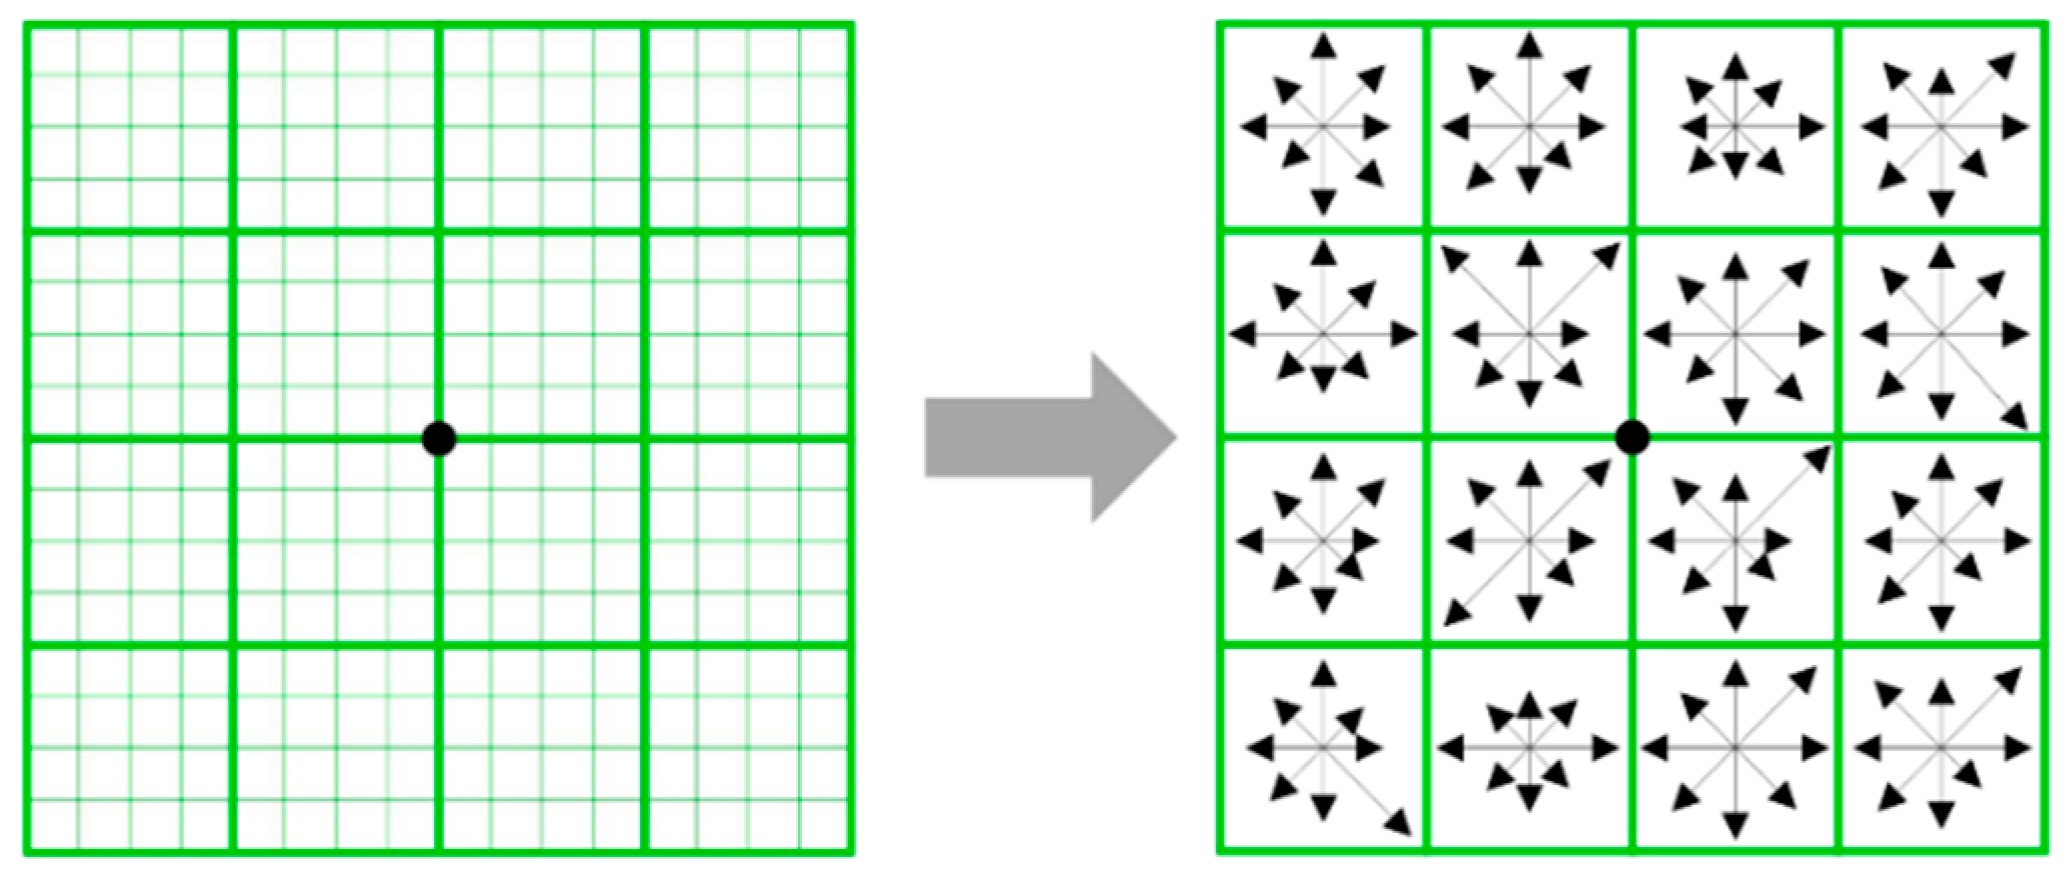
A feature descriptor is a representation of an image or an image patch, simplifying image information by extracting useful details and filtering out redundant data. In this study, feature descriptors are generated by computing gradient information within the region surrounding each feature point, thereby capturing the position, orientation, and scale of the key feature point, as well as the gradients of neighboring pixels. For example, within a 16 × 16 neighborhood centered on a feature point, as shown in Figure 4, interpolation is performed for each of the 4 × 4 equally sized subregions, resulting in a feature descriptor of 4 × 4 × 8, or a total of 128 dimensions.

2.1.4. Feature Vector Matching

By comparing the feature descriptors of keypoints detected in the target image and the image to be stitched, it can be determined whether they represent the same feature. Matching feature points with identical descriptors are then identified and used as inputs for the image transformation model to perform image transformation.

2.2. Image Quality Assessment (IQA) Methods for Stitching Quality Evaluation

The quality of stitched images is comprehensively evaluated in terms of blurriness, noise, color variation, geometric transformation, and degree of distortion to determine the effectiveness of the image stitching. In this study, an objective no-reference image quality assessment (NR-IQA) method is employed, which evaluates the quality of an image based solely on its characteristics and is particularly suitable for assessing the quality of stitched images without a reference image [26]. Among the classic algorithms used for no-reference image quality assessment [27], the BRISQUE (Blind/Referenceless Image Spatial QUality Evaluator) algorithm is widely used due to its simplicity, efficiency, strong scalability, and low computational complexity, making it a common choice for evaluating stitching quality. The BRISQUE score is inversely proportional to image quality; that is, the smaller the value, the better the image quality and the smoother the transition. The principle is to extract MSCN (Mean Subtracted Contrast Normalized) coefficients from the image, calculated as shown in Equation (6),
I ^ i , j = I i , j μ i , j σ i , j + C
where i ∈ 1, 2, …, M; j ∈ 1, 2, …, N; M and N represent the height and width of the image, respectively; C = 1; μ(i, j) and σ(i, j) are calculated according to Equations (7) and (8).
μ i , j = k = K K l = L L ω k , l I k , l i , j
σ i , j = k = K K l = L L ω k , l I k , l i , j μ i , j 2
The MSCN coefficients are then fitted to an asymmetric generalized Gaussian distribution (AGGD) to extract distribution features, as shown in Equation (9),
f x , υ , σ l 2 , σ r 2 = ν β l + β r Γ 1 ν exp x β l ν , x < 0 ν β l + β r Γ 1 ν exp x β r ν , x 0
where βl and βr are defined in Equations (10) and (11),
β l = σ l Γ 1 ν Γ 3 ν
β r = σ r Γ 1 ν Γ 3 ν
The extracted distribution features are then input into a support vector machine (SVM) for regression analysis, ultimately producing the image quality assessment result. The image quality assessment was conducted using the open-source computer vision and machine learning software libraries of OpenCV 3.0+. The BRISQUE algorithm module (cv2.quality.QualityBRISQUE) built into the OpenCV 3.0+ algorithm package fully adheres to the original BRISQUE algorithm logic. Internally, it automatically completes processes such as image preprocessing, MSCN coefficient extraction, AGGD fitting, feature construction, and SVM regression calculations.

3. Panoramic Image Creation

3.1. Detection of Image Feature Points

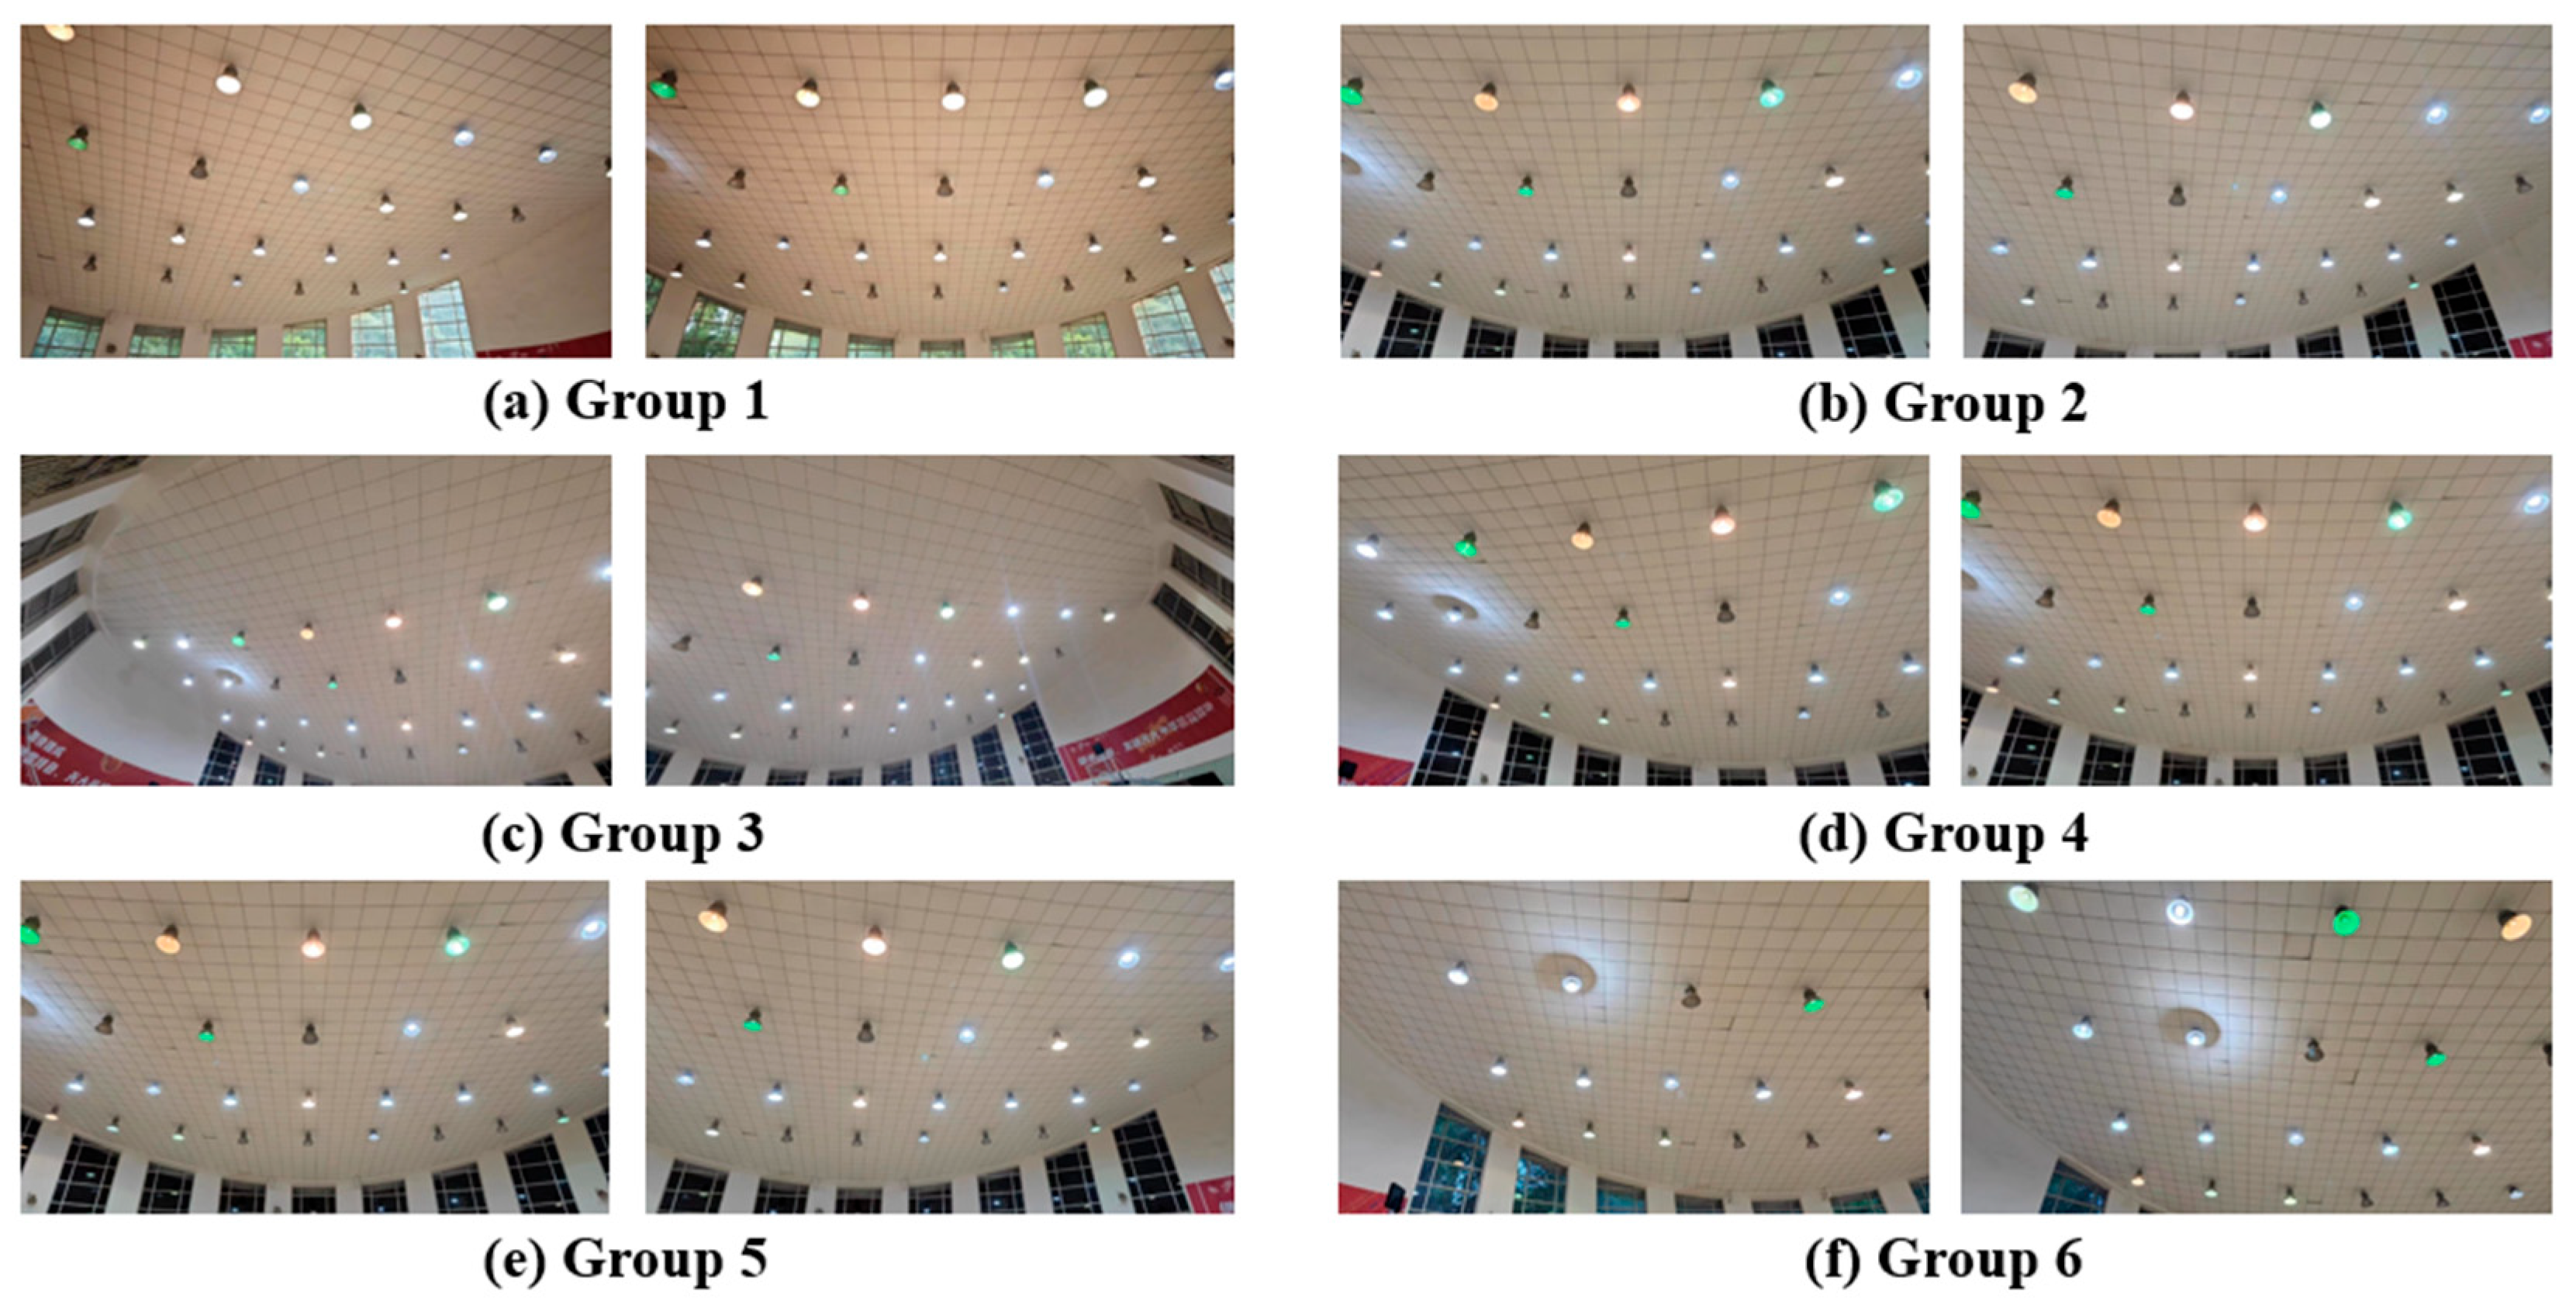
Six sets of stitched images were created using ceiling images taken from different angles in a basketball gymnasium in Tianjin, China. Each set consists of a target image and an image to be registered, as shown in Figure 5. The images were captured using a Xiaomi 13Pro smartphone manufactured by Xiaomi Corporation (China) under natural lighting conditions, and the image dimensions were uniformly adjusted to 1138 × 640.
The specific challenges associated with keypoint detection on the ceilings of large public buildings include pattern repetition, texture absence, and complex lighting conditions. In modern buildings, the surfaces of most ceilings are smooth and uniform in color, lacking rich textural features. Additionally, the ceiling layout employs a highly repetitive arrangement. To meet indoor lighting requirements, the lighting equipment is typically installed in the ceiling area, resulting in complex and variable lighting conditions. To address the challenges posed by pattern repetition and textureless surfaces in ceiling images, the SIFT algorithm was used to extract feature points from both the target images and the images to be registered in each group. On one hand, the SIFT algorithm is insensitive to factors such as image aspect ratio, rotation, scaling, and brightness variations, making it well-suited for handling the challenges of pattern repetition and complex lighting conditions. On the other hand, this algorithm exhibits strong robustness against viewpoint shifts, affine transformations, and noise, which helps address issues arising from the absence of texture on the ceiling surface.
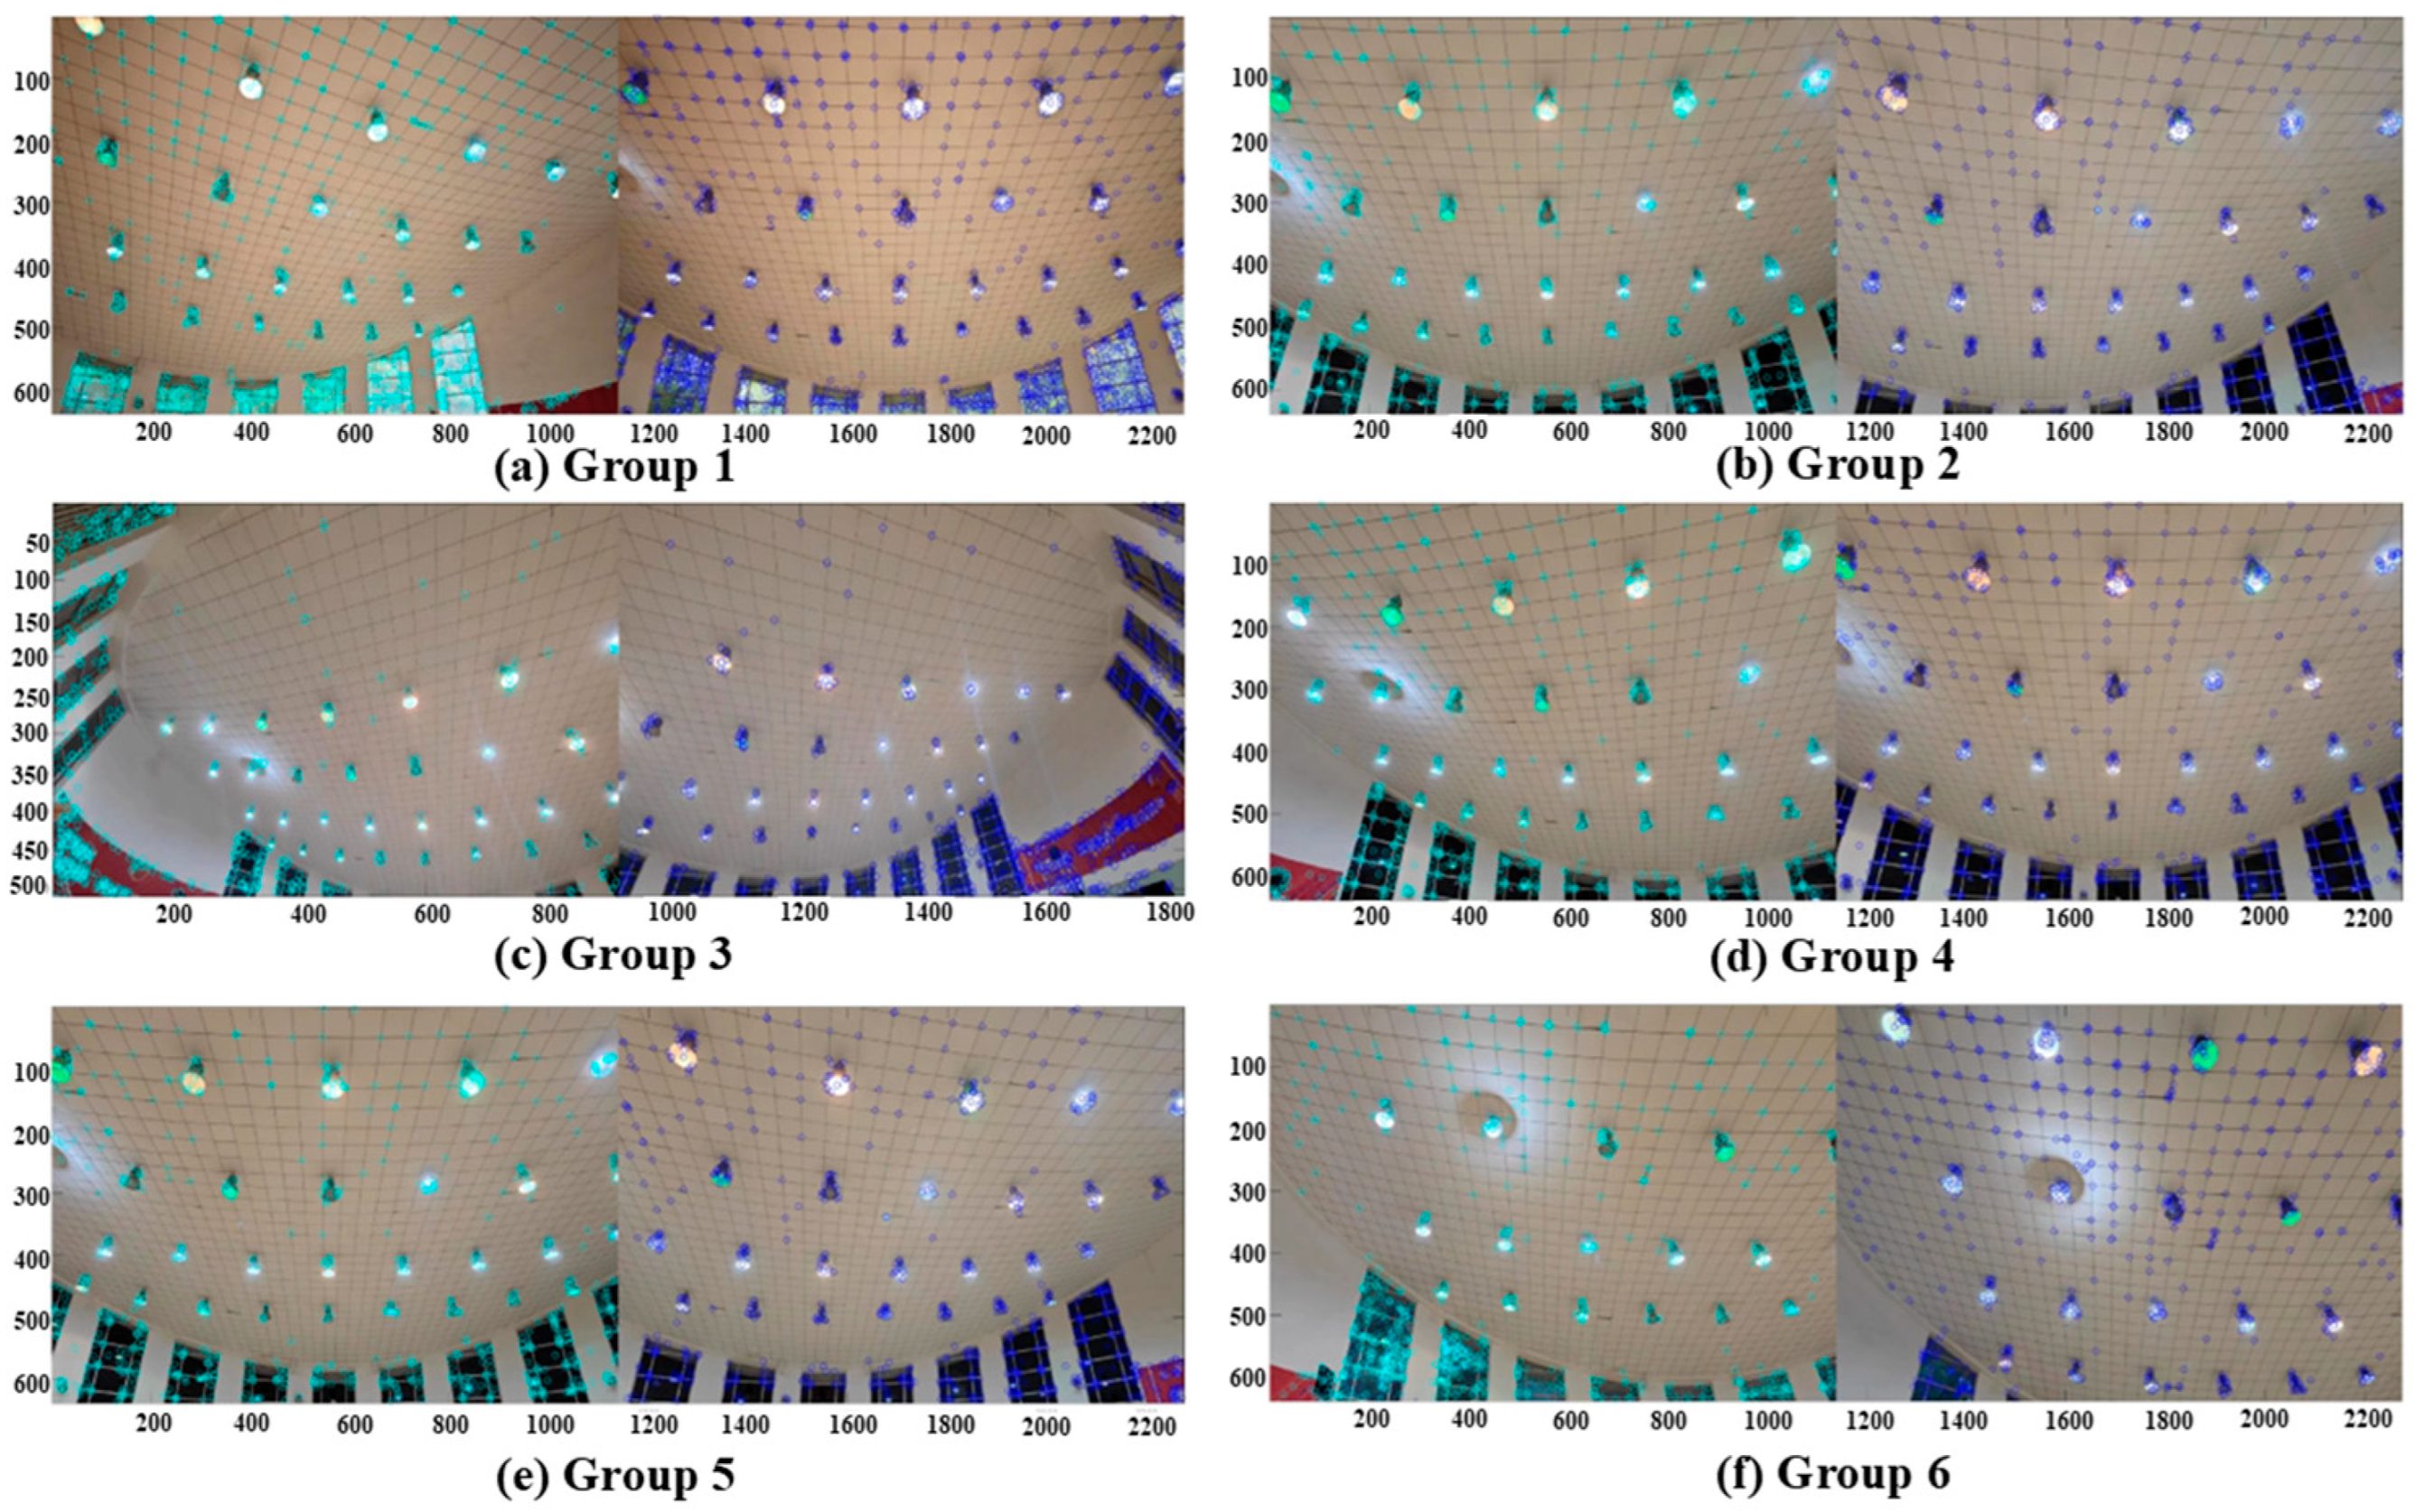
The set of the number of iterations, inlier threshold, and scale-space parameters in SIFT is 5, 0.01, and 4, respectively. The number of feature points detected for each set is shown in Table 1. The detection results are indicated by cyan and blue circles of different scales, as illustrated in Figure 6. The results show that the feature points are mainly concentrated around the edges of the ceiling and pendant lights, the corners of ceiling panels, and the edges of walls and windows. These areas, due to their distinct lines, varying brightness, and color differences, are more easily detected compared to the flat surfaces of ceiling panels or the smooth surfaces of non-ceiling areas such as walls. Therefore, the keypoints of the arrangement pattern of ceilings can be effectively detected, which is the most important for image stitching of building ceilings.

3.2. Feature Point Matching of Images

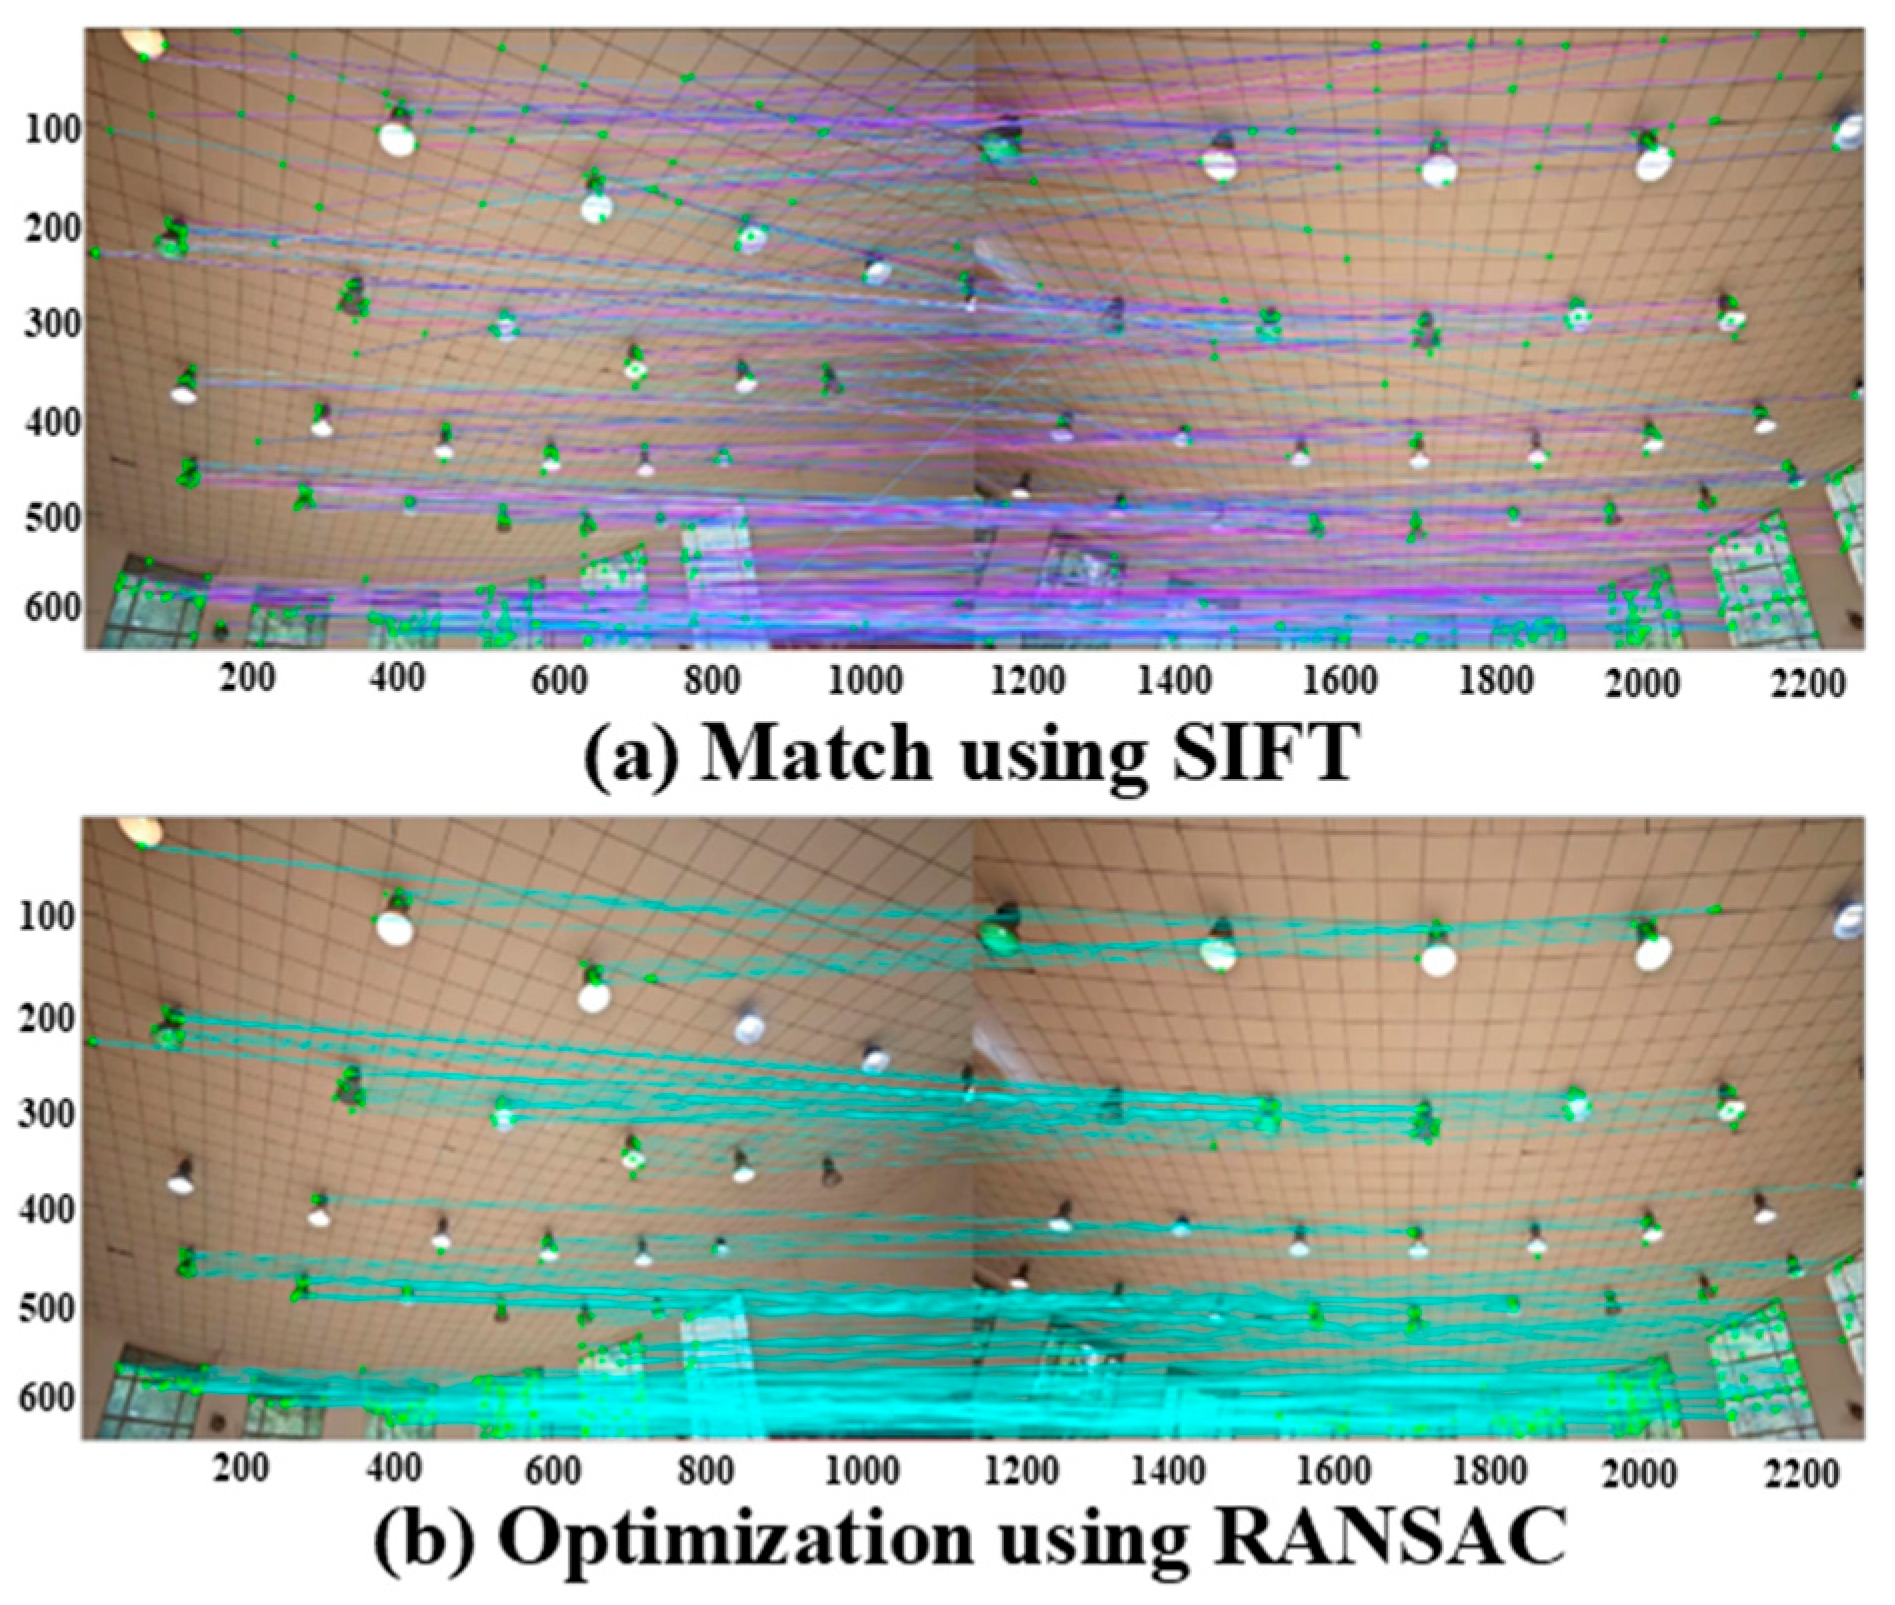
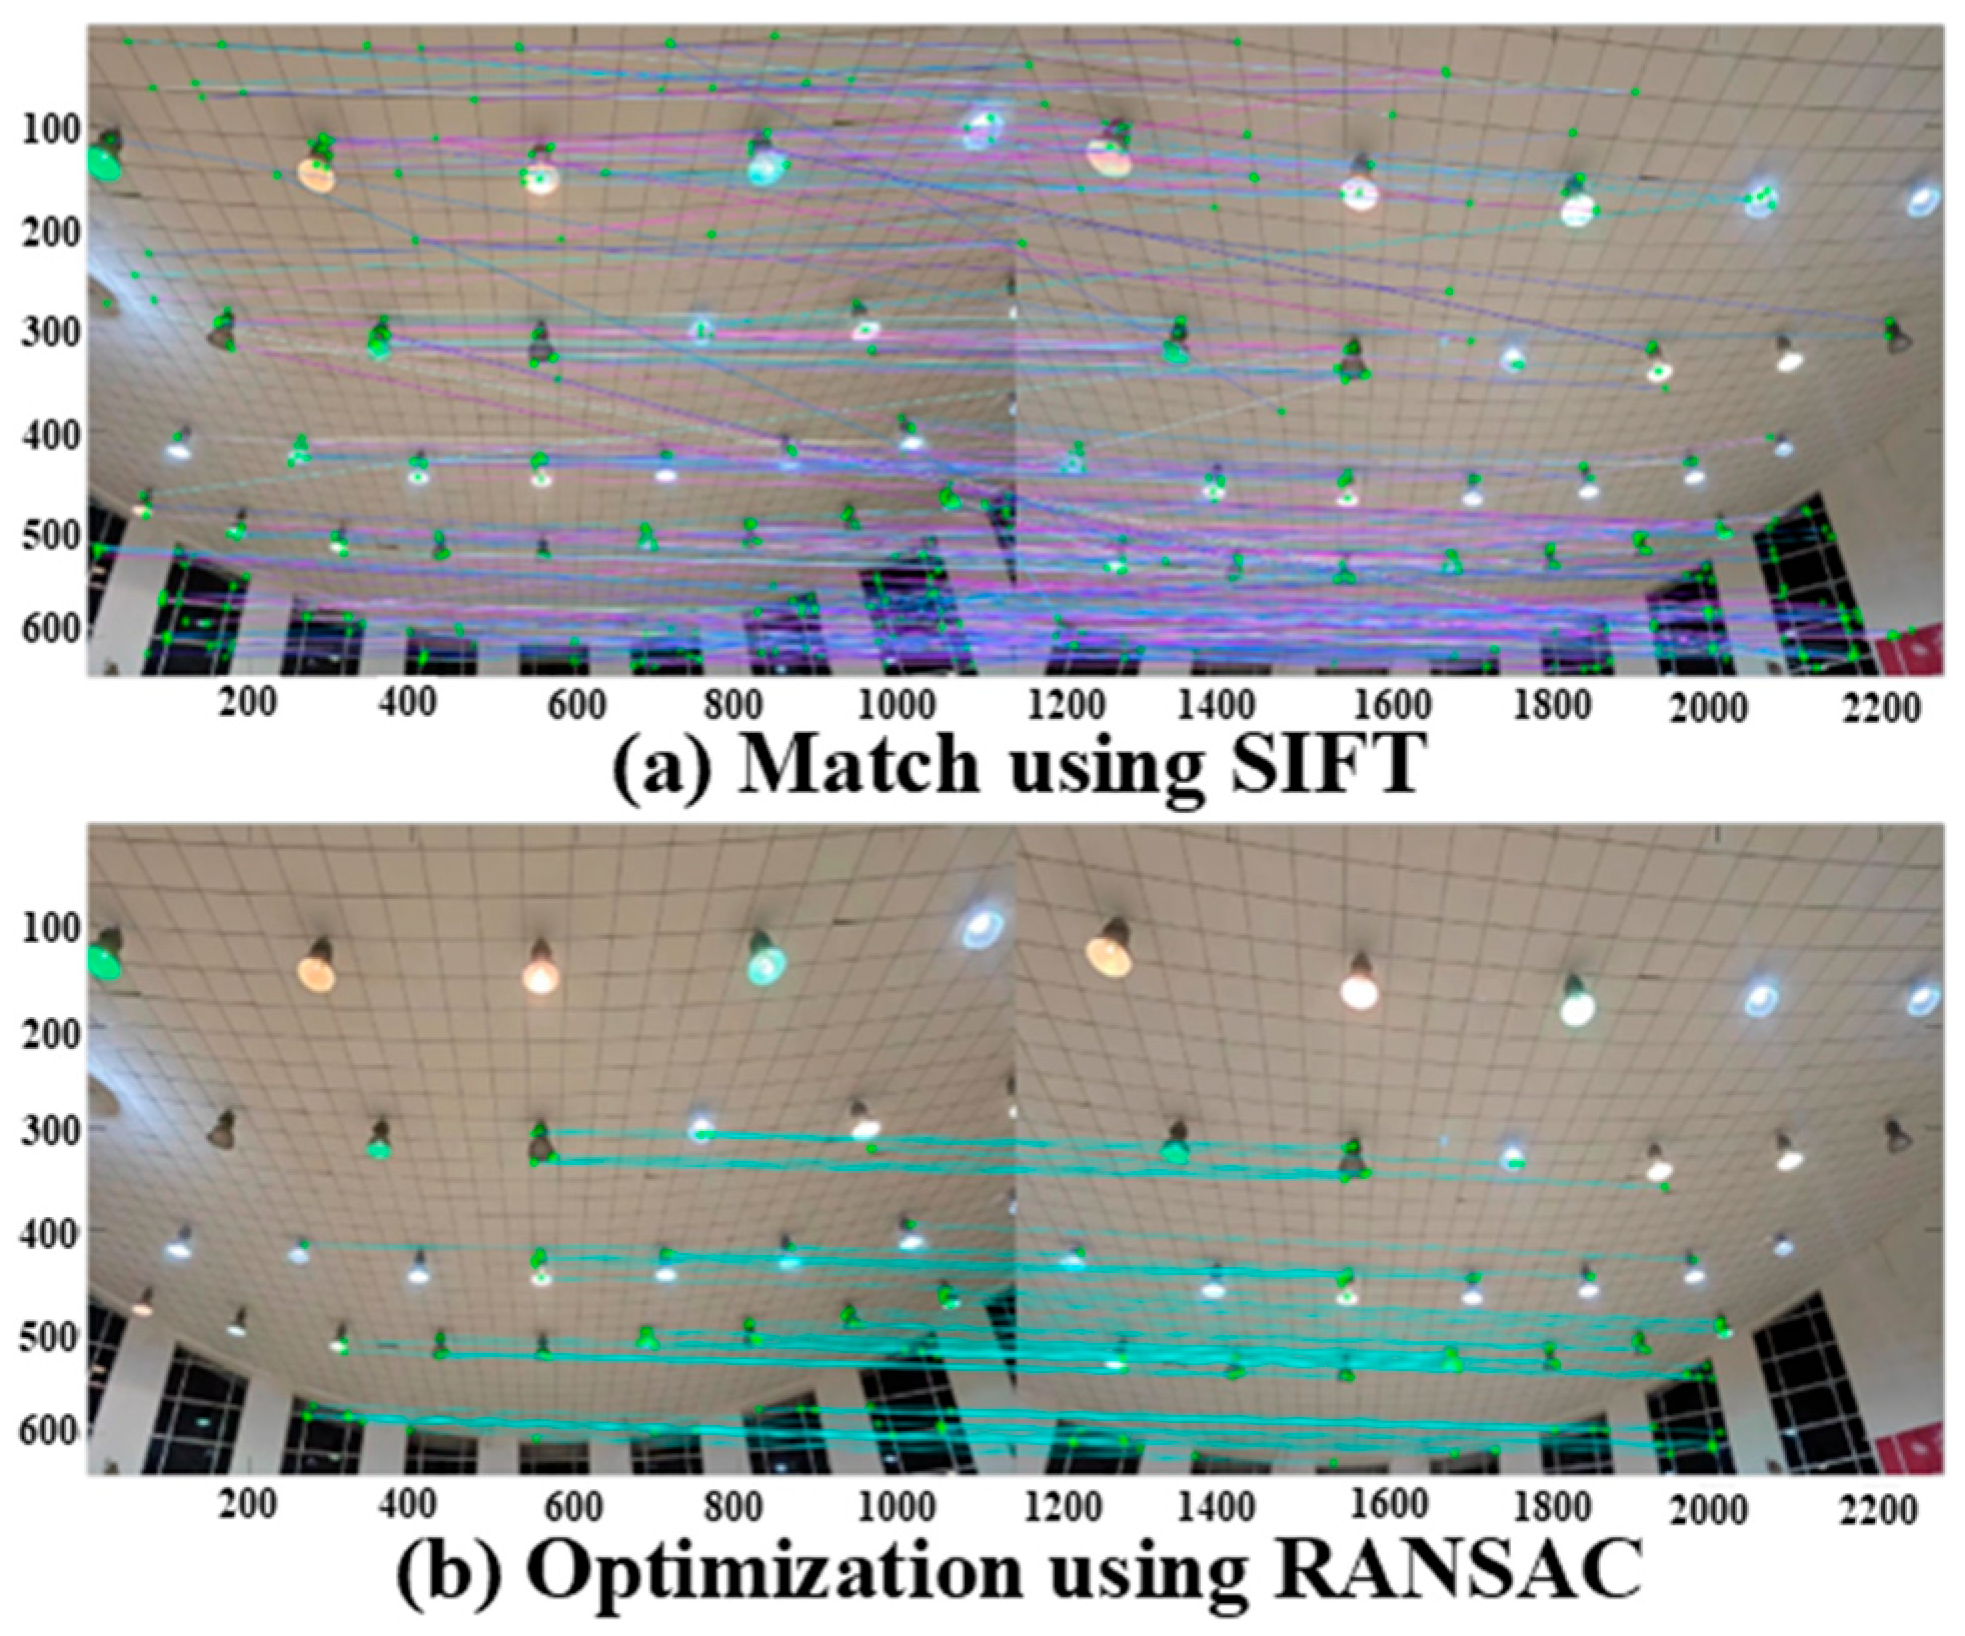
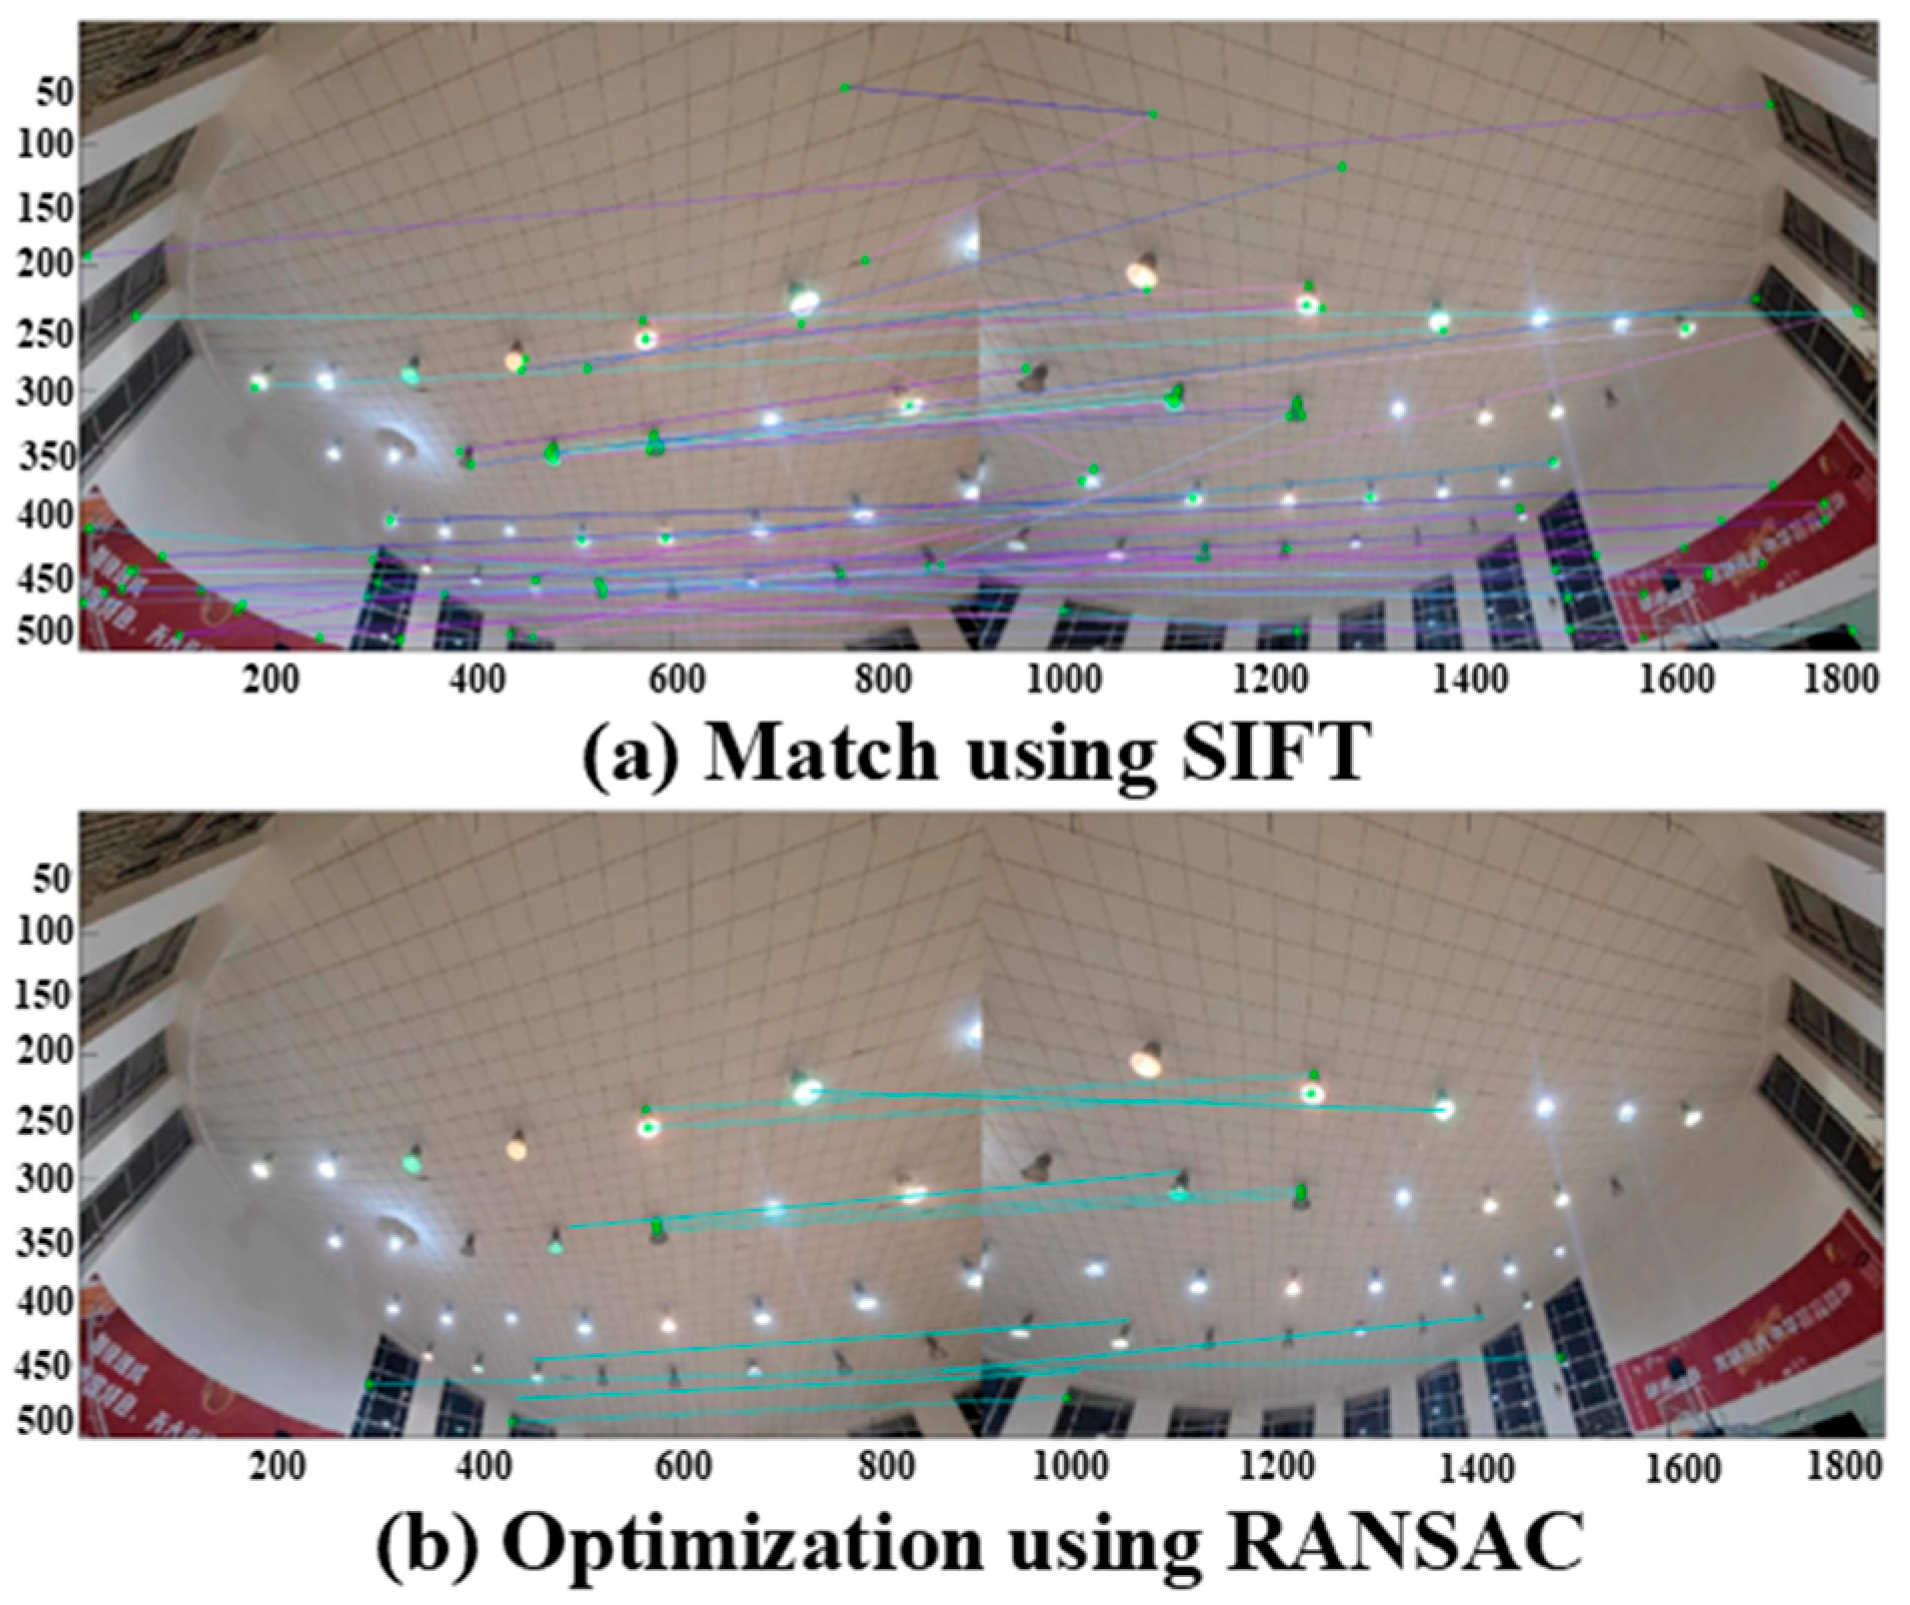
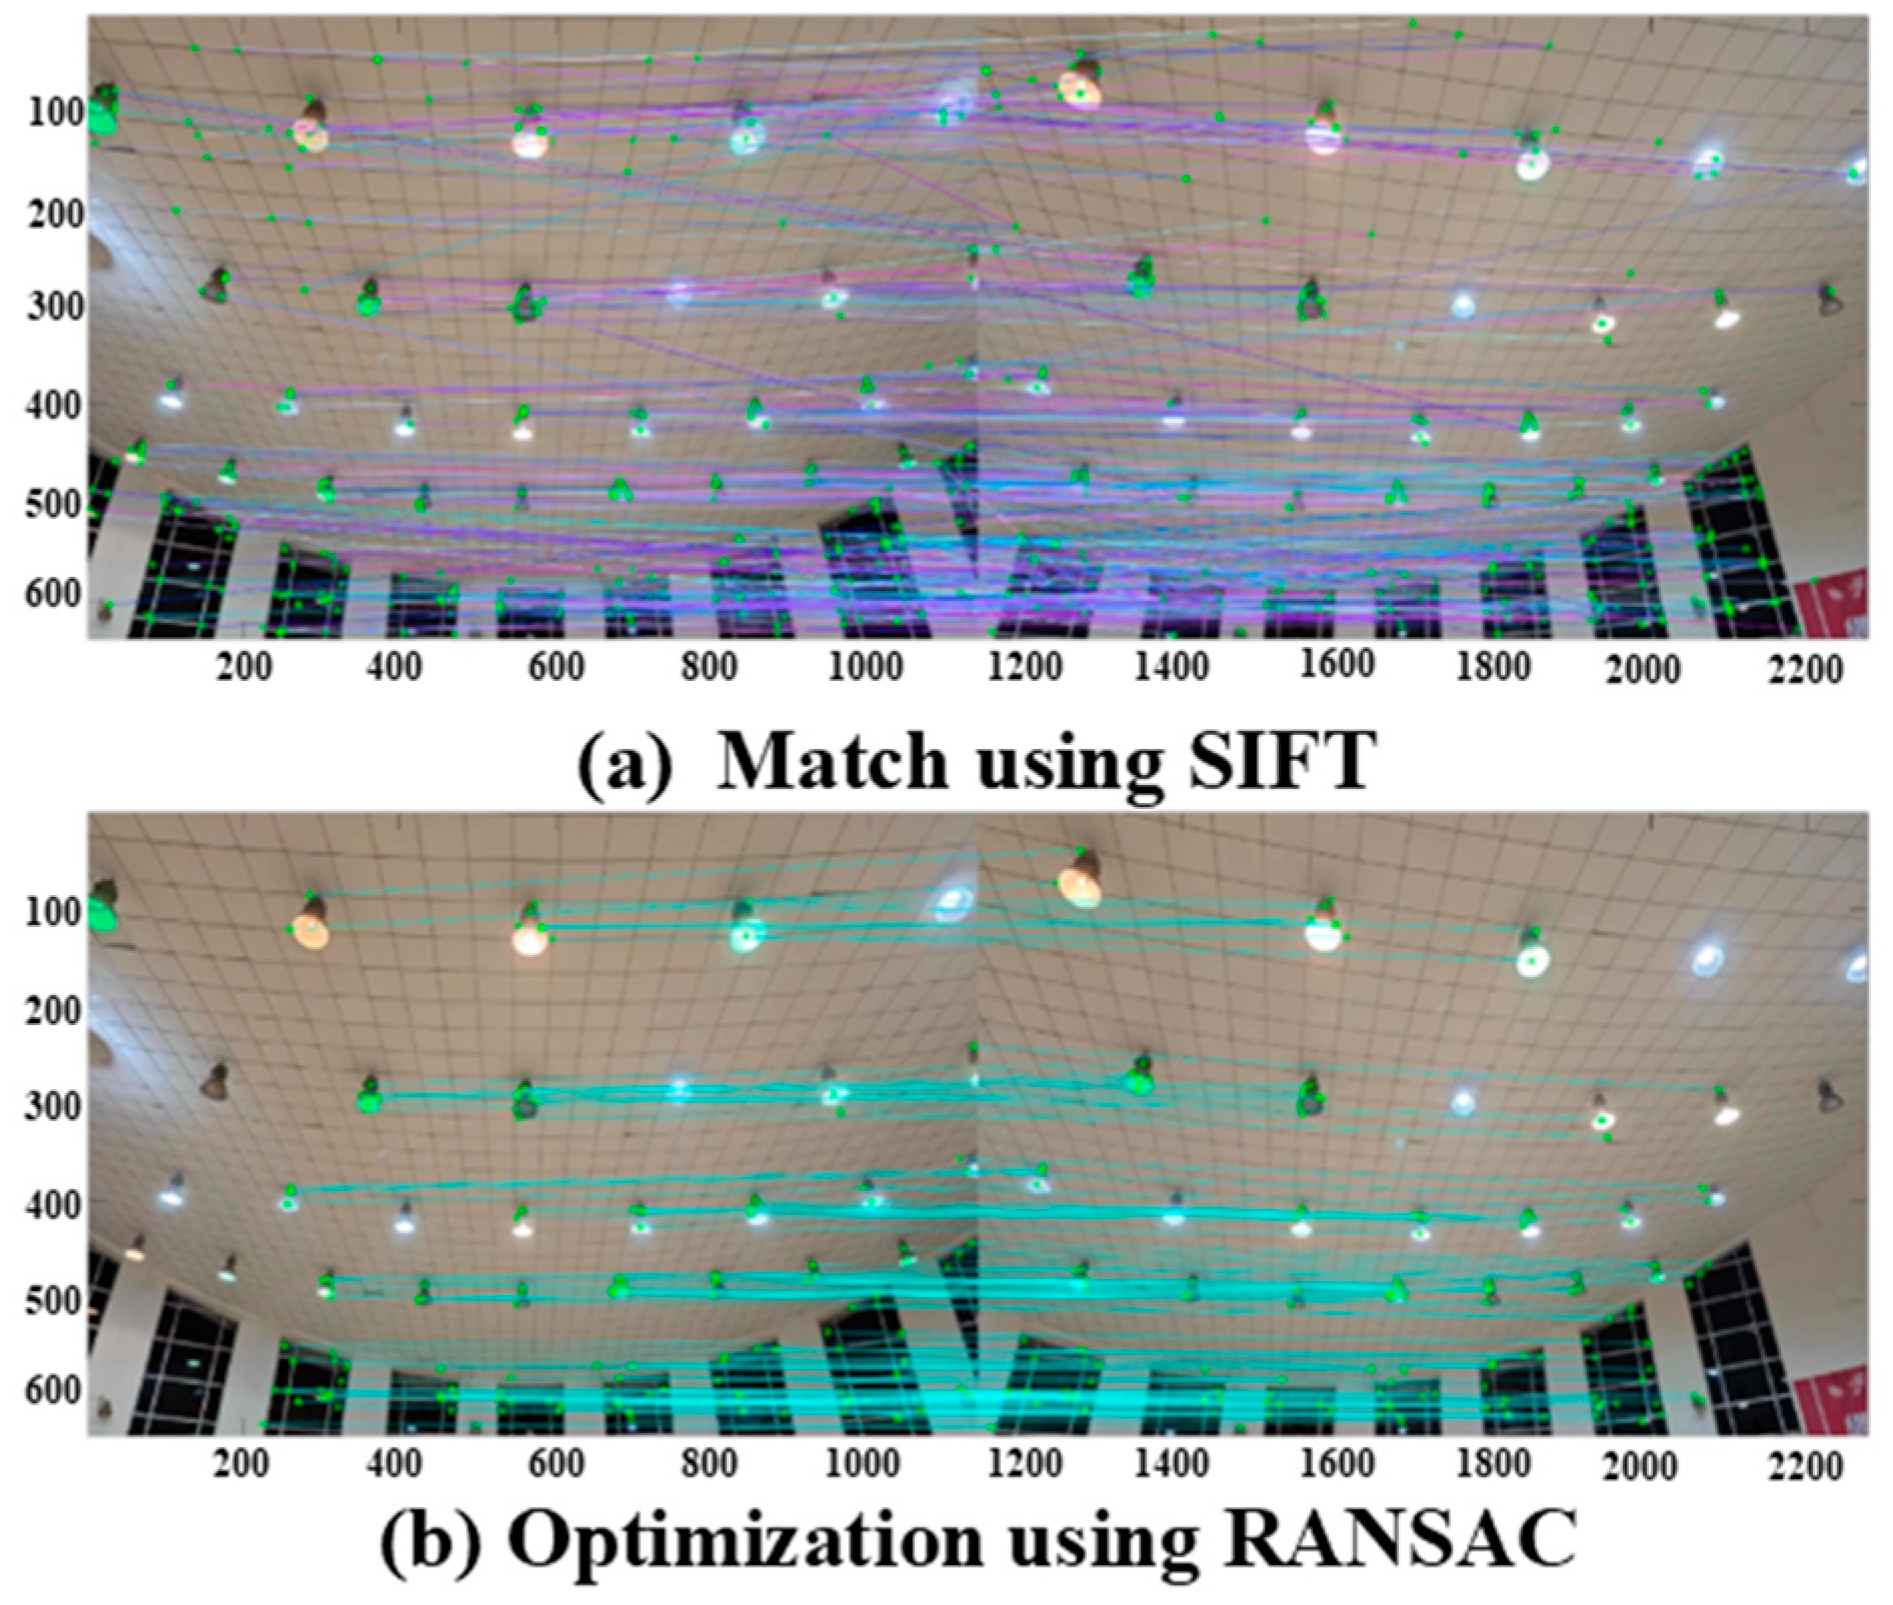
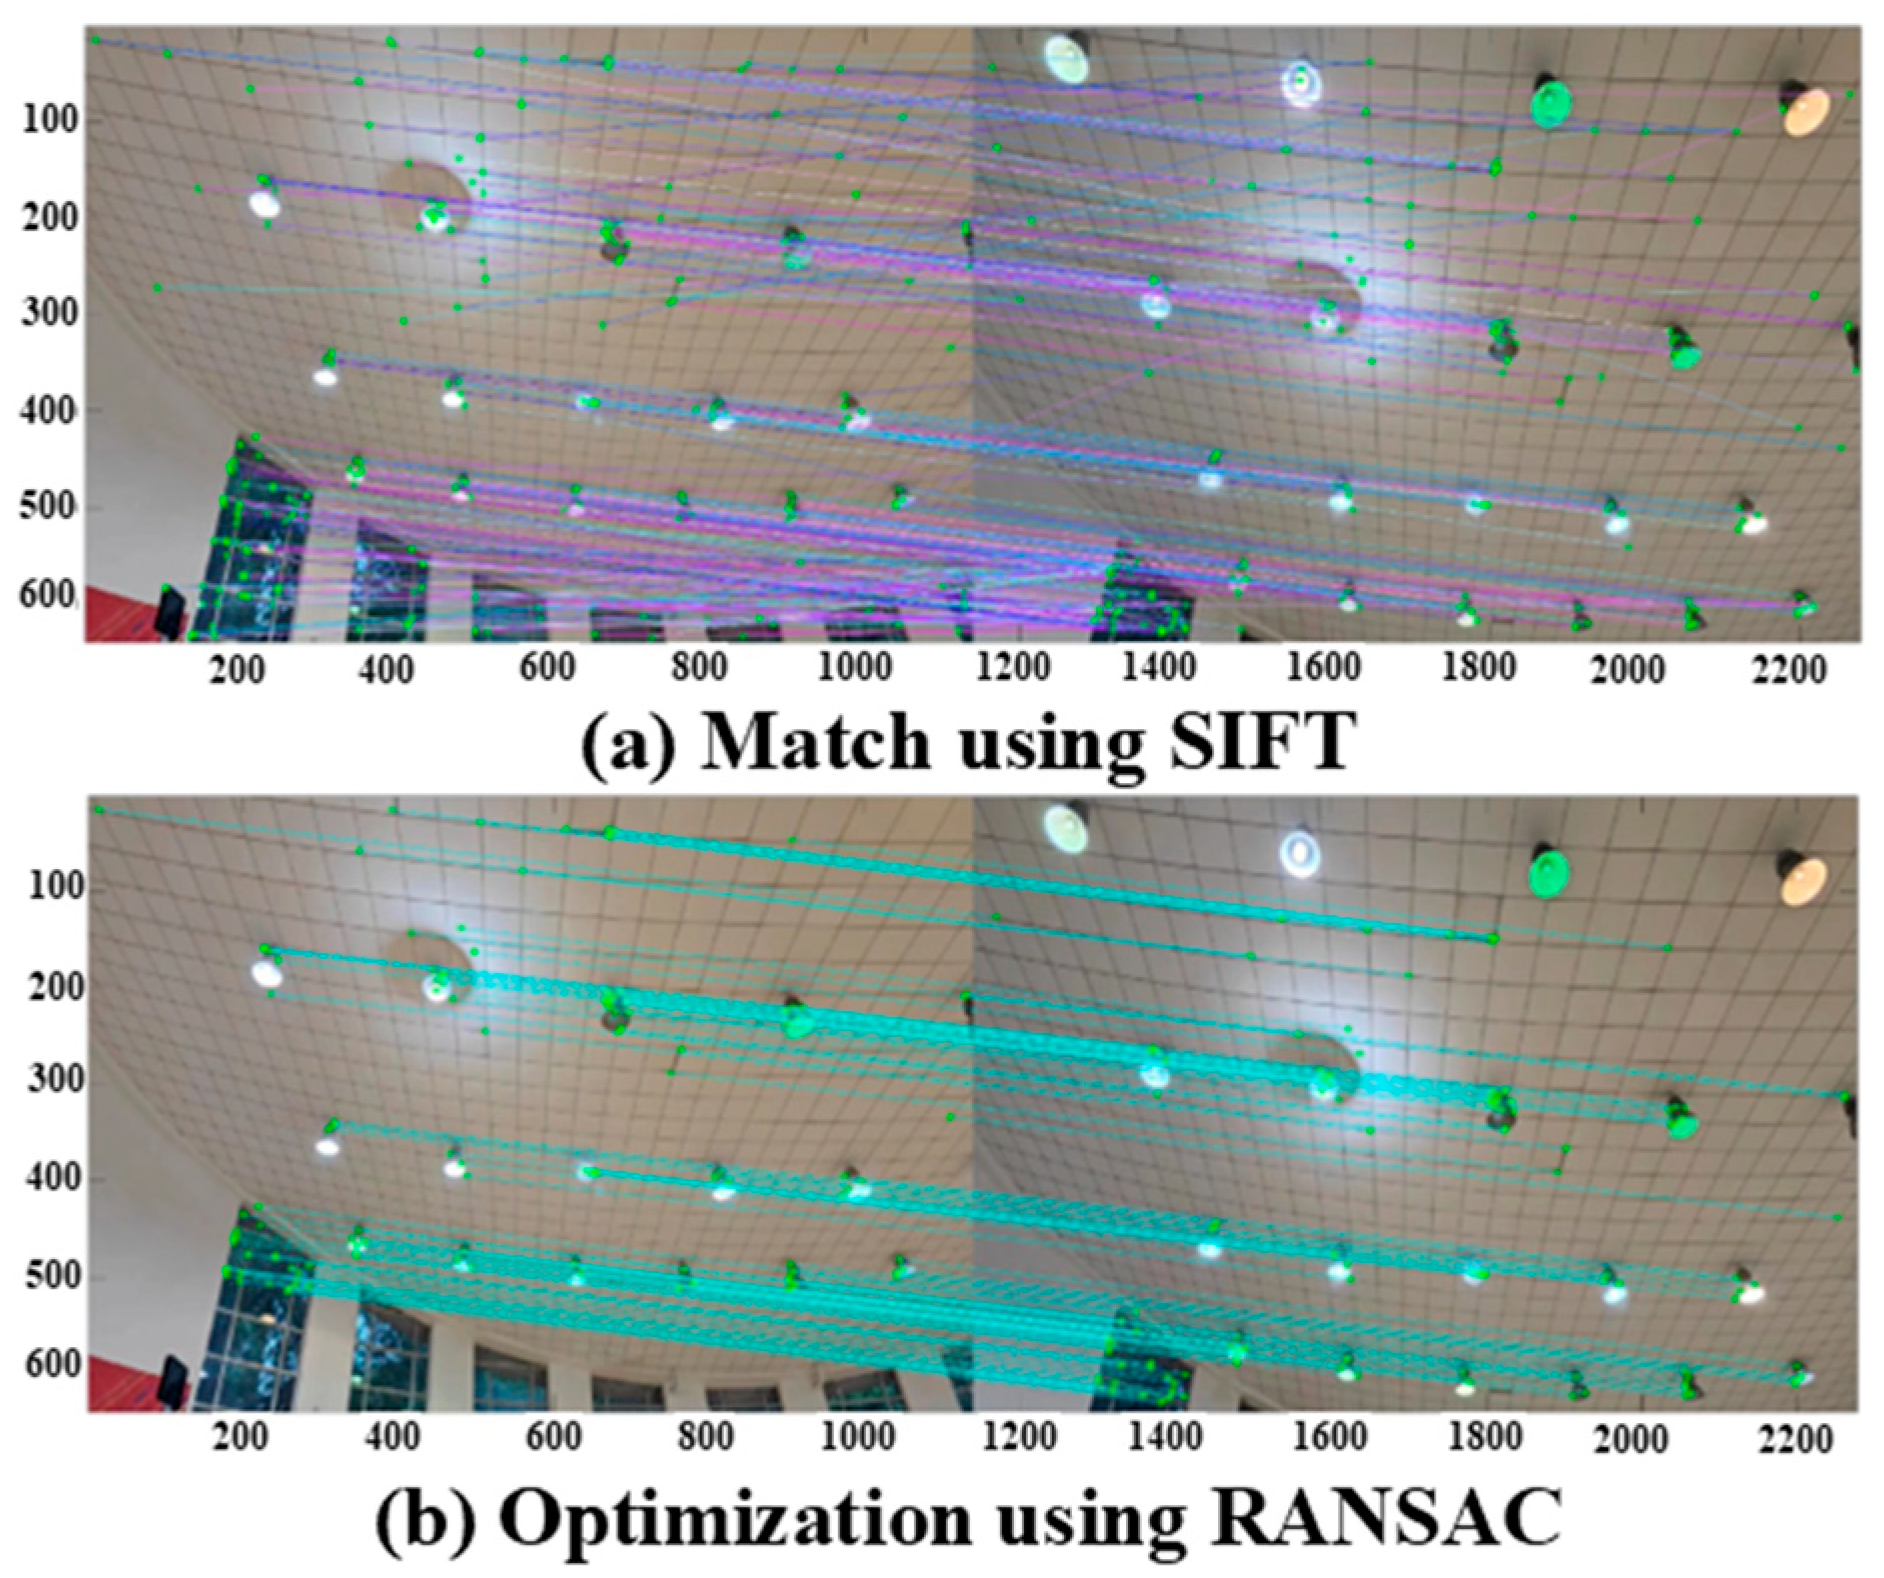
By comparing the feature points detected in the target image and the image to be registered within each set of stitched images, the SIFT algorithm is used to preliminarily match points with identical features in each set. The preliminary matching results are indicated by blue-violet lines, as shown in Figure 6a, Figure 7a, Figure 8a, Figure 9a, Figure 10a and Figure 11a. It can be observed that a considerable number of incorrect matches occur in the initial matching, particularly in the image edge regions. Such erroneous matches can lead to blurring, ghosting, or misalignment in the stitched images, which is detrimental to damage detection in panoramic images. Therefore, it is necessary to optimize the feature point matching results to achieve precise matching. To improve registration accuracy further, the Random Sample Consensus (RANSAC) algorithm is used to optimize feature point matching. The RANSAC algorithm is an optimization method widely used in computer vision for fitting straight lines and computing fundamental transformation matrices between images or point clouds. This method achieves the goal of fitting optimization by randomly sampling from the original data and repeatedly selecting a set of random subsets from the data. The selected subset is assumed to be the inlier set, which was set as the initial value to fit the estimated model. This model adapts to the assumed inner points, with all unknown parameters calculable from the assumed inner points. Simultaneously, this fitting model is used to test other data points. If a point fits the estimated model, it is also considered a new inner point, continuously expanding the inlier set. When the number of inner points in the inlier set reaches a sufficient size, feature matching accuracy improves. The expanded inlier set is then used to re-evaluate the model, obtaining an updated fitting model. The above process constitutes a complete iteration cycle. Through repeated iterations, the model with optimal performance is ultimately obtained. As shown in Figure 7, Figure 8, Figure 9, Figure 10, Figure 11 and Figure 12, the blue-violet lines represent the SIFT feature point matching results, while cyan lines represent the RANSAC-optimized feature point matching results. After RANSAC optimization, the cyan lines no longer scatter but appear as parallel straight lines between the target image and the image to be registered, indicating much more accurate feature point matching between the two images. The detailed numbers of registration points and inlier rates before and after optimization for each image group are shown in Table 2. After optimization, the number of incorrect matches is reduced by 35% to 75% compared to the initial matching results, resulting in a significant improvement in the accuracy of image feature registration. Therefore, the registration points filtered and optimized by the RANSAC algorithm enable more precise panoramic image stitching.

3.3. Image Stitching Quality

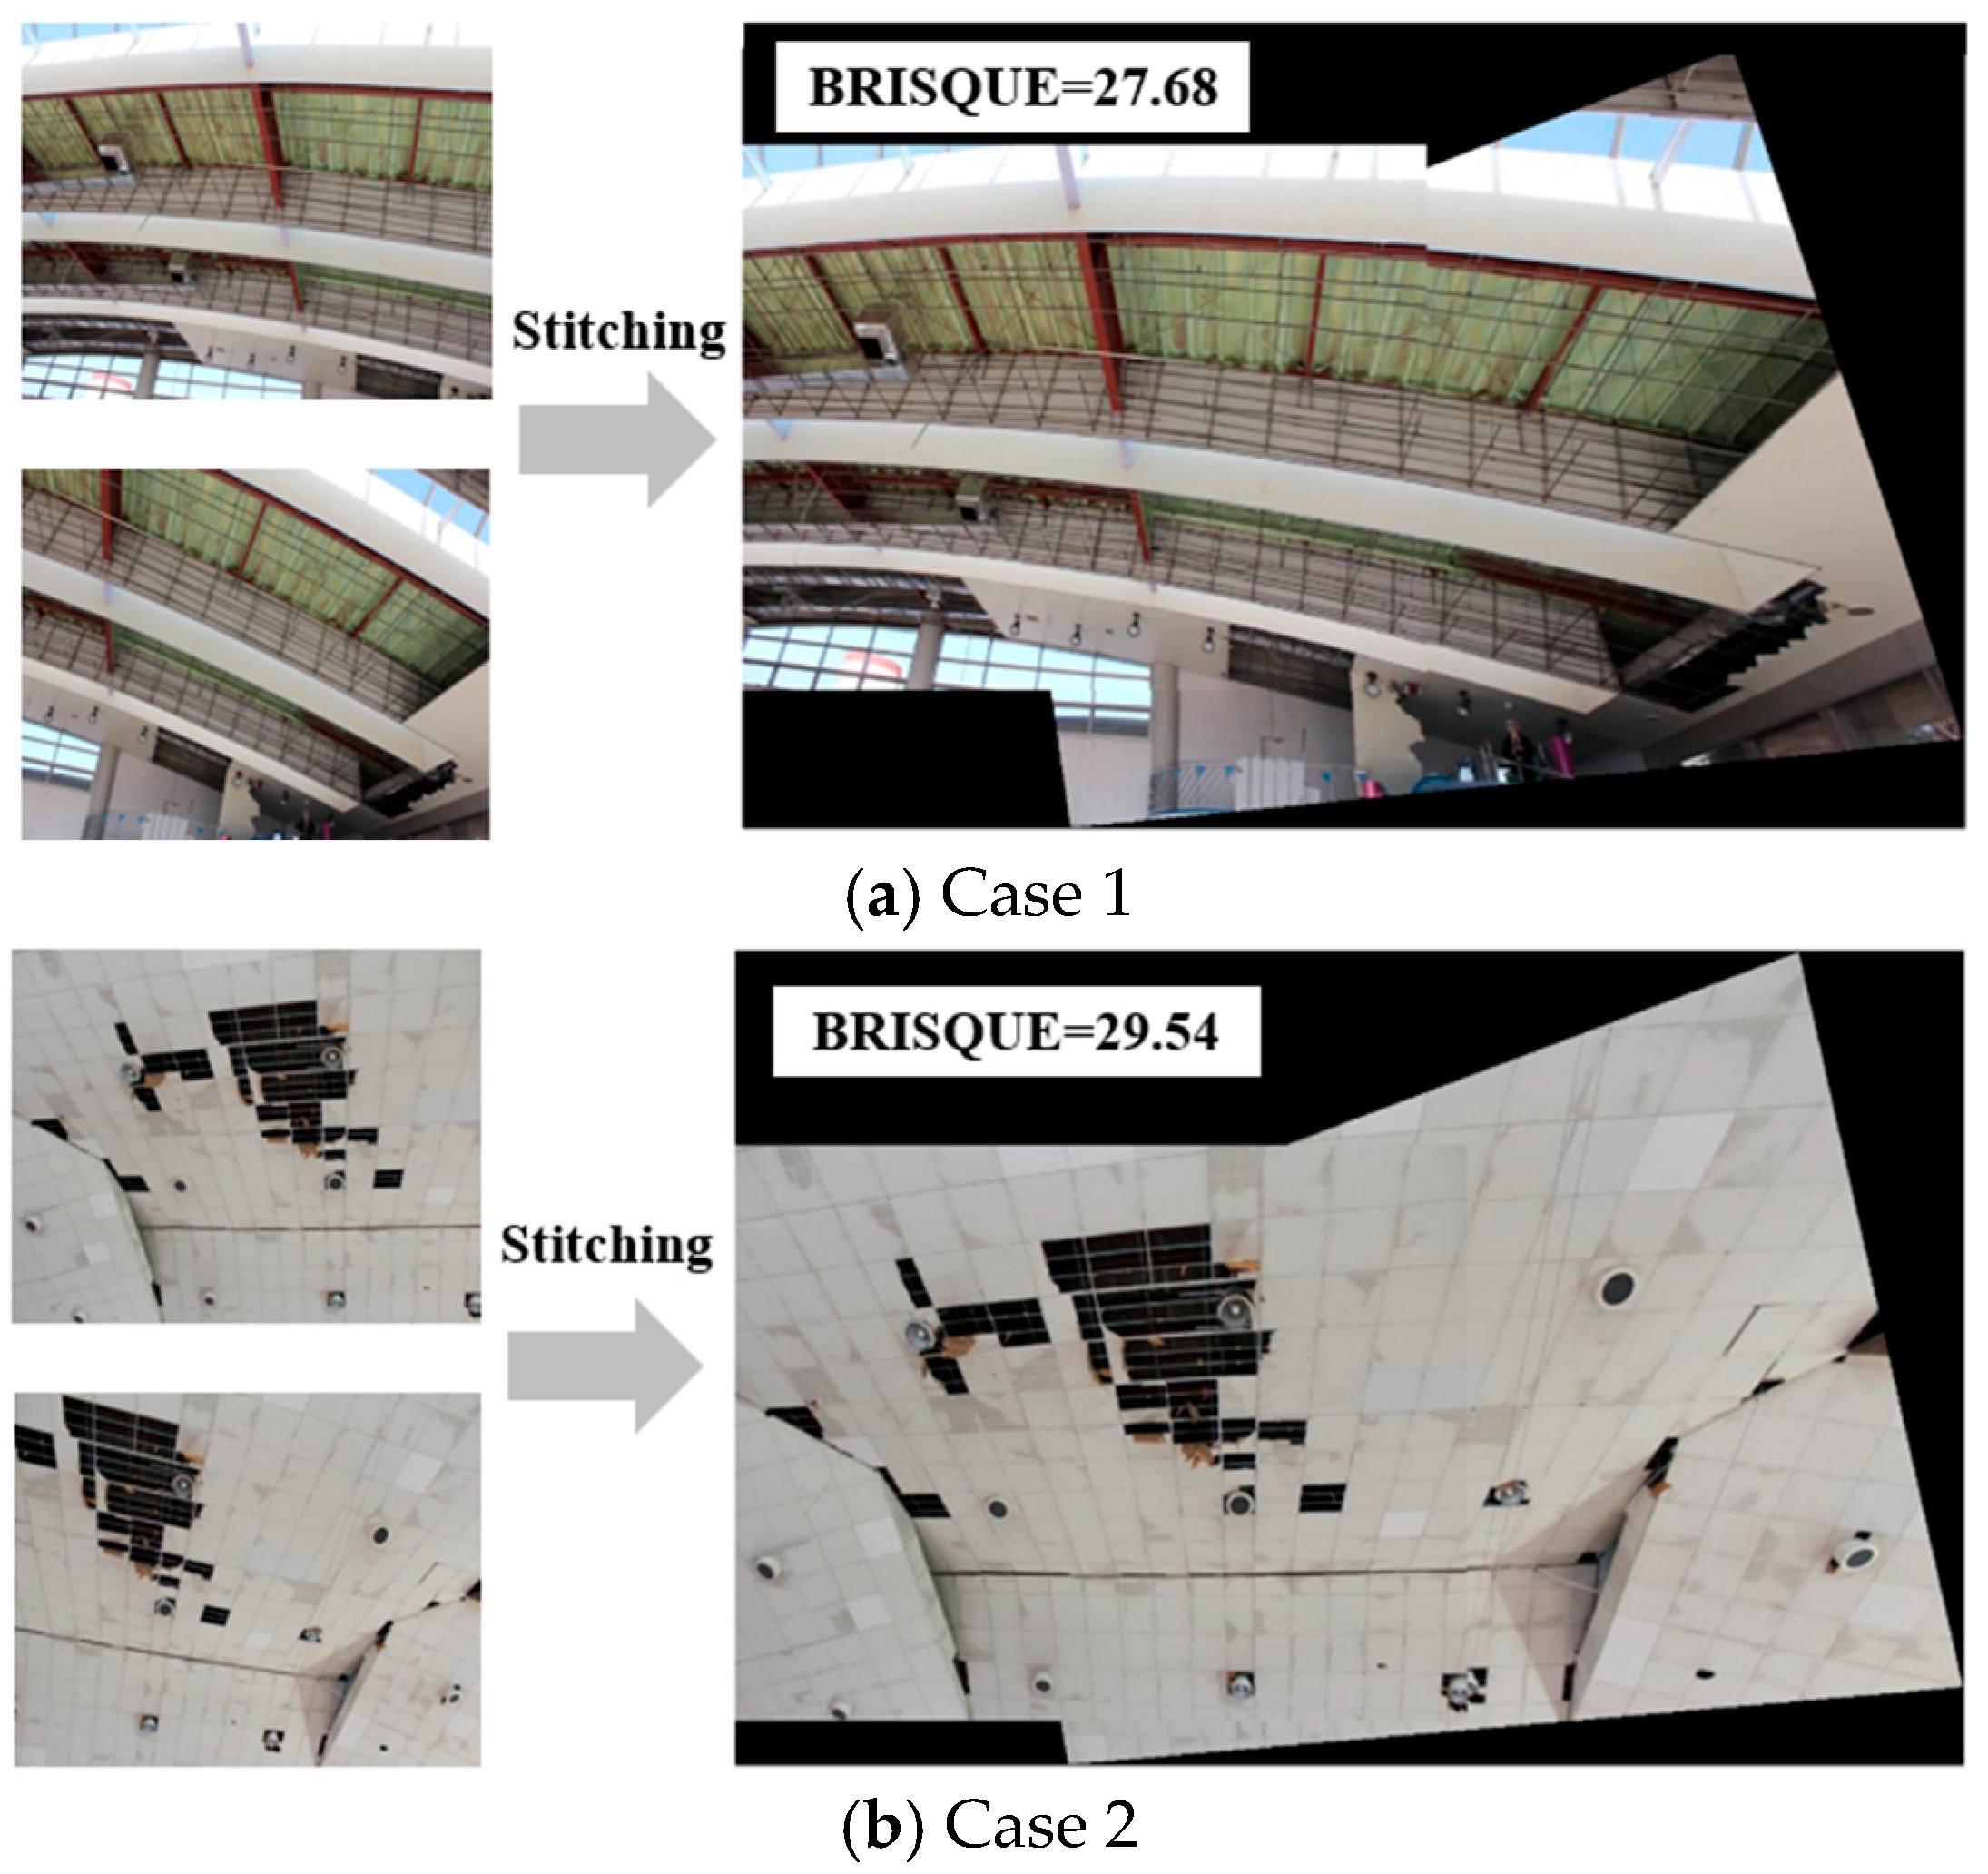
The quality of the stitched images was evaluated using the BRISQUE image quality assessment metric, as shown in Figure 13. The BRISQUE values for all sets of stitched images are around 20 to 30, indicating good stitching performance [28]. Compared to the other four stitched images, the stitching lines in Figure 13a,b are more noticeable. This is because the stitching lines either pass through or are very close to ceiling light sources, and they are mostly located at the image edges in the original images. Therefore, images taken from different angles can have significant color differences, resulting in more prominent stitching lines in the final stitched images. In Figure 13c–f, the stitched images do not exhibit problems of blurring or feature artifacts caused by the projection transformation, and the image edges are unaffected by the light source. This effectively reduces the appearance of stitching lines at the edges of the image overlap area, caused by varying light sources and shooting angles, resulting in a very smooth overall stitching effect. Taking both the BRISQUE evaluation metrics and the visual results of the stitched images into account, all the stitched images show excellent alignment of overlapping regions, smooth transitions between stitched ceiling panel areas, and clear, undistorted straight edges at the panel borders, with good registration in terms of contrast, brightness, and structural features. The stitching lines that appear in Figure 13a,b only affect the brightness in local areas and do not cause geometric distortion or deformation, thus not affecting the identification of earthquake-induced damage to the ceiling. In summary, the panoramic image stitching method, based on SIFT feature point detection and registration and optimized with the RANSAC algorithm, meets the application standards for natural images and demonstrates excellent performance in stitching images of suspended ceiling areas.

4. Results and Discussion

4.1. Image Stitching of the Test Set

The images of earthquake-induced ceiling damage were sourced from post-earthquake photographs taken by the Kawaguchi Lab during damage surveys of buildings, such as gymnasiums, swimming pools, and exhibition halls, which were used as shelters following the 1995 Great Hanshin-Awaji Earthquake in Japan [29]. The image set comprises a total of 1953 photos [10], from which the authors selected 423 images to form 227 image pairs. First, two images capturing the same ceiling area can form one pair. Then, the image pair capturing the same ceiling area must have over 60% overlapping regions to ensure sufficient feature points. Using SIFT feature point detection and registration optimized with the RANSAC algorithm, 227 groups of images from the stitching test set were processed. The computation processing time for each stitched image is from 1 to 5 min, corresponding to ceiling areas ranging from 720 m2 to 4500 m2. Combining two evaluation metrics of stitched time and ceiling area, the average computation time for processing a ceiling stitched image is 0.06 s per m2 of ceiling area. The BRISQUE values of 227 stitched images range from 26 to 39, with an average of 32.6. The average BRISQUE values of the test set are slightly higher than those of the initial tests in Section 3.1, which indicates the presence of stitched images with poor stitching quality. Therefore, based on different BRISQUE value ranges, a detailed analysis of the quality of stitched images and their impact on damage identification and safety assessment is conducted. As shown in Figure 14, stitched images with lower BRISQUE values (186 groups, accounting for 67% of the test set) demonstrate clear and accurate feature point registration, smooth fusion and transition in overlapping regions, and no obvious stitching lines, effectively avoiding problems such as blurring and artifacts and exhibiting excellent stitching performance. As the BRISQUE value increases, the quality of image stitching declines. For example, Figure 15 shows typical stitched images with BRISQUE values between 30 and 35 (63 groups, or 23% of the test set), where some images present local stitching misalignments. This is the main reason for the higher BRISQUE scores. Upon examination, misaligned areas are typically found in non-ceiling regions with bright colors, such as sunlit window areas, or in dark regions within the ceiling, like black voids left by fallen ceiling panels. These areas have very few keypoints for matching due to extreme brightness or darkness, resulting in poorer stitching quality. From the perspective of ceiling earthquake damage applications, local stitching misalignments occurring in non-ceiling regions do not affect the ceiling area and are not part of the damage region, thus having no impact on identifying earthquake damage in the ceiling. Local misalignments within the ceiling area are observed in the dark voids left by fallen ceiling panels. These misalignments do not affect the characteristics of the fallen ceiling damage and, therefore, do not impact the identification of earthquake damage. With further increases in BRISQUE value, 28 groups of stitched images have BRISQUE values between 35 and 39 (approximately 10% of the test set), as shown in Figure 16. These images exhibit more noticeable stitching lines and local misalignments. Such images were typically taken in poor lighting or with overexposure, resulting in lower image quality and reduced accuracy in keypoint matching. However, regarding ceiling damage features, the stitched images retain all the characteristics of the ceiling area and its earthquake-induced damage, allowing the damage type and area to be identified visually. In principle, this should not have a significant impact on the accuracy of damage recognition models and safety assessments. When taking photos, it is recommended to shoot in environments with natural lighting and avoid overexposure.
In summary, the image stitching method, which is based on SIFT feature point detection and registration and is optimized by the RANSAC algorithm, enables the effective stitching of suspended ceiling areas in large-scale public buildings. Results from the stitching test set, composed of post-earthquake real-world images, show that 90% of stitched images have BRISQUE values below 35. These images exhibit clear and accurate feature point registration, smooth transitions in overlapping regions, and no noticeable stitching lines, demonstrating excellent stitching performance. Images with higher BRISQUE values and average stitching quality may exhibit prominent stitching lines and local misalignments. However, these do not affect the ceiling area or its earthquake-induced damage features, making such images suitable for ceiling damage identification and safety assessment.

4.2. Safety Assessment of Stitched Ceiling Images

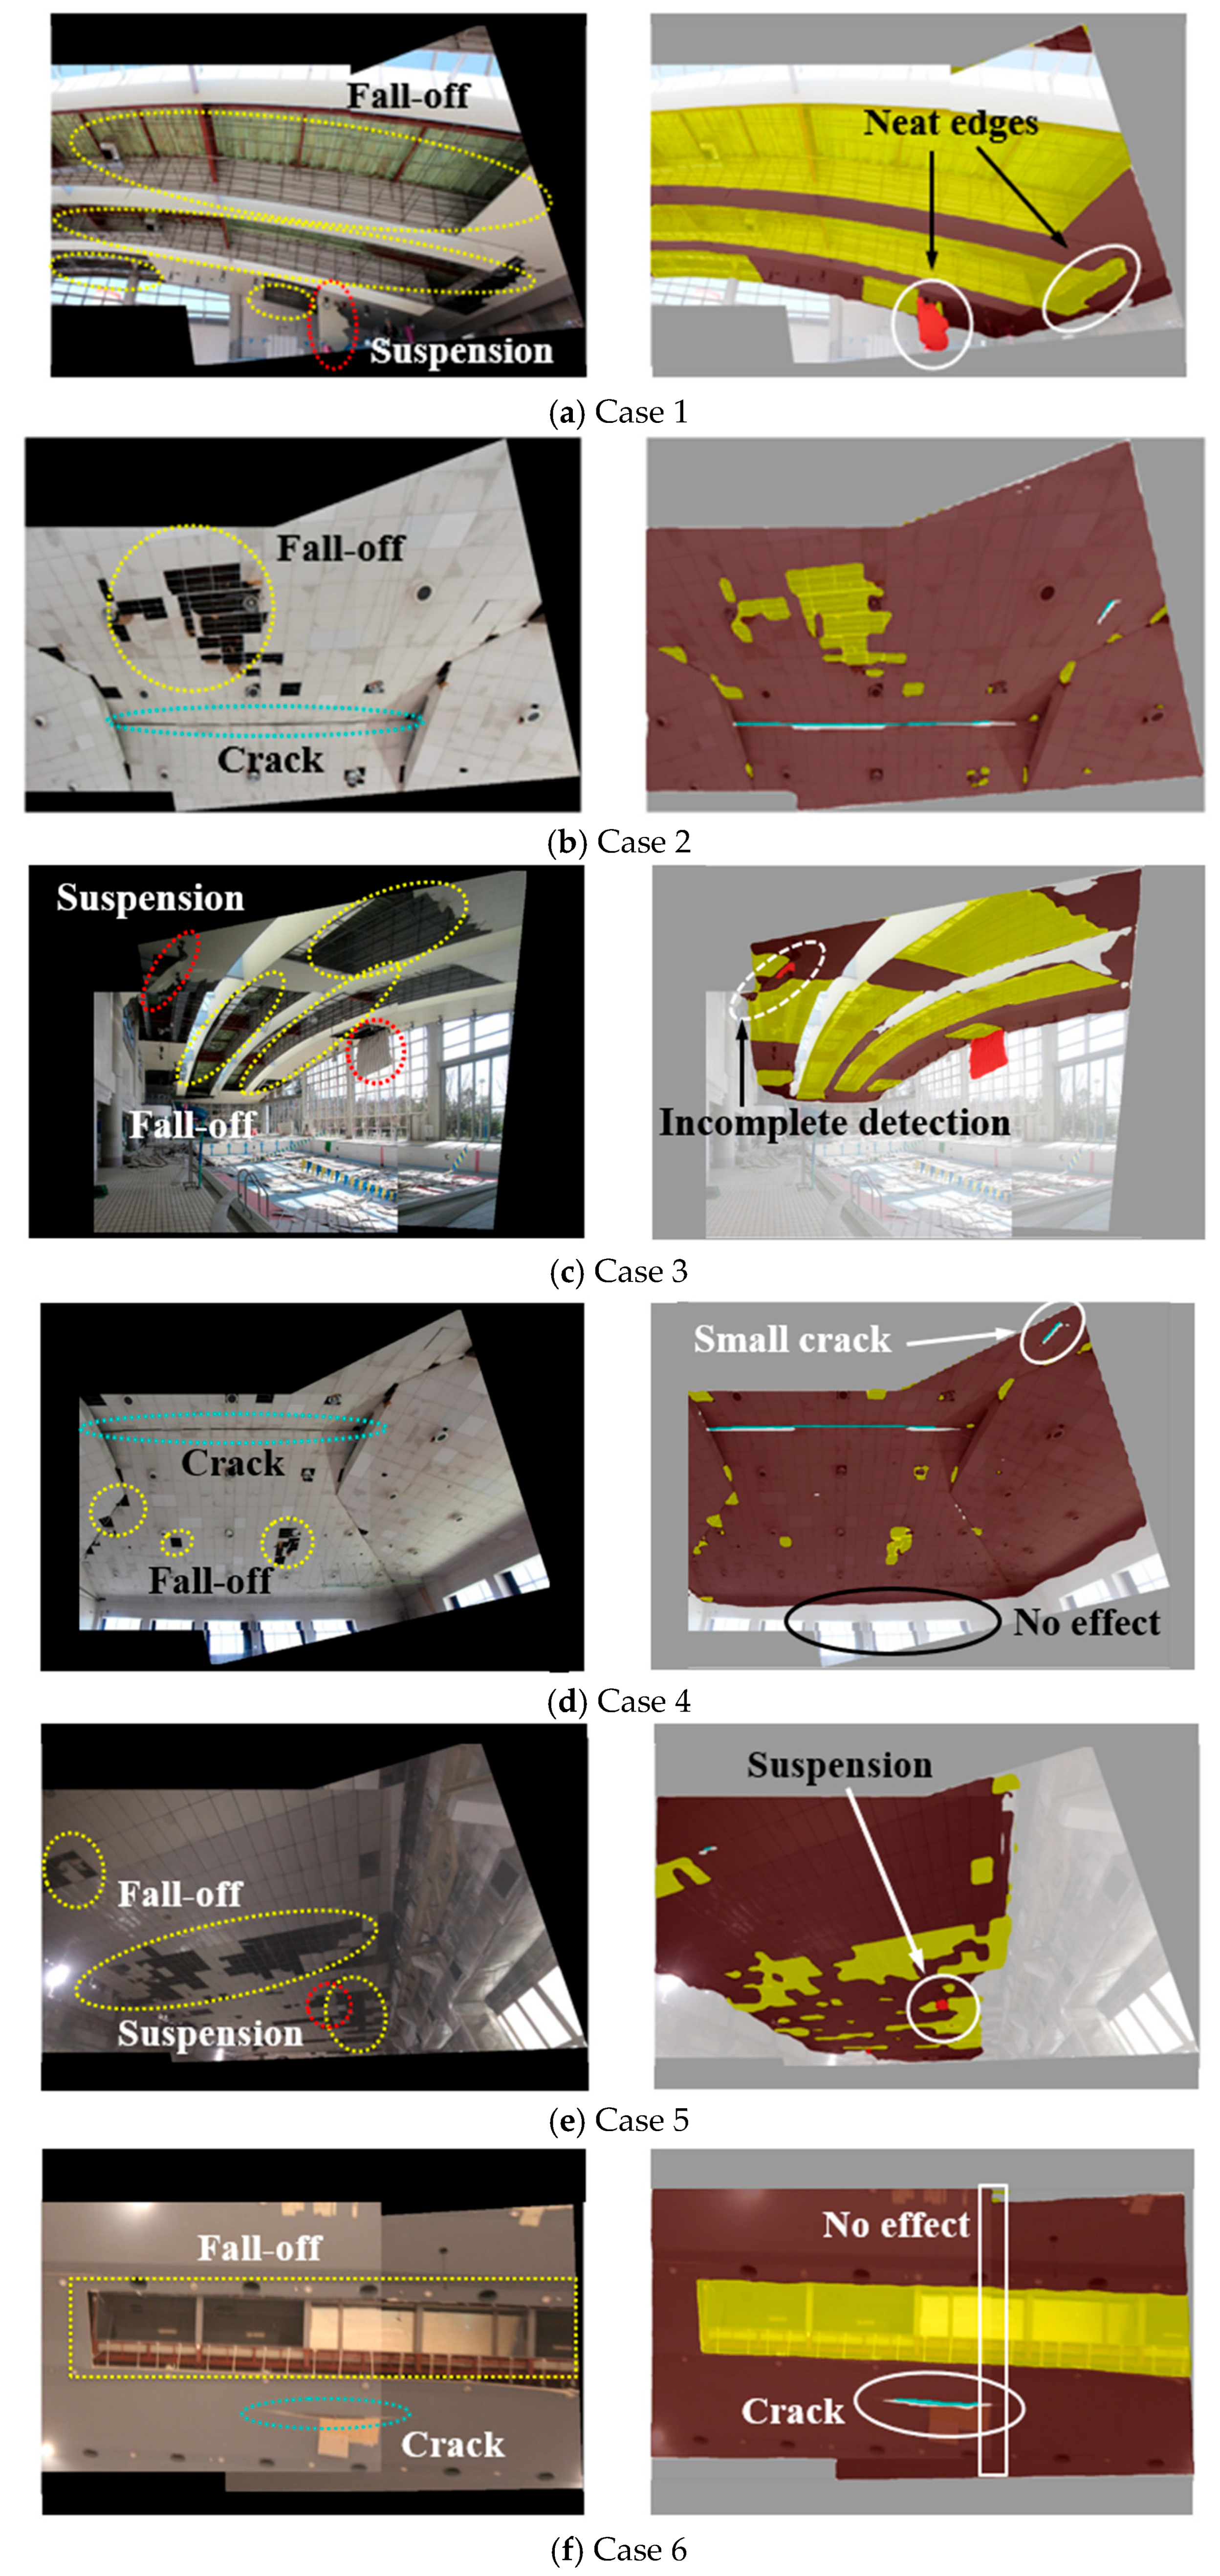
An existing intelligent post-earthquake safety assessment method for suspended ceilings in large-scale public buildings [11] was used to evaluate the safety of 227 stitched images from the test set. The assessment results showed that 224 images were accurately evaluated, and 3 images were misclassified, resulting in an assessment accuracy of 98.7%. This is almost identical to the accuracy rate of 98.6% obtained for non-stitched post-earthquake ceiling images [11], indicating that image stitching does not affect the accuracy of ceiling safety assessments. The semantic segmentation detection results for the 423 non-stitched images in the dataset show that the average values of intersection over union (IoU) and recall are 84.7% and 92.3%, respectively. Among them, for the ceiling fall-off, the IoU and recall results are 91.6% and 95.3%, respectively. For the ceiling suspension, the IoU and recall results are 82.2% and 86.4%, respectively. For the ceiling crack, the IoU and recall results are 51.2% and 71.1%, respectively. Regarding the 227 stitched images, the average values of IoU and recall are 86.7% and 93.7%, respectively. Among them, for the ceiling fall-off, the IoU and recall results are 92.3% and 95.7%, respectively. For the ceiling suspension, the IoU and recall results are 87.2% and 91.3%, respectively. For the ceiling crack, the IoU and recall results are 62.6% and 80.7%, respectively. Based on the detection results, stitched images have better accuracy. In particular, the IoU and recall of suspension and crack damage detection improved by 5% to 10% compared to non-stitched images, indicating that using stitched images can enhance the damage detection capability for small targets due to the increased damage area ratio of small targets. Regarding the quantitative data of safety assessments for the entire dataset of stitched images, the mean absolute error values for pixel numbers related to fall-off, suspension, crack, and fall-off rate are 1972, 242, 173, and 1.39%, respectively. Compared to the corresponding values of 2358, 311, 191, and 1.52% obtained from the entire dataset of non-stitched images, the mean absolute error values of the metric obtained from the dataset of stitched images are slightly smaller. The safety assessment results for the stitched images can be further analyzed using damage identification and localization visualization images of typical cases, along with semantic segmentation detection data, as shown in Figure 17 and Table 3.
As shown in Figure 17, all three types of ceiling damage—fall-off, suspension, and crack—are accurately identified and located, with the recognized regions almost perfectly overlapping the actual damage areas. Precise segmentation is achieved for all types of damage and the edges of damaged regions, including minor and difficult-to-detect cases of ceiling panel suspension and cracking. Further quantitative analysis of different damage type recognition areas—such as pixel counts and panel detachment rates—is presented in Table 3. Cases 1 through 6 correspond to six stitched images with BRISQUE values ranging from 23 to 39, consistent with the example images analyzed in Section 4.1. The statistical data show that, regardless of whether the BRISQUE value is high or low, the quantitative indicators for ceiling fall-off area and fall-off rate in damage detection have very small errors, both below 7% and 10%, respectively; in some excellent cases, the error is even less than 0.5%, demonstrating high precision. These two quantitative indicators are crucial criteria for safety assessment, thus ensuring the reliability of the evaluation. For the detection of suspension and cracking damage, the quantitative error is less than 10% when the BRISQUE value is below 35, and increases to no more than 30% when the BRISQUE value exceeds 35. The main reason is that ceiling suspension and cracks are usually a small damage target. For cases 5 and 6, the pixel values of the ceiling crack area in the image are only 852 and 1762, respectively. Compared to the pixel values of tens of thousands in the ceiling fall-off area, the base number is very small, and even a slight identification deviation can result in a significant error. However, in safety assessment, the key is whether ceiling suspension and cracking damage are detected [11]; a 30% error in the quantitative data is acceptable, and such large errors only occur when the stitching quality is extremely poor. The primary reason for poor stitching quality is poor image capture quality. This can be avoided by adjusting the photography method, such as ensuring that the images to be stitched have sufficient overlap to yield enough key feature points. In addition, the visualization images confirm that misalignments in non-ceiling regions do not affect the accuracy of safety assessment for the ceiling area, as shown in Figure 17d,f. The reason for the three misclassified stitched images in the safety assessment is the failure to detect ceiling suspension damage. These images are all wide-field, distant views and extremely dark, with very small ceiling suspension areas occupying less than 0.01% of the total image pixels. This leads to missed damage detection—an issue that also occurs with non-stitched images [11]. This problem can be addressed by capturing high-quality, close-up, small-field-of-view images for stitching, thereby improving the recognition of very small ceiling suspension areas in wide-field, distant images.
In terms of computational time required for safety assessments, approximately 10 min are needed for using stitched images, which includes the time required for all steps: image capture (6 to 8 images), image stitching, and safety assessment of the stitched image. The time required for each step—image capture, image stitching, and safety assessment—is 7 min, 3 min, and 10 s, respectively. When using non-stitched images, approximately 2 min are needed to take a single image and conduct a safety assessment. Although the safety assessment using image stitching takes longer than that using non-stitched images, 10 min is entirely acceptable—far less time than the traditional manual inspection and assessment.
In summary, when the BRISQUE value of a stitched image is less than 35, the method enables the precise identification and localization of three types of ceiling damage—fall-off, suspension, and crack—with minor pixel-based quantitative errors. When the BRISQUE value exceeds 35, detection errors increase but remain under 30%; however, this increased error does not affect the overall accuracy of the safety assessment. An accuracy rate of 98.7% for safety assessments has been obtained.
From a practical application perspective, the image data set selected in this study includes a variety of ceiling designs. Most of these designs applied light tones as their base color, incorporating dark lines or lacking dark patterns. Additionally, all ceilings employed a pattern repetition design. Therefore, the proposed safety assessment method based on image stitching is highly suitable for typical ceiling designs that utilize light color-based tones and pattern repetition layouts. For rapid post-disaster reconnaissance, the proposed assessment model based on image stitching has the potential to develop into an application for installation on smartphones.

5. Conclusions

This study proposed a panoramic image stitching method based on SIFT feature point detection and registration, optimized with the RANSAC algorithm, capable of generating high-resolution, wide-angle panoramic images of suspended ceilings in large-scale public buildings. Using this image stitching approach, 423 actual images of earthquake-induced ceiling damage were stitched to produce 227 panoramic images, and the stitching quality and its impact on the characteristics of the ceiling damage were analyzed. Finally, by integrating damage identification and image stitching techniques, a safety assessment was conducted on 227 stitched images of earthquake-induced ceiling damage using evaluation indicators such as damage type and quantified severity. The main conclusions obtained are as follows:
(1) The panoramic image stitching method, based on SIFT feature point detection and registration, optimized by the RANSAC algorithm, enables precise alignment and smooth transitions in the overlapping regions of the ceiling in different images. The straight edges of the ceiling panels are clear and distortion-free, with BRISQUE values for the stitched images ranging from 20 to 30, indicating excellent stitching quality and the successful generation of high-resolution, wide-angle panoramic images of suspended ceilings in large-scale public buildings. The SIFT feature point detection and registration method has great potential for processing the building ceiling area with design characteristics of light color, low texture, and pattern repetition.
(2) Among the 227 stitched images created from 423 actual photos of earthquake-induced ceiling damage, 90% have BRISQUE values below 35. These stitched images exhibit clear and accurate feature point registration, with excellent smoothness and seamless transitions in the overlapping regions, and no visible stitching lines, demonstrating outstanding stitching performance. Images with higher BRISQUE values and average stitching quality may exhibit noticeable stitching lines and local misalignments; however, they do not affect the ceiling area or its earthquake-induced damage features, and such images remain suitable for ceiling damage identification and safety assessment.
(3) The intelligent safety assessment of the 227 stitched images of earthquake-induced ceiling damage achieved an accuracy rate of 98.7%, achieving a combination of panoramic image generation technology based on image stitching and damage detection technology based on semantic segmentation. The average values of IoU and recall are 86.7% and 93.7% for the ceiling damage detection of stitched images, respectively, which are greater than the values of non-stitched images. In particular, the IoU and recall of suspension and crack damage detection improved by 5% to 10% compared to non-stitched images, indicating that the use of stitched images can improve the damage detection accuracy for small targets.
(4) When the BRISQUE value of a stitched image is less than 35, the method enables precise identification and localization of three types of ceiling damage—fall-off, suspension, and crack—with pixel-based quantitative errors below 10%, and in some cases below 0.5%, indicating very high accuracy. When the BRISQUE value exceeds 35, detection errors increase but remain under 30%. The successful detection of the ceiling suspension and crack is crucial for a safe assessment. Therefore, a 30% error in quantitative data is acceptable, which does not affect the accuracy of the safety assessment. As a result, this technology enables high-precision, intelligent safety assessments of the entire ceiling area in large public buildings following an earthquake, which is of significant importance and practical value for rapidly determining the safety of suspended ceilings in emergency shelters after an earthquake.

Author Contributions

Conceptualization, L.W.; Methodology, Y.L. and S.Y.; Software, Y.L. and S.Y.; Validation, L.W.; Investigation, L.W., Y.L. and S.Y.; Resources, L.W.; Writing—original draft, Y.L. and S.Y.; Writing—review & editing, L.W.; Supervision, L.W.; Funding acquisition, L.W. All authors have read and agreed to the published version of the manuscript.

Funding

This research was funded by the National Natural Science Foundation of China grant number 52008291.

Data Availability Statement

The original contributions presented in this study are included in the article. Further inquiries can be directed to the corresponding author(s).

Acknowledgments

The authors of this paper would like to express their gratitude for the support provided by the National Science Center for Earthquake Engineering.

Conflicts of Interest

The authors declare no conflict of interest.

References

  1. Zhai, C.; Yue, Q.; Xie, L. Evaluation and construction of seismic resilient cities. J. Build. Struct. 2024, 45, 1–13. [Google Scholar] [CrossRef]
  2. Kawaguchi, K. Damage to Non-structural Components in Large Rooms by the Japan Earthquake. In Structures Congress; American Society of Civil Engineers: New York, NY, USA, 2012; pp. 1035–1044. [Google Scholar] [CrossRef]
  3. Han, Q.; Zhao, Y.; Lu, Y. Seismic behavior and resilience improvements of nonstructural components in the large public buildings—A review. China Civ. Eng. J. 2020, 53, 1–10. [Google Scholar] [CrossRef]
  4. Xie, L.; Qu, Z. On civil engineering disasters and their mitigation. Earthq. Eng. Eng. Vib. 2018, 17, 1–10. [Google Scholar] [CrossRef]
  5. Hu, W.; Wang, W.; Ai, C.; Wang, J.; Wang, W.; Meng, X.; Liu, J.; Tao, H.; Qiu, S. Machine vision-based surface crack analysis for transportation infrastructure. Autom. Constr. 2021, 132, 103973. [Google Scholar] [CrossRef]
  6. Dais, D.; Bal, İ.E.; Smyrou, E.; Sarhosis, V. Automatic crack classification and segmentation on masonry surfaces using convolutional neural networks and transfer learning. Autom. Constr. 2021, 125, 103606. [Google Scholar] [CrossRef]
  7. Kurata, M.; Li, X.; Fujita, K.; Yamaguchi, M. Piezoelectric dynamic strain monitoring for detecting local seismic damage in steel buildings. Smart Mater. Struct. 2013, 22, 115002. [Google Scholar] [CrossRef]
  8. Pathirage, S.N.; Li, J.; Li, L.; Hao, H.; Liu, W.; Ni, P. Structural damage identification based on autoencoder neural networks and deep learning. Eng. Struct. 2018, 172, 13–28. [Google Scholar] [CrossRef]
  9. Wang, L.; Kawaguchi, K.; Wang, P. Damaged ceiling detection and localization in large-span structures using convolutional neural networks. Autom. Constr. 2020, 116, 103230. [Google Scholar] [CrossRef]
  10. Wang, P.; Xiao, J.; Kawaguchi, K.; Wang, L. Automatic Ceiling Damage Detection in Large-Span Structures Based on Computer Vision and Deep Learning. Sustainability 2022, 14, 3275. [Google Scholar] [CrossRef]
  11. Han, Q.; Yan, S.; Wang, L.; Kawaguchi, K. Ceiling damage detection and safety assessment in large public buildings using semantic segmentation. J. Build. Eng. 2023, 80, 107961. [Google Scholar] [CrossRef]
  12. Wang, B.; Yang, Z. Review on image-stitching techniques. Multimed. Syst. 2020, 26, 413–430. [Google Scholar] [CrossRef]
  13. Lingua, A.; Marenchino, D.; Nex, F. Performance analysis of the SIFT operator for automatic feature extraction and matching in photogrammetric applications. Sensors 2009, 9, 3745–3766. [Google Scholar] [CrossRef]
  14. Schwind, P.; Suri, S.; Reinartz, P.; Siebert, A. Applicability of the SIFT operator to geometric SAR image registration. Int. J. Remote Sens. 2010, 31, 1959–1980. [Google Scholar] [CrossRef]
  15. Li, F.; Ye, F. Summarization of SIFT-based remote sensing image registration techniques. Remote Sens. Land Resour. 2016, 28, 14–20. [Google Scholar] [CrossRef]
  16. Wu, X.; Zhao, Q.; Bu, W. A SIFT-based contactless palmprint verification approach using iterative RANSAC and local palmprint descriptors. Pattern Recognit. 2014, 47, 3314–3326. [Google Scholar] [CrossRef]
  17. Vourvoulakis, J.; Kalomiros, J.; Lygouras, J. FPGA-based architecture of a real-time SIFT matcher and RANSAC algorithm for robotic vision applications. Multimed. Tools Appl. 2018, 77, 9393–9415. [Google Scholar] [CrossRef]
  18. Wang, L.; Spencer, B.F.; Li, J.; Hu, P. A fast image-stitching algorithm for characterization of cracks in large-scale structures. Smart Struct. Syst. 2021, 27, 593–605. [Google Scholar] [CrossRef]
  19. Cheng, K.; Shan, J.; Liu, Y. Feature-based image stitching for panorama construction and visual inspection of structures. Smart Struct. Syst. 2021, 28, 661–673. [Google Scholar] [CrossRef]
  20. Cui, D.; Zhang, C. crack detection of curved surface structure based on multi-image stitching method. Buildings 2024, 14, 1657. [Google Scholar] [CrossRef]
  21. Zhu, Z.; German, S.; Brilakis, I. Detection of large-scale concrete columns for automated bridge inspection. Autom. Constr. 2010, 19, 1047–1055. [Google Scholar] [CrossRef]
  22. Xie, R.; Xie, J.; Xie, R.; Ya, J.; Liu, K.; Lu, X.; Liu, Y.; Xia, M.; Zeng, Q. Automatic multi-image stitching for concrete bridge inspection by combining point and line features. Autom. Constr. 2018, 90, 265–280. [Google Scholar] [CrossRef]
  23. Chen, Z.; Chen, Q.; Dai, Z.; Song, C.; Hu, X. Seismic damage quantification of RC short columns from crack image using the enhanced U-Net. Buildings 2025, 15, 322. [Google Scholar] [CrossRef]
  24. Wang, X.; Zhang, F.; Zou, X. Efficient lightweight CNN and 2D visualization for concrete crack detection in bridges. Buildings 2025, 15, 3423. [Google Scholar] [CrossRef]
  25. Zhu, H.; Zhao, S. Research on a rapid image stitching method for tunneling front based on navigation and positioning information. Sensors 2025, 25, 3023. [Google Scholar] [CrossRef]
  26. Zhang, Q.; Rui, T.; Fang, H.; Zhang, J.; Gou, H. Particle Filter Object Tracking Based on Harris-SIFT Feature Matching. Procedia Eng. 2012, 29, 924–929. [Google Scholar] [CrossRef]
  27. Wan, G.; Wang, J.; Li, J.; Cao, H.; Wang, S.; Wang, L.; Li, Y.; Wei, R. Method for quality assessment of image mosaic. J. Commun. 2013, 34, 76–81. [Google Scholar] [CrossRef]
  28. Mittal, A.; Moorthy, A.K.; Bovik, A.C. No-Reference Image Quality Assessment in the Spatial Domain. IEEE Trans. Image Process. 2012, 21, 4695–4708. [Google Scholar] [CrossRef] [PubMed]
  29. Ishikawa, K.; Kawaguchi, K.; Tagawa, K.; Sakai, T.; Sakai, T. Report on gymnasium and spatial structures damaged by hyogoken-hanbu earthquake. AIJ J. Technol. Des. 1997, 3, 96–101. [Google Scholar] [CrossRef]
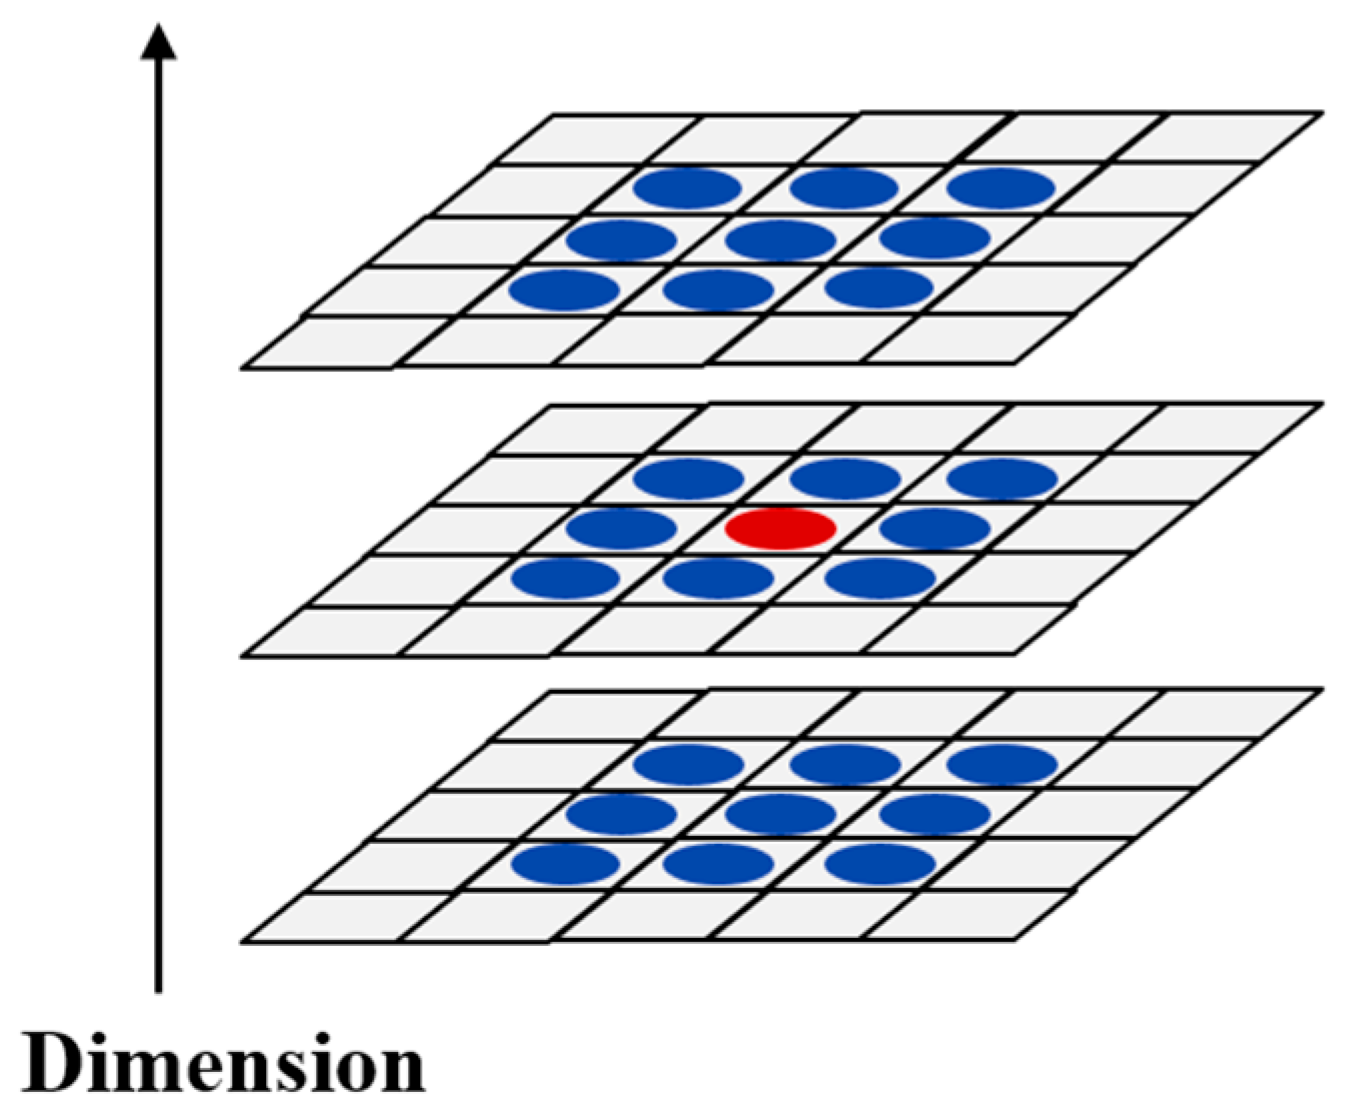
Figure 1. Detection of the local keypoints.
Buildings 15 03922 g001
Figure 2. Three types of damaged ceilings caused by an earthquake.
Buildings 15 03922 g002
Figure 3. Flowchart for determining the main orientation of feature points.
Buildings 15 03922 g003
Figure 4. Example of feature descriptor generation.
Buildings 15 03922 g004
Figure 5. Stitched ceiling images for each group.
Buildings 15 03922 g005
Figure 6. Feature point detection results for each group of stitched images.
Buildings 15 03922 g006
Figure 7. Feature Point Registration and Optimization for the First Set of Stitched Images.
Buildings 15 03922 g007
Figure 8. Feature Point Registration and Optimization for the Second Set of Stitched Images.
Buildings 15 03922 g008
Figure 9. Feature Point Registration and Optimization for the Third Set of Stitched Images.
Buildings 15 03922 g009
Figure 10. Feature Point Registration and Optimization for the Fourth Set of Stitched Images.
Buildings 15 03922 g010
Figure 11. Feature Point Registration and Optimization for the Fifth Set of Stitched Images.
Buildings 15 03922 g011
Figure 12. Feature Point Registration and Optimization for the Sixth Set of Stitched Images.
Buildings 15 03922 g012
Figure 13. Post-stitching results for each group of stitched images.
Buildings 15 03922 g013
Figure 14. Typical stitched images with BRISQUE values in the range of 23 to 30.
Buildings 15 03922 g014
Figure 15. Typical stitched images with BRISQUE values in the range of 30 to 35.
Buildings 15 03922 g015
Figure 16. Typical stitched images with BRISQUE values in the range of 35 to 39.
Buildings 15 03922 g016
Figure 17. Visualization of identification and localization of ceiling damage in stitched images.
Buildings 15 03922 g017
Table 1. Feature point detection results for each set of stitched images.
SetNumber of Feature Points in Target ImageNumber of Feature Points in Registered ImageSetNumber of Feature Points in Target ImageNumber of Feature Points in Registered Image
11331154748901027
294281751027987
3884112861019832
Table 2. Feature registration results for each set of stitched images.
SetRegistration Points Using SIFTOptimized Registration Points Using RANSACInlier Rates/%
138225265.9
228611138.8
3631625.4
426912245.4
533215346.1
625510741.9
Table 3. Safety assessment results for each group of stitched images.
No.CategoryNumber of Pixels for Fall-OffNumber of Pixels for SuspensionNumber of Pixels for CrackFall-Off Rate/%Result
Case 1True755,86913,846070.59Danger
Detection746,29013,392068.86Danger
Error/Accuracy1.3%3.3%02.5%Accurate
Case 2True90,228045106.51Danger
Detection87,497047266.35Danger
Error/Accuracy3.0%04.6%2.5%Accurate
Case 3True292,30019,756050.12Danger
Detection291,64117,866055.11Danger
Error/Accuracy0.2%9.6%09.1%Accurate
Case 4True22,770045002.04Danger
Detection23,207048642.13Danger
Error/Accuracy1.9%07.5%4.4%Accurate
Case 5True144,01172485215.04Danger
Detection134,23793262416.53Danger
Error/Accuracy6.8%28.7%26.7%9.9%Accurate
Case 6True325,3500176325.01Danger
Detection325,8650225525.06Danger
Error/Accuracy0.2%027.9%0.2%Accurate
Disclaimer/Publisher’s Note: The statements, opinions and data contained in all publications are solely those of the individual author(s) and contributor(s) and not of MDPI and/or the editor(s). MDPI and/or the editor(s) disclaim responsibility for any injury to people or property resulting from any ideas, methods, instructions or products referred to in the content.