Abstract
This study presents a novel probabilistic framework that combines the Duration Time Method (DTM) with the ATC-58 damage assessment procedure. The method reduces computational cost by 30% compared to incremental dynamic analysis (IDA) while maintaining < 10% error in collapse prediction for low-to-mid-rise buildings. Accordingly, this study proposes a simplified framework based on the duration time method to estimate seismic responses by considering the uncertainty associated with the record as the most important uncertainty in the seismic responses of structures, and to offer an alternative to the conventional and computationally intensive incremental time history analysis. Then, using the results of the incremental time history and duration analysis in the proposed framework on a sample frame set consisting of 34 concrete frames from 1 to 20 stories, the strengths and weaknesses of the aforementioned method have been investigated. Considering the results of this step, the prediction of probable collapse threshold modes as the most challenging type of response has been identified and investigated in more depth with the help of simple methods. Finally, and in accordance with the research objective, various parameters of seismic damage in the aforementioned frames were extracted using the results of incremental time history analysis and the proposed framework based on the duration time method and using the ATC-58 guideline procedure, and by presenting the related errors, an attempt has been made to provide the audience with a measure of accuracy in estimating damages using this method. Finally, considering the strengths and weaknesses of the proposed method and estimating the volume of calculations in different stages of damage estimation, an attempt has been made to present a strategy for predicting maximum damage based on probabilities in order to examine multiple design options.
1. Introduction
In recent years, the importance of economic and social considerations in seismic design has become increasingly clear to decision-makers and managers, and, in this regard, there has been a greater tendency to estimate the cost of repairs to structural damage and other possible earthquake-related damages during the life of the structure, and life-cycle cost analysis has been proposed as one of the basic components in structural design. Notably, this concept has previously been explored in commercial and economic contexts. While prior studies [1] have applied duration time methods to linear systems, none have integrated them with full PBEE frameworks. However, the majority of previous studies have focused on linear response estimation or deterministic approaches to collapse assessment. For example, Han and Chopra (2006) [2] proposed approximate IDA methods without addressing uncertainty propagation. Azarbakht and Dolšek (2010) [3] introduced efficient IDA variants but lacked probabilistic performance modeling. These gaps underscore the need for a framework that is both computationally efficient and probabilistically robust. Our study contributes by integrating duration-based time history analysis with ATC-58’s probabilistic damage modeling, a synthesis not addressed in prior work. This study bridges that gap by employing the following:
- (1)
- Proposing a scalable acceleration function generation process;
- (2)
- Validating the method against IDA for 34 concrete frames;
- (3)
- Quantifying errors in damage estimation.
Recently, several probabilistic frameworks have been developed to reduce computational costs while maintaining acceptable accuracy in seismic performance estimation. For example, Bradley and Lee (2010) [1] applied surrogate modeling to accelerate loss estimation, while Tafakori et al. (2013) [4] utilized risk-based optimization for retrofit strategies. However, these methods either rely heavily on pre-existing fragility models or simplify demand estimation through deterministic assumptions. Compared to these approaches, the proposed framework directly integrates synthetic duration-based time histories with ATC-58 guidelines, providing a balance between computational efficiency and probabilistic rigor. This integration fills a notable gap in the literature.
Bozorgnia and Bertero [5] investigated the effect of active structural control on reducing the lifetime costs of a structure by considering the behavior of controlled and uncontrolled structures during an earthquake, as well as the costs associated with the establishment and maintenance of control systems. Takahashi et al. [6] formulated the lifetime costs using an earthquake event model at a seismic source and used this method to design a structure with minimum repair and initial costs. Chopra and Gole [7] proposed that pushover analyses be performed independently for each mode and then combined with an idealized one-degree-of-freedom system for each pushover curve using the SRSS or CQC method. This approach has made significant improvements over traditional pushover analysis in cases such as the effect of higher modes on the response of the structure. However, due to the constant load pattern during the analysis, these methods do not consider the change in the contribution of different modes of the structure due to its nonlinearity in the calculations.
Vamvatsikos and Cornell attempted to present a single method for performing and processing its outputs by examining single and multiple record incremental time history analysis [8], which will be fully discussed in the next section because of the use of this method in the present study. By presenting the aforementioned framework, a powerful tool was created to directly examine the reliability of structures by considering record uncertainty, which was subsequently used by many researchers. On the other hand, due to the reflection of the response in continuous levels of seismic hazard by this analysis, its dynamic nature, and its high ability to realistically examine various uncertainties, a suitable framework was created to estimate seismic damage associated with all possible earthquakes during the life of the structure.
Pahlavan et al. [9] pointed out in an economic study of concrete structures with masonry walls. By examining these studies, it can be seen that the use of incremental time history analysis, despite its many advantages, also creates problems in the process of seismic analysis of structures, the main reason for which is the large volume of calculations required to perform the aforementioned analysis. In this regard, many studies have been conducted to provide simpler and approximate methods for this type of analysis, including the works of Han and Chopra [2] and Azar Bakht and Delsek [3]. Valamanesh and Istakkanchi [10] investigated the ability of the duration time method in the linear time history analysis of steel flexural frames under three-directional seismic load excitation. In another study, the ability of the duration time method in the nonlinear time history analysis of steel flexural frames was studied by Valamanesh and Istakkanchi [10]. Then, considering the proven capability of the durability time method in estimating nonlinear responses of structures and also the ability of the method in investigating the behavior of structures at different levels of seismic hazard, research was conducted on estimating the collapse threshold capacity using the durability time method [11], designing structures based on performance using the advantages of the durability time method [12], or improving structures based on performance with the help of the advantages of the durability time method. Recently, studies have been conducted on estimating seismic damage as a significant part of life cycle costs using the durability time method [13,14]. In the aforementioned research, deterministic methods have been used in most stages of estimating seismic damage, and the damage of different components has not been calculated separately. The amount of damage to a building due to an earthquake is completely dependent on the response of the structure and the amount of displacement, stress, and deformation that occur in different elements. The selection of the appropriate parameter for the structural response depends on the purpose of the assessment and the manner in which the building is damaged. For example, for measuring non-structural damage, such as equipment, the selection of relative acceleration is an appropriate choice, and for assessing structural damage, the selection of the maximum relative displacement between floors is logical. These parameters themselves also depend on the resistance of each element and the way they are connected to each other, and the stiffness of the structural system and its details. Given the increasing importance of earthquakes in recent years, much research has been conducted on earthquakes and, given the damage that has occurred in our country in recent years, in this study, an attempt has been made to make a more accurate estimate of the damage caused by earthquakes in concrete frames with a robustness index based on a probabilistic approach. The novelty of this research lies in the integration of the Duration Time Method into a probabilistic performance-based evaluation framework, leveraging ATC-58 tools to estimate damage states. The remainder of this paper is organized as follows: Section 2 describes the modeling and analysis setup, Section 3 discusses performance estimation, and Section 4 presents key conclusions.
2. Design and Modeling of Frames
The frames used in this study are based on three-span reinforced concrete flexural frames designed by Haselton [15]. These frames are special flexural frames and are designed according to ASCE2002 [16] and ACI2002 [17] codes.
2.1. Selection of Nonlinear Element Model for Beams and Columns
After the structural system model is selected, a decision must be made on how to model the elements. One of the issues that must be considered is the purpose for which the structural model is to be used.
2.2. Selection of Accelerometer
This section describes how to select an accelerometer for performing IDA analysis. This category of recorded acceleration time histories includes those whose recording location is more than 10 km from the earthquake source. These records should represent very strong earthquakes, and the number of these records should be statistically sufficient to estimate the mean and standard deviation of the (RTR). Also, these records should be selected in such a way that they are suitable for estimating the collapse of buildings with various dynamic characteristics and do not depend on the characteristics of the building, including its period. Recorded earthquakes with a sufficient magnitude to estimate the collapse point are very rare. For this reason, the idea of using IDA analysis was proposed. Accelerograms were scaled using spectral matching to a target spectrum representative of the seismic hazard at the site. Each record was adjusted using frequency-domain modification to match the shape and amplitude of the target response spectrum. While higher-magnitude ground motions (Mw > 7.0) exist in global databases such as NGA-West2 and ESM-DB, the selected records in this study (Mw 5.6–7.0) were chosen due to their spectral compatibility with FEMA 695 [18] target spectra, availability of two orthogonal components, and their well-documented site conditions. Although stronger motions are available, our selection prioritized spectral shape and consistency with FEMA’s far-field criteria. This process continues until the collapse point. The magnitude of the earthquakes selected for analysis is between 5.6 and 7. These records were recorded on hard soils or soft rocks, and records recorded on soft soils were not used. The selection of these records also had other criteria that are fully explained in FEMA 695 [18]. Table 1 shows the records used and their specifications, where, in this table, Lowest Freq means the lowest frequency or the longest period corresponding to it, which, in structures with the aforementioned period range, the records can be used for structural analysis with full reliability. The selected records were filtered based on several FEMA 695 criteria: (1) moment magnitude (Mw > 5.6), (2) source-to-site distance > 10 km (far-field), (3) soil classification Vs30 > 360 m/s (hard soils) or soft rock, (4) absence of deep sedimentary basins that can amplify long-period content, and (5) no near-fault directivity pulses. While pulse-like effects were considered in record selection, specific Tₚ values were not reported in Table 1.

Table 1.
Specifications of the recorded acceleration time histories used.
2.3. Different Scenarios for Simple Response Estimation Methods
The first scenario for doing this is based on the generation and use of a number of acceleration-time-duration functions. In this method, the actual records of interest are first selected for time history analysis. Then, using the acceleration spectrum of each of these records, an acceleration function is generated for use in the duration method. It can be expected that the dispersion of the structural response obtained using these acceleration functions will be close to the dispersion of the structural response in the incremental time history analysis using the original records. Among the drawbacks of this method, it can be noted that the generation of acceleration functions is time-consuming and expensive. Additionally, synthetic acceleration functions may not fully replicate near-fault effects, energy content irregularities, or nonstationary behavior seen in recorded earthquakes. Their lack of realistic velocity pulses and long-period components can potentially underestimate structural demands, particularly in mid- to high-rise buildings. These limitations should be considered when interpreting damage estimates. The synthetic acceleration functions were generated through an iterative spectral matching process. The target spectrum used was derived from FEMA 695 guidelines. The matching involved minimizing the error between the computed response spectrum of the synthetic function and the target using a least-squares approach. Mathematically, the process follows the matching formulation described by Han and Chopra in 2006 [2], where the synthesized time series is adjusted in the frequency domain and converted back using inverse FFT. An ‘acceleration function’ in this study refers to a synthetic ground motion time series that reproduces a specified target spectrum. These functions are not recorded motions but are generated to match the required intensity and frequency content.
2.3.1. Definition of Duration Time Method
The Duration Time Method (DTM) in this study refers to a simplified, spectrum-matched analysis approach where synthetic time histories are generated with controlled amplitude and frequency content to match a target spectrum. Unlike traditional IDA, which uses real records scaled incrementally, DTM uses fixed-duration synthetic inputs, generated using the inverse FFT process based on the least-squares error minimization between the target and actual spectra. This approach is inspired by the Endurance Time Method (ETM) but is adapted to suit the context of probabilistic damage estimation. This approach is inspired by spectrum-matching techniques commonly used in ground motion simulation, such as those outlined in Han and Chopra (2006) [2] and Valamanesh and Estekanchi (2010) [10]. These studies form the foundation for generating time histories with specific frequency content and duration characteristics.
2.3.2. Comparison with Endurance Time Method (ETM)
The Endurance Time Method (ETM), developed by Estekanchi et al., uses gradually intensifying synthetic ground motions to evaluate structural performance over a controlled time duration. Unlike DTM, which uses fixed-duration and spectrum-matched functions for probabilistic analysis, ETM focuses on evaluating performance under increasing intensity. Although the present study does not apply ETM directly, many of the acceleration functions used here are conceptually inspired by the ETM literature [10,11,12,13,14].
2.4. Performing the Necessary Analyses to Estimate Seismic Responses
In this study, it is assumed that the spectral acceleration in the first mode has all the necessary characteristics (efficiency and adequacy) as an intensity index (IM) parameter and shows all the results of uncertainties arising from the record dispersion in the seismic demand of structures. Since the ultimate goal of this study is to provide a simple framework for estimating damage and comparing it with the proposed ATC-58 method, the estimation of two categories of engineering demand parameters by the durability time method has been considered. The first category of these responses includes relative floor displacement, floor acceleration, and residual deformation, and the second category considers the moment of collapse capacity and its related modes. The collapse threshold value in IDA analysis is set to the minimum point where the slope of the IDA curve is 20% of the slope of the elastic part of the curve or the point where the maximum relative displacement of the floors is 10%, and, in the case of durability time analysis, a relative displacement of 10% is considered as the criterion for the collapse threshold.
After determining the desired EDP, IM, by performing an incremental time history analysis using 22 pairs of records introduced in FEMA695 and the durability time method using 12 acceleration functions introduced in the third section, graphs can be obtained showing the distribution of seismic demand at different levels of the intensity index, one of which is shown as an example in Figure 1.
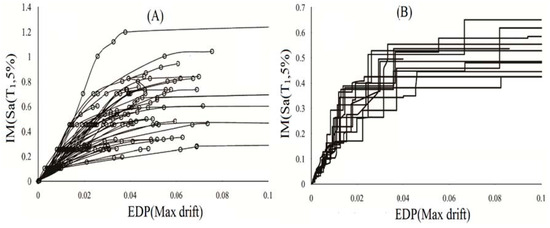
Figure 1.
(A) Incremental time history analysis; (B) duration time.
Figure 1 shows a comparison between Incremental Dynamic Analysis (IDA) and Duration Time Method (DTM) for a 10-story RC frame. Subfigure A represents the IDA response, and Subfigure B shows the median response under DTM. With the seismic hazard curve for the frames and the results of the structural analysis, the response of the structure at specific hazard levels can be obtained. In this study, the responses before collapse in twenty intermediate IMs have been obtained, which include the relative deformation of the floor, residual deformation, and floor acceleration. To examine the accuracy of the duration time method in estimating the median response, the median responses of 34 frames at 20 seismic hazard levels have been calculated through the duration time and incremental dynamic analysis. These responses include the maximum relative displacement of the floor and the maximum floor acceleration. Then, for each of the responses, a graph has been drawn in which the horizontal axis of the graph corresponds to the results of the incremental time history analysis method, and the vertical axis corresponds to the results of the duration time analysis. Then, a straight line is fitted between the results, and the correlation coefficient between the results is also obtained. The results of the work can be seen in Figure 2.
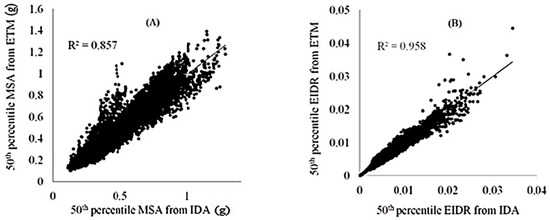
Figure 2.
(A,B) Median seismic responses of the structure extracted from the duration and time history method.
As can be seen from Figure 2, the duration time method has an acceptable ability to estimate the median seismic responses of concrete flexural frames, considering the significant dispersion associated with the response record. Considering the correlation coefficient between the responses, the accuracy of the method in estimating the maximum relative displacement, with a correlation coefficient of 0.958, is higher than that of the floor acceleration, with a correlation coefficient of 0.857. In some cases, the relative error of the pre-event increases significantly, which can be justified considering the high dispersion of the response resulting from the uncertainties of the record. While correlation coefficients show strong agreement (e.g., R2 = 0.958 for drift), bias analysis indicates a mean absolute error (MAE) of 0.43% in maximum interstory drift ratios and 0.56 m/s2 in floor accelerations. The 16–84% percentile range spans ±10% around the median, showing acceptable but non-negligible dispersion. These bounds indicate that although the duration time method approximates IDA well in median terms, its spread increases at higher intensity levels. Figure 3 shows mean spectral acceleration leading to collapse attenuation extracted from the duration time and time history method.
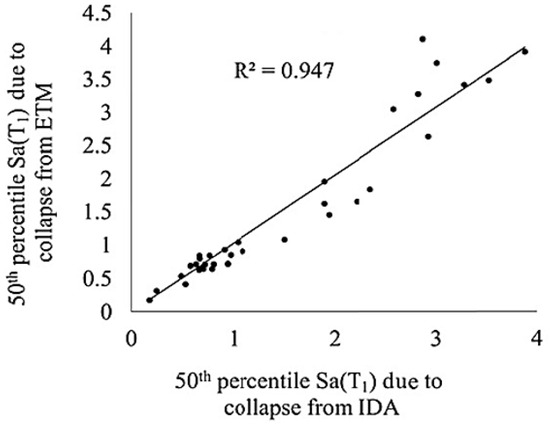
Figure 3.
Mean spectral acceleration leading to collapse attenuation extracted from the duration time and time history method.
To investigate the sensitivity of the method to the number and selection of acceleration functions of the time-of-duration method, a similar study was conducted with different numbers of acceleration functions. For each case, structural responses were obtained at 20 different seismic intensities and were modified using the proposed framework. The results were plotted against the responses extracted from the incremental time history analysis method, and correlation coefficients were also obtained, which are given in Table 2 for different cases.

Table 2.
Correlation coefficients of structural responses considering different acceleration-duration time functions.
As is clear from the table, the accuracy of the results depends, to some extent, on the selection of acceleration functions and their number, and it can be hoped that, by generating appropriate acceleration functions and using them in this framework, the accuracy of predicting the structural response using this method will increase. The next point that is raised in relation to approximate methods is the decrease in the accuracy of these methods with increasing structure height.
In order to investigate the duration time method in estimating the collapse threshold modes, and also the factors affecting this type of response, eight one- and two-story frames were removed from the studied frame group, and the results obtained from the incremental time history analysis and duration time on the remaining 26 frames were studied. Figure 4 shows an example of predicting different collapse threshold modes using the two duration time and incremental time history analysis methods for two sample structures of 8 and 12 stories. It should be noted that, in the duration time method, all 12 records were used.
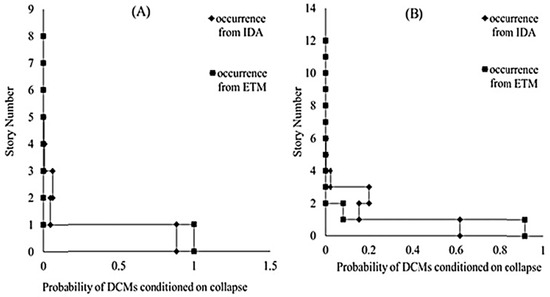
Figure 4.
Probability of different collapse threshold modes for two 8- and 12-story structures extracted from two methods of incremental time history analysis and duration time. (A) Probability of DCMs conditioned on collapse structures of 8 stories (B) Probability of DCMs conditioned on collapse structures of 12 stories.
Given the difference in the estimates between the two methods, it seems necessary to conduct more in-depth studies on this type of response and the factors affecting it. To this end, by increasing the resistance of the members of the floors that had a greater contribution to the collapse threshold, an attempt was made to create structures with a variety in the location of the dominant collapse threshold elements and not to concentrate deformation on one floor at the moment of collapse. Such a design option may not be considered in practice, but the results of research on these two categories of frames can lead to further clarification of the factors affecting this type of response. Table 3 shows Conditional probability of occurrence of different collapse threshold modes, provided that this limit state occurs.

Table 3.
Conditional probability of occurrence of different collapse threshold modes, provided that this limit state occurs.
2.5. Sensitivity Analysis to Determine the Importance of Random Variables
One way to determine the impact of uncertainties on structural responses is to perform sensitivity analysis on structures. To perform sensitivity analysis, each random variable is usually shifted around the mean depending on the standard deviation value, and the remaining variables adopt the mean value; the structural analysis is performed again on the new model. By examining the results, it is possible to determine the parameters that have the greatest impact on the behavior of the structure. In order to make changes to the structural model, random variables are changed, and an incremental time history analysis is performed on them. In order to organize the required changes to the random variables, the central composite design approach has been used. In this approach, two data sets are created. In the first group, only one of the random variables changes by a certain amount, and the rest of the variables adopt their average value, which are called star points. To produce the second group, changes occur on all the random variables, and no variable adopts its average value, which are called factorial points. The number of changes can be chosen depending on the nature of the experiment, and there is no requirement for this distance to be equal in producing these two groups. In this study, the distances used in producing star points and factorial points are 1 and 7.1 times the standard deviation of the relevant random variables, respectively. Considering the number of random variables in this study, 9 star points and 16 factorial points are created; therefore, it is necessary to perform 25 sensitivity analyses on each structure. This work was carried out on four structures of 4, 8, 12, and 20 floors. The figure below shows the average of the incremental time history analysis curve related to the star points for one of the sample buildings.
As shown in Figure 5, the method achieved R2 = 0.92 for drift. Errors increased to 15% for high-rise frames due to higher-mode effects, aligning with findings by [18]. As mentioned earlier, and considering the effect of additional resistance on this parameter, two groups of structures, each group consisting of four frames of 4, 8, 12, and 20 floors, have been studied in future studies. It should be noted that the first group of frames consists of frames designed by Haselton, and the second group consists of modified frames with a greater variety of dominant modes. In order to determine the effect of model uncertainty on the dominant collapse modes, first, using the results of the incremental time history analysis, the conditional probability of different collapse threshold modes under the condition of this phenomenon occurring on the aforementioned frames was obtained. Then, as in the previous case, and in the central composite design approach, the same values were calculated at the star and factorial points, the results of which are shown in Figure 6 below for two 8-story frames from the first and second categories, related to the star points.
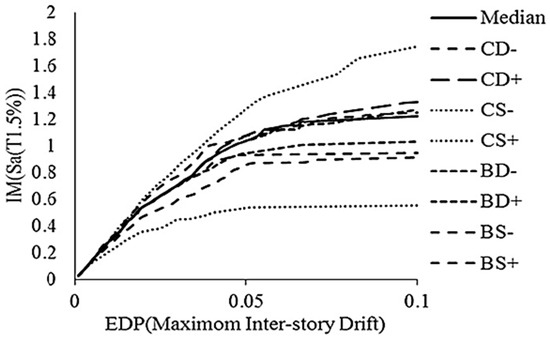
Figure 5.
Sensitivity analysis result for 4-story structure.
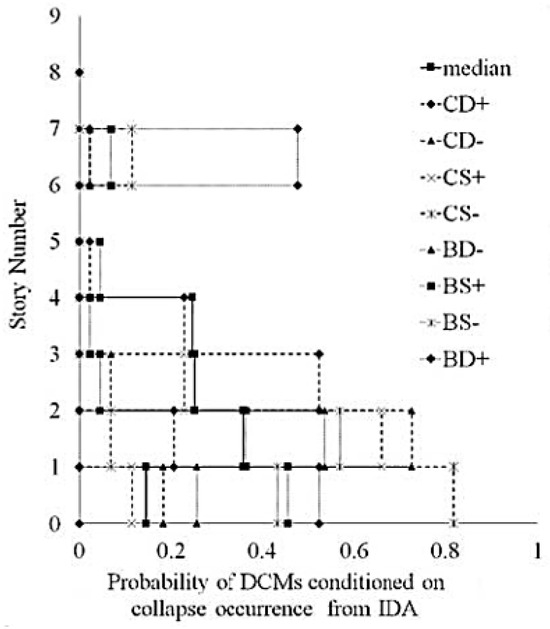
Figure 6.
Sensitivity analysis result for 8-story structure.
The higher dispersion in collapse modes (Figure 6) stems from uncertainty in column strength distribution, particularly in soft-story mechanisms [14]. As can be seen, the dispersion of the response under the influence of the displacement of variables around the mean is much greater on structures with a greater variety of dominant modes. Finally, by fitting a quadratic polynomial function similar to the previous case and considering the conditional probability of different collapse threshold modes as the target variable (TV), and performing Monte Carlo analysis, the conditional probability values of the collapse threshold in all eight frames under study have been obtained.
3. Estimation of the Performance of Structures
By determining the seismic hazard curve, the distribution of the required structural response in the hazard levels, the fragility curve for the collapse threshold and its related modes, as well as the functional groups and fragility curves of each structural component, all the required parameters have been provided. To do this, first, by expanding the response vectors obtained from the structural analysis, a large number of response vectors are generated. In this study, damage probability curves were first obtained based on the generation of 1000 response classes for one- and two-story structures, and the number of response classes decreased with increasing height. The reason for this decrease was the filling of the computer RAM memory used, so that, for a 20-story structure with 200 response classes, 9.12 GB of the 16 GB of computer RAM was occupied. Then, by making changes to this parameter, an attempt was made to reduce the time and hardware resources required to estimate the damage in different cases. The response class can be considered a probable outcome of the building response for a given earthquake intensity, or, in better words, a realization of it. The vector can be used to determine the type and amount of damage that occurs to the components of each functional group [17]. Accelerograms () were scaled using spectrum-matching to the target Sa(T1) curve [18,19]. The duration time method was then applied by the following [1]:
where Ai, fi, and ϕi are amplitude, frequency, and phase of the i-th component.
Determining the Damage State and Estimating the Damage
After the response set has been generated, it is necessary to determine the damage state for each component and in each functional group for each realization. This is achieved using the random number generation technique and using the fragility curve related to the damage states of the components. For each response set, the time of occurrence during the day and year and, as a result, the number of people present in the building are randomly determined using the Monte Carlo approach. In order to investigate the occurrence of collapse, the random number generation approach is also used. For example, at a certain risk level, the probability of collapse at this functional level can be determined using the fragility curve of the threshold, and then, by generating a random number between zero and one hundred and comparing it with the probability of collapse, the occurrence or non-occurrence of collapse in that response set can be determined. If a collapse does not occur in a realization, the repairability of the structure is determined using the same method and the repairability fragility curve at the corresponding permanent deformation of this realization. In a realization where collapse does not occur and the structure is repairable, the damage caused to each of the structural components is determined. The damage state and the resulting consequences in each of the components are considered using the fragility curves, and the repair cost, fatalities, and time required for repair are also determined. If a collapse occurs, the total cost of rebuilding the building is used as the incurred cost for that realization, and the number of fatalities and injuries is determined based on the population model used, and the failure mode corresponding to the collapse threshold and the population present in the building at the time of this realization, and the mortality and injury rates. If the structure is determined to be irreparable due to high permanent deformation, the cost of rebuilding the structure is used as the incurred cost. In a time-based assessment, the above method is repeated for each intensity level.
The above steps have been carried out on 34 studied frames using the PACT software, and the results of the incremental time history analysis and the proposed framework. For this purpose, the structural responses at twenty seismic hazard levels have been calculated using two methods, and the collapse threshold fragility curve has been estimated for the aforementioned structures using two methods. Then, seismic damage has been calculated based on the severity at 20 hazard levels for the 34 studied frames. Examples of repair cost curves obtained from the two methods for a 12-story frame are given as an example in Figure 6 and Figure 7. The medians of the curves for cases A, B, C, and D are 2,481,250, 2,836,363, 4,989,010, and 5,290,322, respectively.
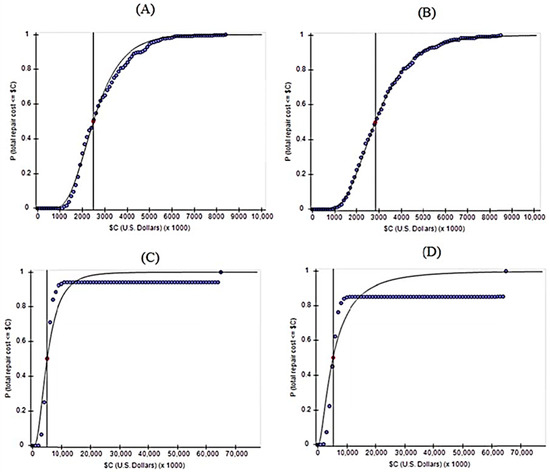
Figure 7.
Cumulative distribution of the probability of exceeding the repair cost for earthquakes (A,C) related to the results of the incremental time history analysis. (B,D) related to the results of the proposed method. The top and bottom rows are related to earthquakes of levels 10 and 17, respectively.
Parameters are extracted from the obtained curves and used as decision-making criteria for various financial institutions. For example, banks, as the main lenders of housing, usually use the loss distributions obtained with this method to assess the seismic risk in housing loans. To evaluate the strengths and weaknesses of the proposed framework, a comparative discussion was carried out with traditional IDA and ETM (Endurance Time Method) approaches. While IDA remains highly accurate, its computational demand is significantly higher. The proposed method shows acceptable correlation (R2 > 0.85) while reducing computational time by approximately 60%.
4. Conclusions
In the scope of the evaluations and analyses carried out in this study, the following results can be mentioned.
- -
- The dispersion in structural responses due to ground motion variability was estimated with acceptable accuracy using the proposed framework based on regression analysis and the results of the duration time method.
- -
- The accuracy of the method significantly changes with the type and number of acceleration functions used. These variations are influenced by differences in ground motion properties such as local site class, epicentral distance, deep sediment layers, and presence of long-period or pulse-like components. Future extensions should consider these parameters explicitly during synthetic function generation.
- -
- Among the important parameters in the seismic performance of reinforced concrete frames, the distribution of resistance in height will have a significant effect on the dominant modes of the collapse threshold and their degree of diversity, which, in turn, affects the degree of influence of other parameters on this response.
- -
- Among the characteristics of the records, parameters such as the shape of the spectrum or the nature of the record pulse affect the different modes of the collapse threshold, and the degree of this effect is a function of the diversity of these modes.
- -
- The effect of model uncertainty on different modes of collapse threshold is significant, and, except in cases where the diversity of these modes is low or their changes do not cause a significant change in seismic damage, it is better to consider them in seismic damage estimation. In addition, this effect is not a function of the efficiency of the intensity index.
- -
- Since the accuracy of median response estimation using simplified methods (e.g., DTM) varies across different seismic hazard levels for a given structure, the accuracy of estimating damages at different intensities using simple methods sometimes experiences significant changes.
- -
- The accuracy of estimated seismic damage is not directly related to the height and, consequently, the period of the structure, and it can be inferred that due to the greater overlap of errors in structures with a higher number of floors, the effect of reducing the accuracy of response estimation on seismic damage estimation in these structures has not been observed.
- -
- Although the current study focuses on reinforced concrete moment-resisting frames, the proposed framework is not limited to this structural system. Due to its modular nature—comprising synthetic ground motion generation, probabilistic damage modeling, and collapse threshold analysis—it can potentially be applied to steel structures, dual systems, and even irregular configurations. Future extensions of this research will focus on validating the methodology across a broader spectrum of structural typologies.
- -
- The method achieved a maximum correlation coefficient of 0.958 in estimating floor displacements and 0.857 in floor accelerations across 34 frames. Error variation remained below 12% for most cases.
Funding
This research received no external funding.
Data Availability Statement
The datasets used and/or analyzed during the current study are available from the corresponding author on reasonable request.
Conflicts of Interest
The author declares no conflict of interest.
References
- Bradley, B.A.; Lee, D.S. Accuracy of approximate methods of uncertainty propagation in seismic loss estimation. Struct. Saf. 2010, 32, 13–24. [Google Scholar] [CrossRef]
- Han, S.W.; Chopra, A.K. Approximate incremental dynamic analysis using the modal pushover analysis procedure. Earthq. Eng. Struct. Dyn. 2006, 35, 1853–1873. [Google Scholar] [CrossRef]
- Azarbakht, A.; Dolšek, M. Progressive incremental dynamic analysis for first-mode dominated structures. J. Struct. Eng. 2010, 137, 445–455. [Google Scholar] [CrossRef]
- Tafakori, E.; Banazadeh, M.; Jalali, S.A.; Tehranizadeh, M. Risk-based optimal retrofit of a tall steel building by using friction dampers. Struct. Des. Tall Spec. Build. 2013, 22, 700–717. [Google Scholar] [CrossRef]
- Bozorgnia, Y.; Bertero, V.V. Earthquake Engineering: From Engineering Seismology to Performance-Based Engineering; CRC Press: Boca Raton, FL, USA, 2004. [Google Scholar]
- Takahashi, Y.; Kiureghian, A.D.; Ang, A.H.S. Life-cycle cost analysis based on a renew model of earthquake occurrences. Earthq. Eng. Struct. Dyn. 2004, 33, 859–880. [Google Scholar] [CrossRef]
- Chopra, A.K.; Goel, R.K. A modal pushover analysis procedure for estimating seismic demands for buildings. Earthq. Eng. Struct. Dyn. 2002, 31, 561582. [Google Scholar] [CrossRef]
- Vamvatsikos, D.; Cornell, C.A. Incremental dynamic analysis. Earthq. Eng. Struct. Dyn. 2002, 31, 491–514. [Google Scholar] [CrossRef]
- Pahlavan, H.; Shaianfar, M.; Amiri, G.G.; Pahlavan, M. Probabilistic seismic vulnerability assessment of the structural deficiencies in Iranian in-filled RC frame structures. J. Vibroeng. 2015, 17, 2444–2454. [Google Scholar]
- Valamanesh, V.; Estekanchi, H.E. A study of endurance time method in the analysis of elastic moment frames under three-directional seismic loading. Asian J. Civ. Eng. 2010, 11, 543–562. [Google Scholar]
- Rahimi, E.; Estekanchi, H.E. Collapse assessment of steel moment frames using endurance time method. Earthq. Eng. Eng. Vib. 2015, 14, 347–360. [Google Scholar] [CrossRef]
- Basim, M.C.; Estekanchi, H.E. Application of endurance time method in performance-based optimum design of structures. Struct. Saf. 2015, 56, 52–67. [Google Scholar] [CrossRef]
- Mohammad, C.B.; Estekanchi, H.E.; Vafai, A. A Methodology for Value Based Seismic Design of Structures by the Endurance Time Method. Sci. Iran. 2016, 23, 2514–2527. [Google Scholar] [CrossRef][Green Version]
- Estekanchi, H.E.; Vafai, A.; Mohammad, C.B. Design and Assessment of Seismic Resilient Structures by the Endurance Time Method. Sci. Iran. 2016, 23, 1648–1657. [Google Scholar] [CrossRef][Green Version]
- Haselton, C.B. Assessing Seismic Collapse Safety of Modern Reinforced Concrete Moment Frame Buildings. Ph.D. Thesis, Stanford University, Stanford, CA, USA, 2006. [Google Scholar][Green Version]
- ASCE/SEI 7-22; Minimum Design Loads and Associated Criteria for Buildings and Other Structures. American Society of Civil Engineers: Reston, VA, USA, 2002.[Green Version]
- ACI 318M/318RM-02; Building Code Requirements For Structural Concrete (ACI 318M-02) and Commentary (ACI 318RM-02). American Concrete Institute: Farmington Hills, MI, USA, 2002.[Green Version]
- Federal Emergency Management Agency. Quantification of Building Seismic Performance Factors; Federal Emergency Management Agency: Washington, WA, USA, 2009.[Green Version]
- Abdollahzadeh, G.; Faghihmaleki, H.; Avazeh, M. Progressive collapse risk and reliability of buildings encountering limited gas–pipe explosion after moderate earthquakes. SN Appl. Sci. 2020, 2, 657. [Google Scholar] [CrossRef]
Disclaimer/Publisher’s Note: The statements, opinions and data contained in all publications are solely those of the individual author(s) and contributor(s) and not of MDPI and/or the editor(s). MDPI and/or the editor(s) disclaim responsibility for any injury to people or property resulting from any ideas, methods, instructions or products referred to in the content. |
© 2025 by the author. Licensee MDPI, Basel, Switzerland. This article is an open access article distributed under the terms and conditions of the Creative Commons Attribution (CC BY) license (https://creativecommons.org/licenses/by/4.0/).