Abstract
Steel structure specimens exhibit high strength and ductility and are often subjected to complex loading conditions and pre-existing cracks in critical engineering applications. In this study, peridynamics (PD) theory—known for its unique advantages in modeling structural damage and failure—is employed to establish specimens with bilateral cracks and double central cracks at varying longitudinal spacings. To address the complexity of elastic–plastic behavior, the D-M model is applied to transform the nonlinear problem into an equivalent linear elastic one. This approach is integrated with PD theory and the crack tip opening displacement (COD) concept of fracture mechanics to derive a novel linear fracture criterion, termed the PD-COD. Furthermore, numerical models based on PD and the PD-COD criterion are developed for central cross double-crack specimens, enabling analysis of crack propagation under loading. The results validate the effectiveness of the PD-COD damage criterion and elucidate the underlying mechanisms of crack propagation in centrally intersecting double-crack configurations. This work contributes to a deeper understanding of the damage evolution in defective steel structures under load and provides theoretical guidance for engineering design.
1. Introduction
Although concrete offers advantages such as convenient construction, low cost, and good compressive strength, it suffers from drawbacks like poor tensile strength and susceptibility to cracking [1,2,3]. In contrast, steel provides robust structural support in engineering applications due to its high strength, stability, ductility, durability, and recyclability. Owing to these advantageous properties, steel plays an indispensable role in modern engineering and is widely used in the form of thin-walled components that often bear complex loading conditions or exhibit inherent structural imperfections during prolonged service in critical structural zones. Therefore, understanding the mechanical behavior and theoretical analysis methods of steel members with weakened structural configurations is crucial for ensuring structural safety and extending service life. Recognizing the significance of steel’s characteristics in structural engineering, extensive research has been conducted on the physical properties of steel and the mechanical behavior of steel structures, leading to the development of numerous experimental techniques and theoretical approaches for assessing damage in steel and steel connections.
By integrating the characteristic indices of ground motion parameters with the interstory drift ratio, we establish the failure mode identification criteria for high-rise steel frame structures and present the corresponding control methods as well as influencing factors for failure mode analysis [4]. The steel damage and fracture parameters are incorporated into an ABAQUS subroutine, enabling accurate prediction of the fracture behavior and failure modes of welded joints between perforated plates and beam columns by integrating the microvoid growth model, GTN model, and continuum damage mechanics model [5]. The parameters associated with crack initiation, propagation, bifurcation, and coalescence are quantified, and the criteria for strength-based crack initiation, energy-driven crack propagation, and fracture path identification are integrated. A phase-field regularized cohesive zone model (PF-CZM) is proposed, capable of accurately simulating both brittle failure and quasi-brittle fracture [6]. A fatigue damage model for structures with variable cross-sections is established using damage mechanics, and the fatigue damage life of the structure is estimated based on the damage evolution equation, and the error between the results predicted by the proposed model and those from the Manson–Coffin relationship is within 5% [7]. To address the problems of low-cycle and high-cycle fatigue in steel structures, precise multi-scale fatigue damage models and short–long crack co-evolution theoretical models are established. These models demonstrate effective performance in analyzing damage and failure mechanisms in large-scale structures [8]. The failure characteristics of T-shaped semi-rigid beam-column joints under cyclic loading are investigated by integrating experimental and theoretical approaches, and the crack initiation location and crack propagation process are predicted [9]. A finite element model of explosion overpressure for steel columns and steel frames was established to be used to analyze the damage and failure response of the structure under explosive loading, and the factors influencing the stability of the structure were obtained [10]. By integrating the Liu–Murakami creep model for metals with PD, a creep PD constitutive model is proposed, and the high-temperature creep behavior of P91 steel is analyzed [11]. Based on the Johnson–Cook constitutive equation and the associated damage model, a three-dimensional non-ordinary state-based peridynamic (NOSB-PD) theoretical framework is proposed. By incorporating the effects of plastic hardening, thermal softening, and fracture behavior of the material, the damage evolution and failure characteristics of the structure under impact loading are systematically analyzed [12]. The PD theory was employed to establish the physical and mechanical model of structural damage under impact loading, enabling accurate simulation of the nonlinear transient deformation and damage-induced failure behavior of composite materials subjected to explosive loads [13]. By combining PD theory and anisotropy theory, the local problem is expressed in non-local form, and the energy failure criterion of anisotropic crack is derived by variational principle and Lagrange equation [14]. Based on the PD theory, the OSB-PD model was established to investigate the damage, crack initiation and propagation process of two-dimensional functionally graded material structures. The ultimate load and damage evolution process of the plate structure were analyzed [15]. The Navier equation and boundary conditions are converted into integral form by PDDO theory, and we inserted the elastic modulus gradient layer into the two-material physical model of PD theory, which eliminates the abrupt stress change and cracking at the material interface [16]. Combined with the principles of thermodynamics, a thermal–mechanical coupling damage model (TM-DHPD) is proposed to accurately simulate the bonding damage within the structure and between the interfaces of different materials and solve the challenging numerical simulation problems in engineering [17]. A structural model of a steel plate containing porosity, inclusions, and lack-of-fusion flaws is established to study how initial defects affect damage progression and crack growth in double-crack specimens with different central arrangements [18]. PD theory and XFEM method have been used to establish the bilateral crack specimen model and analyze the advantages of the two methods in the analysis of structural damage and crack growth [19]. Bilateral crack specimen models with different hole radii and were created to analyze the mechanisms governing structural damage and crack growth [20]. The high-temperature mechanical behavior of steel was incorporated into the PD theoretical constitutive equation, leading to the derivation of a thermomechanically coupled PD constitutive model. The coupled effects of elevated temperature and mechanical loading on the damage evolution and displacement distribution in double-sided cracked structures were subsequently analyzed [21,22]. A three-dimensional stress–damage–seepage coupling model for hydraulic fault cement casing (HFCC) was developed using ABAQUS 2020 to investigate the effects of fault slip on the stress–strain behavior and damage progression in the pipeline, while also validating the accuracy and reliability of the proposed HFCC model [23]. Three-dimensional cubic models of plain concrete and pebble concrete were established using PD theory to analyze the mechanism of pressure action and internal force distribution on structural damage and failure [24]. A peridynamic (PD) model coupling hydrogen diffusion and fracture in AISI 4340 alloy steel was developed, incorporating temperature effects and hydrogen diffusion theory. The simulation of hydrogen embrittlement cracking was conducted and validated against experimental data, successfully capturing the entire process of hydrogen diffusion and crack propagation [25]. A model of steel rotors was established with non-metallic inclusion defects to analyze the formation and propagation of initial defects and cracks under high temperature and fatigue load [26]. Authors presented a 3D bolted steel structure plate of a PD theoretical model and analyzed the whole process of ductile to brittle fracture under shear, bending moment and torsion [27]. Based on the results of SEM image analysis and PD theory damage, authors also proposed the anisotropic hardening plasticity and nonlinear failure criteria of ferrite and martensite and analyzed the evolution of the microscopic damage mechanism of DP600 [28]. The pitting, gap, intergranular and stress-related corrosion damage models in PD theory are improved, and the calculation methods FFT and inverse FFT are introduced to greatly reduce the calculation time cost of PD theory, and the whole process of structural corrosion damage can be predicted in detail and accurately [29]. Combining the phase field model with the finite volume method and using a diffusion operator based on the penalty function to overcome the explicit time step ensure computational stability and efficiency [30]. The I-type J-integral and crack opening displacement of a single-edge notched beam were studied. The influences of the crack length and beam width on the J-integral were calculated. The path independence of the J-integral was proved [31]. The influence mechanism of the stiffness distribution in the non-local region at the crack tip on the crack velocity was explored; the implicit wave velocity attenuation phenomenon in the damage zone was revealed to derive the prediction formula for the ultimate crack velocity [32].
Most of the research on PD is based on model analysis and computational methods, with relatively few studies in the direction of structural damage and fracture criteria. To address the shortcomings of traditional methods in the field of damage and failure criteria and enhance the strength and load-bearing capacity of steel structures during service, using diverse techniques and methodologies to analyze the behavior of internal forces, as well as to understand damage and failure mechanisms in steel structures, can help improve structural design and increase load-bearing performance. Therefore, the research work in this article is of great significance.
2. PD and PD-COD Theory
2.1. PD Theory
2.1.1. Ordinary State-Based PD
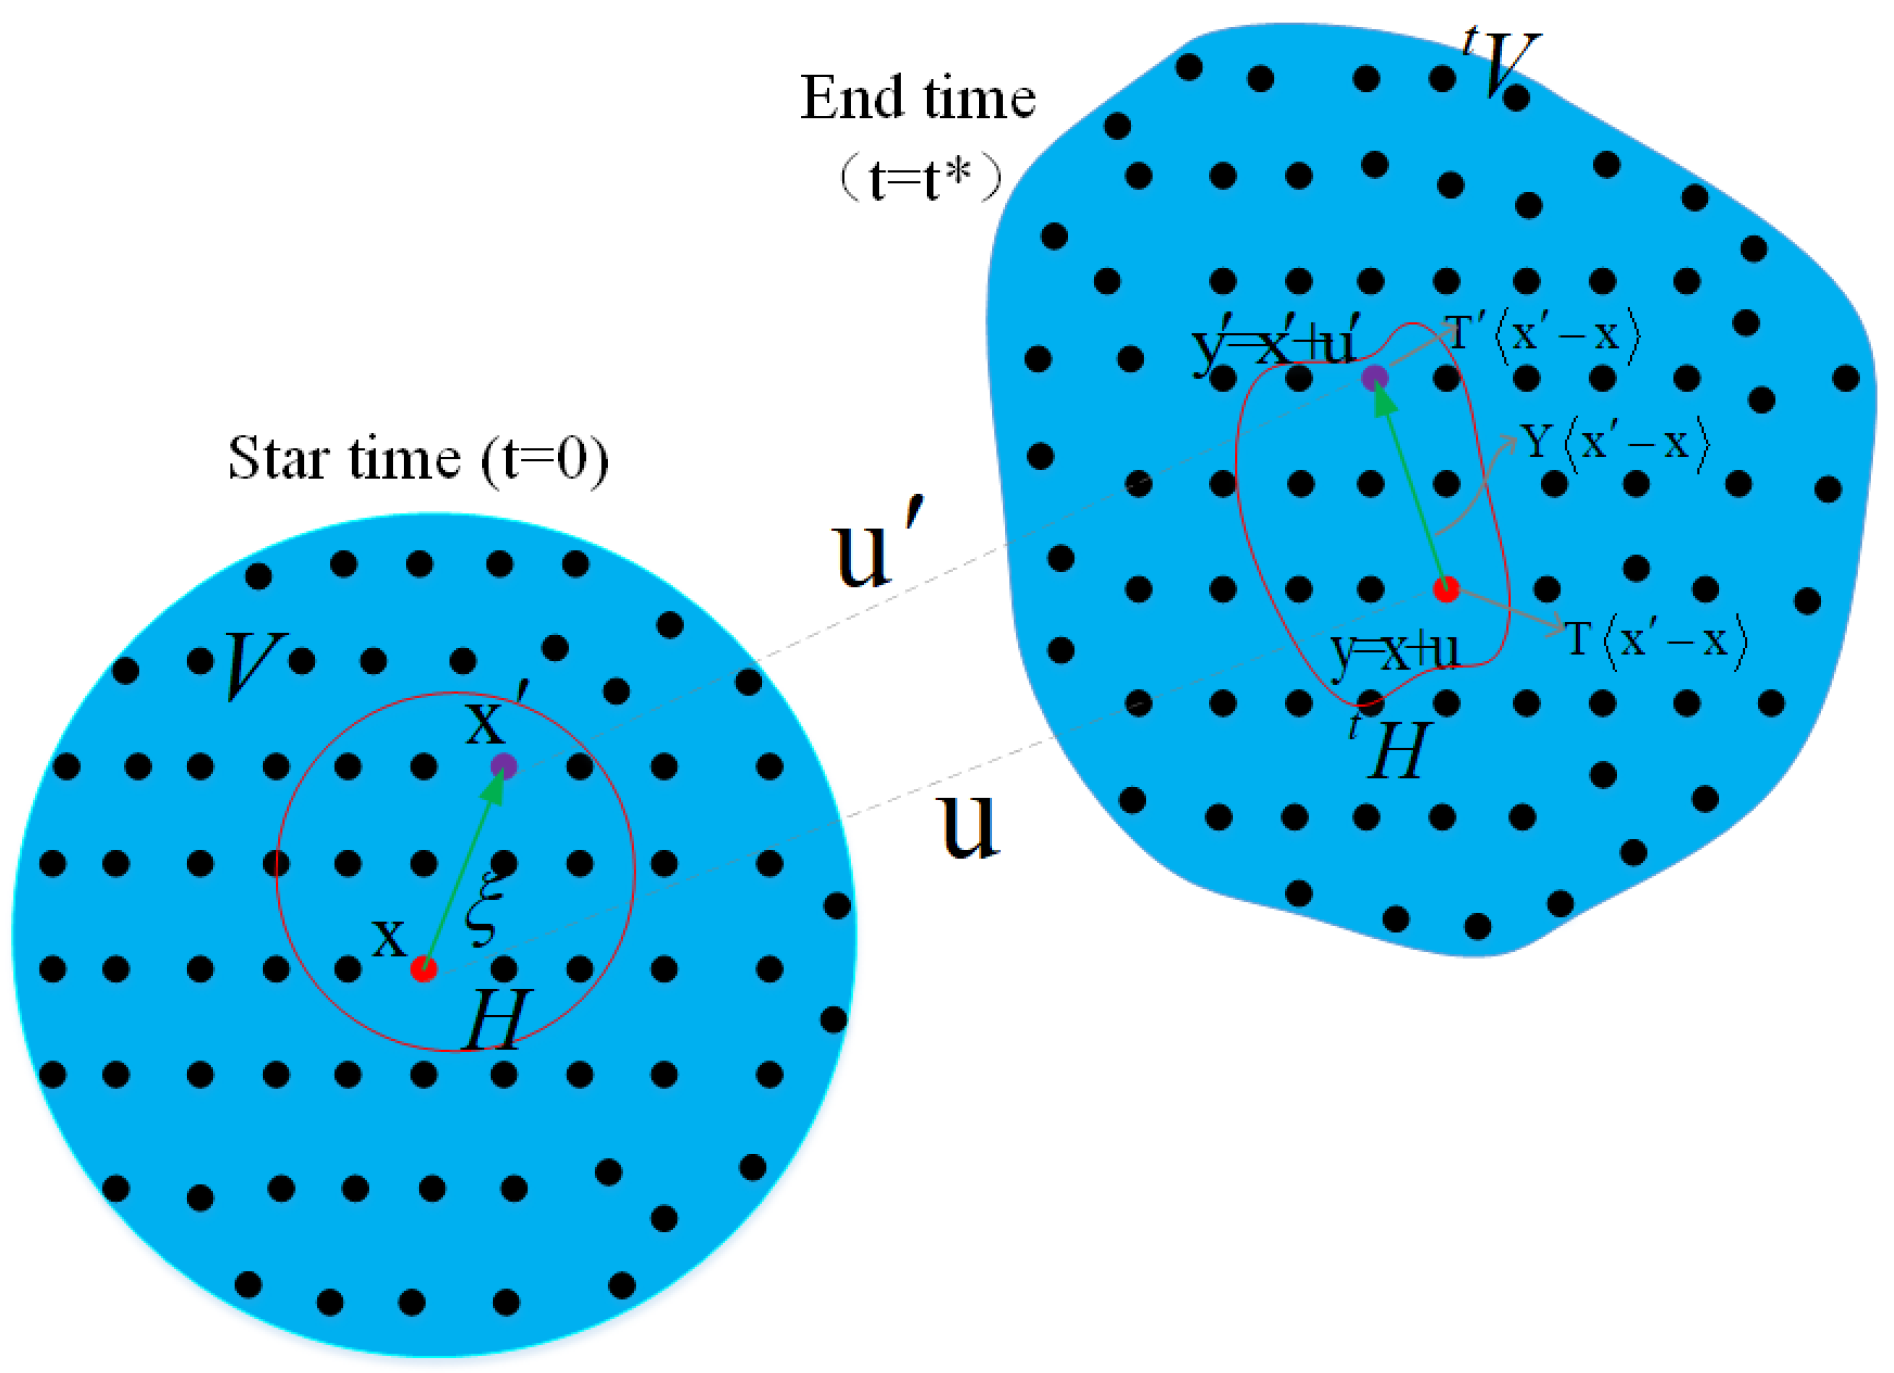
The basic idea of PD is to disperse an object into many particles with fixed numbers and determined coordinates. Each particle interacts with other particles within the interaction radius , usually . Each particle interacts with the near-field dynamic force , and the force state vector is used to represent the near-field dynamic force of all interactions.
When the object is subjected to external load, the particle changes displacement under the action of force ; then, the particle and coordinate after the action of external force are represented as , and the vector coordinate after deformation of all particles is represented by , and the mechanical balance relationship before and after deformation of particles is established, as shown in Figure 1.
and
where is the mathematical operator. When the vector is computed with , the result is a vector. When the scalar is computed with , the result is a scalar.
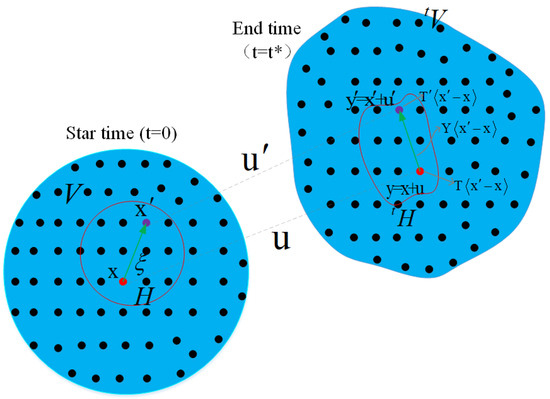
Figure 1.
PD particles’ interaction and changed displacements.
At some time , is the force state vector for all interacting particles inside the body and can be expressed as
The external loading applied to the object induces variations in its total kinetic energy and total potential energy . The micro-potential energy , arising from small displacements between two neighboring particles , is computed, and the overall micro-potential energy of the system is defined as the summation of all internal micro-potential energy contributions.
so, ,
and also
The total kinetic energy and total potential energy of the body are determined by aggregating the microkinetic and micropotential energies associated with all particles within the system.
and
where and respectively represent the density and tiny volume of particle . , and represent the volume load, displacement and velocity of a particle.
Using the principle of virtual work, the dynamic equation of PD particle inside the body is expressed as
where represents the initial state of the object and represents the final state of the object under load.
By bringing the sum of potential energy and kinetic energy at of the PD particle into Equation (9), we obtain the equilibrium equation for particle :
For a two-dimensional object, the PD equation for the particle of the object is calculated as
where represents the integration region.
2.1.2. Boundary Conditions
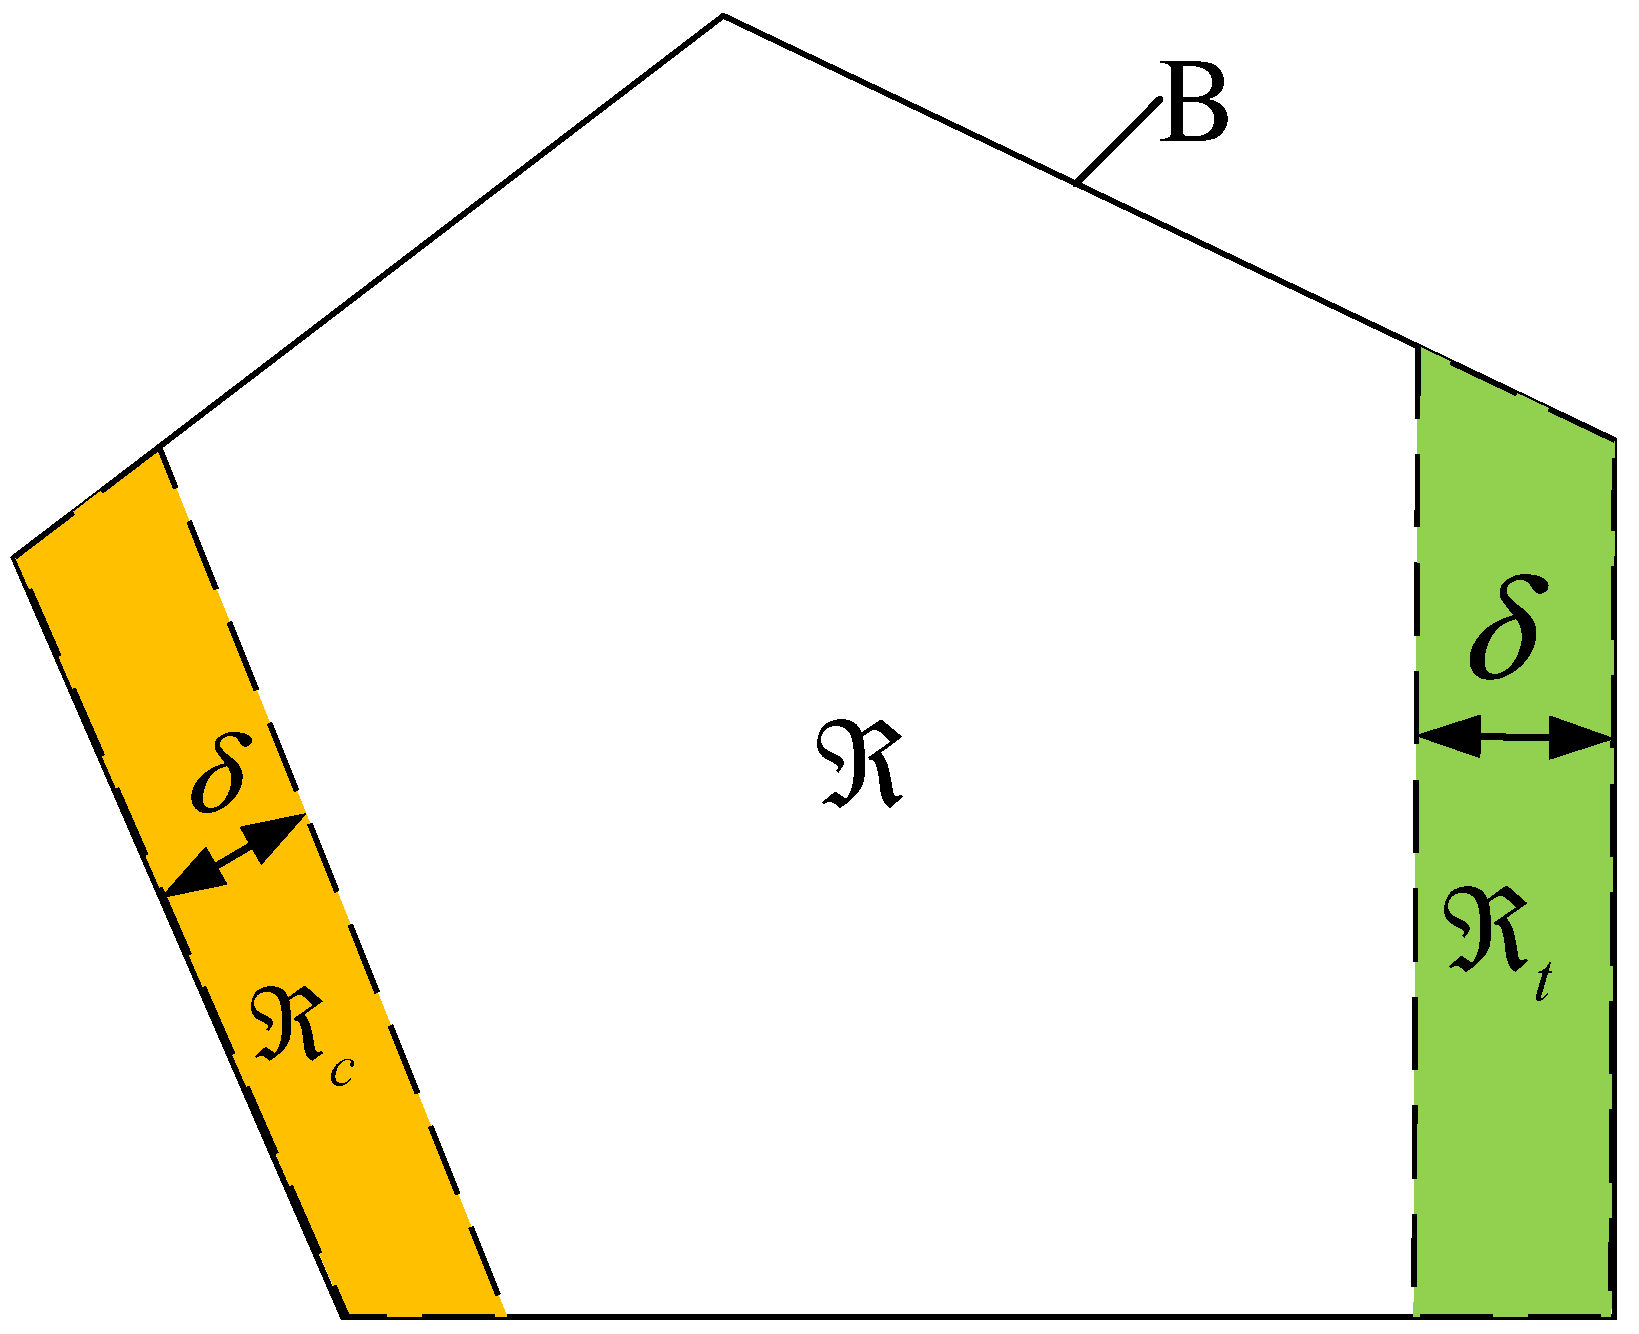
Based on numerical experiments, it is proposed that the width of the virtual layer is , which can ensure that the constraint conditions are fully reflected in the actual material. The theoretical model is shown in Figure 2, where is the virtual boundary with a width of and is the actual material region.
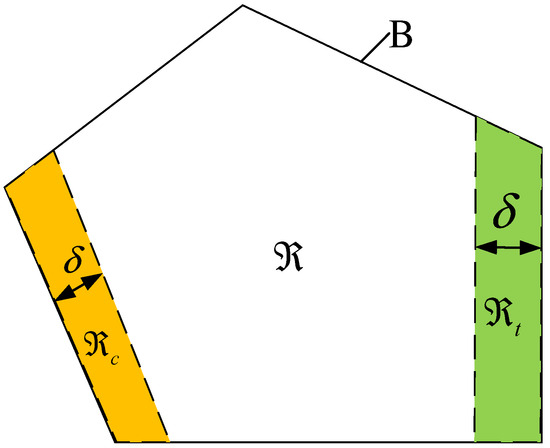
Figure 2.
Analysis model of boundary conditions.
The displacement vector can be applied to the structure through the particle in , as shown in
To avoid the sudden emergence of displacement constraint conditions on the object boundary, the displacement conditions are expressed as
in which is the moment when the displacement load is applied; thus, the velocity of each particle in the object can be expressed as .
The displacement boundary condition application method is adopted. The velocity vector of the particles in the region acts on the boundary of the object, which is expressed as follows:
By integrating the velocity of a particle of an object, the displacement result of the object can be obtained, such as
Similarly, to avoid the sudden introduction of the velocity boundary conditions, the velocity boundary conditions are expressed as
in which, represents the moment when the acceleration load is applied.
2.2. PD-COD Theory
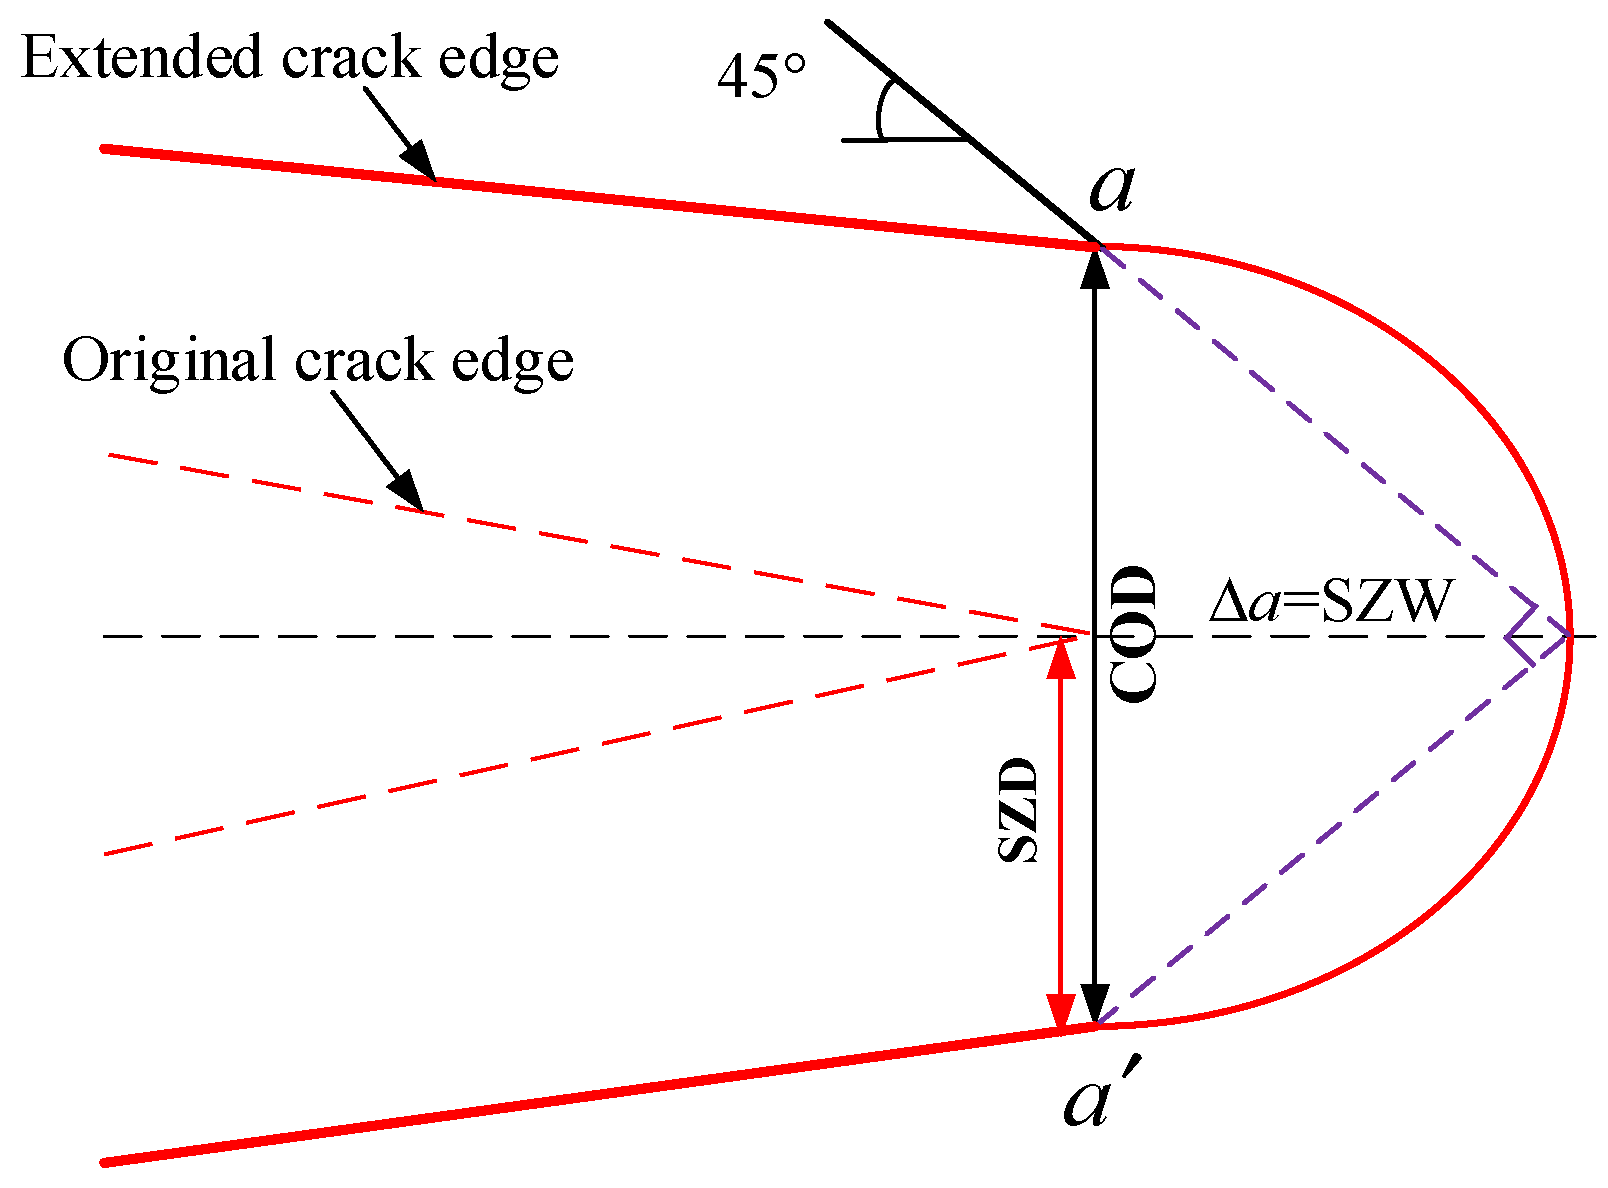
After the action of external load, the crack tip tends to passivate, open and extend, and this part of the material is subjected to strong tensile load to form an elongation zone. Therefore, the size of crack tip opening displacement is used to represent whether the crack continues to expand forward. As shown in Figure 3, COD represents the displacement at the crack tip opening, SZD signifies the height of the stretched zone, and SZW denotes its width, equivalent to the distance of crack extension. During this phase, the crack advances from the original crack boundary to the newly formed edge, where SZD is equal to SZW.
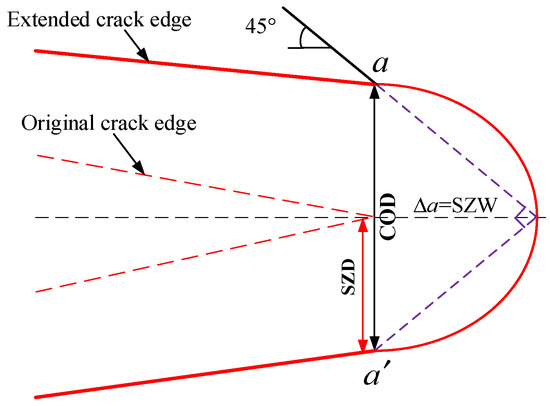
Figure 3.
Passivation and opening displacement of crack tip.
2.3. Model Transformation
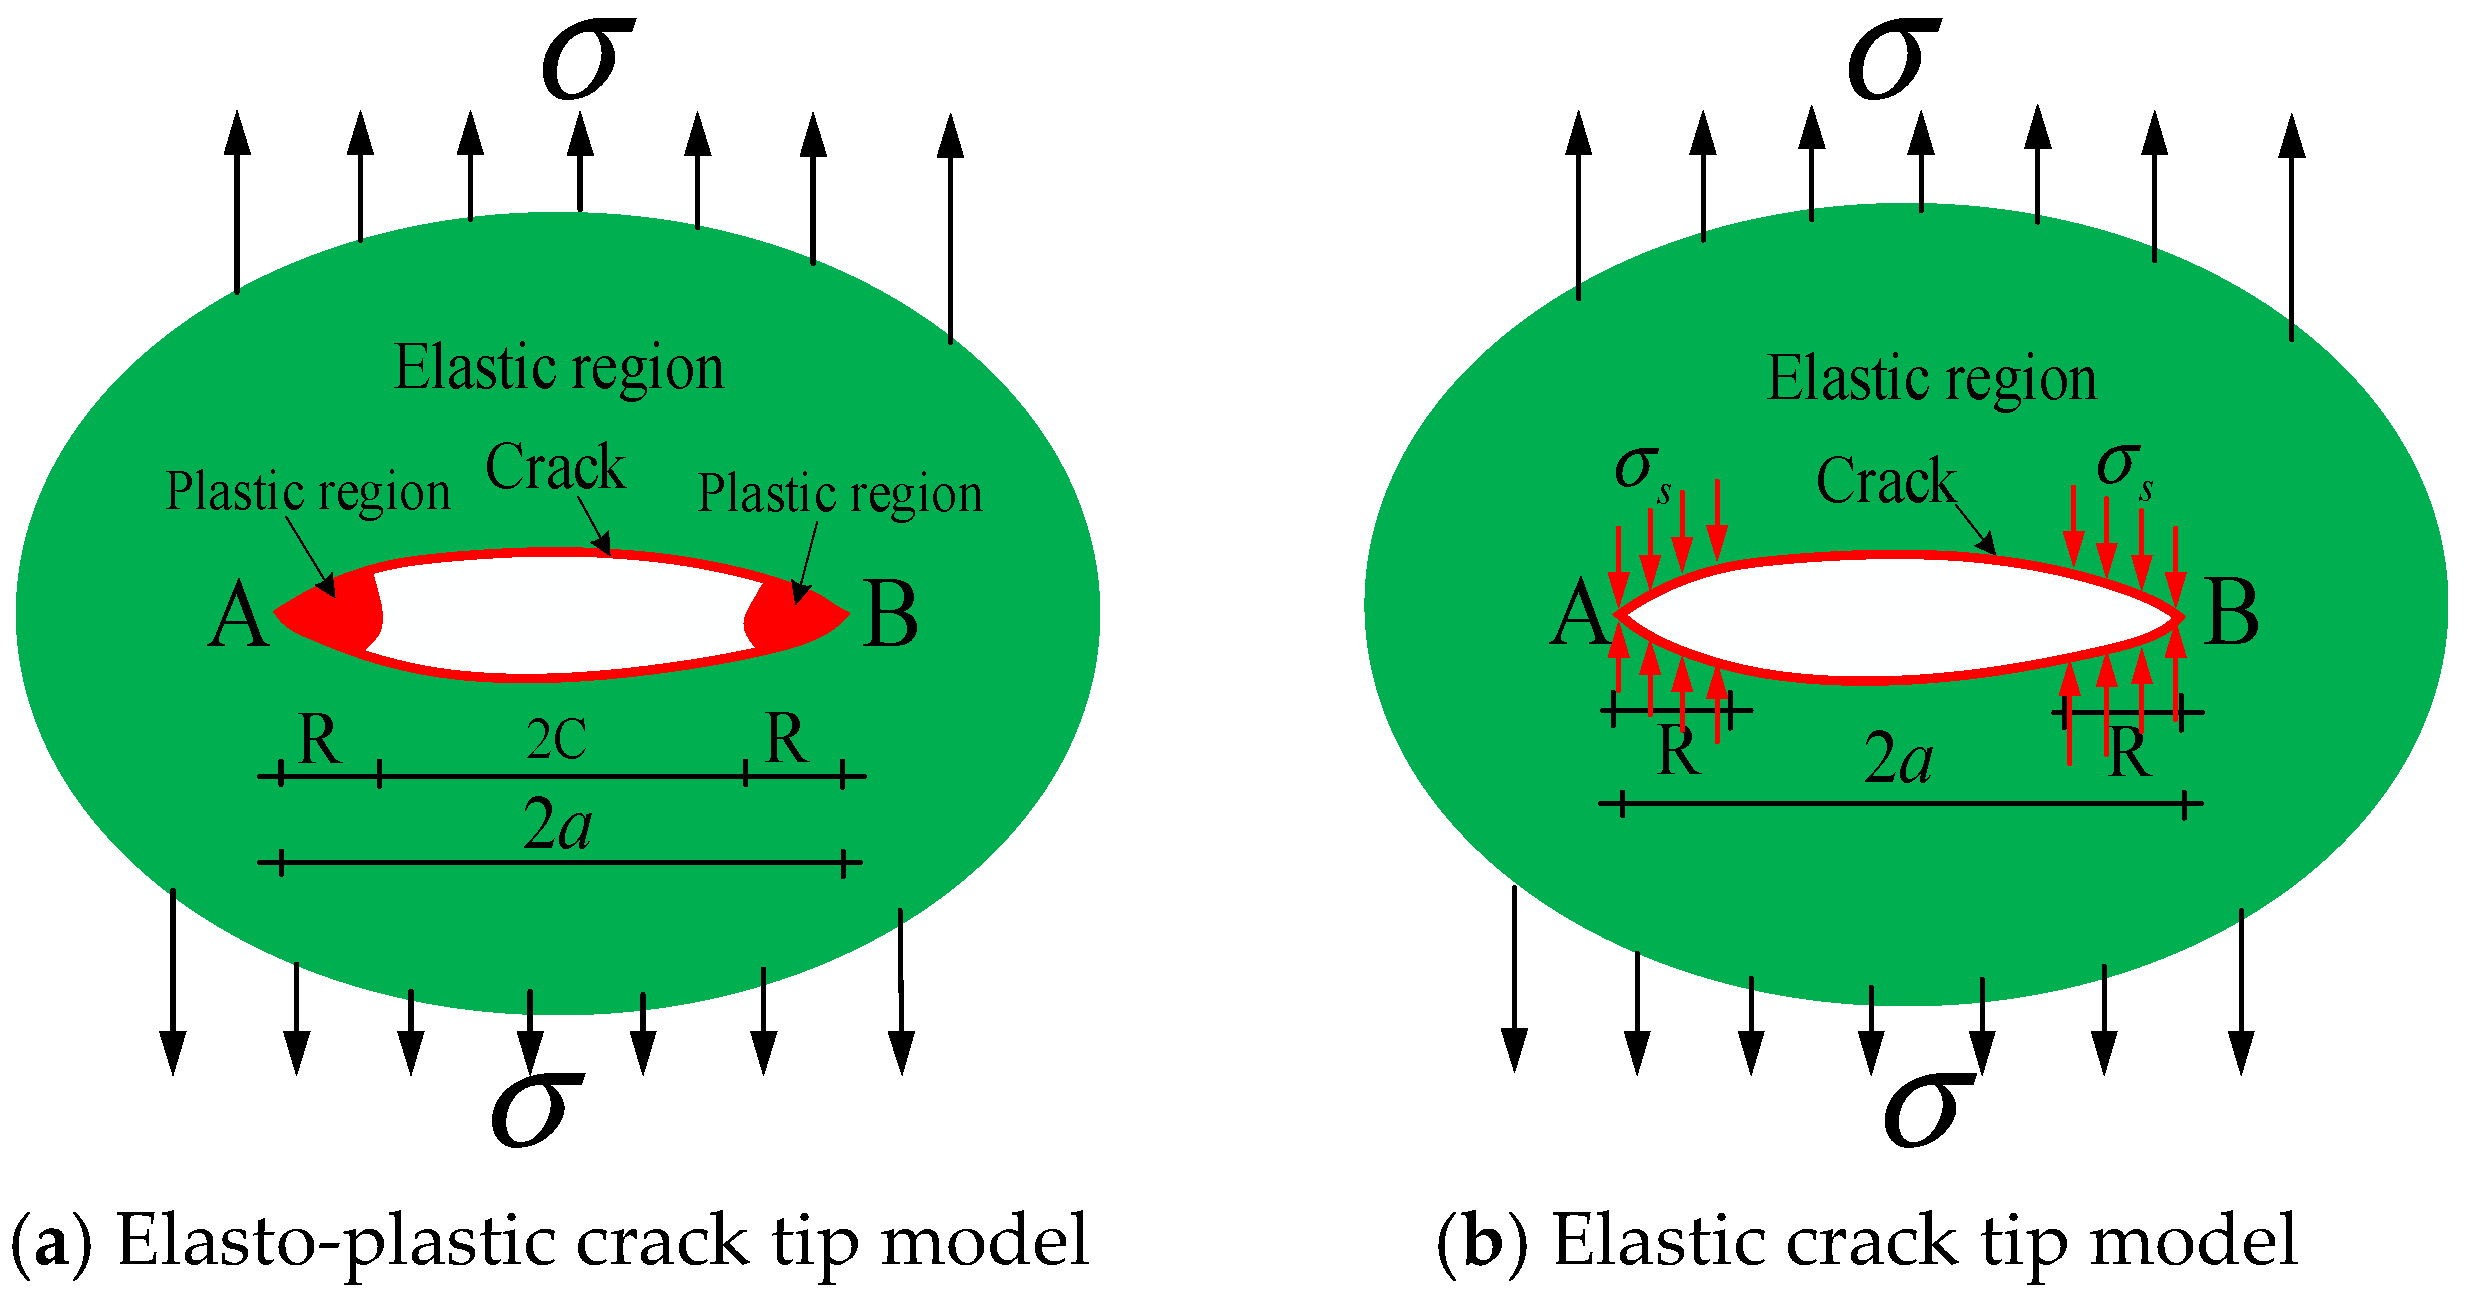
During crack tip opening, blunting, and extension, a plastic zone forms at the tip, as shown in Figure 4a, where represents stress or external load. Under loading, the red areas at tips A and B are plastic zones; the rest remains elastic. The plastic zone size (2R) is much smaller than the crack length (2C), so 2C >> 2R. In this region, the material reaches its limit and can no longer carry load. Thus, the plastic zone is treated as part of the crack, extending the effective length from 2C to 2, simplifying the elastoplastic problem into an elastic one, as shown in Figure 4b.
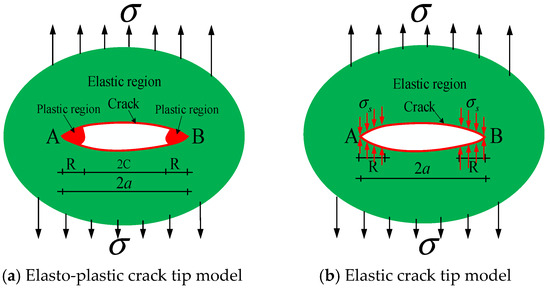
Figure 4.
Simplified D-M analysis model at crack tip.
With the increase in load, the opening displacement value of the crack tip also increases. It is assumed that when reaches a certain critical value , the crack tip begins to expand. According to Cassini’s theorem, the displacement of the force along the direction of the point of application is equal to the partial derivative of the strain energy of the elastomer with respect to the force , i.e.,
where is the strain energy; is the i-th solution position or the i-th particle position; is the force applied at the object; is the displacement of the force along the direction of the force vector.
The relationship between crack propagation force , strain energy , and crack length is expressed as follows:
For two-dimensional problems, the crack tip opening displacement can be expressed as
where is the virtual equilibrium force inside the object; , are the type I and type II crack stress intensity factors, and under the action of the stress intensity factors are expressed as , ; under the action of virtual equilibrium force , can be written as , ; is the instantaneous crack length; is the ultimate strength of the material when it enters plasticity.
The crack tip opening displacement of the D-M model is
Hypothesis:
Integral solution:
When the crack tip enters plasticity, the crack tip opening displacement is defined as the critical opening displacement during the crack propagation, which is defined as :
It is assumed that the crack propagation begins when the crack tip enters a plastic state. When the distance of two PD particles reaches the value , it is considered that cracks are formed between two particles. Combining PD theory and COD theory, there is
3. Crack Propagation of Steel Structure Members
3.1. Test
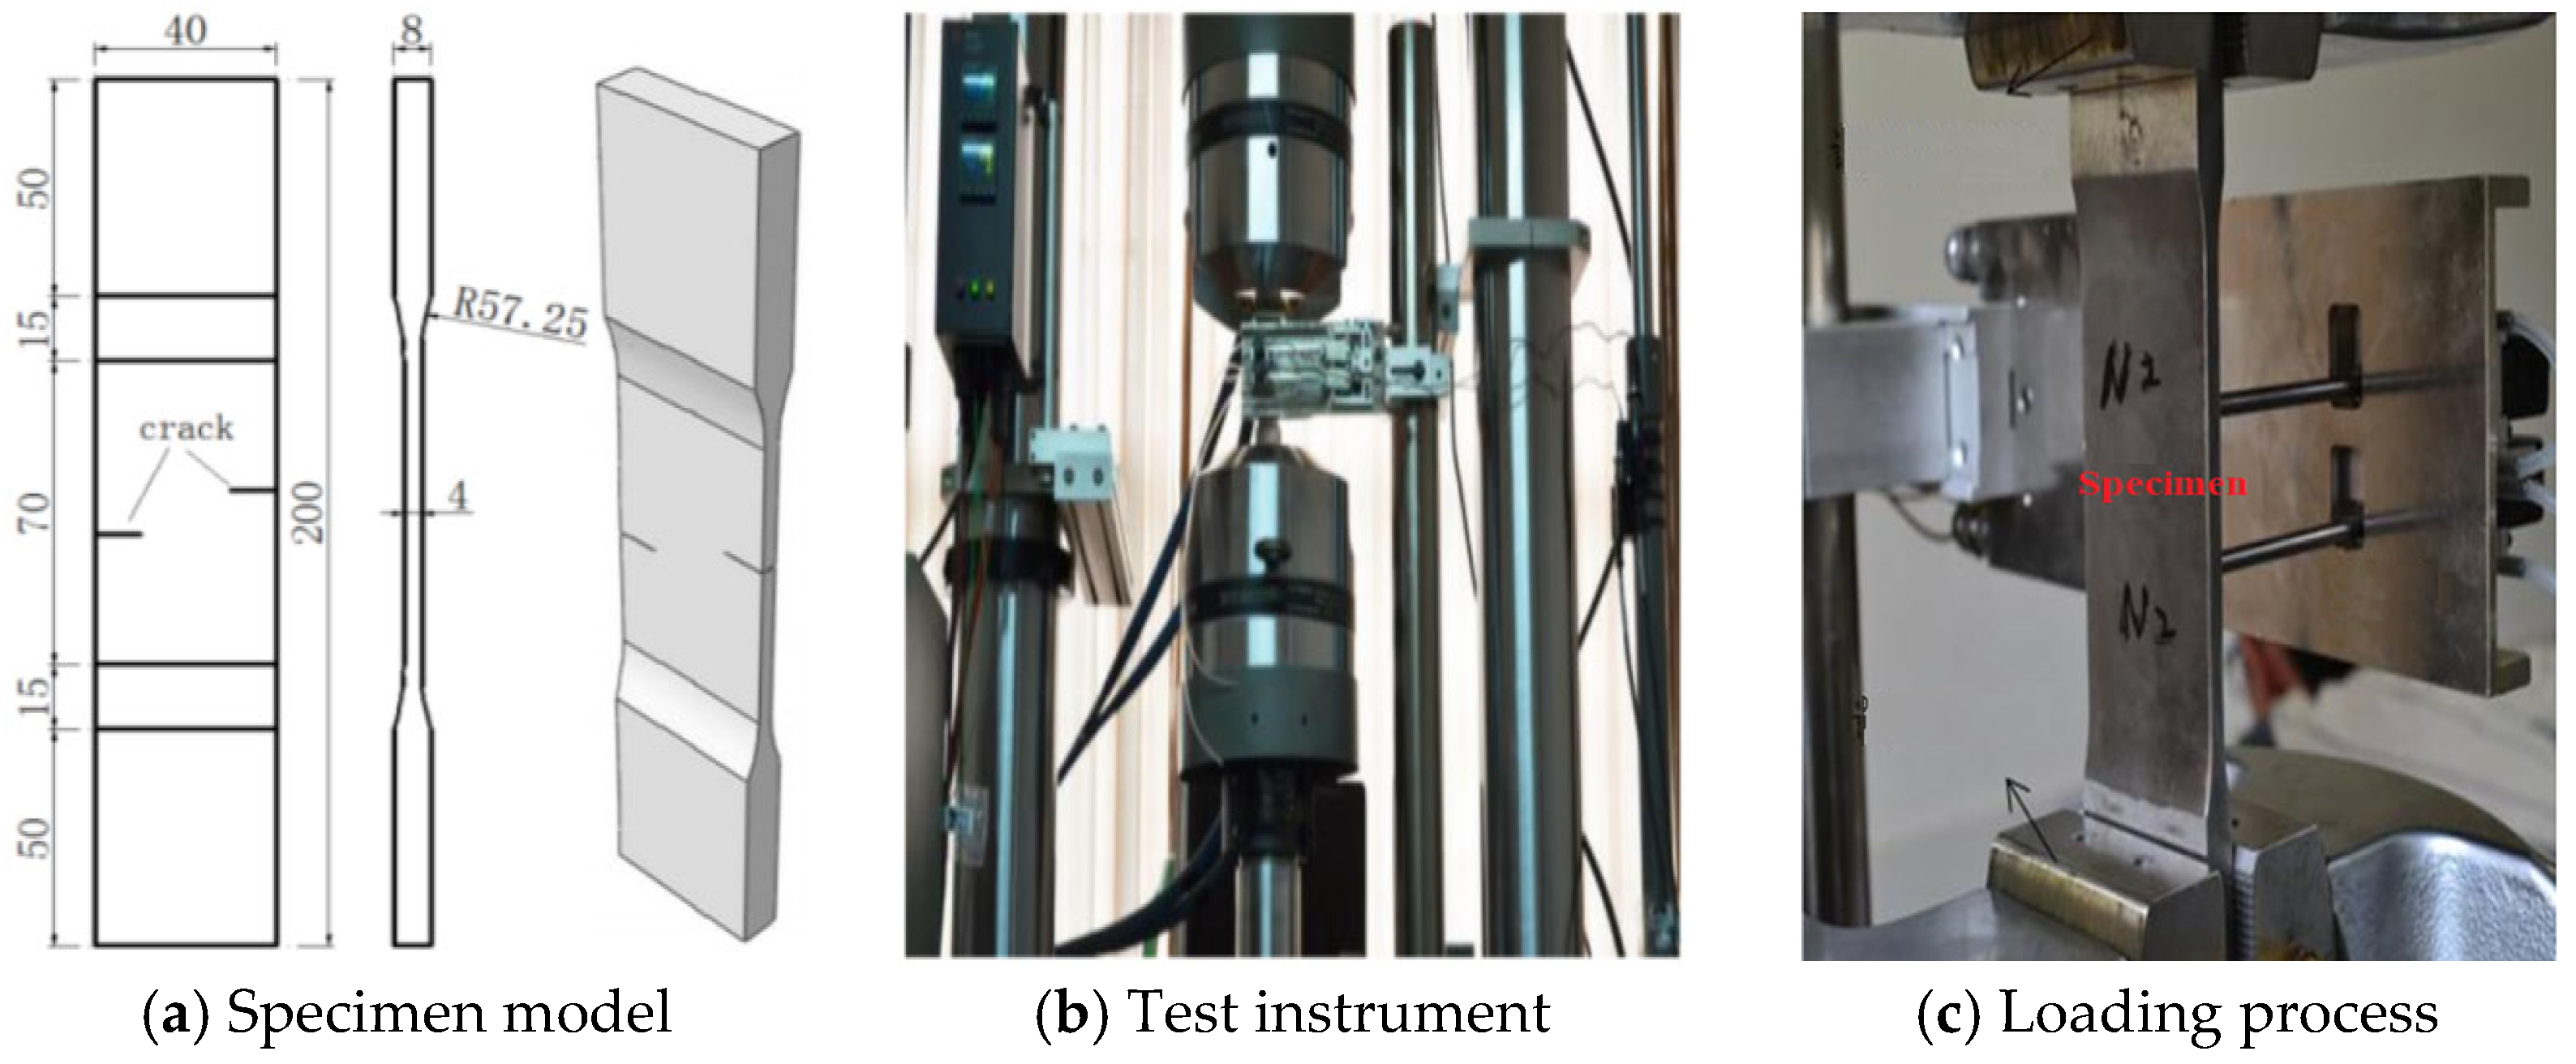
Q345 steel characterized by an elastic modulus of 203 GPa, a Poisson’s ratio of 0.3, an elongation of 27.96%, yield strength of 410 MPa and ultimate strength of 572 MPa was used to make three kinds of specimens with a length of 70 mm, width of 40 mm, and bilateral cracks: 5 mm length, spaced at 0 mm, 10 mm, and 20 mm. Models are shown in Figure 5a.
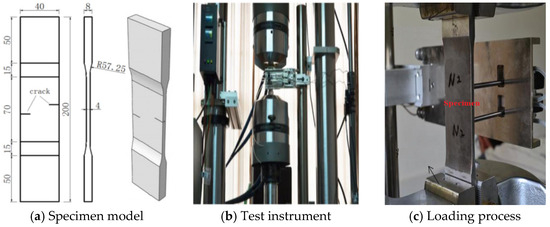
Figure 5.
Test instrument and specimen model [33].
The electro-hydraulic servo fatigue testing machine MT809 was adopted as the loading equipment for the test, as shown in Figure 5b. The fabricated specimens were installed on the clamps of the loading device, which was used to secure both ends of the specimens. The loading rate was adjusted to a displacement load of , and the power switch of the equipment was turned on to apply the load. The loading process is illustrated in Figure 5c. The quantity and size information of the specimens are presented in Table 1. We can use measuring tools with an accuracy of less than 1 mm to measure the crack length, such as vernier calipers and micrometers. After the specimen breaks, we remove it and take photos to record the fracture result of the specimen.

Table 1.
Information of bilateral crack specimens.
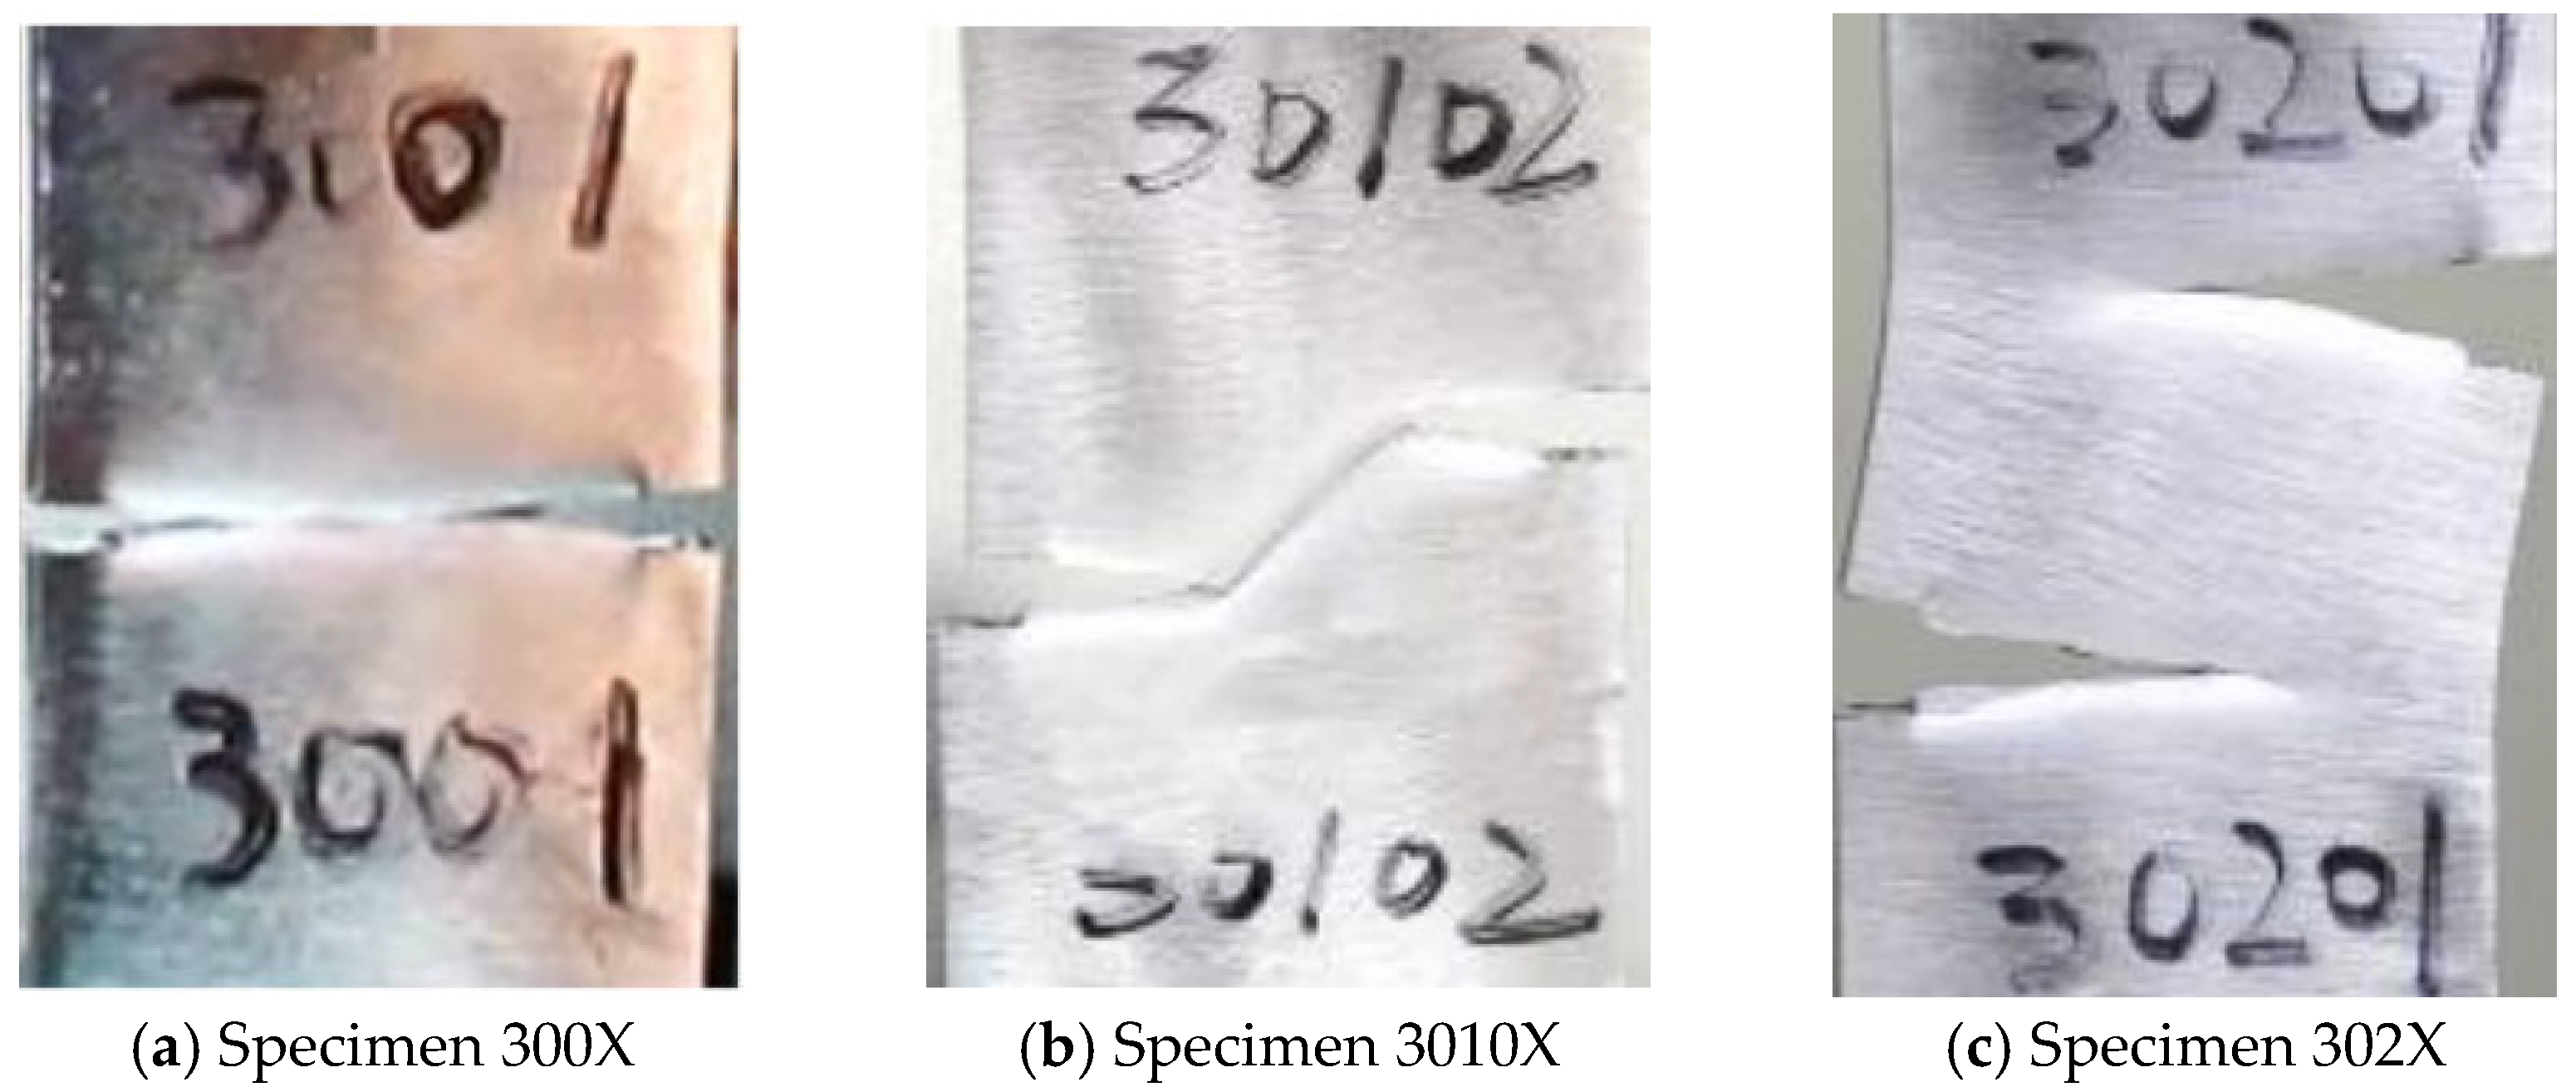
Figure 6 shows the fracture outcomes of the three specimens under tensile loading. Figure 6a presents the 300X specimen featuring bilateral cracks with zero longitudinal spacing, where the crack ultimately develops into a horizontal fracture. Figure 6b displays the 3010X specimen with a 10 mm longitudinal separation between the two cracks. The cracks on both sides began to expand in a straight line and then spread in opposite directions along a tilt angle of about 30–45 and finally run through the whole specimen. Figure 6c shows the 3020X specimen with 20 mm bilateral crack spacing. The wide separation prevents crack interaction, allowing independent propagation and formation of two distinct horizontal cracks.
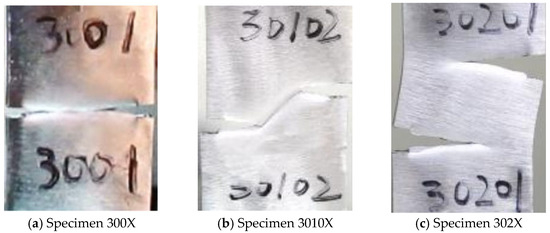
Figure 6.
Fracture results of three types of bilateral crack specimens [33].
3.2. PD Theoretical Simulation Analysis
3.2.1. Simulation Analysis of Double-Sided Crack Specimens
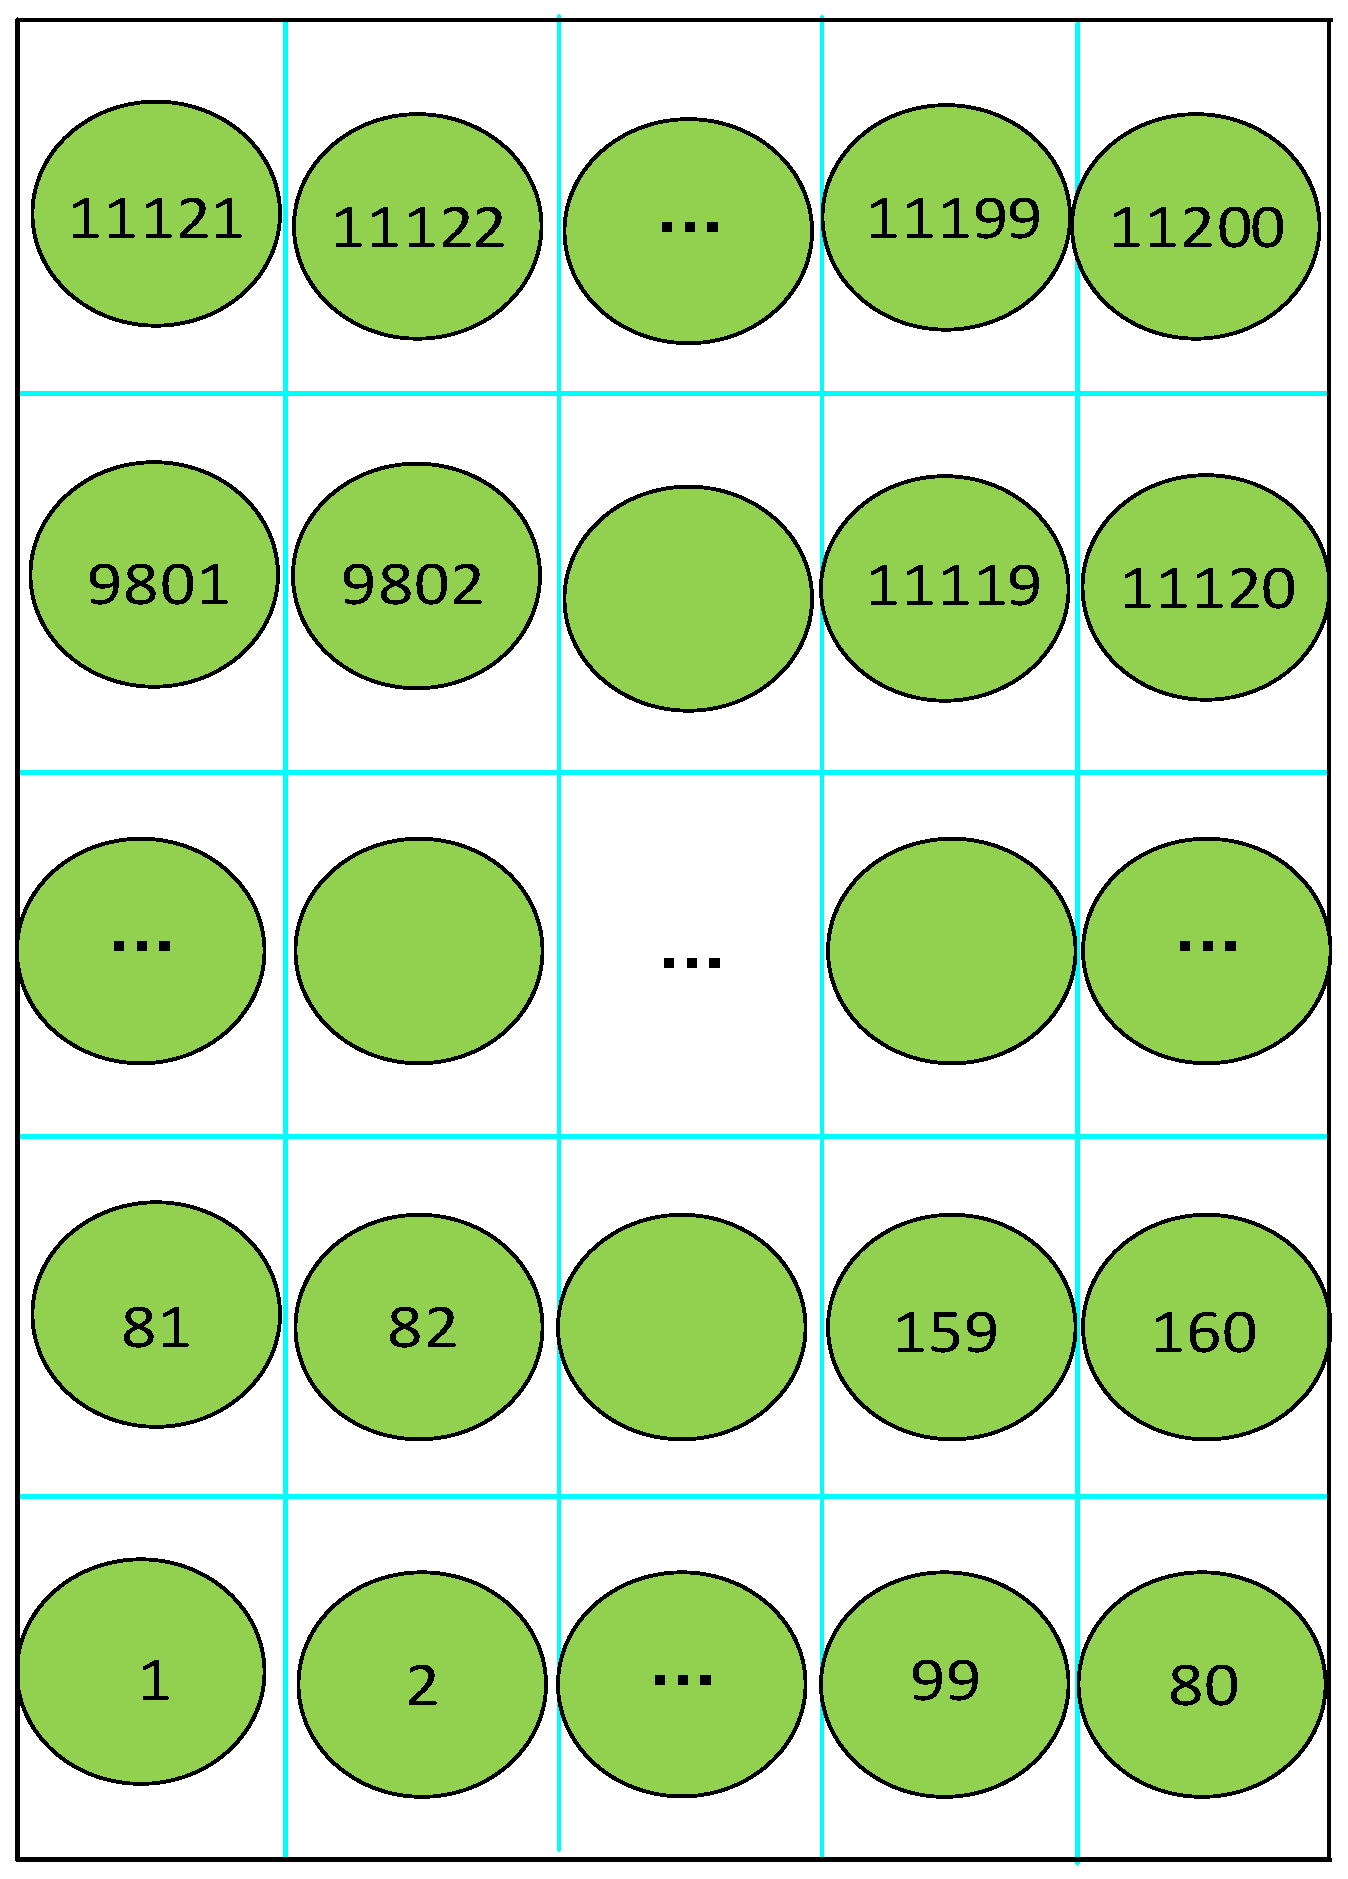
Due to the uniform load, the PD physical model simplifies the Q345 steel plate to the unidirectional tensile problem of the two-dimensional specimen size 70 mm × 40 mm × 0.5 mm along the length direction. The PD model cell has a side length of ; there are 11,200 particles in the plate, and the division and distribution pattern of the PD particles in the specimen are shown in Figure 7. The load is applied uniformly to the nodes within a boundary region of width of . The relationship between the crack propagation path and crack length of bilateral crack specimens is simulated by PD theory.
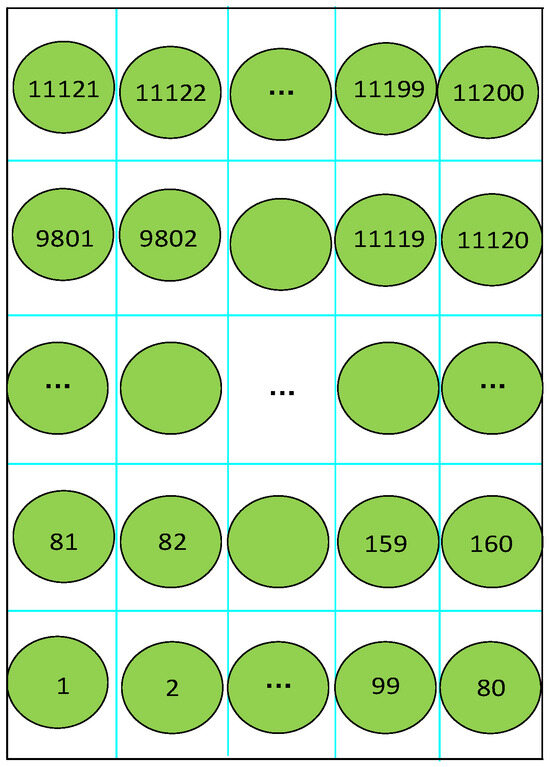
Figure 7.
Distribution of PD particle positions in the specimen.
The PD theory grid division and particle position distribution program is as follows:
Specimen 300X
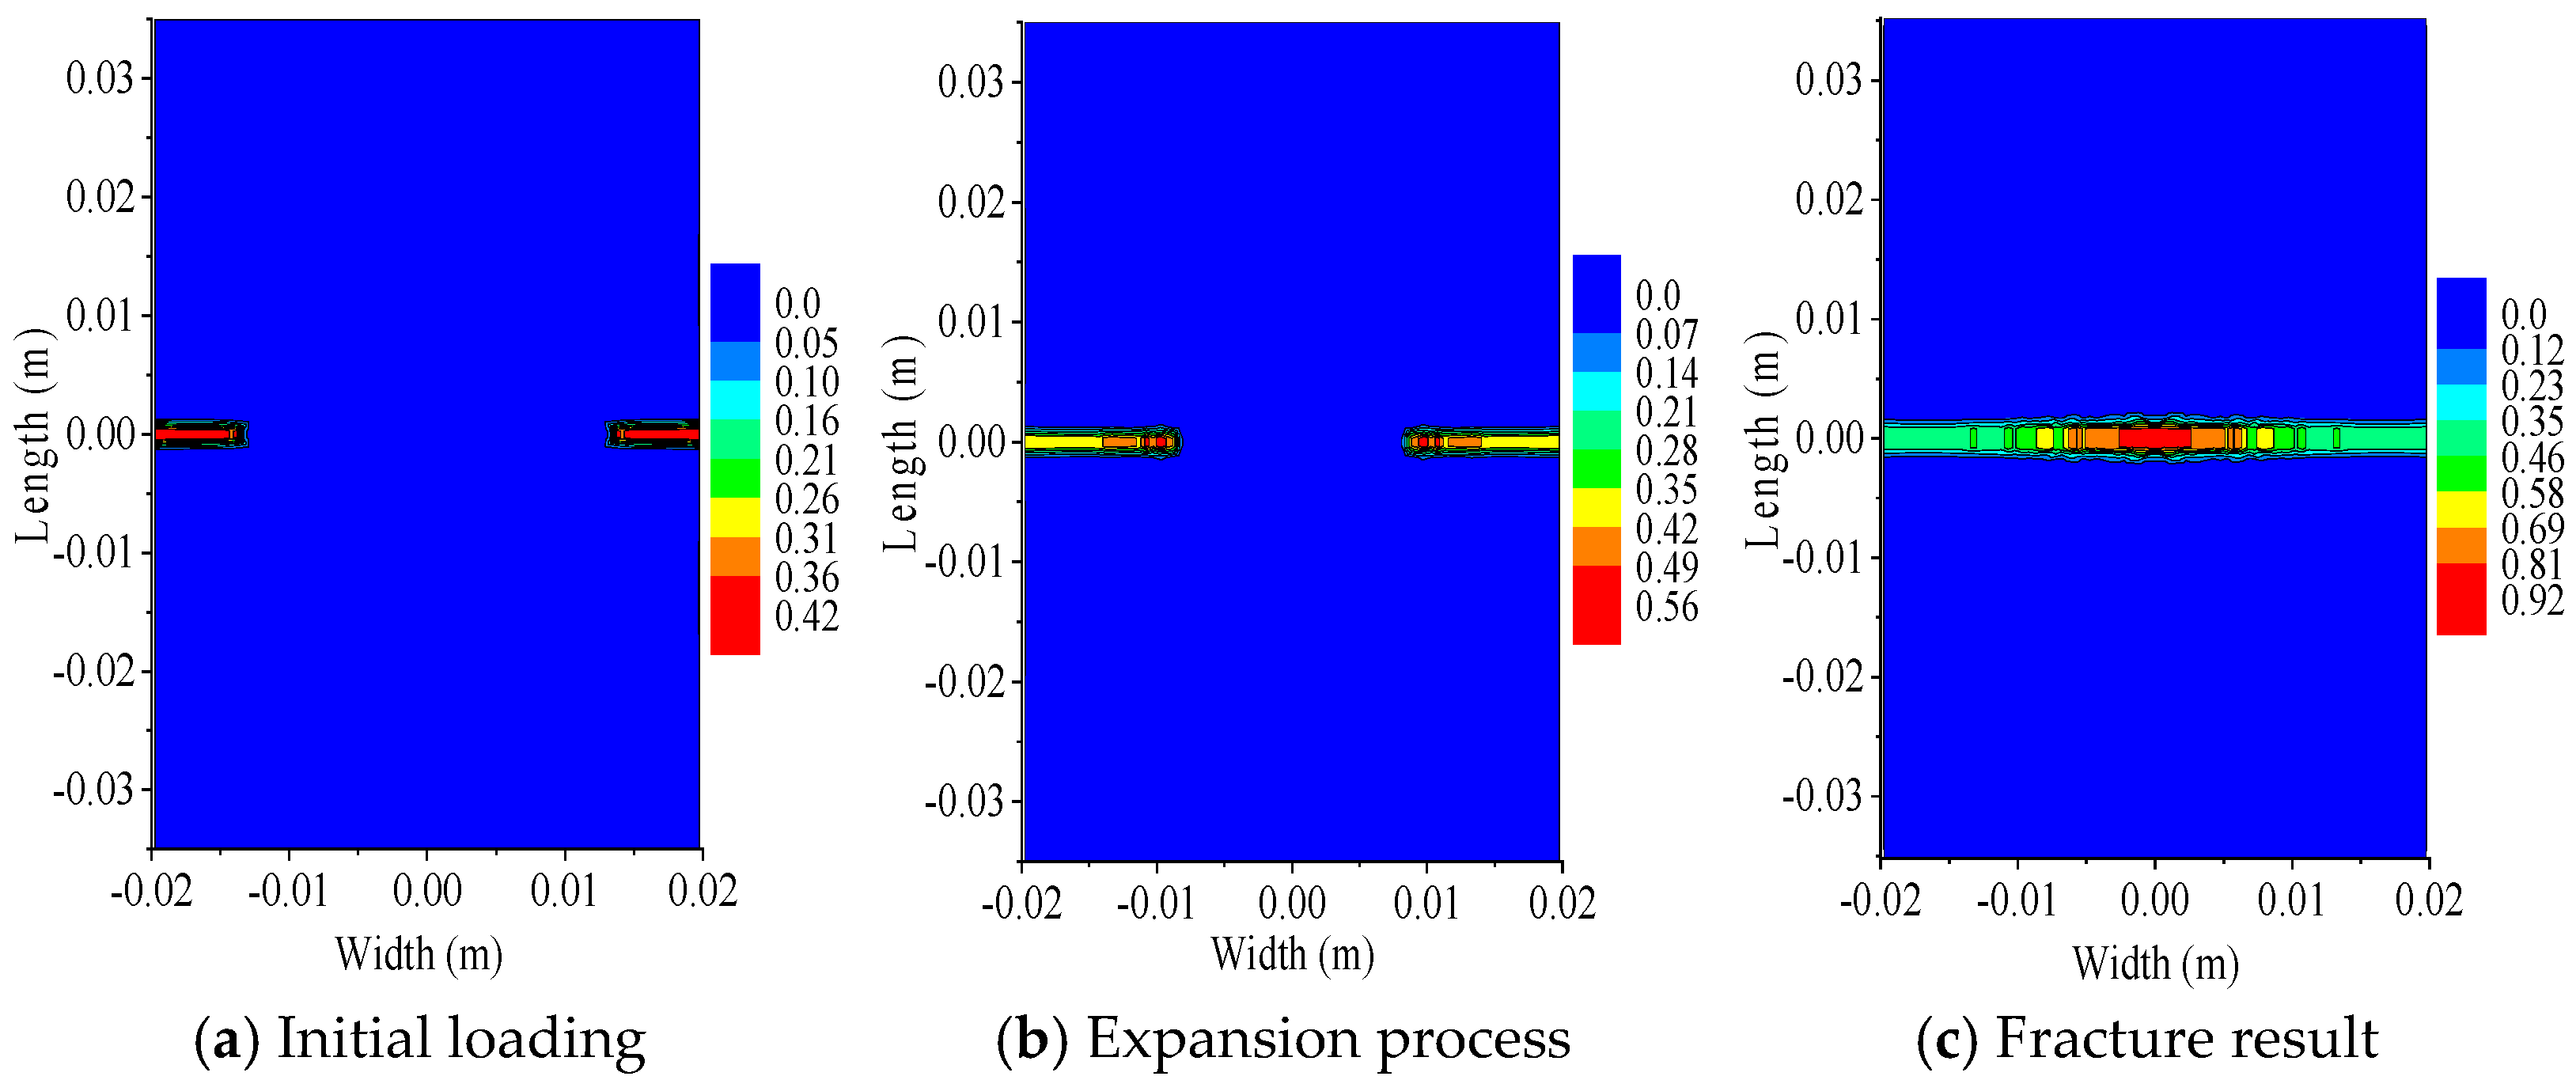
Figure 8 shows the 300X specimen with a bilateral crack length of 5 mm, as well as the change trend of crack initiation and damage and the whole process of crack propagation. Figure 8a illustrates the initial crack formation and damage progression in the specimen during the early loading phase. As the load is applied, the damage expands continuously and gradually expands horizontally. Figure 8b depicts the crack growth trend of the specimen before fracture. Figure 8c shows the final fracture result of the specimen. As illustrated in Figure 6a and Figure 8, the experimental fracture patterns of the specimens align well with the simulation outcomes based on peridynamic (PD) theory. Under uniaxial tensile loading, specimens containing 5 mm bilateral cracks propagate horizontally in opposite directions, gradually coalescing into a single horizontal crack, ultimately leading to specimen separation into two distinct segments, as depicted in Figure 8c.
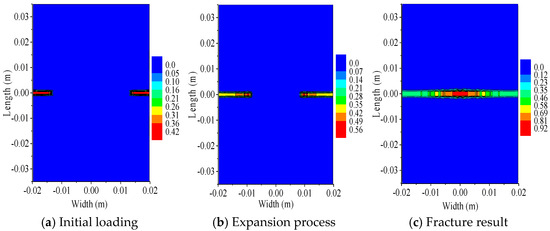
Figure 8.
Damage and crack propagation of 300X specimen.
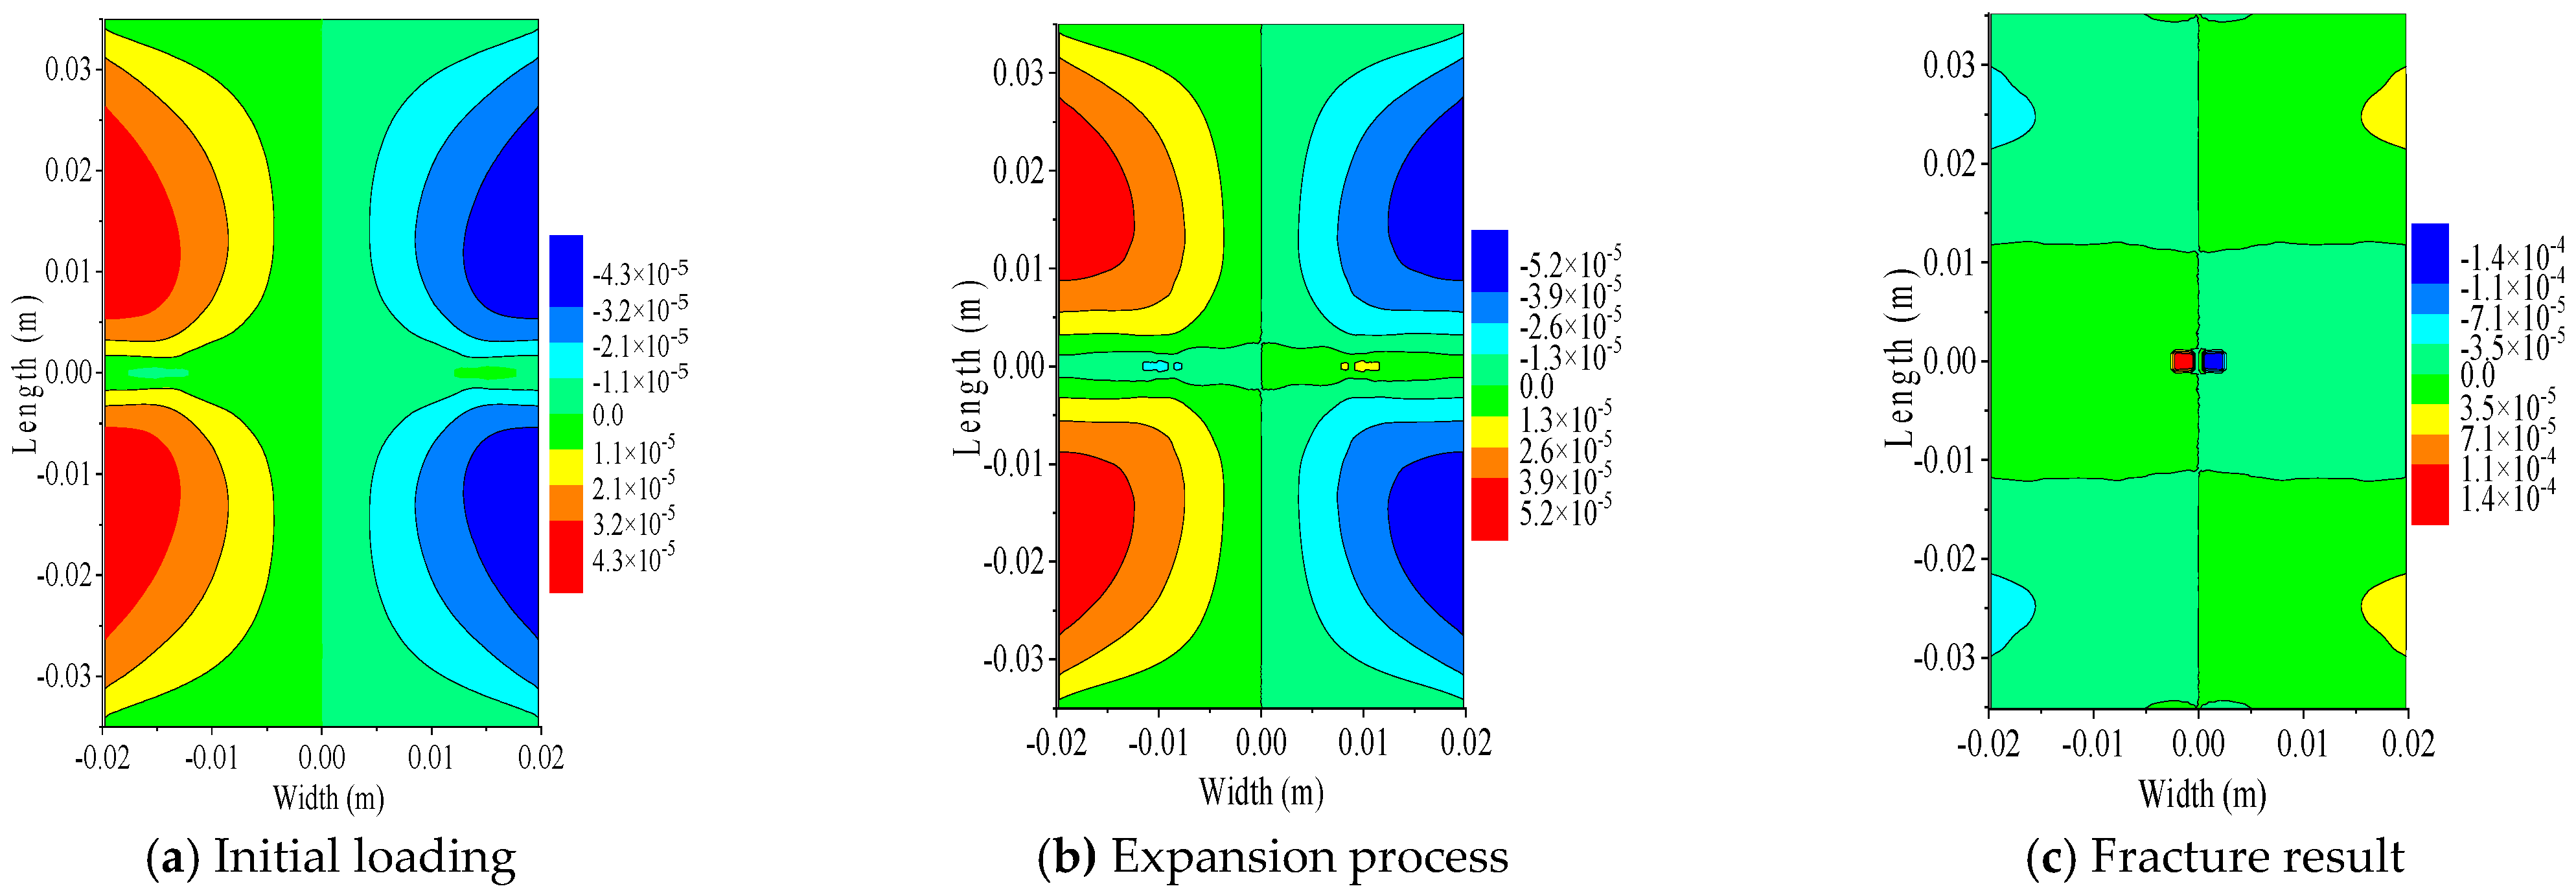
Figure 9 presents the crack initiation and propagation process of the 300X specimen and the displacement variation of the particles along the X direction within the specimen. As shown in Figure 9a, during the crack initiation and propagation, the displacement of the particles at the upper and lower ends of the vertical crack is the largest, forming a semi-circular shape that is symmetrical about the X-axis and antisymmetric along the Y-axis. As illustrated in Figure 9b, as the crack propagates, the area with the maximum particle displacement gradually expands towards the crack tip at the same rate. When the crack is about to penetrate the entire specimen, the semi-circular displacement of the particles about the X-axis disappears, becoming a rectangular symmetry about both the X-axis and Y-axis, and the position of the maximum particle displacement shifts to the area where the two crack tips are about to merge, as shown in Figure 9c.
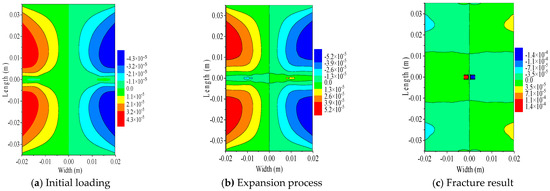
Figure 9.
Change rule of 300X specimen particles’ displacement in X direction.
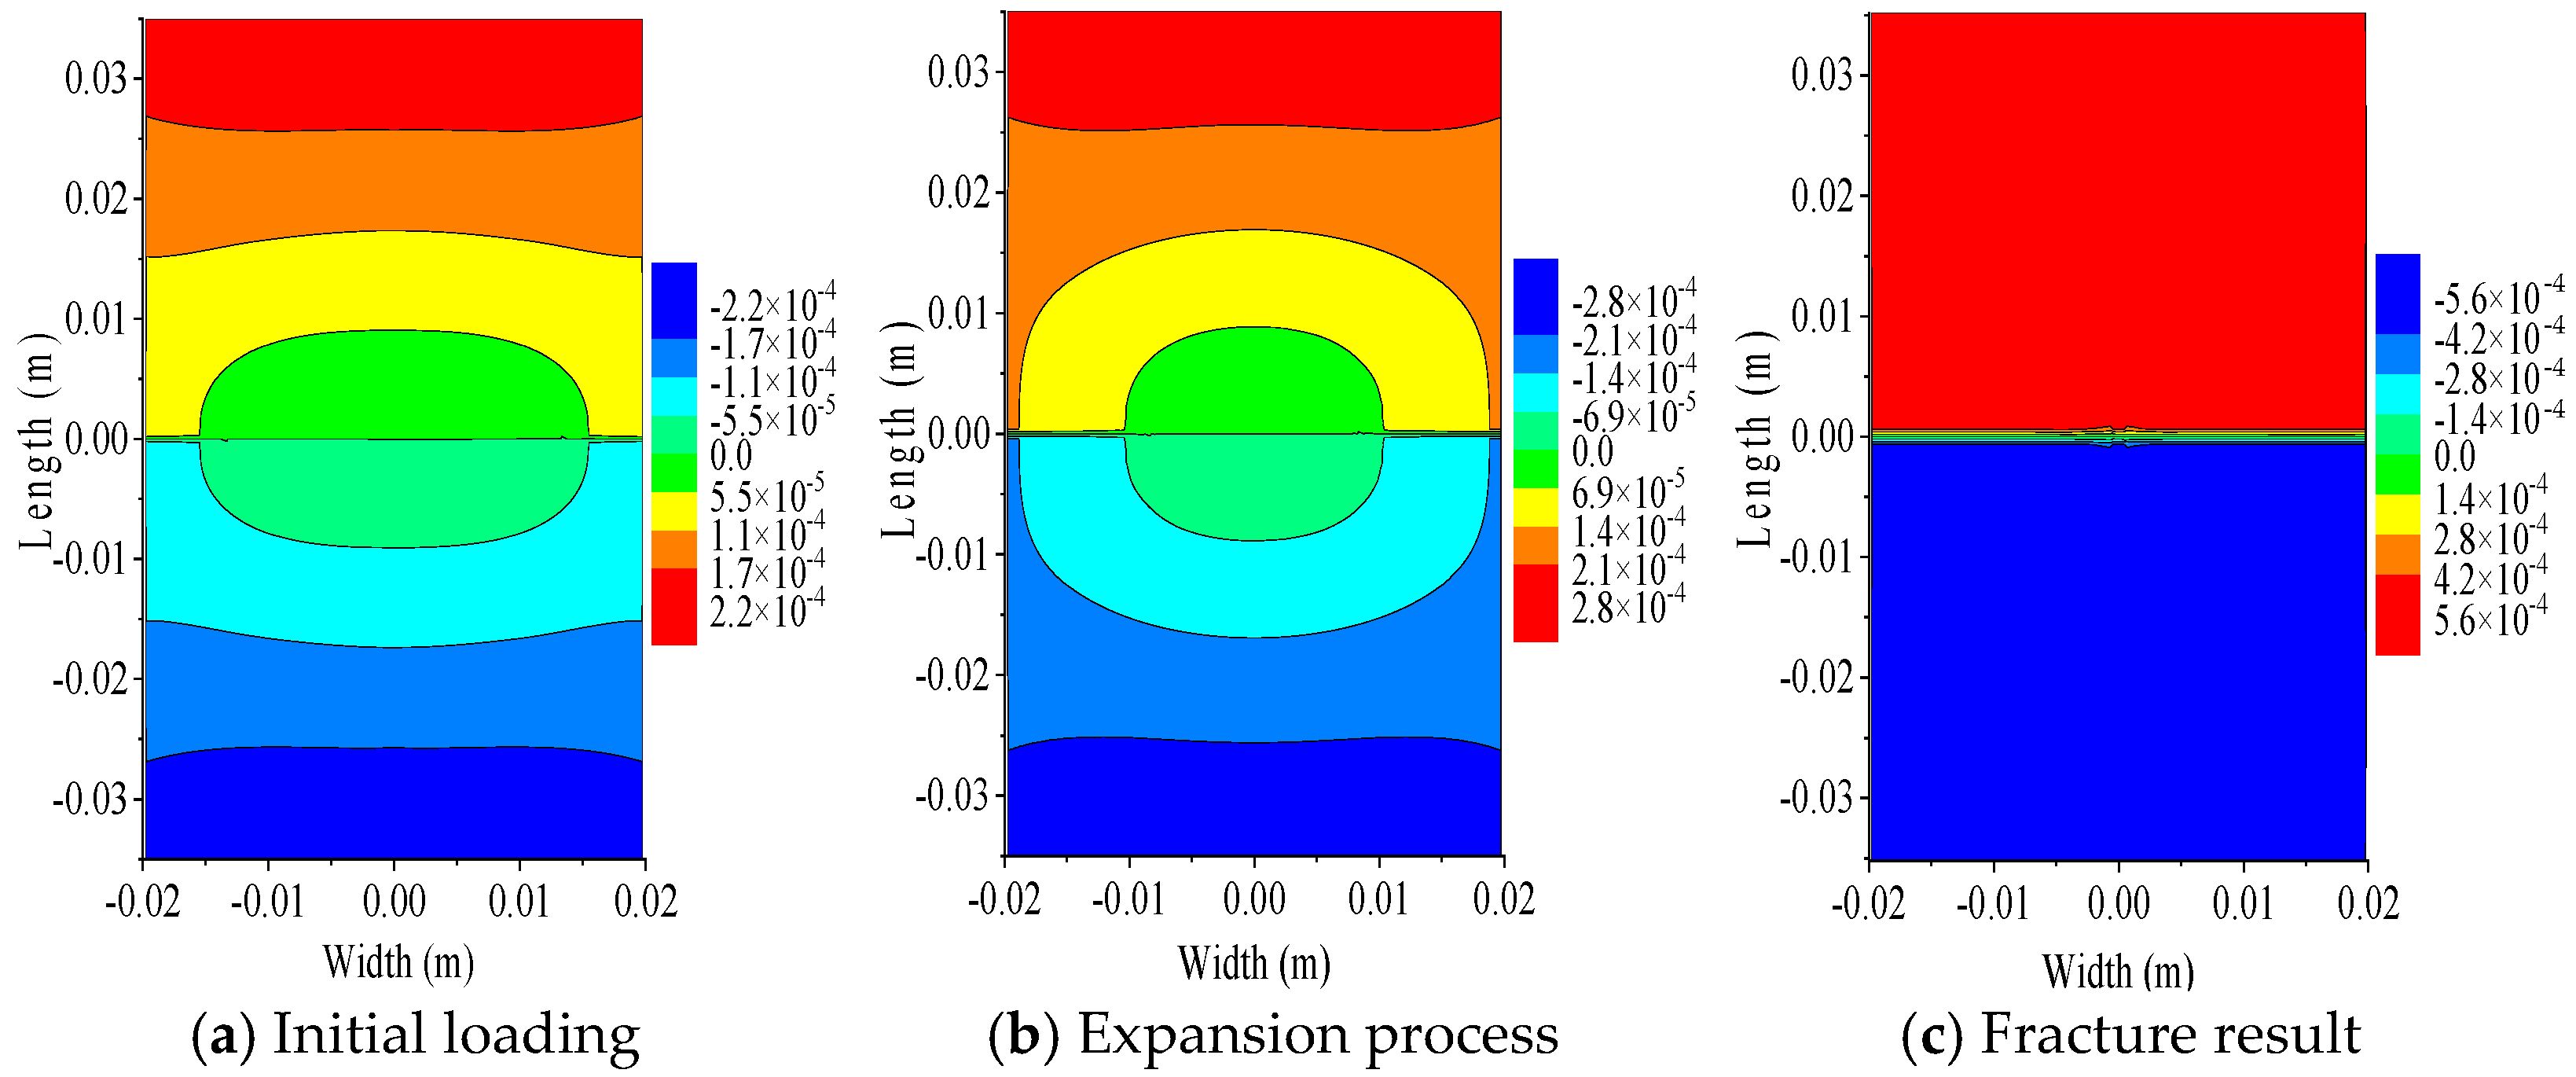
Figure 10 illustrates the Y-direction displacement of PD particles during crack propagation in the 300X specimen. At crack initiation, maximum displacement occurs at the specimen ends, while minimum displacement forms an elliptical zone at the crack tips. As the crack grows, the maximum displacement region expands inward from the ends, and the minimum displacement area shrinks from elliptical to circular. When the crack fully penetrates the specimen, maximum displacement particles are symmetric about the X-axis with equal absolute values. The circular minimum displacement region continuously contracts and eventually approaches zero.
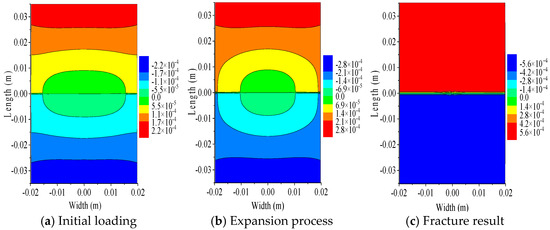
Figure 10.
Change rule of 300X specimen particles’ displacement in Y direction.
Specimen 3010X
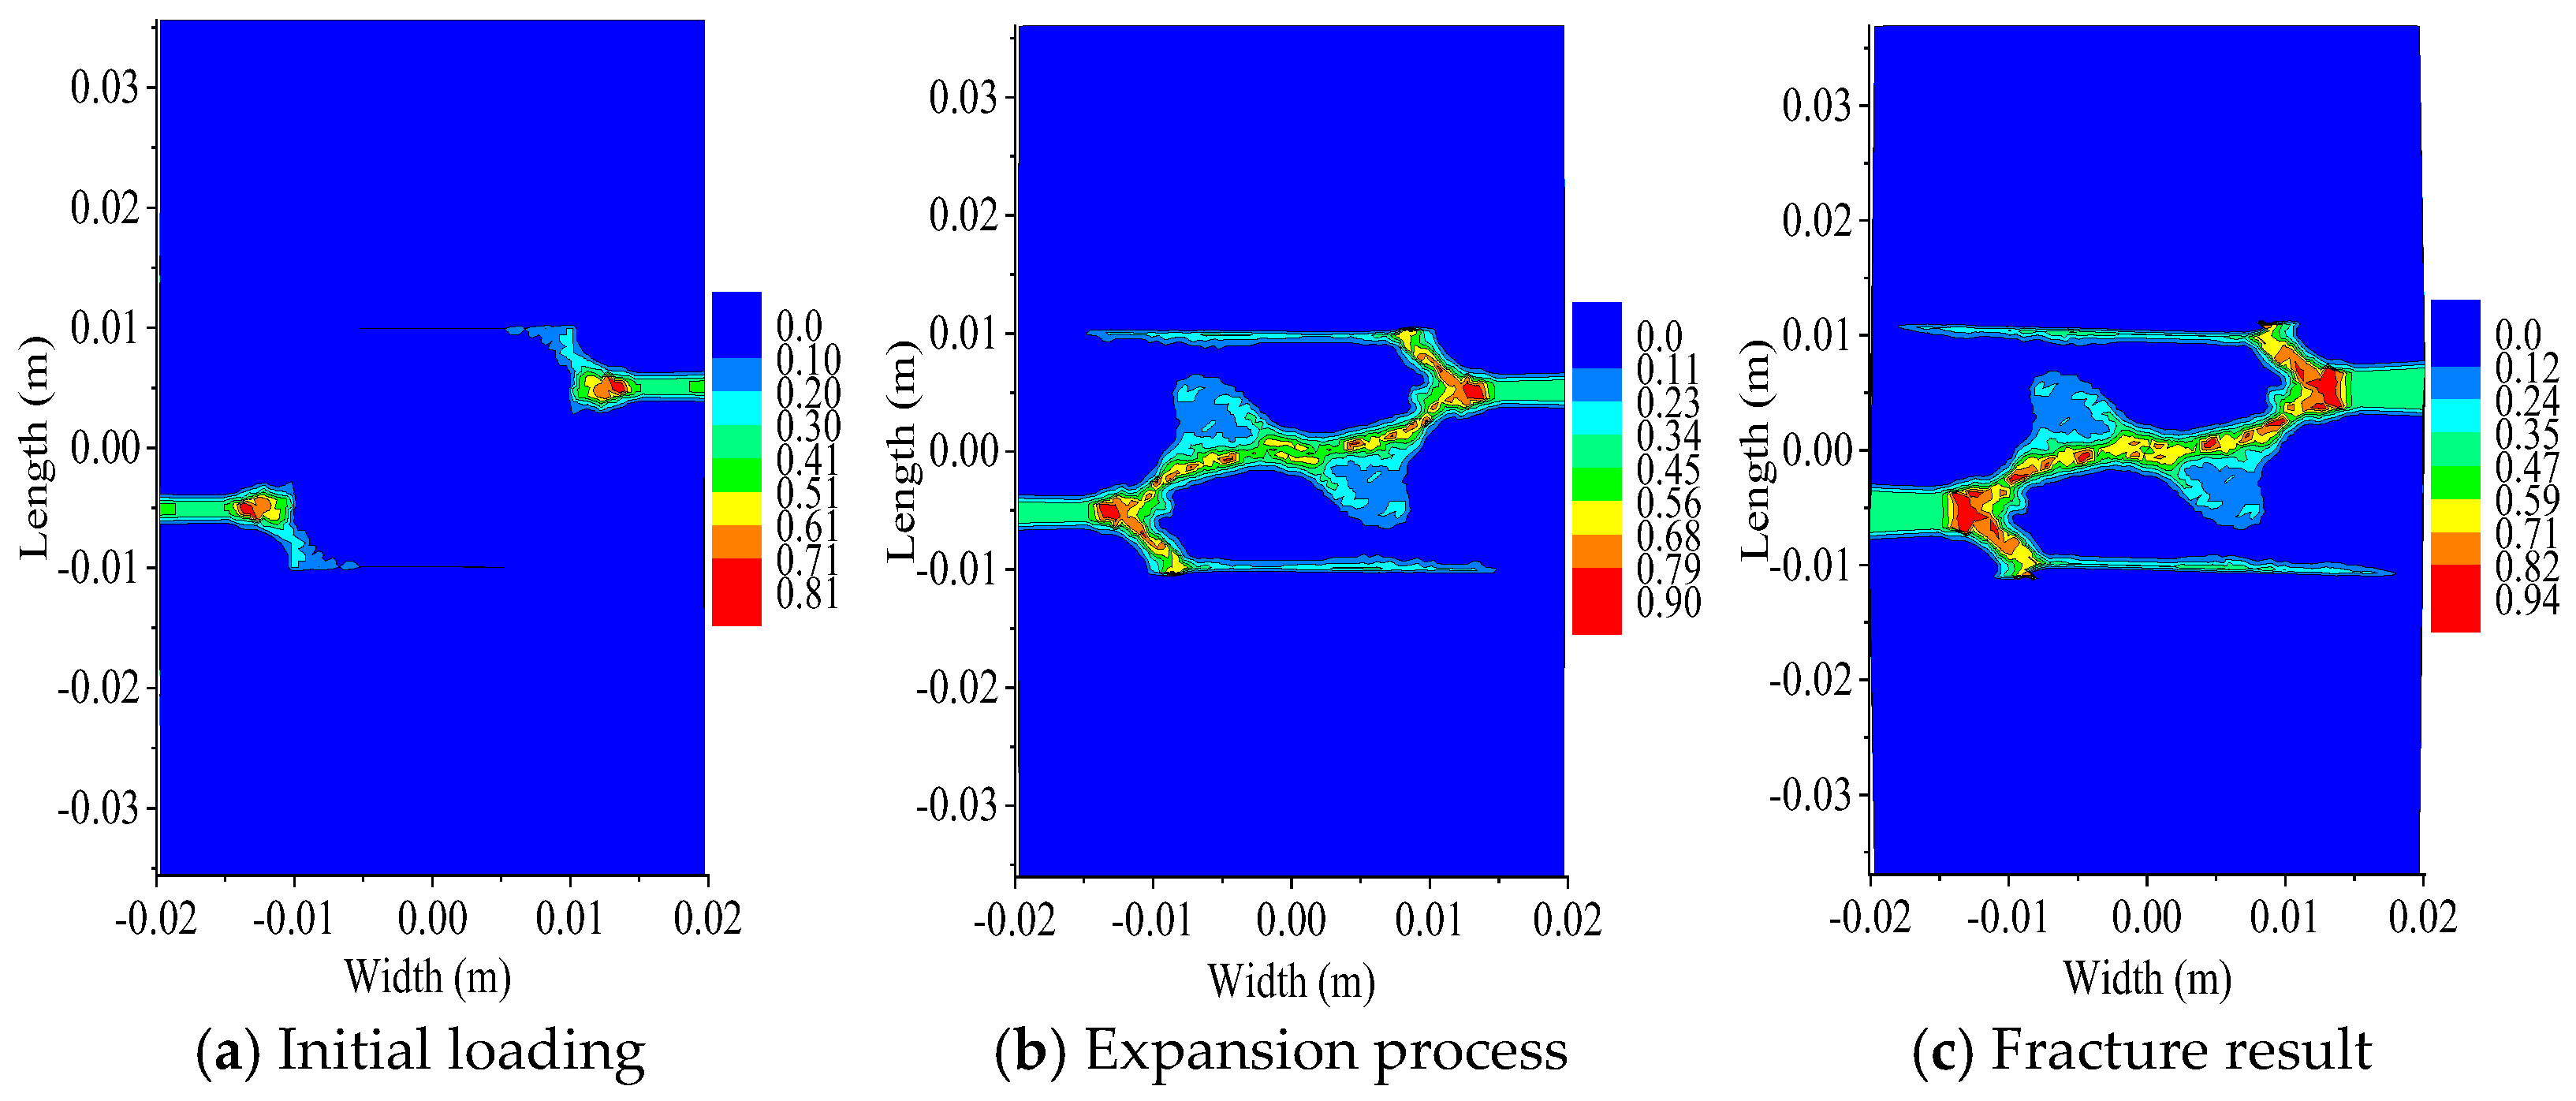
Figure 11 illustrates the damage evolution and crack propagation process in the 3010X specimen, which contains bilateral cracks of 5 mm in length and a longitudinal crack spacing of 10 mm, under applied loading. As shown in Figure 11a, with the continuous load application, the two crack tips spread along the horizontal direction for a short time, and then the crack tips spread along the direction of 30°~45° with the horizontal direction, and the damage value is about 0.8. Subsequently, the crack tip began to bifurcate and formed two damage cracks with an angle of about 70°. At the same time, the two cracks expanding opposite each other gradually developed into the main crack; the other two cracks only formed local damage in the crack bifurcation region, as shown in Figure 11b. The two main cracks finally merged into an oblique crack with an angle of 30°~45° from the horizontal direction, and the damage value was about 1.0, as shown in Figure 11c.
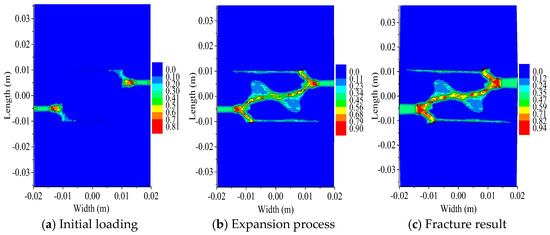
Figure 11.
Damage and crack propagation of 3010X specimen.
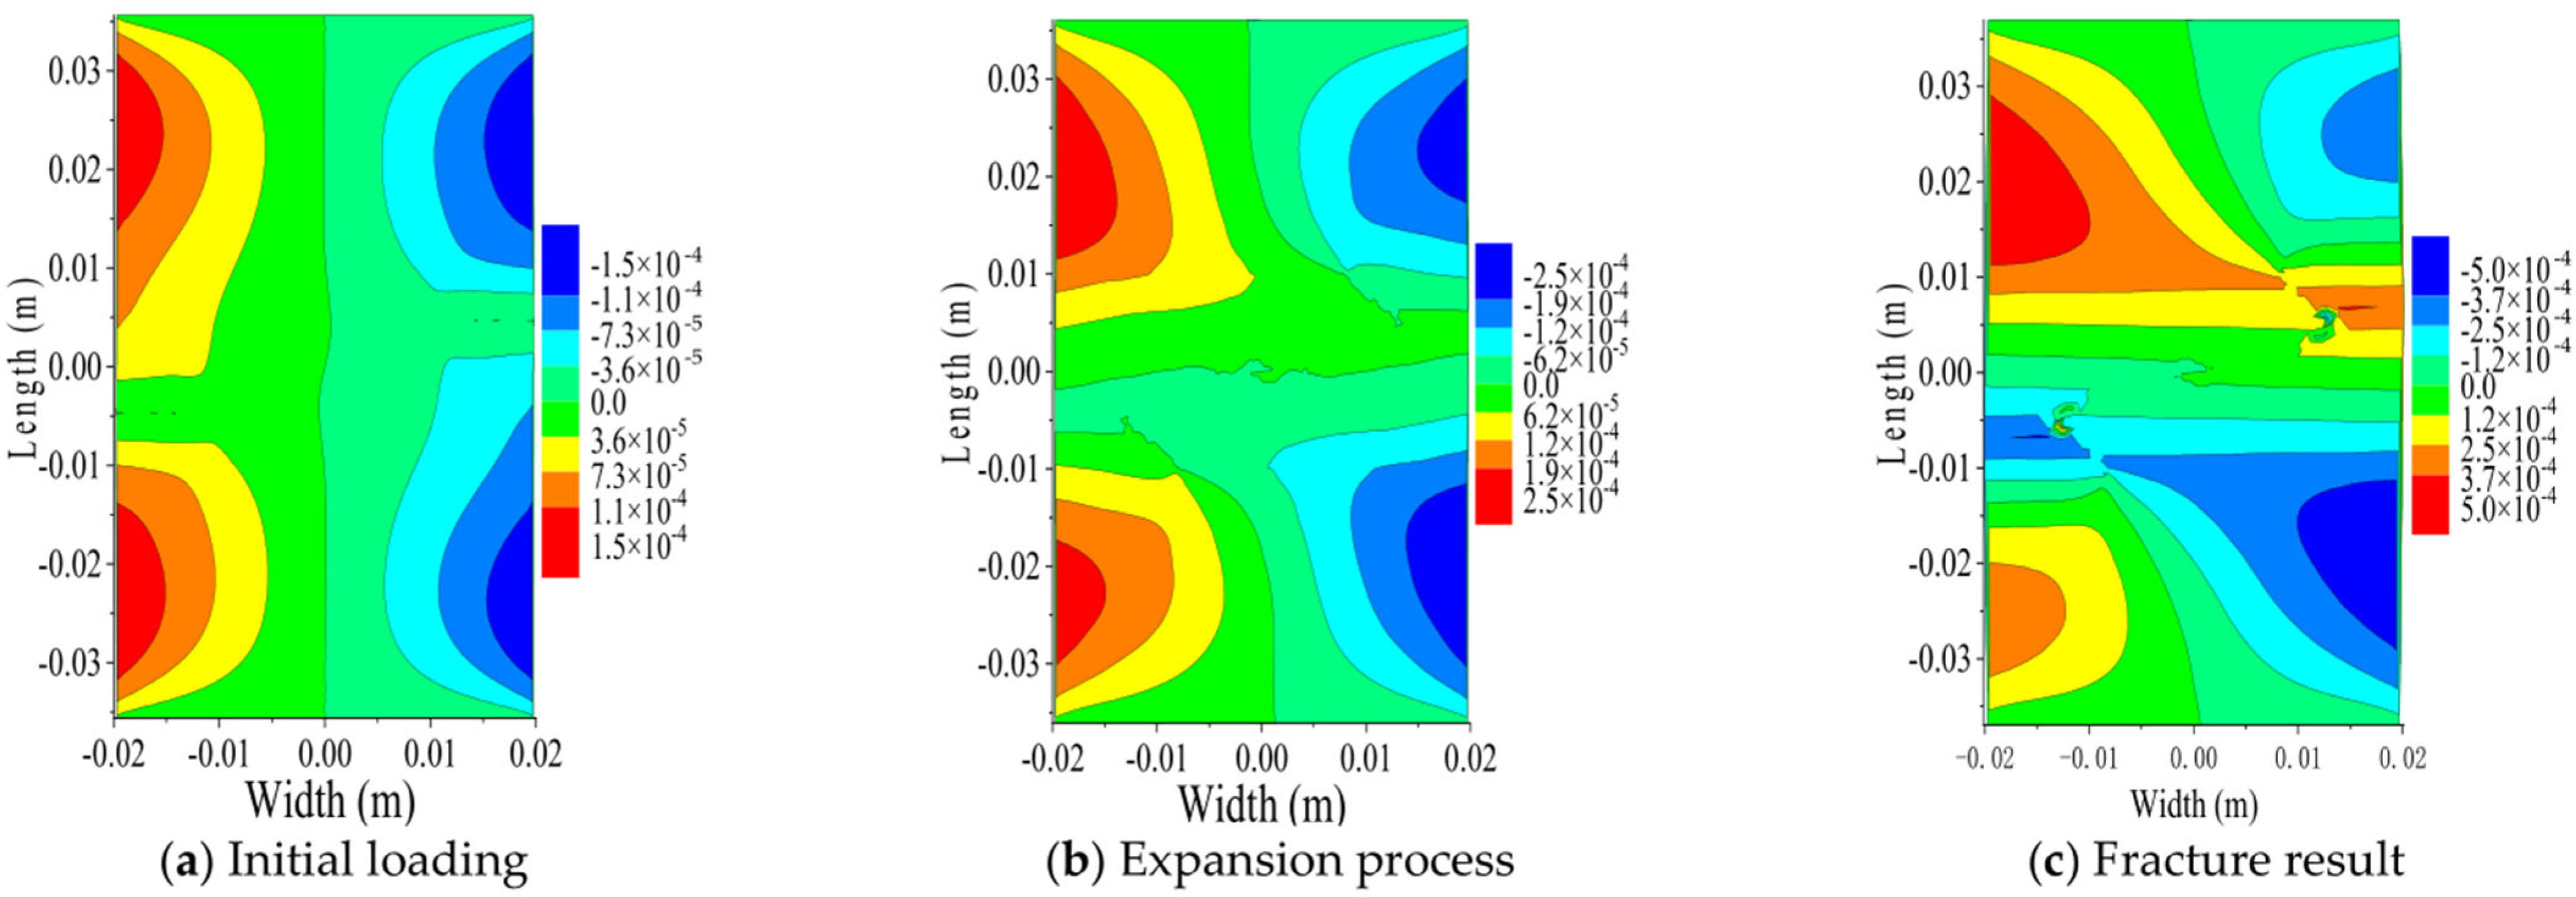
As shown in Figure 12, the X-direction displacement distribution of PD particles in the 3010X specimen is symmetric and inclined relative to the specimen center. Figure 12a reveals that all particle displacements in the X-direction are directed toward the Y-axis. As shown in Figure 12b, under loading, crack propagation continues and the displacement of PD particles progressively increases. The particle displacements extending along the Y-direction near the X-axis gradually span across the entire specimen. As time goes on, the displacement value increased continuously, and PD particles penetrating the strip displacement of the specimen increased continuously, forming displacement with horizontal gradient distribution near the X-axis, as illustrated in Figure 12c.
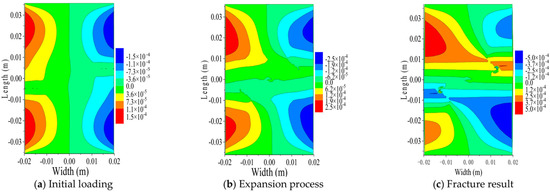
Figure 12.
Change rule of 3010X specimen particles’ displacement in X direction.
Figure 13 illustrates the Y-direction displacement distribution of PD particles during crack propagation in the 3010X specimen. At the beginning of the loading stage, particle displacements at both ends decrease progressively toward the X-axis, forming a minimal-displacement region near the X-axis that exhibits an elliptical pattern, as shown in Figure 13a. With the application of load, cracks continued to propagate, and the displacement gradient in the Y-direction gradually evolved into an arc-shaped pattern, while the Y-direction displacement distribution at the center of the specimen transformed into a circular pattern, as shown in Figure 13b. When the crack fully penetrates the specimen, the region of minimum displacement reaches its smallest extent, while the areas of maximum Y-direction displacement at both ends expand significantly, as shown in Figure 13c.
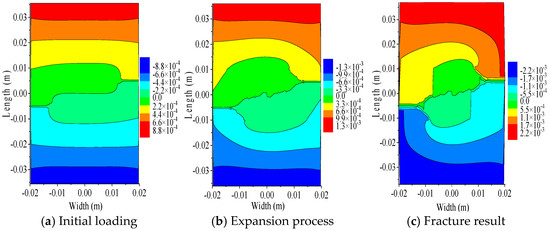
Figure 13.
Change rule of 3010X specimen particles’ displacement in Y direction.
Specimen 3020X
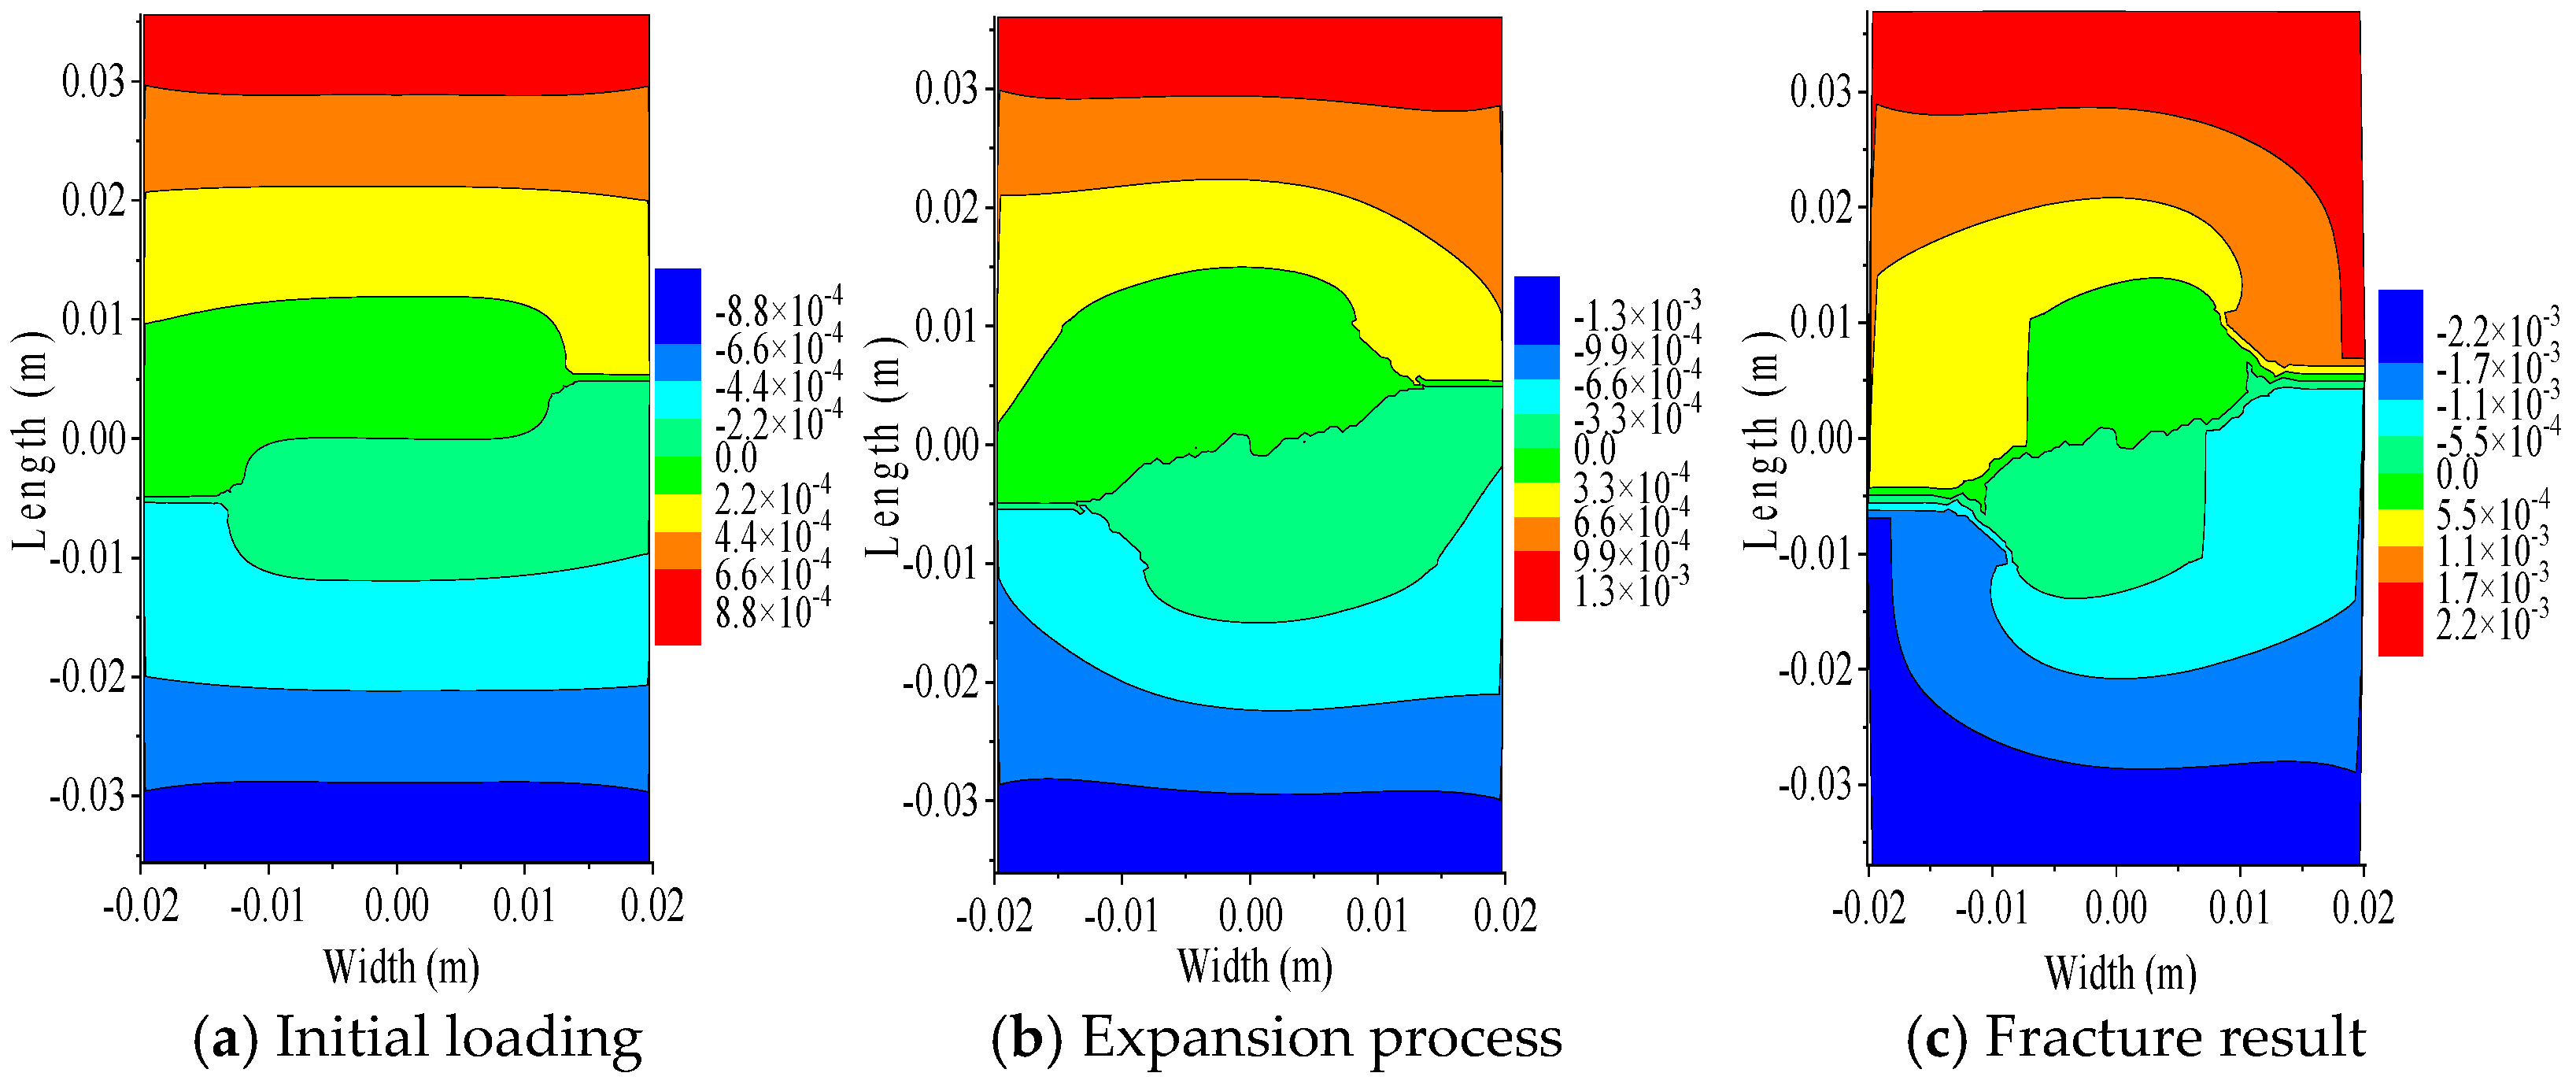
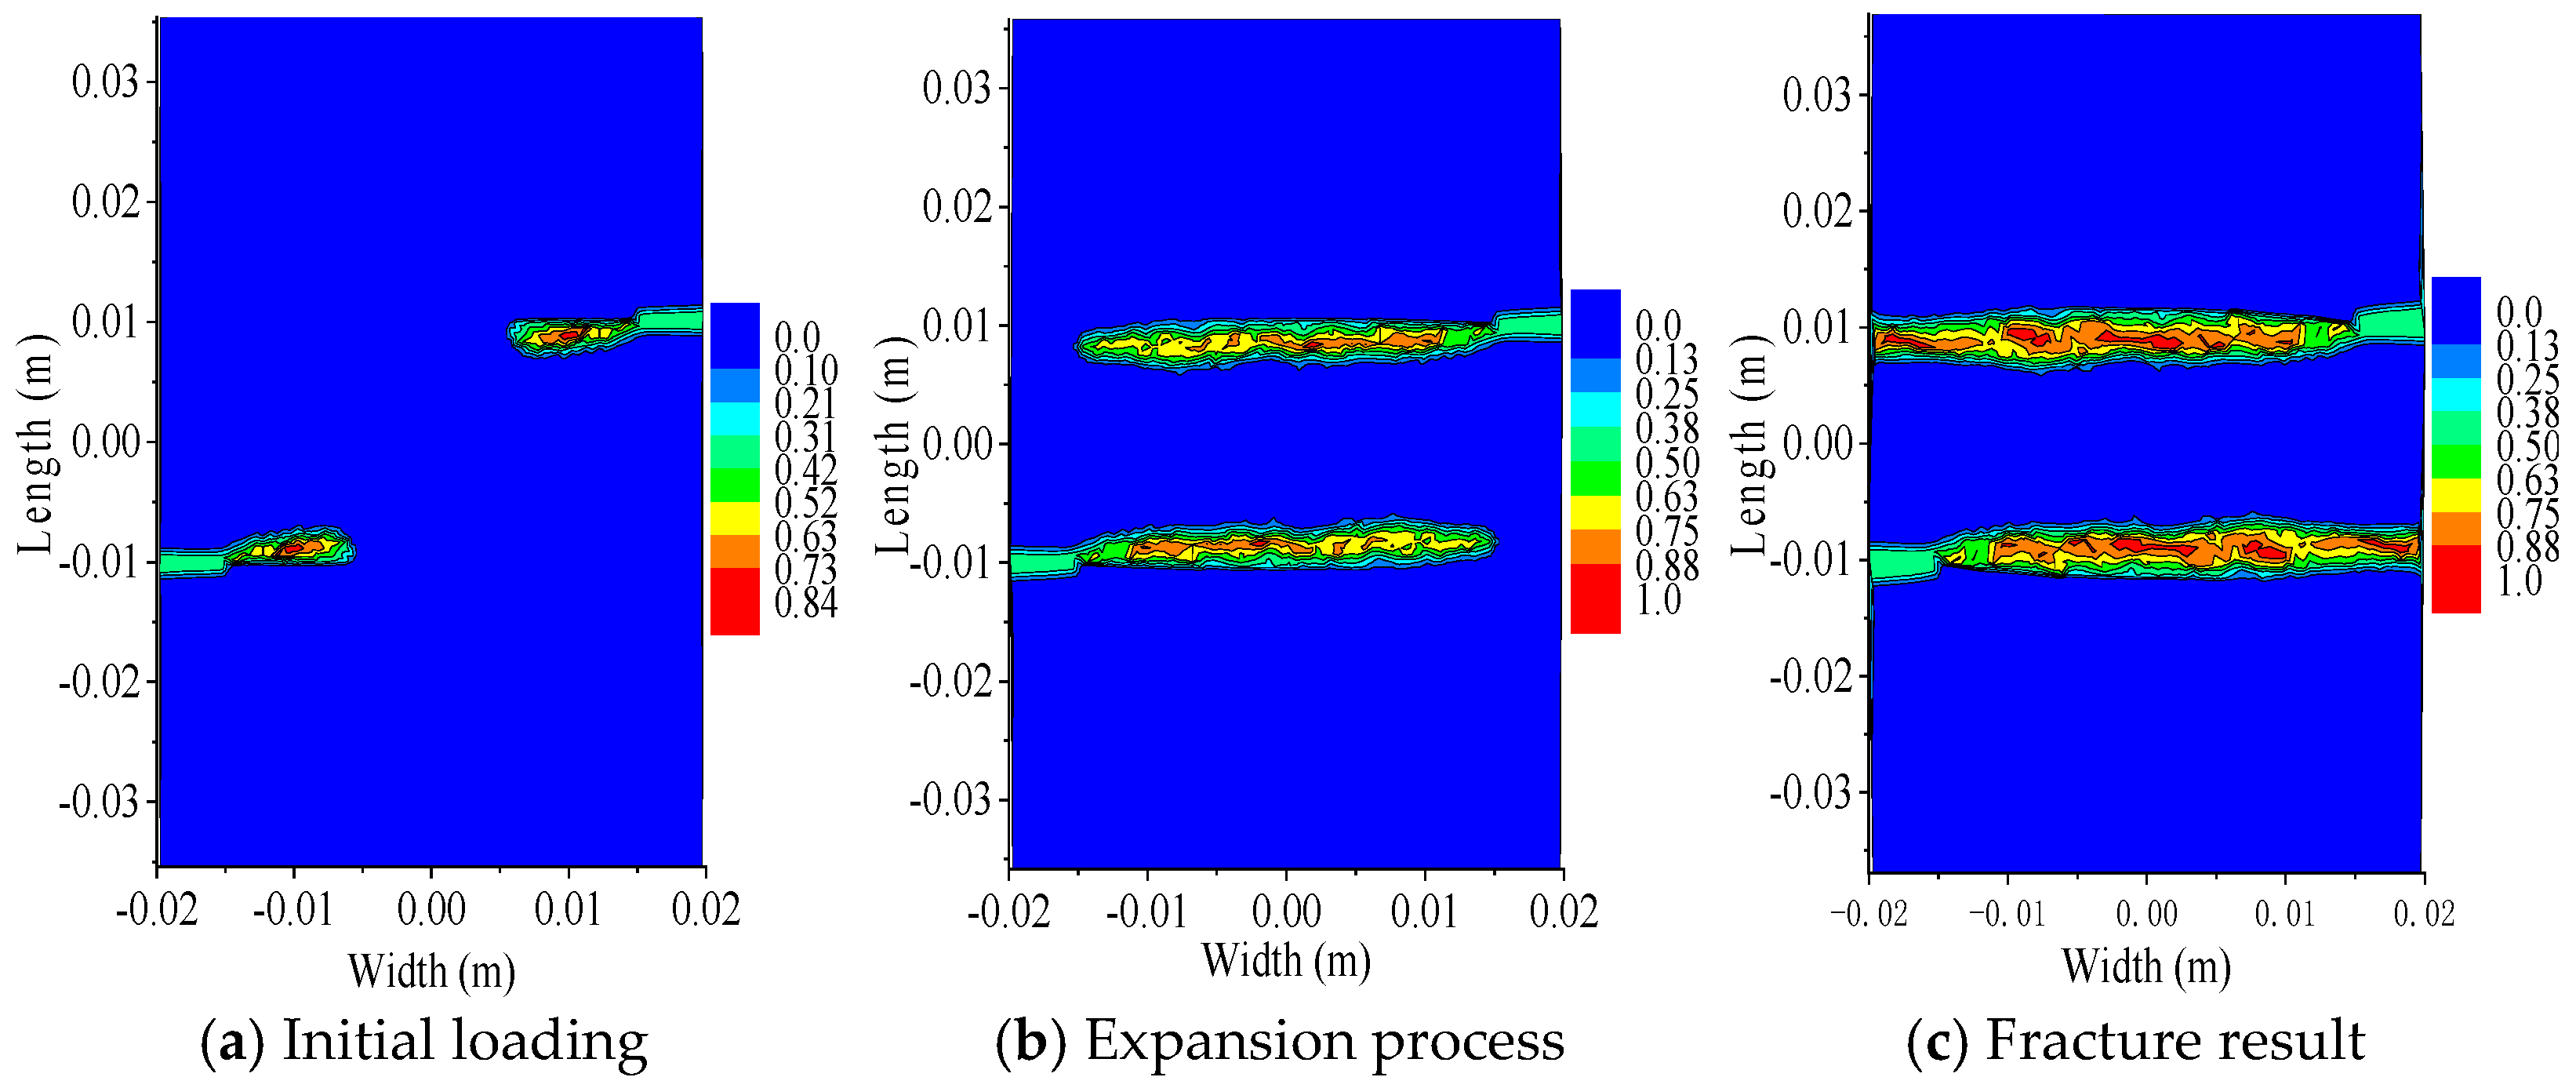
Figure 14 illustrates the complete process of damage evolution and crack propagation in the 3020X specimen, which has 5 mm bilateral cracks spaced 20 mm apart longitudinally under loading. As shown in Figure 14a, during the initial stage of crack growth, the crack tips show a slight tendency to approach and merge. With increasing loading time, as depicted in Figure 14b, the cracks extend further in the horizontal direction, resulting in two parallel horizontal fractures. Finally, as presented in Figure 14c, both cracks fully penetrate the specimen, leading to its separation into three distinct segments.
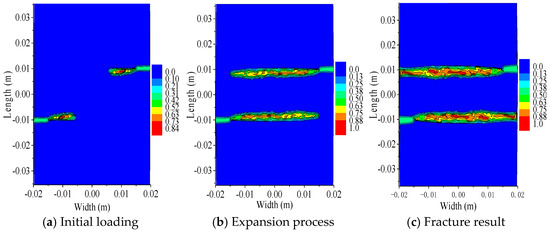
Figure 14.
Damage and crack propagation of 3020X specimen.
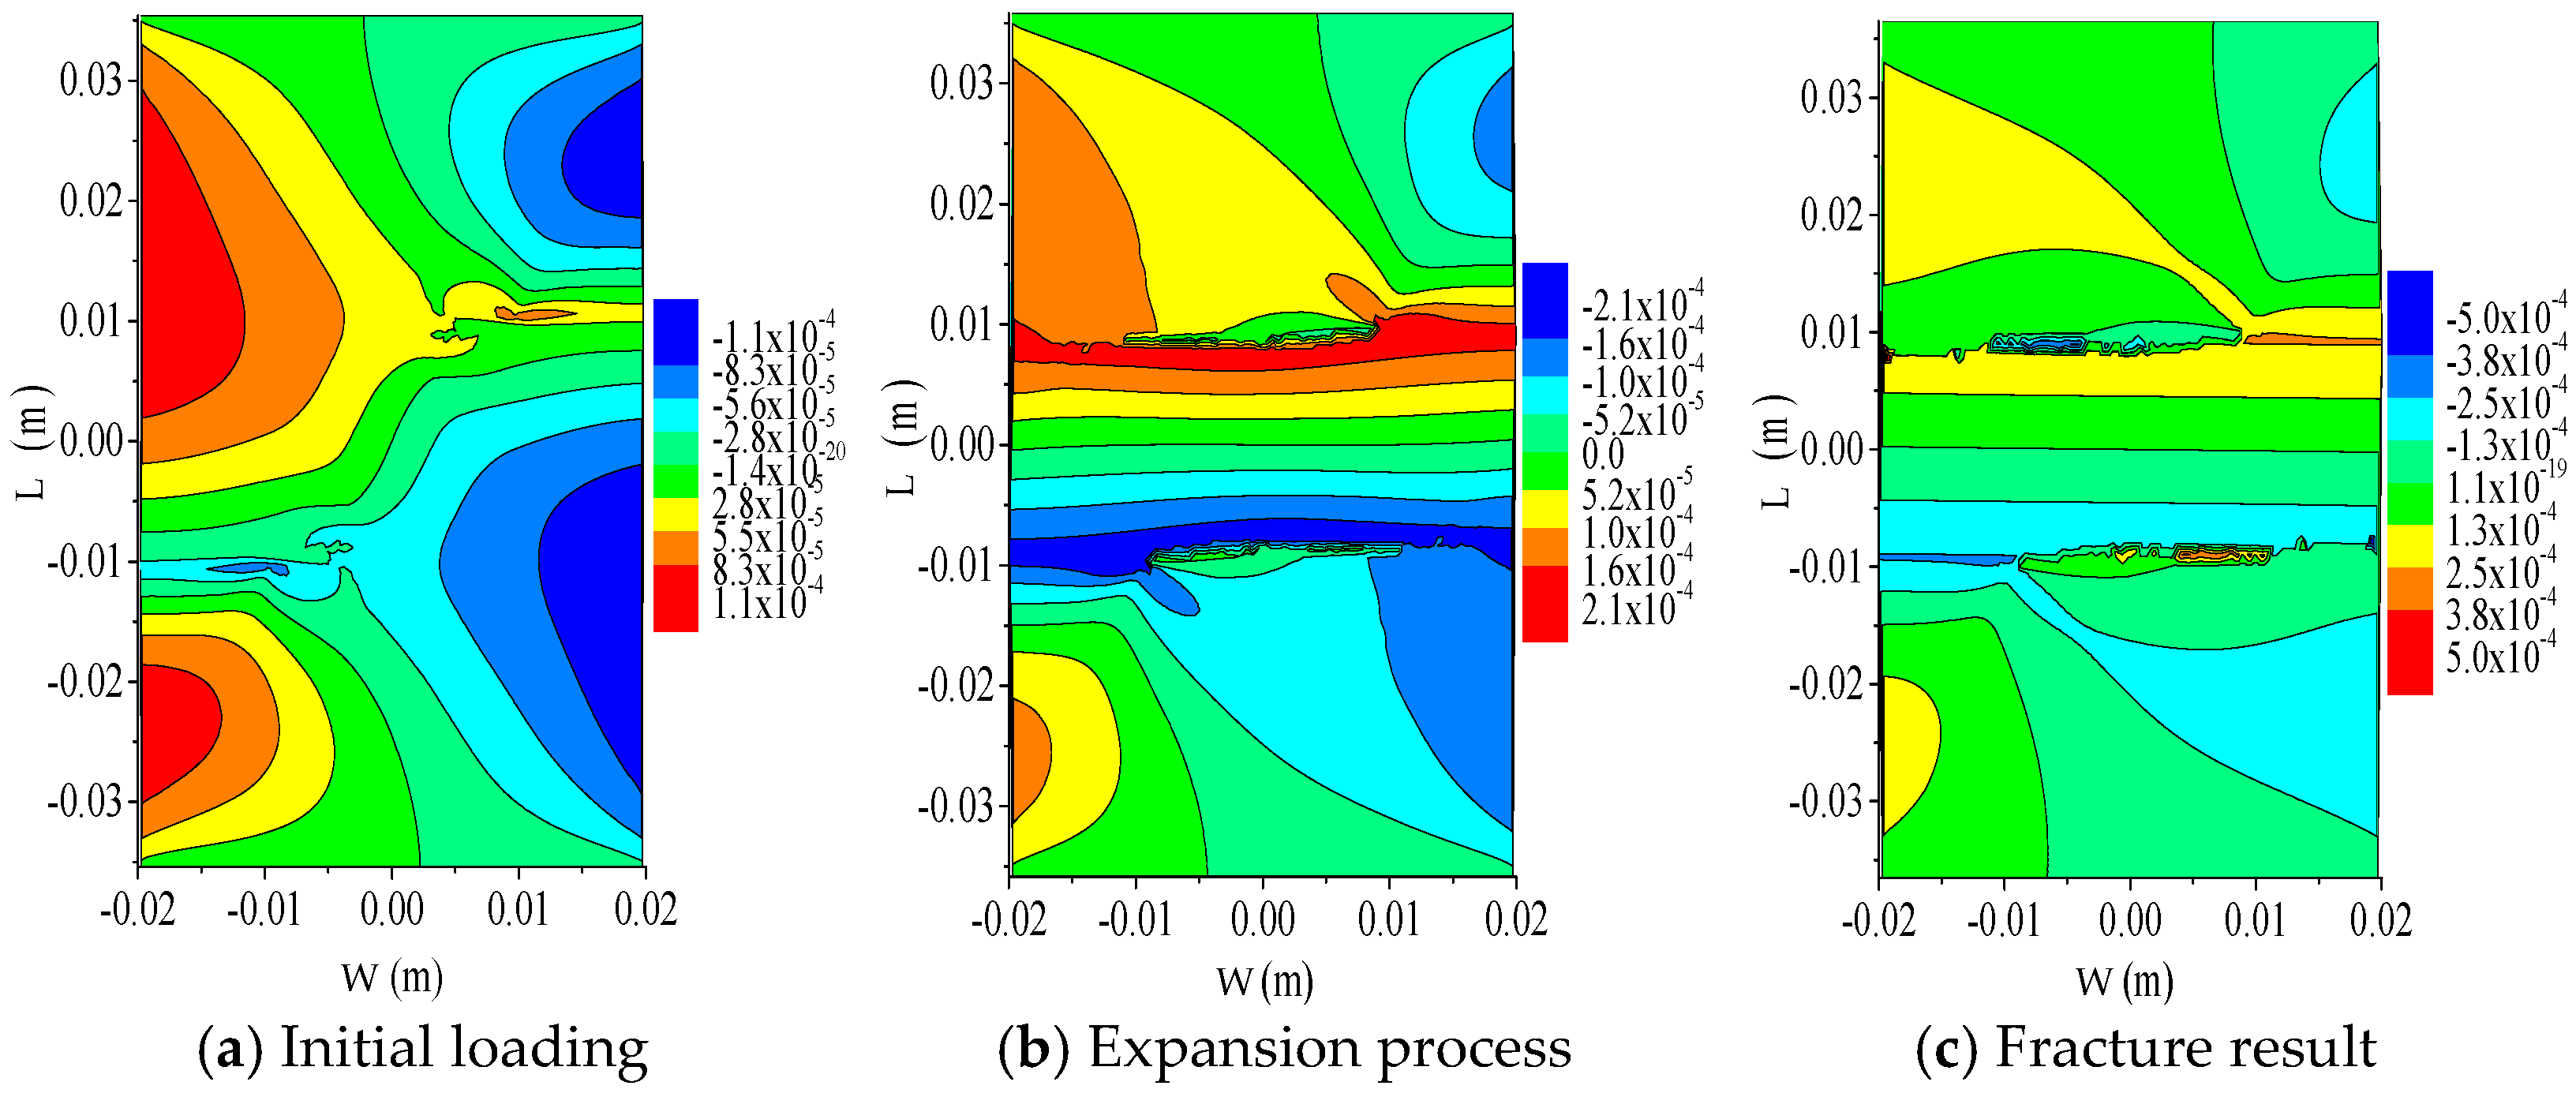
Figure 15 shows the X-direction displacement of the 3020X specimen under load. At initial loading, displacements at the cracked edges decrease gradually toward the Y-axis. Maximum displacement regions are larger in the uncracked areas and smaller near the cracks. The distribution is inclined and symmetric about the specimen center, as shown in Figure 15a. With the application of load, the maximum displacement region in the X-direction gradually extended horizontally along the crack propagation zone of the specimen and progressively decreased in magnitude, as shown in Figure 15b. When the crack fully propagates across the specimen, X-direction displacement of PD particles becomes negligible throughout, as shown in Figure 15c.
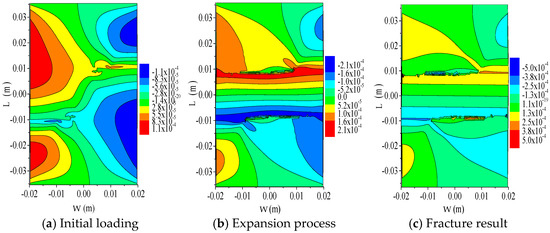
Figure 15.
Change rule of 30120X specimen particles’ displacement in X direction.
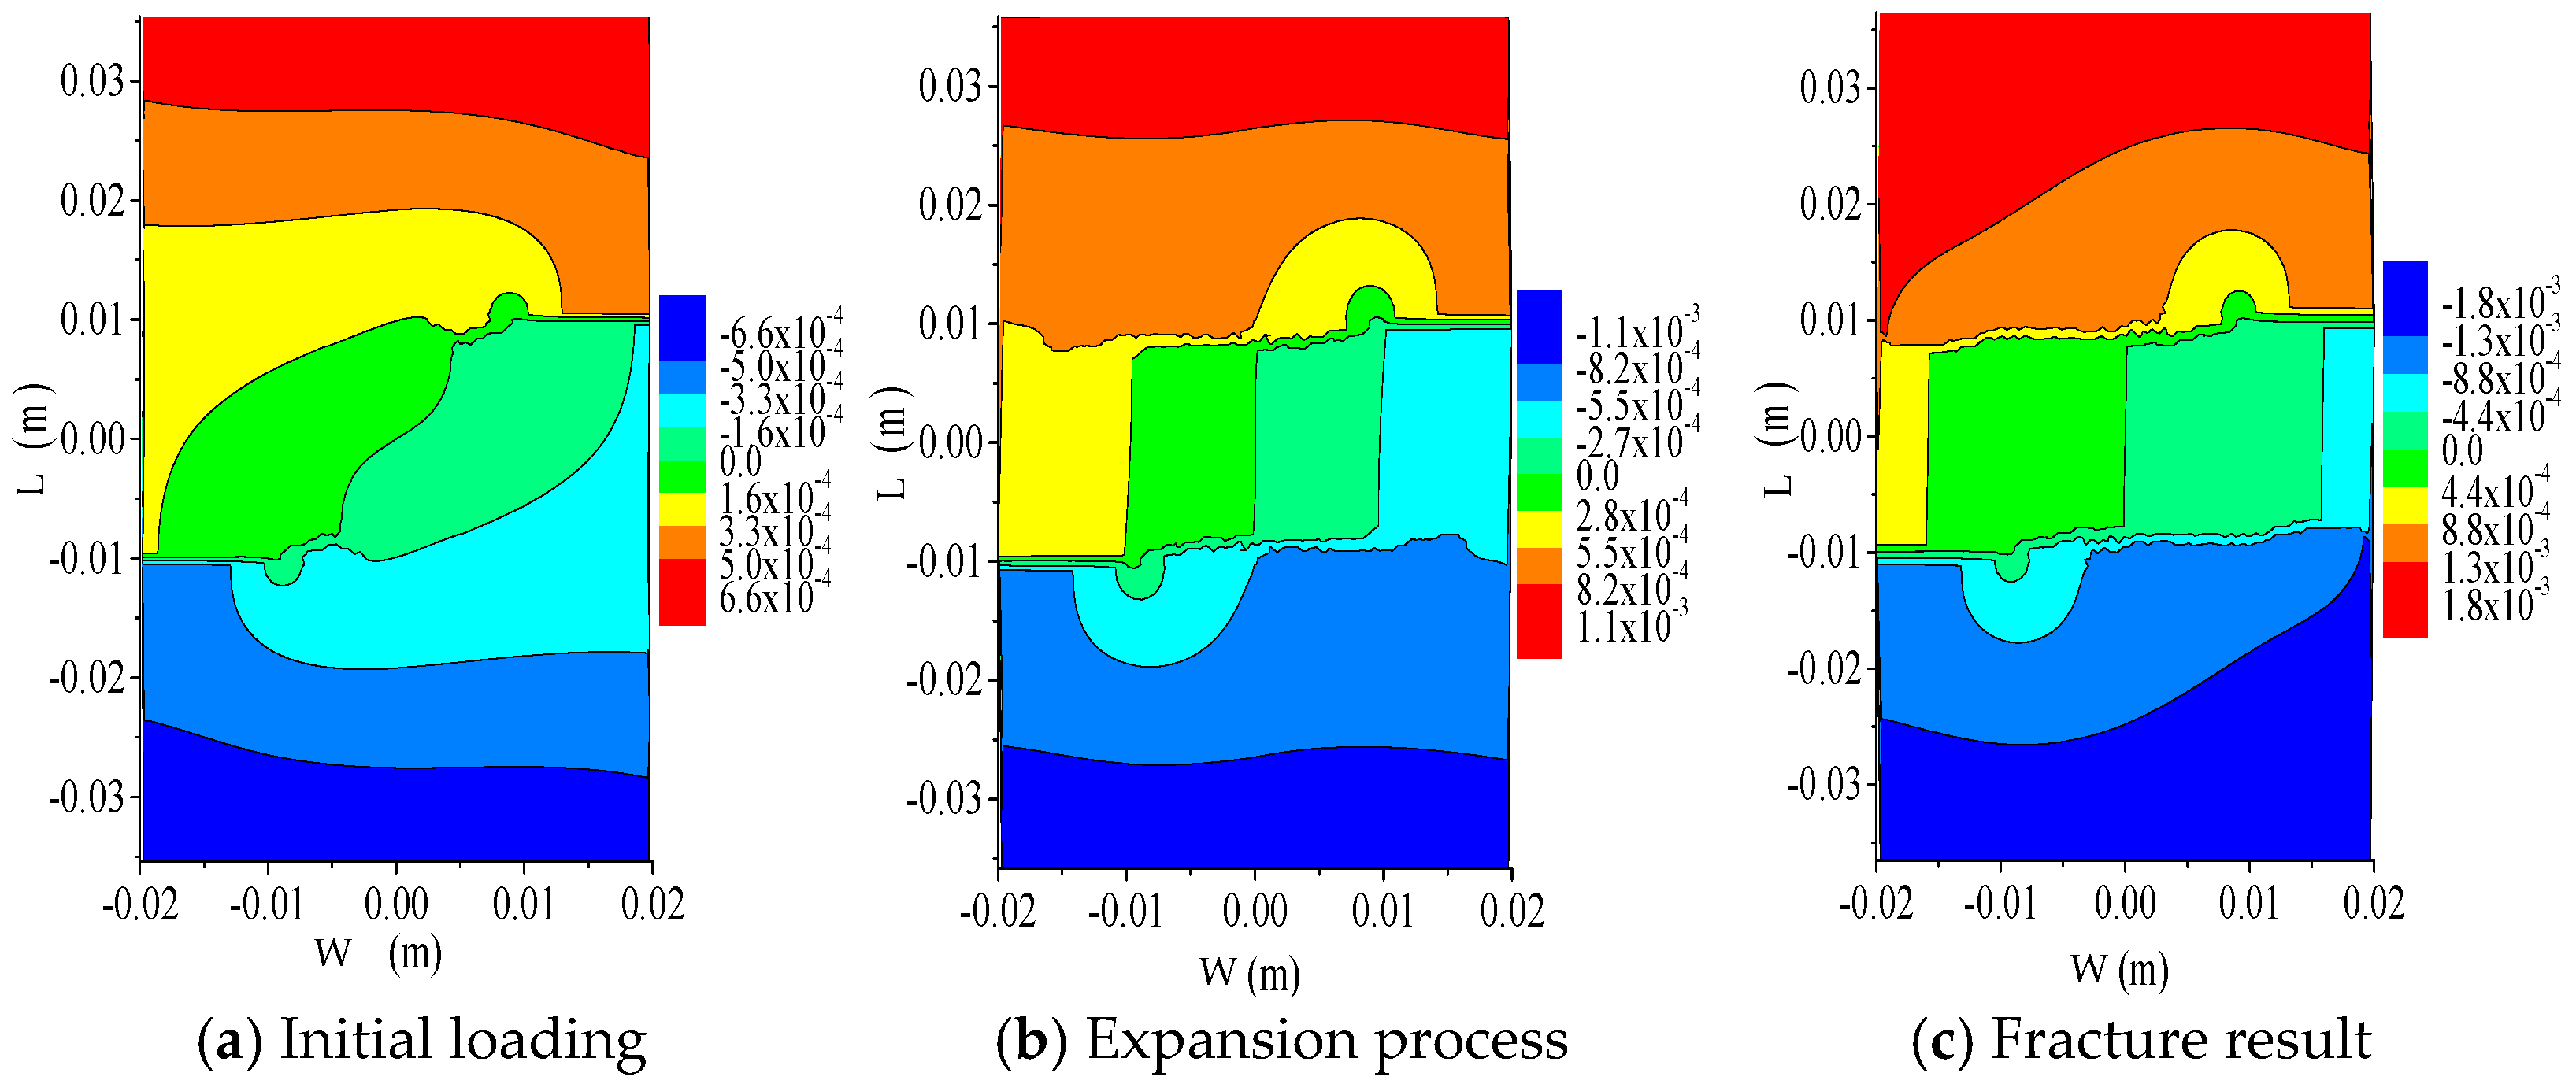
Figure 16 shows the Y-direction displacement of PD particles during crack propagation in the 3020X specimen. Due to the 20 mm longitudinal spacing between the two cracks, they do not influence each other, and the Y-direction displacement in the central region between the cracks remains at 0 mm. The area with zero Y-direction displacement progressively expands as the cracks propagate. When both cracks fully traverse the width of the specimen, PD particles exhibiting zero displacement in the Y-direction extend across the entire width direction of the specimen.
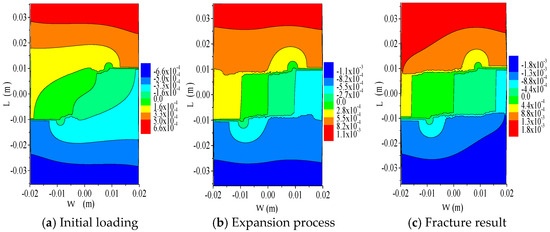
Figure 16.
Change rule of 3020X specimen particles’ displacement in Y direction.
3.2.2. Central Double-Crack Growth Analysis
Using PD theory, we establish a two-dimensional Q345 steel plate with length and width of 0.05 m and thickness of . The two central crack lengths are 2a = 0.01 m, and the longitudinal spacing is divided into 2 mm, 3 mm, and 4 mm, respectively. Specimen dimensions and quantities are listed in Table 2. A displacement load at is applied at both ends perpendicular to the vertical cracks to examine how crack center spacing affects crack propagation and PD particle displacements in the X and Y directions.

Table 2.
The size information of central double-crack specimens.
Specimen C02X
Figure 17 shows crack propagation in the C02X specimen with central double cracks spaced 2 mm apart longitudinally. Figure 17a illustrates that during the initial phase of loading, the two centrally located double cracks start to propagate linearly in opposite directions, exhibiting a tendency toward coalescence. Figure 17b shows that two centrally located double cracks propagate and coalesce into a horizontal crack, after which the crack tip extends along a straight line under the applied load. Figure 17c shows the crack penetrating through the whole specimen, dividing the specimen into two parts.

Figure 17.
Crack fusion and fracture results of C02X specimen.
Figure 18 illustrates the complete process of displacement evolution of PD particles in the X-direction for the C02X specimen during crack propagation. Figure 18a shows that during the initial phase of crack propagation, the maximum displacement variation in the X-direction on the left and right sides of the specimen extends across both edges and gradually diminishes toward the Y-axis. Figure 18b shows that as loading progresses and cracks propagate, the maximum x-direction displacement decreases progressively across the width, resulting in a well-defined triangular distribution zone. Figure 18c further reveals that upon complete crack traversal through the specimen, X-direction displacements at the upper and lower edges approach zero, while peak displacements on the left and right sides remain localized near the crack tips.

Figure 18.
Displacement distribution of C302X specimen in X direction.
Figure 19 shows the Y-direction displacement evolution in the C02X specimen during crack propagation. As shown in Figure 19a, at initial loading, the maximum Y-direction displacement expands from both ends toward the center, while the 0 mm displacement region spans the full width. Figure 19b shows that as the central double cracks coalesce, the 0 mm region extends from the left and right edges toward the crack tips, and the area of maximum displacement grows continuously. Figure 19c shows that after full crack propagation, the specimen separates into two parts, with small Y-direction displacements only near the left and right cracks; elsewhere, displacements are close to 0 mm.

Figure 19.
Displacement distribution of C302X specimen in Y direction.
Specimen C03X
Figure 20 shows the C03X specimen with double cracks spaced 3 mm apart longitudinally. It illustrates the entire crack propagation process during loading. As shown in Figure 20a, the crack tips at the top and bottom of the specimen start to exhibit indications of merging during the early stage of loading. As shown in Figure 20b, the crack propagation paths of the C03X specimen are consistent with those of the C02X specimen. The cracks initially extend a short distance along a straight line, followed by coalescence into a horizontal crack. With the continuous application of load, the horizontal crack after fusion continued to expand until it penetrated the entire width direction of the specimen, and the specimen is divided into two parts, as shown in Figure 20c.

Figure 20.
Crack fusion and fracture results of C03X specimen.
Figure 21 shows the X-direction displacement evolution of the C03X specimen under load. It captures the entire crack propagation process. During the initial phase, the displacement behavior of the C03X specimen is nearly identical to that of the C02X specimen. The maximum displacement occurs along the left and right edges over the full length of the specimen. As the load increases, the region of maximum X-direction displacement progressively narrows along the length of the specimen, decreasing gradually from the plate’s lateral edges toward the crack tip. The distribution range is similar to a triangle, as shown in Figure 21b. When the crack fully crosses the specimen width, X-displacement at the upper and lower ends approaches 0 mm. The maximum X-displacements along the length are localized near the crack tips on the left and right sides. This distribution is shown in Figure 21c.

Figure 21.
Displacement distribution of C303X specimen in X direction.
Figure 22 shows the full evolution of Y-direction displacement in the C03X specimen under load. At initial loading, displacement spreads inward along the length across the full width, increasing steadily. As cracks propagate, the maximum displacement zone expands from the upper and lower ends toward the center. When the crack fully penetrates the specimen, Y-displacement across the entire specimen approaches 0 mm. This final state is shown in Figure 22c.

Figure 22.
Displacement distribution of C303X specimen in Y direction.
Specimen C04X
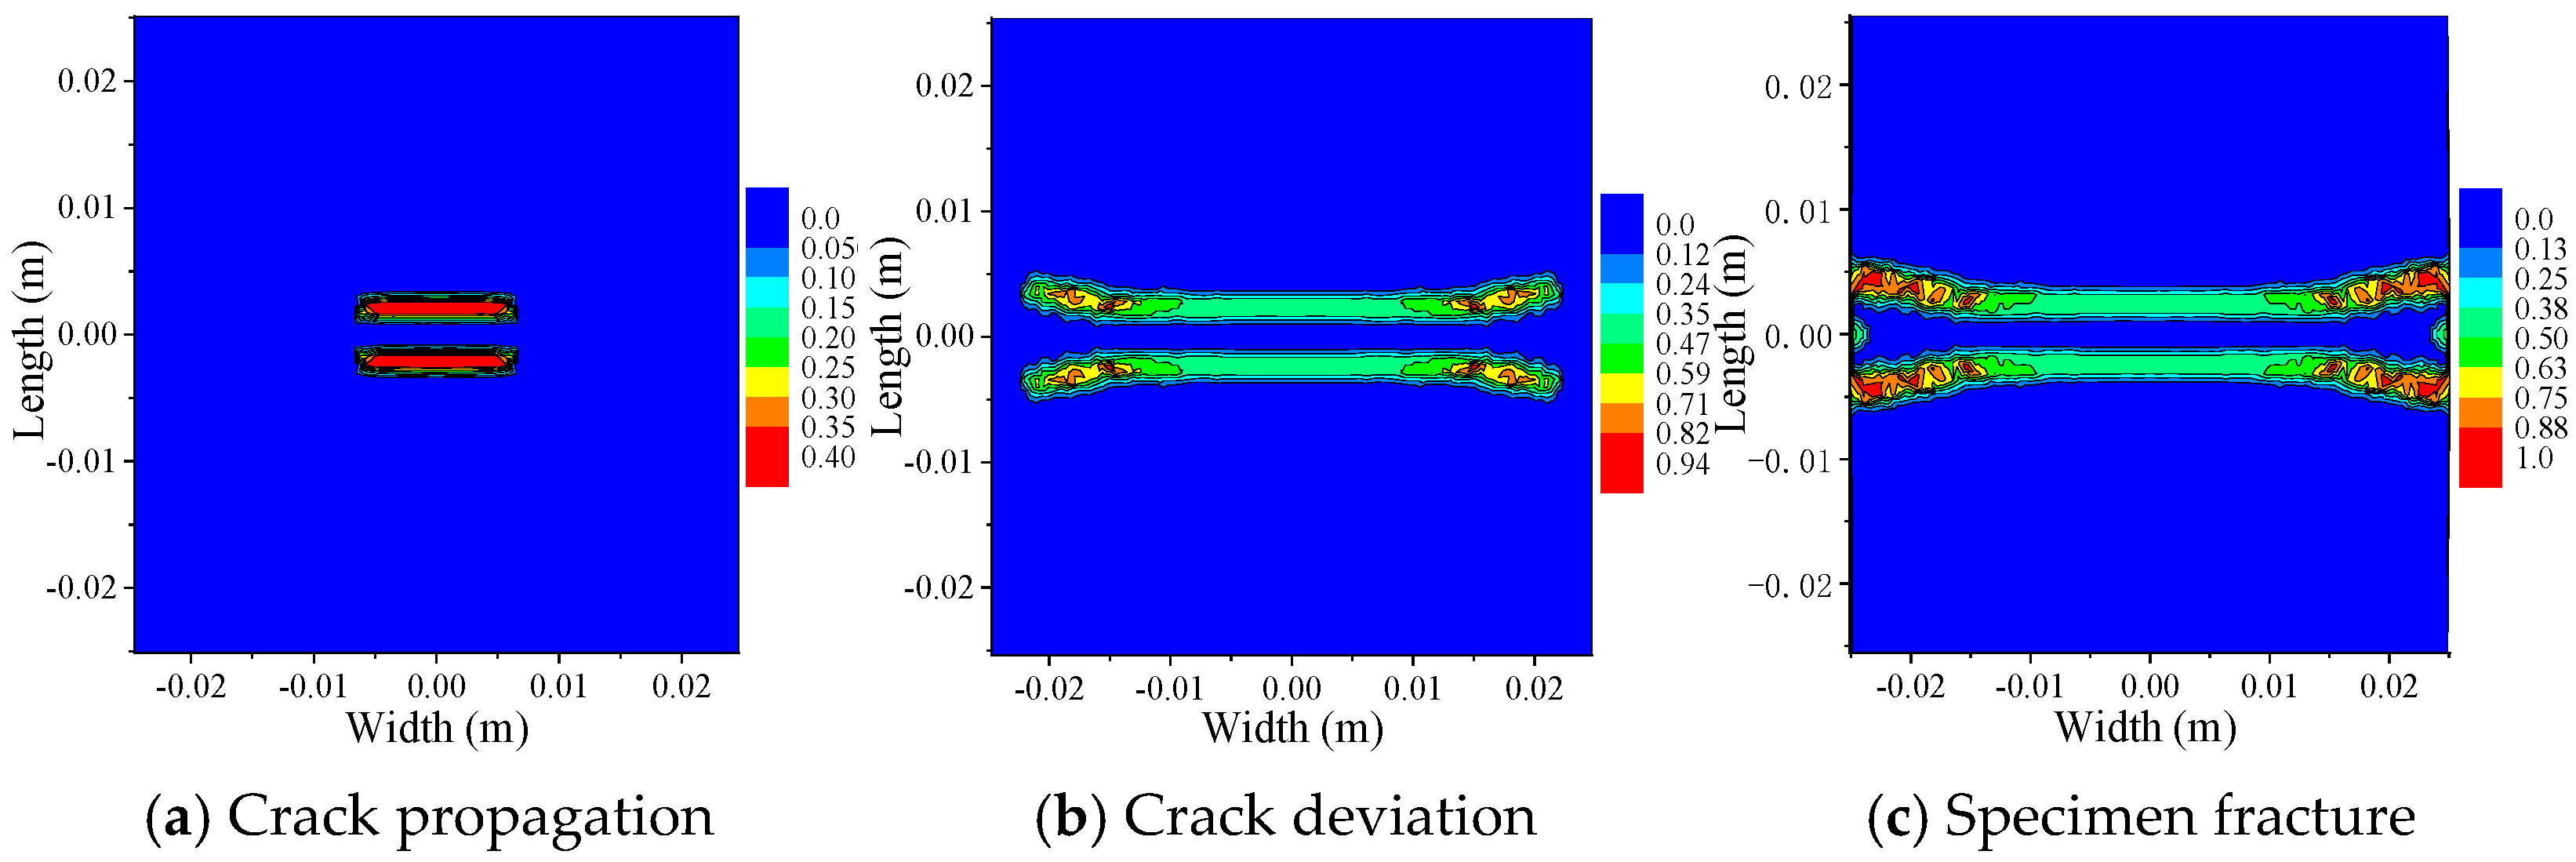
Figure 23 presents the C04X specimen containing a central double crack with a longitudinal spacing of 4 mm and a crack length of 10 mm, illustrating the entire process of structural damage and crack propagation under load. As shown in Figure 23a, during the initial loading phase, the tips of the two parallel cracks initially extend in the horizontal direction. The C04X specimen shows a distinct crack propagation path compared to C02X and C03X specimens. The double cracks propagate at a 15° deviation from the horizontal direction. As loading continues, the longitudinal distance between the two cracks increases. The cracks eventually penetrate the full width of the specimen. The specimen is finally divided into three parts, as shown in Figure 23c.
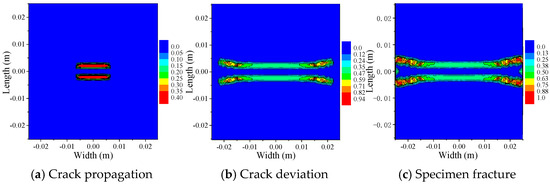
Figure 23.
Crack deviation and fracture results of C04X specimen.
Figure 24 shows the X-direction displacement evolution in the C04X specimen under load. At the initial stage, displacement behavior matches that of C02X and C03X specimens, with maximum displacement along the left and right edges over the full length. The maximum displacement gradually decreases in the Y-direction. As loading progresses, the extent of high displacement along the length reduces. When the crack fully traverses the specimen, X-displacement at the upper and lower ends approaches 0 mm, while peak displacements on the left and right sides are localized near the crack tips, as shown in Figure 24c.

Figure 24.
Displacement distribution of C304X specimen in X direction.
Figure 25 shows the full development of Y-direction displacement distribution in the C04X specimen during crack propagation. At initial loading, maximum Y-displacement is distributed along the width at both ends. The displacement decreases from these regions toward the X-axis. The range of maximum Y-displacement continuously expands. This evolution is illustrated in Figure 25a,b. As the load was applied, the cracks continued to propagate, and the region of maximum Y-direction displacement gradually extended from the upper and lower ends of the specimen toward its central portion. However, once the crack fully traversed the specimen, the Y-direction displacement at the top and bottom edges approached 0 mm, as illustrated in Figure 25c.

Figure 25.
Displacement distribution of C304X specimen in Y direction.
3.3. PD-COD Crack Propagation Analysis
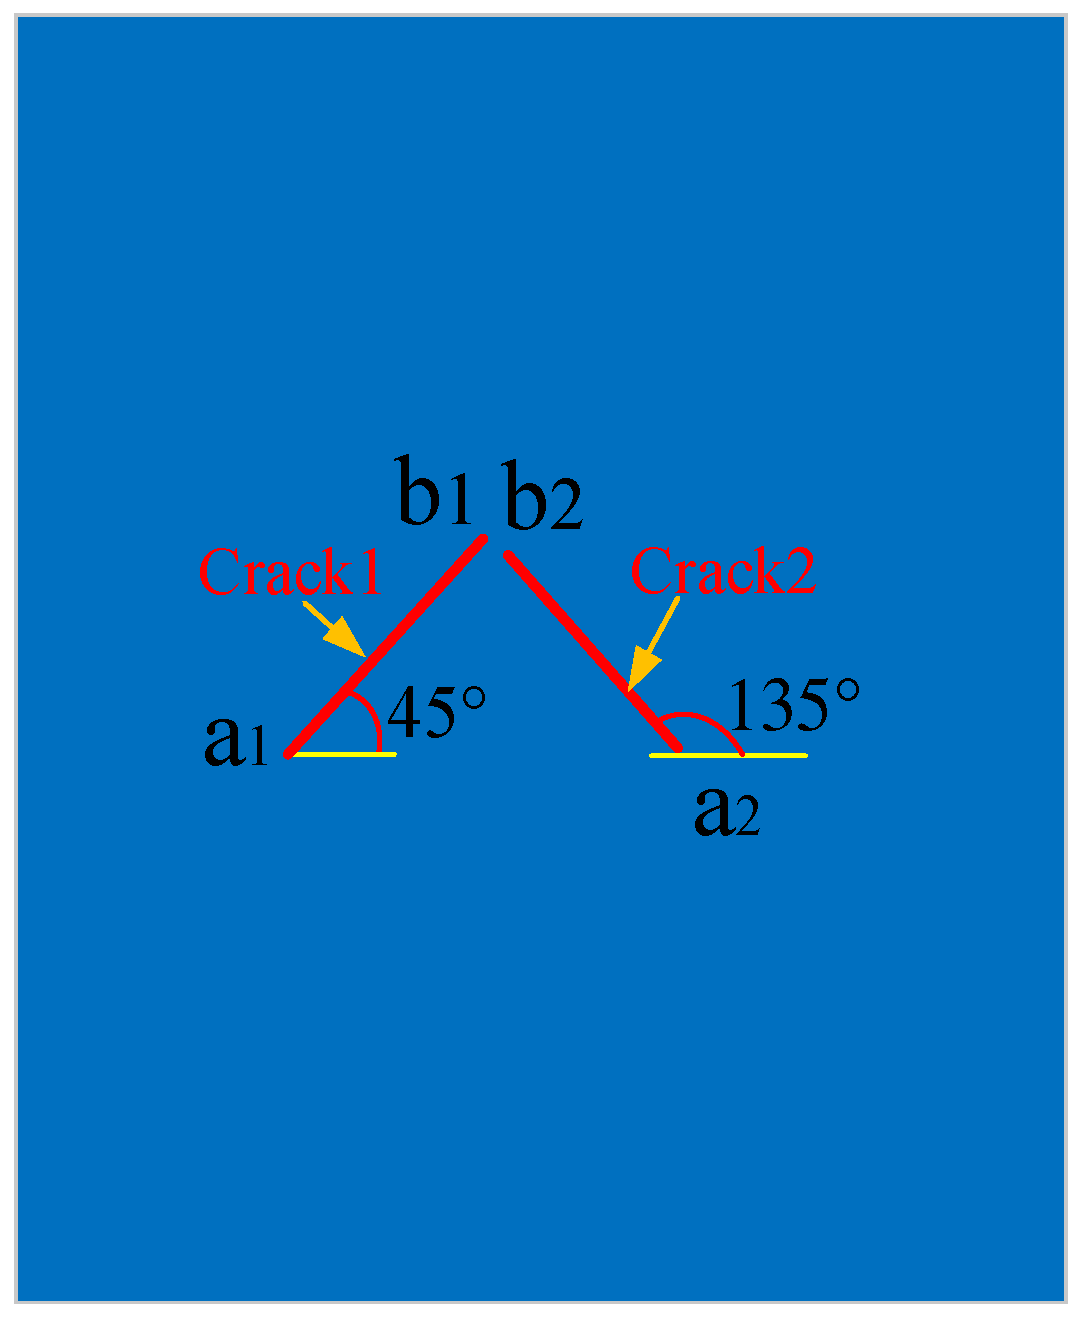
Q345 steel was used to establish two cross/center oblique crack specimens; the length was 70 mm, the width was 60 mm, the crack length was 10 mm and the tilt angles were 45° and 135°. The specimen number was CX001, as shown in Figure 26. The CX001 specimen was discretized into PD particles. A displacement load of 2.0 × 10⁻⁵ m/s was applied to the upper and lower sections. The damage and crack propagation behavior was analyzed using PD damage and fracture criteria. The PD-COD criterion was also used for comparison. These methods helped evaluate the failure mechanisms.
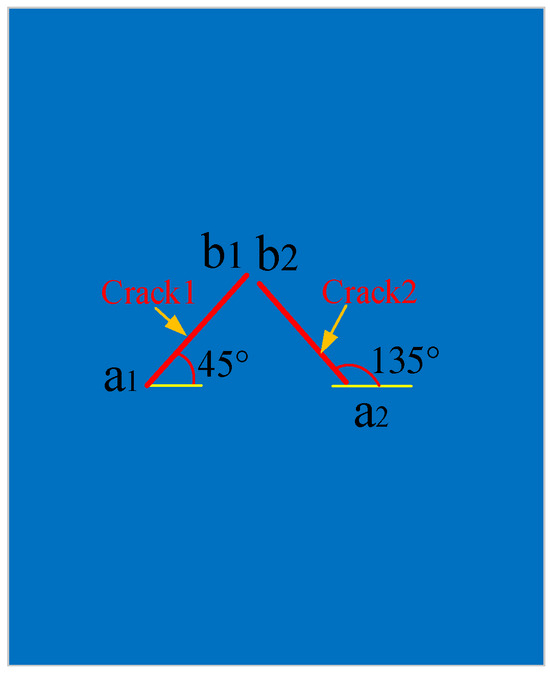
Figure 26.
CX001 specimen model with central cross oblique cracks.
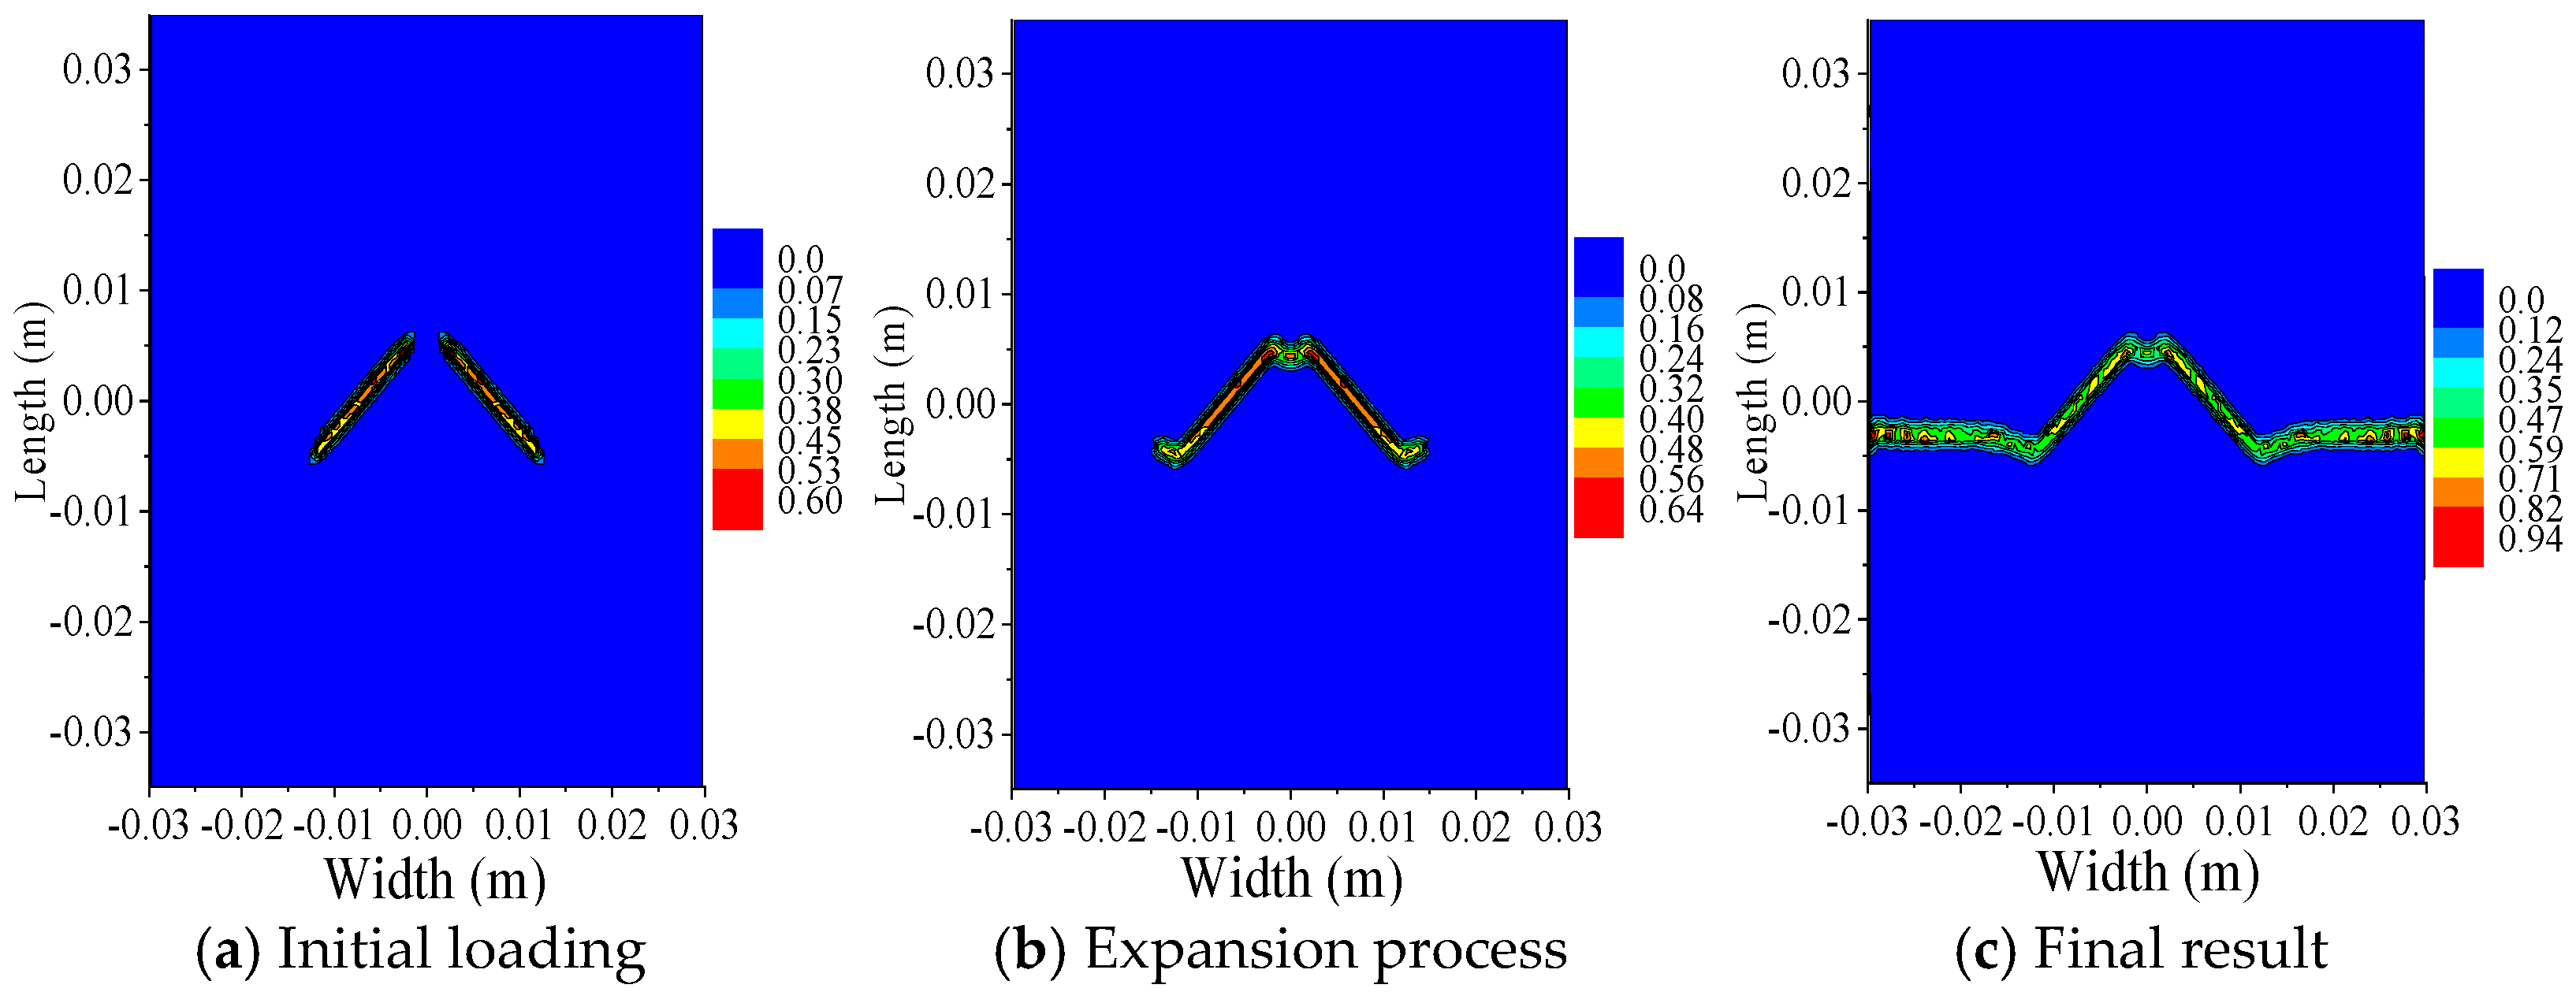
Figure 27 shows the whole process of cross oblique crack propagation simulated by PD elongation fracture criterion. At the initial stage of loading, both sides of the 45° and 135° oblique cracks propagated forward. When the load was applied, the b ends of the two inclined cracks coalesced, while the a ends extended further in the horizontal direction, as illustrated in Figure 27a,b. Finally, the b end of the two oblique cracks fused into a crack, and the a end of the two cracks formed a horizontal crack through the width direction of the specimen, as shown in Figure 27c.
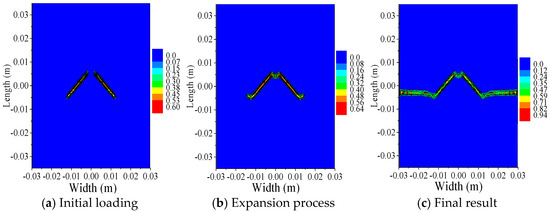
Figure 27.
Simulation results of CX001 specimen by PD.
Figure 28 presents the complete process of cross oblique crack propagation in the CX001 specimen, simulated using the PD-COD elongation fracture criterion. The comparison between Figure 27 and Figure 28 shows that the simulation results of the two fracture criteria are consistent. At the initial loading stage, the b end of the cross cracks fused, and the a end of the cracks propagated along the horizontal direction, but the damage value of the PD-COD analysis result was slightly higher than that of the PD theoretical analysis result, as shown in Figure 28a,b. With the continuous application of load, a horizontal crack propagation through the width direction of the specimen was eventually formed at the a end of the specimen’s crack. At this time, the damage values of the PD theoretical simulation results and the PD-COD simulation results are basically the same, as shown in Figure 27c and Figure 28c.

Figure 28.
Simulation results of CX001 specimen by PD-COD.
4. Conclusions
In this paper, bilateral crack specimens and central double-crack specimens with different longitudinal spacing are established by experiments and PD theory, and crack propagation and PD particle displacement are analyzed under load. Finally, the PD theory is integrated with COD, and the D-M model is employed to convert the elastic–plastic problem at the crack tip into an equivalent elastic problem, leading to the proposal of the PD-COD damage fracture criterion. The correctness of the PD-COD criterion is verified by PD theory with a central cross crack test, and we obtain the law of central cross crack damage and crack growth.
- (1)
- The analysis results of bilateral crack specimens with longitudinal spacings of 0 mm, 10 mm, and 20 mm and a crack length of 5 mm show that when the longitudinal crack spacing is small, the crack growth path is significantly influenced by the spacing between the cracks; when the spacing between longitudinal cracks is sufficiently large, crack propagation remains unaffected by the crack spacing. At the onset of loading, the highest X-direction displacement values appeared on the left and right edges of the specimens, displaying an inclined symmetric pattern with respect to the specimen’s central axis. The Y-direction displacement at the upper and lower ends of the specimens was the highest. Both X- and Y-direction displacements decreased toward the center. The displacement distribution shows a symmetric pattern from the ends to the center.
- (2)
- The results obtained from analyzing the centrally located double-crack specimens with different longitudinal spacing and crack length of 10 mm show that when the longitudinal spacing is small, the two center double-crack tips first propagate a certain distance along the horizontal direction and then fuse into a horizontal crack and continue to propagate through the width direction of the specimen; when the longitudinal spacing is large, the two cracks propagate horizontally without mutual interference; after the two horizontal cracks extend a certain distance, their tips gradually diverge at a 15° angle in the opposite horizontal direction and eventually penetrate the whole specimen. The maximum X-direction displacement decreases from the left and right sides toward the Y-axis. The maximum Y-direction displacement decreases from the upper and lower regions toward the X-axis. The displacement distribution is symmetric relative to the center. Both directions show a gradient reduction from the edges inward.
- (3)
- Under the action of load, the b end of the central cross cracks first fused, and the a end of the cross cracks propagated along the direction of vertical load and penetrated the specimen. As can be observed from the damage values of the specimen during crack propagation, the damage value obtained from PD-COD analysis is slightly higher than that from PD theoretical analysis in the initial stage. When the crack permeates the specimen, the results of PD theory are basically consistent with those of PD-COD analysis. The comparison results show that the accuracy of the analysis results of PD-COD damage fracture criteria meets the requirements.
Author Contributions
Data curation, J.Z., G.Z., S.Z. and L.Y.; formal analysis, J.Z.; investigation, L.Y. and J.X.; resources, X.H.; validation, G.Z.; writing—original draft, J.Z.; writing—review and editing, J.X. All authors have read and agreed to the published version of the manuscript.
Funding
This article was supported by the Jiangsu Funding Program for Excellent Postdoctoral Talent in 2024, No. 2024ZB602; the Undergraduate Training Program for Innovation and Entrepreneurship, No. 202510294041; and the Zhejiang Province 2024 Construction Scientific Research Project, fund number 2024K302; and the National Natural Science Foundation of China, No. 52278160.
Institutional Review Board Statement
Not applicable.
Informed Consent Statement
Informed consent was obtained from all subjects involved in the study.
Data Availability Statement
The original contributions presented in this study are included in the article. Further inquiries can be directed to the corresponding authors.
Conflicts of Interest
Authors Lingpeng Ye was employed by The Architectural Design & Research Institute of Zhejiang University Co., Ltd. Author Xinzhan Hu was employed by the company Zhejiang Jiangnan Project Management Co., Ltd. The remaining authors declare that the research was conducted in the absence of any commercial or financial relationships that could be construed as a potential conflict of interest.
References
- Xiao, J.; Huang, L.; Weng, R.; Murong, Y.; Liu, L.; Zeng, H.; Jiang, H. Mechanism of chloride ion transport and associated damage in ultra-high-performance concrete subjected to hydrostatic pressure. J. Build. Eng. 2025, 112, 113700. [Google Scholar] [CrossRef]
- Weng, R.; He, Z.; Liu, J.; Lei, B.; Huang, L.; Xu, J.; Liu, L.; Xiao, J. Shear Performance of UHPC-NC Composite Structure Interface Treated with Retarder: Quantification by Fractal Dimension and Optimization of Process Parameters. Buildings 2025, 15, 2591. [Google Scholar] [CrossRef]
- Shao, H.; Shen, D.; Kang, J.; Liu, C.; Wen, C. Tensile Creep and Cracking Resistance of High-Strength Concrete with Shrinkage Reducing Admixture under Uniaxial Restrained Condition at Early Age. J. Mater. Civ. Eng. 2024, 36, 04024226. [Google Scholar] [CrossRef]
- Shi, Y.D.; Shen, H.Y.; Tan, H.M.; Ding, Y.; Li, Z.X. Research on Failure Mode Identification of High-Rise Steel Frame Structure and its Uniform Damage Pattern Control. Eng. Mech. 2025, 42, 46–59. [Google Scholar]
- Huang, X.; Zhao, J. Comparison of Different Fracture Models for Fracture Failure Prediction of Steel Structures. J. Archit. Civ. Eng. 2018, 35, 93–101. [Google Scholar]
- Wu, J. On the Unified Phase-field Theory for Damage and Failure in Solids and Structures: Theoretical and Numerical Aspects. Chin. J. Theor. Appl. Mech. 2021, 53, 301–329. [Google Scholar]
- Li, B.; Wang, X.; Lang, S. Methods for Estimating Fatigue Life of Steel Structure with Variable Cross-section. Steel Struct. 2018, 33, 18–22. [Google Scholar]
- Sun, B. Simulation and Analysis Method of Failure Process of Engineering Structures due to Trans-Scale Damage Evolution. Ph.D. Thesis, Southeast University, Nanjing, China, 2016. [Google Scholar]
- Li, Z. Micro-Mechanism Based Ansys of T-Stub Connections Failure Process Under Cyclic Loading. Ph.D. Thesis, Guangxi University, Nanning, China, 2016. [Google Scholar]
- Li, Z.; Liu, Z.; Ding, Y. Dynamic Responses and Failure Modes of Steel Structures Under Blast Loading. J. Build. Struct. 2008, 29, 106–111. [Google Scholar]
- Kulkarni, S.; Wang, X.; Tabarraei, A. Modeling the creep damage of P91 steel using peridynamics_IMECE2019 presentation. Mech. Solids Struct. Fluids 2019, 9, 11–14. [Google Scholar]
- Amani, J.; Oterkus, E.; Rabczuk, T.; Areias, P.; Zi, G.; Nguyen-Thoi, T. A non-ordinary state-based peridynamics formulation for thermoplastic fracture. Intenational J. Impact Eng. 2016, 87, 83–94. [Google Scholar] [CrossRef]
- Diyaroglu, C.; Oterkus, E.; Rabczuk, T.; Madenci, E.; Siddiq, A. Peridynamic modeling of composite laminates under explosive loading. Composite Structures 2016, 144, 14–23. [Google Scholar] [CrossRef]
- Li, Z.; Huang, D.; Rabczuk, T. Nonlocal anisotropic model for deformation and fracture using peridynamic operator method. Mech. Sci. 2024, 268, 109023. [Google Scholar] [CrossRef]
- Dorduncu, M.; Olmus, I.; Rabczuk, T. A peridynamic approach for modeling of two dimensional functionally graded plates. Compos. Struct. 2022, 279, 114743. [Google Scholar] [CrossRef]
- Dorduncu, M.; Kutlu, A.; Rabczuk, T.; Madenci, E. Nonlocal modeling of bi-material and modulus graded plates using peridynamic differential operator. Eng. Comput. 2022, 39, 893–909. [Google Scholar] [CrossRef]
- Bie, Y.; Ren, H.; Rabczuk, T.; Bui, T.Q.; Wei, Y. The fully coupled thermo-mechanical dual-horizon peridynamic correspondence damage model for homogeneous and heterogeneous materials. Comput. Methods Appl. Mech. Eng. 2024, 420, 116730. [Google Scholar] [CrossRef]
- Zhao, J.; Tang, H.; Xue, S. Analysis of the center parallel double-crack propagation with initial casting defects by peridynamics. J. Harbin Eng. Univ. 2018, 39, 1612–1616. [Google Scholar]
- Zhao, J.; Tang, H.; Xue, S. Peridynamics versus XFEM: A comparative study for quasistatic crack problems. Front. Struct. Civ. Eng. 2018, 12, 548–557. [Google Scholar] [CrossRef]
- Zhao, J.; Li, T.; Dou, X. Crack propagation with different radius local random damage based on peridynamic theory. Front. Struct. Civ. Eng. 2021, 15, 1238–1248. [Google Scholar] [CrossRef]
- Zhao, J.; Gao, H.; Guo, X. A numerical study of crack propagation with variable temperature in steel structures using peridynamic constitutive model. Int. J. Hydromechatronics 2021, 4, 116–141. [Google Scholar] [CrossRef]
- Zhao, J.; Sun, H.; Zhang, X. Damage and Crack Propagation Mechanism of Q345 Specimen Based on Peridynamics with Temperature and Bolt Holes. Buildings 2024, 14, 3220. [Google Scholar] [CrossRef]
- Sun, R.; Huang, D.; Chen, D.; Zhao, J. Research on casing failure mechanisms and countermeasures in hydraulic fracture of shale reservoirs considering dynamic evolution of fault slip. Eng. Fail. Anal. 2024, 161, 108301. [Google Scholar] [CrossRef]
- Zhao, J.; Sun, R.; He, D.; Ma, Q.; Huang, D. Analysis of compressive failure mechanism of concrete and grouting cubes by Peridynamics. Theor. Appl. Fract. Mech. 2024, 131, 104423. [Google Scholar] [CrossRef]
- Ran, X.; Qian, S.R.; Zhou, J.; Xu, Z. Crack propagation analysis of hydrogen embrittlement based on peridynamics. Int. J. Hydrogen Energy 2022, 47, 9045–9057. [Google Scholar] [CrossRef]
- Karim, M.R.; Kadau, K.; Narasimhachary, S.; Radaelli, F.; Amann, C.; Dayal, K.; Silling, S.; Germann, T.C. Crack nucleation at forging flaws studied by non-local peridynamics simulations. Math. Mech. Solids 2022, 27, 1129–1149. [Google Scholar] [CrossRef]
- Abdoh, D. Failure analysis of bolted steel plate connections with three-dimensional flexibilities. Int. J. Mech. Sci. 2024, 272, 109313. [Google Scholar] [CrossRef]
- Ahmadi, M.; Sadighi, M.; Toudeshky, H. Computational microstructural model of ordinary state-based Peridynamic theory for damage mechanisms, void nucleation, and propagation in DP600 steel. Eng. Fract. Mech. 2021, 247, 107660. [Google Scholar] [CrossRef]
- Jafarzadeh, S. Novel and Fast Peridynamic Models for Material Degradation and Failure. Ph.D. Thesis, The University of Nebraska Lincoln, Lincoln, NE, USA, 2023. [Google Scholar]
- Mossaibya, F.; Häfner, G.; Shojaei, A.; Hermann, A.; Cyron, C.; Müller, M.; Silling, S. On efficient simulation of self-assembling diblock copolymers using a peridynamic-enhanced Fourier spectral method. Comput. Methods Appl. Mech. Eng. 2025, 439, 117878. [Google Scholar] [CrossRef]
- Le, M. Dual-horizon peridynamic study of the mode-I J-integral and crack opening displacement in single-edge notched beams. Mech. Adv. Mater. Struct. 2024, 33, 5478–5485. [Google Scholar] [CrossRef]
- Zhang, M.; Chen, S.; Ji, J.; Cui, K.; Tian, F.; Li, L. Mechanisms governing crack speed in peridynamic model. Eng. Fract. Mech. 2024, 305, 110201. [Google Scholar] [CrossRef]
- Zeng, S. Bilateral Crack Growth Behavior of Q345 Steel Under Uniaxial Thensile Load. Master’s Thesis, Guangxi University, Nanning, China, 2014. [Google Scholar]
Disclaimer/Publisher’s Note: The statements, opinions and data contained in all publications are solely those of the individual author(s) and contributor(s) and not of MDPI and/or the editor(s). MDPI and/or the editor(s) disclaim responsibility for any injury to people or property resulting from any ideas, methods, instructions or products referred to in the content. |
© 2025 by the authors. Licensee MDPI, Basel, Switzerland. This article is an open access article distributed under the terms and conditions of the Creative Commons Attribution (CC BY) license (https://creativecommons.org/licenses/by/4.0/).

