Article

Optimization of Gaussian Process Regression with Intelligent Algorithms for Predicting Compacted Density of Gravel-Soil Materials

1
College of Water Conservancy & Architeclural Engineering, Shihezi University, Shihezi 832003, China
2
Department of Water Resources of Xinjiang Uygur Autonomous Region, Urumqi 830000, China
3
China Institute of Water Resources and Hydropower Research, Beijing 100048, China
*
Authors to whom correspondence should be addressed.
Buildings 2025, 15(21), 3910; https://doi.org/10.3390/buildings15213910
Submission received: 22 September 2025 / Revised: 11 October 2025 / Accepted: 25 October 2025 / Published: 29 October 2025
(This article belongs to the Section Building Structures)

Abstract

To effectively control the deformation of high concrete face rockfill dams, this study proposes an intelligent prediction model (CO–SA–GPR) that integrates the Cheetah Optimizer (CO) and Simulated Annealing (SA) algorithm to optimize Gaussian Process Regression (GPR) for accurately estimating the compaction density of sandy gravel materials. Firstly, a theoretical derivation of the specification-similar gradation scaling method was conducted, clarifying the relationship between gradation parameters before and after scaling. On this basis, the CO and SA algorithms were employed to adaptively optimize the hyperparameters of the GPR model, obtaining the global optimal solution through intelligent search, thereby enhancing the model’s prediction accuracy and robustness. Application of the established model to actual engineering predictions shows that in estimating the maximum and minimum dry densities, the CO–SA–GPR model achieves R2 values as high as 0.9752 and 0.9741, with RMSE as low as 0.0022 and 0.0028, respectively, significantly outperforming comparative models. The proposed model enables accurate prediction of compaction density from laboratory scaled-down tests to prototype gradations, providing a reliable new method for quality control in high rockfill dam construction and offering important theoretical and technical reference values for similar coarse-grained soil engineering.

1. Introduction

Sandy gravel material, as a typical non-cohesive coarse-grained soil, holds significant importance in hydraulic engineering construction due to its notable advantages, including high shear strength, large deformation modulus, and strong adaptability to complex foundation conditions [1,2]. The Xinjiang region is rich in natural sandy gravel deposits. Characterized by typical alpine plateau geological features such as high altitude (average elevation > 3500 m), severe cold (mean annual temperature < 0 °C), deep riverbed overburden (thickness > 50 m), and high silt content (clay fraction 5–8%). These conditions make sandy gravel the primary fill material for concrete face rockfill dams (CFRDs) in the region. CFRDs have become the preferred dam type for major projects in this area due to advantages such as the utilization of local materials, simple structural form, high construction efficiency, and good economic performance [3]. Statistics show that [4,5]: among the constructed and under-construction high dams exceeding 100 m in height in Xinjiang, the majority use sandy gravel as the main fill material. Notable examples include the Kalabelli Water Conservancy Project CFRD (dam height 92.5 m), the Wuluwati Water Conservancy Project CFRD (dam height 138 m), the Nuer asphalt-core sandy gravel dam (dam height 80 m), the Dashimen asphalt-core sandy gravel dam (maximum dam height 128.8 m), the Aertashi concrete face sandy gravel dam (dam height 164.8 m, with deep overburden of 100 m), the Yulongkashi concrete face sandy gravel–rockfill dam (dam height 230.5 m), and the Dashixia concrete face sandy gravel dam (dam height 247 m).
Deformation control represents a critical technical challenge in the construction of high dams, with enhancing compaction density serving as the core measure for mitigating deformation. Compared to blasted rockfill materials, sandy gravel possesses a continuous gradation, where finer particles adequately fill the voids between coarser aggregates, resulting in a higher compression modulus and superior deformation resistance [6]. In practical engineering, the compaction quality of coarse-grained soils is typically evaluated using indicators such as porosity, dry density, or relative density. Among these, relative density is a key parameter for assessing the compaction effectiveness of sandy gravel dam materials. Its accurate determination relies on the precise measurement of maximum and minimum dry density [7]. Consequently, research on quantitative analysis methods for the compaction density of sandy gravel materials holds significant theoretical and engineering value for improving the construction quality of high dams.

1.1. Literature Review

With the rapid advancement in the construction of super-high rockfill dams, higher demands are imposed on the evaluation of compaction characteristics for dam-building sandy gravel materials. Traditional indoor tests require scaling down the particle grading of actual dam materials to determine the compaction density of gravelly soils. Existing research has shown that the maximum and minimum dry densities of sandy gravel exhibit a significant scale effect [8,9,10,11]. Test results often fail to accurately reflect the conditions of the actual field project. If the quality control of dam compaction continues to be based on the maximum and minimum dry densities determined by these conventional laboratory methods, it will adversely affect the assessment of the dam’s actual compaction quality.
In the research on the compaction density of coarse-grained soils, numerous scholars have conducted systematic work focusing on the influence of scaling methods on density test results. Weng Houyang et al. [12] compared the effects of four scaling methods on the strength and compaction indices through experiments on rockfill material from the Shuangjiangkou project. Fu Hua et al. [13] systematically analyzed the influence of the equivalent substitution method, the parallel gradation method, and the hybrid method on the physical and mechanical behavior of coarse-grained materials. Zhao Na et al. [14], based on fractal theory, revealed the coupling mechanism between particle fractal dimension and scaling methods on maximum dry density.
Regarding the relationship between gradation characteristics and dry density, Shi Yanwen and Feng Guanqing et al. [15,16] used the parallel gradation method to establish a semi-logarithmic linear model between maximum dry density and maximum particle size. Zuo Yongzhen et al. [17], through various scaled tests, proposed a multivariate correlation between maximum dry density and maximum particle size, coefficient of uniformity, and coefficient of curvature. Zhu Sheng et al. [10], from the perspective of fractal theory, demonstrated that extreme dry density is a multivariate function of particle shape, surface characteristics, and gradation fractal dimension. Zhu Jungao et al. [8] developed predictive models for dry density tailored to different scaling methods. Wu Erlu et al. [18,19] integrated the continuous gradation equation with the parallel gradation method to establish a functional relationship for maximum dry density based on gradation structure parameters, providing a new approach for the quantitative analysis of scale effects. Sukkarak et al. [20] developed a new dam deformation prediction method by considering the effect of scale on the density of rockfill materials; Shibuya et al. [21] investigated the influence of particle size distribution on compaction characteristics and deformation-strength properties through triaxial compression tests.
Although significant progress has been made in understanding the influence of gradation parameters and maximum particle size on the compaction density of gravelly soils, two critical issues remain unresolved. First, existing scaling methods maintain the same minimum particle size, leading to a “truncation” at the fine-grained end of the gradation curve, which introduces significant systematic errors [11]. Second, under the condition of the same area under the gradation curve, the impact of varying contents of particles finer than 5 mm (P5)—which significantly affect compaction density—is often overlooked. Therefore, when determining the compaction density of the prototype gradation, in addition to the maximum particle size and gradation parameters (Cu, Cc), it is essential to incorporate P5 and develop a predictive model that integrates P5 content with key gradation characteristic parameters. This will enable accurate extrapolation from laboratory test results to field compaction quality assessment of prototype materials, providing a scientific basis for guiding fill compaction quality control.

1.2. Contribution

Confronted with the challenges of complex regression modeling, such as small sample sizes, high dimensionality, and strong nonlinearity, traditional parametric methods (e.g., linear regression, polynomial regression) or certain non-parametric methods (e.g., K-Nearest Neighbors) often exhibit limitations [22]. In recent years, machine learning techniques, particularly neural networks, have been widely applied in predicting construction quality for earth-rock dam filling due to their strong capability in handling nonlinear problems, independence from predefined analytical functions, and good generalization performance. Examples include Radial Basis Function (RBF) neural networks [23], eXtreme Gradient Boosting (XGBoost) algorithm [24], and Elman neural networks [25]. However, although these models can approximate functions with arbitrary accuracy, they suffer from drawbacks such as complex model structures, susceptibility to local optima, and difficulties in hyperparameter tuning.
Gaussian Process Regression (GPR), a kernel-based machine learning method grounded in statistical learning and Bayesian theory, demonstrates significant advantages and strong adaptability in addressing such complex problems. Its unique non-parametric Bayesian framework and ability to model directly in function space have led to successful applications [26]. Nevertheless, the predictive performance of GPR is highly dependent on the selection of its hyperparameters. Current approaches for hyperparameter determination, such as experimental trial-and-error or empirical selection, are largely characterized by high randomness and a tendency to converge to local optima.
With the ongoing cross-disciplinary integration and convergence of fields, metaheuristic algorithms inspired by natural evolutionary principles have demonstrated significant application and development potential in recent years for optimizing individual algorithmic models. Commonly proposed intelligent optimization algorithms include the Genetic Algorithm, Particle Swarm Optimization, Ant Colony Optimization, Firefly Algorithm, Cuckoo Search, Artificial Bee Colony, Bacterial Foraging Optimization, and Artificial Fish Swarm Algorithm, among others. Integrating such intelligent optimization algorithms with Gaussian Process Regression (GPR) offers an effective strategy for optimizing GPR hyperparameters and has yielded promising results.
To this end, this paper introduces a hybrid approach combining a metaheuristic algorithm–the Cheetah Optimizer (CO)–and Simulated Annealing (SA) to adaptively optimize the hyperparameters of GPR. This method employs intelligent search strategies to identify the global optimum hyperparameter configuration, thereby enhancing the model’s predictive accuracy and robustness. By applying the improved GPR model to predict the compaction density of sandy gravel materials in a real-world engineering context, this study enables accurate extrapolation from laboratory-scale test results to field conditions with prototype gradations. The proposed approach provides a novel method for quality control in the construction of high earth–rockfill dams and offers valuable theoretical insights and technical support for similar projects involving coarse-grained soils.

1.3. Organization

The organization of this paper is organized as follows: Section 2 introduces the similar gradation scaling equation and the gradation characterization parameters, as well as the fundamental principles and framework of the proposed CO–SA–GPR model. Section 3 provides a detailed description of the development and training process of the compaction density prediction model for sandy gravel materials. Section 4 discusses the application of the model to predict the compaction density of sandy gravel dam materials in a practical engineering project, including a comparative analysis of model evaluation metrics and an assessment of predicted versus experimentally measured values for maximum and minimum dry density. Section 5 presents a comprehensive summary of the paper. Finally, Section 6 highlights prospective directions for future research.

2. Materials and Methods

2.1. Gradation Equation for Continuously Graded Soils

The gradation characteristics of traditional sandy gravel dam materials are typically determined through sieve analysis, which yields a cumulative gradation curve. This curve is used to identify key characteristic parameters such as the limiting particle size d60, the median particle size d30, and the effective particle size d10. These values are then utilized to calculate the coefficient of uniformity, Cu (=d60/d10), and the coefficient of curvature, Cc (=d302/(d10 × d60)), which serve as indicators for evaluating gradation quality. Current specifications stipulate that a sandy gravel material can be classified as well-graded if it simultaneously satisfies Cu ≥ 5 and Cc = 1~3.
However, this evaluation method, based solely on Cu and Cc, only provides a qualitative analysis of the influence of gradation on the mechanical properties of the dam material. It falls short of offering a quantitative characterization of how gradation quality specifically affects the material’s compressibility, deformation behavior, and shear strength.
In the study of gradation equations, Fuller et al. [27] pioneered the theory of maximum density curves, laying the foundation for subsequent research on particle size distribution. Talbot et al. [28] later proposed a new gradation equation based on fractal theory, while Swamee et al. [29] developed specialized gradation curve equations for natural sediments. However, Zhu Jungao et al. [30] found that these traditional gradation equations lack sufficient universality in practical engineering applications. Through systematic analysis of a large number of soil gradation curves from actual projects, they constructed a novel gradation curve equation. This equation uses any particle size d within the gradation range as the independent variable and the corresponding percentage content P finer than that size as the dependent variable, enabling a quantitative description of continuously graded soils. This research provides a new theoretical basis for the quantitative evaluation of gradation characteristics in coarse-grained materials. The continuous soil gradation equation is expressed as follows:
P = 100 ( 1 b ) ( d max d ) m + b
where dmax denotes the maximum particle size defining the gradation (mm); b and m are characteristic parameters related to the shape of the gradation curve (-). These parameters can be determined through optimization fitting using software such as Matlab or Origin, or by implementing custom optimization algorithms. Their values generally fall within the following reasonable ranges: m > 0 and b < 1.

2.2. Scaled Gradation Equation Using the Parallel Gradation Method

According to the specification [31], the parallel gradation method requires that the particle sizes of the original gradation curve be proportionally reduced based on geometric similarity. The scaled soil sample should maintain the same coefficient of uniformity and coefficient of curvature as the original material. The corresponding particle sizes and gradation are calculated using the following formulas:
d i = d 0 i n
n = d 0 max d max
where n denotes the particle size scaling factor (-); di denotes the particle size after scaling the i-th original particle size by a factor of n (mm); d0i denotes the i-th original particle size (mm); d0max denotes the maximum particle size of the prototype gradation (mm); dmax denotes the allowable maximum particle size of the specimen (mm).
As shown in Figure 1 of reference [32], which depicts the gradation curves before and after scaling by a similar gradation method, the prototype curve and the scaled curve are identical in shape. This demonstrates that their corresponding gradation characteristic parameters are, respectively, the same (b0 = b, m0 = m). Therefore, it can be concluded that:
P x = P 0
To rigorously validate the above conclusions, the following analytical proof is established. Let d max / d i = λ , whose substitution into Equation (1) yields the comparative equations for prototype and parallel-gradation-scaled curves:
P x = 100 ( 1 b ) λ m + b
P 0 = 100 ( 1 b 0 ) λ m 0 + b 0
Substituting Equations (5) and (6) into Equation (4) yields:
( 1 b ) λ m + b = ( 1 b 0 ) λ m 0 + b 0
The equality holds universally for arbitrary λ values if and only if (i) constant terms are identical, and (ii) λ -coefficients are pairwise equal, mathematically expressed as:
b = b 0 , m = m 0
According to the continuous gradation Equation (1), the percentage finer (P) corresponding to a given particle size (di) can be calculated as:
P = 100 ( 1 b ) ( d max d i ) m + b
From Equation (9), the following relationship can be derived:
d i = d max P ( 1 b ) 100 P b 1 m
From Equation (10), the characteristic particle sizes (d10, d30, d60) can be determined, enabling subsequent calculation of the scaled gradation’s uniformity coefficient (Cu) and curvature coefficient (Cc) as follows:
C u = d 60 d 10 = 6 ( 1 0.1 b ) 1 0.6 b 1 m
C c = d 30 2 d 60 d 10 = 3 1 0.1 b 1 0.6 b 2 ( 1 0.3 b 2 1 m
As demonstrated by Equations (11) and (12), the post-scaling uniformity coefficient (Cu) and curvature coefficient (Cc) depend exclusively on gradation parameters b and m. Since Equation (8) confirms the invariance of these parameters under parallel gradation scaling, both Cu and Cc remain unchanged—in full compliance with specification requirements. Consequently, the mathematical representation of the parallel gradation equation is derived as follows:
P x = 100 ( 1 b 0 ) ( d max d ) m 0 + b 0
where d is the arbitrary particle size within gradation range (mm); dmax is the particle size defining gradation (mm); b0, m0 is the original gradation characteristic parameters (-).

2.3. Gradation Curve Area

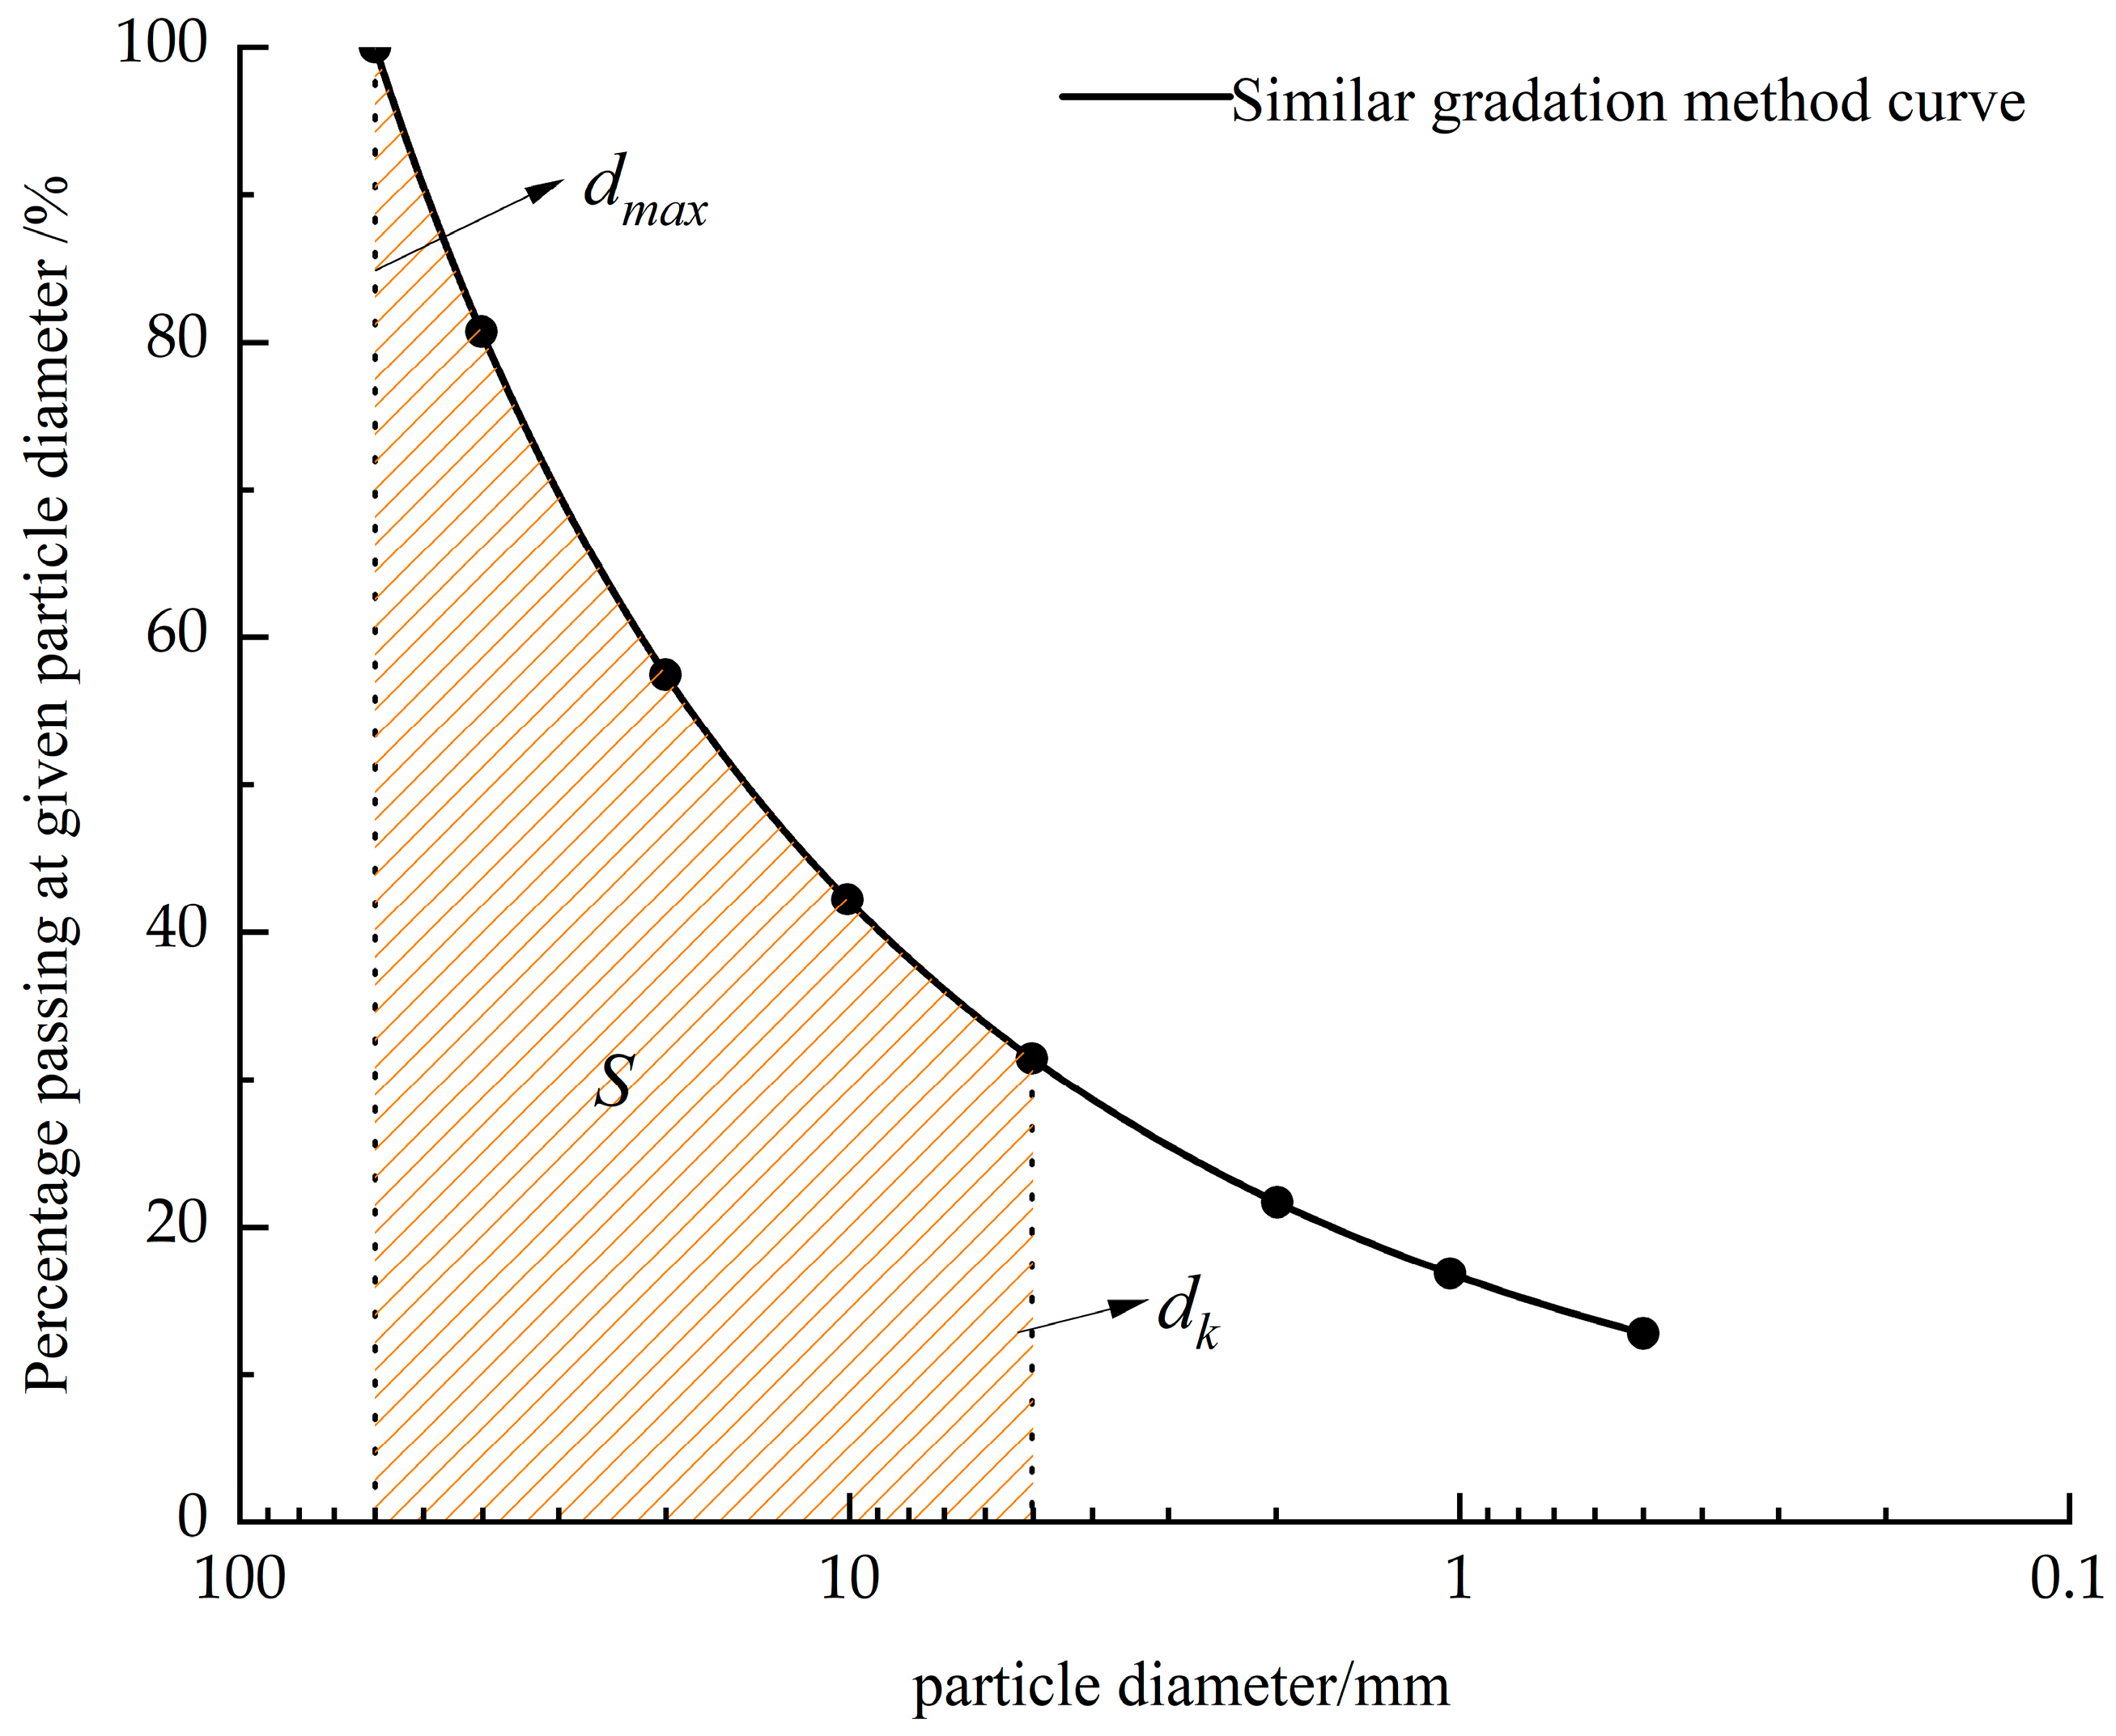
Wu Erlu et al. [18,19] introduced the gradation curve area parameter (S) to quantify coarse-grained material compaction characteristics. This parameter is geometrically defined as the enclosed area bounded by: (1) the gradation curve, (2) the horizontal axis (particle size d), (3) the maximum particle size line (d = dmax), and (4) the characteristic particle size line (d = dk0), as illustrated in Figure 2.
Based on the continuous gradation equation, the mathematical expression for calculating the gradation curve area parameter (S) is derived as follows:
S = ln 1 k b ln 1 b m b ln 10
where the coefficient k is calculated as:
k = 1 1 b d max d k 0 m + b
When b = 0 , the gradation curve area parameter (S) can be expressed as:
S = 1 k m ln 10

2.4. CO–SA–GPR Model

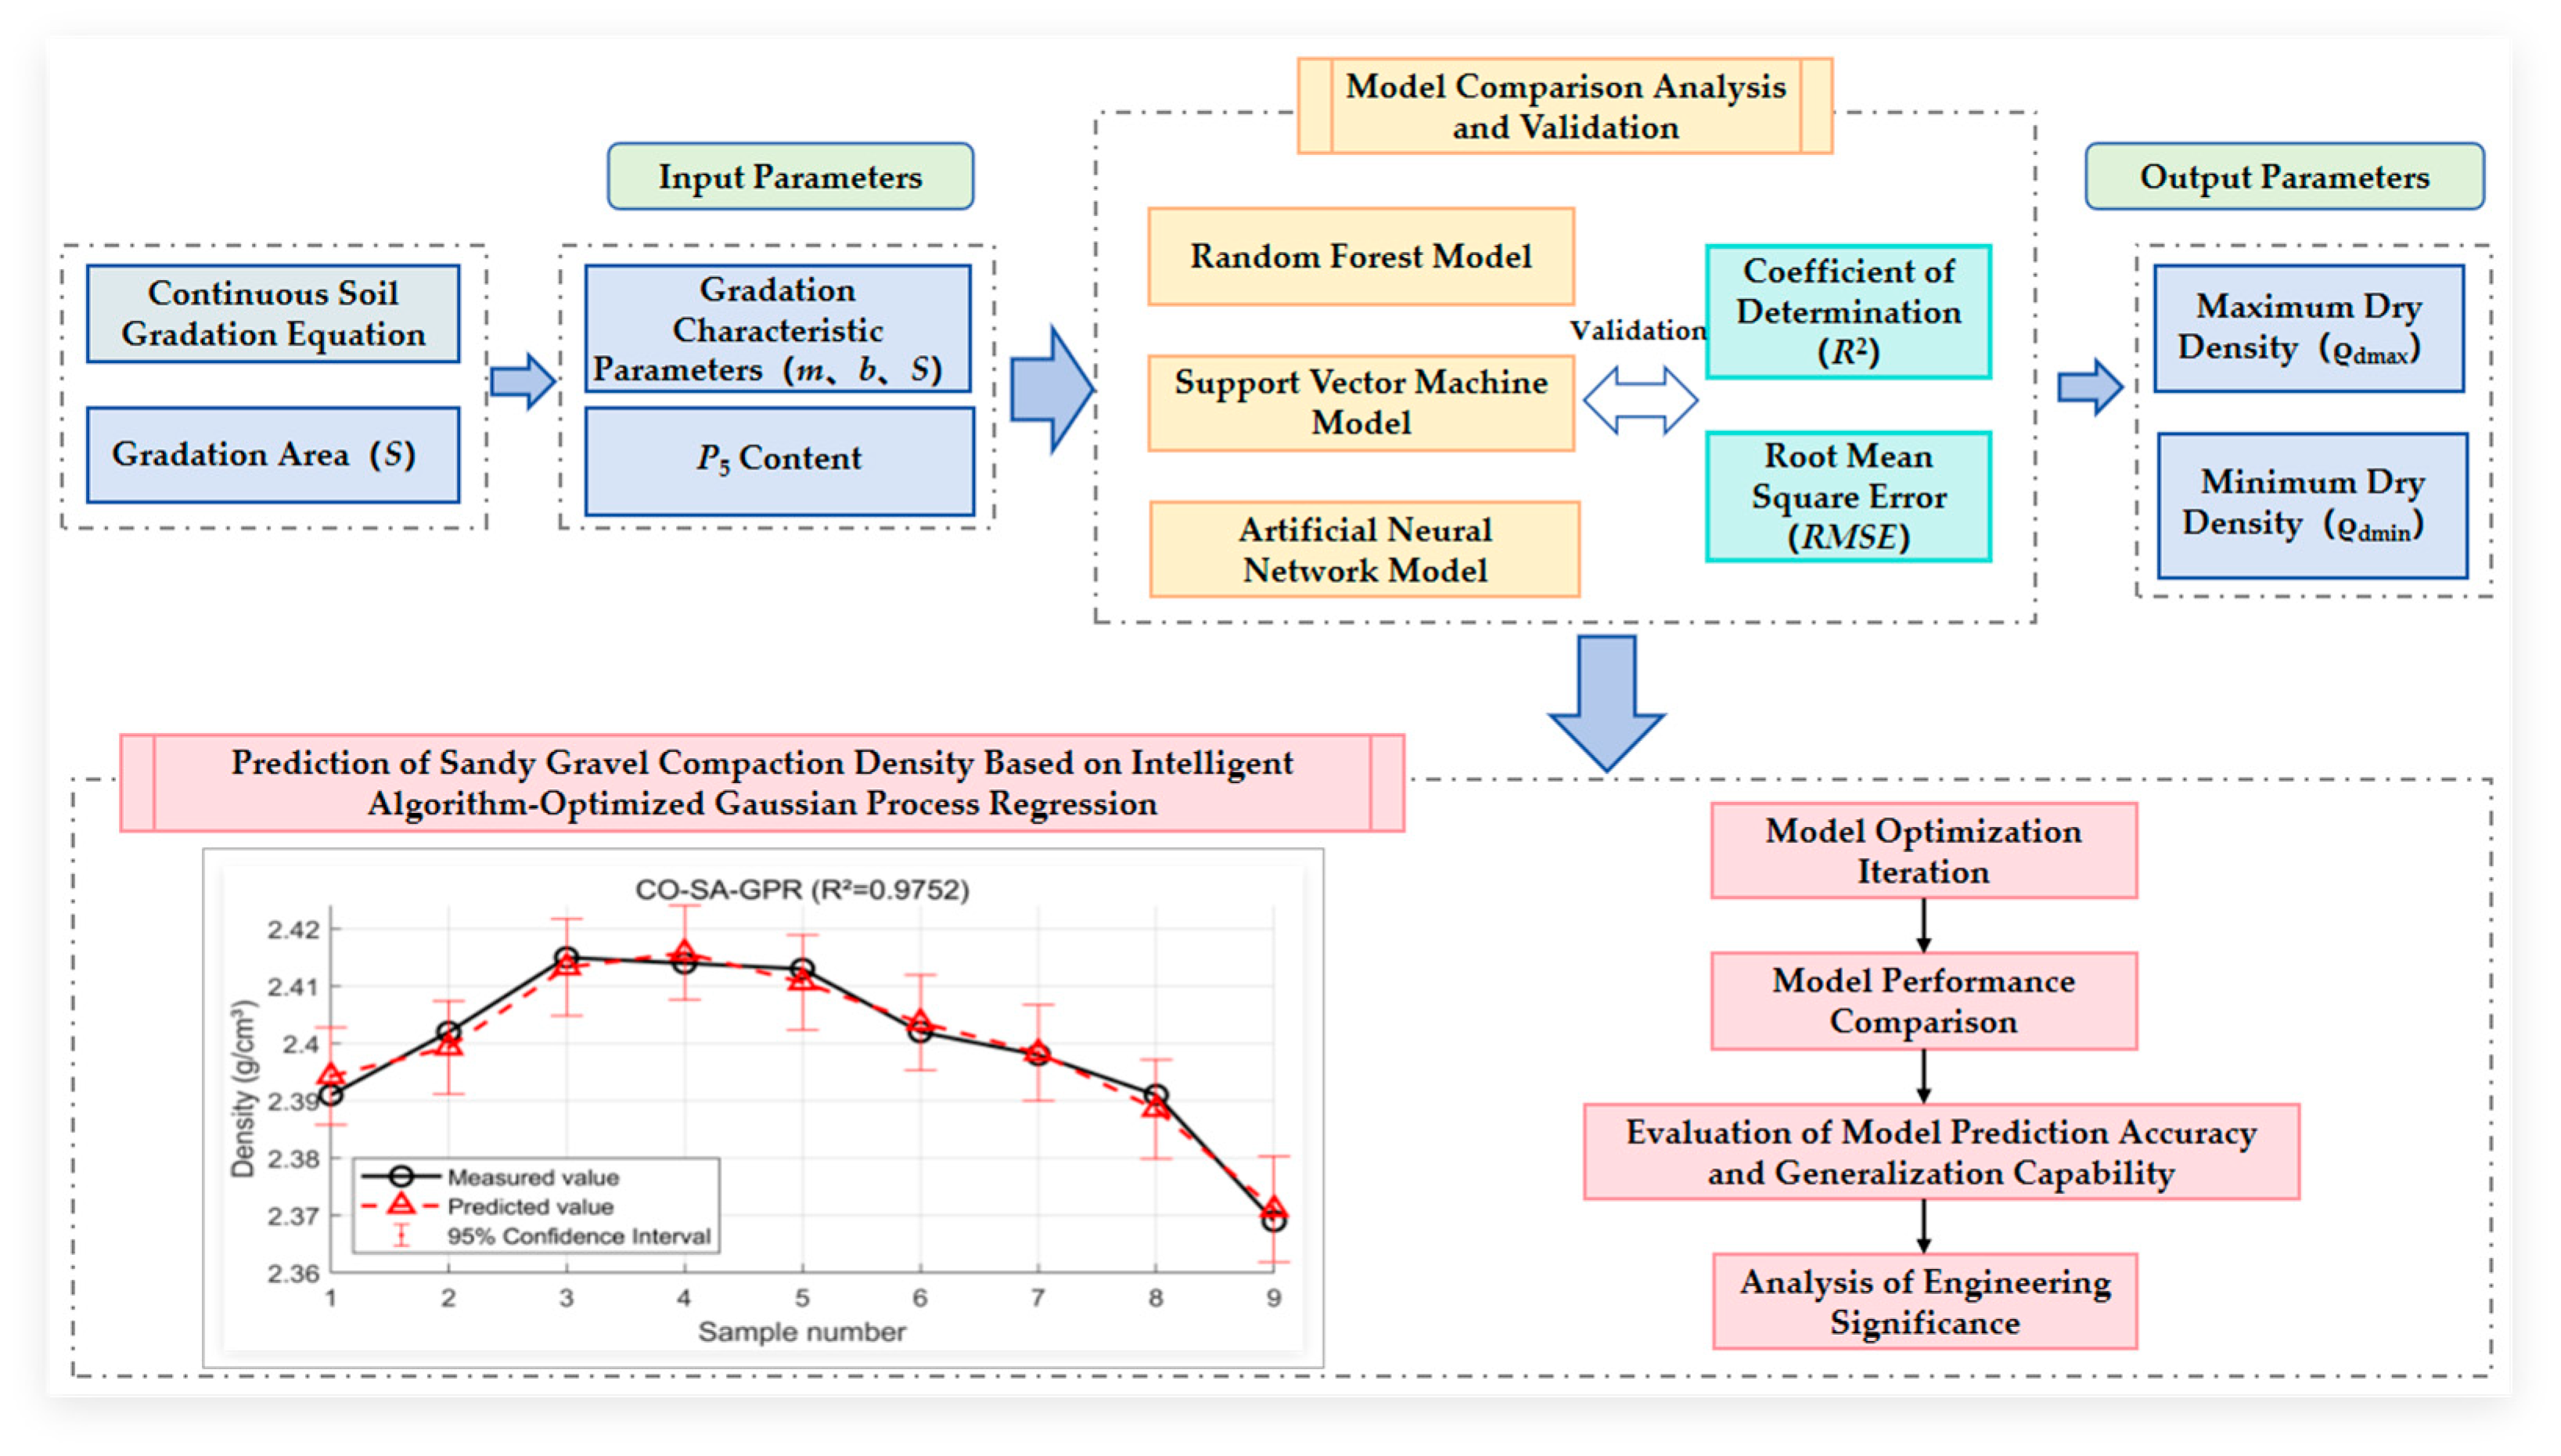
To address the issue of Gaussian process regression (GPR) easily converging to local optima or failing to converge due to improper initial hyperparameter settings, this study introduces a hybrid strategy combining the Cheetah Optimizer (CO) and Simulated Annealing (SA) for adaptive hyperparameter optimization of the GPR model. A CO–SA–GPR prediction model for the compaction density of sandy gravel materials is thus established based on this intelligently optimized Gaussian process regression. For the model inputs, the gradation characteristic parameters (m, b, S) and the P5 content of the sandy gravel material are selected as the main feature variables to construct the corresponding dataset for training and validation. The predictive performance of different intelligent optimization algorithms is compared using multiple evaluation metrics, and the generalization capability of the proposed model is comprehensively evaluated to ensure its stability and reliability in practical engineering applications. The specific workflow for constructing the model is shown in Figure 3.

2.4.1. Gaussian Process Regression

Gaussian Process Regression (GPR) is a non-parametric Bayesian regression method [33]. Its core idea is to treat the function f(x) to be fitted as a random variable drawn from a Gaussian process. The prior distribution of this process is then updated using observed data to obtain the posterior distribution for making predictions. GPR not only provides predicted values but also quantifies the uncertainty of predictions (e.g., confidence intervals).
Assuming the observed data (training set) is:
D = x i , y i i = 1 n
where x i is the input feature; y i is the output (or target) feature.
In practical testing, data often contain a certain level of noise. Therefore, it is necessary to incorporate a noise term ε into the regression model, yielding the Gaussian Process Regression (GPR) model as:
y = f ( x ) + ε       ,   ε N   ( 0 ,   σ n 2 )
where x is the input vector; f represents the latent function value; y denotes the observed value contaminated by noise; ε is Gaussian noise characterized by a normal distribution with a mean of 0 and a variance of σ n 2 .
The prior distribution of the function value f = f ( x 1 ) , , f ( x n ) T is given by:
f ~ N ( 0 , K )
where the covariance matrix K is computed by a kernel function:
K X , X = k ( x 1 , x 1 ) k ( x 1 , x n ) k ( x n , x 1 ) k ( x n , x n )
Assuming the noise is independent and identically distributed (i.i.d.), the likelihood function of the observations y = y 1 , y 2 , y n T is given by:
y f N ( f , σ n 2 I )
The joint prior distribution of the observed values y and the predicted values f is given by:
y f N 0 , K ( X , X ) + σ n 2 I             K ( X , X ) K ( X , X )                             K ( X , X )
This study employs the squared exponential kernel function, which is expressed as:
k ( x i , x j ) = σ f 2 exp 1 2 l 2 x i x j 2 + σ n 2 δ i j
where σ f represents the signal standard deviation; l denotes the length scale; σ n is the noise standard deviation.
The conjugate gradient optimization method inherent in GPR is highly dependent on the initial values. However, there is currently no theoretical basis for setting these initial values. If the initial values are inappropriately chosen, the optimization process may become trapped in a local optimum or even fail to converge. To address this limitation, an optimization algorithm will be introduced in the subsequent sections to enhance its performance.

2.4.2. Cheetah Optimizer (CO)

The Cheetah Optimizer (CO) is a novel metaheuristic algorithm proposed in 2022 by Mohammad Amin Akbari et al. [34,35], inspired by the hunting strategies of cheetahs in nature. During the hunting process, cheetahs employ three main strategies: searching, sitting-and-waiting, and attacking. The algorithm mimics these behaviors to search for optimal solutions. It offers advantages such as fast convergence speed and strong global exploration capabilities.
In the Cheetah Optimizer (CO), the position update of each cheetah (i.e., solution) is influenced by the current best cheetah position, a random cheetah position, and the movement strategies of the cheetah. The following provides a mathematical description of the key steps in the algorithm:
(1)
Search Strategy: Cheetahs employ two primary methods to locate prey: conducting a comprehensive scan across their entire territory or proactively searching the surrounding areas. During the hunt, depending on factors such as prey availability, terrain coverage, and the cheetah’s own physical condition, the cheetah may alternate between these two search modes. The position update formula is as follows:
X i , j t + 1 = X i , j t + α r 1
where X i , j t represents the position of the i cheetah in the j dimension at iteration t; r 1 is a random number drawn from a standard normal distribution, introduced to incorporate randomness; α is the step size parameter, typically set to α = 0.001 × t T , where T denotes the maximum number of iterations.
(2)
Sitting-and-Waiting Strategy: When prey is detected but current conditions are unsuitable for an immediate attack, the cheetah will conceal itself and wait for the prey to approach or for a more opportune moment to initiate the hunt. When this strategy is adopted, the cheetah maintains its current position:
X i , j t + 1 = X i , j t
(3)
Attack Strategy: The attack strategy consists of two phases: sprinting and capturing. Sprinting: The cheetah rapidly closes in on the prey. When the opportunity arises, it initiates an active assault. In group hunting scenarios, each cheetah may adjust its position based on the fleeing prey and the locations of the leading or adjacent cheetahs.
The mathematical formulation of the cheetah’s attack strategy is as follows:
X i t + 1 = X b e s t t + β r 2
where X b e s t t is the current best position in the population (i.e., the prey’s position); r 2 is a random number drawn from a standard normal distribution, simulating the sharp turns during the cheetah’s capture mode; β is the interaction factor, reflecting the cooperative behavior among cheetahs.

2.4.3. Simulated Annealing Algorithm

The Simulated Annealing (SA) algorithm was proposed by Metropolis in the 1950s, inspired by the study of solid-state matter annealing processes. The core of this algorithm lies in the Metropolis criterion [36], which is unique in that it not only accepts improved solutions during the temperature reduction process but also accepts worse solutions with a certain probability determined by the temperature variable. This characteristic enhances the algorithm’s ability to escape local optima during the search process. In this study, the adaptive particle swarm optimization algorithm is integrated with simulated annealing to effectively reduce the probability of the particle swarm algorithm becoming trapped in local optima. The Metropolis criterion defines the probability of accepting a new solution when transitioning from state i to state j at temperature T as:
P i j ( k ) = 1                                                                                 ,                                       E j ( k ) < E i ( k ) exp ( E j ( k ) E i ( k ) T i )             ,                                       E j ( k ) E i ( k )
where Ei(k) and Ej(k) represent the internal energy in state i and state j, respectively, which corresponds to the fitness value of the current particle; Ti denotes the annealing temperature at the current state; ∆E = Ej(k) − Ei(k) is the internal energy increment. If Ej(k) < Ei(k), the system accepts the new state with a probability of 1. If Ej(k) ≥ Ei(k), the system may still accept the inferior state (worse solution) with a probability p = exp(−ΔE/Ti) [37,38,39].
The annealing process is applied over multiple iterations to search for the optimal solution. The temperature decreases at an extremely slow rate to ensure solution accuracy, and annealing is performed at the end of each iteration.
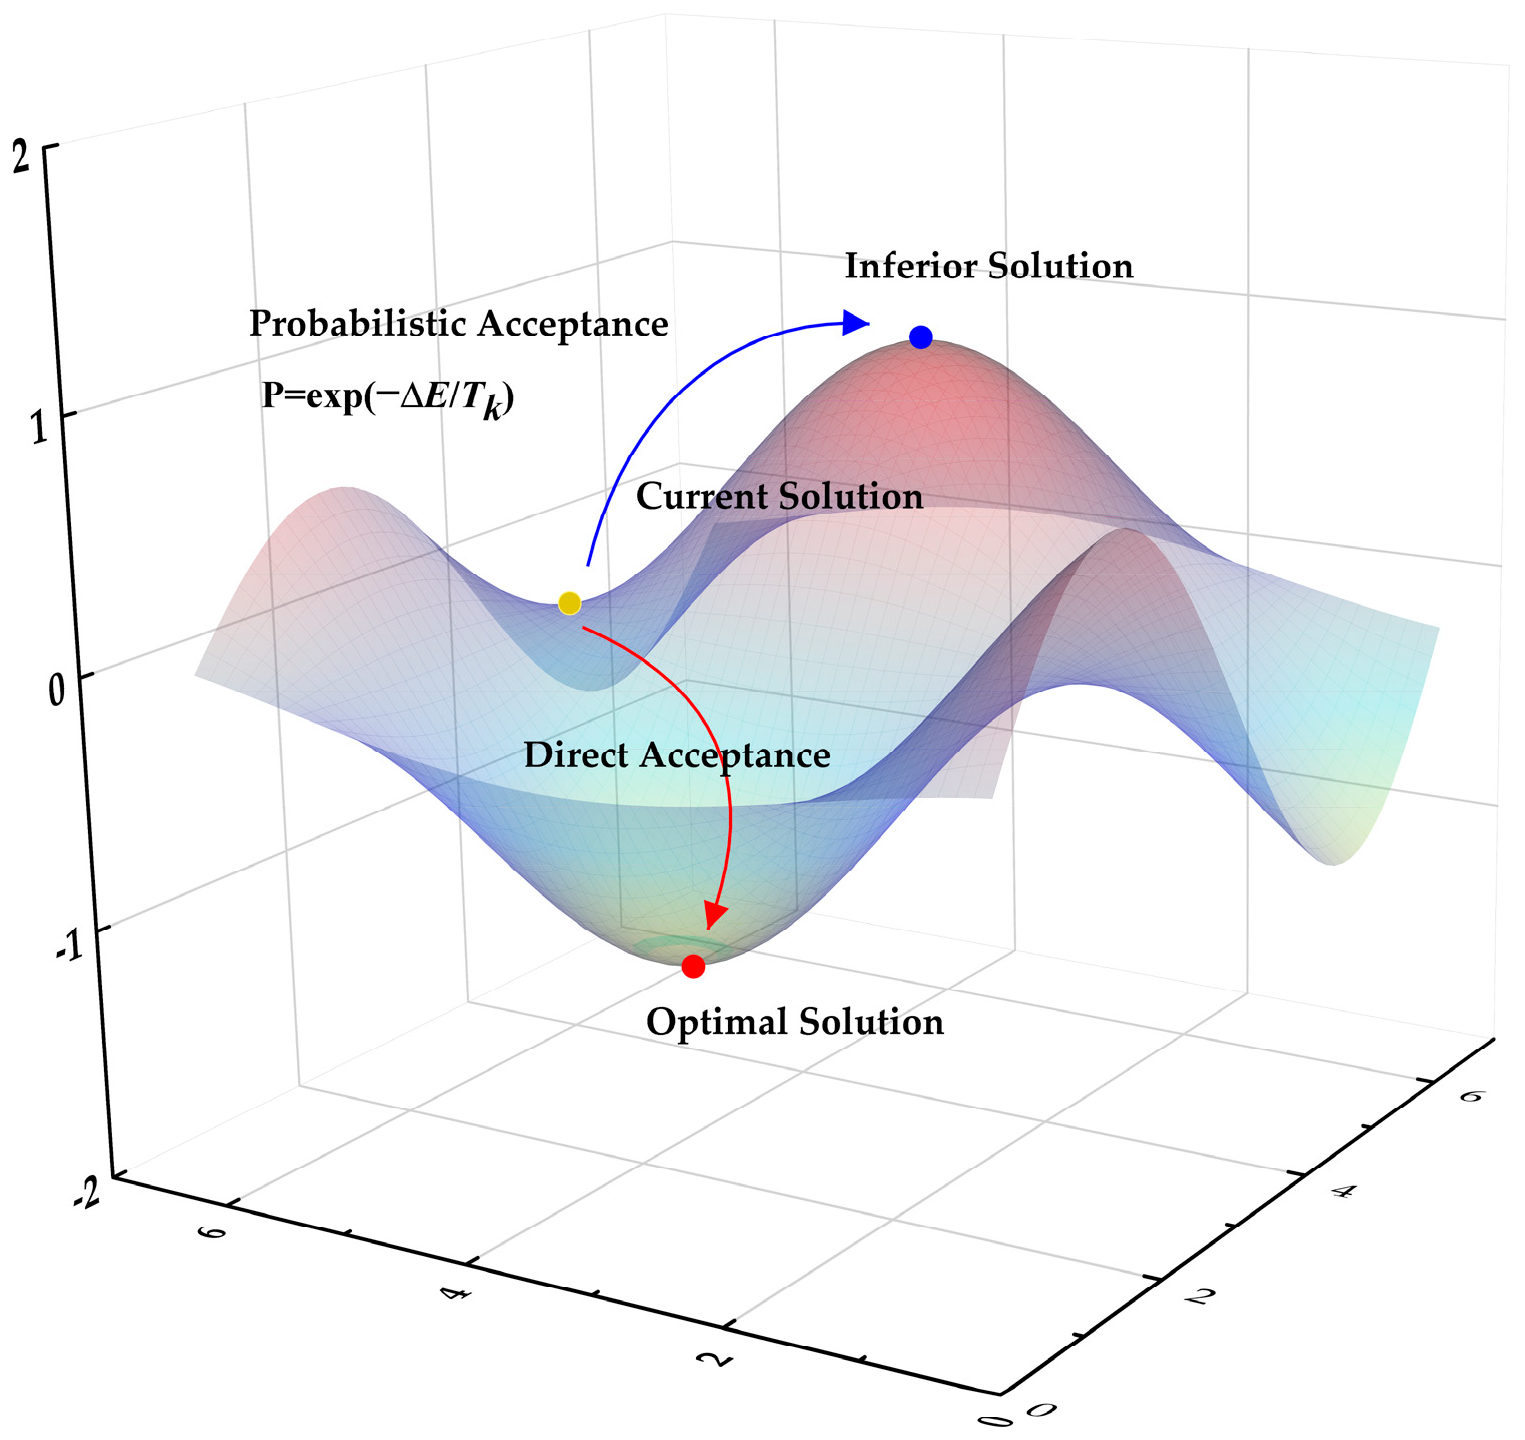
The Simulated Annealing algorithm is a global search method inspired by the metallurgical process of annealing, which achieves the global optimum of an objective function in a probabilistic sense (the algorithm principle is illustrated in Figure 4). For optimization problems, the internal energy can be abstracted as a fitness function. At higher temperatures, the algorithm exhibits a higher probability of accepting worse solutions. As the temperature gradually decreases, this probability reduces, which helps the algorithm escape the constraints of local optima and ultimately converge to the global optimum.
In this study, the Simulated Annealing algorithm is integrated into the Gaussian Process Regression model. During the search for extremum values, it allows the objective function to temporarily deteriorate within a limited range with a certain probability, thereby facilitating escape from local optima and ensuring convergence to the globally optimal solution.

3. Development of a CO–SA–GPR-Based Model for Predicting Sandy Gravel Compaction Density and Its Engineering Application

3.1. Engineering Background

This study was conducted within the context of the Altash concrete face sandy gravel dam in Xinjiang. This pivotal water control project is located in the lower mountainous section of the main stream of the Yarkant River and delivers comprehensive benefits in flood control, irrigation, and power generation. The reservoir has a total storage capacity of 2.24 billion cubic meters, a normal impoundment level of 1820 m, and a total installed power capacity of 690 MW. The major hydraulic structures include water-retaining structures, flood discharge facilities, power generation water diversion systems, and an ecological power station building at the dam toe.
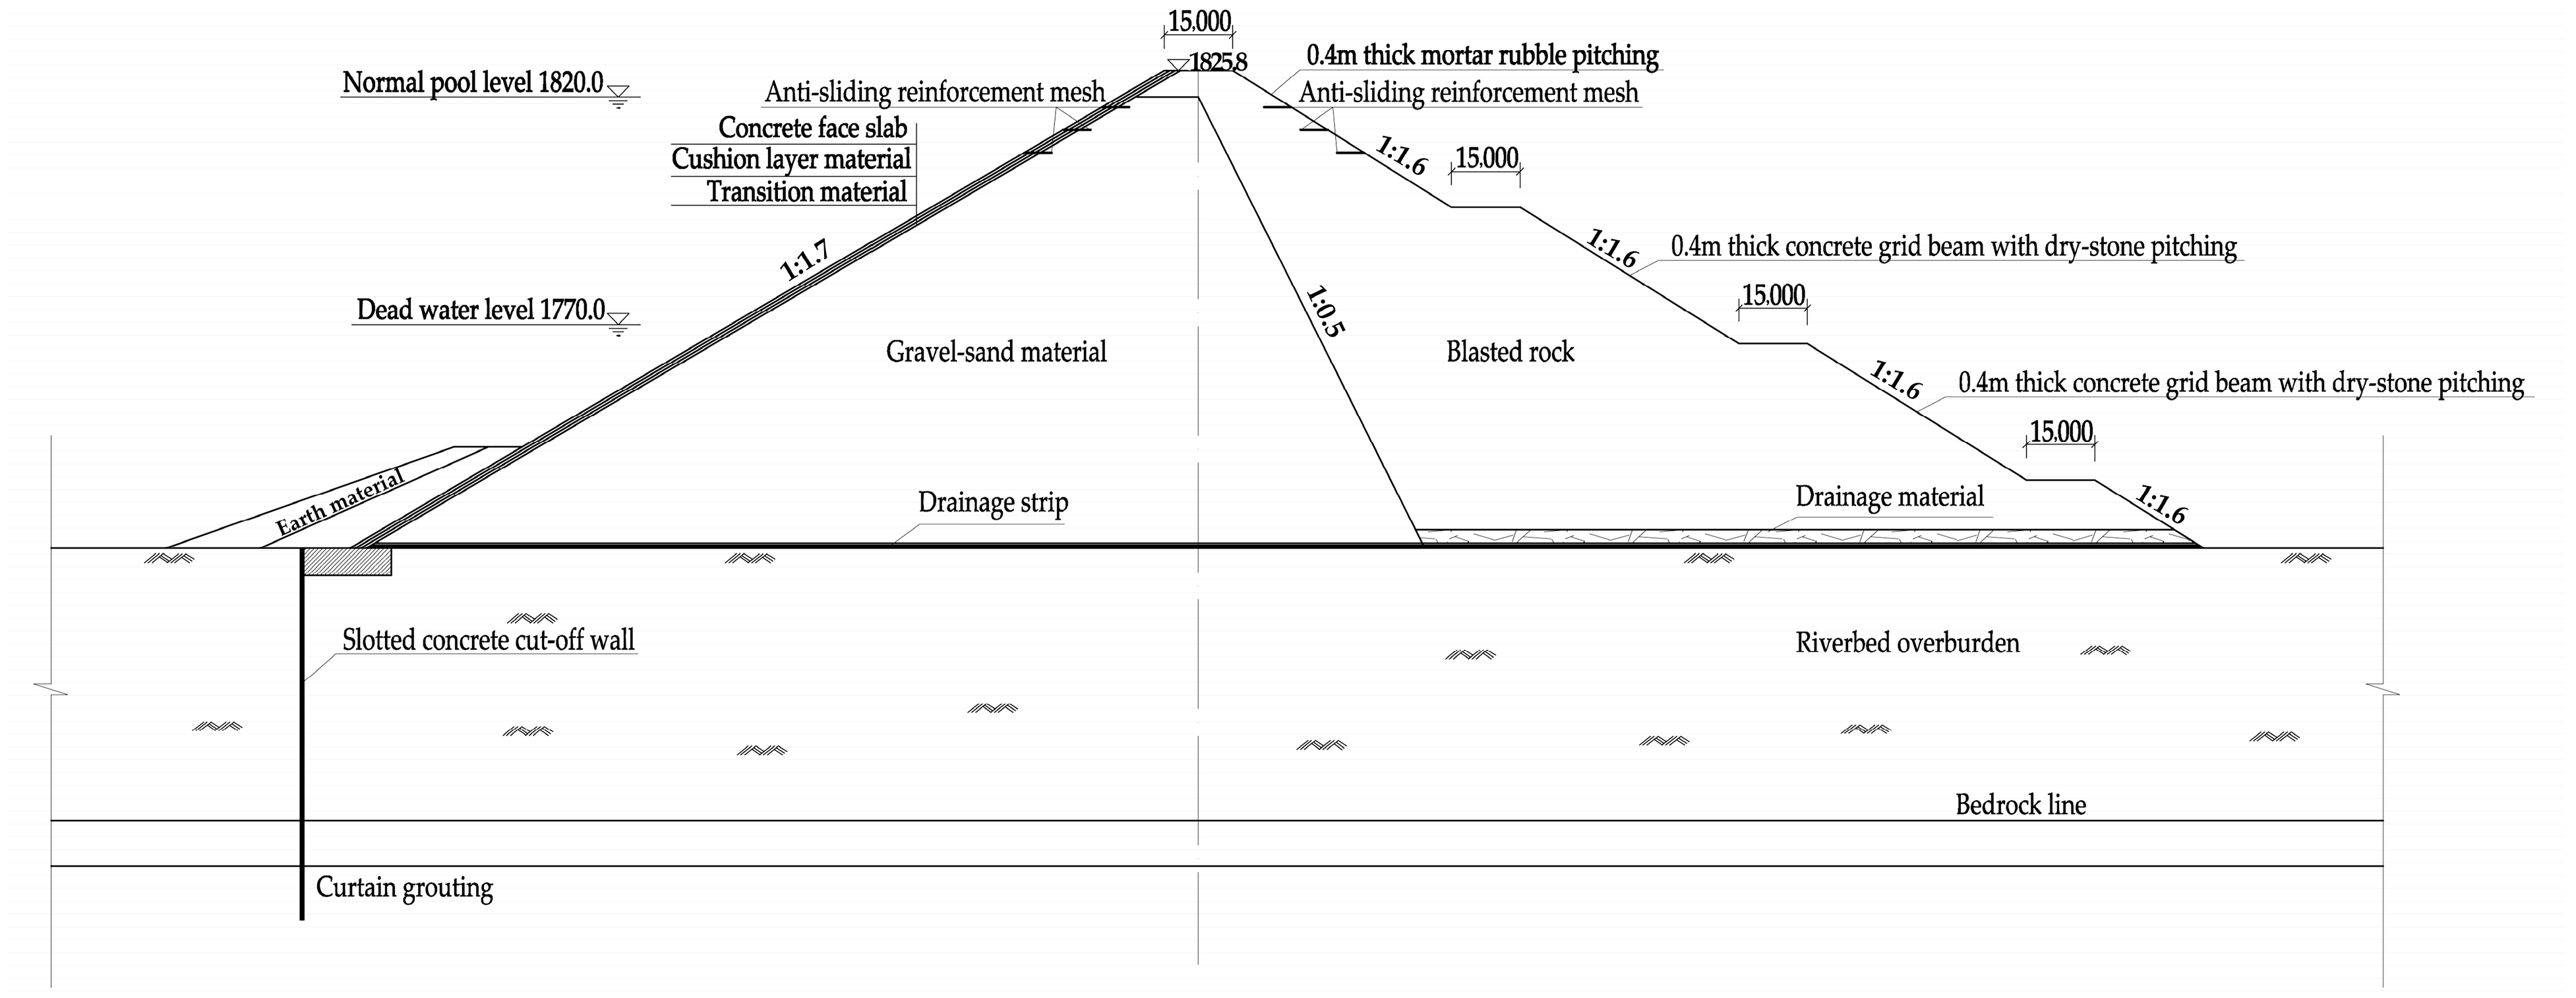
The Altash water-retaining dam is a concrete-faced sandy gravel dam with a crest elevation of 1825.8 m, a maximum height of 164.8 m, a crest width of 12.0 m, and a total length of 795 m. In terms of the dam’s cross-sectional zoning, the following components are arranged sequentially from upstream to downstream: an upstream overburden zone, a blanket zone, the concrete face, a cushion material zone, a transition material zone, a sandy gravel material zone, a downstream blasted rockfill zone, and a horizontal drainage material zone. According to the engineering filling quantity statistics, the total fill volume of the dam is approximately 25 million m3, consisting of 0.36 million m3 of cushion material, 0.59 million m3 of transition material, 12.3 million m3 of sandy gravel material, and 10.4 million m3 of blasted rockfill material. A standard cross-section of the dam is illustrated in Figure 5.

3.2. Model Development and Application

The test employed the pouring loose-fill method to determine the minimum dry density of the sandy gravel material, while the vibratory table method was used to measure its maximum dry density. The parameters for the vibratory table test were set as follows: a static load of 14 kPa was applied to the specimen surface, with a vibration frequency of 47.5 Hz. The vibration duration and excitation force were determined in accordance with the relevant testing standards.
The test soil material was sourced from the natural main sandy gravel stockpile in the C3 borrow area of the Altash Water Control Project. The particles are predominantly subrounded to rounded in shape. To systematically investigate the influence of gradation on compaction characteristics, nine groups of test materials with different gradations were generated using an interpolation method based on the envelope range of the original gradation.
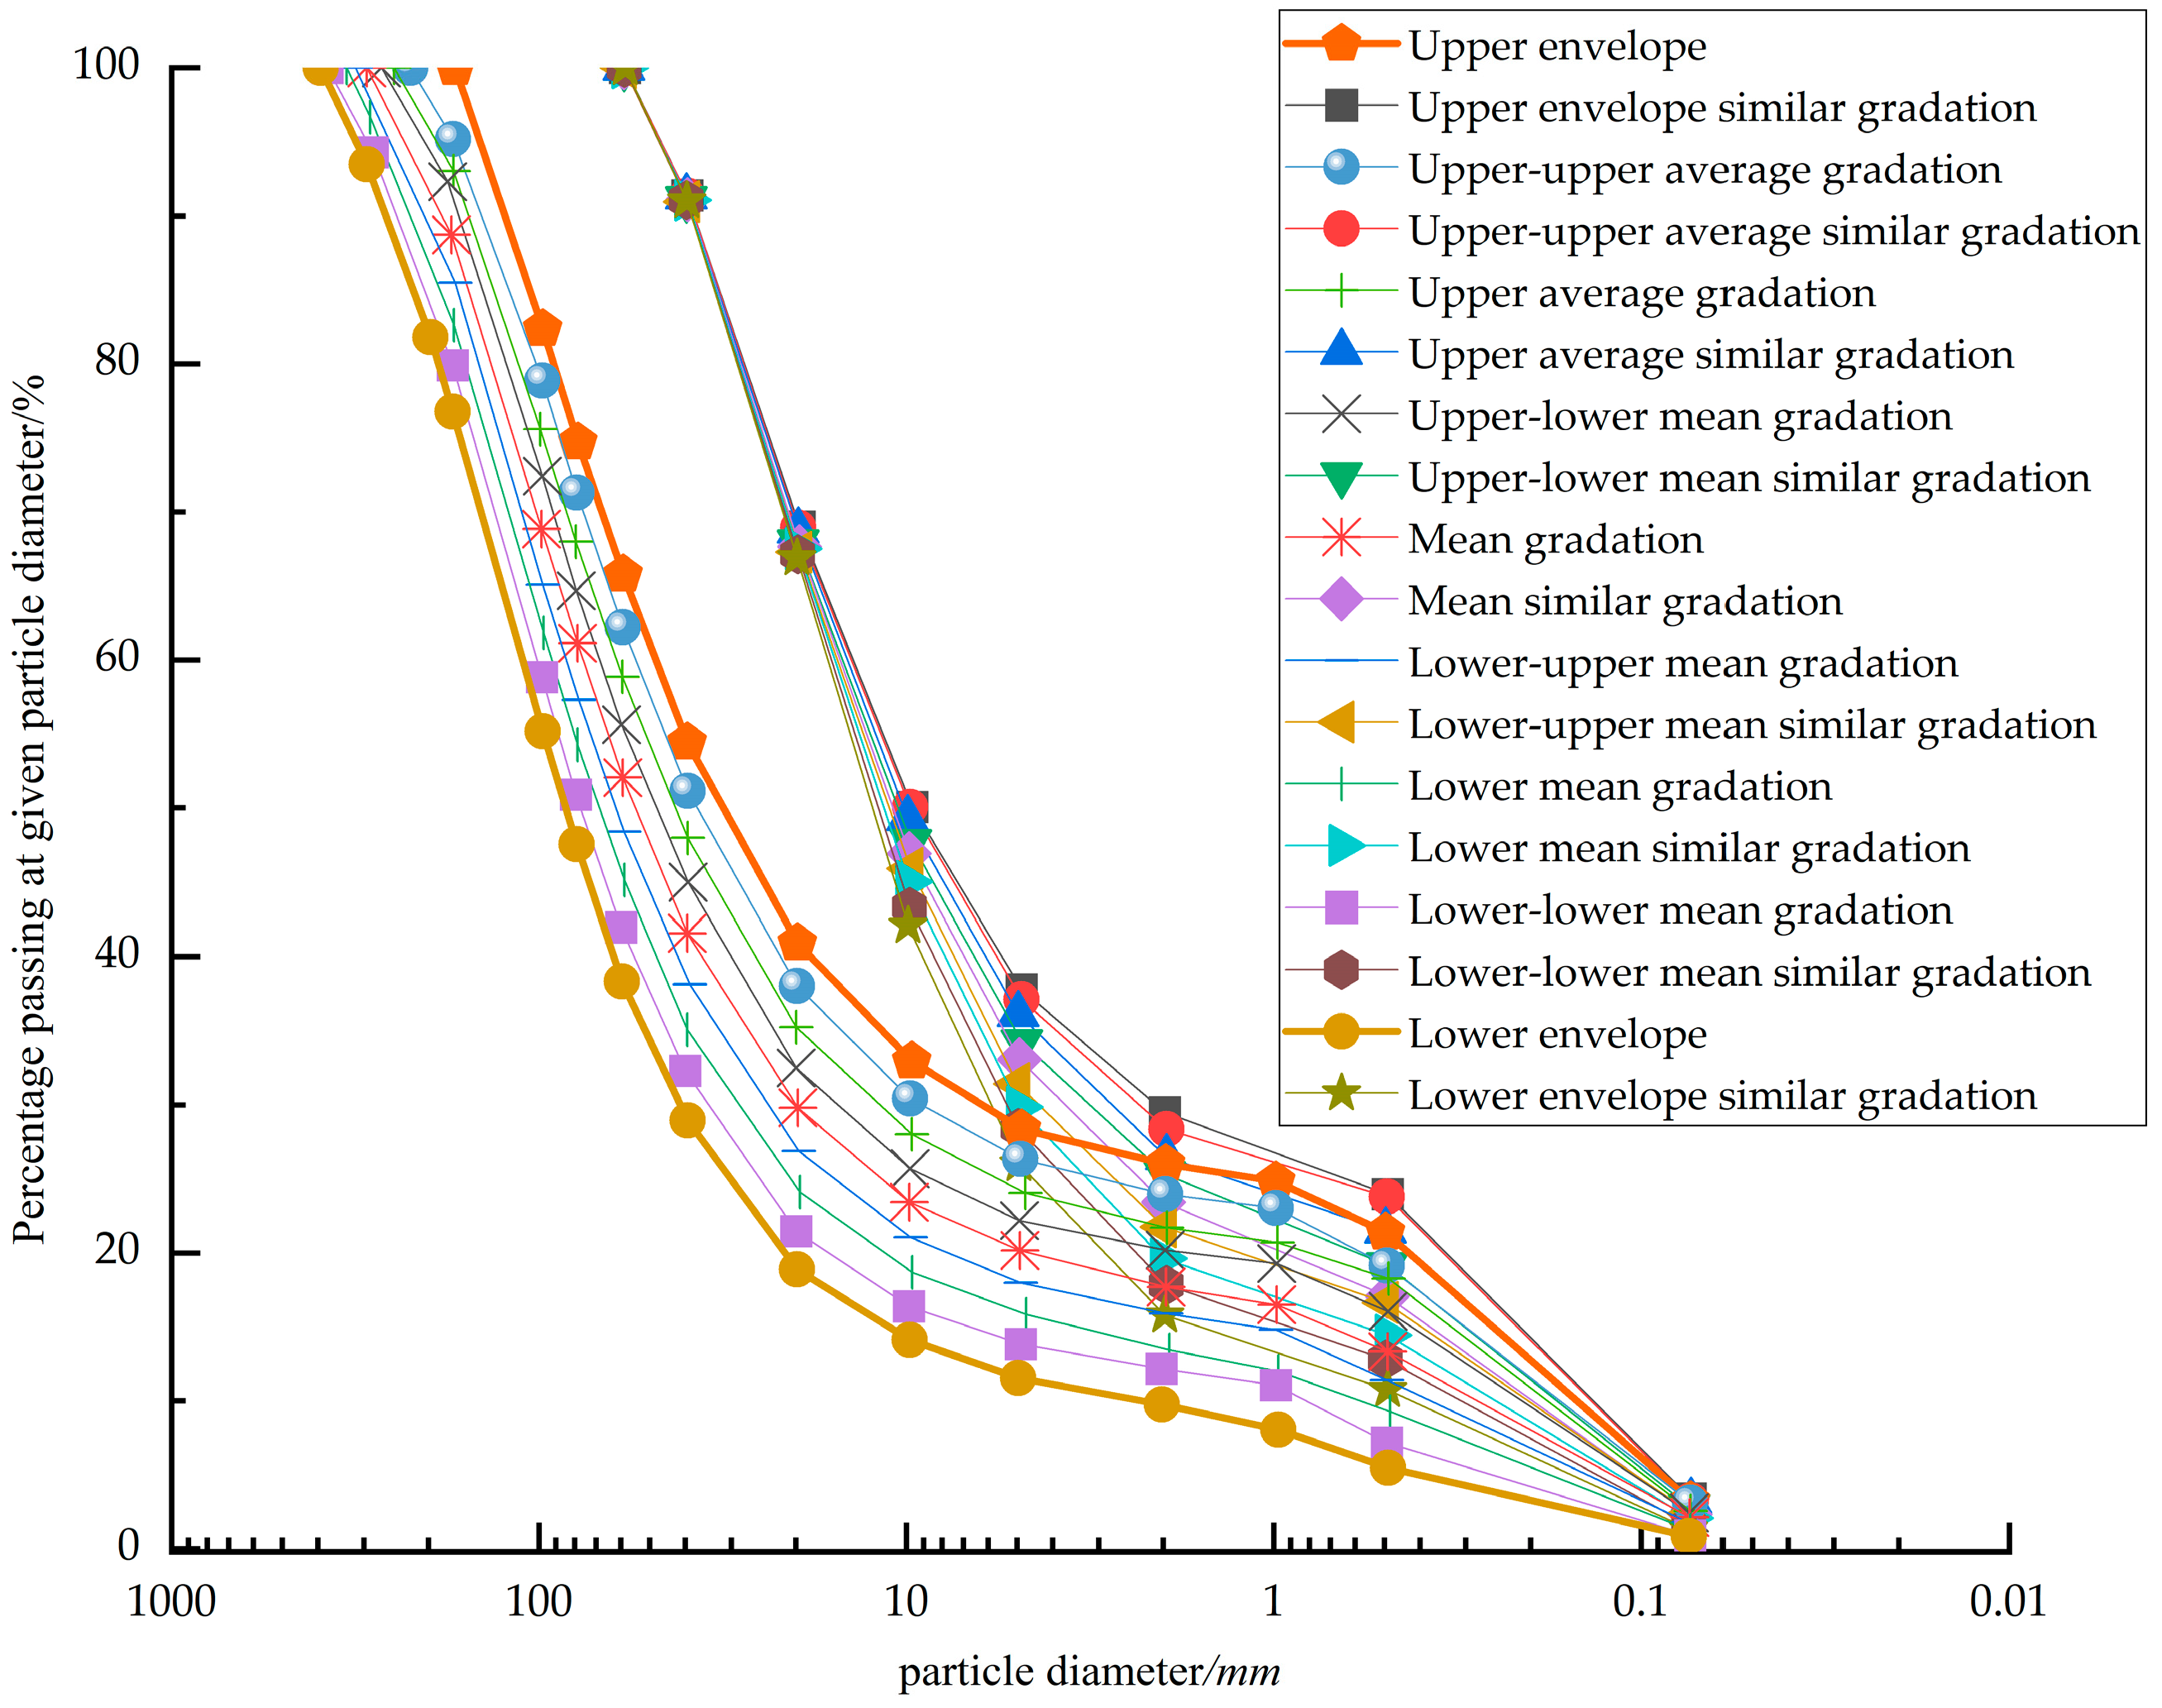
Furthermore, the prototype gradation was scaled down in accordance with the standardized similar gradation method [31] to meet the requirements of the laboratory testing equipment, which has a maximum particle size (dmax) limitation of 60 mm. A comparison between the original and scaled gradation curves is shown in Figure 6.
Based on the continuous gradation equation and the gradation curve area integration method, the scaled sandy gravel gradation curves were nonlinearly fitted using Origin software to obtain the parameters m, b, and S (gradation area), which characterize the gradation features. The specific calculation results are summarized in Table 1. Table 1 also lists the percentage of particles smaller than 5 mm (P5 content) for each gradation sample, along with their corresponding compaction characteristic indicators. These include the minimum dry density (ρmin), measured by the pouring loose-fill method, and the maximum dry density (ρmax), determined by the vibratory table method.
Given the very small sample size (only 9 data sets), this study faces the challenge of small-sample learning. Under such conditions, employing complex deep learning models is prone to overfitting. Therefore, a Gaussian Process Regression (GPR) model optimized by the CO–SA (Cheetah Optimizer–Simulated Annealing) hybrid algorithm is adopted, which demonstrates superior performance on small datasets. The model establishes a nonlinear mapping between the input parameters (gradation parameters of the sandy gravel material: P5, m, b, S) and the output parameters (maximum dry density ρdmax and minimum dry density ρdmin), and its generalization capability is rigorously evaluated.
Given the limited dataset size, Leave-One-Out Cross-Validation (LOO–CV) was employed to evaluate the model in order to mitigate randomness introduced by data partitioning. Separate prediction models were developed for the maximum dry density (ρdmax) and the minimum dry density (ρdmin).
Moreover, to validate the accuracy of the compaction quality assessment model developed using the proposed algorithm, two widely adopted model evaluation metrics were introduced: the coefficient of determination (R2) and the root mean square error (RMSE). These metrics were employed to compare and assess the performance of the model.
R 2 = 1 i = 1 n ( y i y ^ ) 2 i = 1 n ( y i y ¯ ) 2
R M S E = 1 n i = 1 n ( y i y ^ i ) 2
where n is the number of samples; y i is the true value of the i-th sample; y ^ i is the predicted value of the i-th sample; y ¯ is the sample mean of the true values.

4. Results and Discussion

4.1. Comparison of Results from Different Evaluation Models

This study employs four hybrid optimization algorithm models for comparative analysis: the CO–SA–GPR model, CO–SA–RF model, CO–SA–SVM model, and CO–SA–ANN model.
(1)
Gaussian Process Regression (GPR) describes the underlying functional relationship through a Gaussian process prior and provides a predictive probability distribution.
(2)
Random Forest (RF) is a Bagging ensemble learning algorithm that constructs multiple decision trees during regression modeling and aggregates their predictions to enhance overall predictive performance [40].
(3)
Support Vector Machine (SVM) is a supervised learning algorithm based on statistical learning theory. Its fundamental principle is to find an optimal decision boundary between data points to separate different classes, ensuring this boundary maximizes the margin to the nearest data points (support vectors). The key idea is to improve the generalization ability of the learning machine by minimizing structural risk [41].
(4)
An Artificial Neural Network (ANN) is a computational tool that “learns” from known sample data to establish relationships between the input and output layers [42].
Figure 7 presents the evaluation metrics R2 and RMSE for different models, with the blue bars representing the metrics for maximum dry density predictions and the red bars for minimum dry density predictions. A comparison of the evaluation metrics across the models shows that the intelligently optimized Gaussian Process Regression (GPR) model proposed in this study outperforms the others, achieving RMSE values of 0.0022 and 0.0028 for the maximum and minimum dry density predictions, respectively, and R2 values of 0.9752 and 0.9741. These results demonstrate significantly superior fitting performance compared to the other models.
As indicated by the evaluation metrics of different models in Table 2, the Random Forest, Support Vector Machine, and Artificial Neural Network models all demonstrate strong performance in predicting the minimum dry density, with their R2 values reaching 0.9674, 0.9692, and 0.9535, respectively, indicating a high ability of fit. However, these models exhibit a significant decline in fitting performance when predicting the maximum dry density, accompanied by considerable errors and an overall imbalance in predictive capability. Additionally, they show certain limitations in interpretability. In contrast, the CO–SA–GPR model proposed in this study performs well not only in predicting the minimum dry density but also achieves superior results in predicting the maximum dry density, demonstrating more comprehensive predictive performance and higher practical value.
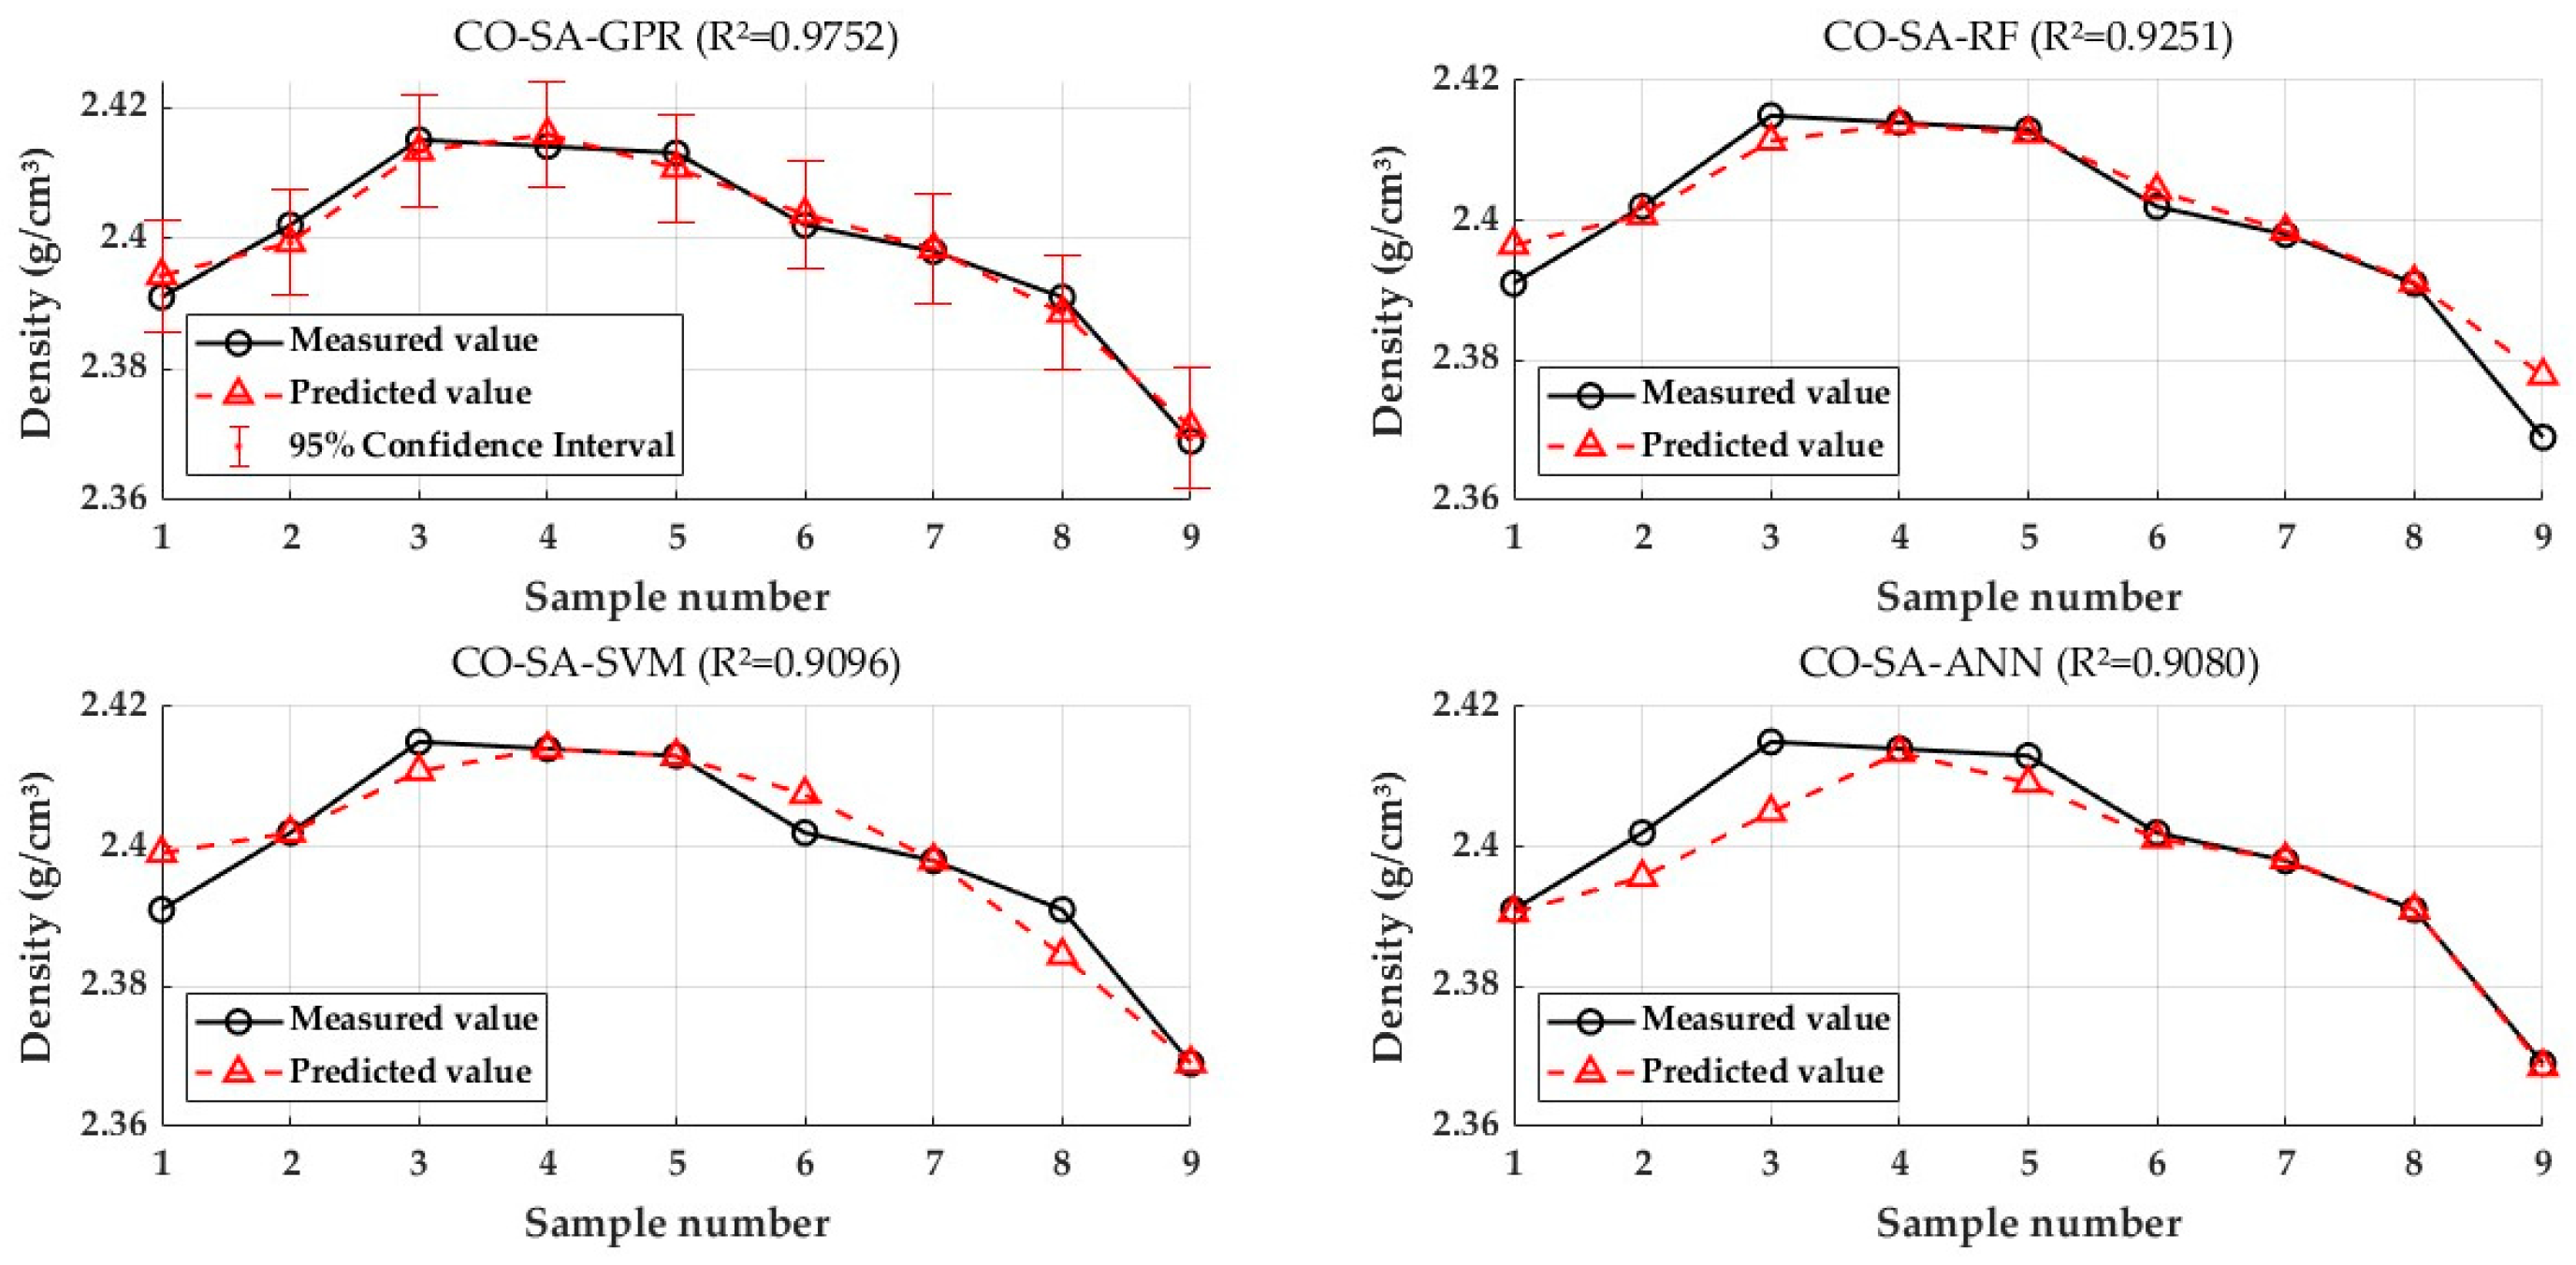
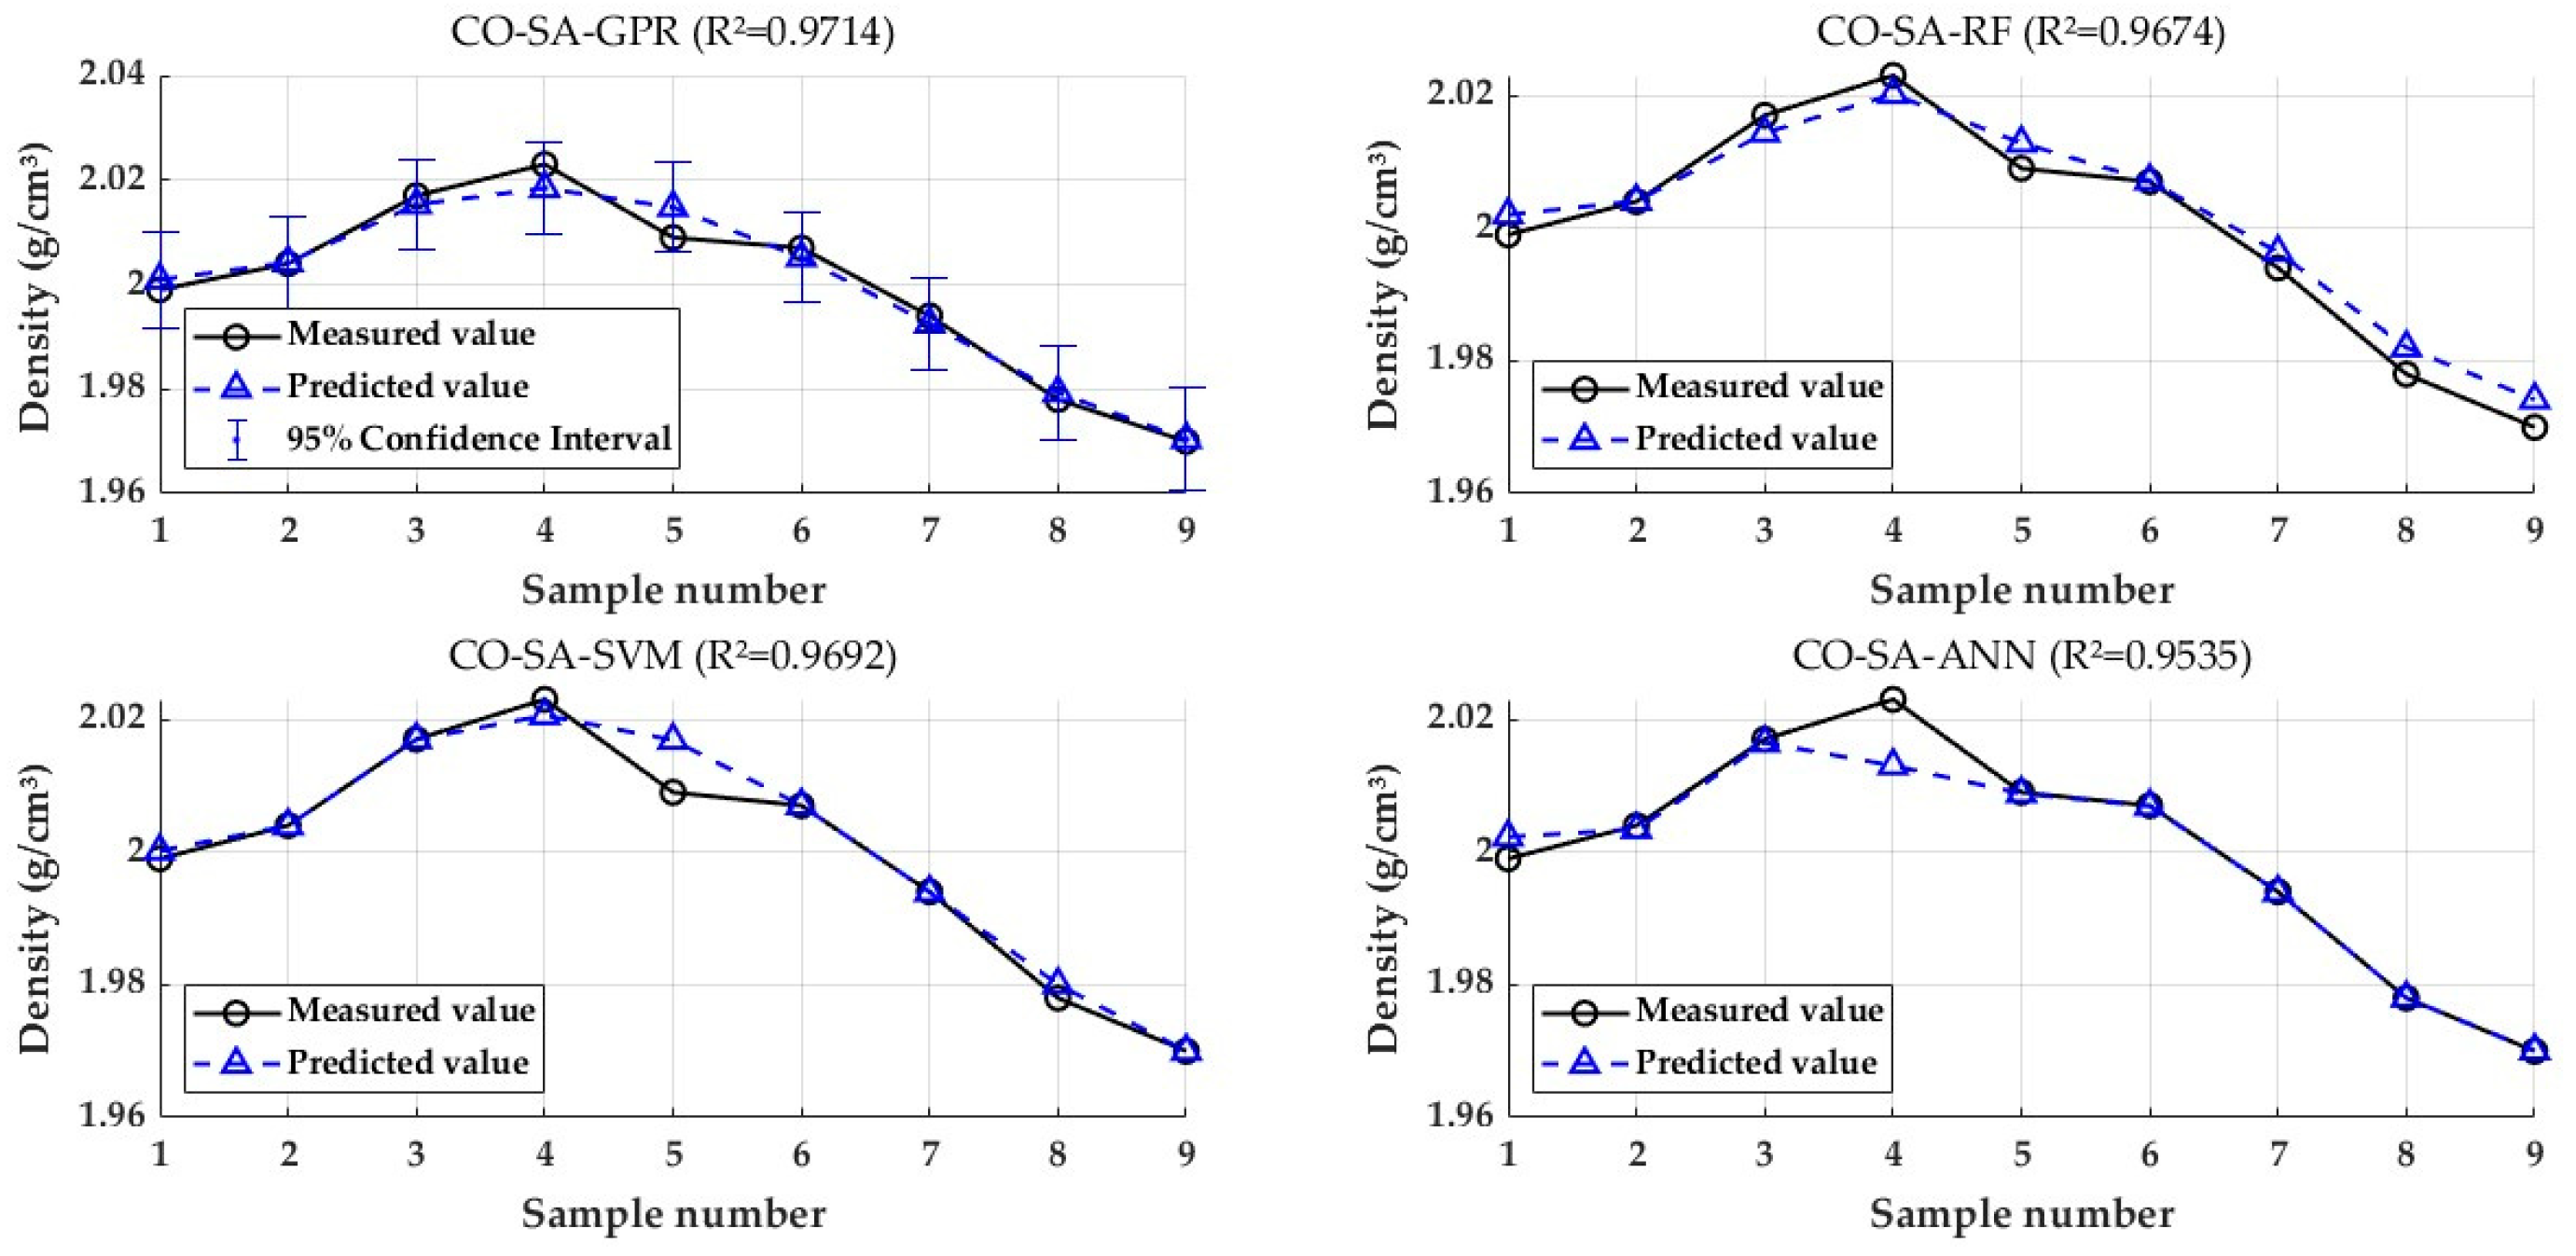
To further evaluate the predictive performance of different models, the nine sets of experimental data were tested. A comparison of the prediction accuracy for the maximum dry density is shown in Figure 8, and for the minimum dry density in Figure 9. In these figures, the black curves represent the measured values of the maximum and minimum dry density, respectively, while the red curves represent the predicted values from the different evaluation models.
As illustrated in Figure 8 and Figure 9, the proposed CO–SA–GPR model demonstrates superior agreement between predicted and true values for both maximum and minimum dry densities, outperforming all other models in predictive accuracy. Although both CO–SA–RF and CO–SA–SVM exhibit certain predictive capabilities, their fitted curves show noticeable deviations from the measured values, particularly near extreme points, where their performance is less stable. The predictions of CO–SA–ANN deviate substantially from the actual measurements, indicating limited generalization ability under the current data scale and feature conditions.
Furthermore, the 95% confidence interval provided by CO–SA–GPR not only reflects its inherent advantage as a probabilistic model but also effectively complements its high-precision predictions. This significantly enhances the reliability and interpretability of the forecasting results, making the output of the proposed model more scientifically valuable and practically meaningful.

4.2. Reliability Analysis of the CO–SA–GPR Model

First, to mitigate the randomness of a single data split, the model employs a strategy combining k-fold cross-validation with multiple iterative analyses. This method randomly divides the dataset into k mutually exclusive subsets and performs k rounds of training and validation, each time using a different subset as the validation set and the remaining subsets as the training set. All performance metrics (such as R2 and RMSE) are averaged over these k iterations. This process effectively smooths out performance variance caused by data sampling fluctuations, thereby more convincingly demonstrating the stability and reproducibility of the evaluation results of the proposed CO–SA–GPR model for predicting the compaction density of sandy gravel materials, rather than reflecting a one-off exceptional performance.
Second, to assess the model’s generalization capability, i.e., its universality, we adopted a cross-sample validation approach. The results show that the CO–SA–GPR model consistently maintains excellent predictive performance (with R2 remaining above 0.90). This strongly indicates that our model does not merely memorize the noise in the training data (i.e., overfitting) but has genuinely captured systematic patterns, thereby offering higher reliability in statistical inference.
Finally, the inherent algorithmic design of the CO–SA–GPR model provides intrinsic robustness when handling the small-sample data used in this study. Gaussian process regression, as a Bayesian nonparametric model, has the core advantage of naturally regularizing solutions by introducing appropriate kernel function priors and directly outputting predictive uncertainty, thereby effectively preventing overfitting.
Thus, the model framework is both theoretically and practically suited for small-sample scenarios, ensuring that all statistical conclusions and inferences drawn from our limited data are robust and credible.

4.3. Discussion on Model Performance Across Different Parameters and Variables

To further elucidate the predictive capability and robustness of the proposed CO–SA–GPR model, we analyze its performance with respect to different input parameters (features) and output variables (targets). This discussion aims to provide deeper insights into how the model leverages various gradation characteristics to achieve high prediction accuracy.

4.3.1. Influence of Input Parameters

The model incorporates four key input parameters derived from the gradation of sandy gravel materials: P5, m, b and S. Our analysis reveals that: P5 content exhibits a strong nonlinear correlation with both ρdmax and ρdmin. The model successfully captures this relationship, which is often overlooked in traditional scaling methods. The gradation shape parameters m and b influence the curvature and uniformity of the gradation. The CO–SA–GPR model effectively interprets their combined effect on compaction density, especially in capturing the transition between well-graded and poorly graded materials. The gradation area S serves as a comprehensive indicator of the overall gradation structure. The model’s ability to integrate S with other parameters contributes to its superior performance in predicting both extreme densities. These findings confirm that the model not only relies on individual parameters but also learns their interactions, enabling it to handle complex, multivariate nonlinear relationships.

4.3.2. Performance on Output Variables

The model was separately trained and evaluated for two target variables: Maximum dry density (ρdmax), Minimum dry density (ρdmin). As shown in Table 2 and Figure 8 and Figure 9, the model achieves high accuracy for both targets, with R2 values of 0.9752 and 0.9741, and low RMSE values of 0.0022 and 0.0028, respectively. This balanced performance across both outputs underscores the model’s versatility and reliability in estimating the full range of compaction characteristics. Notably, the model performs slightly better in predicting ρdmax, which may be attributed to the more controlled and repeatable nature of the surface vibration method used to measure it, compared to the pouring method for ρdmin.

4.3.3. Comparison with Other Models Across Variables

Compared with CO–SA–RF, CO–SA–SVM and CO–SA–ANN, the proposed model shows that there is excellent consistency between the two output variables, and it has better generalization on small datasets. In addition, the interpretability is enhanced through the probability output (confidence interval). This makes the CO–SA–GPR model particularly suitable for practical engineering applications where both accuracy and reliability are of critical importance.

5. Conclusions

To address the challenge of predicting the compaction density of sandy gravel materials, this study proposes a CO–SA–GPR prediction model for accurate estimation of both the maximum (ρdmax) and minimum (ρdmin) dry densities.
First, based on the continuous soil gradation equation, the gradation equation for the parallel gradation scaling method was derived. Parameters m, b, and the gradation area S, which characterize the gradation features, were obtained through curve fitting. Combining the P5 content and experimentally measured ρdmax and ρdmin data, a hybrid strategy integrating the Cheetah Optimizer (CO) and Simulated Annealing (SA) was employed to optimize the hyperparameters of the Gaussian Process Regression (GPR) model. This approach effectively avoids local optima and significantly enhances the convergence efficiency and robustness of the algorithm.
Second, practical engineering applications demonstrate that the proposed CO–SA–GPR model outperforms comparative models such as Random Forest (RF), Support Vector Machine (SVM), and Artificial Neural Network (ANN) in predicting ρdmax and ρdmin, achieving superior performance in evaluation metrics including the coefficient of determination (R2) and root mean square error (RMSE). The model exhibits higher prediction accuracy and stability. Moreover, it provides predictive uncertainty information, offering a more comprehensive and reliable reference for the assessment and control of compaction quality in sandy gravel materials.

6. Limitations and Future Research Directions

The CO–SA–GPR model for predicting the compaction density of sandy gravel materials, as proposed in this study, has certain limitations that should be addressed in future research:
(1)
Data Limitations: The predictive performance of the model relies on specific indicators such as laboratory test data and P5 content, which may be constrained by the scale and representativeness of the training dataset. Its effectiveness, particularly for materials with extreme gradations or non-typical sandy gravels, remains to be validated. Future studies could incorporate additional material parameters to enhance the model’s generalizability and interpretability across diverse materials.
(2)
Regarding model performance: There is potential to improve model performance by exploring alternative optimization strategies and more complex kernel functions. Furthermore, developing lightweight model architectures and embedded computing optimization strategies could reduce computational costs while maintaining prediction accuracy, thereby facilitating the integration of the model into real-time compaction monitoring systems.
(3)
Model Applications: This study developed an intelligently optimized Gaussian process regression model, aiming to provide a more accurate method for predicting the compaction density of gravelly soils in dam construction. The model’s output of compaction density can be used to guide on-site compaction quality control. Furthermore, these prediction results can serve as key input parameters for predictive models of the dam material’s mechanical characteristics, thereby supporting the prediction of mechanical properties and numerical analysis of long-term dam deformation. This ultimately provides data support for optimizing engineering design and informing safety operation decisions.

Author Contributions

H.W.: Data curation, Writing—original draft; J.L.: Formal analysis, Writing—review and editing; Y.Z.: Methodology, Resources; B.L.: investigation, Software. All authors have read and agreed to the published version of the manuscript.

Funding

This research was funded by the National Natural Science Foundation of China (No. 52369012), “Regulation Process of Winter Irrigation on Soil Water, Heat, Salt, and Nitrogen during the Seasonal Freeze-Thaw Period in Xinjiang”; the Science and Technology Bureau of Xinjiang Production and Construction Corps (No. 2022DB020), “Support Program for Innovation and Development of Key Industries in Southern Xinjiang”; and the Science and Technology Bureau of Xinjiang Production and Construction Corps (No. 2024AB079), “Research and Demonstration of Prefabricated Frost-Resistant Structures and Intelligent Monitoring Systems for Hydraulic Structures in Irrigation Areas”.

Data Availability Statement

The data will be provided if requested.

Acknowledgments

The authors would like to express their sincere gratitude to the relevant departments of the Alta Sh Hydropower Project for providing the essential data and materials that supported this research.

Conflicts of Interest

The authors declare no conflicts of interest.

Abbreviations

The following abbreviations are used in this manuscript:
GPRGaussian Process Regression
COCheetah Optimizer
SASimulated Annealing
RFRandom Forest
SVMSupport Vector Machine
ANNArtificial Neural Network
XGBoosteXtreme Gradient Boosting

References

  1. Guo, Q.G. Engineering Properties and Applications of Coarse-Grained Soils; Yellow River Water Conservancy Press: Zhengzhou, China, 2003. [Google Scholar]
  2. Deng, M.J.; Yu, H.M. Progress in Dam Construction in Xinjiang; China Water & Power Press: Beijing, China, 2011. [Google Scholar]
  3. Li, J.; Li, X.Q. Design and construction technology development of concrete face rockfill dams and asphalt concrete core dams under special conditions in Xinjiang. Water Resour. Hydropower Eng. 2016, 47, 2–8+20. [Google Scholar] [CrossRef]
  4. Li, J.; Liu, Y.; Huang, T. Application of key technologies in dam type selection and layout of medium-sized reservoirs in Xinjiang. Water Resour. Hydropower Eng. 2018, 49, 87–96. [Google Scholar] [CrossRef]
  5. Liu, Y.; Li, J.; Yang, Y.S.; Peng, Z.X. Filling standards and deformation control of high concrete face rockfill dams in Xinjiang. J. Hydraul. Eng. 2021, 52, 182–193. [Google Scholar] [CrossRef]
  6. Xu, Z.P. Key technologies and research progress of concrete face rockfill dams. J. Hydraul. Eng. 2019, 50, 62–74. [Google Scholar] [CrossRef]
  7. Xiao, S.; Yang, J.; Lu, X.; Zhou, H.; Cheng, L.; Ma, C.H.; Tong, F. Research progress on key technologies for safety monitoring of CFRDs considering special engineering problems of “three highs, one depth, and one narrow”. Adv. Eng. Sci. 2025, 1–19. [Google Scholar] [CrossRef]
  8. Zhu, J.G.; Weng, H.Y.; Wu, X.M.; Liu, H.L. Experimental study on compaction density of coarse-grained materials after particle size scaling. Rock Soil Mech. 2010, 31, 2394–2398. [Google Scholar]
  9. Li, P. Determination Method and Application of Filling Standards for Wide-Graded Large-Sized Coarse-Grained Soils. Ph.D. Thesis, Xi’an University of Technology, Xi’an, China, 2006. [Google Scholar]
  10. Zhu, S.; Wang, Y.M.; Weng, H.Y. Study on scale effect of compaction density of coarse dam materials. Chin. J. Rock Mech. Eng. 2011, 30, 348–357. [Google Scholar]
  11. Zhu, S.; Wang, J.; Zhong, C.X.; Wu, L.Q. Scale effect and sample preparation standards for dry density of rockfill materials. Chin. J. Rock Mech. Eng. 2019, 38, 1073–1080. [Google Scholar]
  12. Weng, H.Y.; Jing, W.H.; Li, Y.H.; Wang, G.Q. Analysis of factors influencing scale effect of coarse-grained materials. J. Water Resour. Water Eng. 2009, 20, 25–28+34. [Google Scholar]
  13. Fu, H.; Han, H.Q.; Ling, H. Influence of particle size scaling methods on laboratory test results of rockfill materials. Rock Soil Mech. 2012, 33, 2645–2649. [Google Scholar]
  14. Zhao, N.; Zuo, Y.Z.; Wang, Z.B.; Yu, S.G. Study on particle size scaling method for coarse-grained materials based on fractal theory. Rock Soil Mech. 2016, 37, 3513–3519. [Google Scholar]
  15. Shi, Y.W. Determination of filling standards and construction control for large-sized coarse dam materials. Chin. J. Geotech. Eng. 1982, 04, 78–93. [Google Scholar]
  16. Feng, G.Q.; Yang, Y.H. Study on laboratory test methods for maximum index density of rockfill materials. Chin. J. Geotech. Eng. 1992, 05, 37–45. [Google Scholar]
  17. Zuo, Y.Z.; Zhang, W.; Pan, J.J.; Zhao, N. Influence of particle size scaling methods on maximum dry density of coarse-grained materials. Rock Soil Mech. 2015, 36, 417–422. [Google Scholar]
  18. Wu, E.L.; Zhu, J.G.; Guo, W.L.; Chen, G. Experimental study on the influence of scale effect on compaction density of coarse-grained materials. Chin. J. Geotech. Eng. 2019, 41, 1767–1772. [Google Scholar]
  19. Wu, E.L.; Zhu, J.G.; Guo, W.L.; Lu, Y.Y. Experimental study on compaction characteristics of coarse-grained materials based on gradation equation. Rock Soil Mech. 2020, 41, 214–220. [Google Scholar]
  20. Sukkarak, R.; Pramthawee, P.; Jongpradist, P.; Kongkitkul, W.; Jamsawang, P. Deformation analysis of high CFRD considering the scaling effects. Geomech. Eng. 2018, 14, 211–224. [Google Scholar]
  21. Shibuya, S.; Uemoto, Y.; Hashimoto, Y.; Kawajiri, S. Effects of grain size distribution characteristics on compaction and deformation-strength characteristics of gravelly fill materials. In Deformation Characteristics of Geomaterials: Proceedings of the Fifth International Symposium on Deformation Characteristics of Geomaterials, IS-Seoul 2011, 1-3 September 2011, Seoul, Korea; IOS Press: Amsterdam, The Netherlands; Fairfax, VA, USA, 2011; p. 411. [Google Scholar]
  22. Zhou, M.; Lyu, Z.G.; Di, R.H.; Li, Y. BP neural network modeling based on small sample data. Sci. Technol. Eng. 2022, 22, 2754–2760. [Google Scholar]
  23. Lin, Z.X.; Ou, B.; Wang, Y.; Gao, L. Study on predicting mechanical indices of clay materials using improved RBF method. J. Yunnan Agric. Univ. (Nat. Sci.) 2011, 26, 277–279+283. [Google Scholar]
  24. Chen, H.C.; Zhang, X.Y.; Chen, W.L.; Qiu, W.; You, Q.S. Research on compaction quality evaluation of rockfill dams based on binary butterfly optimization algorithm and feature selection under real-time monitoring. Water Resour. Hydropower Eng. 2021, 52, 230–237. [Google Scholar] [CrossRef]
  25. Liu, B.; Zhao, Y.; Wang, W.; Liu, B. Compaction Density Evaluation Model of Sand-Gravel Dam Based on Elman Neural Network with Modified Particle Swarm Optimization. Front. Phys. 2022, 9, 806231. [Google Scholar] [CrossRef]
  26. Yao, Y.; Hu, T.; Fu, J.X.; Hu, S. Regression modeling and multi-objective optimization for small-sample dispersed data. J. Shanghai Univ. (Nat. Sci. Ed.) 2022, 28, 451–462. [Google Scholar]
  27. Fuller, W.B.; Thompson, S.E. The laws of proportioning concrete. Trans. Am. Soc. Civ. Eng. 1907, 59, 67–143. [Google Scholar] [CrossRef]
  28. Talbot, A.N.; Brown, H.A.; Richart, F.E. The Strength of Concrete: Its Relation to the Cement Aggregates and Water. Master’s Thesis, University of Illinois, Champaign, IL, USA, 1923. [Google Scholar]
  29. Swamee, P.K.; Ojha, C.S.P. Bed-load and suspended-load transport of nonuniform sediments. J. Hydraul. Eng. 1991, 117, 774–787. [Google Scholar] [CrossRef]
  30. Zhu, J.G.; Guo, W.L.; Wang, Y.L.; Wen, Y.F. Grading equation and its applicability for continuously graded soils. Chin. J. Geotech. Eng. 2015, 37, 1931–1936. [Google Scholar]
  31. DL/T 5356-2014; Test Code for Coarse-Grained Soils in Hydropower and Water Conservancy Engineering. China Electric Power Press: Beijing, China, 2014.
  32. Guo, W.L.; Zhu, J.G.; Wen, Y.F. Unified explanation of four gradation scaling methods for coarse-grained materials. Chin. J. Geotech. Eng. 2016, 38, 1473–1480. [Google Scholar]
  33. Huang, J.Y.; Bai, J.Q.; Xian, Y.H. DOD-LN-GPR model-based SOH estimation method for lithium-ion batteries. Acta Energiae Solaris Sin. 2025, 46, 60–69. [Google Scholar] [CrossRef]
  34. Akbari, M.A.; Zare, M.; Azizipanah-Abarghooee, R.; Mirjalili, S.; Deriche, M. The cheetah optimizer: A nature-inspired metaheuristic algorithm for large-scale optimization problems. Sci. Rep. 2022, 12, 10953. [Google Scholar] [CrossRef]
  35. Wang, L.J.; Wang, Y.X.; Zhang, K.N.; Li, H.Y.; Zhang, W.X.; Zuo, S.K.; Lei, Z. Photovoltaic Power Prediction Based on Weather Scenario Dynamic Recognition Using CO-MHA-LSTM Model. South. Power Syst. Technol. 2025, 1–13. Available online: https://link.cnki.net/urlid/44.1643.TK.20250623.0911.012 (accessed on 21 September 2025).
  36. Wang, Y.X.; Cui, L.Q.; Tian, P.; Qin, K.; Zeng, X.L. Research on ECT image reconstruction method based on simulated annealing particle swarm optimization algorithm. Chin. J. Sens. Actuators 2024, 37, 484–491. [Google Scholar]
  37. Shao, L.S.; Wang, Z.; Li, C.M. Mine ventilation optimization algorithm based on simulated annealing and improved particle swarm optimization. J. Syst. Simul. 2021, 33, 2085–2094. [Google Scholar] [CrossRef]
  38. Meng, X.T.; Wang, W.; Xiang, Z. Dynamic compensation method for FOG navigation system based on particle swarm optimization and simulated annealing algorithm. Infrared Laser Eng. 2014, 43, 1555–1560. [Google Scholar]
  39. Hafez, A.A.; Abdelaziz, A.Y.; Hendy, M.A.; Ali, A.F. Optimal sizing of off-line microgrid via hybrid multi-objective simulated annealing particle swarm optimizer. Comput. Electr. Eng. 2021, 94, 107294. [Google Scholar] [CrossRef]
  40. Breiman, L. Random forests. Mach. Learn. 2001, 45, 5. [Google Scholar] [CrossRef]
  41. Sun, C.; Hu, R.Z.; Wu, Z.X.; Liu, N.S.; Ding, J.J. Research on Mixed Gas Detection Method Based on KNN-SVM. Spectrosc. Spectr. Anal. 2025, 45, 117–124. [Google Scholar]
  42. Wang, Y.; Shi, L.; Hu, X.; Song, W.; Wang, L. Multiphysics–informed neural networks for coupled soil hydrothermal modeling. Water Resour. Res. 2023, 59, e2022WR031960. [Google Scholar] [CrossRef]
Figure 1. Schematic diagram of the parallel gradation method.
Buildings 15 03910 g001
Figure 2. Schematic diagram of the gradation curve area.
Buildings 15 03910 g002
Figure 3. Flowchart of the optimized Gaussian process regression model for predicting sandy gravel compaction density using intelligent algorithms.
Buildings 15 03910 g003
Figure 4. Schematic diagram of the simulated annealing algorithm principle.
Buildings 15 03910 g004
Figure 5. Standard cross-section of the concrete-faced sand-gravel dam at Altaş Hydraulic Complex.
Buildings 15 03910 g005
Figure 6. Prototype and scaled gradation curves of sand-gravel dam materials.
Buildings 15 03910 g006
Figure 7. Comparison of evaluation metrics for different models.
Buildings 15 03910 g007
Figure 8. Comparison of maximum dry density prediction accuracy among different evaluation models.
Buildings 15 03910 g008
Figure 9. Comparison of minimum dry density prediction accuracy among different evaluation models.
Buildings 15 03910 g009
Table 1. Gradation characteristic parameters of sand-gravel dam materials.
No.dmax
/(mm)
P5
/(%)
m/(-)b/(-)S/(-)ρdmax
/(g·cm−3)
ρdmin
/(g·cm−3)
16037.570.299−0.2840.7092.3911.999
26037.040.311−0.2360.7072.4022.004
36035.730.3710.0030.7052.4152.017
46034.330.4300.1600.7012.4142.023
56032.810.4920.2840.6952.4132.009
66031.130.5620.3890.6882.4022.007
76029.360.6420.4830.6812.3981.994
86027.470.7380.5700.6732.3911.978
96025.480.8500.6480.6652.3691.970
Table 2. Comparison of Model Evaluation Metrics.
Model TypeCO–SA–GPRCO–SA–RFCO–SA–SVMCO–SA–ANN
R2RMSER2RMSER2RMSER2RMSE
ρdmax0.97520.00220.92510.00380.90960.00420.90800.0042
ρdmin0.97140.00280.96740.00290.96920.00290.95350.0035
Disclaimer/Publisher’s Note: The statements, opinions and data contained in all publications are solely those of the individual author(s) and contributor(s) and not of MDPI and/or the editor(s). MDPI and/or the editor(s) disclaim responsibility for any injury to people or property resulting from any ideas, methods, instructions or products referred to in the content.