Article

Measurement of Dynamic Response and Analysis of Characteristics of Heavy-Haul Railway Tunnel Bottom Structure Under Train Loading

1
Beijing MTR Construction Administration Corporation, Beijing 100068, China
2
Beijing Key Laboratory of Fully Automatic Operation and Safety Monitoring for Urban Rail Transit, Beijing 100068, China
3
Beijing Infrastructure Investment Co., Ltd., Beijing 100101, China
4
Department of Civil Engineering, Tsinghua University, Beijing 100084, China
5
Key Laboratory of Urban Underground Engineering of Ministry of Education, Beijing Jiaotong University, Beijing 100044, China
*
Author to whom correspondence should be addressed.
Buildings 2025, 15(21), 3880; https://doi.org/10.3390/buildings15213880
Submission received: 18 September 2025 / Revised: 14 October 2025 / Accepted: 24 October 2025 / Published: 27 October 2025
(This article belongs to the Section Building Structures)

Abstract

This study investigates the dynamic response characteristics of the tunnel bottom structure, focusing on a heavy-haul railway tunnel. To assess the condition of the tunnel bottom, geological radar and drilling core techniques were employed, along with on-site dynamic testing. The dynamic stress and acceleration response characteristics of the tunnel bottom structure, situated in grade V surrounding rock, were analyzed under axle loads of 25 t, 27 t, and 30 t. Both time-domain and frequency-domain analyses were conducted to explore the impact of structural defects on the dynamic response of the tunnel bottom. The results indicate that the dynamic response of the tunnel bottom structure increases linearly with increasing train axle load. In the presence of void-related defects at the tunnel bottom, the dynamic response of the structure is amplified, with an observed growth rate of up to 26.3%. Furthermore, the load exerted by heavy-duty trains on the tunnel bottom structure is predominantly a low-frequency effect, concentrated within the range of 0–20 Hz. Analysis of the 1/3 octave band reveals that the maximum difference in acceleration levels occurs at a center frequency of 31.5 Hz. Additionally, as the distance between the measurement point and the vibration source increases, the dynamic response induced by the void defect on the tunnel bottom structure weakens.

1. Introduction

Heavy haul railways have become the preferred method for transporting bulk goods globally, owing to their advantages of large capacity, low energy consumption, and cost-efficiency [1]. However, the axle load, number of train formations, and annual transport volume of modern heavy-duty trains have far surpassed the original design parameters, leading to the presence of defects in many heavy-duty railway tunnels. Specifically, the tunnel bottom structure, as the primary carrier of train loads, is particularly susceptible to safety hazards [2,3]. Therefore, studying the dynamic response of tunnel bottom structures under heavy train loads is of significant practical importance for assessing the long-term stability of these structures.
Existing research on the dynamic response of railway structures under train-induced vibration primarily focuses on the subgrade, bridges, and road bridge transition sections. Nie et al. [4] conducted field measurements on the transition section of the Shuohuang Railway, finding that the vibration frequency of the roadbed predominantly falls within the 0–20 Hz range. LI et al. [5] conducted similar measurements on a railway subgrade in Baotou City, monitoring acceleration data from the track, sleepers, and embankment, and explored the diffusion characteristics of ground vibration along the center axis of the track. Guo et al. [6] performed on-site tests on the dynamic load characteristics of railway bridge piers under varying vehicle speeds and axle loads, analyzing the dynamic load curves from both time and frequency domains. Chen et al. [7] studied traditional gravel roadbeds in the northern foothills of the Qinghai–Tibet Railway and discovered a significant attenuation effect in the transmission of dynamic loads from the shoulder to the base of the slope. Mei et al. [8] carried out dynamic testing on the transition section of a road and bridge, investigating the variation in dynamic displacement along the track and slope and found that peak dynamic displacement at the roadbed shoulder followed a normal distribution. Ribeiro et al. [9] conducted dynamic tests on trains traveling at 220 km/h and found that wedge-shaped steel rails in the transition section exhibited a more gradual dynamic response compared to steel rails above the roadbed. LI et al. [10] analyzed ground vibrations caused by high-speed trains passing over elevated bridges, examining the effects of varying train speeds and soil damping ratios on ground vibration.
While these studies provided valuable insights into the dynamic response of roadbeds, bridges, and transition sections, they did not address the dynamic behavior of tunnel structures. Tunnels, as integral components of railway lines, exhibit more complex vibration characteristics, and due to their specific design and construction, on-site testing in tunnels presents greater challenges [11,12,13]. Only a few studies have investigated the dynamic response of tunnel bottom structures under train loads. Mandal et al. [14] and Jeon et al. [15] have reported that the tunnel structure will be strongly squeezed by the large tectonic stress, when the tunnel is located in the weak surrounding rock. Nejati et al. [16] took Tehran Metro Line 4 as an example, applied the dynamic load to the tunnel as a point load, and studied the ground vibration caused by the train vibration. Takemiya et al. [17] proposed a simulation model to study the relationship between train vibration and train speed under the track. Andersen et al. [18] tried to compare the response differences between the 2D model and the 3D model, and concluded that the 3D model is more accurate for absolute prediction of train-induced vibration, while the 2D model is only qualitatively feasible. Auersch [19] noted that the effect of train speed is always combined with the effect of reduced soil stiffness. Very soft soils result in lower train critical speeds and greater vibration of the track and ground compared to normal rigid soils. Indraratna et al. [20] through a series of undrained cyclic triaxial tests, found that the softening of sur-rounding rock is due to the upward migration of water and fine particles in the soil, which eventually leads to the softening and fluidization of the uppermost part of the soil sample. Du et al. [21,22] conducted on-site measurements at the Fuchuan Tunnel of the Lanzhou-Xinjiang high-speed railway, examining dynamic stress and vibration acceleration in the tunnel bottom arch structure at different train speeds. Ma et al. [23,24] investigated the changes in vibration acceleration and dynamic stress of tunnel foundation structures under three conditions: intact, damaged, and repaired, using on-site monitoring data. Zou et al. [25] carried out on-site testing to analyze the horizontal and vertical dynamic stress distributions of the bottom structure of heavy-duty railway tunnels under various axle loads and vehicle speeds. They found that the horizontal dynamic stress of the base structure was characterized by upward compression and downward tension, while the vertical dynamic stress was compressive. Wang et al. [26] studied the dynamic response and fatigue life of tunnel bottom structures subjected to softening and void formation in the surrounding rock through on-site testing and numerical simulations. Wang et al. [27] evaluated the effects of construction techniques, interlayer thickness, and train axle load on the dynamic characteristics of the Caomaoshan Tunnel, finding that the minimum safe distance between two tunnels was approximately 1.0 B.
Overall, while much of the existing research focuses on the dynamic characteristics of high-speed railways, primarily considering the influence of vehicle speed, there is comparatively less focus on the tunnel structures. Given that heavy-duty trains have higher axle loads, lower speeds, and distinct structural features compared to high-speed trains, their dynamic effects on tunnel bottom structures are characterized by greater amplitude and lower frequency [28]. Furthermore, none of the studies mentioned above address the dynamic response of tunnel bottom structures in the presence of structural defects. The defect rate of heavy-duty railway tunnels is 2.5 times higher than that of conventional railway tunnels, with defects primarily concentrated at the tunnel bottom [29]. In light of this, this study first investigates the diseases at the bottom of a heavy-duty railway tunnel and then conducts on-site dynamic testing to obtain vibration acceleration and vertical dynamic stress responses of the tunnel bottom structure under normal and void conditions, subjected to 25 t, 27 t, and 30 t axle loads. The dynamic response characteristics of the tunnel bottom structure are analyzed from both time-domain and frequency-domain perspectives.

2. Field Measurement

2.1. Survey Point Engineering Overview

The subject tunnel traverses a geologically complex zone characterized by frequent lithological variations. The rock mass exhibits well-developed fine and cross-bedding, coupled with low interlayer bonding strength. This condition is particularly pronounced in interbedded sequences of thin mudstone, shale, and sandstone, rendering these strata highly susceptible to spalling and delamination. The hydrogeological regime is equally complex, featuring an extensive and interconnected system of surface water and groundwater. Furthermore, the presence of confined aquifers with significant hydraulic connectivity is observed in certain sections. The tunnel site is situated in a mid-low mountainous terrain with a general topographic gradient descending from north to south and from east to west. The Standard for Engineering Classification of Rock Masses (GB/T 50218-2014) [30] provides the following definitions for poor-quality rock masses. Class IV, characterized by poor stability, is similar to Class III but is distinguished by a higher density of weak structural planes that can form fractured zones under 2.0 m in width. Locally, a crushed (cataclastic) structure is present, accompanied by significant groundwater activity. Class V rock mass is considered extremely unstable, typically comprising strongly to completely weathered rock that is heavily influenced by geological structures. Joints and fissures are extensively developed, and fault fracture zones are wider than 2.0 m, with fractures commonly filled with clay. Furthermore, groundwater activity is strong, leading to a notable water influx. Based on this standard, it was determined that Class IV and V rocks account for 70.4% of the tunnel’s total length, highlighting the overall poor quality of the surrounding rock mass. The tunnel is a double-track, heavy-duty railway structure, featuring a composite lining system throughout its entire cross-section. It comprises a left track for loaded freight trains and a right track for returning empty consists. Since its commissioning, the tunnel has manifested various structural defects, including, notably, mud pumping and foundation subsidence, as documented in Figure 1.

2.2. On Site Disease Detection

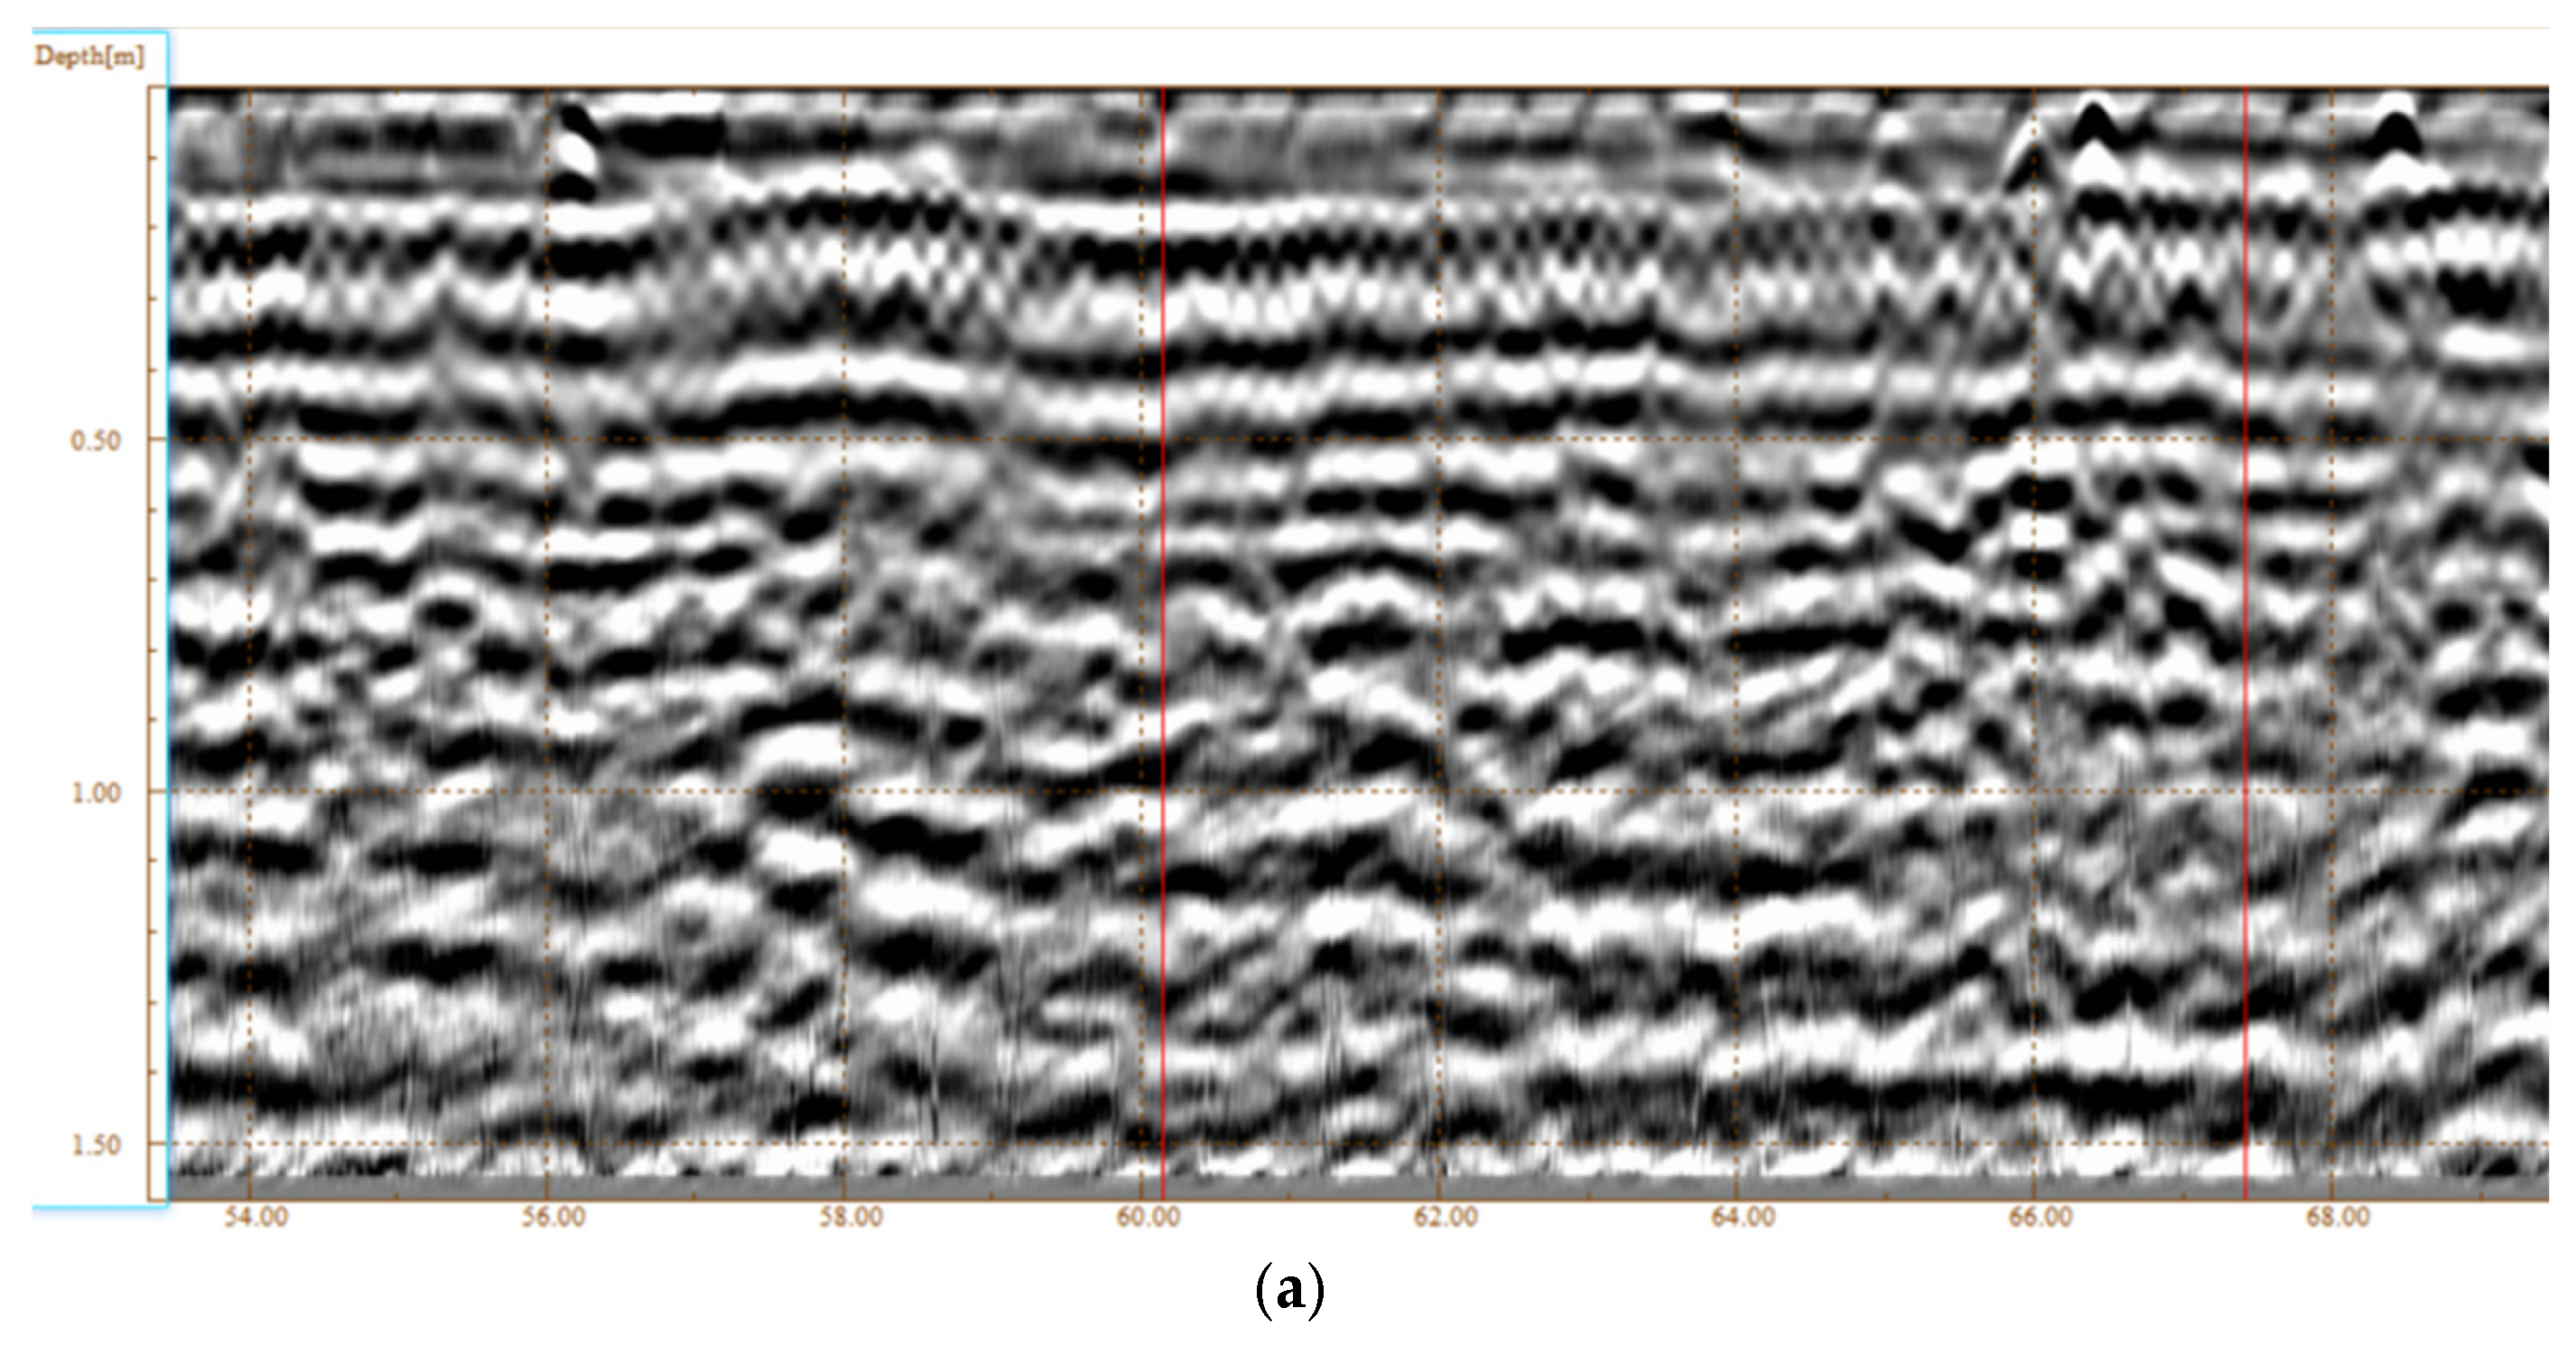
To conduct a comprehensive assessment of the tunnel’s structural distress, a detailed investigation of the tunnel foundation was performed using Ground Penetrating Radar (GPR) supplemented by core drilling. A representative GPR profile is presented in Figure 2, while the recovered core samples are documented in Figure 3. Three sets of core sampling were conducted on site to verify the rationality of radar detection. The investigation revealed significant defects within the inverted arch concrete structure. These defects are characterized by voids with typical heights ranging from 4 to 11 cm and lateral extents of 30 to 80 cm. The affected sections of the tunnel invert are compromised by a constellation of distress mechanisms, including fractured foundation concrete, void formation, and mud pumping (soil liquefaction and ejection). Critically, the thickness of the invert concrete at the sampled locations was found to be deficient, failing to meet the stipulated design specifications.

2.3. Dynamic Testing Content

To investigate the dynamic response of the tunnel foundation under train-induced vibration, a series of in situ dynamic tests were conducted with a primary focus on minimizing any potential damage to the original tunnel structure. Consequently, all measurement points were strategically installed on the surface of the bottom filling layer. During the tests, vertical dynamic stress and vertical acceleration were monitored on the surface of this base layer. These two key indicators were then employed to comparatively analyze the dynamic response characteristics of the foundation under two distinct service conditions: intact (fully operational) and empty (non-operational). The measurement of dynamic stress provides critical insights into the stress state within the foundation structure, whereas acceleration directly quantifies the intensity of vibration and impact imparted by the passing train. Collectively, these parameters are of significant guiding value for the safety assessment and performance evaluation of tunnel foundation structures.

2.4. Sensor Layout and Installation

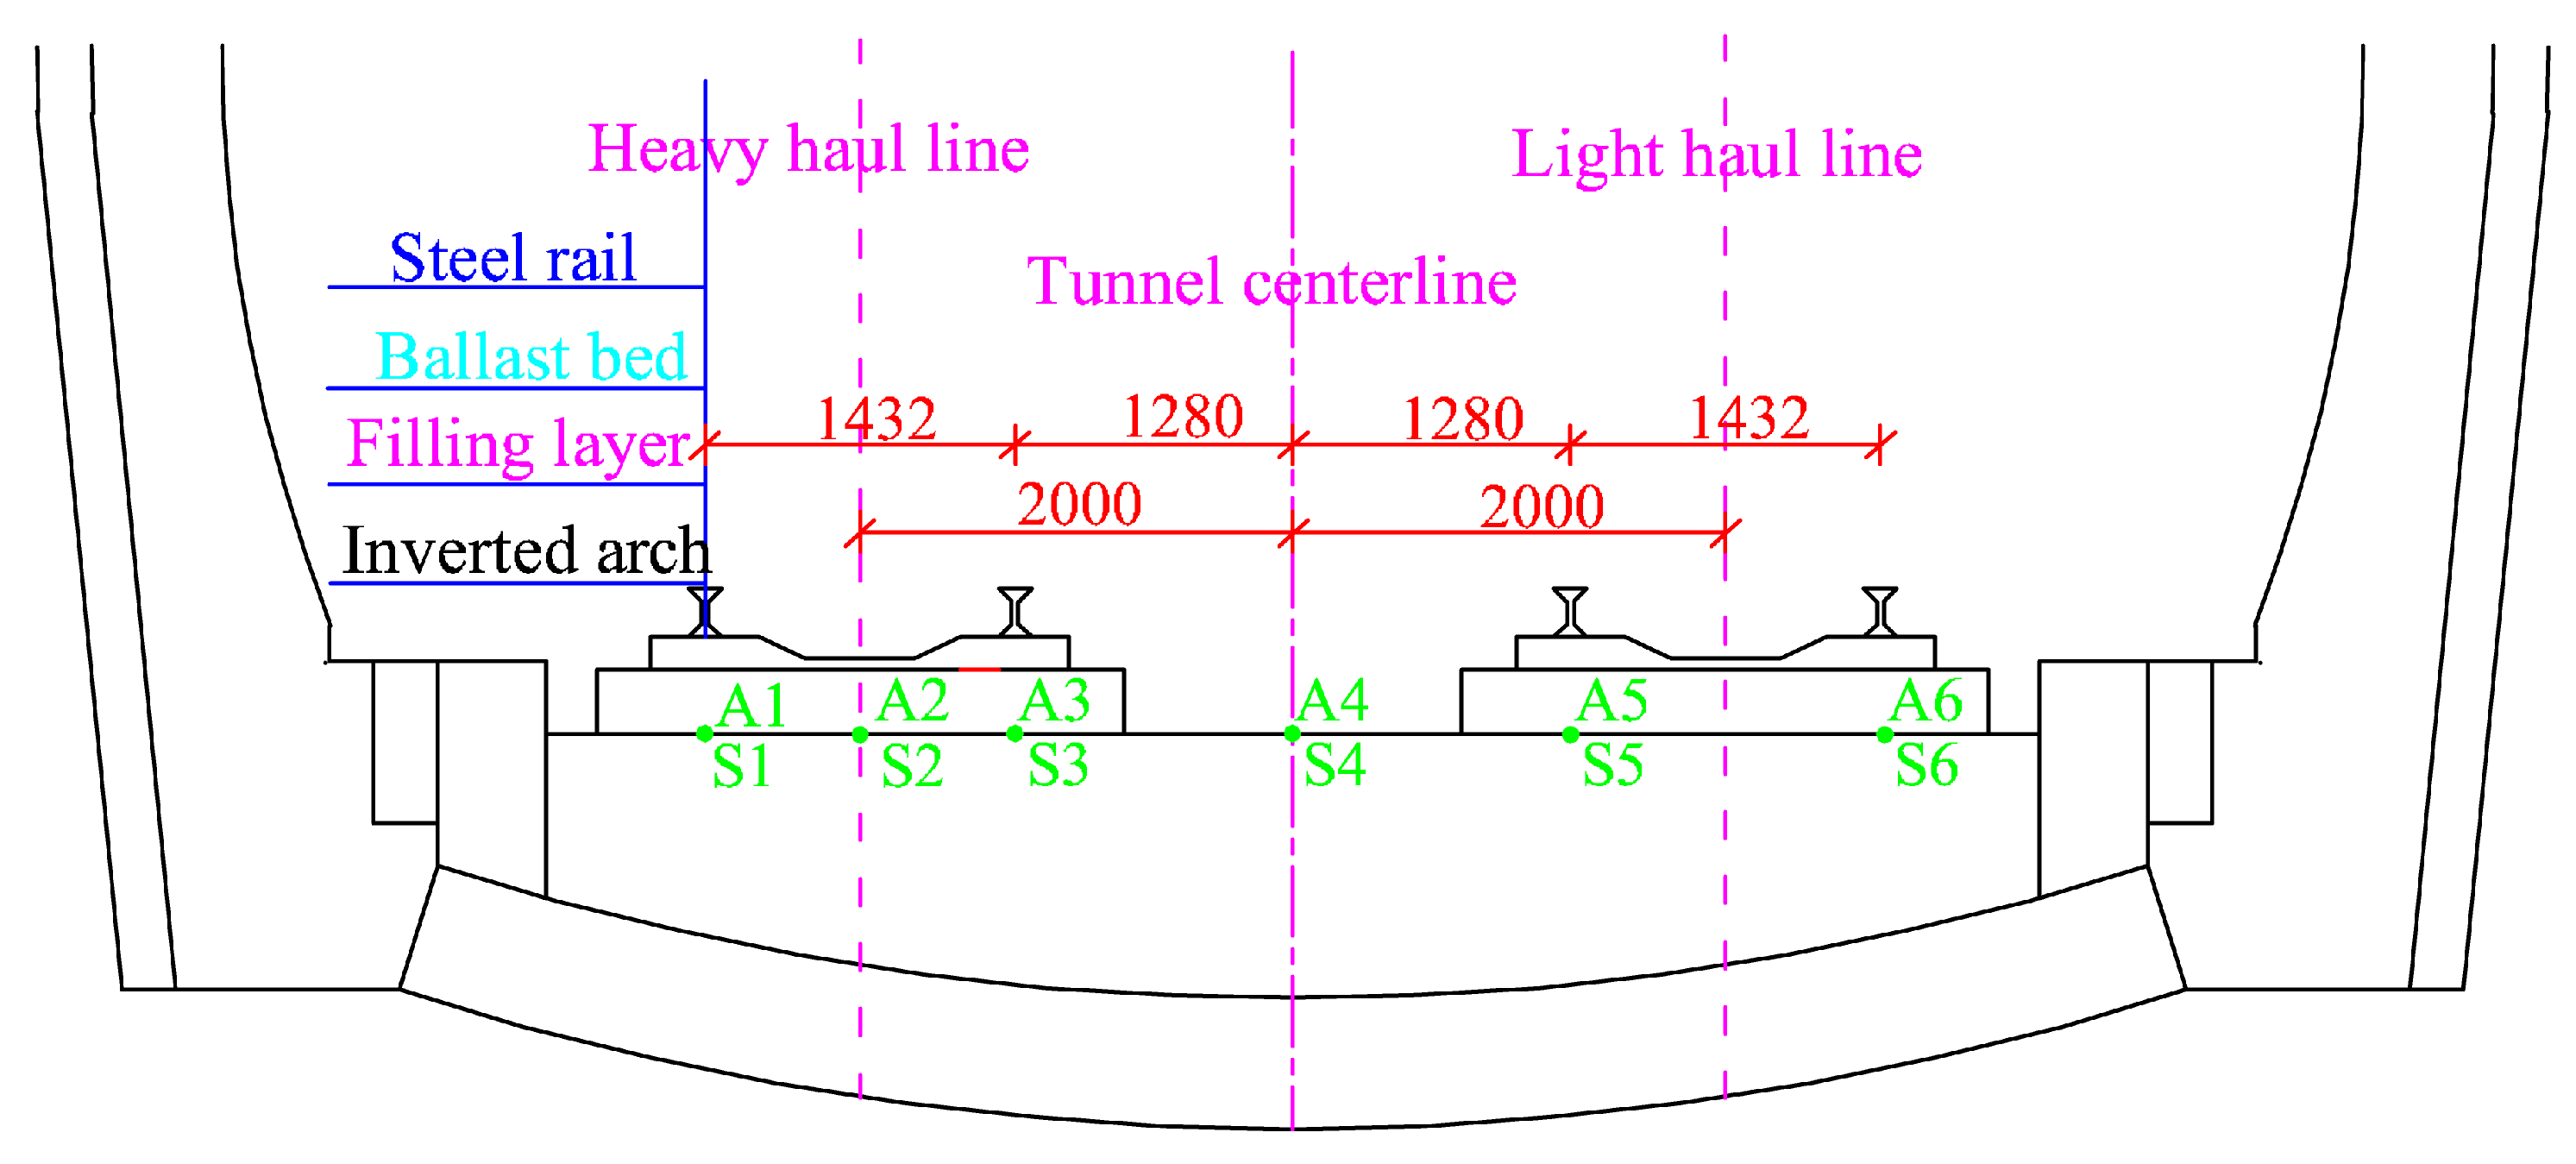
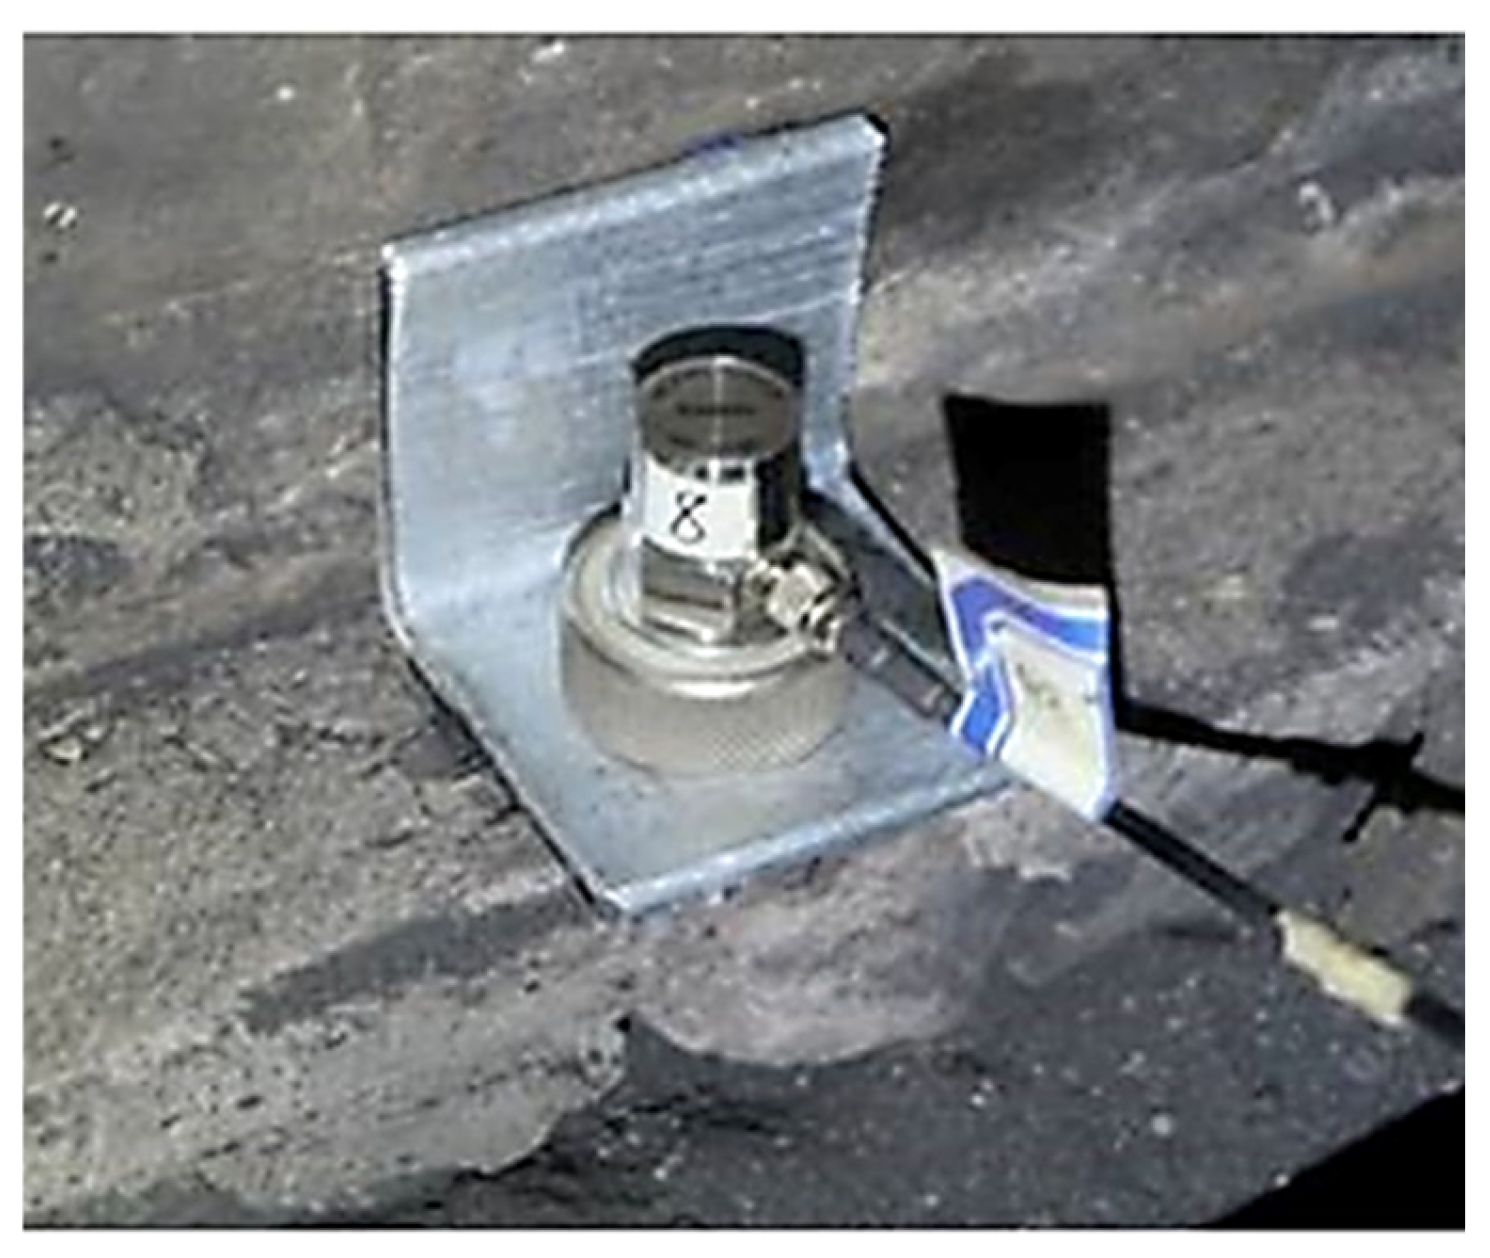
Two test sections were established to investigate the dynamic behavior of the tunnel foundation: one situated in an area of intact Grade-V surrounding rock, and the other in a region containing a void within the same rock classification. At each section, six measurement points were strategically deployed. These points were positioned directly beneath the left and right rails of the heavy-haul track, at the center of the heavy-haul track, along the tunnel centerline, and beneath the left and right rails of the adjacent non-operational (or empty) track. A schematic diagram of the sensor layout is presented in Figure 4, and a photograph of the on-site implementation is shown in Figure 5. The Digital Signal Processing (DSP) vibration testing system is selected for the on-site monitoring equipment. A fiber grating stress sensor with a range of 0.5 MPa is selected for the monitoring instrument. The vibration monitoring equipment is an IEPE piezoelectric acceleration sensor with a range of ±50 m/s2, a response frequency of 2~10,000 Hz, a resolution of 5 × 10⁻⁴ m/s2, and an installation resonance frequency greater than 35 Hz.

3. Analysis of Dynamic Stress Test Results

3.1. Time-Domain Dynamic Stress Response Characteristics
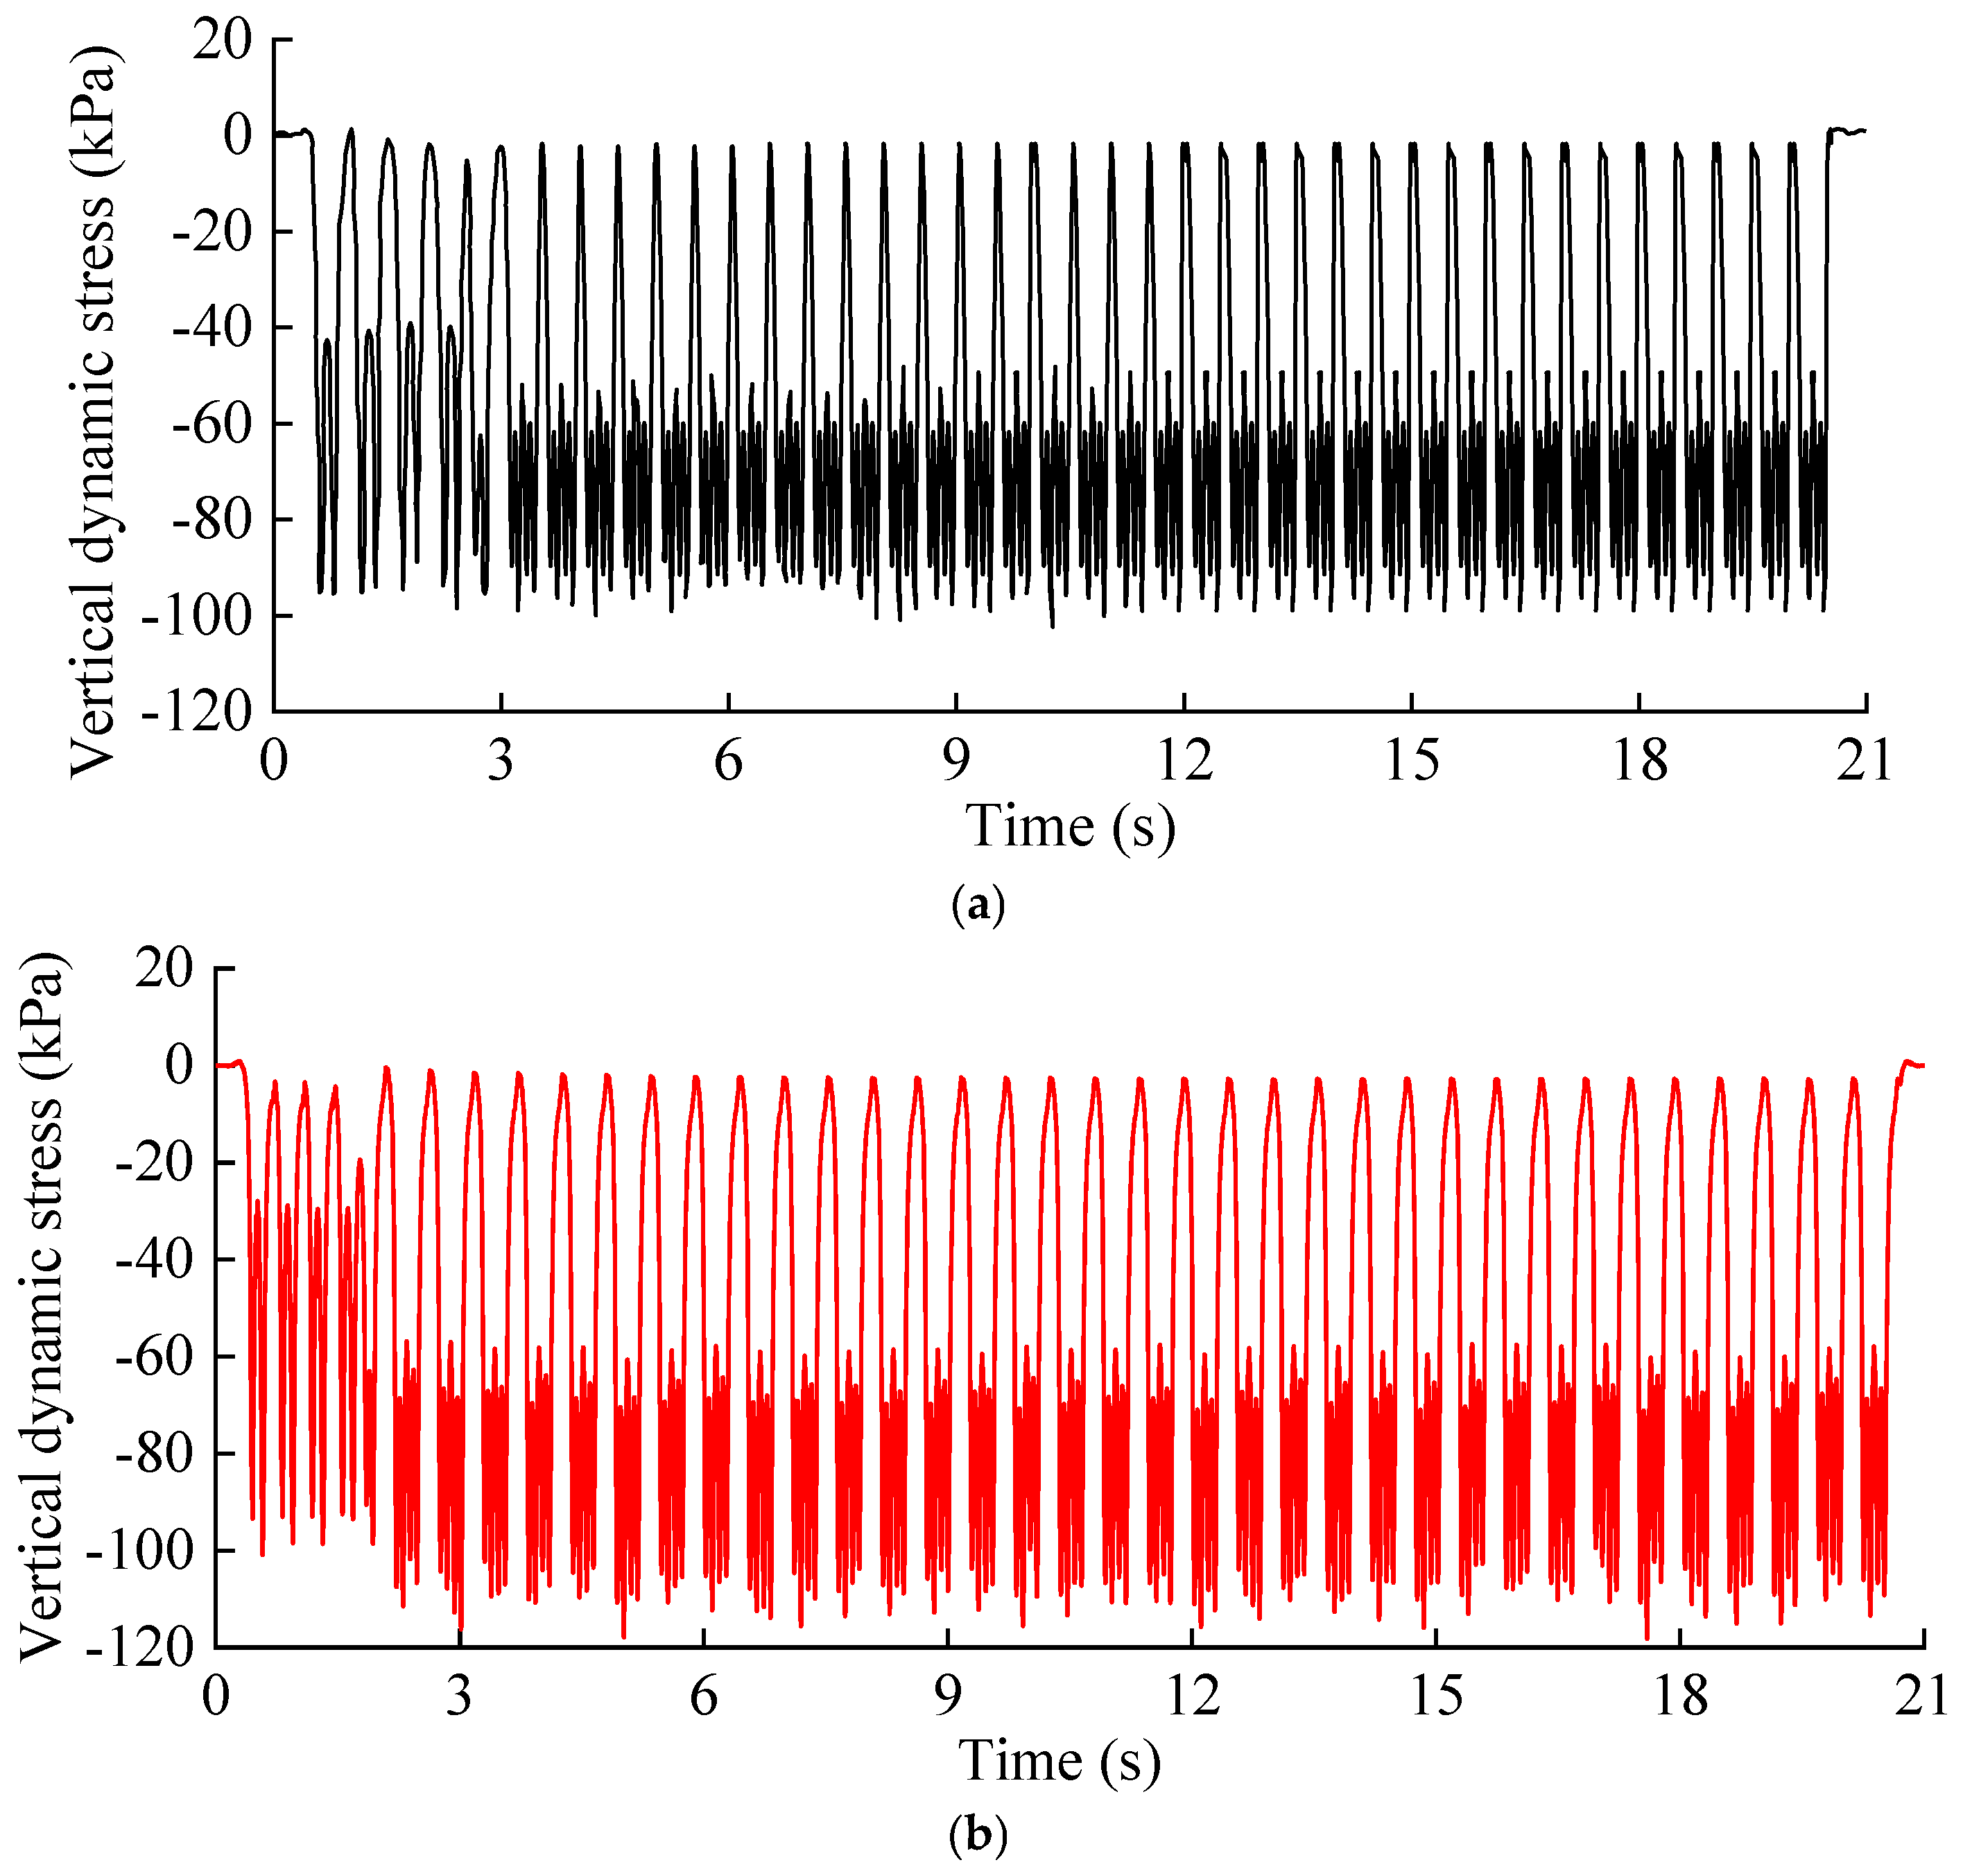
Figure 6 presents the time–history curves of vertical dynamic stress at measuring point S3 for both the intact and void sections of the tunnel foundation. These data were recorded under a train axle load of 27 t and a speed of 80 km/h. It is important to note that the dynamic stress was derived from the measured strain using the established stress–strain constitutive relationship. To facilitate a clear analysis of the response patterns, a representative 21 s segment of the recorded data is displayed.
As illustrated in Figure 6, the dynamic stress at the measurement point remains negligible prior to the train’s arrival, indicating that remote vibrations have a minimal impact on the foundation. A dramatic and rapid increase in dynamic stress is observed as the train passes over the point, characterized by intense fluctuations. The time–history curves exhibit a distinct periodicity, which corresponds directly to the sequential passage of the train’s wheelsets. The presence of a void defect does not alter the fundamental characteristics of the dynamic stress response; rather, its primary effect is to amplify the peak stress values.
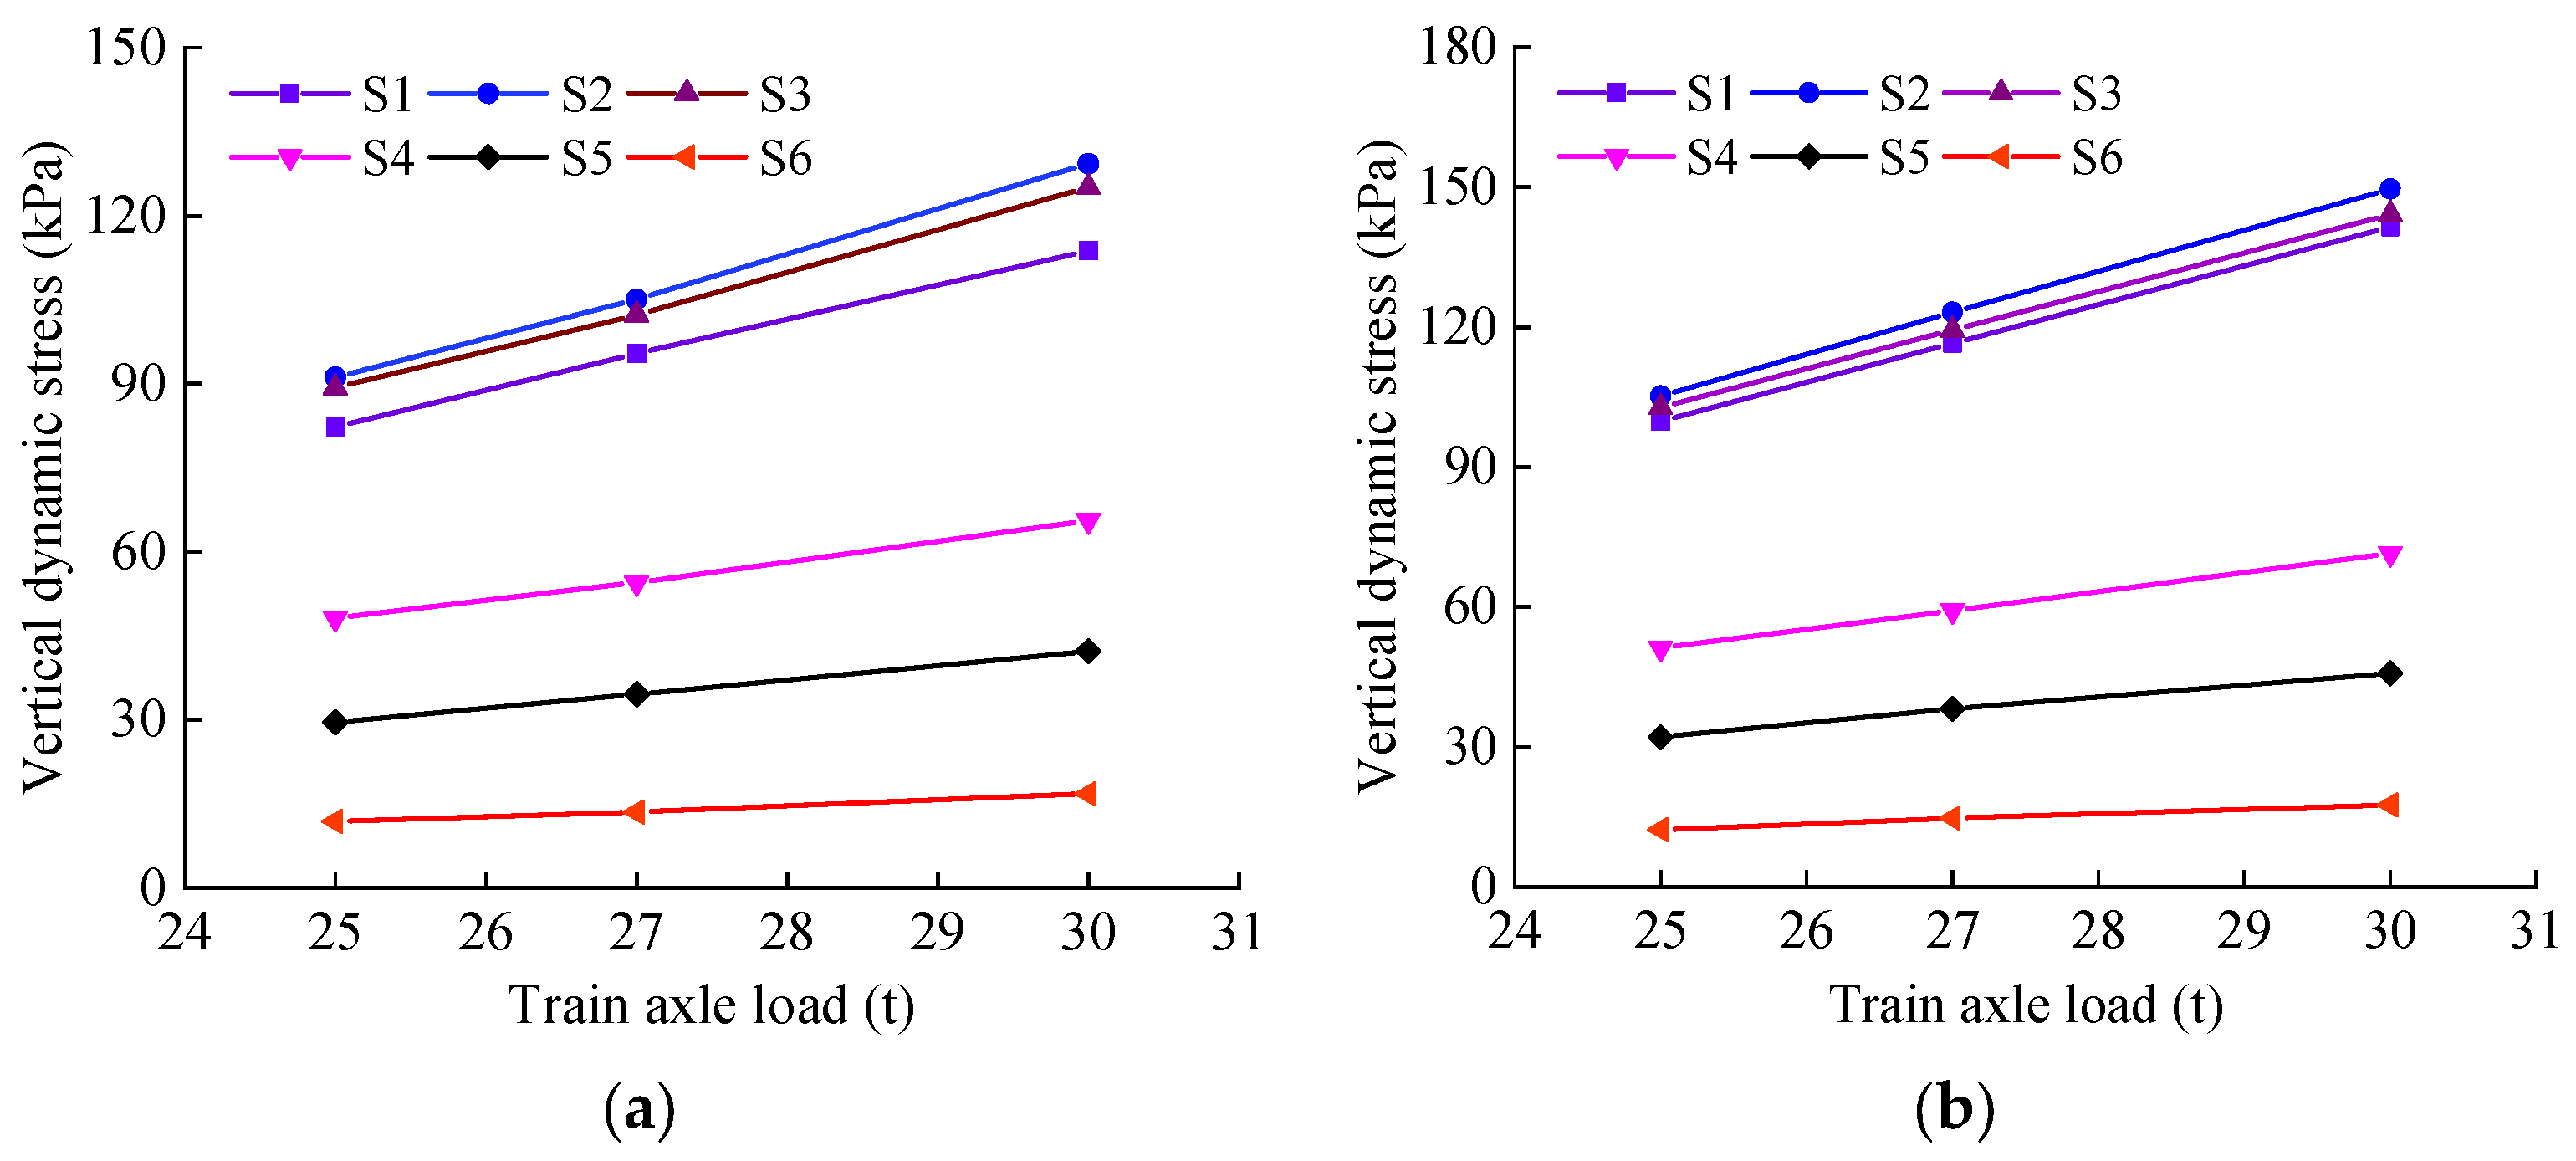
To investigate the effect of varying train axle loads on the dynamic stress response of the foundation structure within the Grade V surrounding rock, the peak dynamic stresses at all measuring points were extracted and are presented in Figure 7.
Figure 6. Time–history curves of vertical dynamic stress at measuring point S3: (a) Intact foundation section; (b) Foundation section with void.
Buildings 15 03880 g006
Figure 7. Peak dynamic stress on the filling layer surface under varying axle loads: (a) Intact section; (b) Section with void defect.
Buildings 15 03880 g007
As illustrated in Figure 7, several key observations can be made. First, the peak vertical dynamic stress induced by heavy-haul trains is significantly greater at all measuring points beneath the heavy-haul track compared to those beneath the adjacent empty track. The most pronounced stress concentration occurs directly beneath the center of the heavy-haul track. This phenomenon is attributed to the superposition of stress waves generated by the train loads on both rails as they propagate through the ballast and subgrade to the filling layer surface.
Second, the presence of a void defect substantially amplifies the dynamic stress response. This amplification effect is particularly evident under the heavy-haul track, whereas the response under the empty track remains relatively unaffected. For instance, under a 30 t axle load, the peak stress at point S1 (heavy-haul track) increases from 113.8 kPa in the intact section to 141.5 kPa in the defective section, marking a significant increase of 24.3%. In contrast, at point S5 (empty track), the stress only rises from 42.3 kPa to 45.8 kPa, a marginal increase of 8.3%. This disproportionate impact suggests that the long-term application of cyclic heavy-haul loads exacerbates the deterioration of the foundation structure, making it more susceptible to defects like voids.
A clear linear relationship is observed between the peak dynamic stress and the train axle load. Taking the defective section’s point S3 as an example, an increase in axle load from 25 t to 27 t resulted in a stress increase from 102.8 kPa to 119.4 kPa (a 16.1% rise). A further increase from 27 t to 30 t led to a stress escalation from 119.4 kPa to 144.2 kPa (a 20.8% rise). This linear trend is consistent across both intact and defective sections, but the defective section consistently exhibits higher stress magnitudes. For example, at point S2, the void defect caused stress increases of 15.4%, 17.2%, and 15.2% under axle loads of 25 t, 27 t, and 30 t, respectively, compared to the intact section. This further confirms that structural voids intensify the dynamic response of the tunnel foundation under all loading conditions.
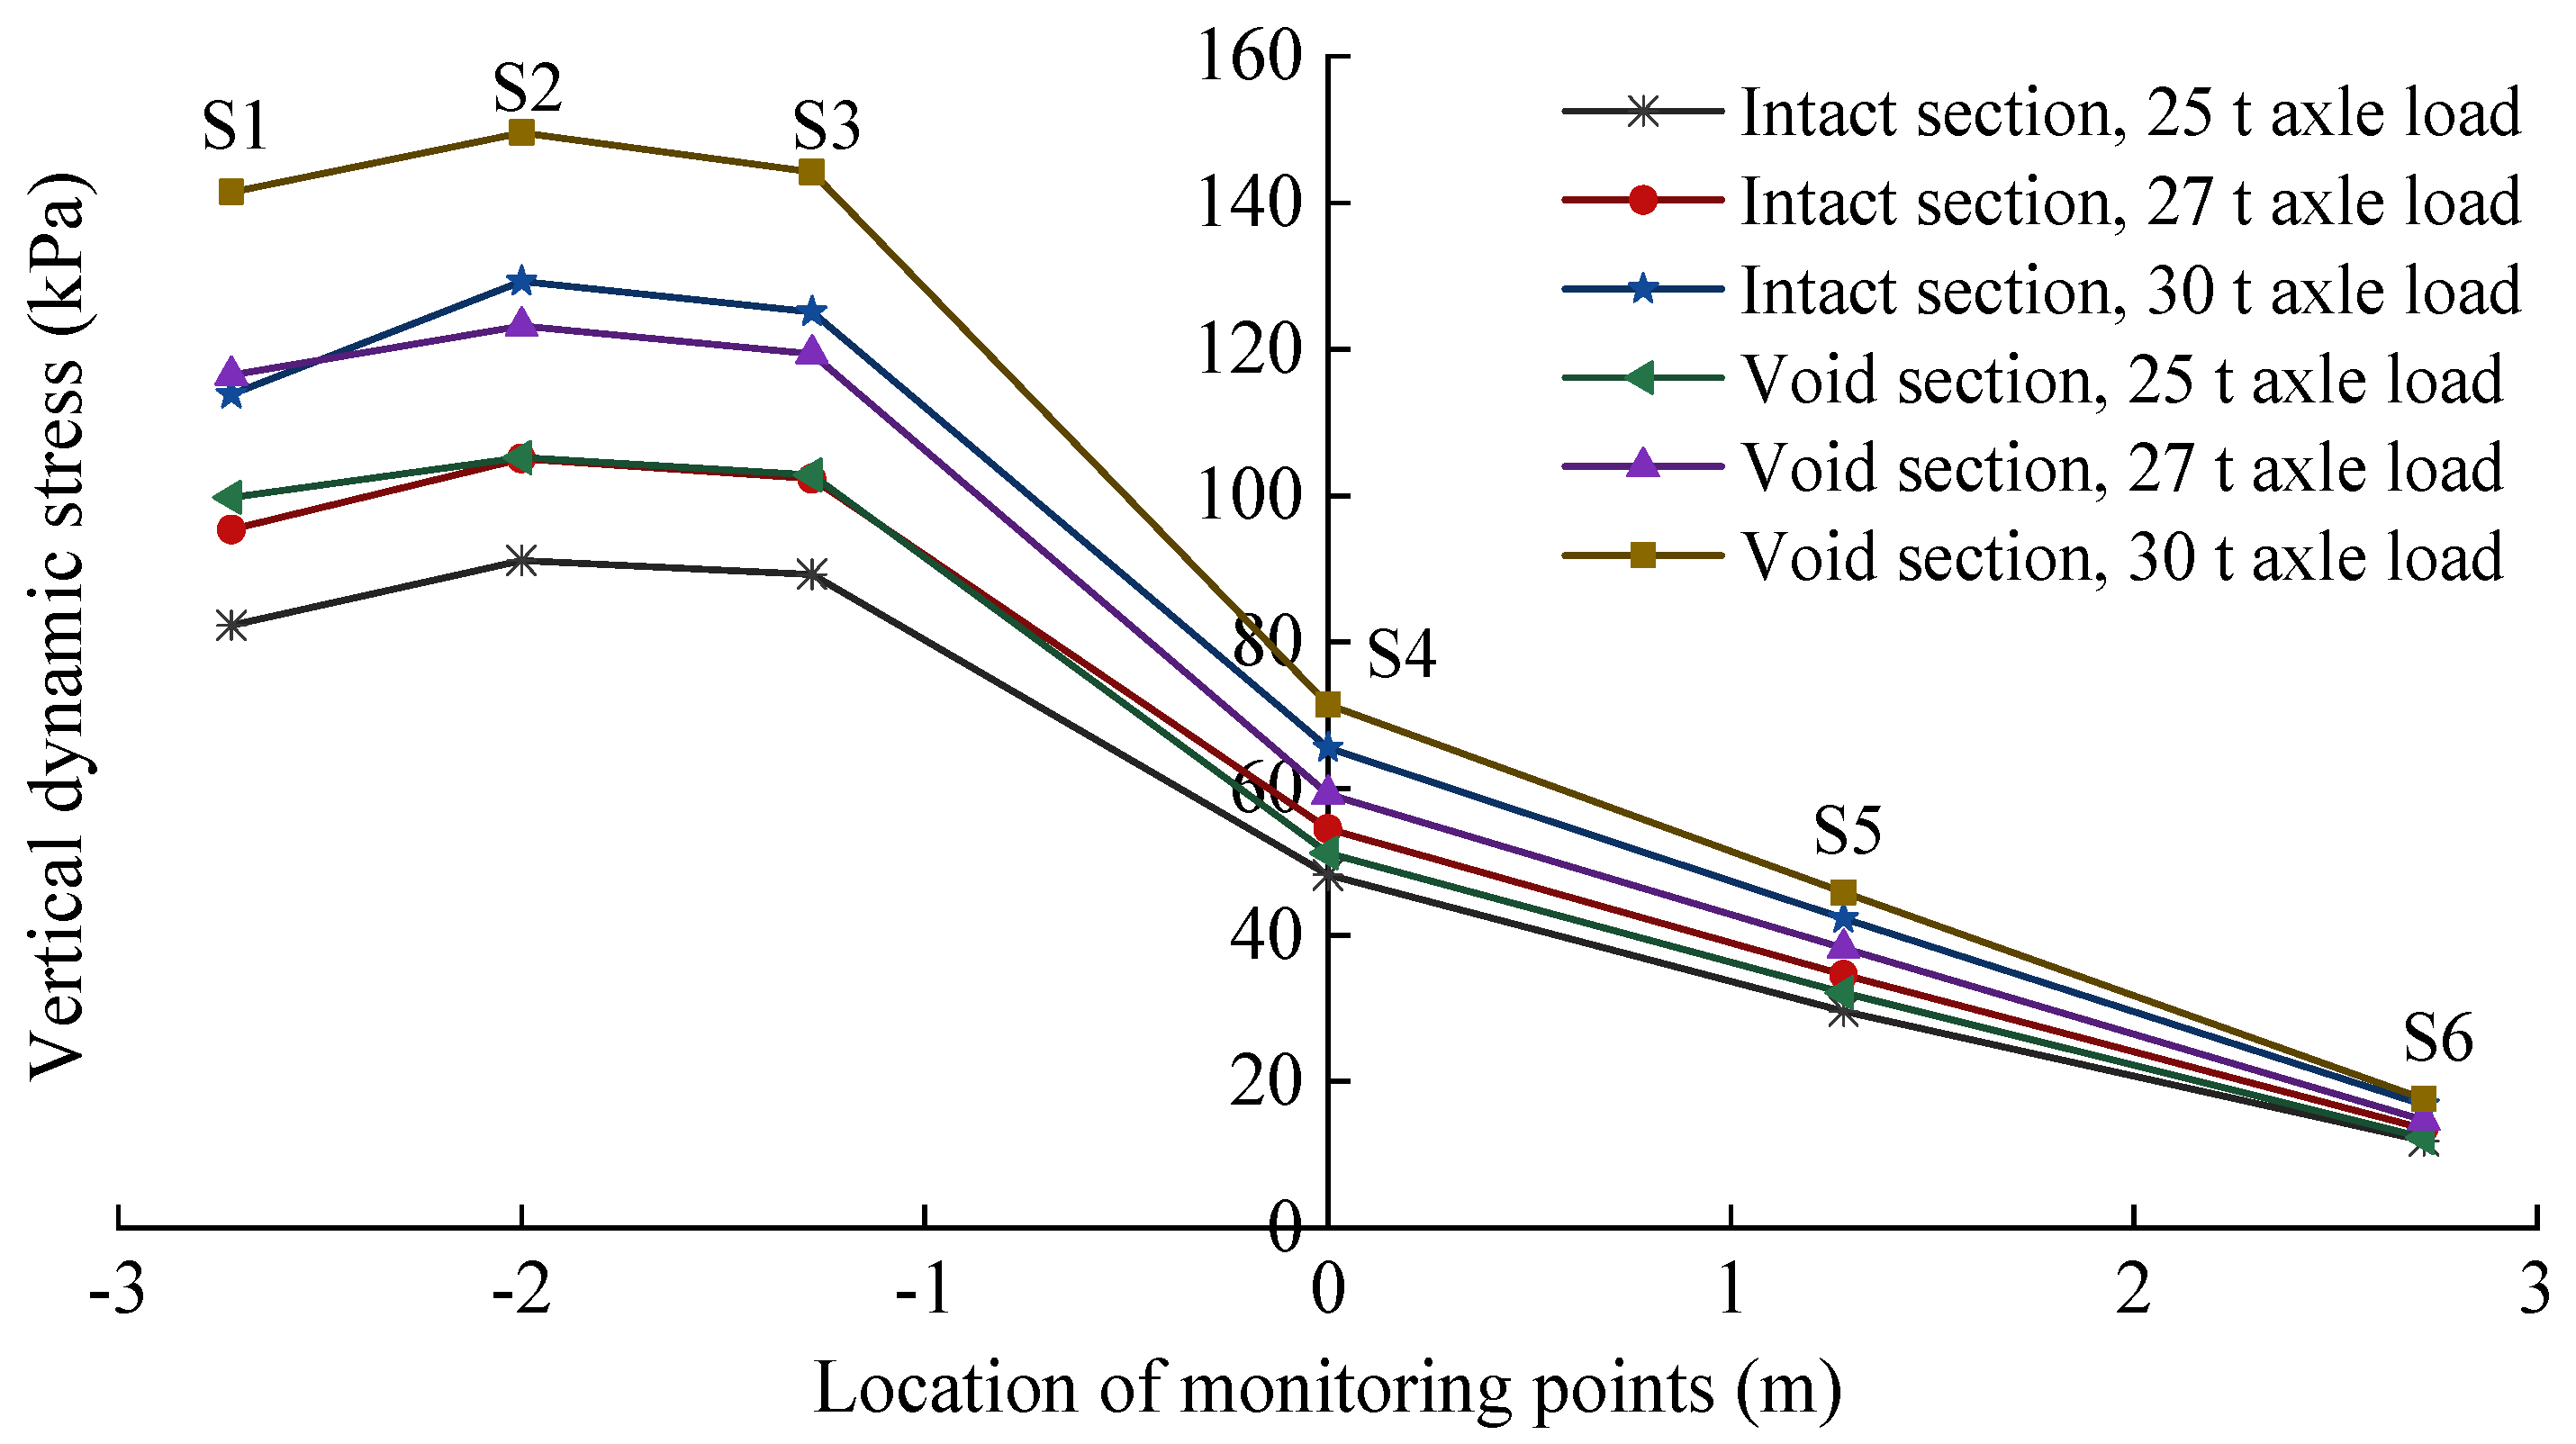
The lateral distribution of vertical dynamic stress across the filling layer surface is depicted in Figure 8, where the abscissa origin (0 m) corresponds to the tunnel centerline. The results reveal a consistent distribution pattern: the peak stress is located at the heavy-haul track center and dissipates symmetrically towards the tunnel sidewalls. Critically, the stress levels across the entire section are markedly elevated in the presence of a void defect, confirming its detrimental effect on the overall structural performance.

3.2. Frequency-Domain Dynamic Stress Response Characteristics
To elucidate the frequency-domain behavior of the dynamic stress, the Fast Fourier Transform (FFT) was applied to the time–history signals, converting them into frequency spectra for quantitative analysis. The primary excitation frequencies induced by a passing C80B gondola car, a typical heavy-haul freight vehicle, are determined by its characteristic axle and bogie spacing. These dominant frequencies, corresponding to different loading patterns, can be theoretically calculated as follows:
(1)
Frequency of Adjacent Vehicle Pairs: This frequency arises from the combined action of the rear bogie of a leading car and the front bogie of a following car, with a unit spacing of 12.0 m [4]:
f 1 = 80 × 1 3.6 × 12 = 1.8 5   Hz
(2)
Frequency of Adjacent Wheelsets within a Bogie: This is determined by the 1.83 m wheelset spacing within a single bogie:
f 2 = 80 × 1 3.6 × 1.83 = 12.14   Hz
(3)
Frequency of Inter-Car Bogie Pairs: This corresponds to the interaction between the rear bogie of a leading car and the front bogie of the following car, with a center-to-center distance of 3.8 m:
f 3 = 80 × 1 3.6 × 3.8 = 5.85   Hz
(4)
Frequency of Intra-Car Bogie Spacing: This is based on the distance between the centers of the two bogies within the same carriage, which is 8.2 m:
f 4 = 80 × 1 3.6 × 8.2 = 2.71   Hz
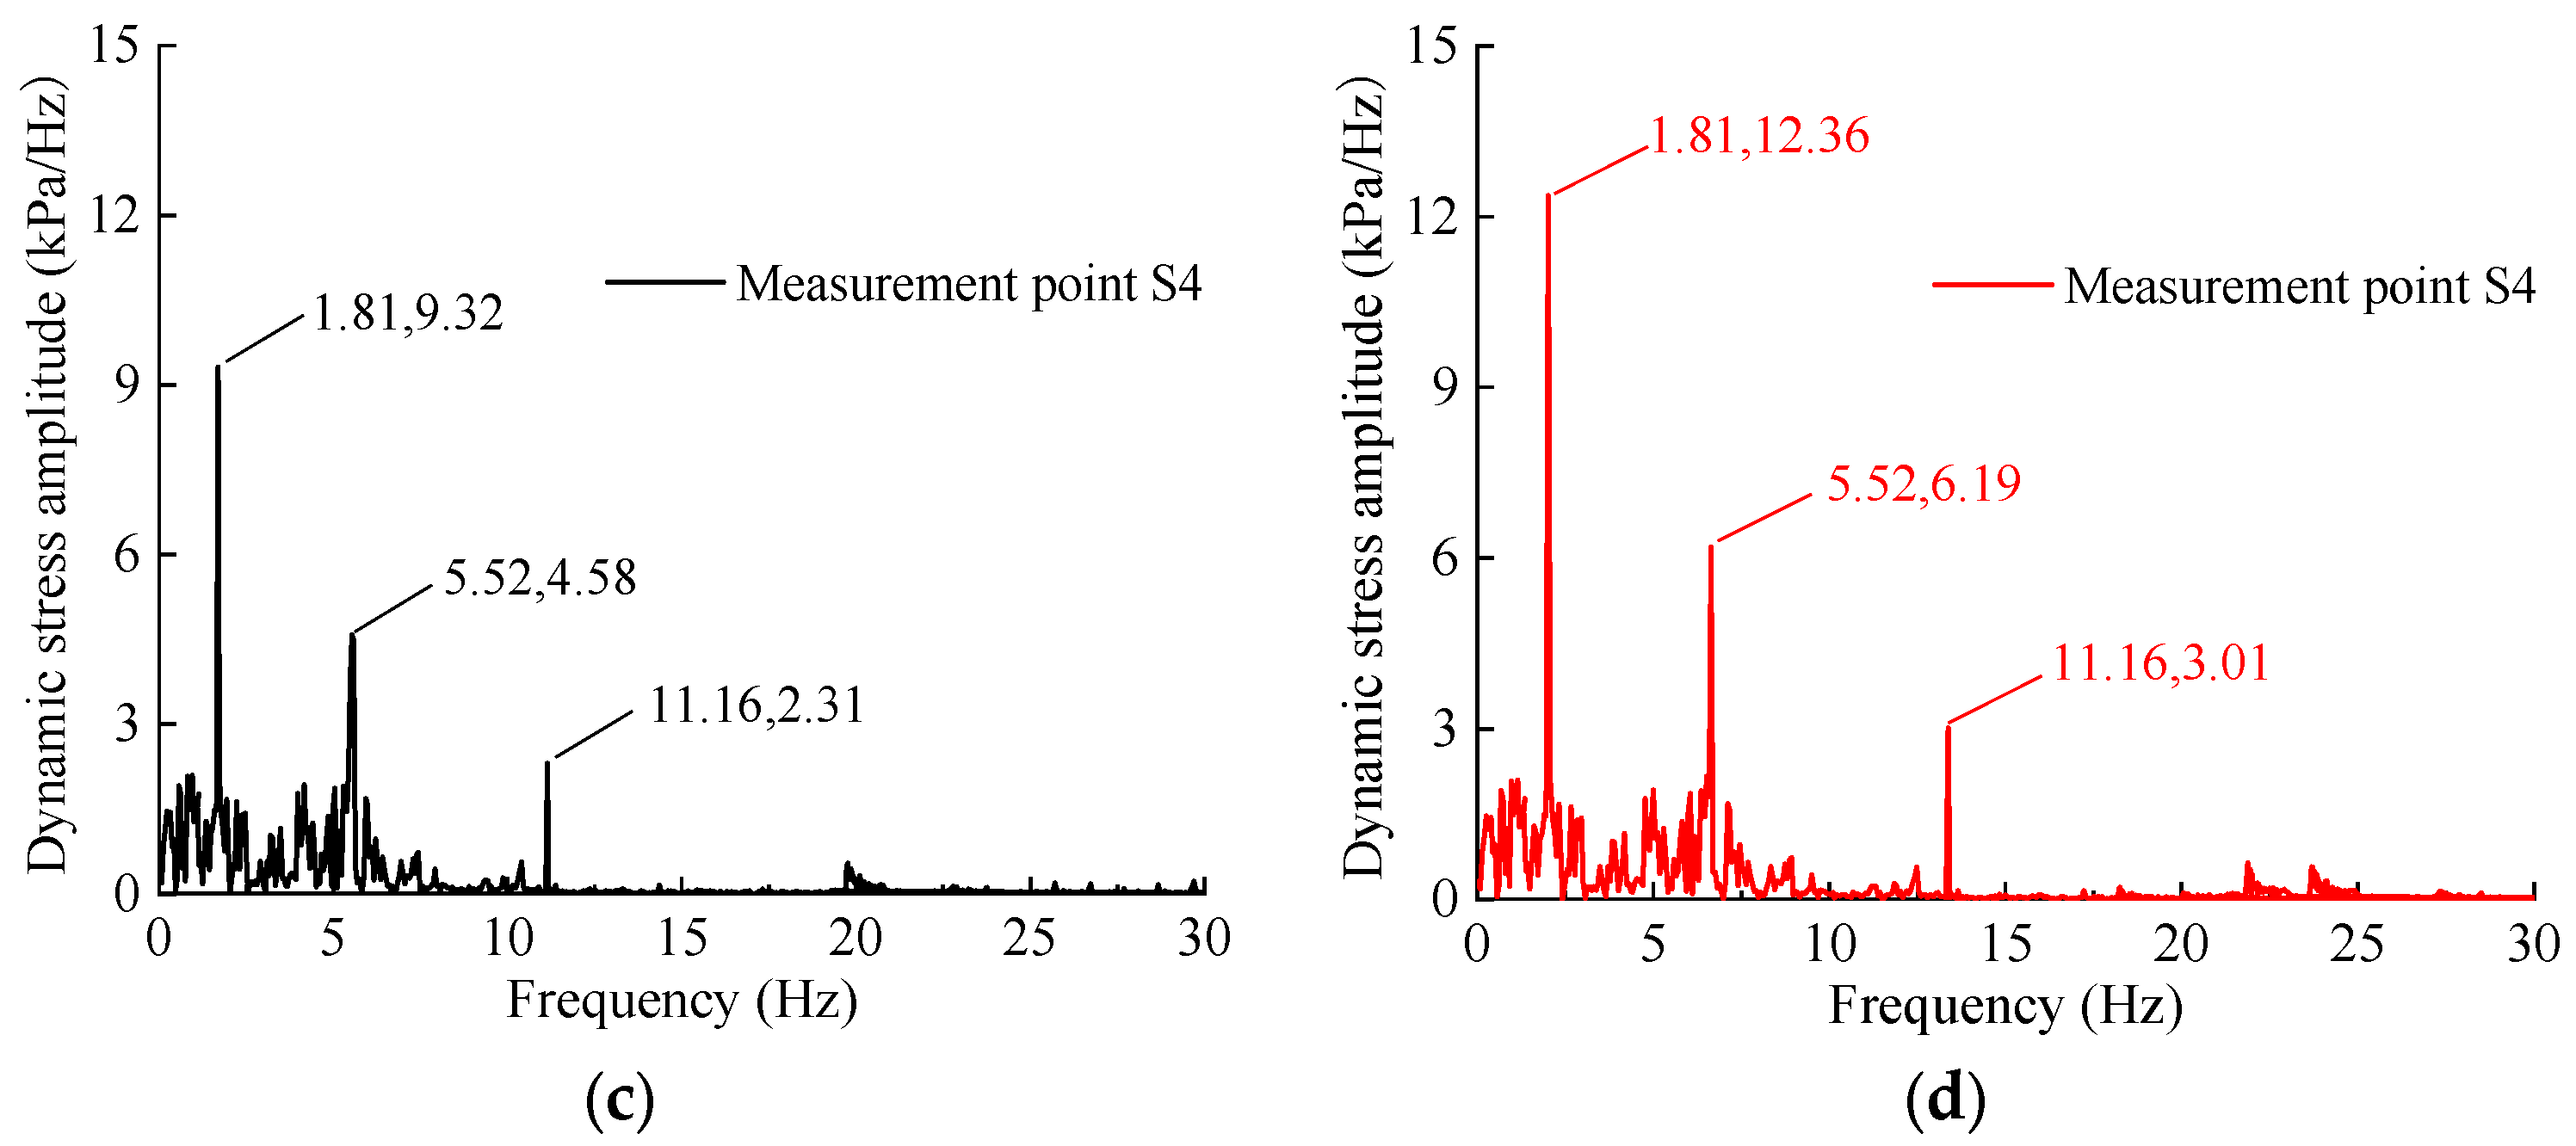
To validate these theoretical predictions, the vertical dynamic stress spectra for measuring points S2 and S4 in both intact and void-affected sections of the Grade V surrounding rock are presented in Figure 9.
As illustrated in Figure 9, the frequency-domain characteristics of dynamic stress are remarkably consistent across all measuring points on the filling layer surface under heavy-haul train loading. The response is dominated by low-order frequencies, with the spectral energy concentrated primarily within the 0–20 Hz band. This observation reveals a significant attenuation of vibration energy as it propagates through the track structure; specifically, the high-frequency components inherent in the rail and sleeper vibrations [28] are almost entirely dissipated before reaching the filling layer. This further corroborates that the dynamic impact of heavy-haul trains on the tunnel foundation is predominantly a low-frequency phenomenon.
Figure 9. Frequency spectra of vertical dynamic stress at measuring points S2 and S4: (a) S2, Intact section; (b) S2, Void section; (c) S4, Intact section; (d) S4, Void section.
Buildings 15 03880 g009aBuildings 15 03880 g009b
The frequency spectrum exhibits three distinct dominant frequencies at 1.81 Hz, 5.52 Hz, and 11.16 Hz, which correspond precisely to the calculated f 1 ( 1.85 ) , f 3 ( 5.85 ) and f 2 ( 12.14 ) excitation frequencies, respectively. The dynamic stress amplitude is greatest at the first dominant frequency (1.81 Hz), followed by the second (5.52 Hz) and third (11.16 Hz). Notably, this low-frequency dominance, particularly at 1.81 Hz, is attributed to the dynamic interaction between the bogies of adjacent carriages. This finding aligns with conclusions from previous research [31], confirming that this inter-carriage effect is the primary source of dynamic excitation for the tunnel foundation structure.

4. Analysis of Vibration Acceleration Results

4.1. Time-Domain Vibration Acceleration Response Characteristics

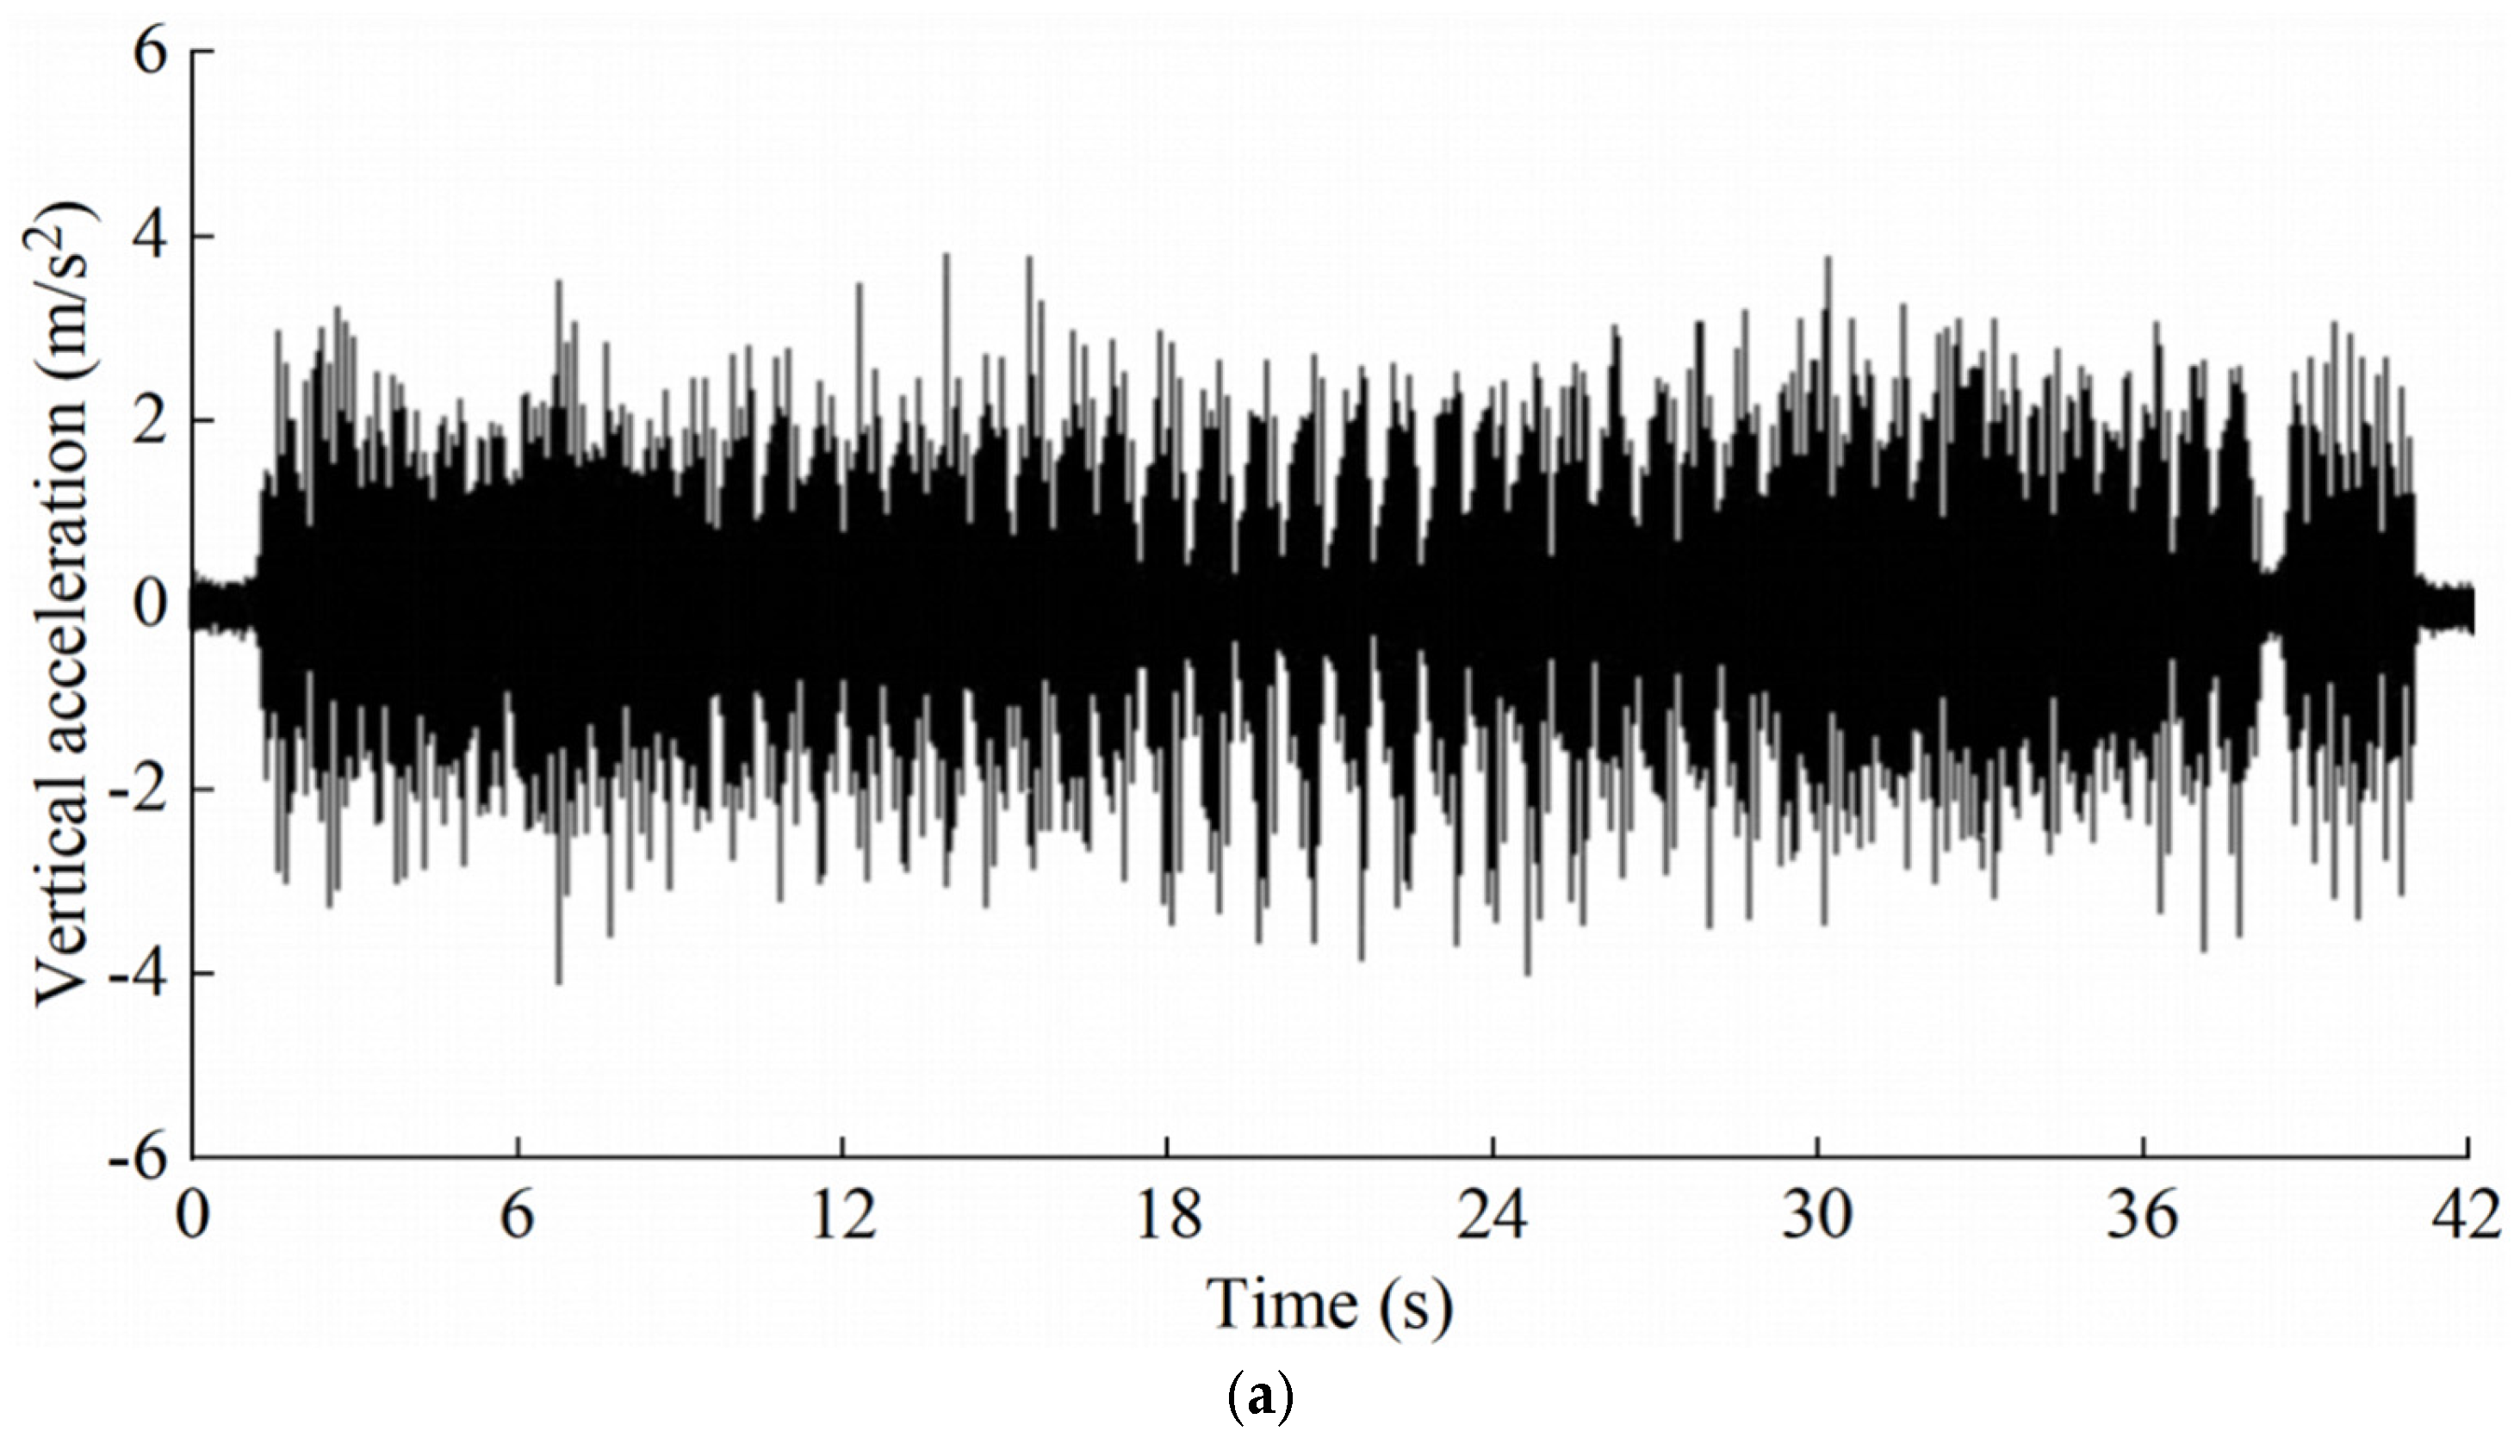
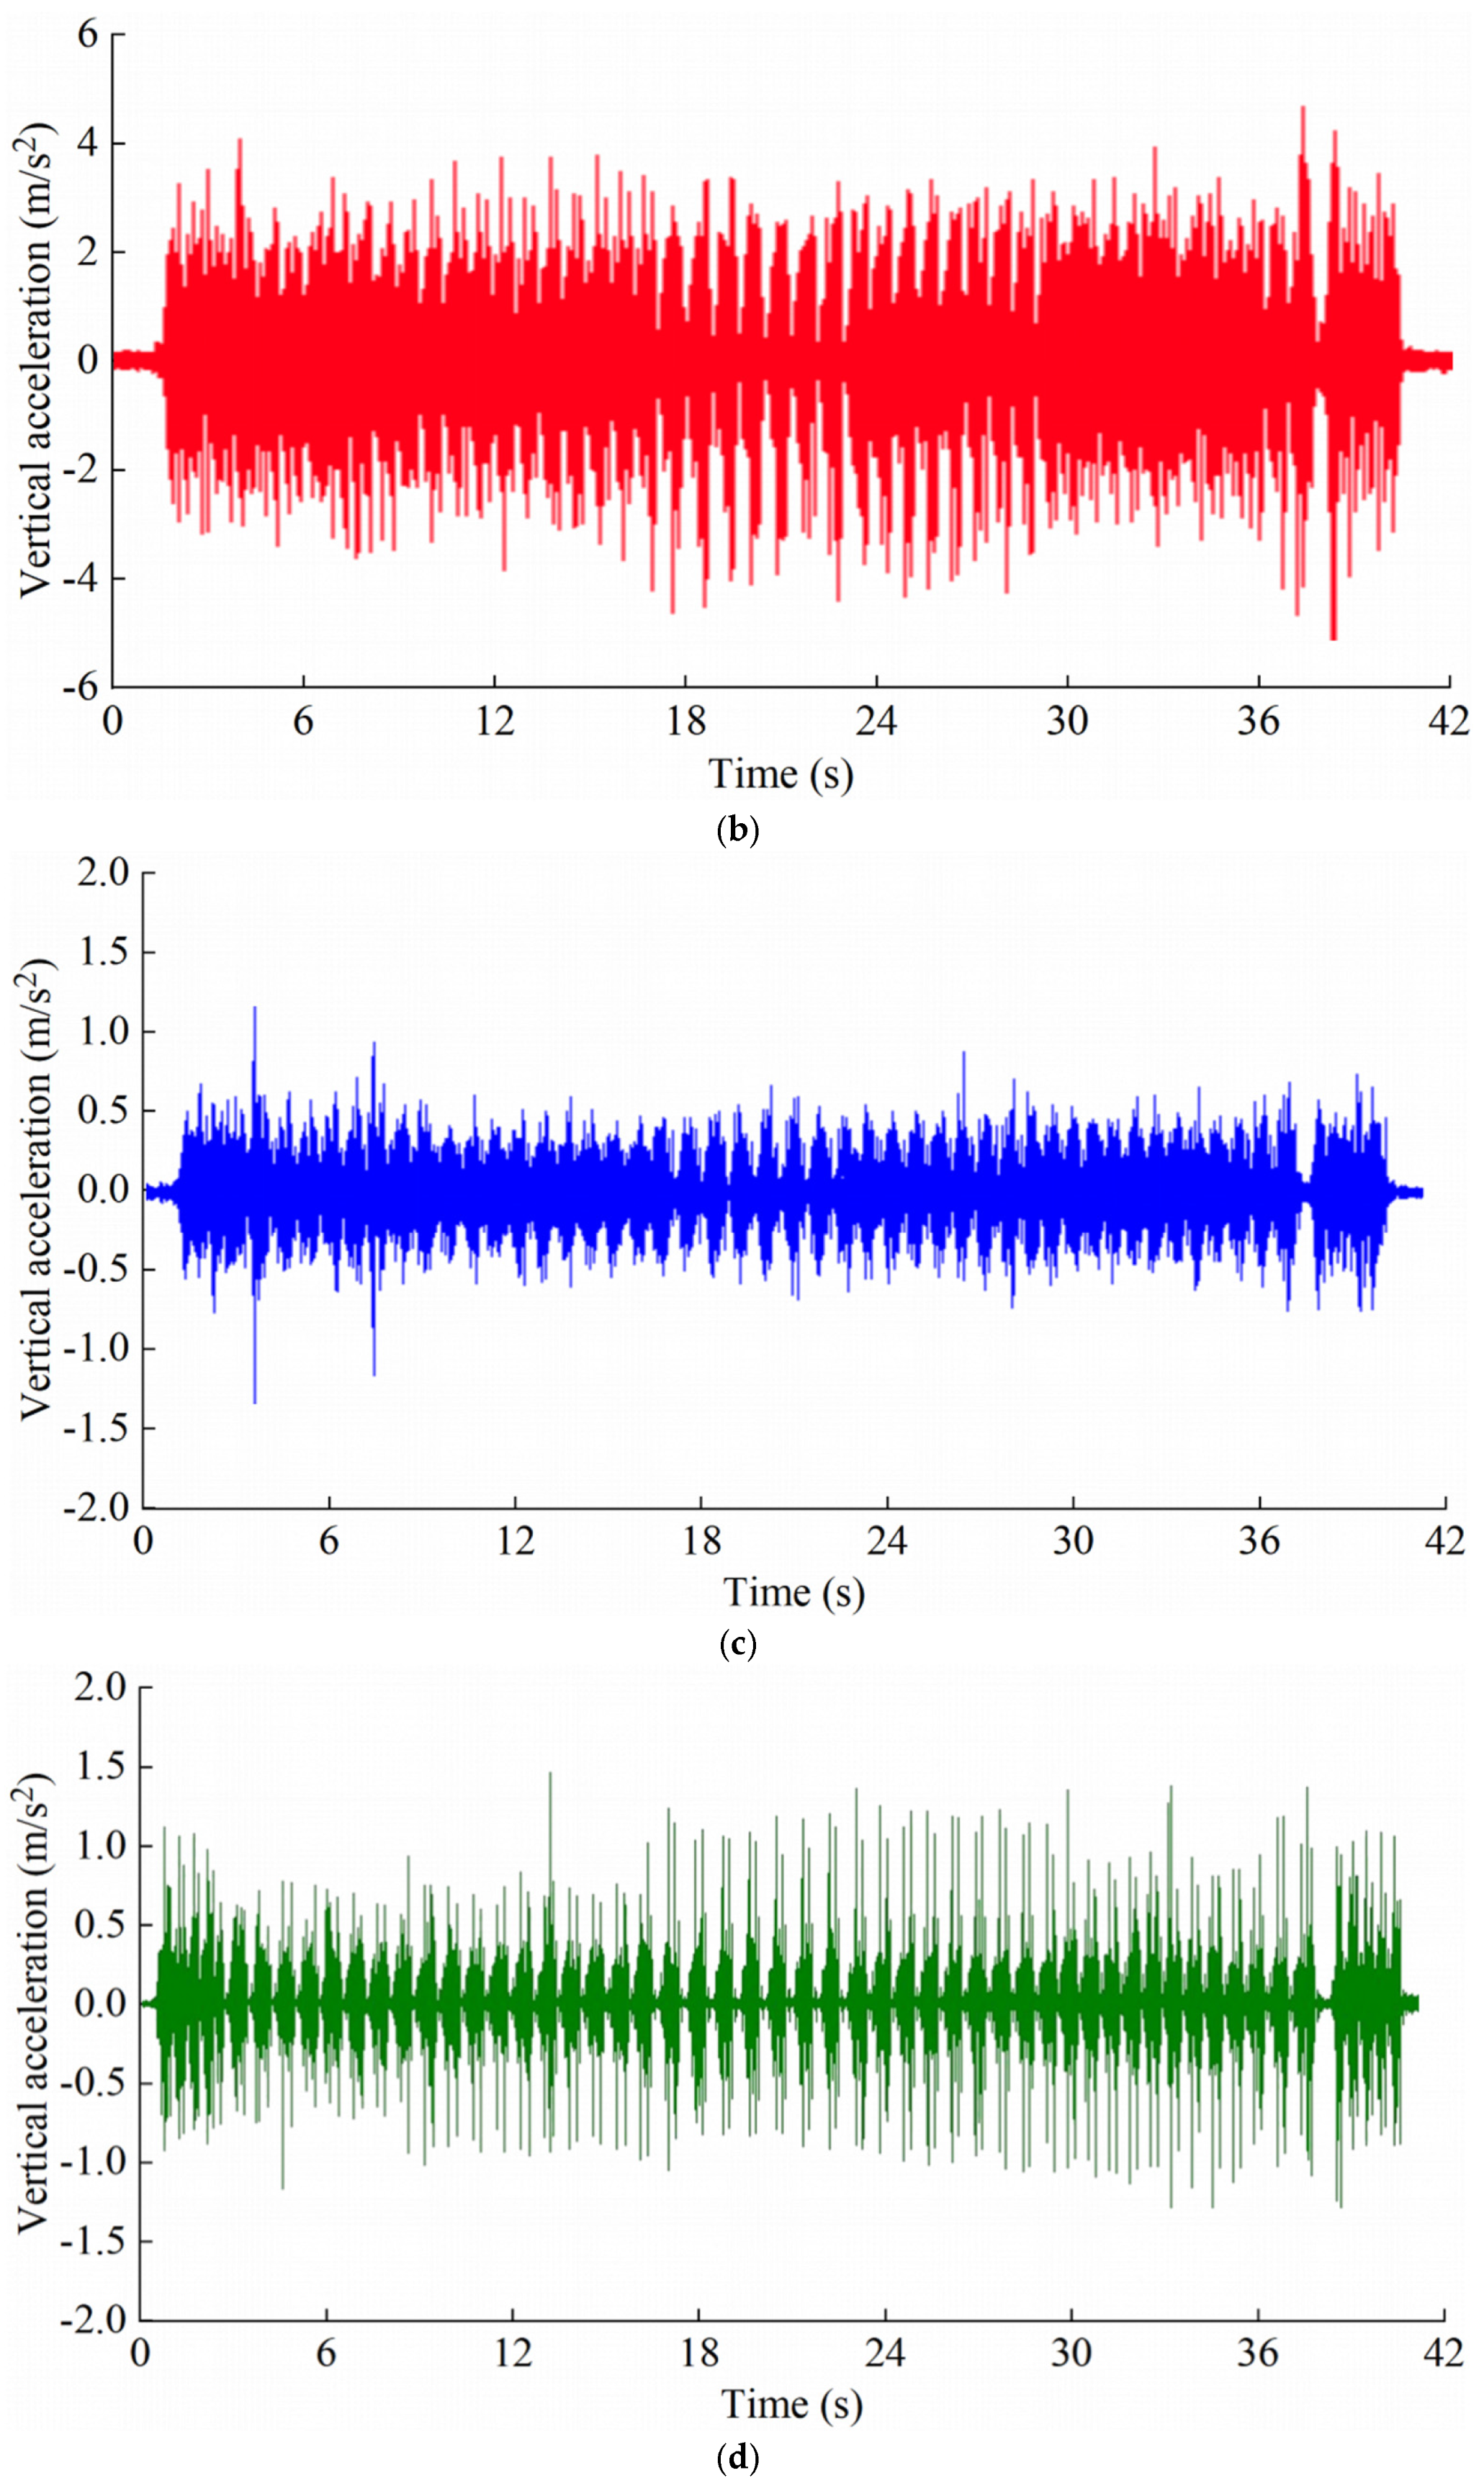
Figure 10 presents the vertical acceleration time–history curves for measuring points A1 and A4, located in the Class V surrounding rock. The curves compare the responses of the intact foundation section and the section with underlying voids, as recorded under an in situ measured train axle load of 30 t.
Figure 10 presents the typical acceleration time–history responses recorded at the monitoring points. In the pre-arrival phase, the acceleration at each point is virtually at rest, exhibiting minimal disturbance attributable to long-distance wave propagation. A significant transition is observed upon the passage of the heavy-haul train, which induces a rapid and violent fluctuation in the acceleration response. This dynamic response is characterized by periodic oscillations about the zero-baseline, reflecting the impulsive loading from the moving axles. Following the train’s departure, the acceleration amplitude progressively attenuates to zero, a behavior governed by the energy dissipation mechanisms inherent in the structural damping. A comparative analysis reveals a spatial variation in response, wherein the acceleration magnitude on the heavy-haul track side is substantially more pronounced than that at the tunnel centerline. Moreover, the existence of basement defects is found to be a critical factor exacerbating the structural response. Specifically, while void defects do not modify the essential morphological characteristics of the acceleration time–history, their primary influence is manifested as a significant amplification of the peak acceleration amplitude.
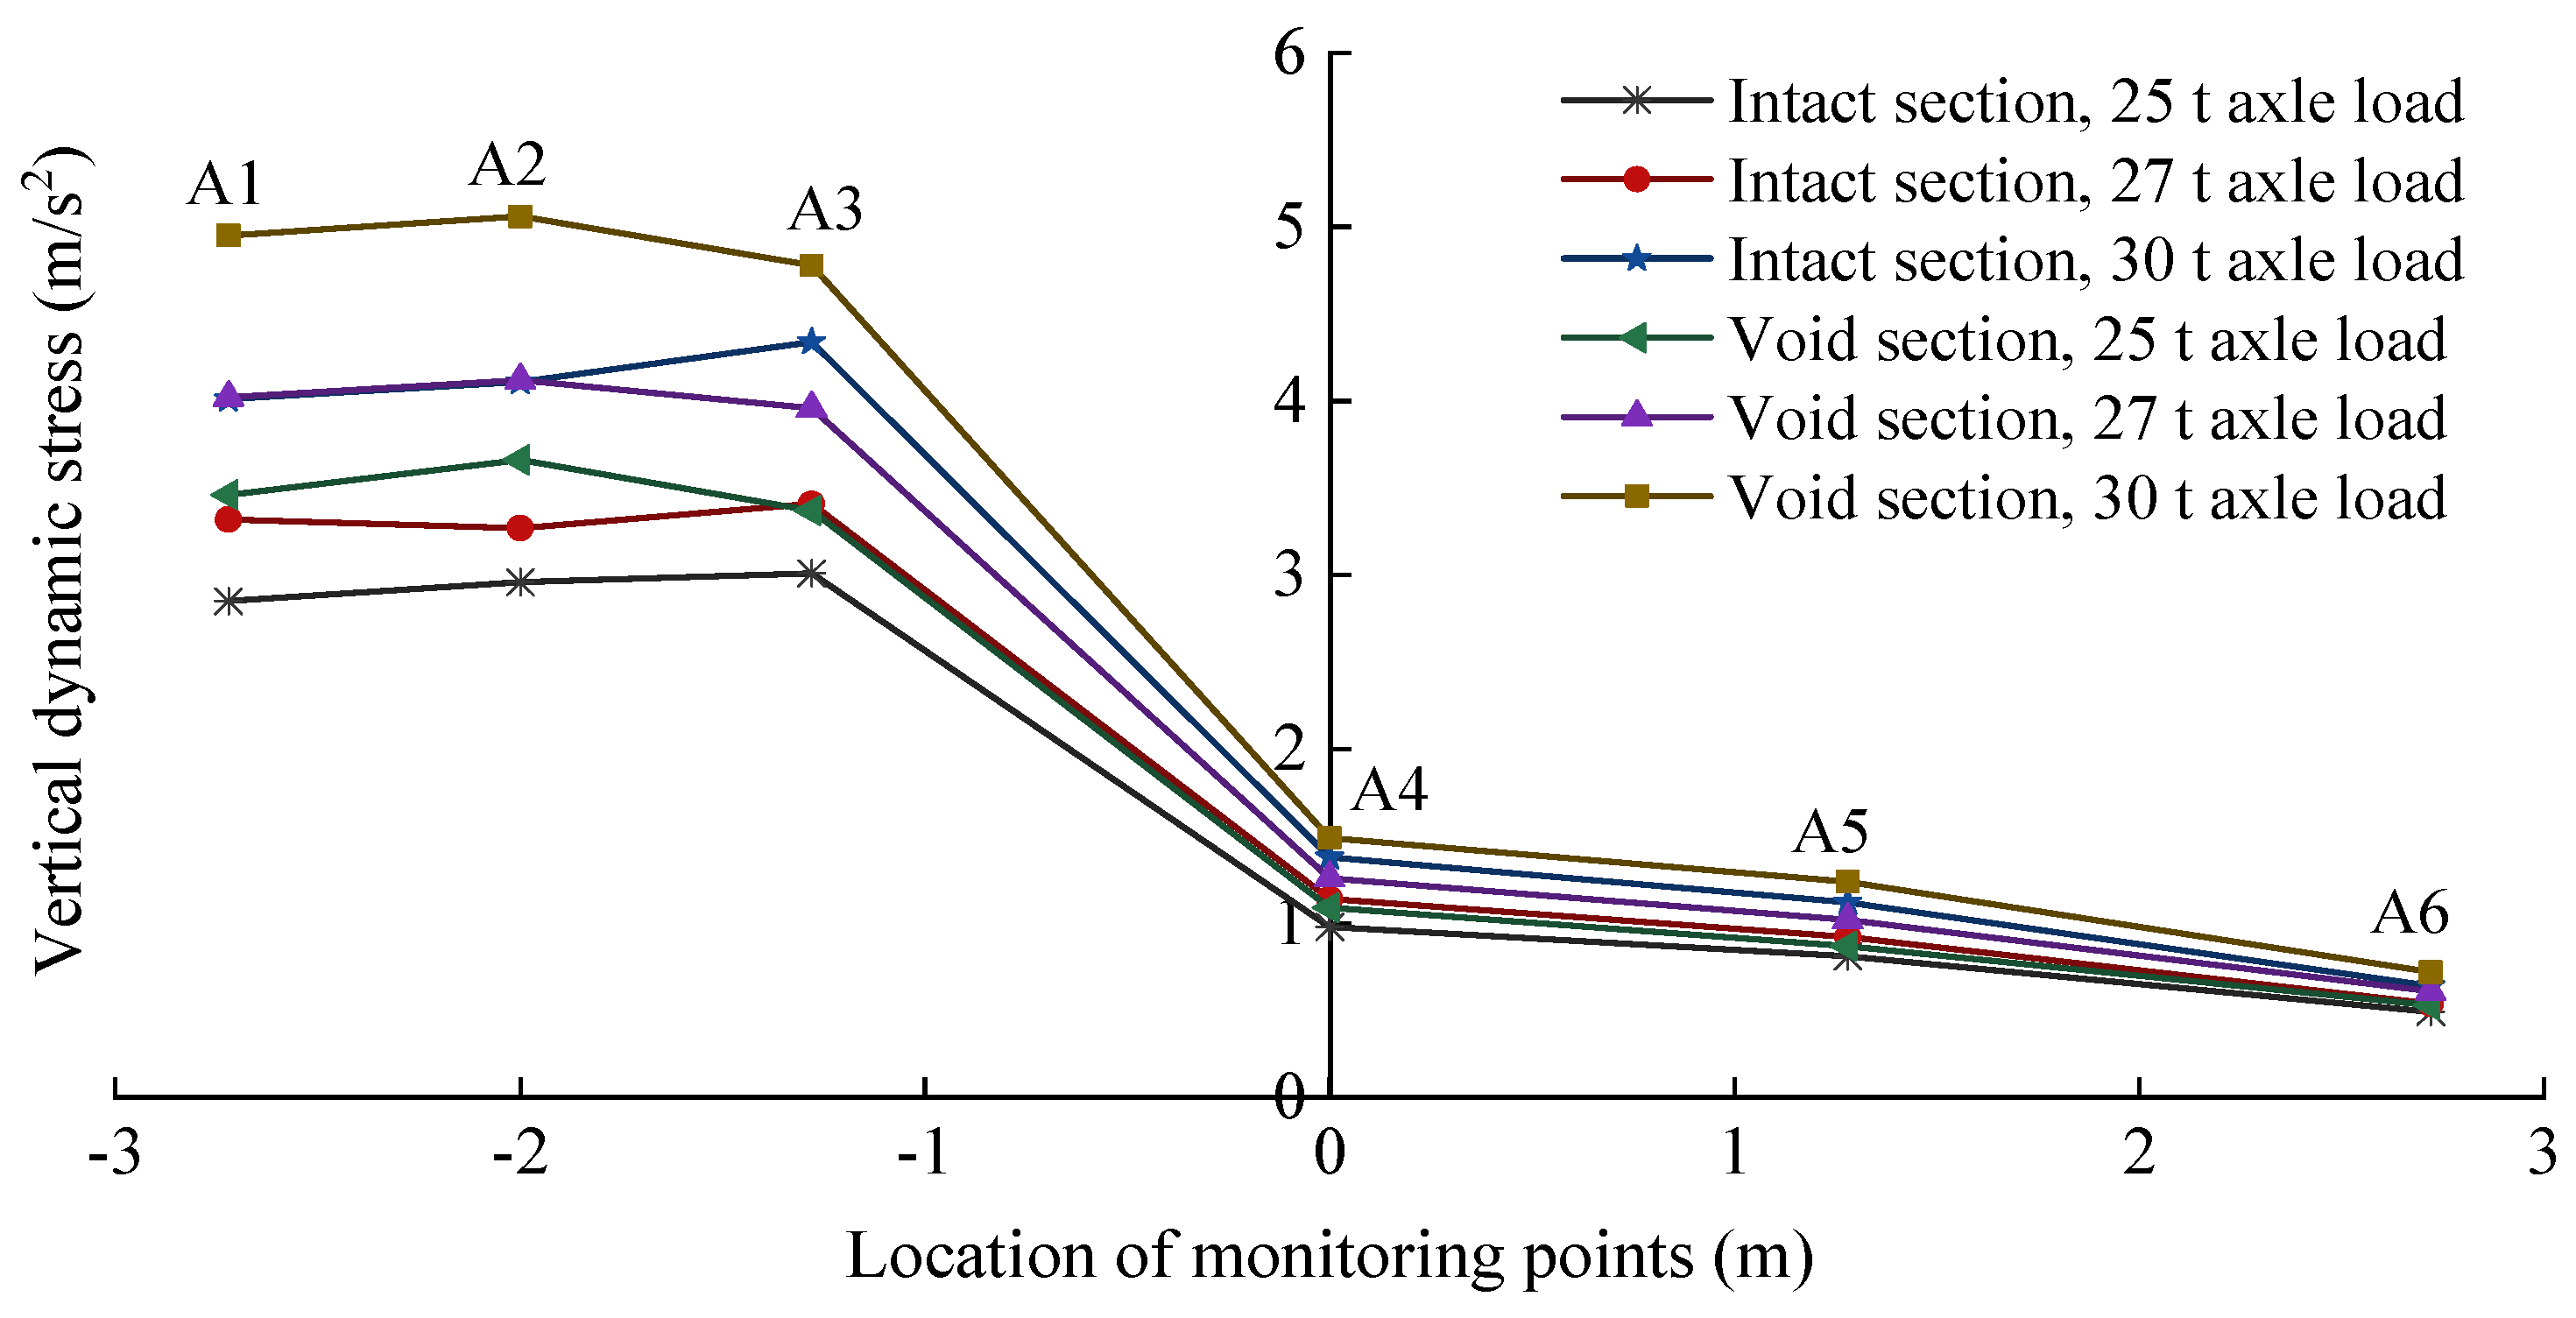
The peak acceleration values extracted from the time–history data of each monitoring point are summarized in Table 1 and Table 2 and graphically represented in Figure 11. For clarity, the growth rate presented in the table quantifies the percentage increase in the dynamic response relative to the baseline scenario, corresponding to an increase in the train’s axle load. This definition applies consistently throughout the subsequent analysis.
An analysis of the data presented in Table 1 and Table 2, along with Figure 11, reveals the distinct dynamic responses of the track foundation to varying operational and structural conditions. The influence of train loading is immediately apparent, with the peak vertical acceleration at the surface of the infill layer on the heavy-duty line being substantially greater than that on the unloaded line. Furthermore, a clear attenuation trend is observed, where the peak acceleration of the foundation structure decreases as the distance from the vibration source (i.e., the track) increases.
Figure 11. Peak acceleration at the surface of the infill layer under Grade V surrounding rock: (a) Intact section; (b) Void section.
Buildings 15 03880 g011
The presence of a void defect beneath the foundation significantly amplifies the dynamic response. This amplification effect is particularly pronounced on the heavy-duty line side but is markedly less significant on the unloaded line side. For instance, under a 30 t axle load, the peak acceleration at monitoring point A1 increased by 23.4%, from 4.01 m/s2 in the normal section to 4.95 m/s2 in the section with a void defect. In contrast, at point S6 on the unloaded line, the acceleration only increased by 12.5% (from 0.64 m/s2 to 0.72 m/s2) under the same defect condition. This asymmetric response can be attributed to the long-term cyclic loading from heavy-axle trains, which causes progressive deterioration and damage to the foundation on the heavy-duty side.
The peak acceleration of the foundation structure also exhibits a strong positive correlation with the train axle load. Taking monitoring point A3 as an example, increasing the axle load from 25 t to 27 t resulted in a percentage increase in peak acceleration ranging from 10.2% to 17.5%. A subsequent increase from 27 t to 30 t led to an even more substantial rise, with percentage increases between 18.0% and 27.3%. This underscores the non-linear relationship between axle load and dynamic response.
Finally, a comparative analysis between normal and void-defect sections confirms that structural voids exacerbate the tunnel’s dynamic response across all tested axle loads. At measurement point A2, the introduction of a void defect caused a significant increase in peak acceleration: by 26.3% under a 25 t axle load (from 2.96 m/s2 to 3.66 m/s2), by 26.0% under a 27 t axle load (from 3.27 m/s2 to 4.12 m/s2), and by 23.1% under a 30 t axle load (from 4.11 m/s2 to 5.06 m/s2). These findings collectively demonstrate that the combined effect of increased axle loads and pre-existing structural defects, such as voids, can critically compromise the stability and serviceability of the track foundation.
Figure 12 depicts the lateral profile of vertical acceleration on the subgrade surface, referenced to the tunnel centerline. The acceleration is maximized under the heavy-haul track and decays laterally. Notably, the presence of a void defect significantly amplifies the acceleration response compared to the normal section.

4.2. Frequency-Domain Vibration Acceleration Response Characteristics
To investigate the frequency-domain characteristics of the structural vibration, a one-third octave band analysis was performed on the measured acceleration signals. This method provides a representation of the signal’s energy distribution across a series of frequency bands, which is particularly effective for analyzing vibrations with a broad frequency content, such as those induced by train traffic. The center frequency of the frequency band is:
f c = f u f d
In the formula, f u and f d are the upper and lower limit frequencies of the frequency band.
The division of frequency bands also has regulations, generally specifying the m-octave band, which is determined by the following formula:
f u = 2 m f d
When m is 1, it is called the octave band, and when m is one-third, it is the one-third octave band. The spectrum in this frequency band ( f u ~ f d ) is called the one-third octave band.
Figure 12. Lateral distribution of vibration acceleration on the surface of the base filling layer.
Buildings 15 03880 g012
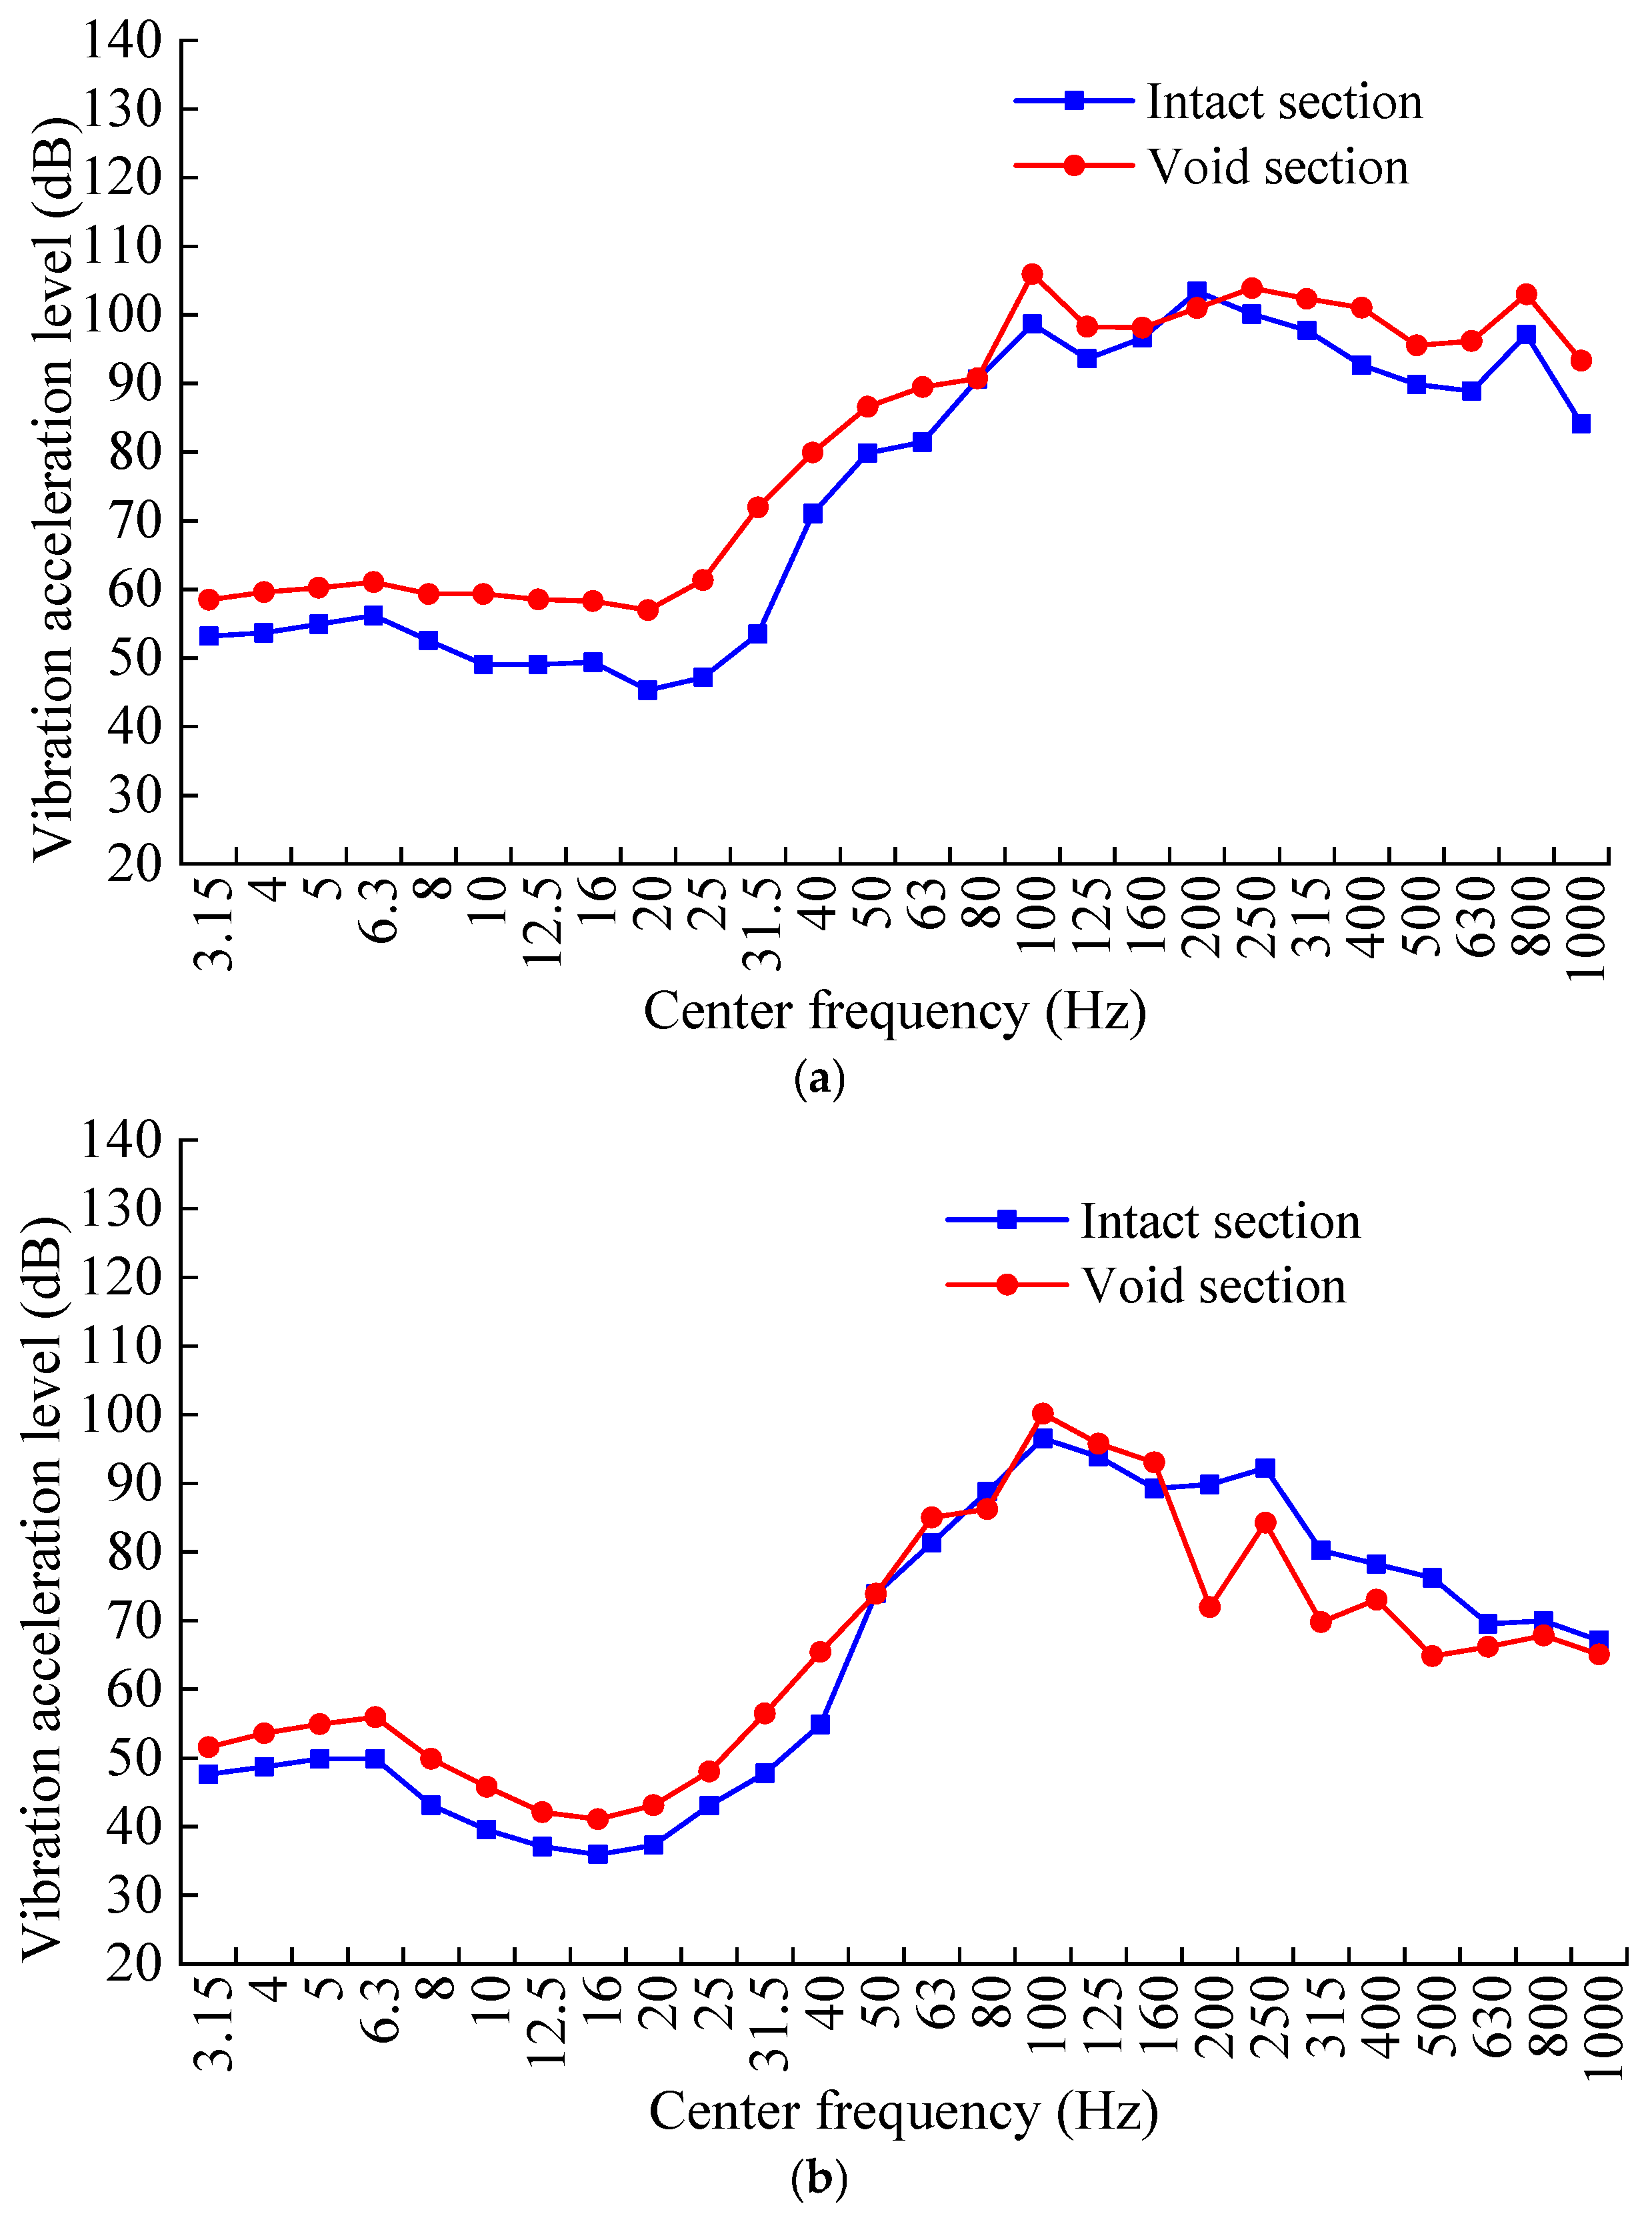
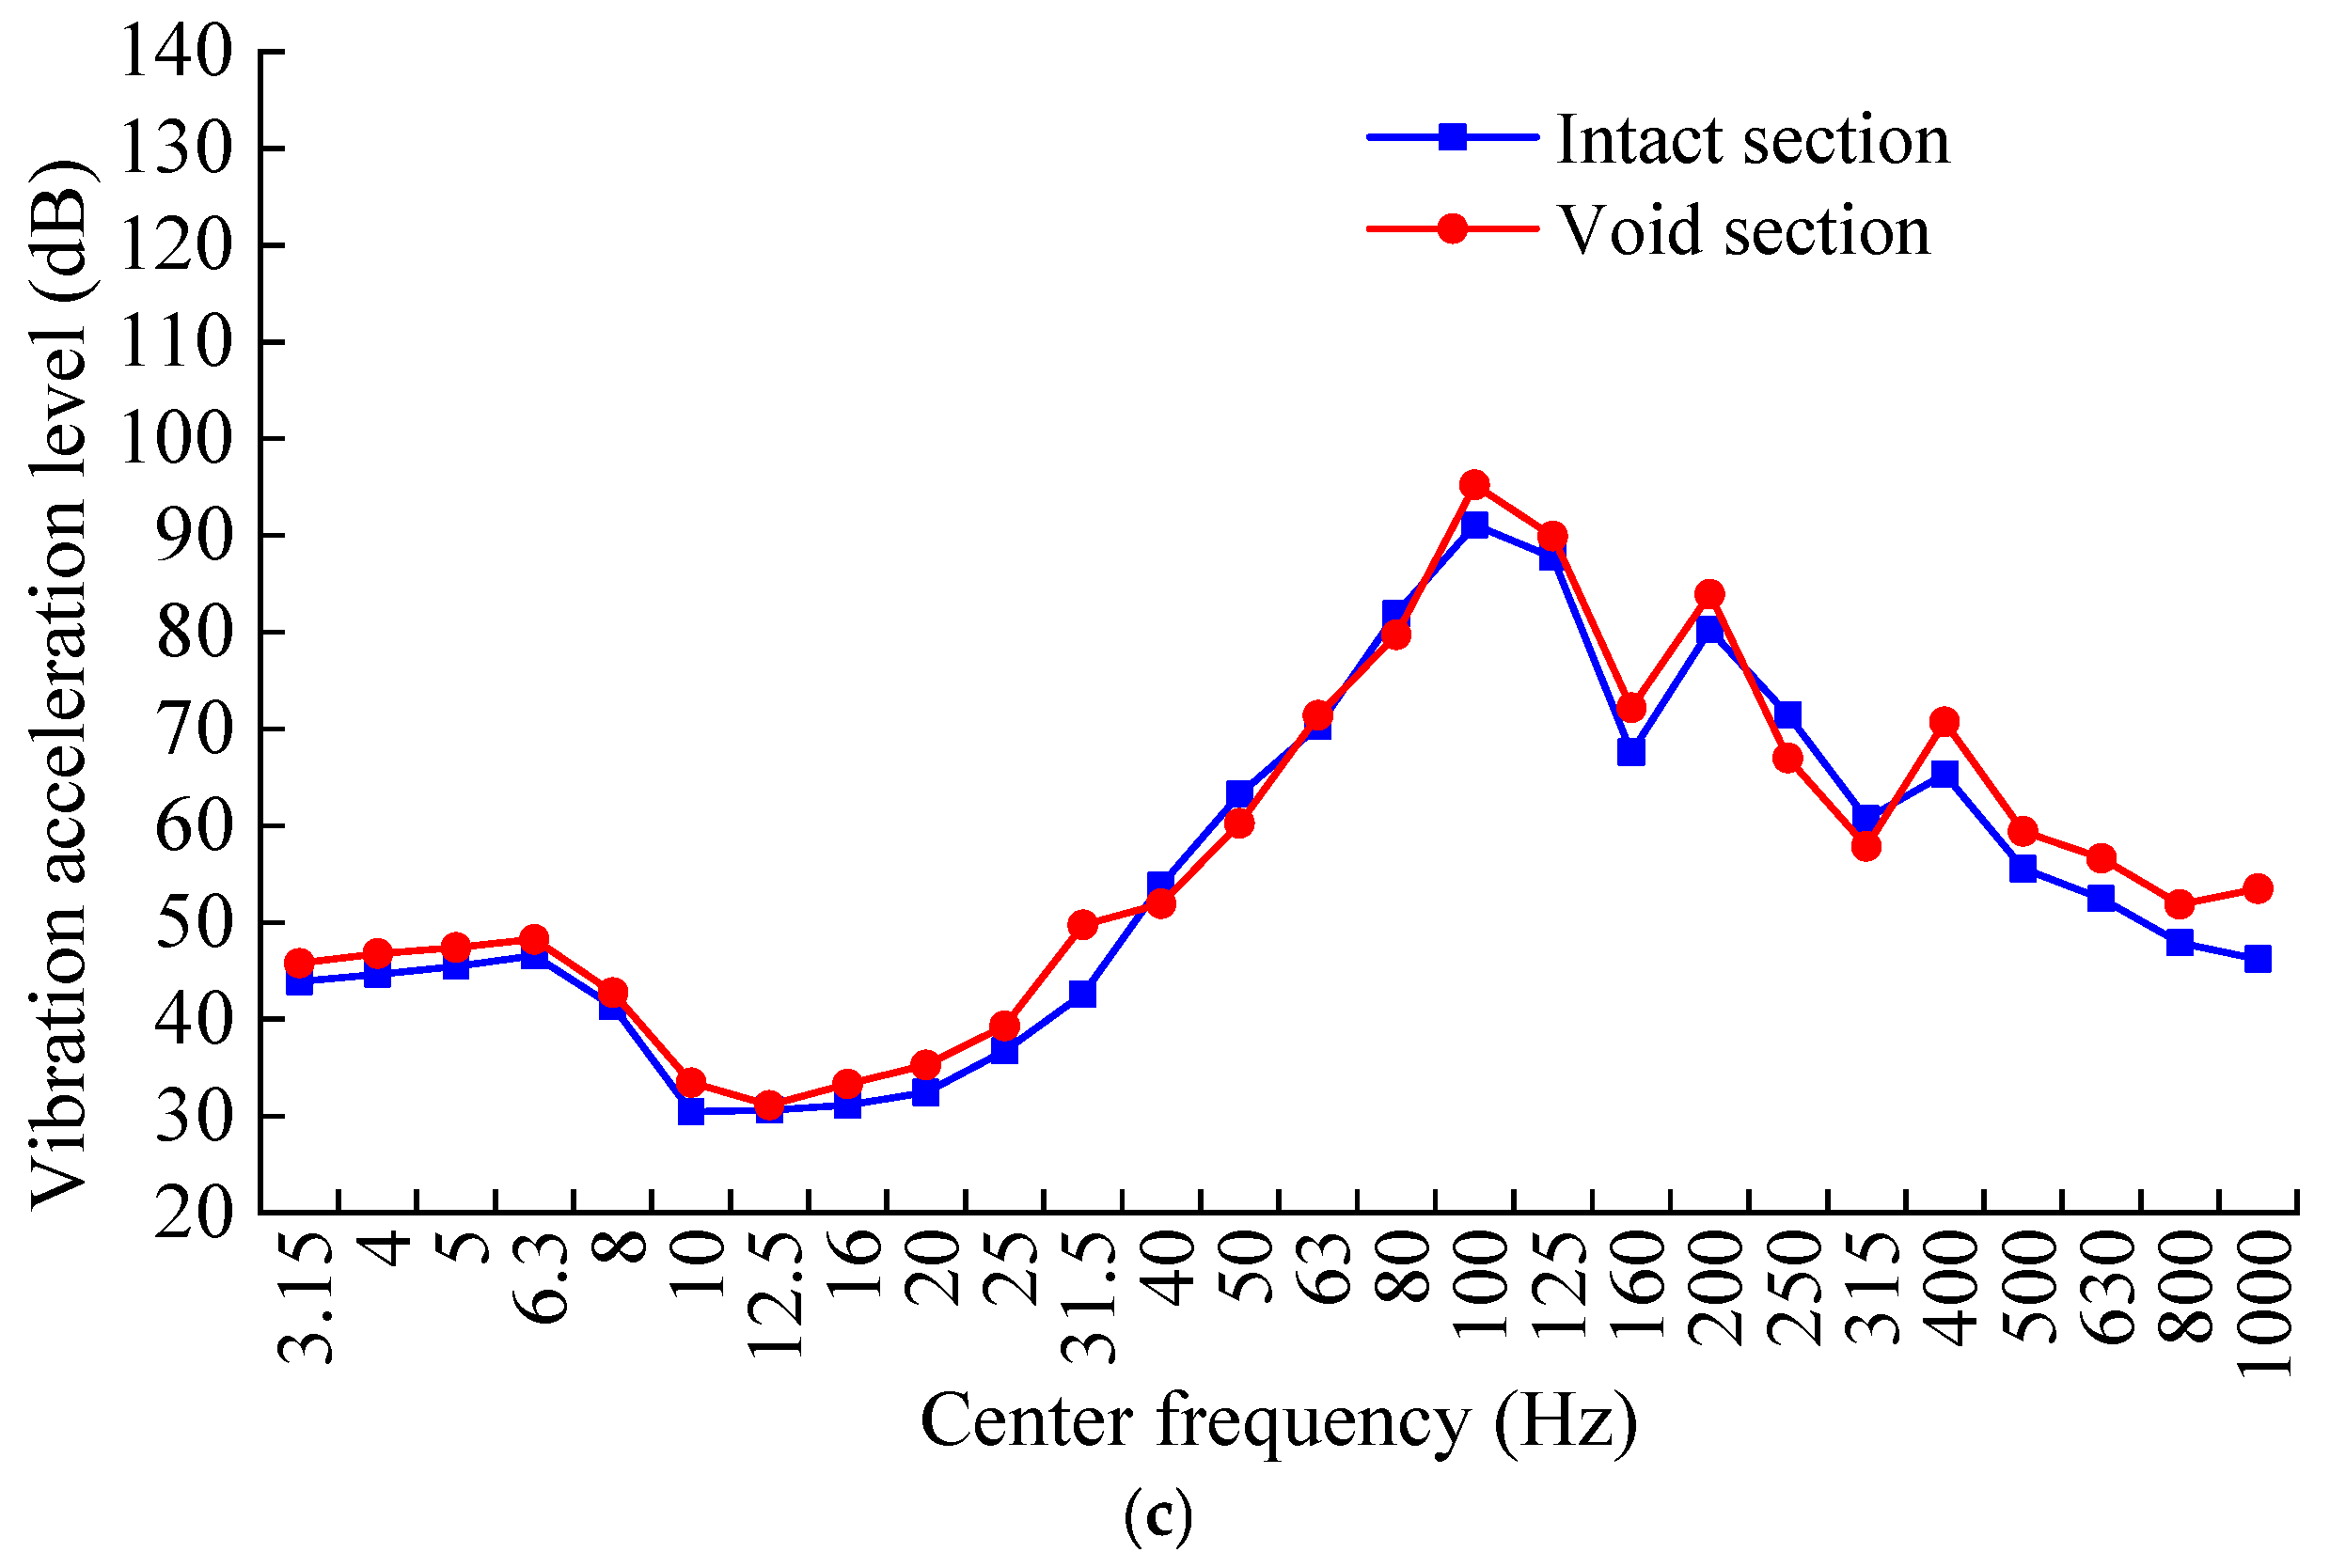
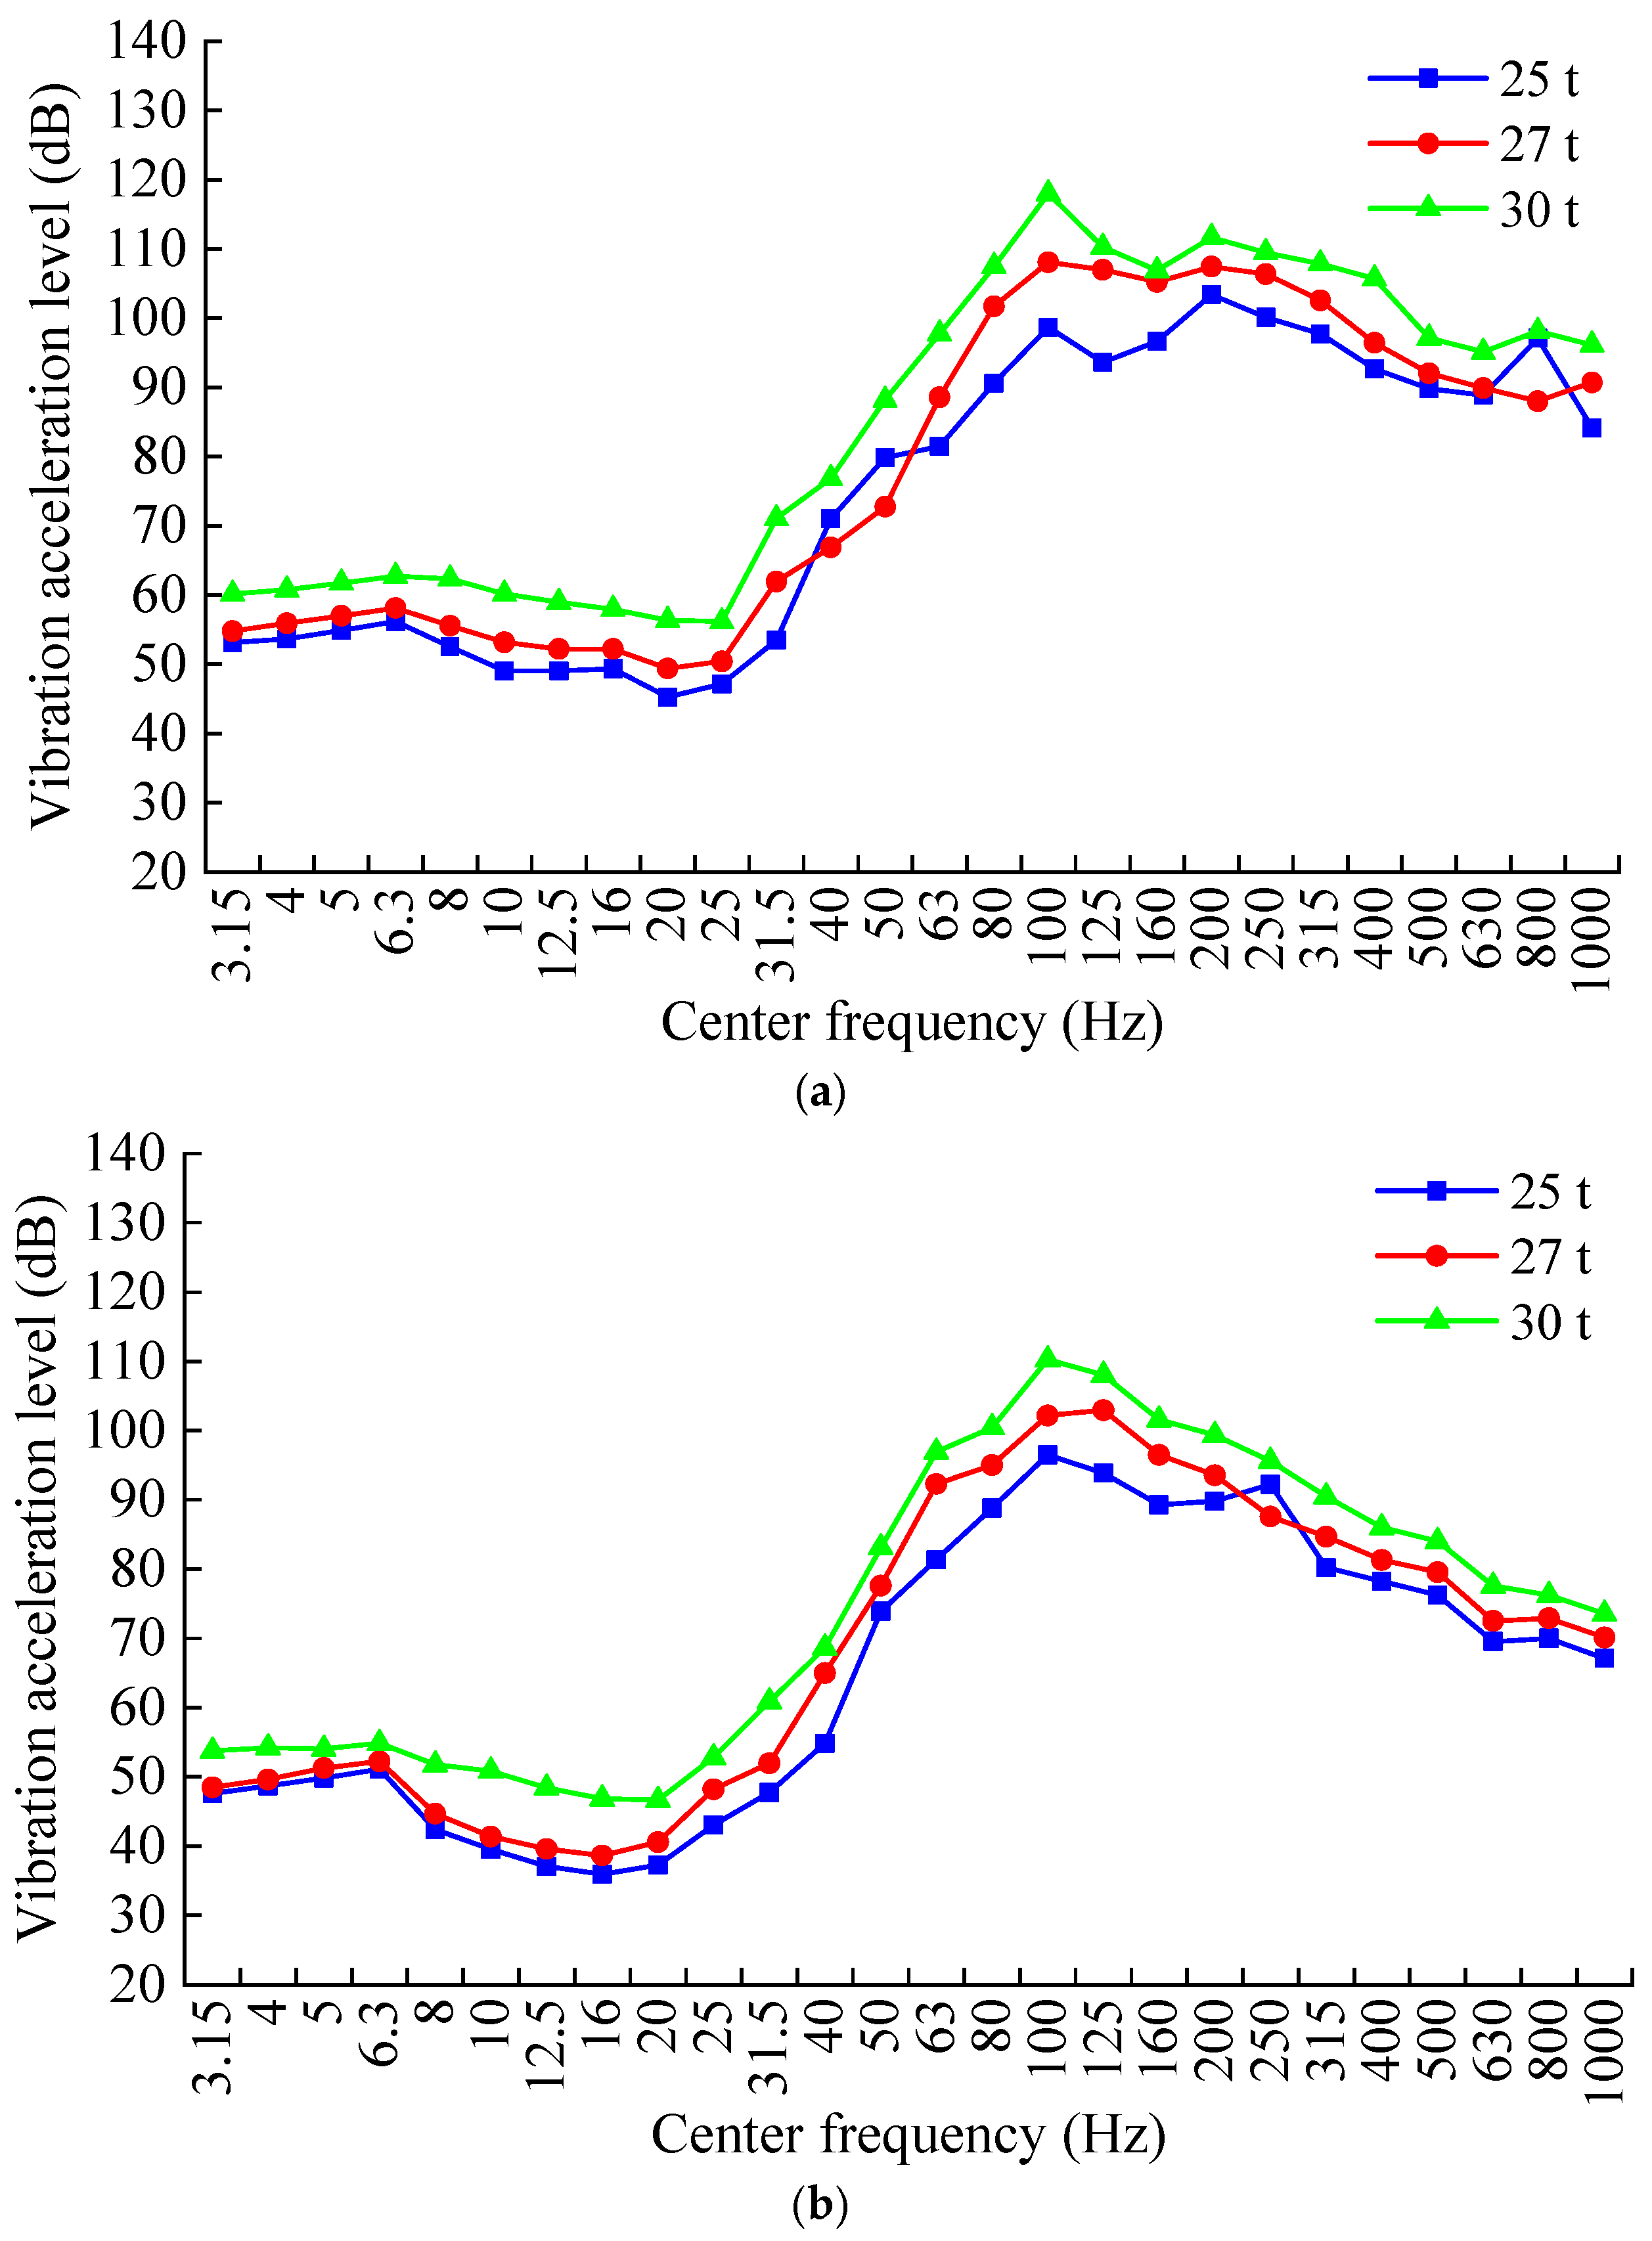
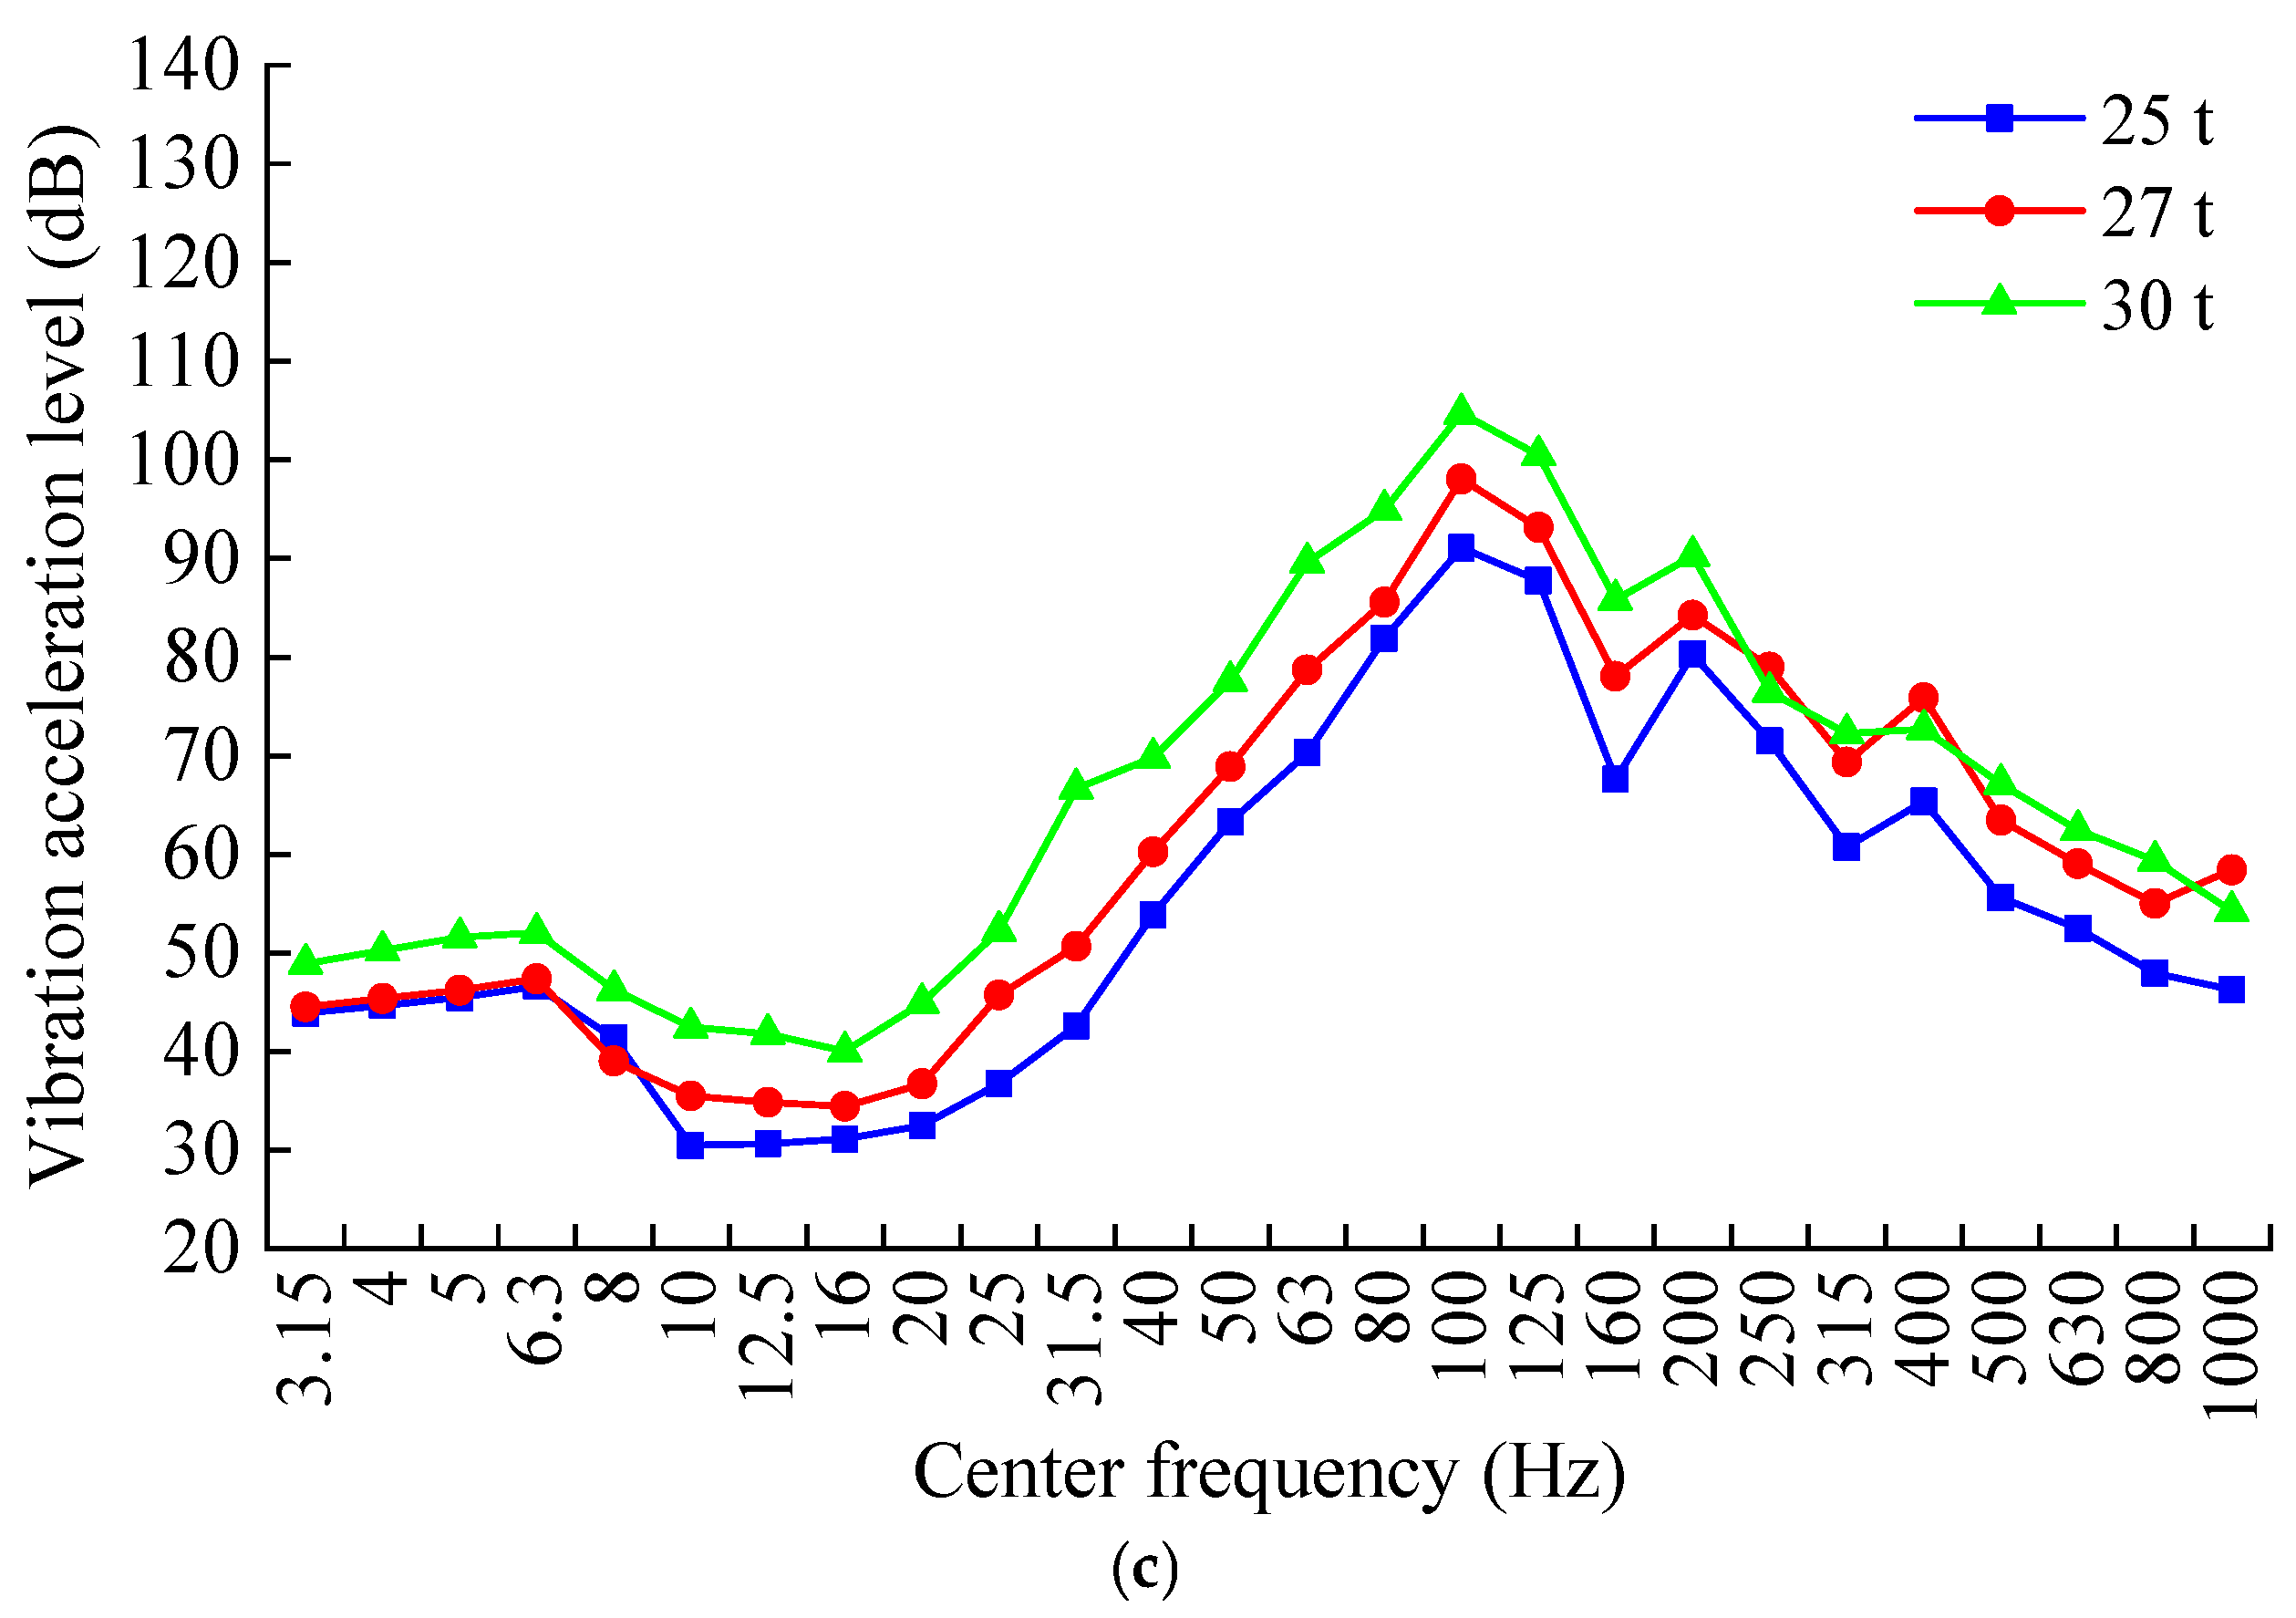
To investigate the spectral characteristics of the base structure’s vibration, a one-third octave band analysis was performed on the acceleration signals. This analysis was conducted for typical measuring points—A2 (heavy-load line side), A4 (tunnel center-line), and A6 (light-load line side)—under various conditions. These conditions included heavy-haul trains with axle loads of 25 t, 27 t, and 30 t traversing both normal and defective (with underlying voids) sections of a tunnel in Grade V surrounding rock. In accordance with ISO standards, the vibration acceleration level was plotted against the center frequency to facilitate a comprehensive evaluation.
The vibration acceleration levels of each measuring point on the complete and hollow sections are shown in Table 3 and Table 4. The results of this analysis are presented in Figure 13 and Figure 14. Figure 13 illustrates the one-third octave band spectra for a typical measuring point, comparing the normal and defective sections under a 25 t axle load. Figure 14 depicts a comparison of the spectra for the three typical measuring points within a normal section, subjected to the different axle loads of 25 t, 27 t, and 30 t.
Table 3. One-third octave frequency on the surface of the intact sections filling layer at the bottom of the tunnel (d).
Monitoring Point3.15 Hz5 Hz8 Hz12.5 Hz20 Hz31.5 Hz50 Hz100 Hz200 Hz315 Hz500 Hz800 Hz1000 Hz
A253.255.052.549.145.353.579.998.793.6103.489.897.184.1
A447.649.843.137.137.347.873.996.589.880.276.270.067.1
A643.945.541.330.632.442.363.291.180.360.755.647.946.2
Table 4. One-third octave frequency on the surface of the void sections filling layer at the bottom of the tunnel (B).
Monitoring Point3.15 Hz5 Hz8 Hz12.5 Hz20 Hz31.5 Hz50 Hz100 Hz200 Hz315 Hz500 Hz800 Hz1000 Hz
A258.560.359.358.557.072.086.6106.098.3101.095.5102.993.3
A451.654.949.942.143.156.573.9100.171.969.864.867.865.1
A645.847.442.831.135.349.760.295.283.957.959.451.853.5
Figure 13. Comparison of one-third octave frequency between intact and void sections: (a) Measurement point A2; (b) Measurement point A4; (c) Measurement point A6.
Buildings 15 03880 g013aBuildings 15 03880 g013b
Figure 14. Comparison of one-third octave frequency under different train axle loads: (a) Measurement point A2; (b) Measurement point A4; (c) Measurement point A6.
Buildings 15 03880 g014aBuildings 15 03880 g014b
Analysis of Figure 13 and Figure 14 reveals that the peak vibration response for both the normal and void sections at the tunnel base occurs at approximately 100 Hz. At this frequency, the vibration acceleration levels at measuring points A2, A4, and A6 are 98.7/105.9 dB, 96.5/100.1 dB, and 91.1/95.2 dB, respectively. The maximum discrepancy in vibration acceleration levels between the normal and void conditions is observed in the 31.5 Hz frequency band, where the differences at points A2, A4, and A6 reach 18.5 dB, 8.7 dB, and 6.2 dB, respectively.
The influence of the void defect on the dynamic response of the foundation structure diminishes with increasing distance from the vibration source. This attenuation effect is quantified by the average differences in vibration acceleration levels across the entire frequency band, which decrease from 7.0 dB at A2 to 3.2 dB at A4 and 2.1 dB at A6. This trend is consistent with the fundamental law of vibration propagation and attenuation.
Furthermore, the dynamic response of the tunnel foundation is significantly amplified by increased train axle loads. This effect is particularly pronounced when the axle load increases from 27 t to 30 t. For instance, at measuring point A4, an increase in axle load from 25 t to 27 t resulted in a 3.7 dB rise in the average vibration acceleration level. In contrast, a subsequent increase from 27 t to 30 t produced a substantially larger increase of 6.5 dB—a magnitude 1.78 times greater than the former increment.

5. Conclusions

(1)
The vertical dynamic stress of the tunnel bottom structure is compressive stress. The maximum compressive stress is observed directly beneath the heavy-load line at the surface of the infill layer, from which it propagates laterally in both directions. Both an increase in train axle load and the occurrence of base detachment contribute to a corresponding increase in the power response.
(2)
The load transmitted from heavy-duty trains to the base structure constitutes a low-frequency dynamic effect, with its primary energy distribution confined to the 0–20 Hz band. It was determined that while variations in axle load directly influence the magnitude of the dynamic stress, they have no discernible effect on its principal frequency components. The overall dynamic response is predominantly characterized by the coupled influence of adjacent bogies from successive rail carriages.
(3)
A marked escalation in the acceleration response of the tunnel bottom structure was observed in conjunction with increasing axle loads. Specifically, an increase in axle load from 25 t to 27 t precipitated a rise in peak acceleration ranging from 10.2% to 17.5%. A further increase from 27 t to 30 t induced a significantly greater escalation, with peak acceleration growth rates between 18.0% and 27.3%.
(4)
The one-third octave band analysis indicates that the most pronounced difference in center frequency vibration acceleration levels is manifest at 31.5 Hz. Moreover, the dynamic response attributable to the void defect attenuates with increasing distance between the measurement point and the vibration source.
(5)
The 31.5 Hz frequency serves as a key indicator for track structure void defects. This allows for the creation of portable or online monitoring systems that target this specific frequency. When the vibration acceleration level exceeds a statistically determined threshold, the system can issue an alert for the rapid and accurate localization of these defects.

Author Contributions

Conceptualization, D.W. and J.S.; software, D.W. and F.L.; validation, D.W. and Z.W.; investigation, J.F. and J.L.; data curation, G.W. and J.L.; writing—original draft preparation, D.W.; writing—review and editing, D.W.; visualization, J.L. and G.W.; supervision, J.S.; project administration, J.F. and J.L. All authors have read and agreed to the published version of the manuscript.

Funding

This research was funded by the Key Laboratory of Urban Underground Engineering of Ministry of Education (Beijing Jiaotong University) Open Fund Project, grant number TUL2024-05 and Beijing MTR Construction Administration Corporation Innovation Fund Project, grant number SCJJ2025003. The authors are grateful to all the study participants.

Data Availability Statement

The original contributions presented in this study are included in the article. Further inquiries can be directed to the corresponding author.

Acknowledgments

The authors gratefully acknowledge the support of the Key Laboratory of Urban Underground Engineering of Ministry of Education (Beijing Jiaotong University) Open Fund Project, grant number TUL2024-05 and Beijing MTR Construction Administration Corporation Innovation Fund Project, grant number SCJJ2025003. The authors thank the anonymous reviewers who provided valuable suggestions that improved the manuscript.

Conflicts of Interest

Authors Dengke Wang, Furong Luo and Zhe Wang were employed by the company Beijing MTR Construction Administration Corporation. Author Dengke Wang was employed by the company Beijing Infrastructure Investment Co., Ltd. The remaining authors declare that the research was conducted in the absence of any commercial or financial relationships that could be construed as a potential conflict of interest. The authors declare that this study received funding from Beijing MTR Construction Administration Corporation. The funder was not involved in the study design, collection, analysis, interpretation of data, the writing of this article or the decision to submit it for publication.

References

  1. Liu, C.; Gong, Z.b.; Sha, M.; Wu, B.; Zeng, J.J.; Zhu, R.N. Dynamic response of heavy haul railway tunnel’s bottom structures with base cavity in hard rock environment. J. Railw. Sci. Eng. 2023, 20, 4667–4677. [Google Scholar] [CrossRef]
  2. Xiao, P.; Peng, L.M.; Li, R.; Wang, H.L.; Lei, M.F. Research on vehicle-rail-tunnel coupling model and influence factors of dynamic response of bottom structure of heavy-haul railway tunnel. J. Railw. Sci. Eng. 2022, 19, 3737–3745. [Google Scholar] [CrossRef]
  3. Wang, F.; Liu, C.; Peng, L.M.; Lei, M.F.; Shi, C.H. Experimental study on fatigue performances of heavy haul railway tunnel’s pavement structure with base cavity. J. Railw. Sci. Eng. 2021, 18, 2688–2693. [Google Scholar] [CrossRef]
  4. Nie, R.S.; Mei, H.H.; Leng, W.M.; Zhao, C.Y.; Li, Y.F.; Tu, R.P. Experimental research on dynamic response characteristics of transition subgrade induced by heavy-haul trains. China Civ. Eng. J. 2019, 52, 101–115. [Google Scholar] [CrossRef]
  5. Li, P.; Ling, X.; Zhang, F.; Li, Y.; Zhao, Y. Field testing and analysis of embankment vibrations induced by heavy haul trains. Shock Vib. 2017, 2017, 7410836. [Google Scholar] [CrossRef]
  6. Guo, F.Q.; Wang, P.J.; Yang, Q.; Yu, Z.W.; Leng, M.W.; Chen, C. Experimental research on characteristics of vertical dynamic load on bridge pier and pile foundation under heavy-haul railway train. China Civ. Eng. J. 2019, 52, 101–115. [Google Scholar] [CrossRef]
  7. Chen, T.; Ma, W.; Wu, Z.J.; Mu, Y.H. Characteristics of dynamic response of the active layer beneath embankment in permafrost regions along the Qinghai–Tibet Railroad. Cold Reg. Sci. Technol. 2014, 98, 1–7. [Google Scholar] [CrossRef]
  8. Mei, H.H.; Leng, W.M.; Nie, R.S.; Tu, R.P.; Li, Y.F.; Dong, J.L. Experimental research on the dynamic response characteristics of the transition subgrade induced by heavy-haul train passage. Proc. Inst. Mech. Eng. Part F J. Rail Rapid Transit. 2019, 233, 974–987. [Google Scholar] [CrossRef]
  9. Ribeiro, C.A.; Rui, C.; Delgado, R. Experimental assessment of the dynamic behaviour of the train-track system at a culvert transition zone. Eng. Struct. 2017, 138, 215–228. [Google Scholar] [CrossRef]
  10. Li, Z.; Li, Z.Q.; Cai, R.Y.; Hua, Y.; Wang, L.; Gu, D.M. Refined model analysis of basement rock degradation mechanism of heavy-haul railway tunnel. Undergr. Space. 2021, 6, 342–352. [Google Scholar] [CrossRef]
  11. Wang, D.K.; Luo, J.J.; Li, F.L.; Wang, L.; Su, J. Research on dynamic response and fatigue life of tunnel bottom structure under coupled action of train load and groundwater. Soil Dyn. Earthq. Eng. 2022, 161, 107405. [Google Scholar] [CrossRef]
  12. Wang, D.K.; Luo, J.J.; Wang, G.Q.; Li, F.L.; Su, J. Dynamic response of the tunnel bottom structure considering groundwater influence under heavy-haul train loading. Structures 2022, 46, 1469–1479. [Google Scholar] [CrossRef]
  13. Wang, D.K.; Luo, J.J.; Wang, G.Q.; Li, F.L.; Hou, Y.J. Dynamic response of heavy-duty railway tunnel under the condition of water-rich surrounding rock void of the tunnel bottom. J. Harbin Inst. Technol. 2023, 55, 33–42. [Google Scholar] [CrossRef]
  14. Mandal, S.K.; Singh, M.M. Evaluating extent and causes of overbreak in tunnels. Tunn. Undergr. Spa. Tech. 2009, 24, 22–36. [Google Scholar] [CrossRef]
  15. Jeon, S.; Kim, J.; Seo, Y.; Hong, C. Effect of a fault and weak plane on the stability of a tunnel in rock—A scaled model test and numerical analysis. Inter. J. Roc. Mech. Min. Sci. 2004, 41, 486. [Google Scholar] [CrossRef]
  16. Nejati, H.R.; Ahmadi, M.; Hashemolhosseini, H. Numerical analysis of ground surface vibration induced by underground train movement. Tunn. Undergr. Spa. Tech. 2012, 29, 1–9. [Google Scholar] [CrossRef]
  17. Takemiya, H.; Bian, X. Substructure simulation of inhomogeneous track and layered ground dynamic interaction under train passage. J. Eng. Mech. 2005, 131, 699–711. [Google Scholar] [CrossRef]
  18. Andersen, L.; Jones, C.J.C. Coupled boundary and finite element analysis of vibration from railway tunnels—A comparison of two-and three-dimensional models. J. Sou. Vib. 2006, 293, 611–625. [Google Scholar] [CrossRef]
  19. Auersch, L. Dynamic stiffness of foundations on inhomogeneous soils for a realistic prediction of vertical building resonance. J. Geotech. Geoenv. 2008, 134, 328–340. [Google Scholar] [CrossRef]
  20. Indraratna, B.; Singh, M.; Nguyen, T.T.; Leroueil, S.; Abeywickrama, A.; Kelly, R.; Neville, T. Laboratory study on subgrade fluidization under undrained cyclic triaxial loading. Can. Geotech. J. 2020, 57, 1767–1779. [Google Scholar] [CrossRef]
  21. Du, M.Q.; Zhang, D.L.; Fang, Q.; Zhang, S.L.; Xiong, L.J. Dynamic response analysis of railway tunnel invert and its filling layer. China Railw. Sci. 2016, 37, 38–45. [Google Scholar]
  22. Du, M.Q.; Zhang, D.L.; Zhang, S.L.; Fang, Q. Field test and analysis of mechanical characteristics of tunnel invert structure for high-speed railway. China Railw. Sci. 2017, 38, 53–61. [Google Scholar] [CrossRef]
  23. Ma, W.B.; Chai, J.F.; Han, Z.L.; Ma, Z.G.; Guo, X.X.; Zou, W.H.; An, Z.L.; Li, T.F.; Niu, Y.B. Research on design parameters and fatigue life of tunnel bottom structure of single-track ballasted heavy-haul railway tunnel with 40-Ton axle load. Math. Probl. Eng. 2020, 2020, 3181480. [Google Scholar] [CrossRef]
  24. Ma, W.B.; Chai, J.F.; Zhu, Z.F.; Han, Z.L.; Ma, C.F.; Li, Y.J.; Zhu, X.Y.; Liu, Z.Y.; Niu, Y.B.; Ma, Z.G.; et al. Research on vibration law of railway tunnel substructure under different axle loads and health conditions. Shock Vib. 2021, 2021, 9954098. [Google Scholar] [CrossRef]
  25. Zou, W.H.; Zhang, M.; Liu, Y.Q.; Ma, W.B. Stress distribution and dynamic response of base structure for heavy haul railway tunnel under 30 t axle load. China Railw. Sci. 2016, 37, 50–57. [Google Scholar] [CrossRef]
  26. Wang, D.K.; Luo, J.J.; Li, F.L.; Wang, G.Q.; Wang, L.; Su, J.; Yin, K.Y. Dynamic response and service life of tunnel bottom structure considering hydro-mechanical coupling effect under the condition of bedrock softening. Materials 2022, 15, 6496. [Google Scholar] [CrossRef]
  27. Wang, H.L.; Dong, J.; Wu, Z.H.; Wang, Z.G. Impact of undercrossing tunnel on safety and stability of existing heavy-duty railway tunnel. J. China Railw. Soc. 2020, 42, 102–111. [Google Scholar] [CrossRef]
  28. Connolly, D.P.; Kouroussis, G.; Laghrouche, O.; Ho, C.L.; Forde, M.C. Benchmarking railway Vibrations-Track, vehicle, ground and building effects. Constr. Build. Mater. 2015, 92, 64–81. [Google Scholar] [CrossRef]
  29. Zou, W.H. Research on Dynamic Response Characteristics and Evaluation System of Heavy Haul Railway Tunnel Base Structure. Ph.D. Thesis, China Academy of Railway Sciences, Beijing, China, 2016. [Google Scholar]
  30. GB/T 50218-2014; Standard for Engineering Classification of Rock Masses. Ministry of Housing and Urban–Rural Development of the People’s Republic of China: Beijing, China, 2014.
  31. Bian, X.C.; Jiang, H.G.; Chang, C.; Hu, J.; Chen, Y.M. Track and ground vibrations generated by high-speed train running on ballastless railway with excitation of vertical track irregularities. Soil Dyn. Earthq. Eng. 2015, 76, 29–43. [Google Scholar] [CrossRef]
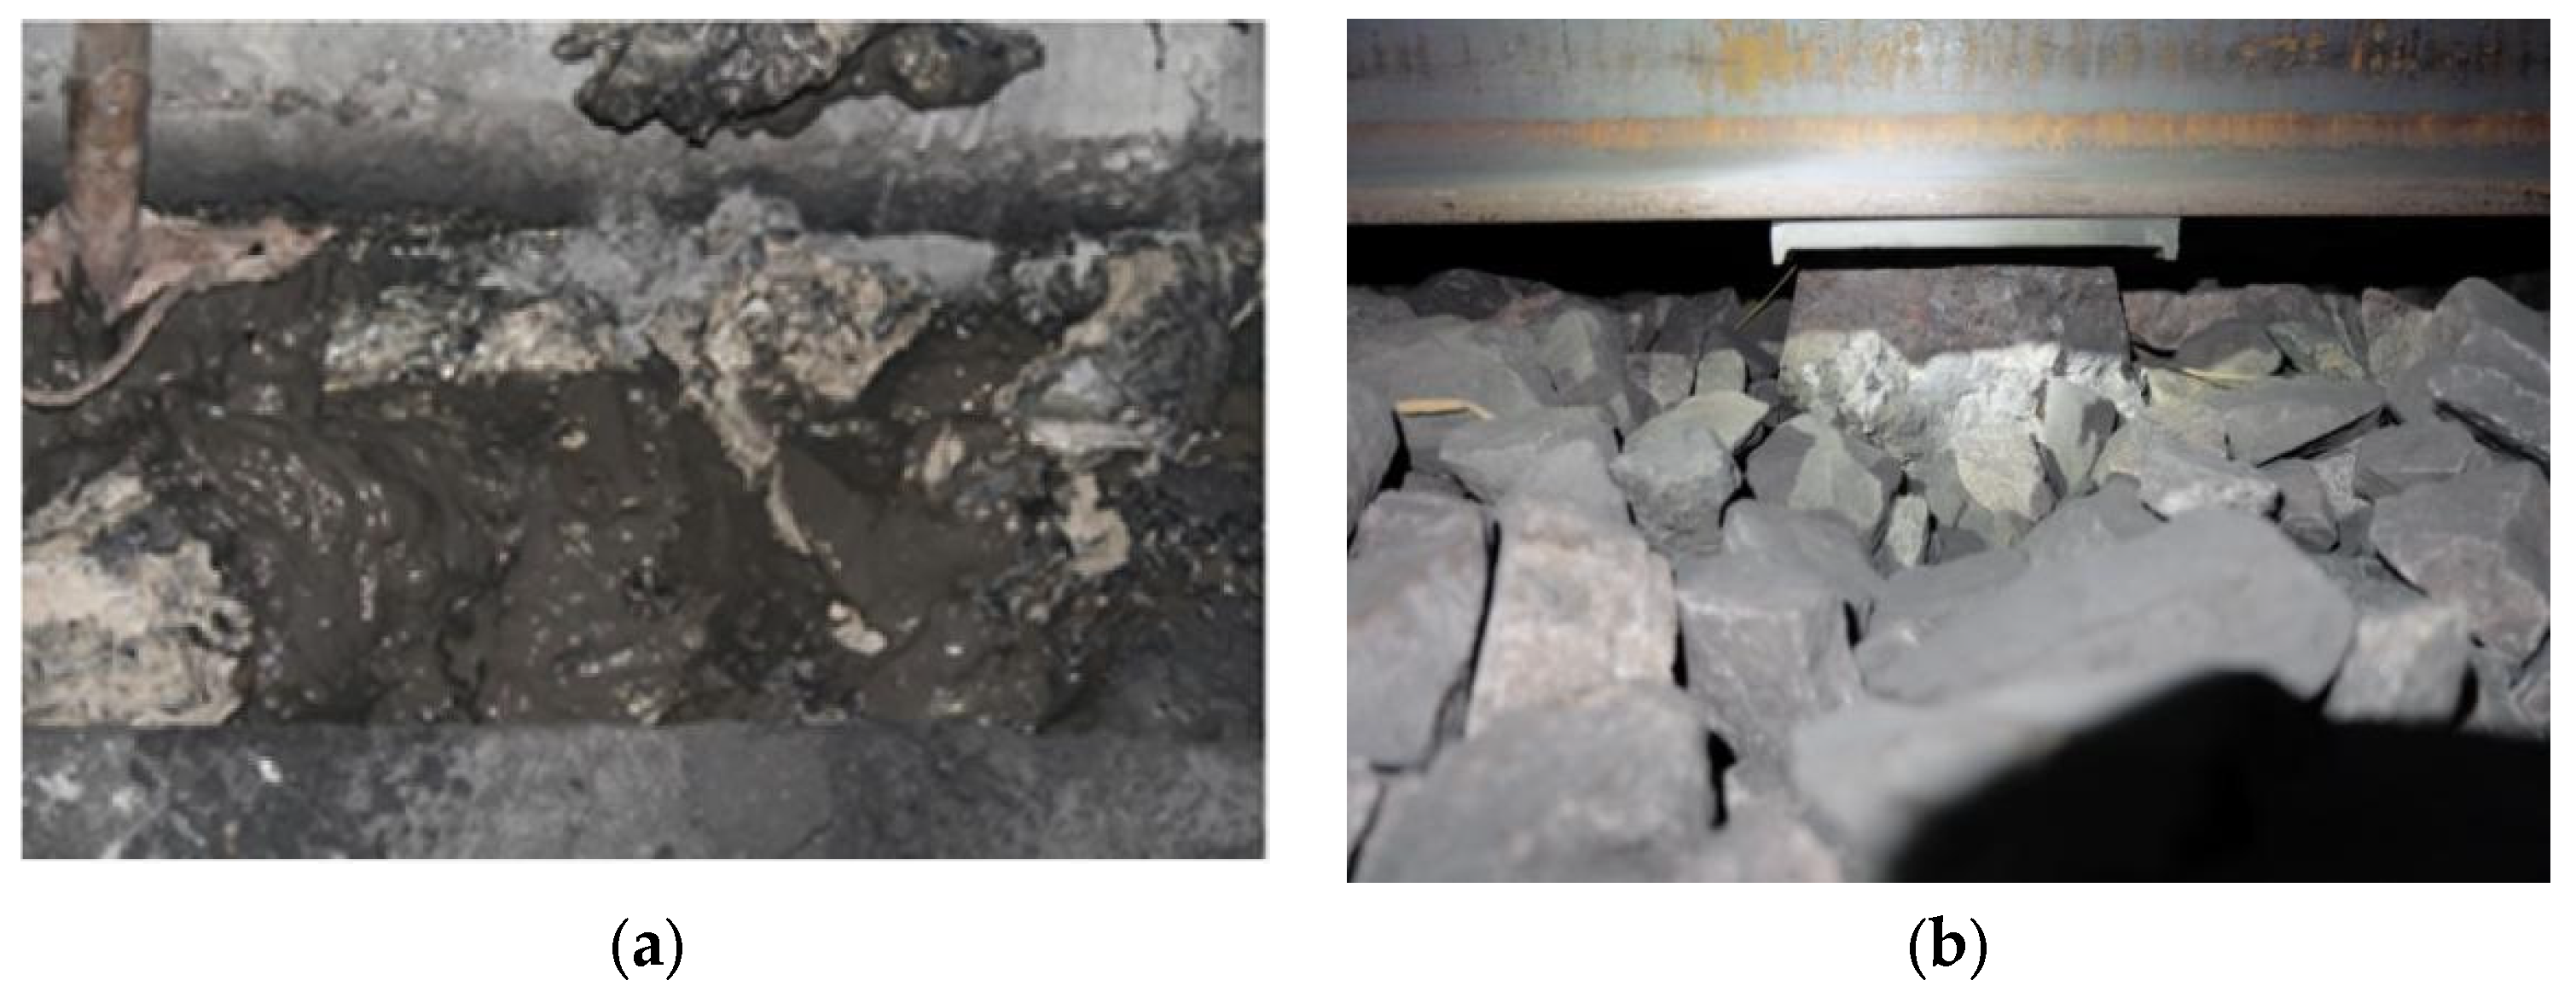
Figure 1. Partial tunnel foundation diseases: (a) Mud-pumping; (b) Foundation subsidence.
Buildings 15 03880 g001
Figure 2. Typical images of GPR: (a) Intact structure; (b) Structure void.
Buildings 15 03880 g002aBuildings 15 03880 g002b
Figure 3. Tunnel base drilling core samples.
Buildings 15 03880 g003
Figure 4. Layout of dynamic testing monitoring points.
Buildings 15 03880 g004
Figure 5. On site sensor installation.
Buildings 15 03880 g005
Figure 8. Lateral distribution of peak dynamic stress on the base filling layer surface.
Buildings 15 03880 g008
Figure 10. Time–history curves of vertical acceleration at measuring points A1 and A4: (a) A1, Intact section; (b) A1, Void section; (c) A4, Intact section; (d) A4, Void section.
Buildings 15 03880 g010aBuildings 15 03880 g010b
Table 1. Peak acceleration on the surface of the filling layer of the intact sections of Class Ⅴ surrounding rock (m/s2).
Monitoring Point25 t Axle Load Growth Rate27 t Axle LoadGrowth Rate30 t Axle Load
A12.8516.5%3.3220.8%4.01
A22.9610.5%3.2725.7%4.11
A33.0113.3%3.4127.3%4.34
A40.9816.3%1.1421.1%1.38
A50.8113.6%0.9221.7%1.12
A60.4910.2%0.5418.5%0.64
Table 2. Peak acceleration on the surface of the filling layer of the void sections of Class Ⅴ surrounding rock (m/s2).
Monitoring Point25 t Axle Load Growth Rate27 t Axle LoadGrowth Rate30 t Axle Load
A13.4616.2%4.0223.1%4.95
A23.6612.6%4.1222.8%5.06
A33.3717.5%3.9620.7%4.78
A41.0915.6%1.2618.3%1.49
A50.8717.2%1.0221.6%1.24
A60.5315.1%0.6118.0%0.72
Disclaimer/Publisher’s Note: The statements, opinions and data contained in all publications are solely those of the individual author(s) and contributor(s) and not of MDPI and/or the editor(s). MDPI and/or the editor(s) disclaim responsibility for any injury to people or property resulting from any ideas, methods, instructions or products referred to in the content.