3.1. Rail Corrugation on Small Radius
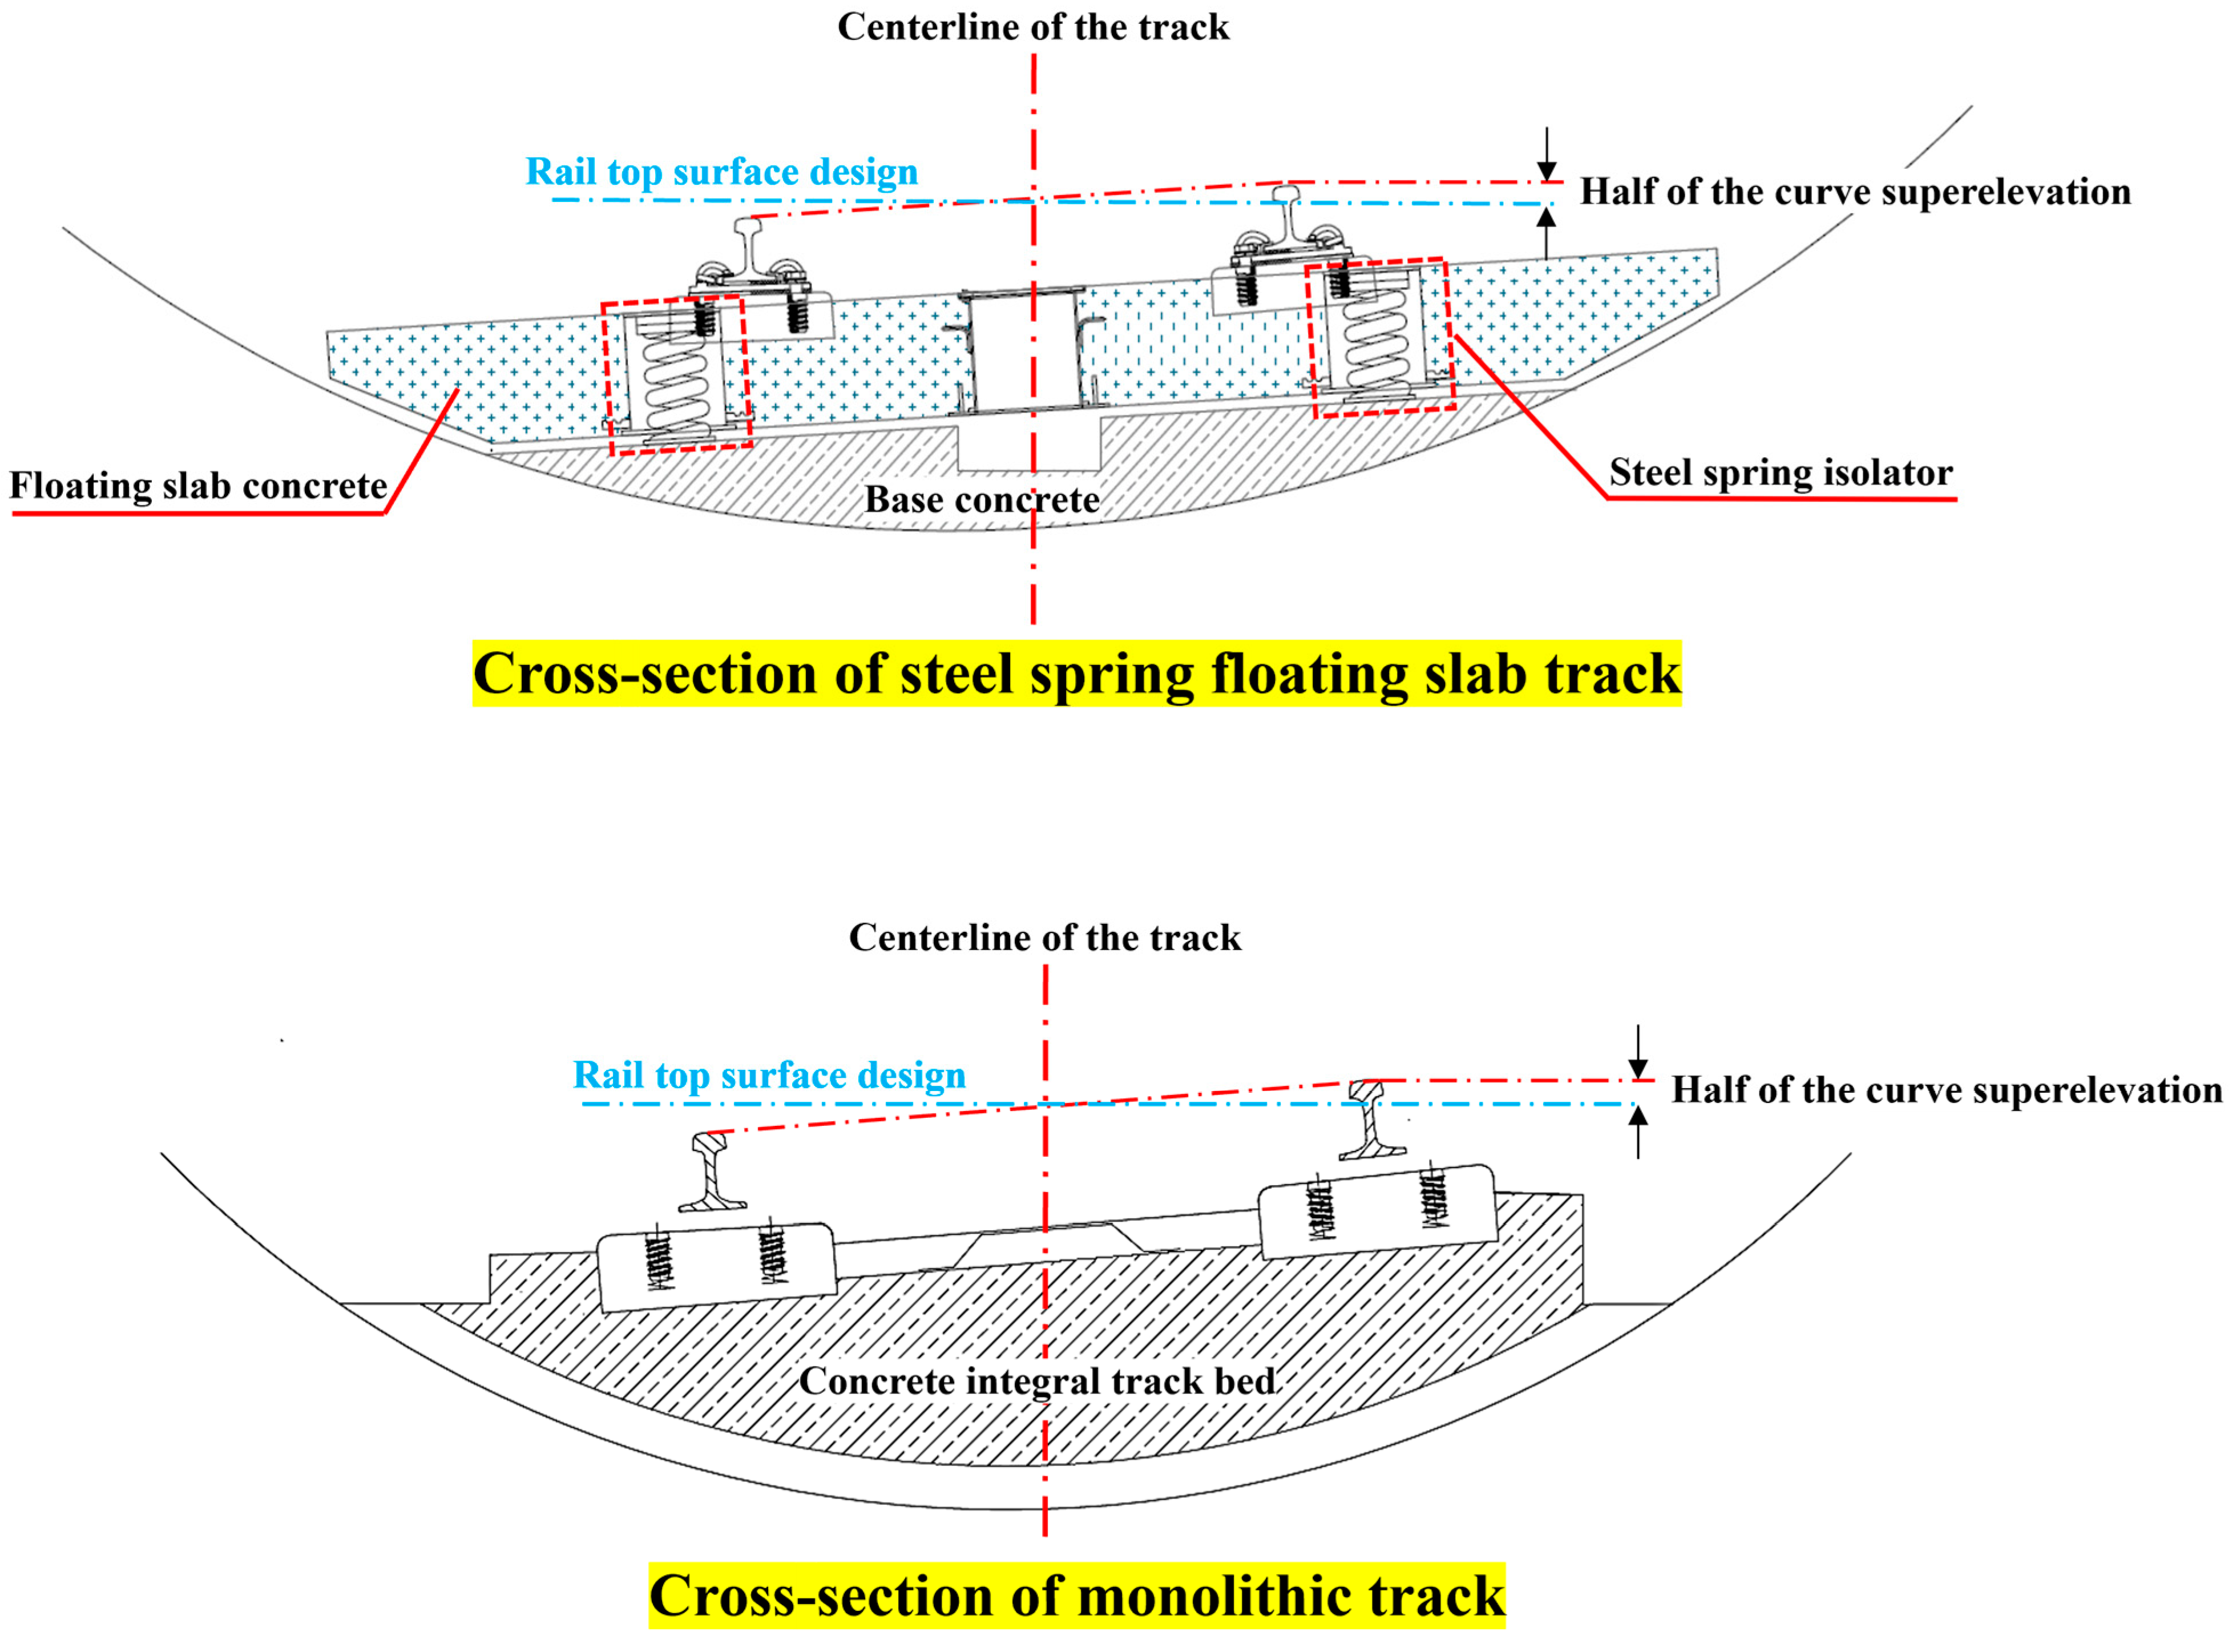
Since all the test sections were located on small-radius curve sections, the line design adopted the setting of outer rail superelevation to balance the vehicle’s centrifugal force. However, the actual train speed may not exactly match the balanced speed corresponding to the outer rail superelevation, which may lead to over-superelevation or under-superelevation problems during operation.
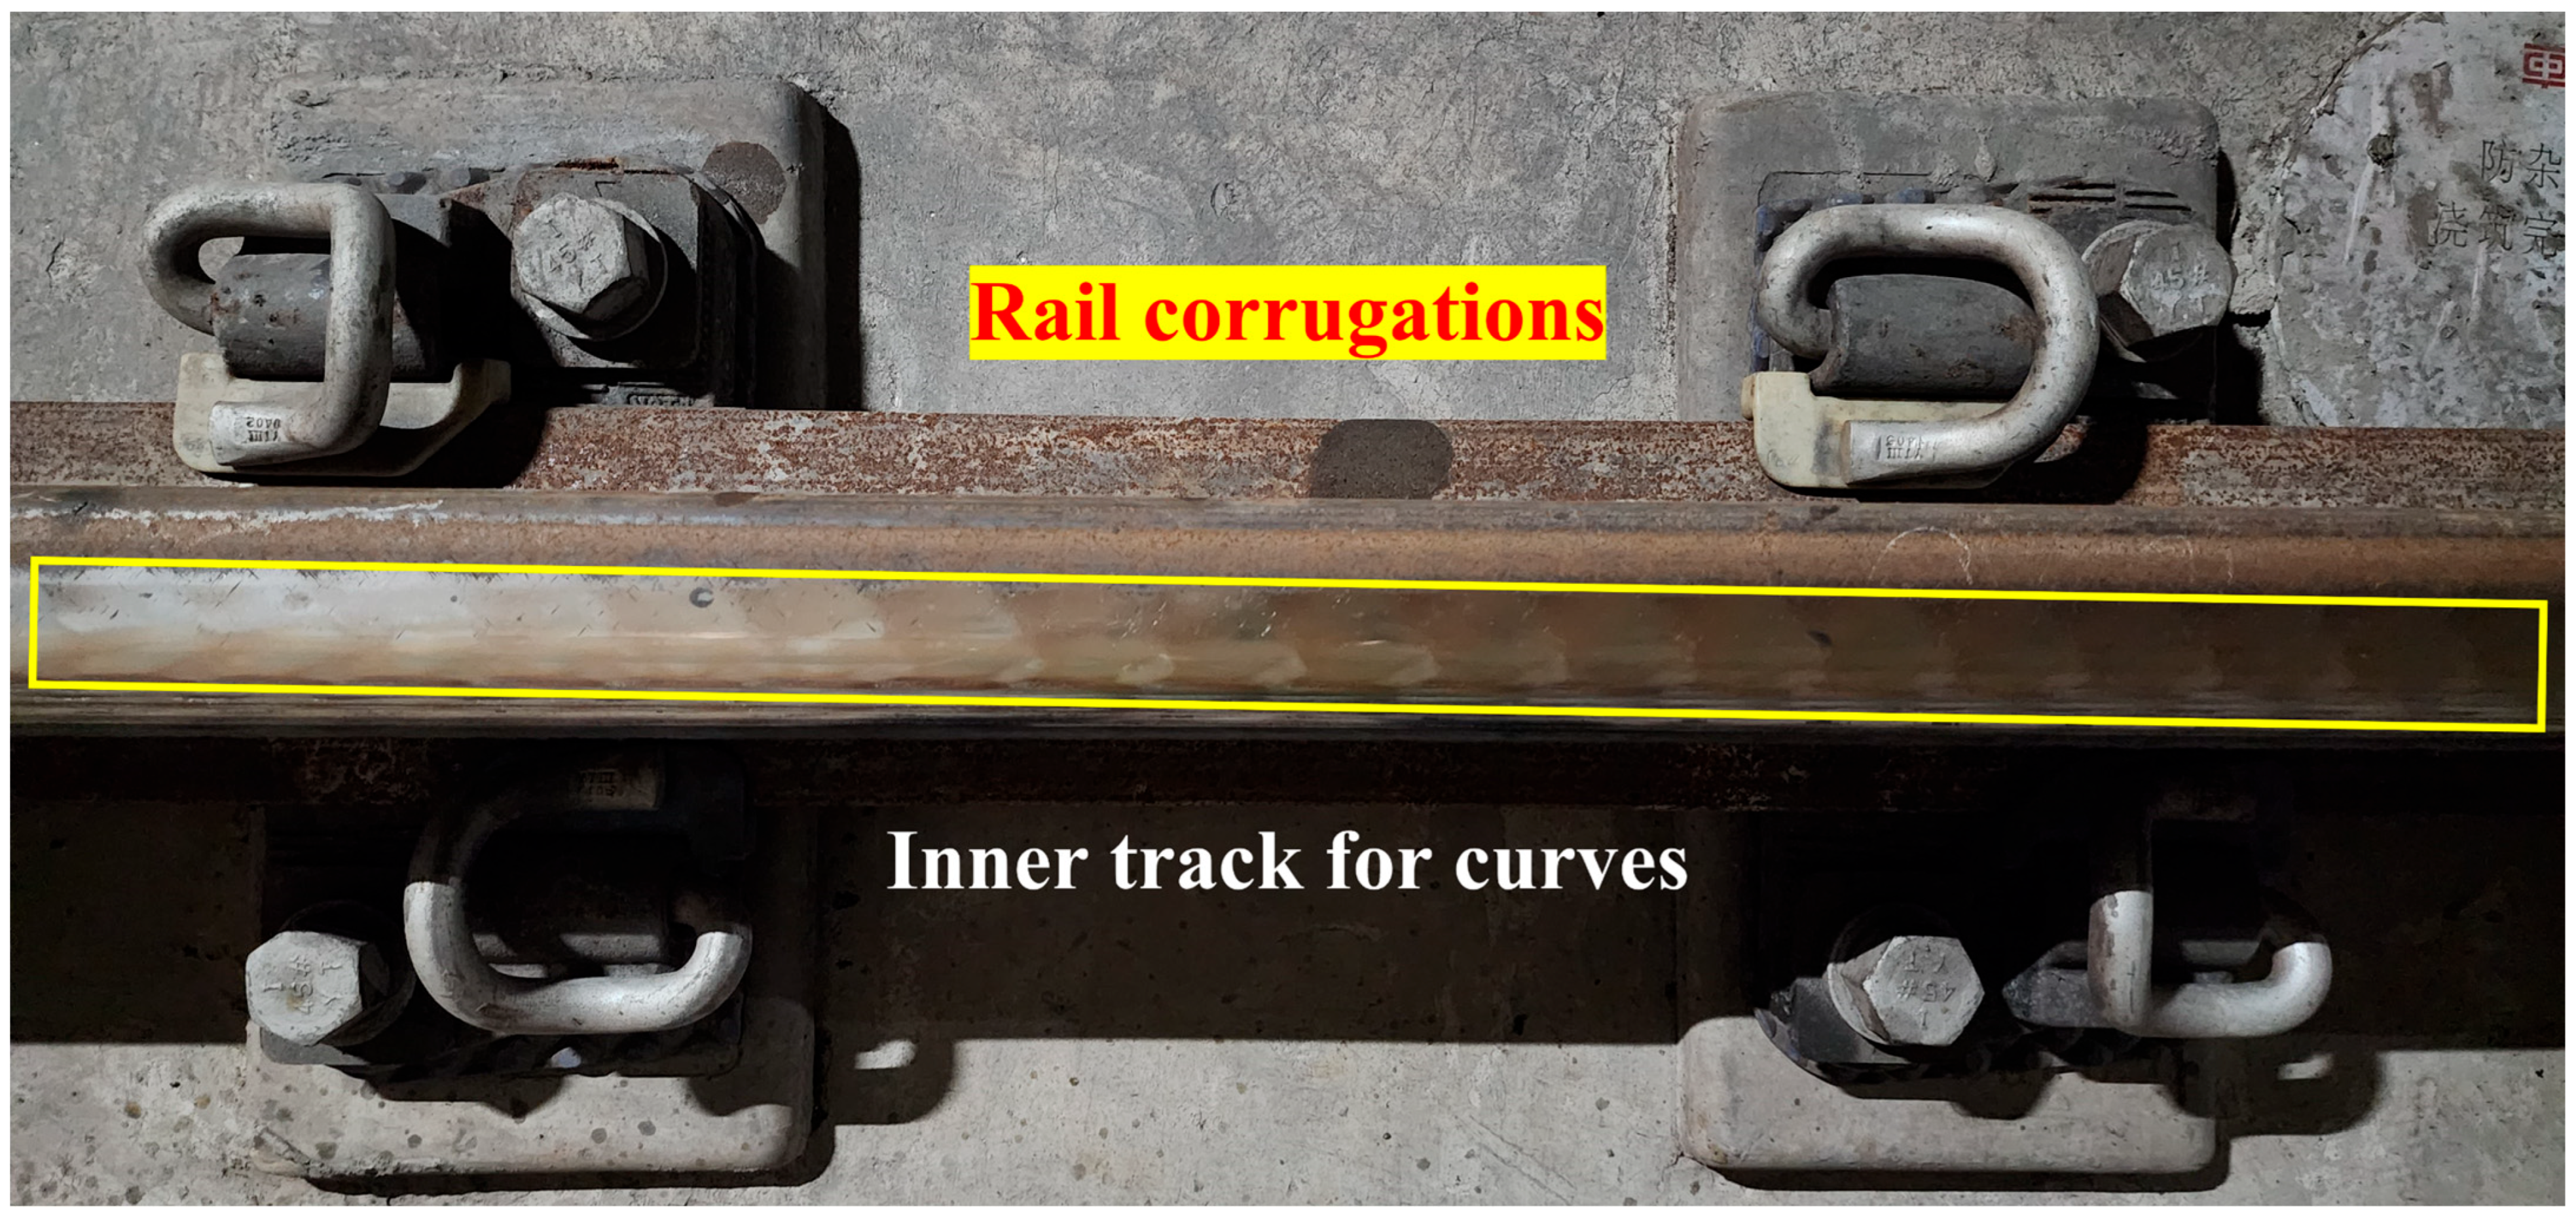
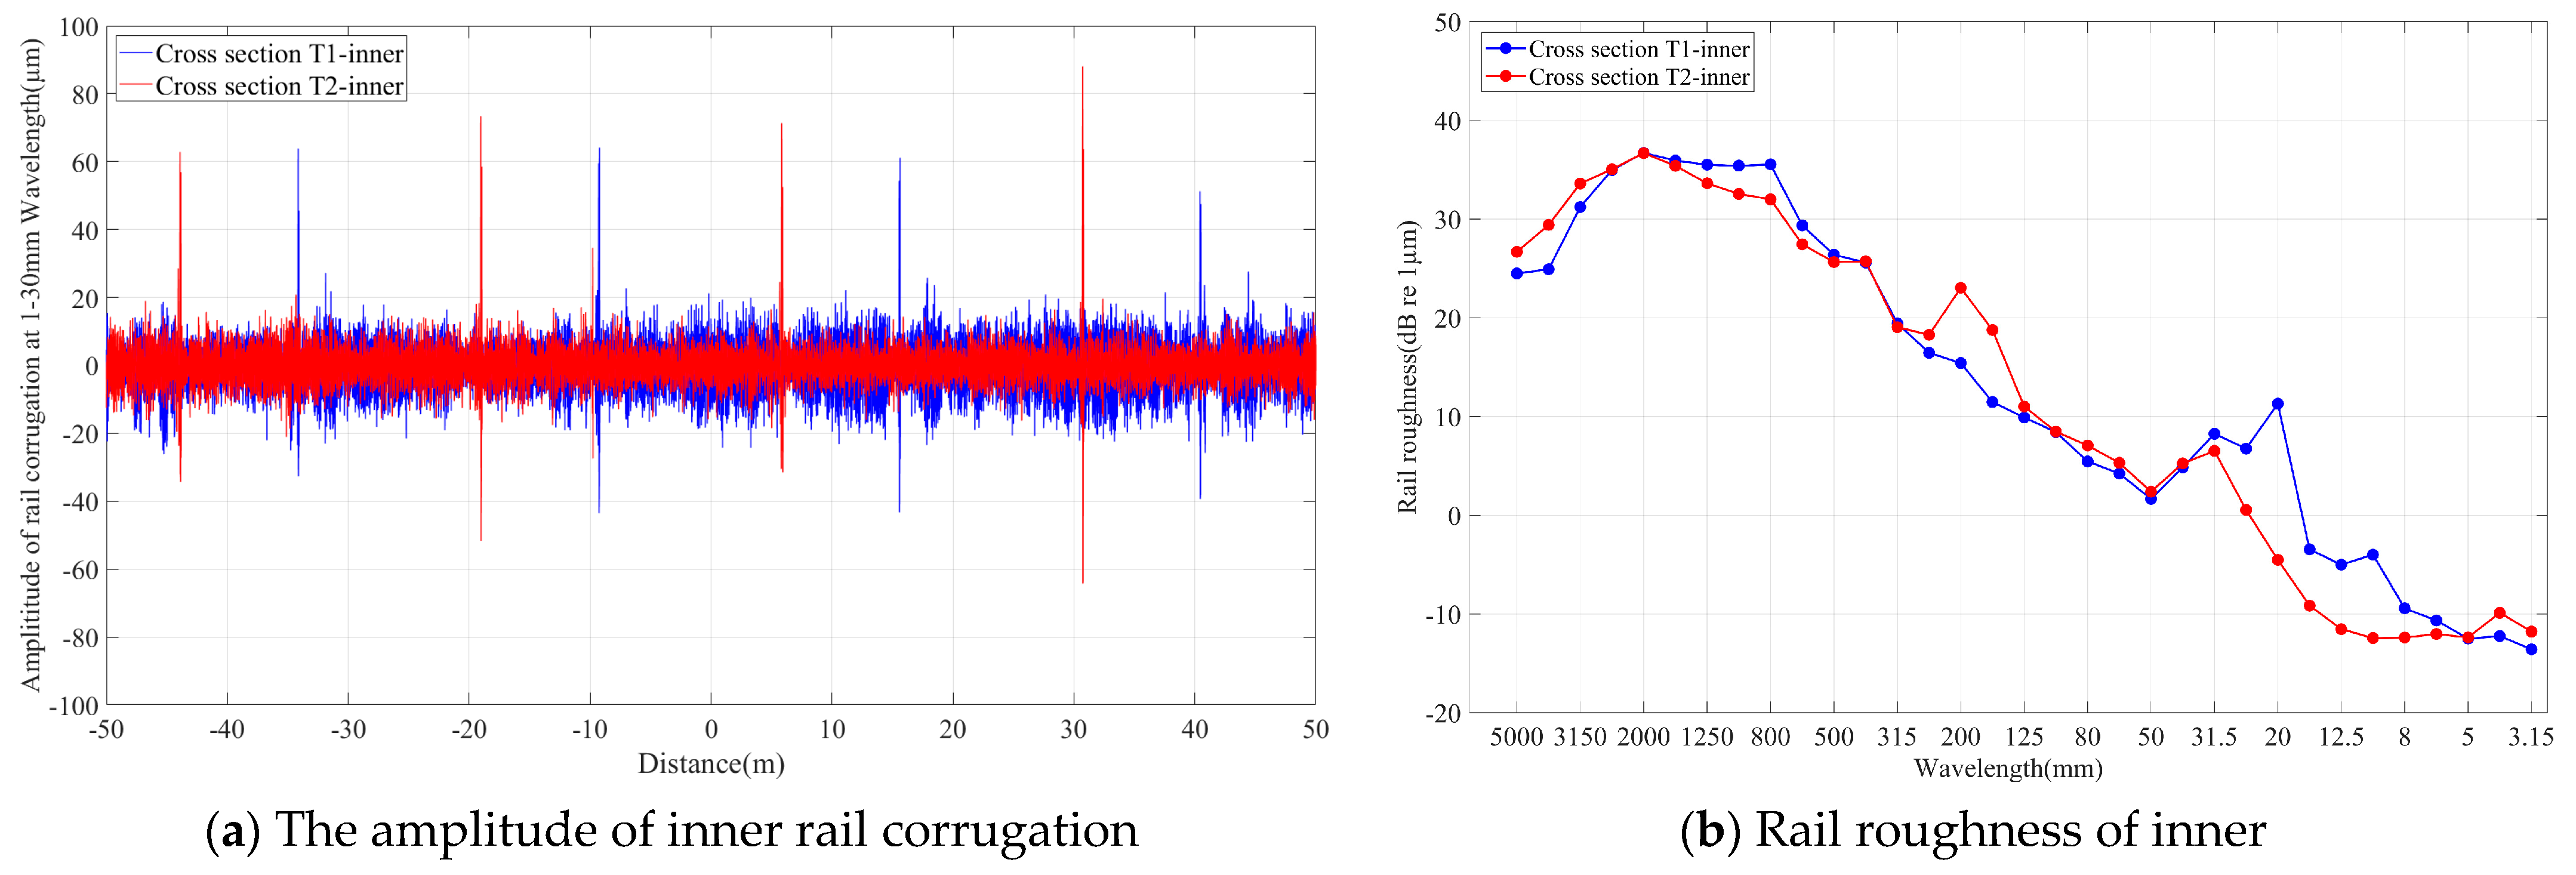
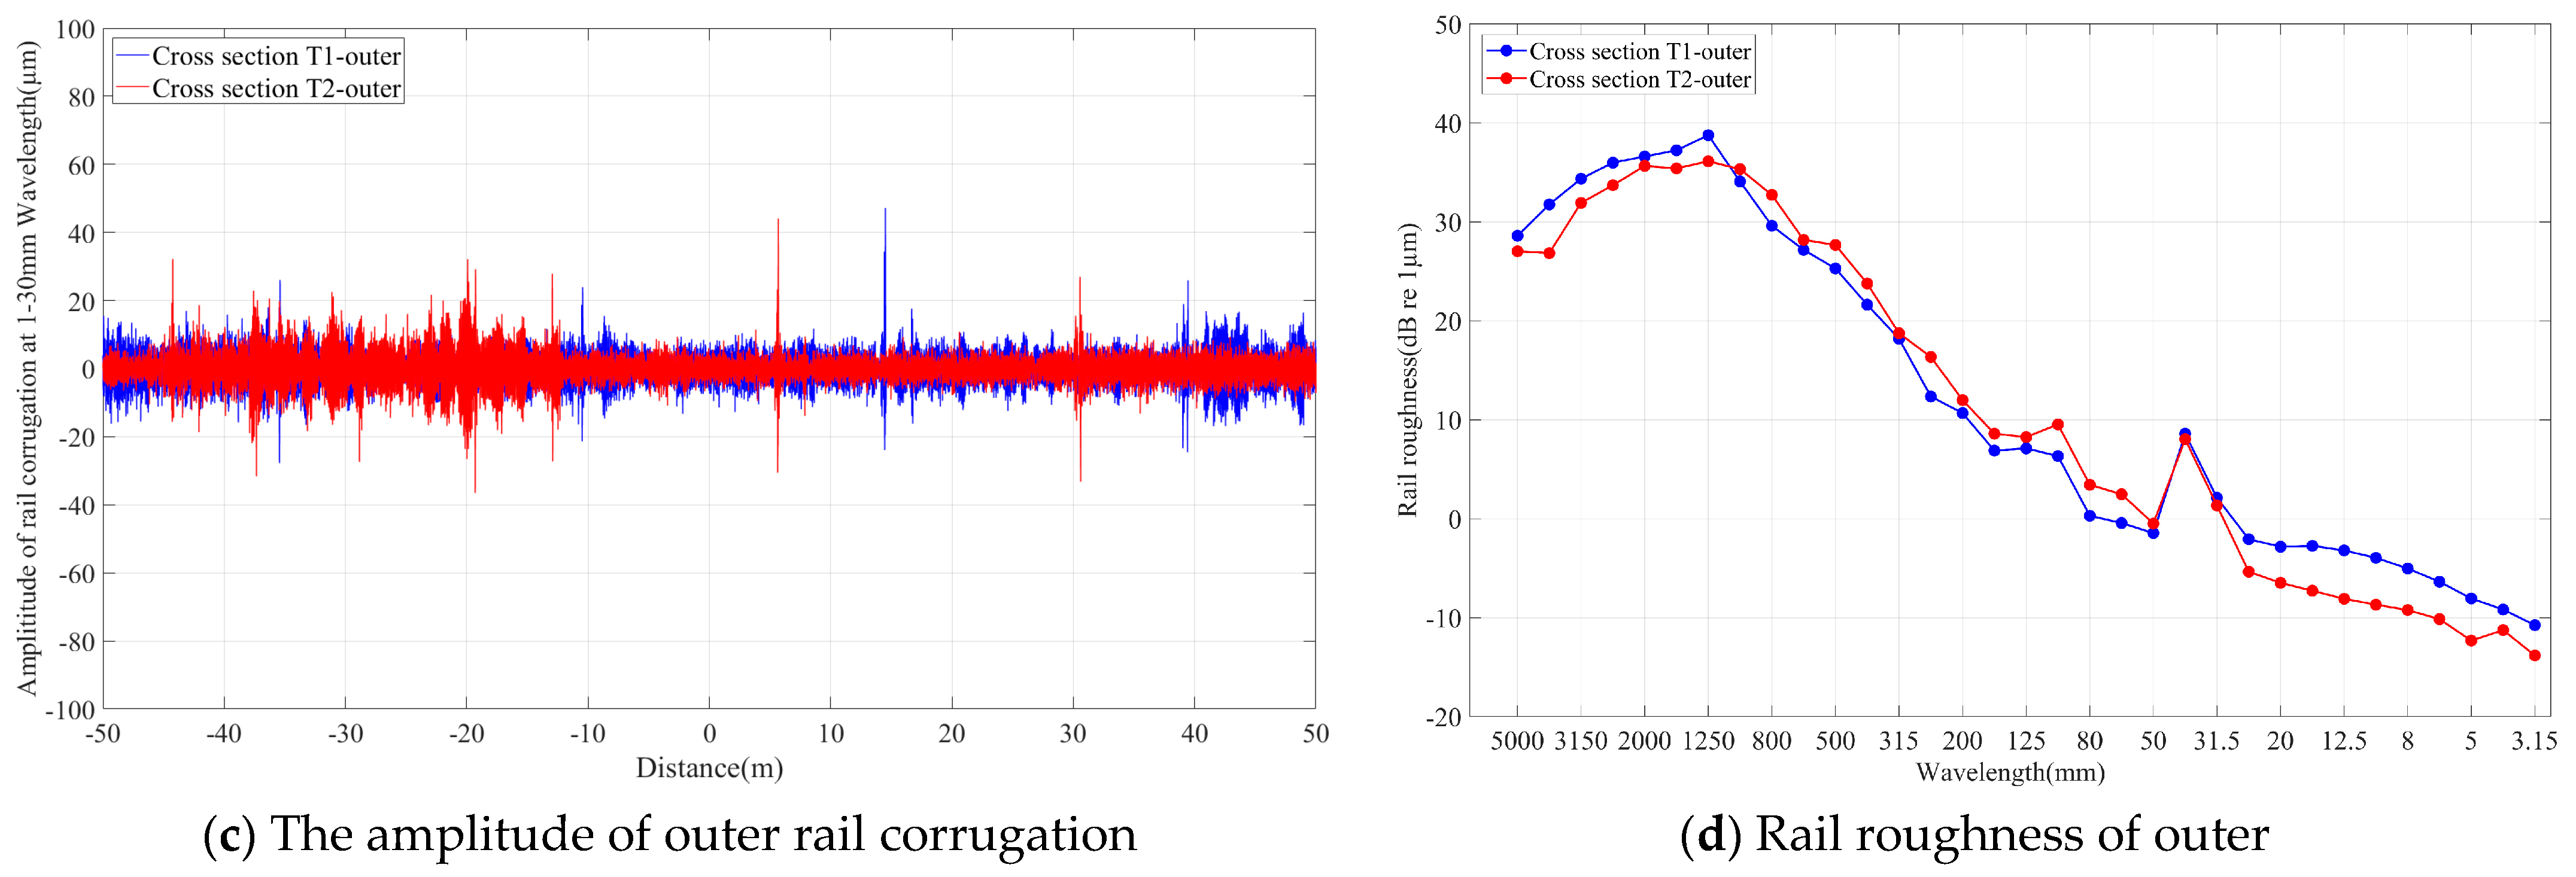
Figure 7 shows the measured results of rail corrugation depth within 50 m before and after two sections. The data indicate that the rail corrugation depth in both sections mainly ranges from 20 to 30 µm, with an abnormal peak at an interval of 25 m, which is the rail welding joint.
By comparing the wave amplitudes of the inner and outer rails in
Figure 7a,c, it can be seen that the wear depth on the top surface of the inner rails in both sections was greater than that of the outer rails. The actual superelevation set for this line is 105 mm, and the train speed is 57 km/h. Therefore, over-superelevation occurs when the train runs on this line, which causes the wheel flange to continuously press against the inner rail, thereby intensifying the wear of the inner rail.
The surface roughness grades of the rails in each section can be calculated using Equation (2), and the 1/3 octave wavelength spectra are shown in
Figure 7b,d.
where
Lr,i is the roughness value of the rail with each center frequency of 1/3 octave frequency band, dB;
is the root mean square value of rail surface roughness with each center frequency of 1/3 octave frequency band, µm;
is the reference roughness, 1 µm.
The analysis of corrugation characteristic wavelengths revealed that for the inner rail of cross-section T1, the corrugation exhibited a dual-peak characteristic of 20 mm and 31.5 mm. Regarding the inner rail of cross-section T2, aside from the common wavelength component of 31.5 mm, there was also a long-wave component of 200 mm. The outer-rail corrugation of two cross-sections, on the other hand, had a dominant wavelength of 40 mm.
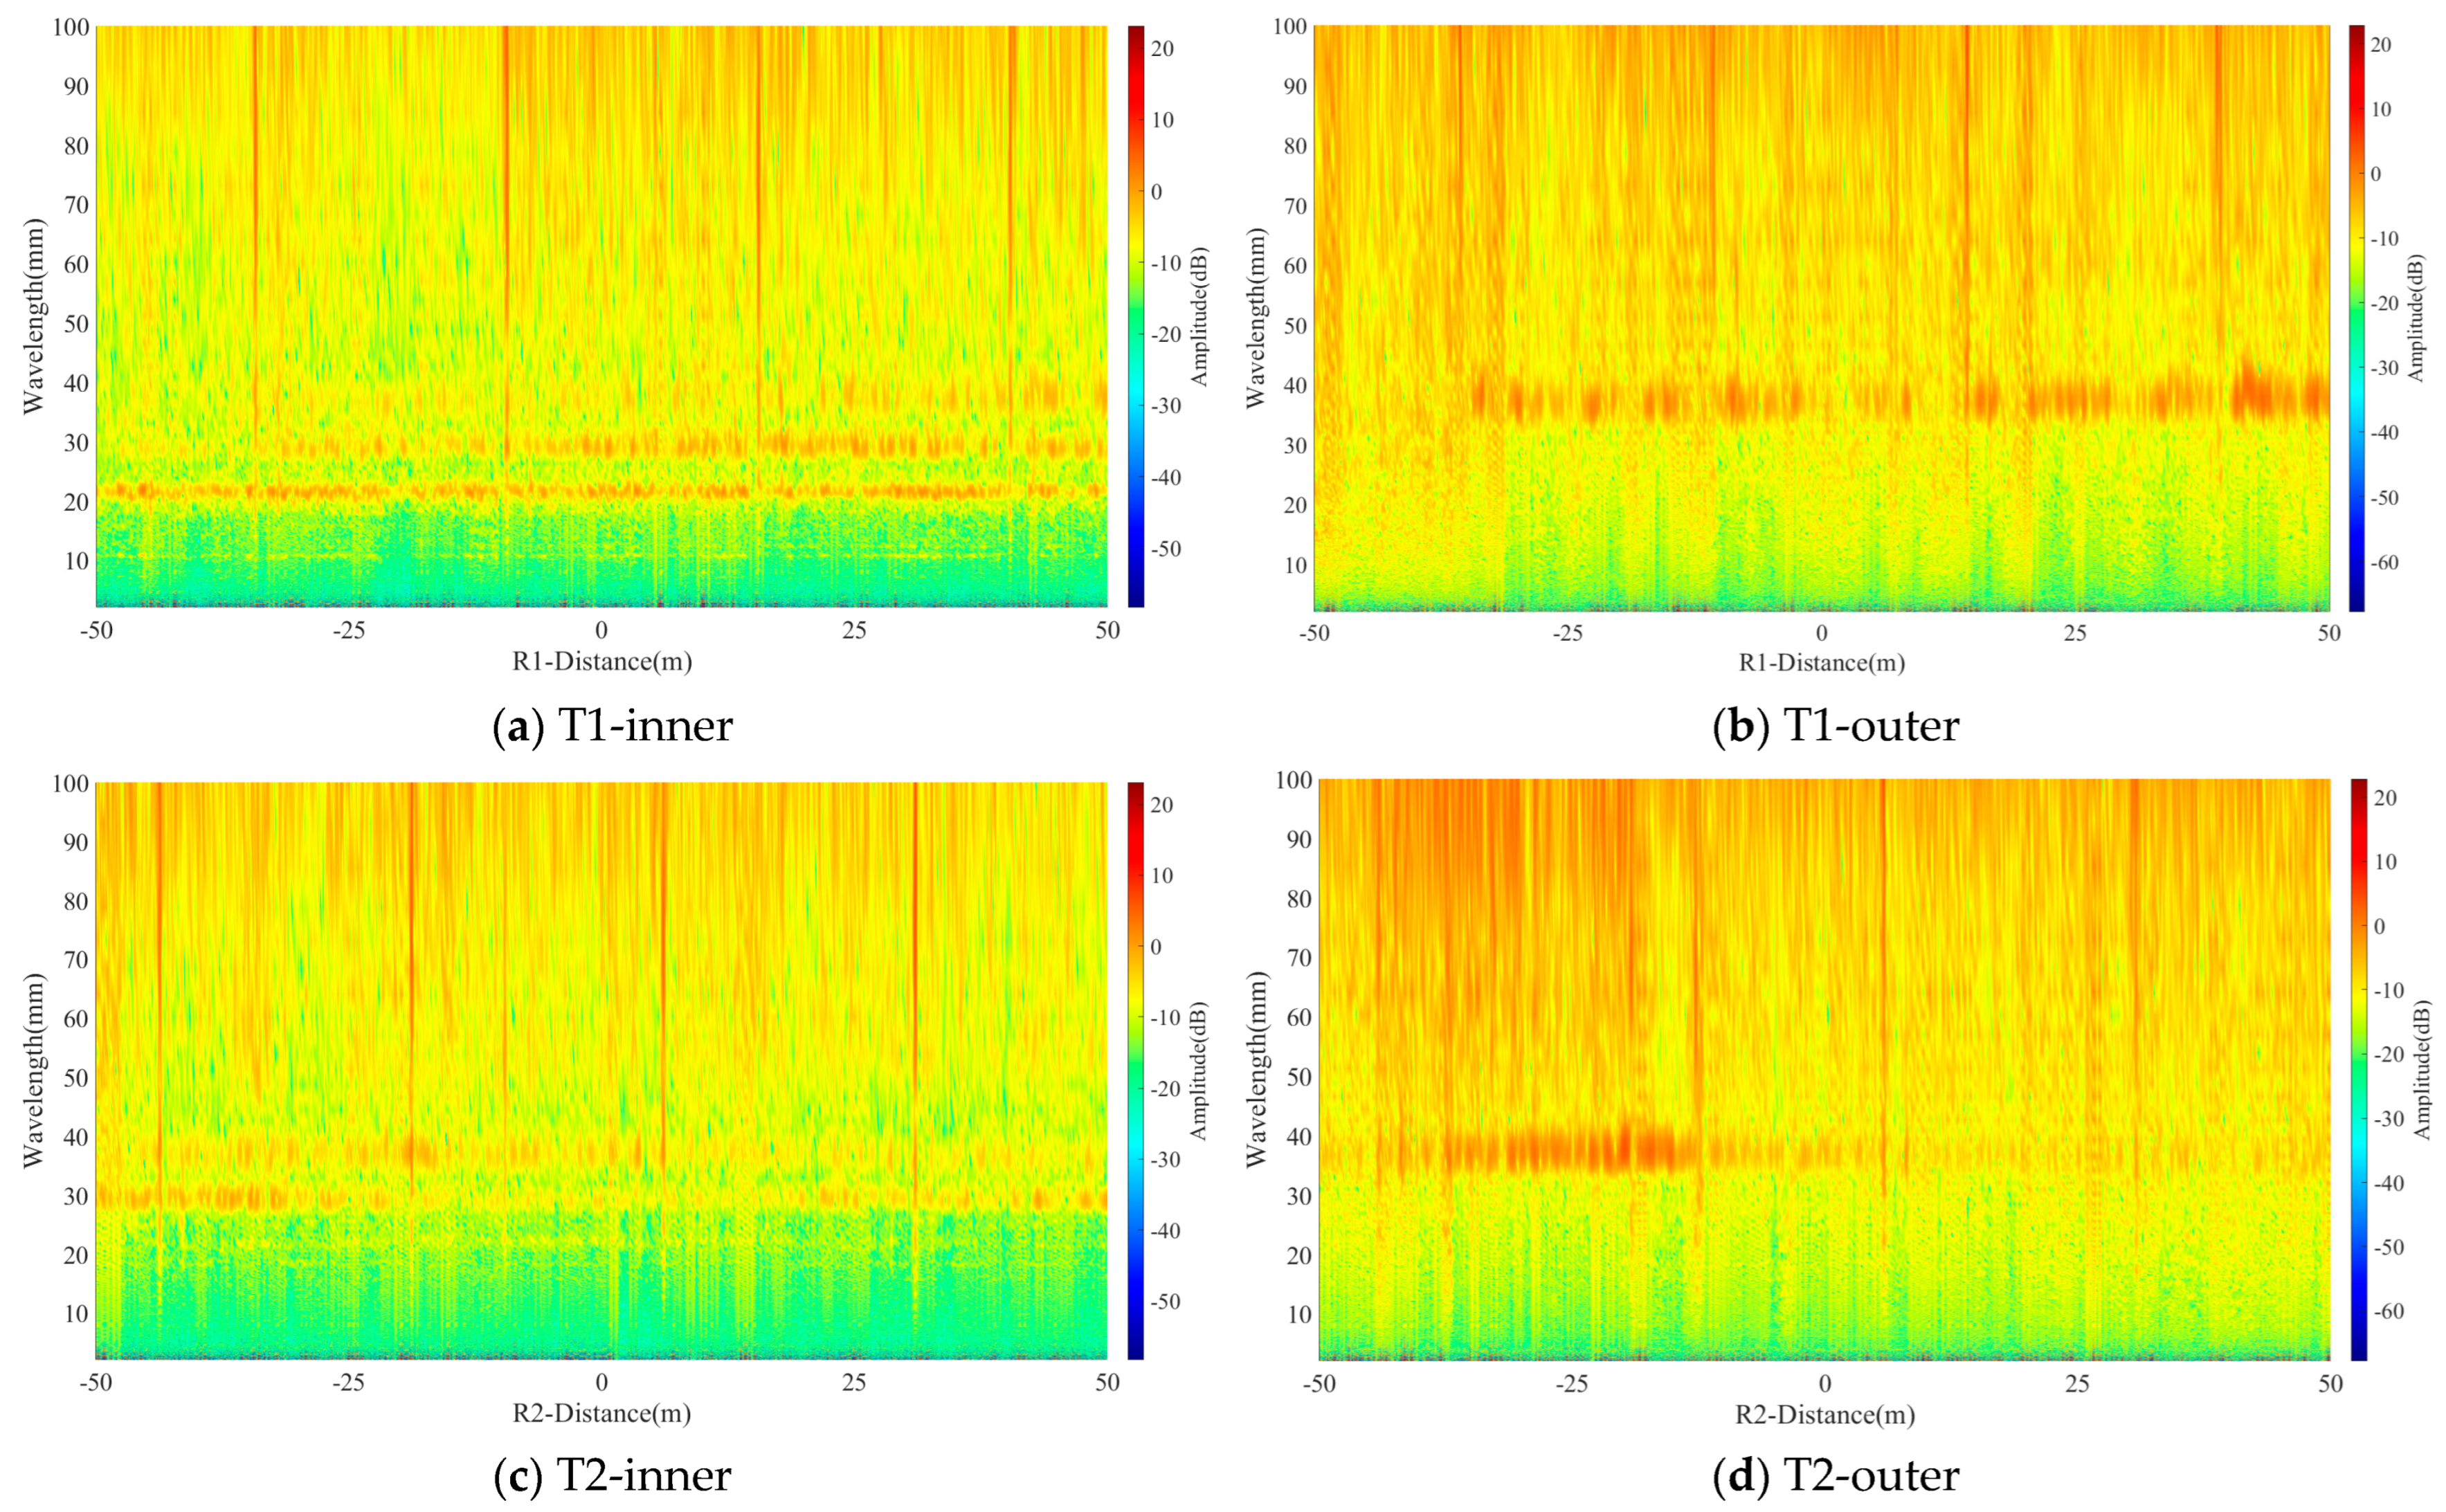
On this basis, the continuous wavelet transform (CWT) was employed to acquire the variation of rail roughness along the line extension direction for the two cross-sections within a wavelength range of 1–100 mm. The results are presented in
Figure 8.
From the results, it can be visually observed that the energy of the 50–100 mm wavelength of the T2 rail cross-section was more abundant compared with that of T1. Moreover, the corrugation with a wavelength of 20 mm on the inner rail of cross-section T1 was the most prominent.
Based on Equation (3), the excitation frequencies induced by each characteristic wavelength can be computed.
where
is the train speed, m/s, and
is the wavelength of the rail corrugation, m.
For cross-section T1, the corrugation-induced main frequencies were 395 Hz, 502 Hz, and 790 Hz. In the case of cross-section T2, typical frequency components of 80 Hz, 395 Hz, 502 Hz, and 790 Hz were generated. The high-frequency components of 395 Hz, 502 Hz, and 790 Hz occurred simultaneously in both cross-sections. These frequencies are associated with the bending mode of the wheel and the self-excited vibration of wheel–rail friction within the wheel–rail system of small-radius curve segments.
Waves of different wavelengths can cause various engineering problems. The short-wavelength corrugations (20–40 mm) present on the cross-sections corresponded to high-frequency vibrations (395–790 Hz), which are close to the natural frequencies of components such as track fasteners [
19]. This can easily induce resonance and accelerate their fatigue damage. At the same time, such high-frequency vibrations transmitted into the vehicle can produce a shrill noise, and this phenomenon may be exacerbated on curves [
20]. It is worth noting that the 200 mm corrugations unique to the T2 cross-section generated vibrations at approximately 80 Hz. These vibrations have the following characteristics: on the one hand, their concentrated energy transmission may increase the long-term maintenance burden on tunnel structures; on the other hand, this frequency falls within the 4–80 Hz range that is sensitive to the human body [
21], which may affect passenger comfort. Additionally, since 80 Hz is within the frequency band with a relatively high vibration transmission rate in the tunnel–soil system, its energy attenuates relatively less when spreading to the surroundings, thus the potential environmental impact on nearby buildings also deserves attention.
3.2. Tunnel Vibration Characteristics
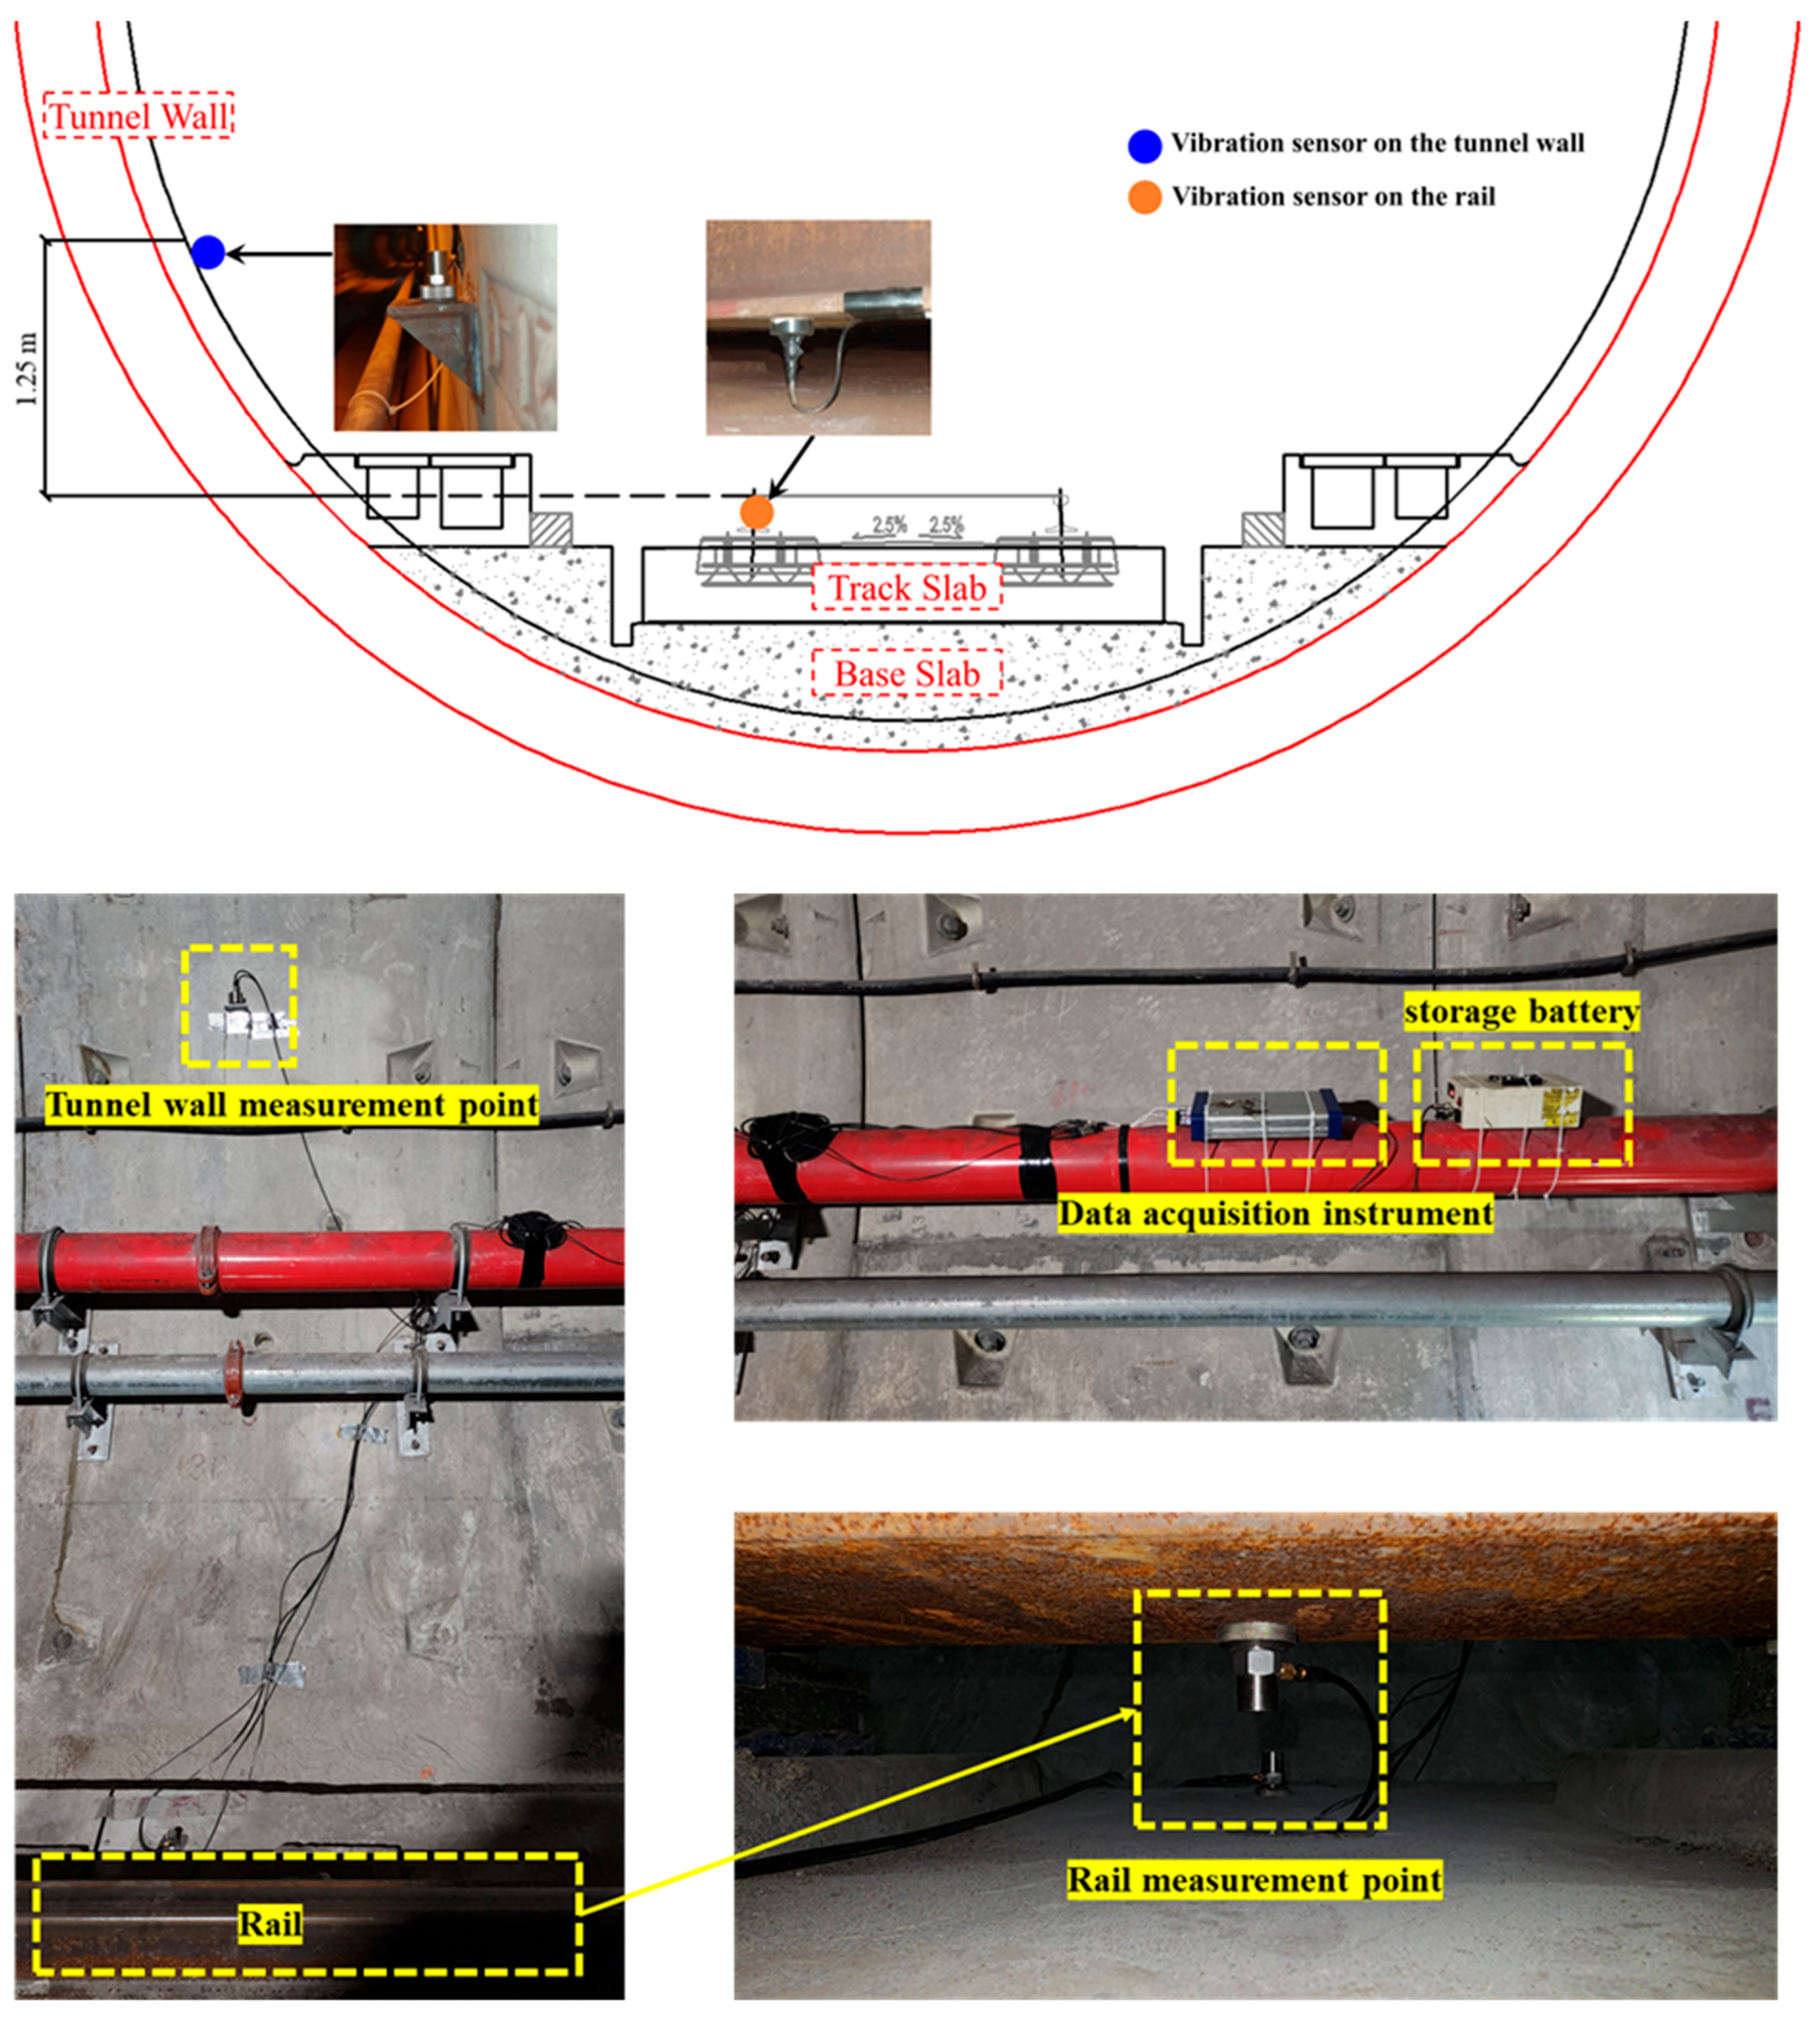
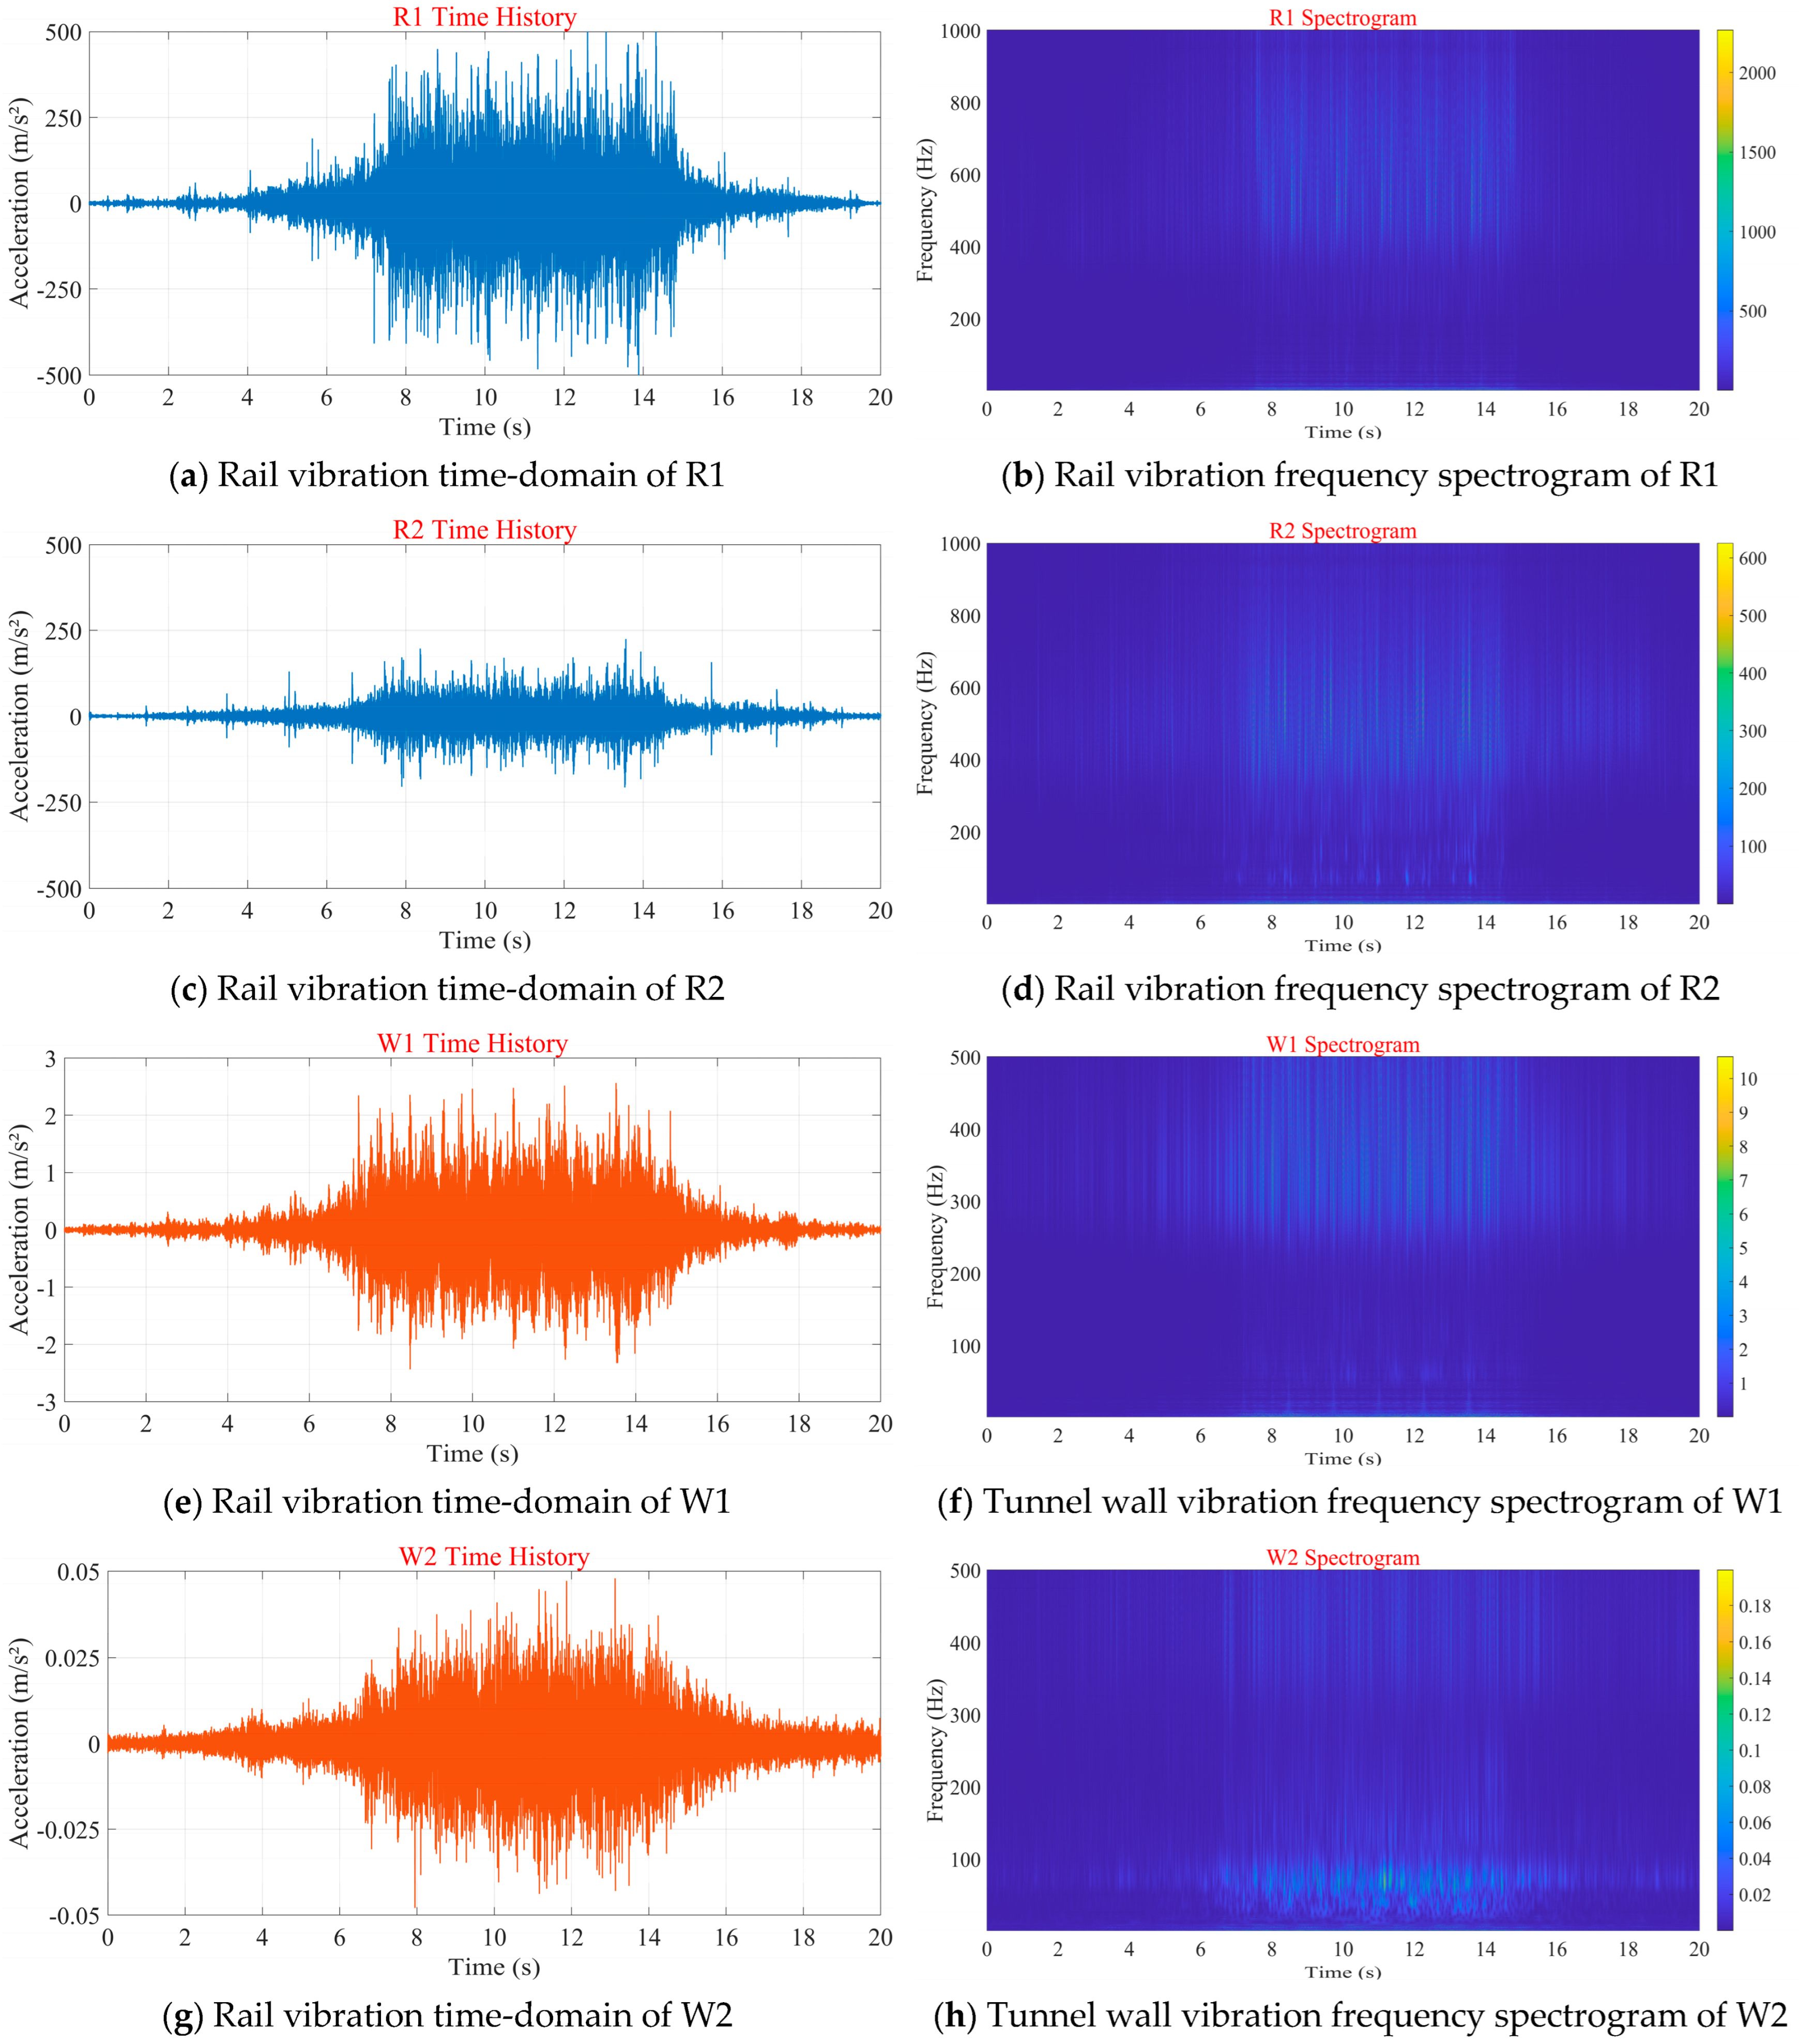
Similarly, the time history curves and frequency spectra of vertical vibration acceleration at the rail and tunnel wall measurement points for each section are presented in
Figure 9. Measurement points R1 and R2 recorded train passage speeds of 57 km/h. As shown in figure, the vibration magnitude of R1 was significantly higher than R2, with a peak acceleration amplitude reaching 500 m/s
2. According to the band-like features observed in the frequency spectra, the dominant frequency range of measurement point R1 was concentrated within the 400–1000 Hz band. In comparison, the frequency band of R2 exhibited a broader distribution and shifted as a whole toward the lower frequency range of 300–600 Hz.
As illustrated in
Figure 9e–h, the vibration underwent significant attenuation after being transmitted to the tunnel wall. The acceleration amplitude at measurement point W1 was approximately 3 m/s
2, whereas section W2 incorporated vibration-reduction measures, resulting in a tunnel wall acceleration amplitude of only 0.05 m/s
2. Spectral analysis revealed that low-frequency components below 200 Hz dominated the tunnel wall’s vibration response, and the frequency response range of W2 was broader compared with that of W1. According to the vibration isolation mechanism of the steel spring floating slab, vibrations above 16 Hz at measurement point W2 should be effectively suppressed. However, further analysis of the rail corrugation characteristics indicated that the 200 mm wavelength corrugation generated by the steel spring floating slab in small-radius curve sections altered the vibration energy distribution of the tunnel wall. It caused an energy peak to emerge at 80 Hz, thereby negatively impacting the expected vibration reduction performance of the floating slab system.
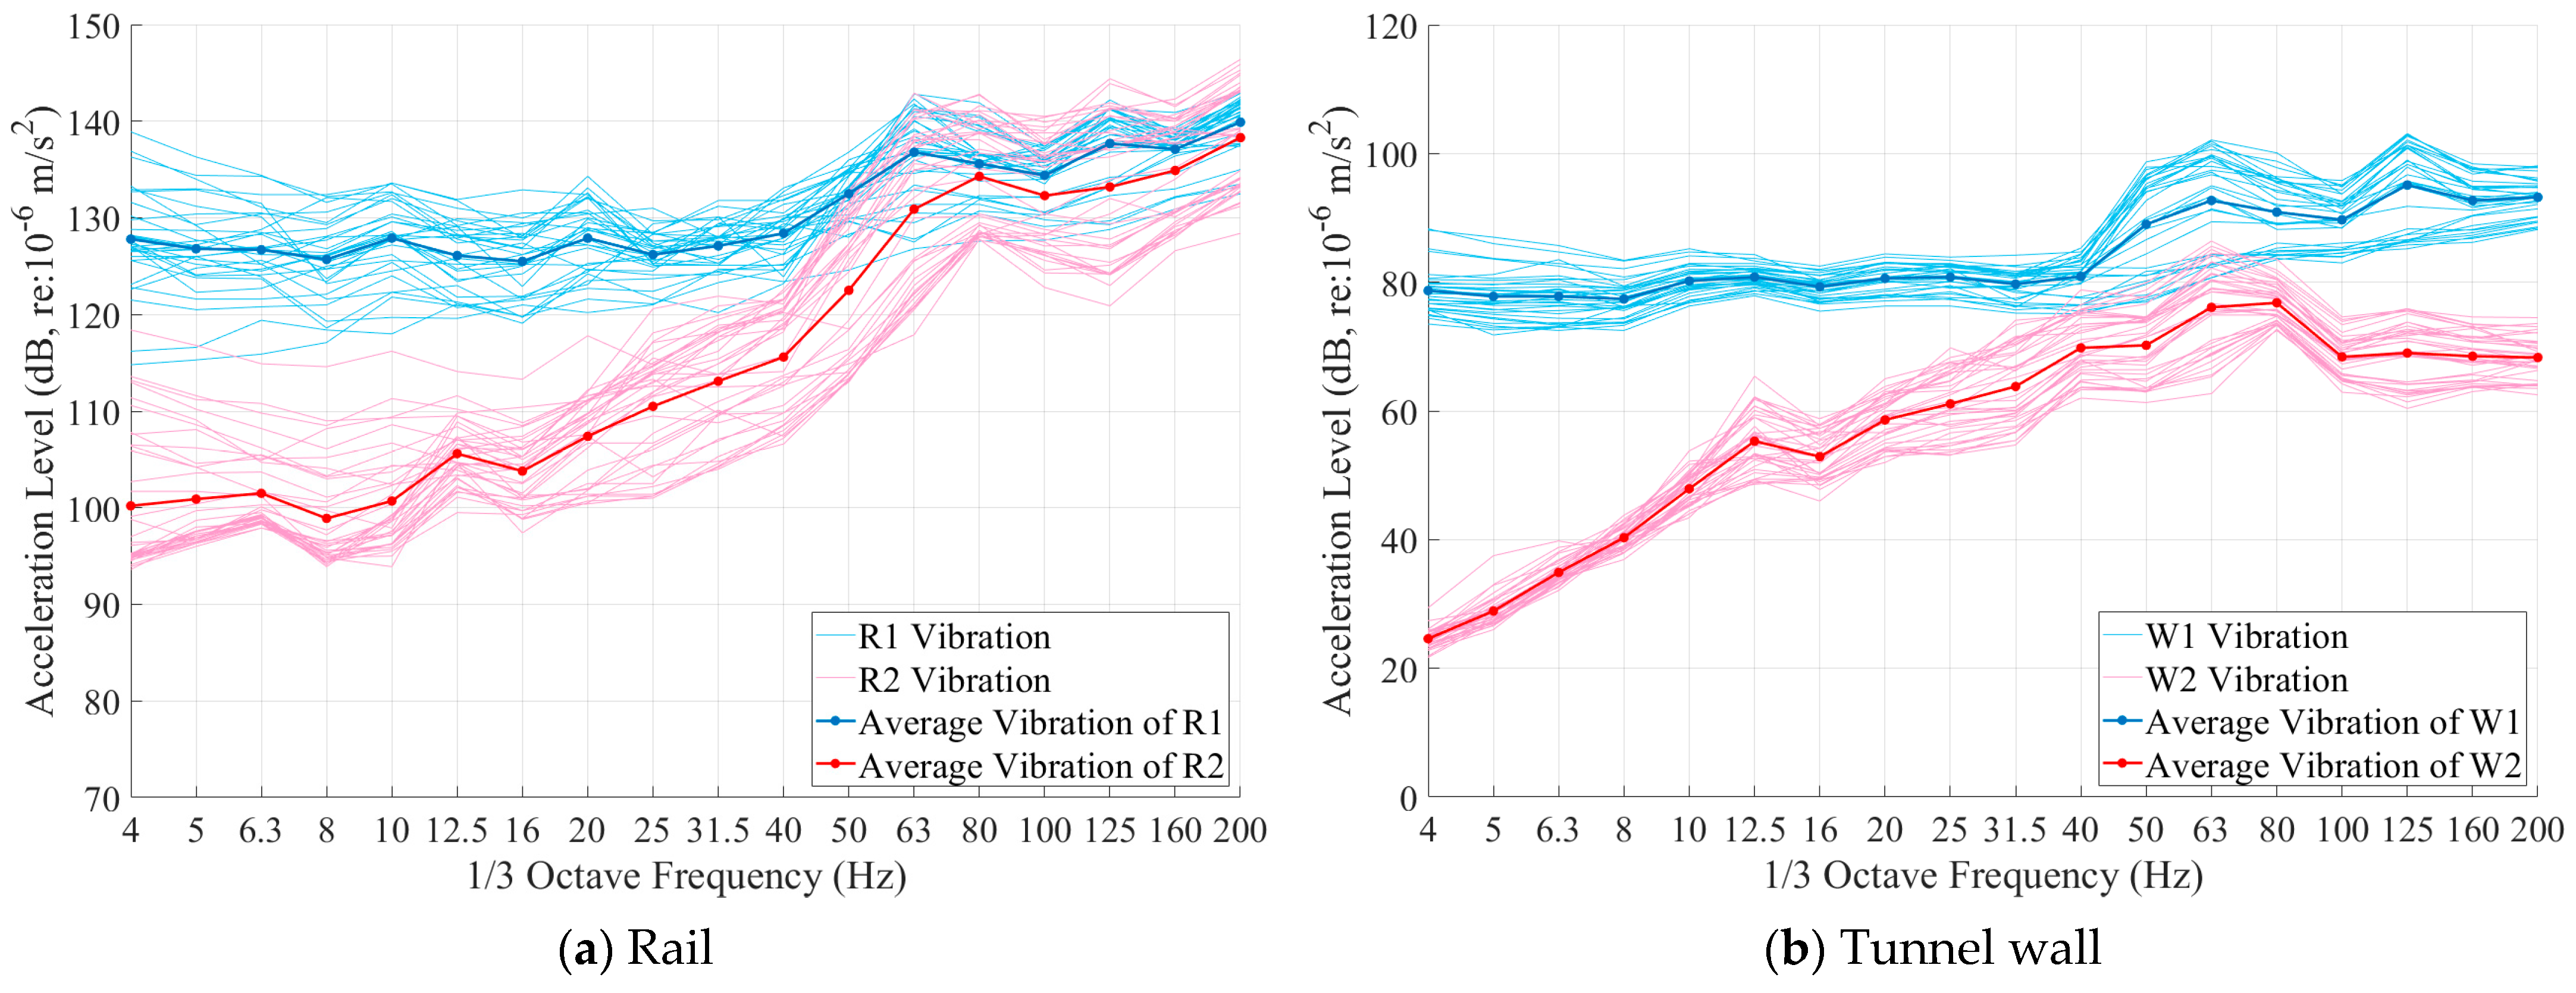
Figure 10 presents the 1/3 octave band vibration acceleration level data collected at each measurement point on sections T1 and T2 during train passage events. The test results revealed that due to variations in train load and wheel conditions, the rail’s vibration response exhibited significant fluctuations, with the maximum difference in vibration levels reaching up to 20 dB. However, the vibration response spectra across different train passages showed good consistency, supporting the appropriateness of using the average vibration acceleration as a characteristic parameter for vibration analysis in this section.
In the test results from section T2, both the rail R2 and tunnel wall W2 exhibited a clear peak in vibration acceleration at 80 Hz. This characteristic frequency aligns with the theoretical excitation frequency associated with the rail surface rail corrugation having a wavelength of 200 mm, further confirming the influence of rail corrugation on structural vibration. Specifically, the overall vibration level of rail R1 was higher than that of R2; however, within the 60–200 Hz frequency band, the vibration difference between the two rails was notably reduced. Importantly, above 80 Hz, the tunnel wall W2, which incorporated vibration-reduction measures, demonstrated a significant attenuation of vibration. Additionally, a typical resonance response was observed at the natural frequency of the floating slab, 12.5 Hz. In contrast, the vibration spectrum characteristics at measurement point W1, where no vibration-reduction measures were implemented, closely resembled those of rail R1, with no evident shift in the dominant frequency of vibration energy.
3.3. Building Vibration Characteristics
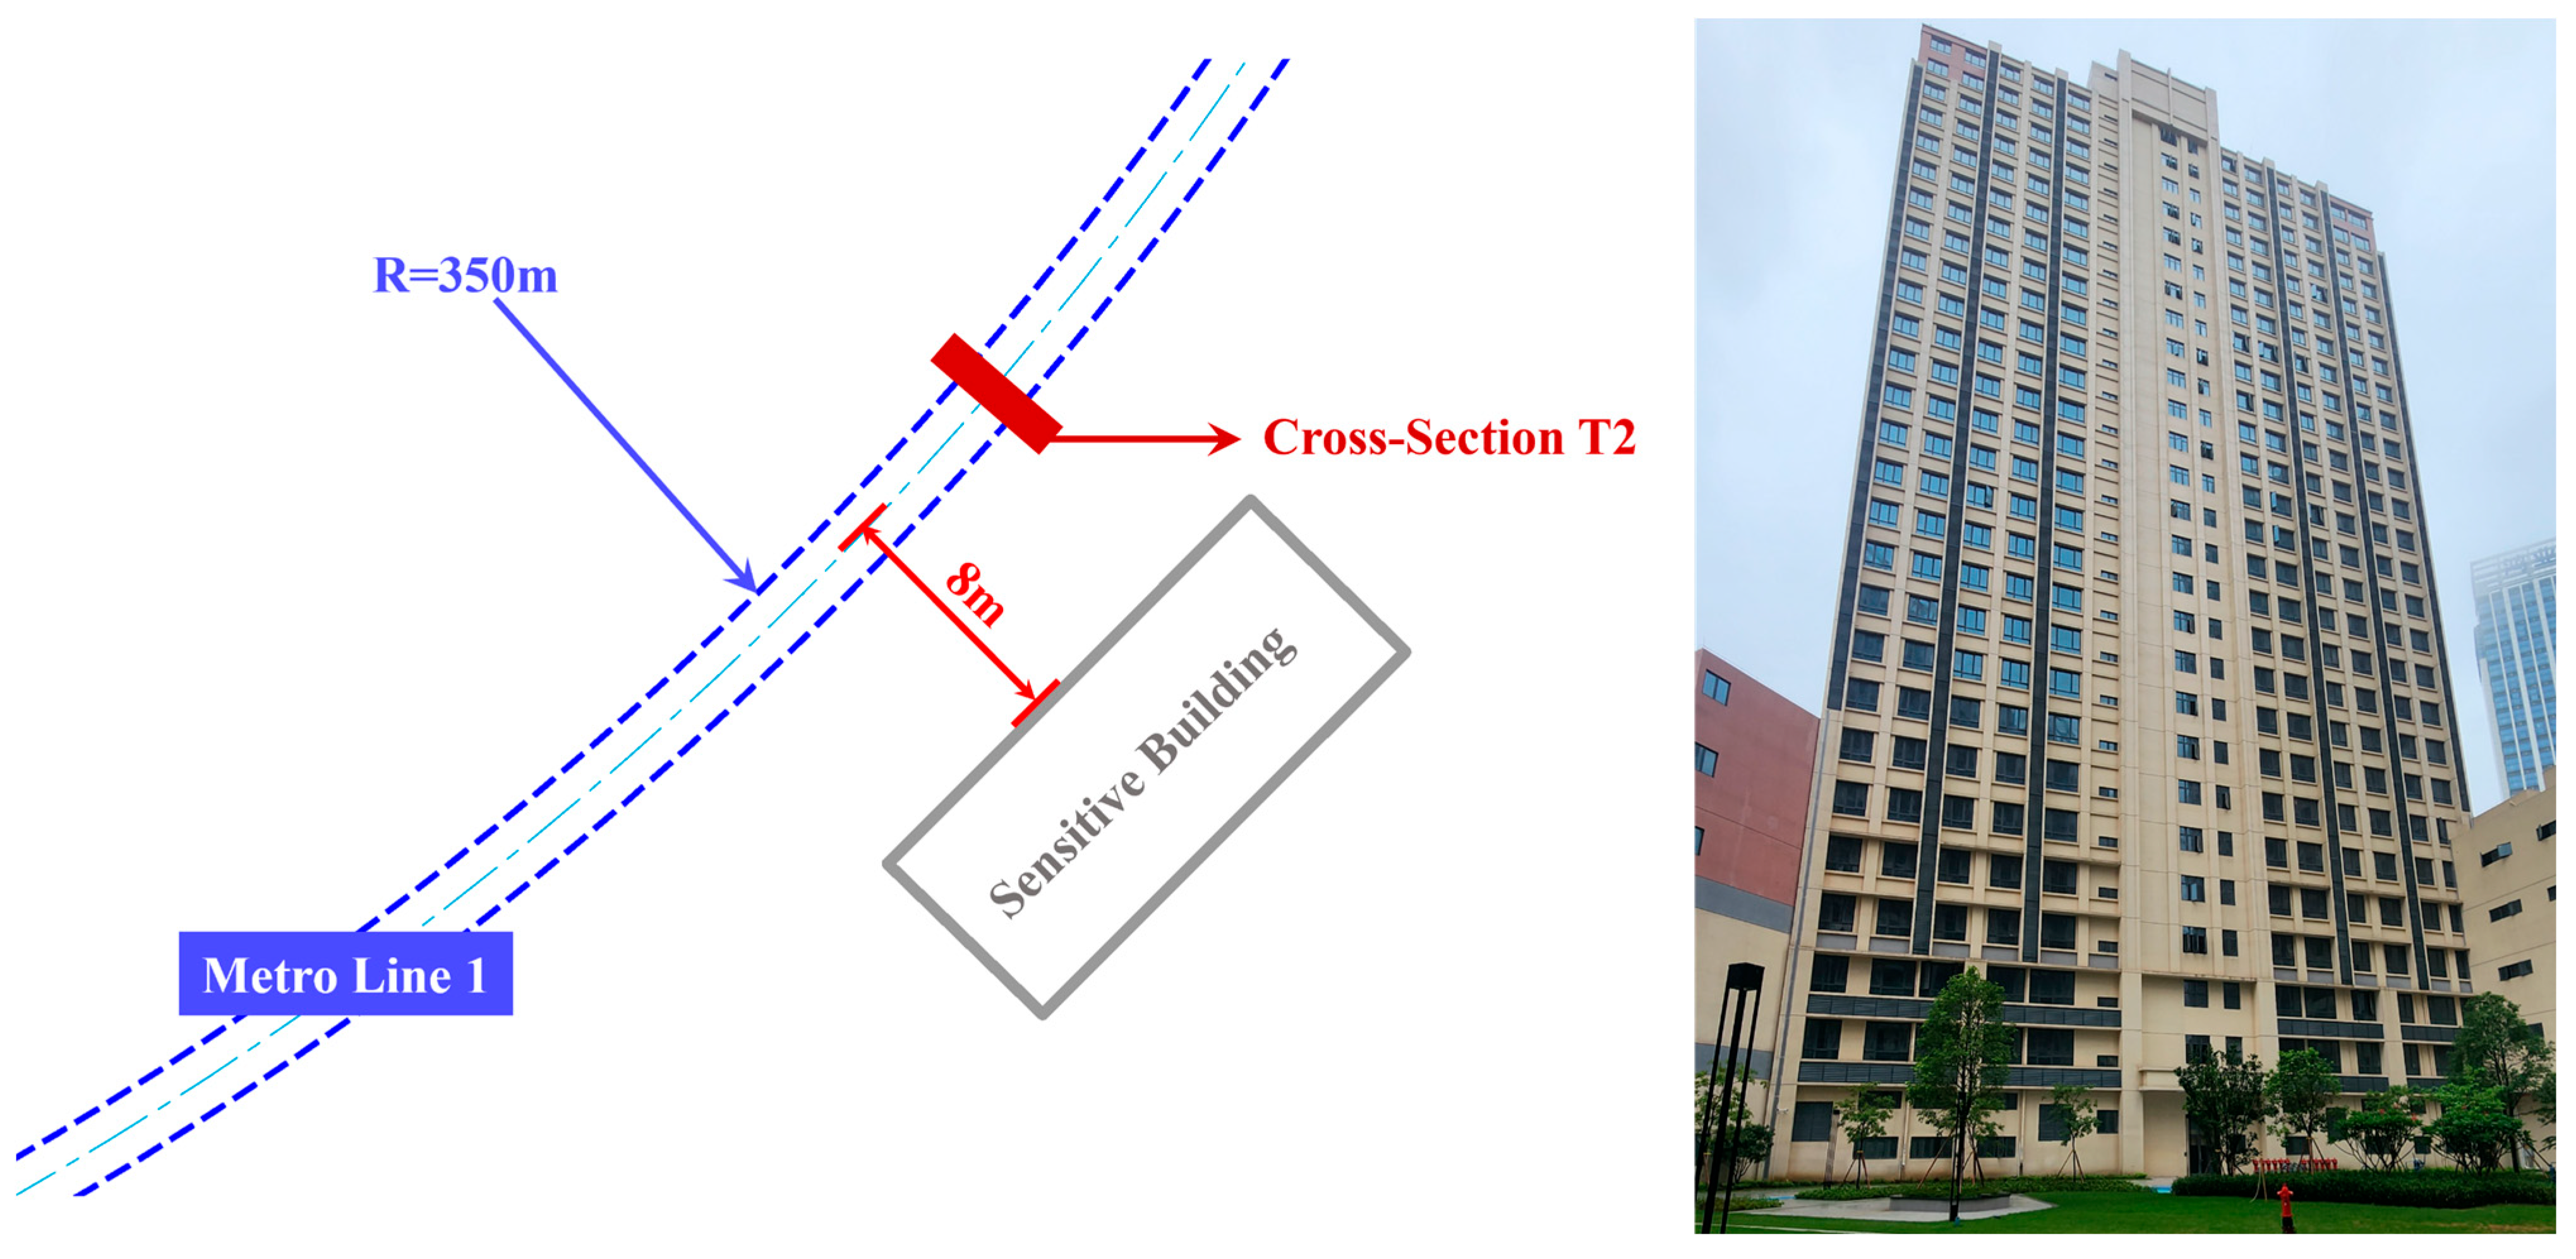
In sensitive building, the time-domain and frequency-domain characteristics of the indoor floor vibrations on the 3rd and 10th floor induced by subway trains are presented in
Figure 11. The peak values of train-induced vibration accelerations at measurement points S3 and S10 were both approximately 0.005 m/s
2. The vibration amplitudes of the two points did not vary significantly. Judging from the frequency-domain plot (the light-band representation), the vibration energy of S3 was distributed over a relatively wide frequency band, with the main frequency range being 40–100 Hz. In contrast, the vibration of S10 was relatively concentrated, and its dominant frequency band was 60–80 Hz.
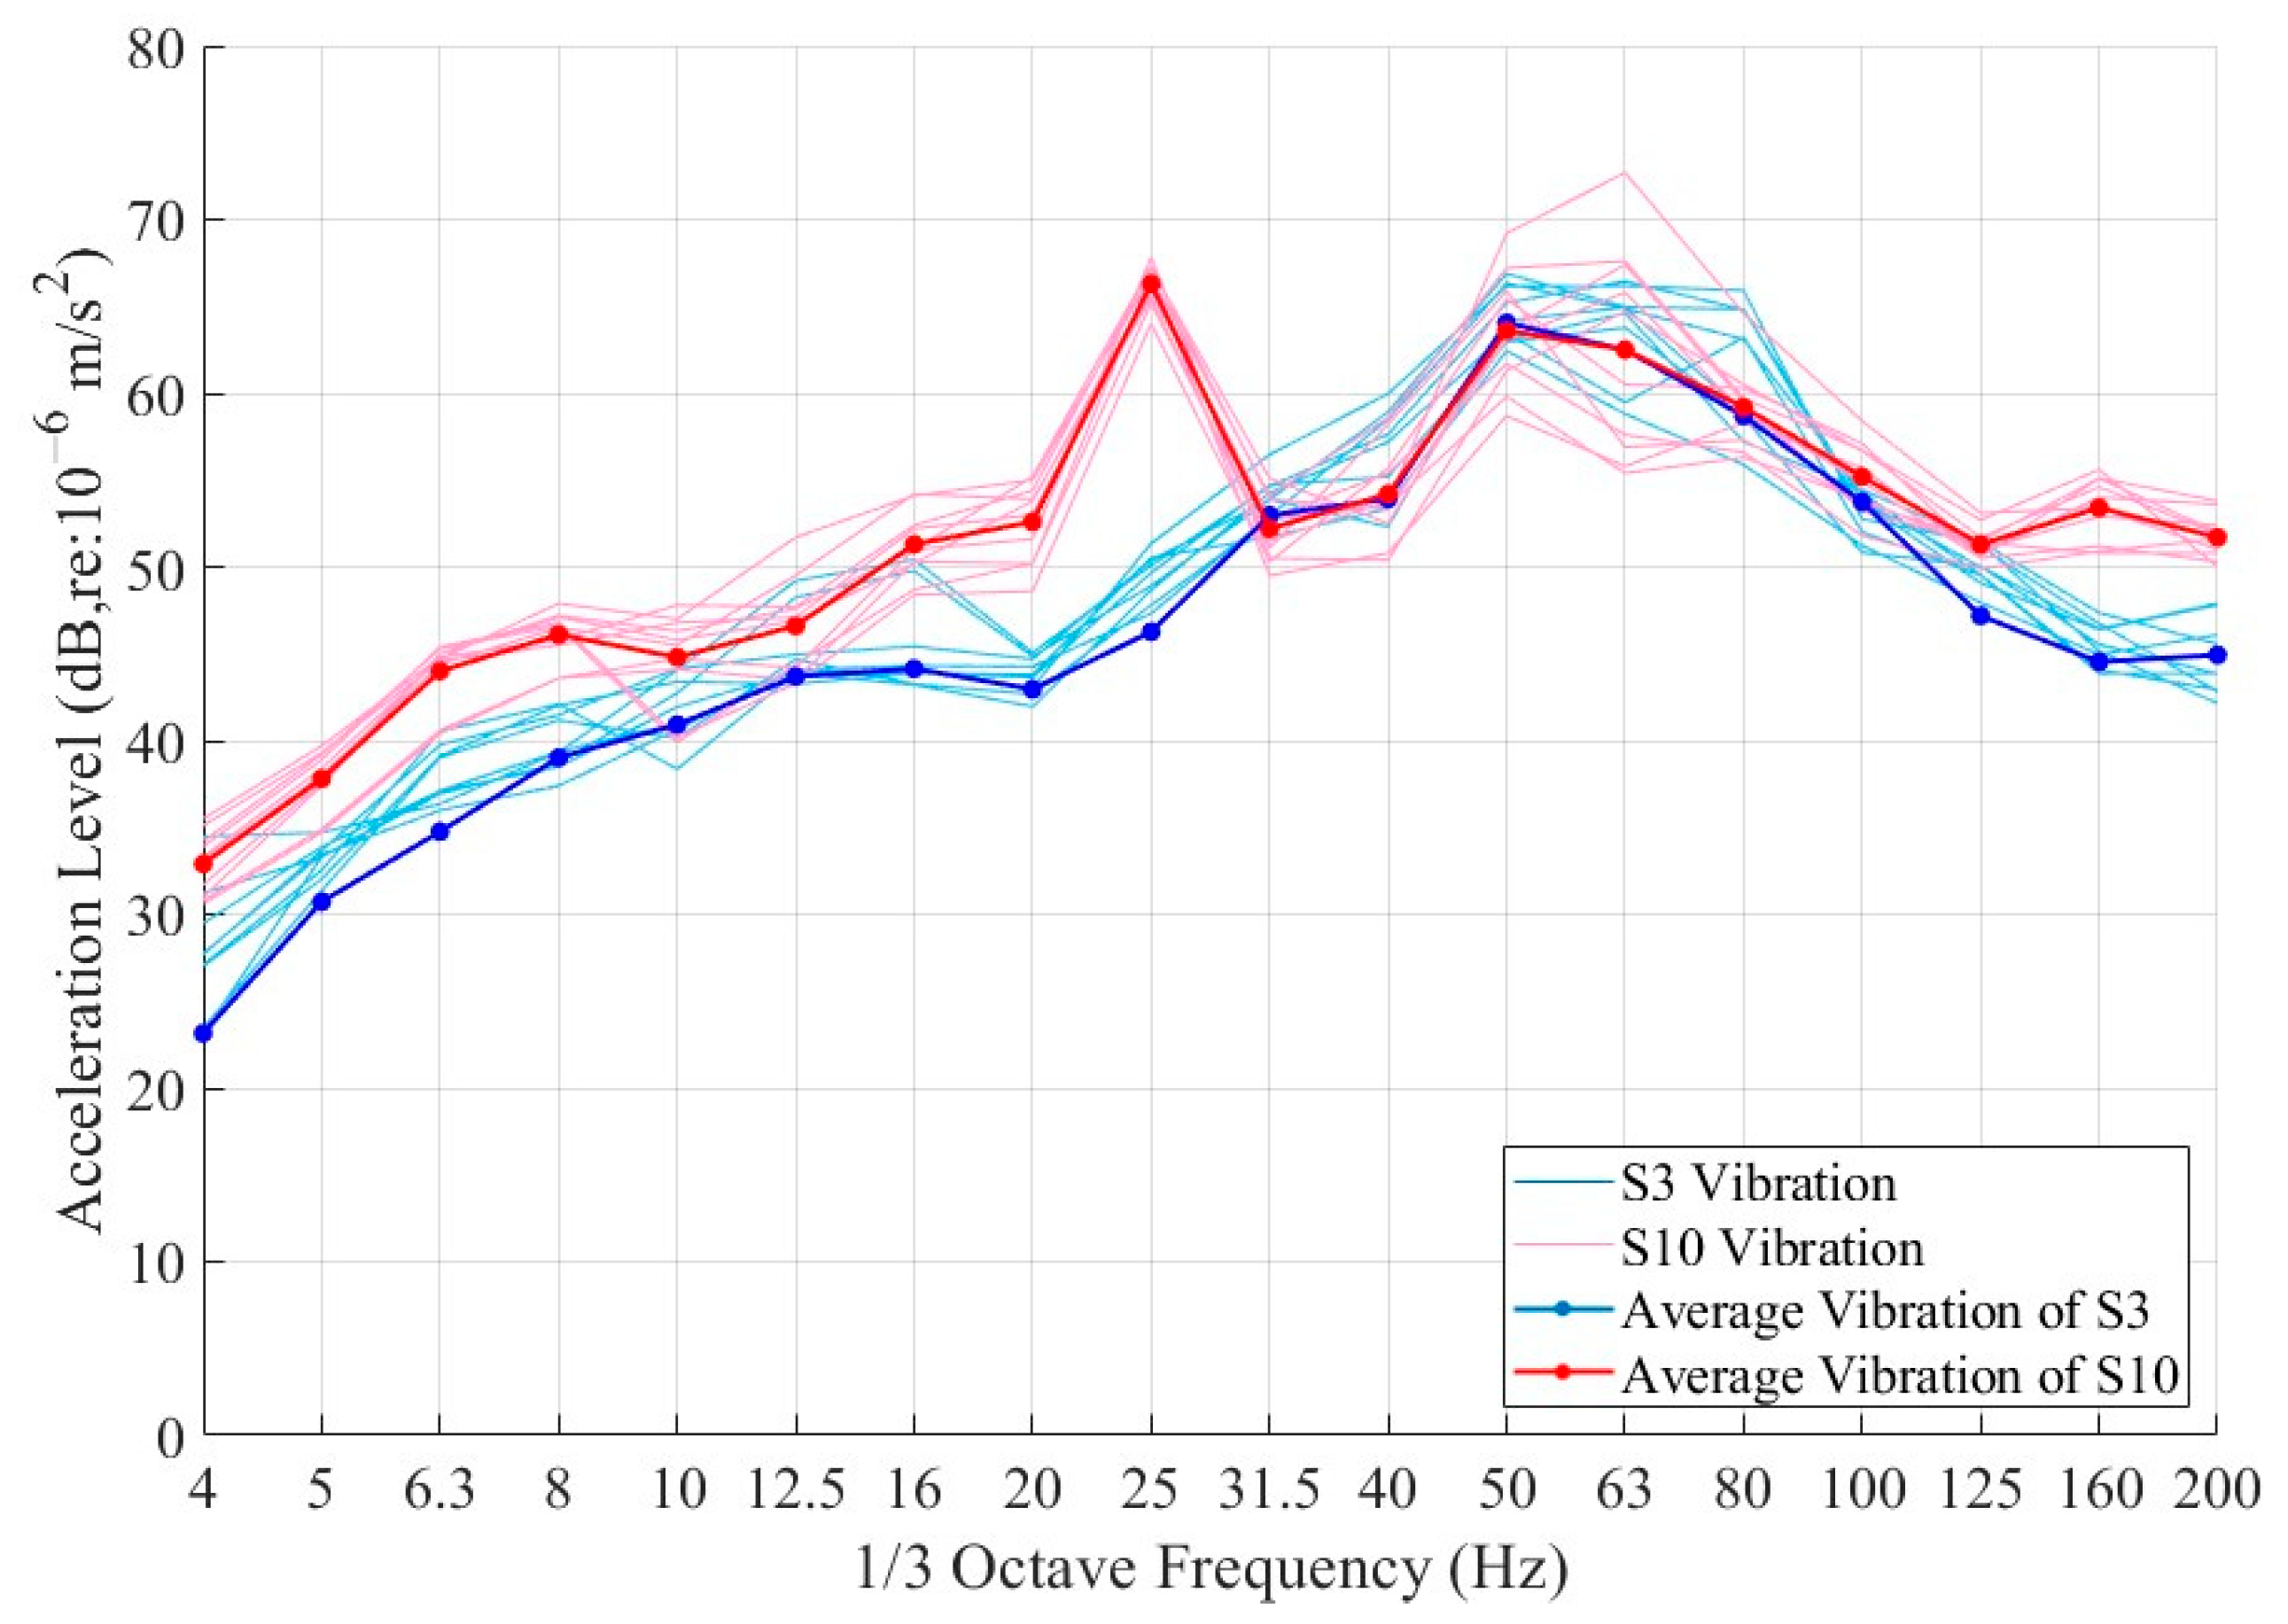
Figure 12 presents the computed floor vibration acceleration levels in the range of 4–200 Hz. When the vibration was transmitted to the superstructure through the soil and underground structures, the attenuation cycle of high-frequency vibrations above 200 Hz increased during this process. Evidently, the energy of this part was attenuated significantly. The vibration energy generated by trains was predominantly distributed within the frequency range of 20–100 Hz. After reaching the building, the vibrations in this frequency band were relatively well-preserved.
In comparison with the third floor of the building, in the slab of the tenth floor, the low-frequency vibration energy in the range of 4–30 Hz was amplified. Notably, a prominent vibration peak emerged at 25 Hz. The test room on the third floor is a show flat, featuring complete material paving and a full set of furniture, whereas the test room on the tenth floor has an empty cement floor. This disparity increased the damping level of the third-floor room, thus reducing the harmonic response of the floor slab [
22]. Part of the long-wave energy undergoes refraction and reflection upon reaching the top of the building. As a result, the middle floors are simultaneously influenced by both upward and downward vibration waves. Consequently, the vibration amplification effect often occurs on the middle floors. The measured results effectively corroborate this phenomenon.
The propagation mechanism of vibration energy induced by subways in adjacent high-rise buildings is complex and subject to uncertainty. This phenomenon is typically influenced by multiple factors such as building type, structural span, height, and the frequency composition of the input excitation. Research has demonstrated that the transmission characteristics of such vibrations are closely related to the structural modal behavior of the building [
23,
24].
To further investigate the vibration amplification observed on the 10th floor during field testing, a modal analysis of the sensitive structure was performed using finite element simulation software. Considering that subway-induced vibrations primarily occur in the vertical direction, only the Z-direction modal response was examined.
The finite element model was established based on the engineering drawings of the building, which provided key geometric and mechanical parameters such as the structural system, dimensions of slabs and walls, and material properties.
The building in question employs a shear wall structural system. Its key engineering dimensions and material properties are summarized in the accompanying
Table 5. Given that the influence of reinforcement detailing on structural modality is minimal, it was excluded from the modal analysis
When considering only the basic structural configuration, the first to fifth vertical modal shapes and their corresponding natural frequencies of the sensitive building are illustrated in
Figure 13. Based on the integration of field test data, the natural frequency associated with the third vertical mode of the model was determined to be 24.28 Hz.
Further analysis of the vibration pattern at this frequency revealed that the mode shape was characterized by localized warping deformations of the floor slabs. Such deformation behavior was primarily observed between the 8th and 13th floors as well as at the topmost level of the building. These observations indicate that compared with the 3rd floor, the 10th floor exhibited a higher sensitivity to vibrations occurring near 24.28 Hz, thereby increasing the possibility of local resonance in the floor structure. This is one of the reasons for the significant amplification of vibrations at 25 Hz on the 10th floor.
In buildings, the resonance phenomenon occurring on the 10th floor can significantly magnify the structural vibration response, thereby triggering uncomfortable low-frequency secondary structural noise. These low-frequency sound waves, directly radiated from the floor vibration, possess strong penetration capabilities. Traditional sound insulation measures prove ineffective in suppressing them, resulting in a notable negative impact on the indoor acoustic environment quality and the residents’ comfort. This often emerges as the core issue in environmental vibration complaints.
Consequently, during the design and vibration assessment of buildings adjacent to subway lines, it is essential to adopt the key control principle of preventing the natural frequency of the floor from coinciding with the dominant vibration frequency of the subway. This approach can effectively mitigate the effects of vibration and secondary noise.
3.4. Discussion
Based on the analysis of the rail corrugation conditions in sections T1 and T2, it can be seen that when the train passed through the small-radius curve section, the excessive contact pressure of the wheel flange on the inner rail resulted in significantly greater surface wear of the inner rail compared with the outer rail. Although the corrugation in both sections excited high-frequency vibrations at 395 Hz, 502 Hz, and 790 Hz, after the steel spring floating slab was laid in section T2, a specific corrugation with a wavelength of 200 mm independently appeared on the inner rail and triggered a dominant vibration frequency of 80 Hz. This frequency happens to fall within the main energy frequency band range of the vehicle-track system.
The above-mentioned 80 Hz vibration phenomenon is consistent with the descriptions of the dynamic characteristics of the floating slab track in the existing literature [
25,
26,
27]. In the research on the dynamic characteristics of the floating slab track in small-radius curve sections (radius 300–350 m, vehicle speed 50–55 km/h), all reported similar regularities: under the wheel–rail coupling excitation, the system exhibited significant vertical response peaks in the 70–80 Hz frequency band, and corrugation with corresponding wavelengths was observed at the corresponding positions on the rail. This phenomenon can be attributed to the following dynamic mechanisms: under the action of the train’s dynamic load, on the one hand, there is P2 resonance caused by the inertial coupling between the unsprung mass of the wheel and the mass of the track; on the other hand, it is manifested as the vertical bending coupling vibration formed by the wheelset and the track structure in a specific vibration mode of this frequency band. This coupled resonance provides the primary energy input for the 80 Hz vibration.
This resonance mechanism has a clear physical correspondence with the formation of the 200 mm wavelength corrugation on this section. The coupled resonance of the wheel–rail system structure intensifies the stick-slip effect at the wheel–rail contact interface, thereby inducing periodic wear of the corresponding wavelength at specific resonance frequencies. Meanwhile, when the train passes through the section with this 200 mm wavelength corrugation, its geometric irregularity further selectively amplifies the vibration energy within a specific frequency range, forming a positive feedback mechanism. This provides the crucial dynamic conditions for the generation and stable expansion of the 200 mm wavelength corrugation.
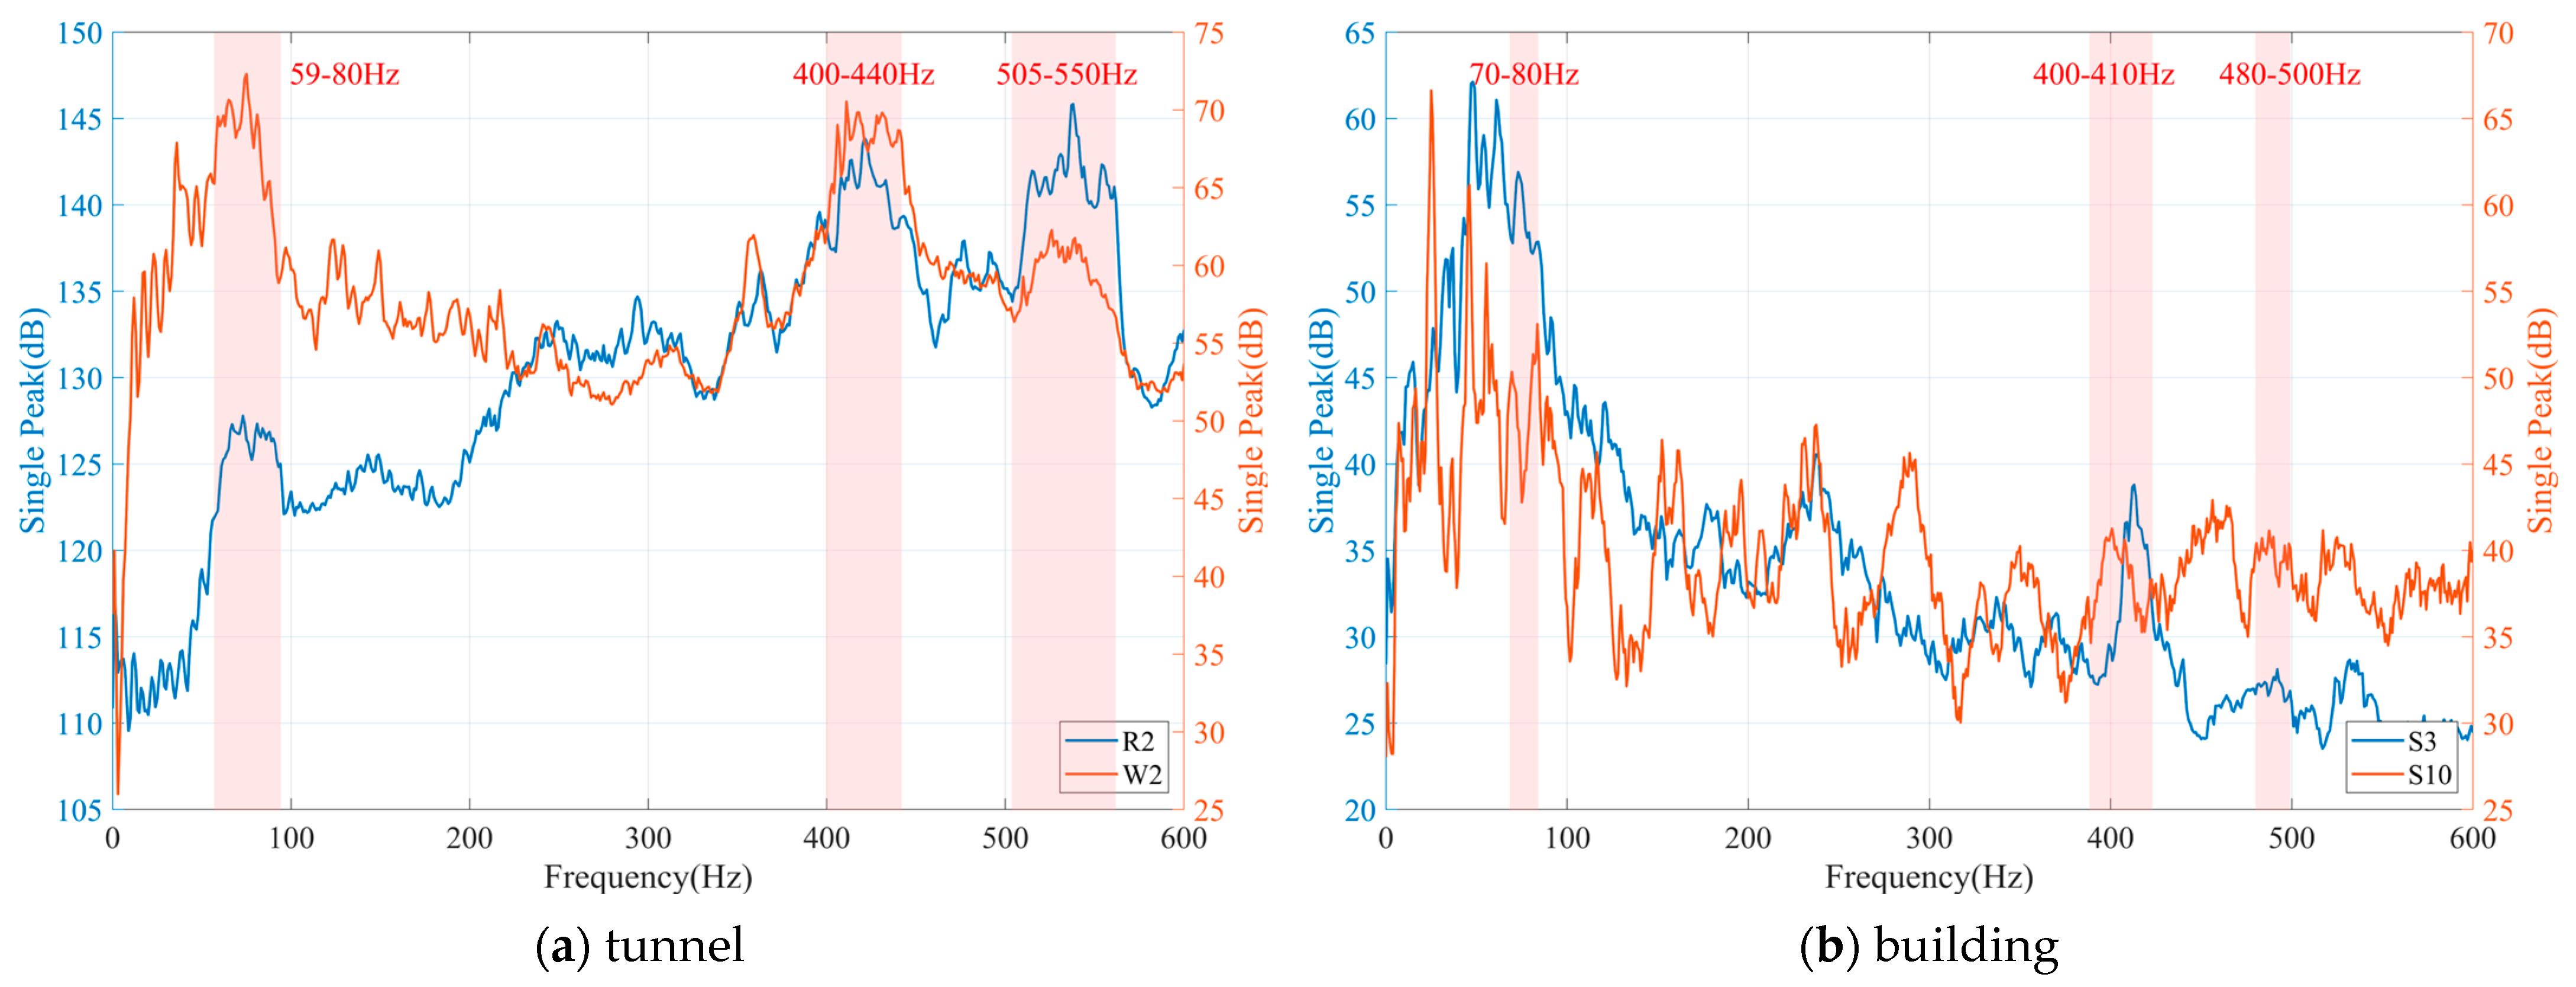
Figure 14a presents the single peak values of the rail and tunnel wall vibrations within the 0–600 Hz frequency range for each 1 Hz interval in the T2 section. It can be seen that the vibration excitation caused by rail corrugation prominently manifested on both the rail and the tunnel wall, with the tunnel wall vibration being dominant in the 59–80 Hz frequency band, forming a distinct vibrational energy peak. During the process of vibration transmission from the tunnel to the building, the high-frequency components (such as 395 Hz, 502 Hz, and 790 Hz) are greatly attenuated when reaching the building foundation due to the strong damping and dissipation characteristics of the soil, which has short wavelengths and is prone to scattering and material internal friction loss during propagation. In contrast, the low-frequency vibration (such as 80 Hz) has a longer wavelength and incurs less loss during propagation in the soil, thus being more effectively transmitted to the building structure. However, the building’s own structural dynamic characteristics act to filter and reshape the incoming vibrations.
The single peak values of vibration on the 3rd and 5th floors of the sensitive building are shown in
Figure 14b. The vibration spectrum inside the building exhibited clear frequency selectivity: vibration components above 200 Hz were significantly attenuated, and the 400 Hz and 500 Hz excitations caused by rail corrugation no longer had a notable impact. However, the vibration energy at 80 Hz, which aligns closely with the dominant transmission frequency band of the tunnel–soil system, remained largely preserved. Nevertheless, the influence of the building’s own structural dynamic characteristics on the vibration response becomes more pronounced. For instance, resonance occurred at the 10th floor slab at 25 Hz, clearly indicating the presence of structural coupling effects.
The analysis of the vibration transmission process from the tunnel to the building indicates that the vibration energy at the tunnel wall was predominantly concentrated around 80 Hz. In contrast, the response of the 10th-floor slab was dominated by 25 Hz. This shift in spectral characteristics results from systematic changes that occur along the vibration propagation path. As a low-frequency vibration isolation system, the floating slab track inherently generates substantial energy in the 10–100 Hz frequency band. The formation of the 200 mm corrugation further amplifies vibrations around 80 Hz, leading to a distinct peak in the tunnel cross-section. It is noteworthy that, in addition to the 80 Hz component, low-frequency vibration energy near the natural frequency of the steel spring floating slab is also preserved and transmitted. When vibrations travel through the soil to the building foundation, high-frequency components attenuate rapidly due to soil damping, whereas low-frequency components—including those near the natural frequency of the floating slab—maintain strong transmission efficiency.
The building structure exhibited obvious frequency-selective characteristics for the incoming vibration. Essentially, the 80 Hz vibration, as the main excitation generated by the coupling resonance of the wheel–rail and floating slab system, is efficiently transmitted to the building foundation through the soil, causing the foundation to receive a wideband vibration spectrum containing a 80 Hz peak and the inherent frequency components of the floating slab. When these vibration energies propagate upward in the building structure, each structural component selectively responds to different frequency components based on its own dynamic characteristics. The 10th-floor slab, due to its inherent frequency (24.28 Hz) matching the low-frequency component of the inherent frequency of the steel spring floating slab in the input vibration, undergoes intense resonance amplification. Therefore, although the input vibration energy was dominated by 80 Hz, the vibration response of the 10th-floor slab still showed a 25 Hz peak dominated by the structural mode. This phenomenon clearly indicates that 80 Hz characterizes the source feature of vibration propagation, while 25 Hz reflects the structural resonance response of the building as the receiver.
The observed phenomenon indicates a significant side effect associated with the application of steel spring floating slab tracks on small-radius curves. While this track system was specifically designed to mitigate medium- to high-frequency vibrations, its inherently low support stiffness may lead to wheel–rail coupled resonance within certain frequency ranges. This resonance selectively promotes the development of rail corrugation at specific wavelengths, thereby increasing the vibration levels in corresponding frequency bands and potentially undermining the intended vibration isolation performance of the track in its target frequency range.
The enhanced low-frequency vibration energy exhibits limited attenuation as it propagates through the surrounding soil, enabling efficient transmission to the foundations of adjacent buildings. When the frequency of the transmitted vibration approaches the natural frequency of structural elements such as floor slabs, resonant conditions may be readily induced. Such low-frequency structural resonance is prone to generating secondary structure-borne noise, which, due to its low-frequency nature, tends to be more perceptible and disturbing to the occupants, thus substantially degrading the indoor acoustic environmental quality. Consequently, in the environmental impact assessment of metro line projects, careful consideration should be given to the propagation characteristics of low-frequency vibrations originating from the track system.
