Article

Numerical Simulation and Model Validation of Multispiral-Reinforced Concrete Columns’ Response to Cyclic Loading

by
Luboš Řehounek
1,* and
Michal Ženíšek
2,3
1
Department of Mechanics, Materials and Machine Parts, Faculty of Transport Engineering, University of Pardubice, Studentská 95, 532 10 Pardubice, Czech Republic
2
Červenka Consulting, Na Hřebenkách 55, 150 00 Prague, Czech Republic
3
Department of Architectural Engineering, Faculty of Civil Engineering, Czech Technical University in Prague, Thákurova 7, 166 29 Prague, Czech Republic
*
Author to whom correspondence should be addressed.
Buildings 2025, 15(21), 3855; https://doi.org/10.3390/buildings15213855
Submission received: 5 September 2025 / Revised: 14 October 2025 / Accepted: 20 October 2025 / Published: 24 October 2025

Abstract

In regions where seismic loads pose a significant danger to the structural stability of buildings, developing sustainable solutions for increasing the ductility of structural members is of great importance. One of the contemporary, emerging approaches is to use the greater confinement of concrete using multispiral reinforcement. A numerical model of two variants of Multispiral-Reinforced Concrete Columns (MRCCs) that differ in their axial loads using FEA was developed and validated. A non-linear combined fracture-plasticity concrete model with the crack band approach and an embedded reinforced model with bond slip were used. The main finding is that higher axial loads do not significantly increase the stiffness response, but reduce ductility (achieved drift). The achieved force agreement between the simulation and the experiment is within 2 % at the peak and within 24 % at the largest column drift in the post-peak region. For the purpose of rapid prototyping, a plugin that enables the user to quickly change various properties of MRCC geometry using an automated approach instead of modeling individual variants from zero is proposed. This overall approach was developed to both save on user time spent modeling and on the great costs that involve manufacturing and testing of real-scale specimens.

1. Introduction

Multispiral concrete rebar is a novel, advanced reinforcement type characterized by the use of multiple spiral steel bars arranged concentrically within a concrete member (a column in this case). Spiral reinforcement is easier to manufacture compared to manually-tied stirrups, as most of the work can be conducted in-house with automation [1], eliminating the need to perform welding and forming of reinforcement on site, as well as the skilled labor required to do them. The improved confinement enhances ductility [2] and also increases the compressive strength of the concrete compared to unconfined concrete, significantly improving the load-bearing capacity of the structure [3]. The multispiral arrangement distributes internal stresses more uniformly compared to conventional transverse reinforcement [4], improving resistance to shear and axial loads. This improvement is beneficial in seismic regions, where energy dissipation and deformation capacity are critical for safety [5]. Empirical studies have demonstrated that multispiral reinforcement significantly delays the onset of structural failure, contributing to improved overall performance and safety in reinforced concrete structures [6]. Chen et al. [7] showed in their experiments that columns with multispiral reinforcement are also 33% stronger in uniaxial compression tests, and the columns are 145% more ductile compared to conventional transversal reinforcement. Among the most common configurations are the two-, four-, six-, and seven-spiral arrangements for square, rectangular, and oblong columns. All the variants show comparable or higher strength and ductility when compared to conventional stirrups [8]. The multispiral configuration provides superior confinement of the concrete within the spirals, enhancing both its compressive strength and ductility, and also requires less reinforcement compared to traditional stirrups [9]. Ou et al. [8] report that multispiral reinforcement achieves this effect with a steel volume only 50–60% that of transverse reinforcement. Other authors [1] also corroborate this finding, reporting up to 30% less transverse steel needed while still maintaining superior performance compared to conventional reinforcement.
However, iterating the physical experiment for every configuration, where important variables are the shape of the concrete cross-section, number, diameter, and placement of spirals, their pitch, and materials used, is very uneconomical and does not comply with the recent initiatives of sustainability. In order to limit the number of experiments needed to determine the optimal materials, geometry, and reinforcement configurations, Finite Element Analysis (FEA) is being widely employed [10,11]. With its use, we can predict the behavior of an individual structure with only a limited number of experiments needed for model validation, saving resources by providing a reliable computational framework that can be used to simulate the behavior of concrete structures of various geometries, boundary conditions, and loads. However, FEM is highly dependent on the quality of input parameters and experimental validation remains essential.
To further our efforts towards sustainability and minimizing the expenses for experiments, a tool that can be used for rapid generation of MRCC geometries, which can be subsequently analyzed via FEA, was developed. This plugin allows for rapid generation of geometry, loads, boundary conditions, and monitors to allow the user to determine reinforcement and other geometry options quickly. This procedure allows more configurations to be explored and chosen from, optimizing the design or the analysis workflow.

2. Materials and Methods

2.1. Methodology

This research aims to develop and validate a numerical model for multispiral-reinforced concrete columns (MRCCs) that can provide insights into the effects of materials, helical rebar placement, geometry, and steel through-beam contribution towards the overall response, ductility, and load-bearing capacity. Since the purpose of the model is to provide a numerical tool to quickly simulate the behavior of a novel geometry, the authors also decided to enhance it with a plugin for rapid generation of geometry (Section 2.5). The FEM approach was delivered by using the ATENA software package [12].
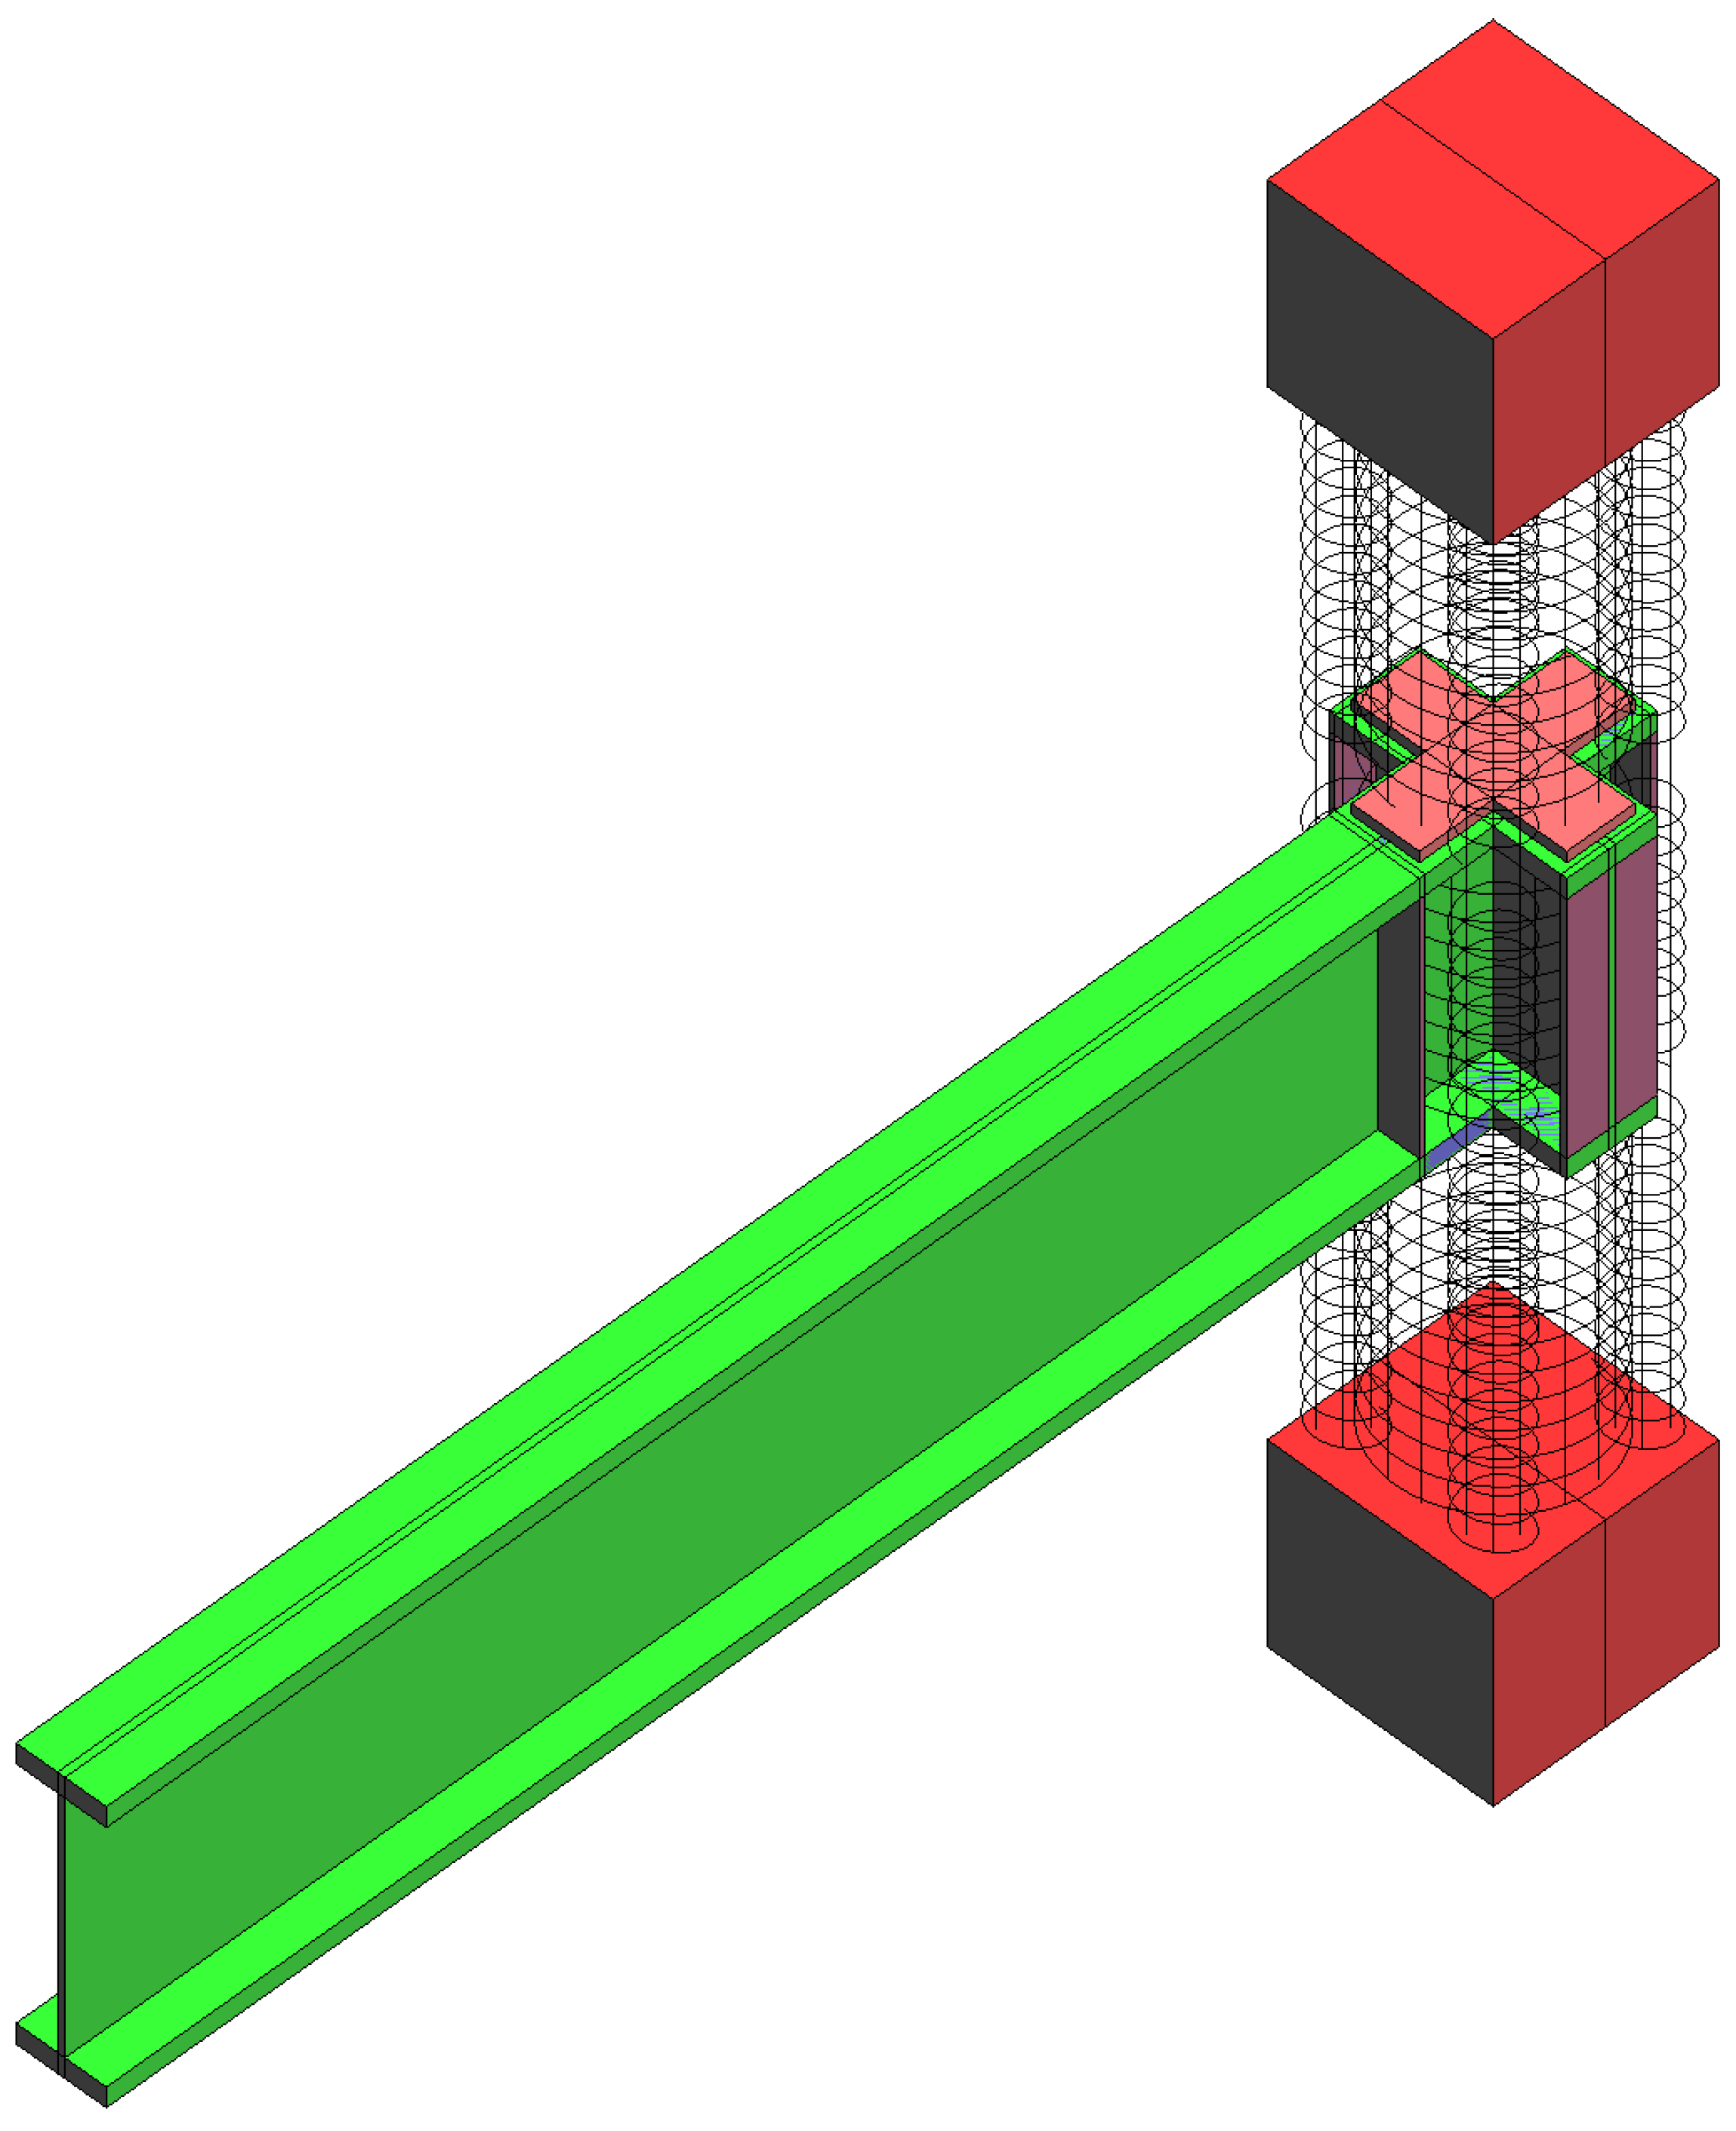
To validate the model, experimental data by Joju [13] were used. For a detailed description of the experiment, please refer to the original work of this author. The experiments were performed on a series of rectangular MRCCs with a steel through-beam. Figure 1 illustrates the model validation workflow. The geometrical model was prepared according to the author’s [13] experimental setup and is shown in Figure 2.

2.2. Geometrical Model

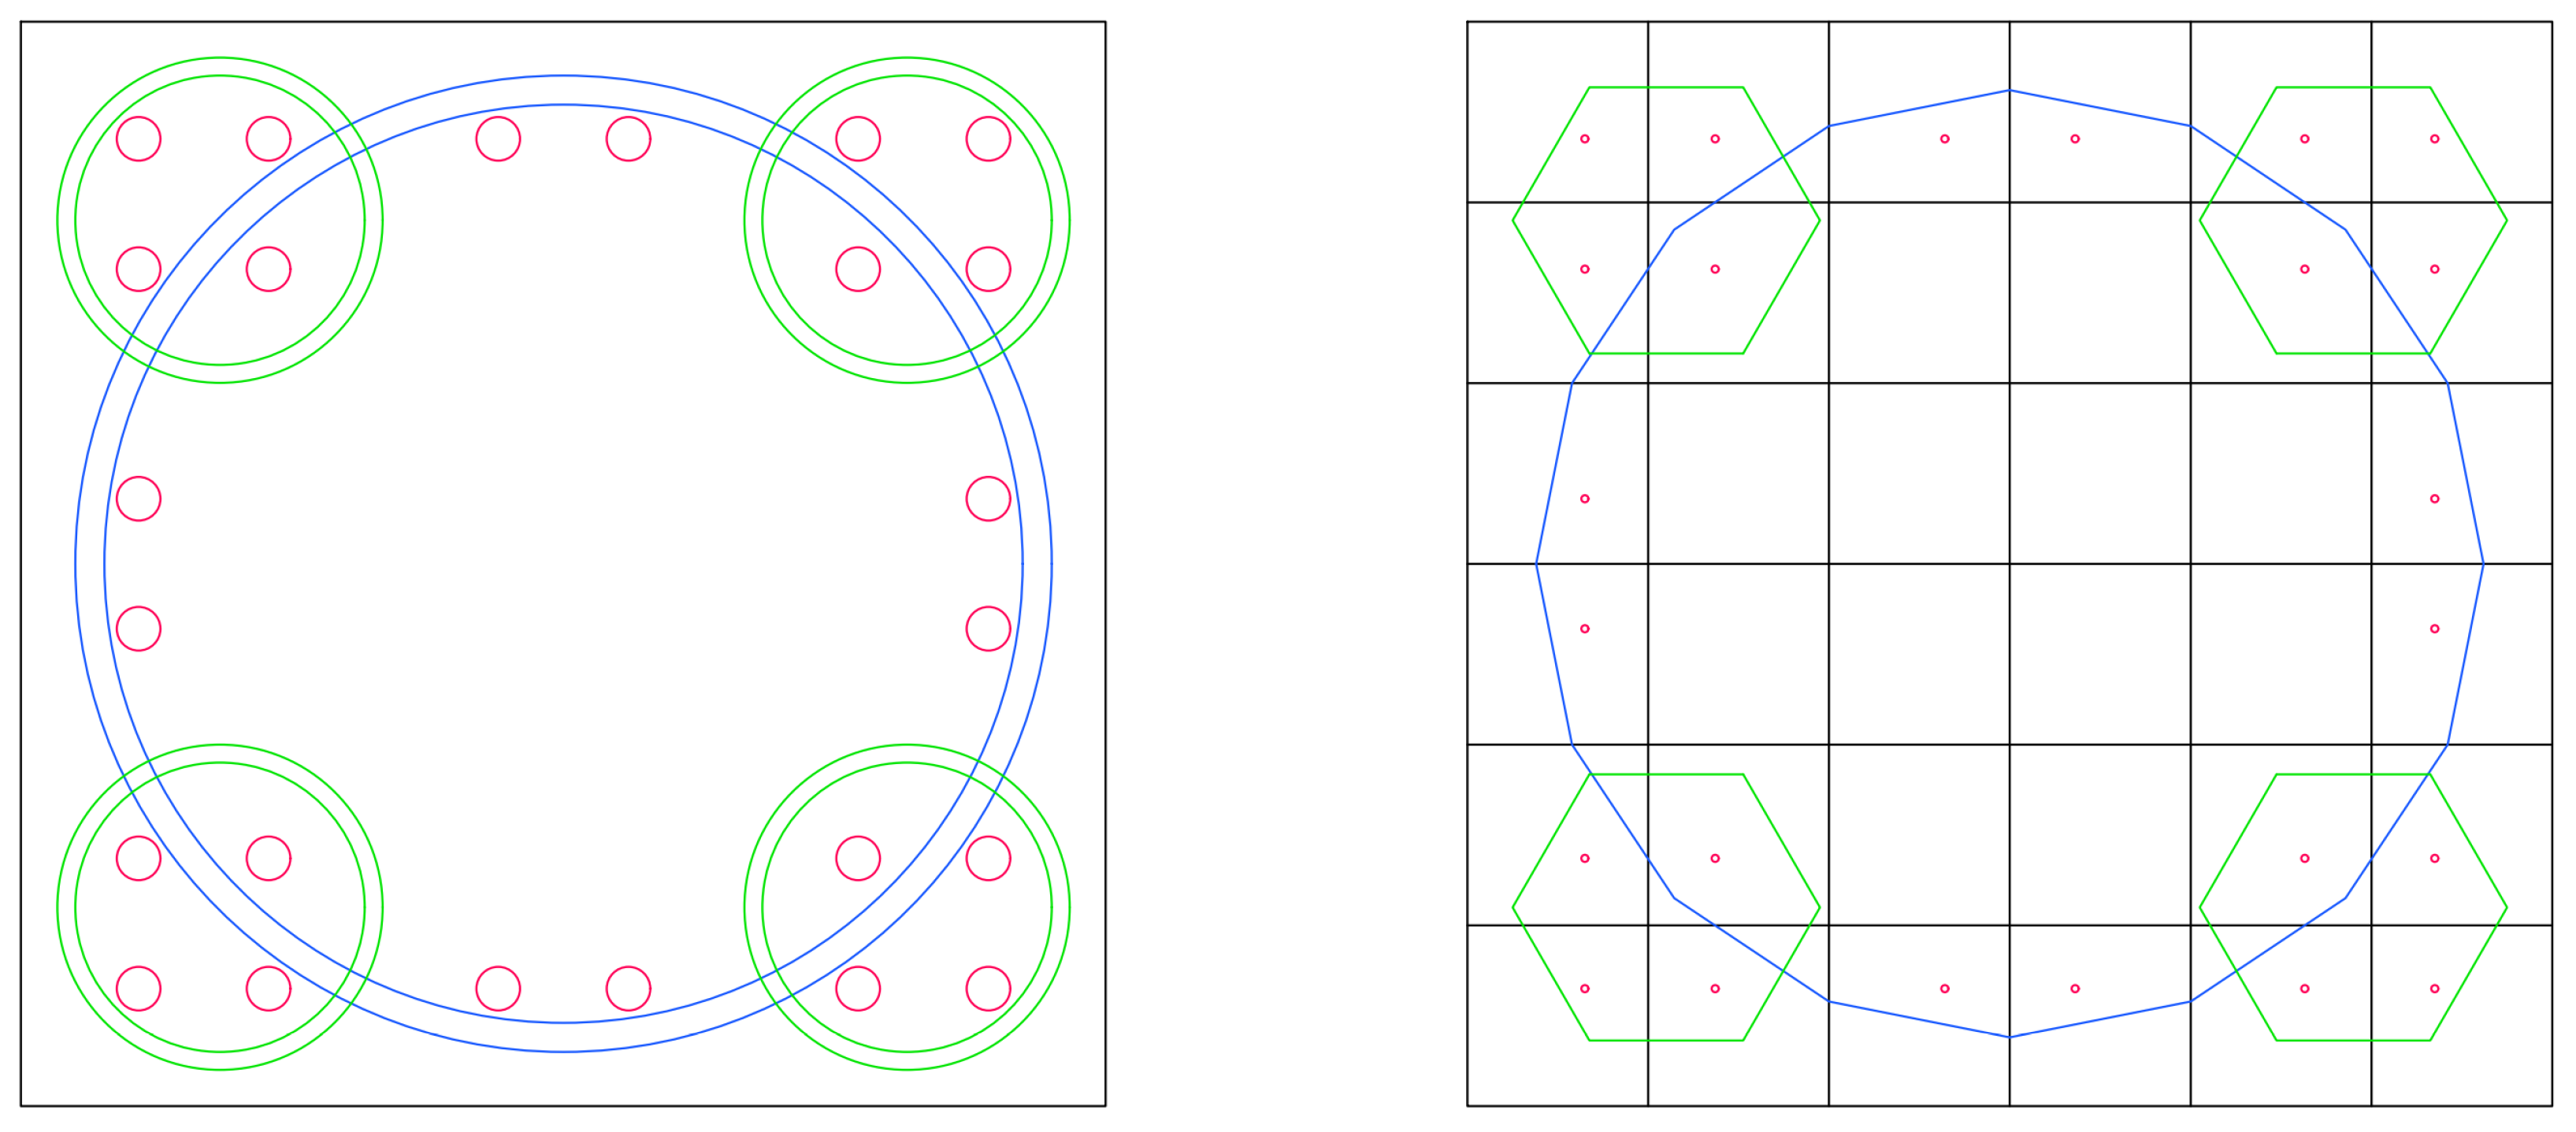
The geometrical model of the analyzed experiment is shown in Figure 2. The model was created in the GiD preprocessor [14]. The main challenge of geometry modeling is the level of detail that is needed to capture the key characteristics of the experiment [15], but does not inflate the complexity and solution time too much. The column geometry was approached by modeling the column as-built, consisting of a 600 × 600 × 2800 mm concrete section and a central, big diameter spiral and four corner, small diameter spirals, as shown in Figure 3. Since the spiral reinforcement usually varies in bar diameter, helix diameter, and pitch, a plugin for rapid generation of geometry (Section 2.5) was prepared.
The 600 × 600 mm cross-section of the analyzed column was reinforced, as shown in Figure 3, with 24 longitudinal bars (d = 29 mm), four small-diameter corner spirals (d = 10 mm, pitch = 75 mm, diameter = 180 mm), and a large spiral (d = 16 mm, pitch = 75 mm, diameter = 540 mm).
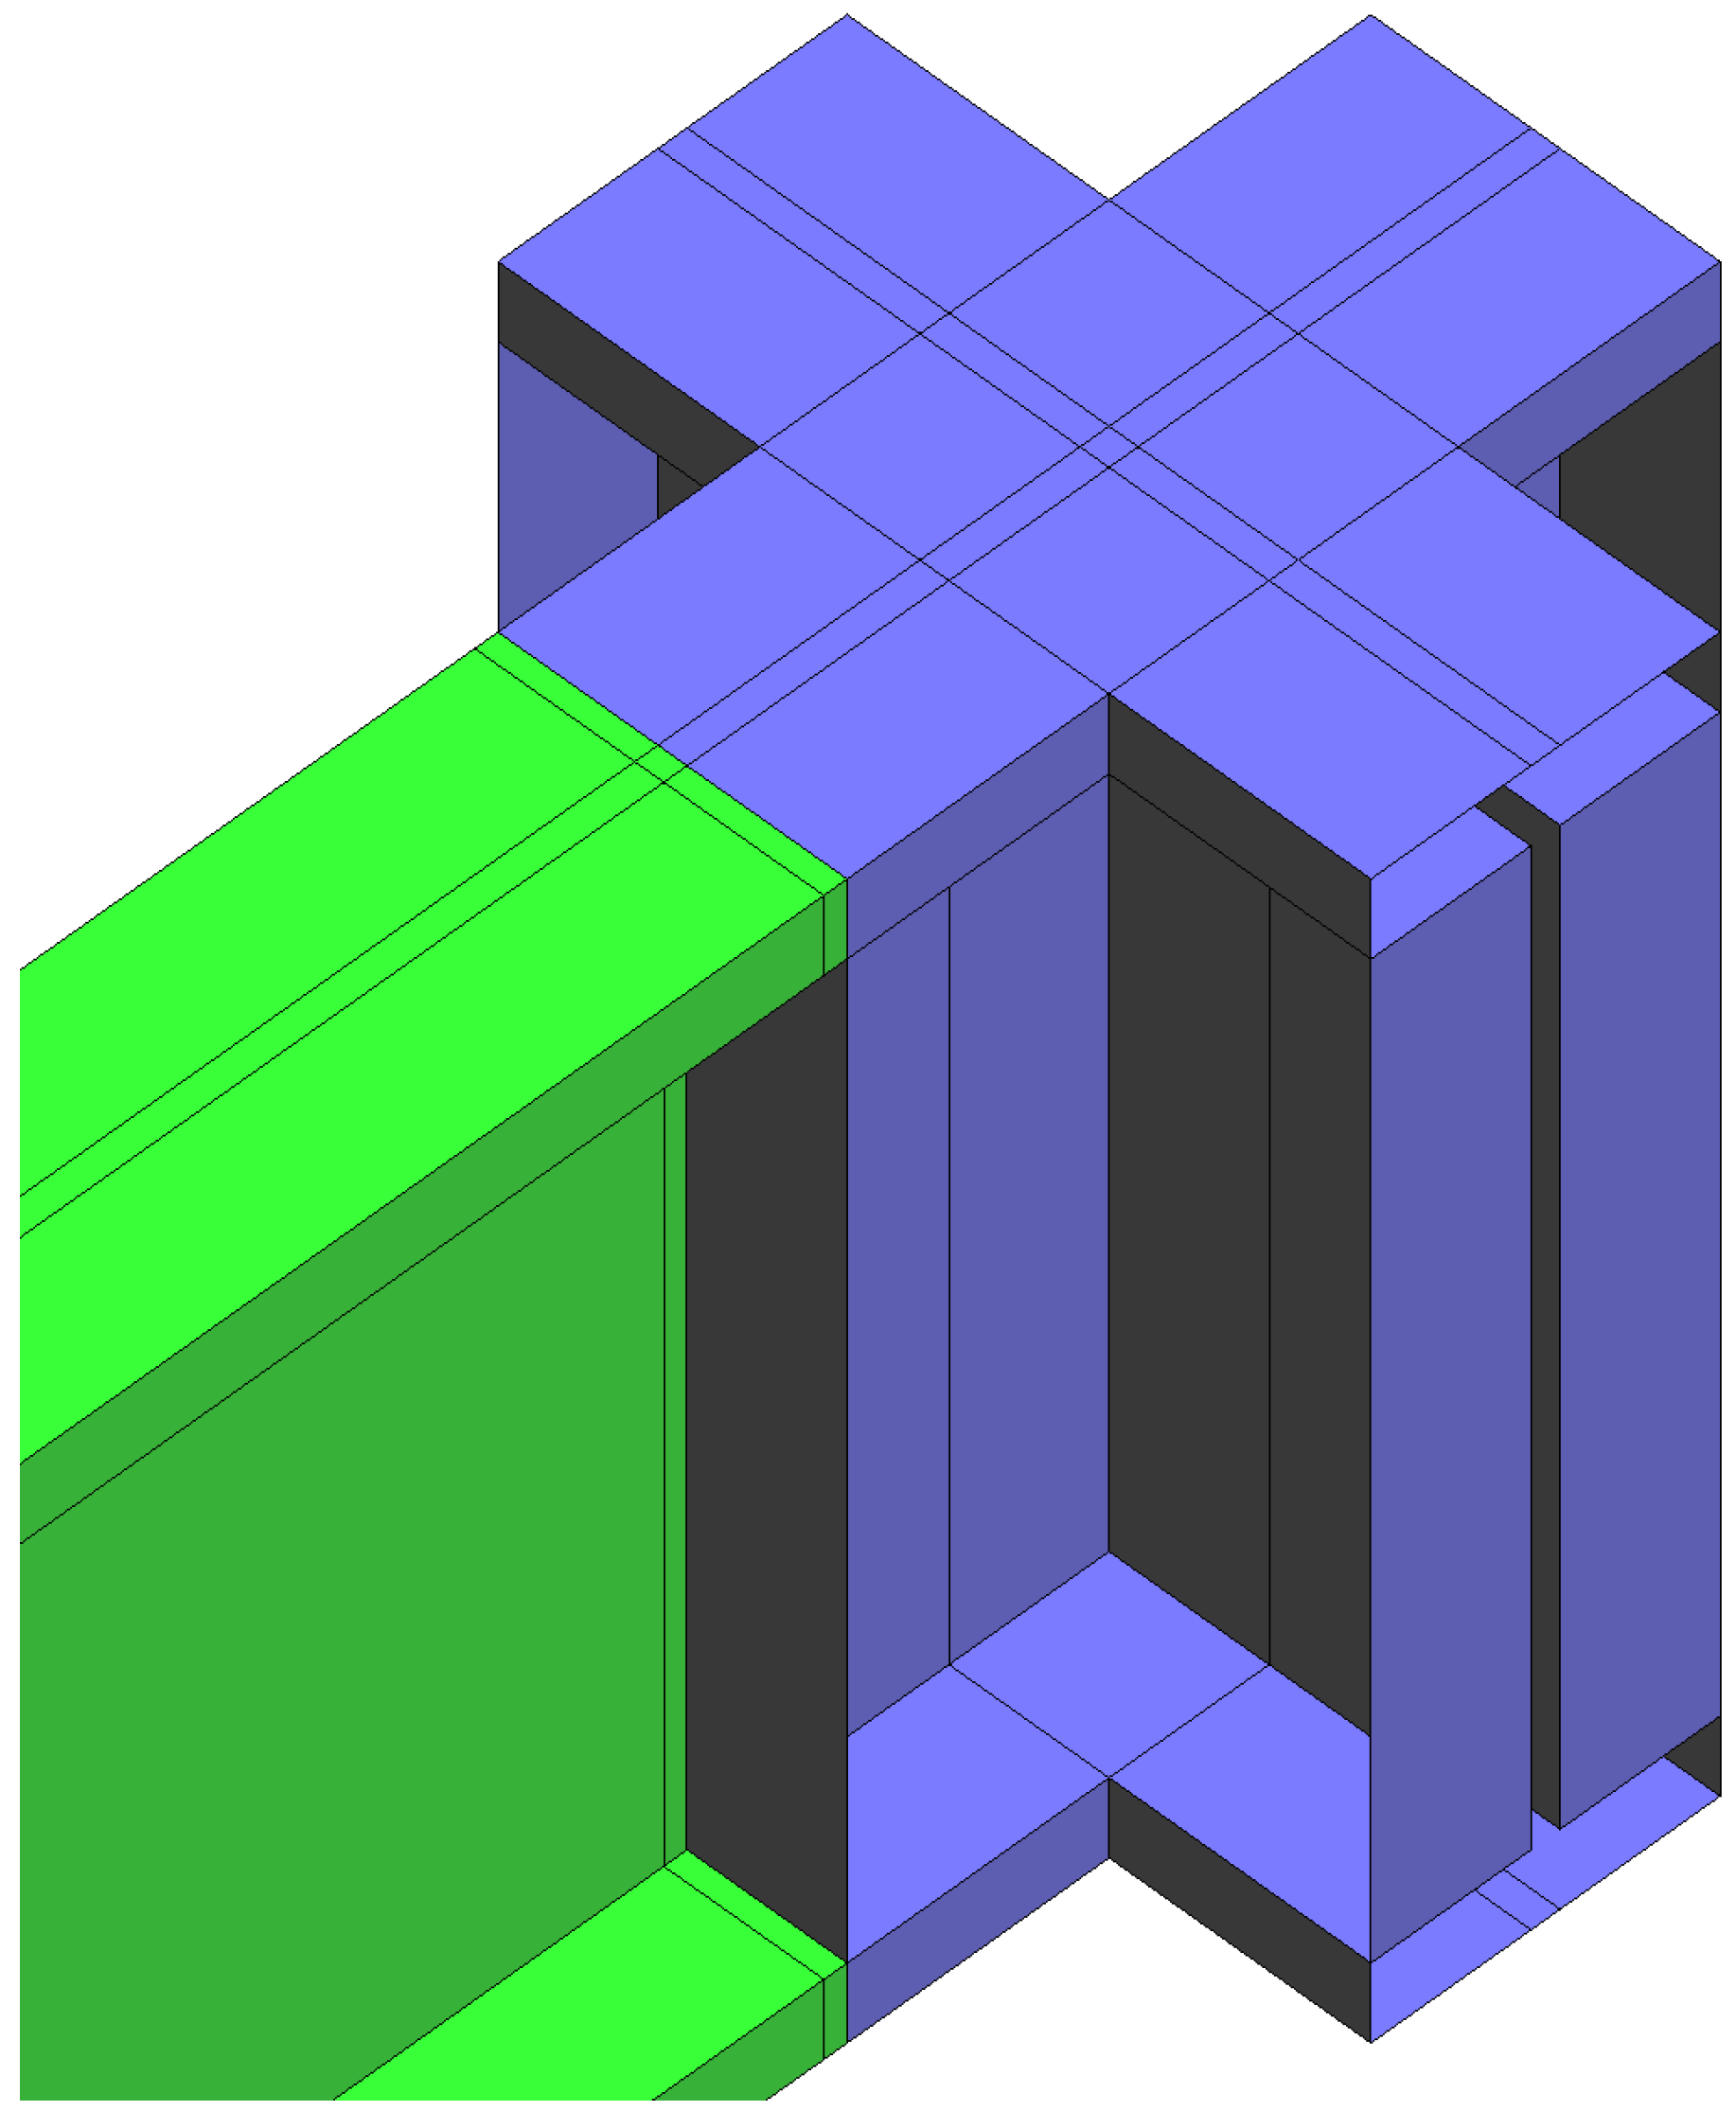
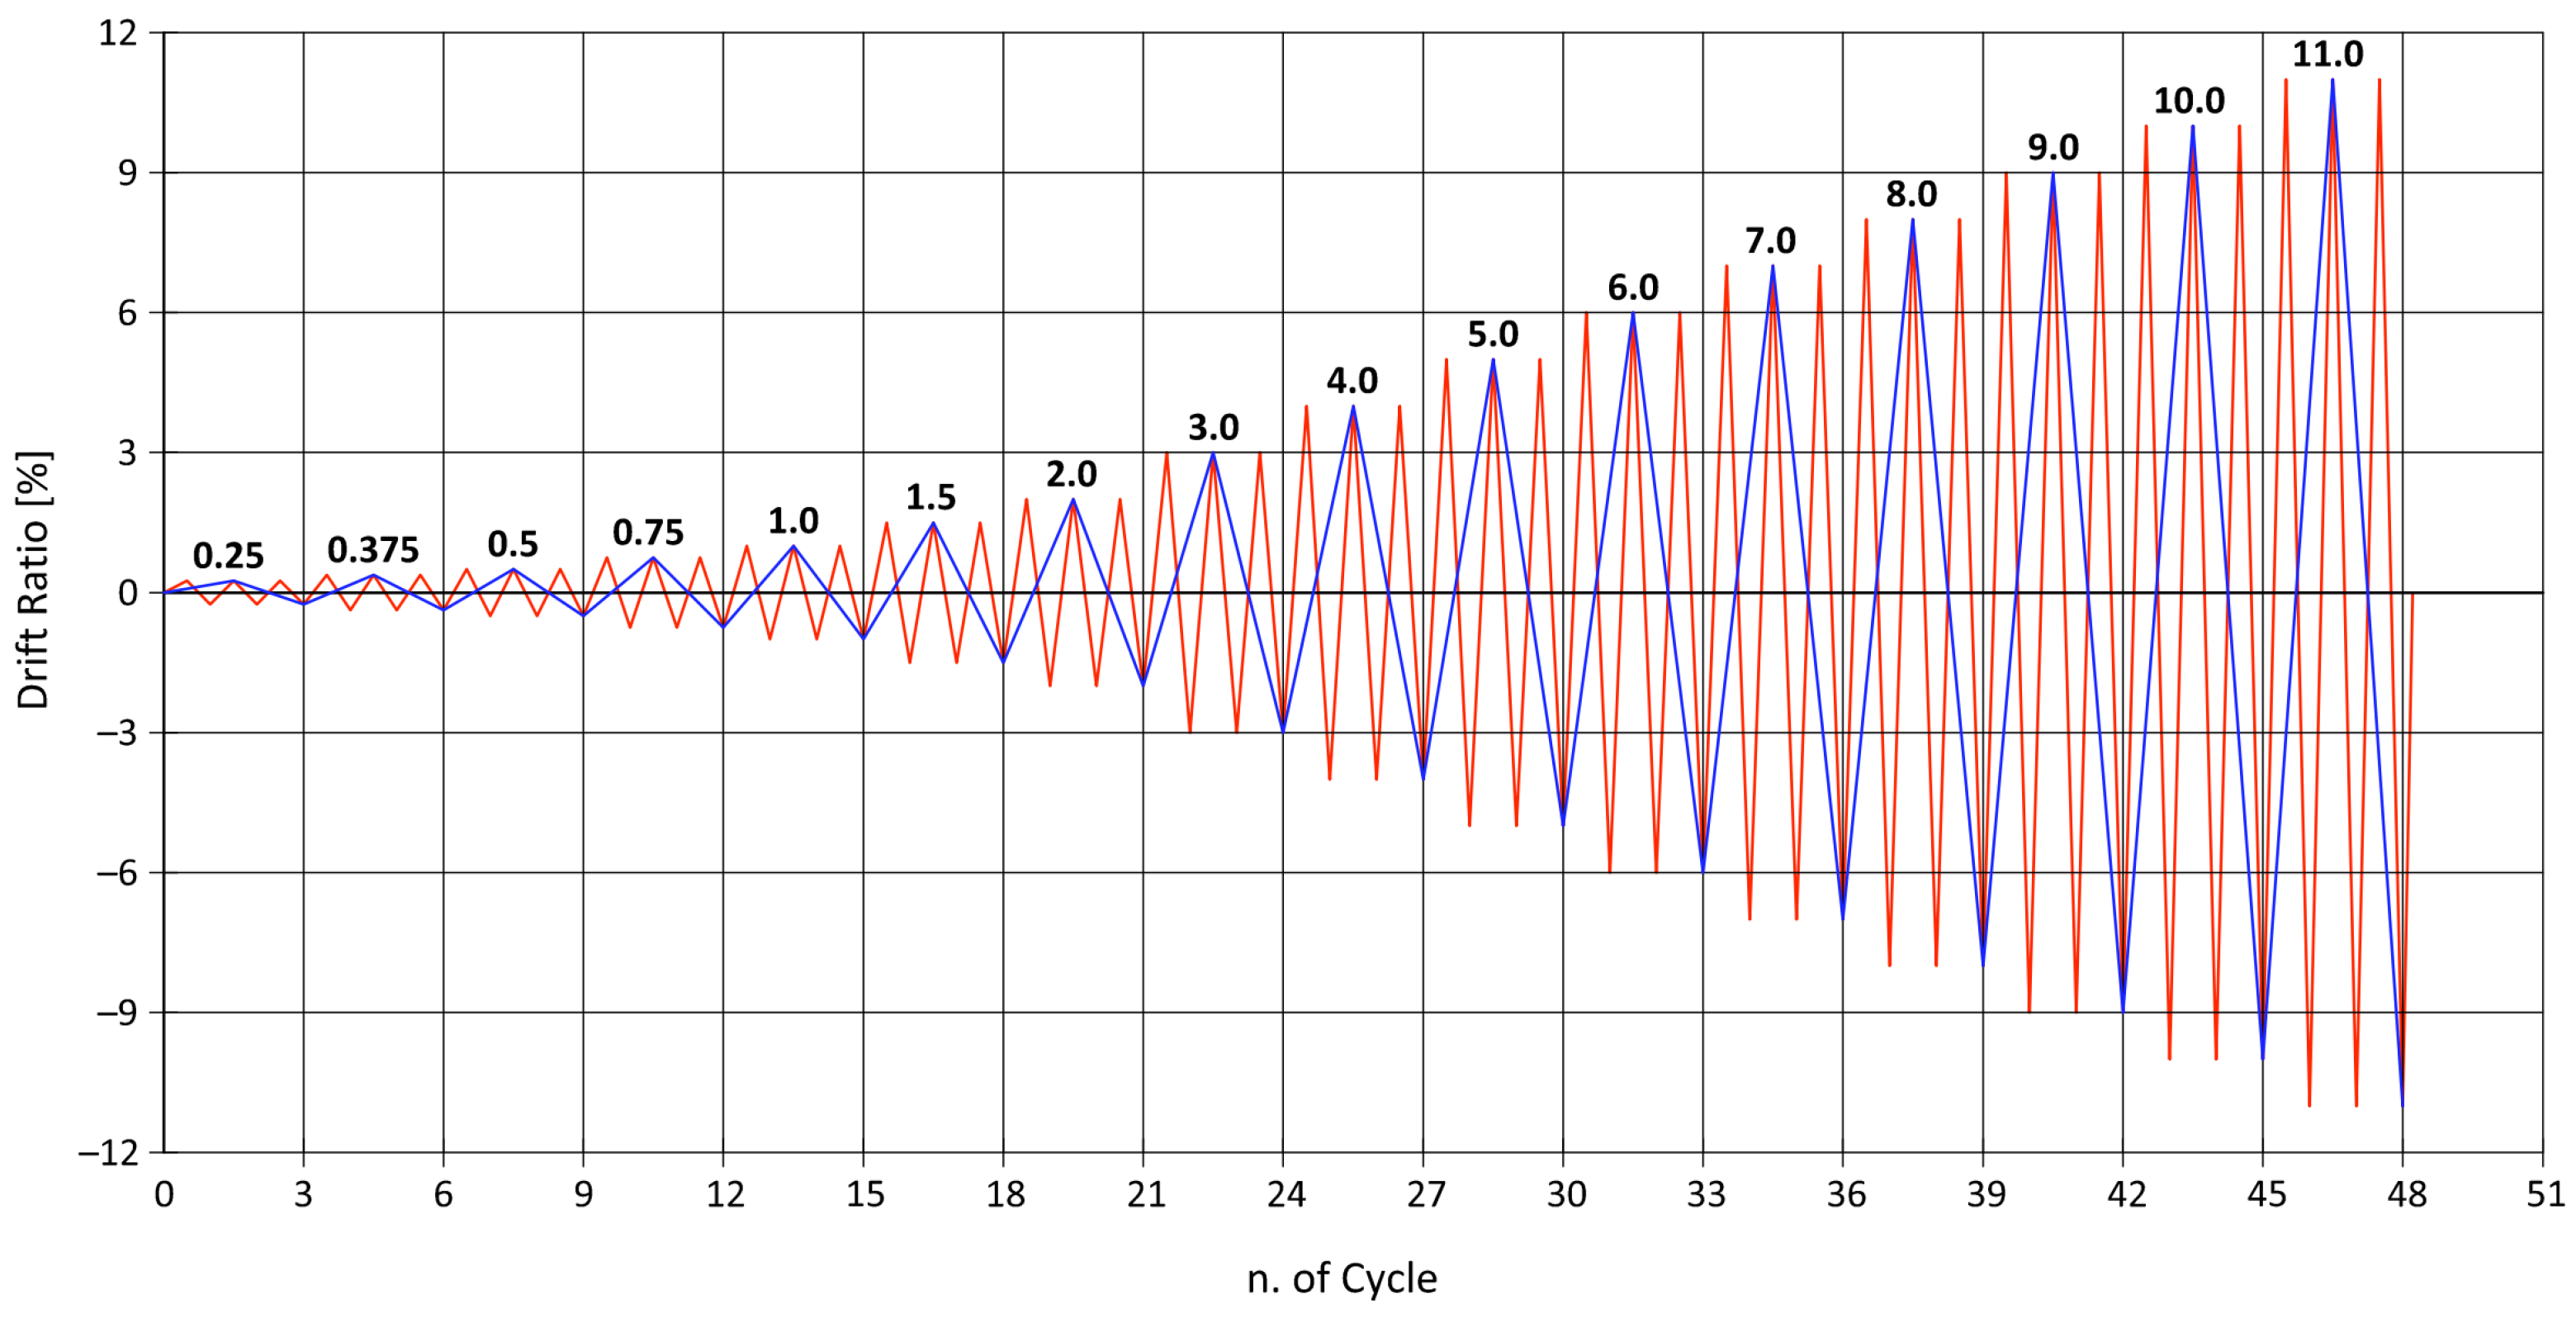
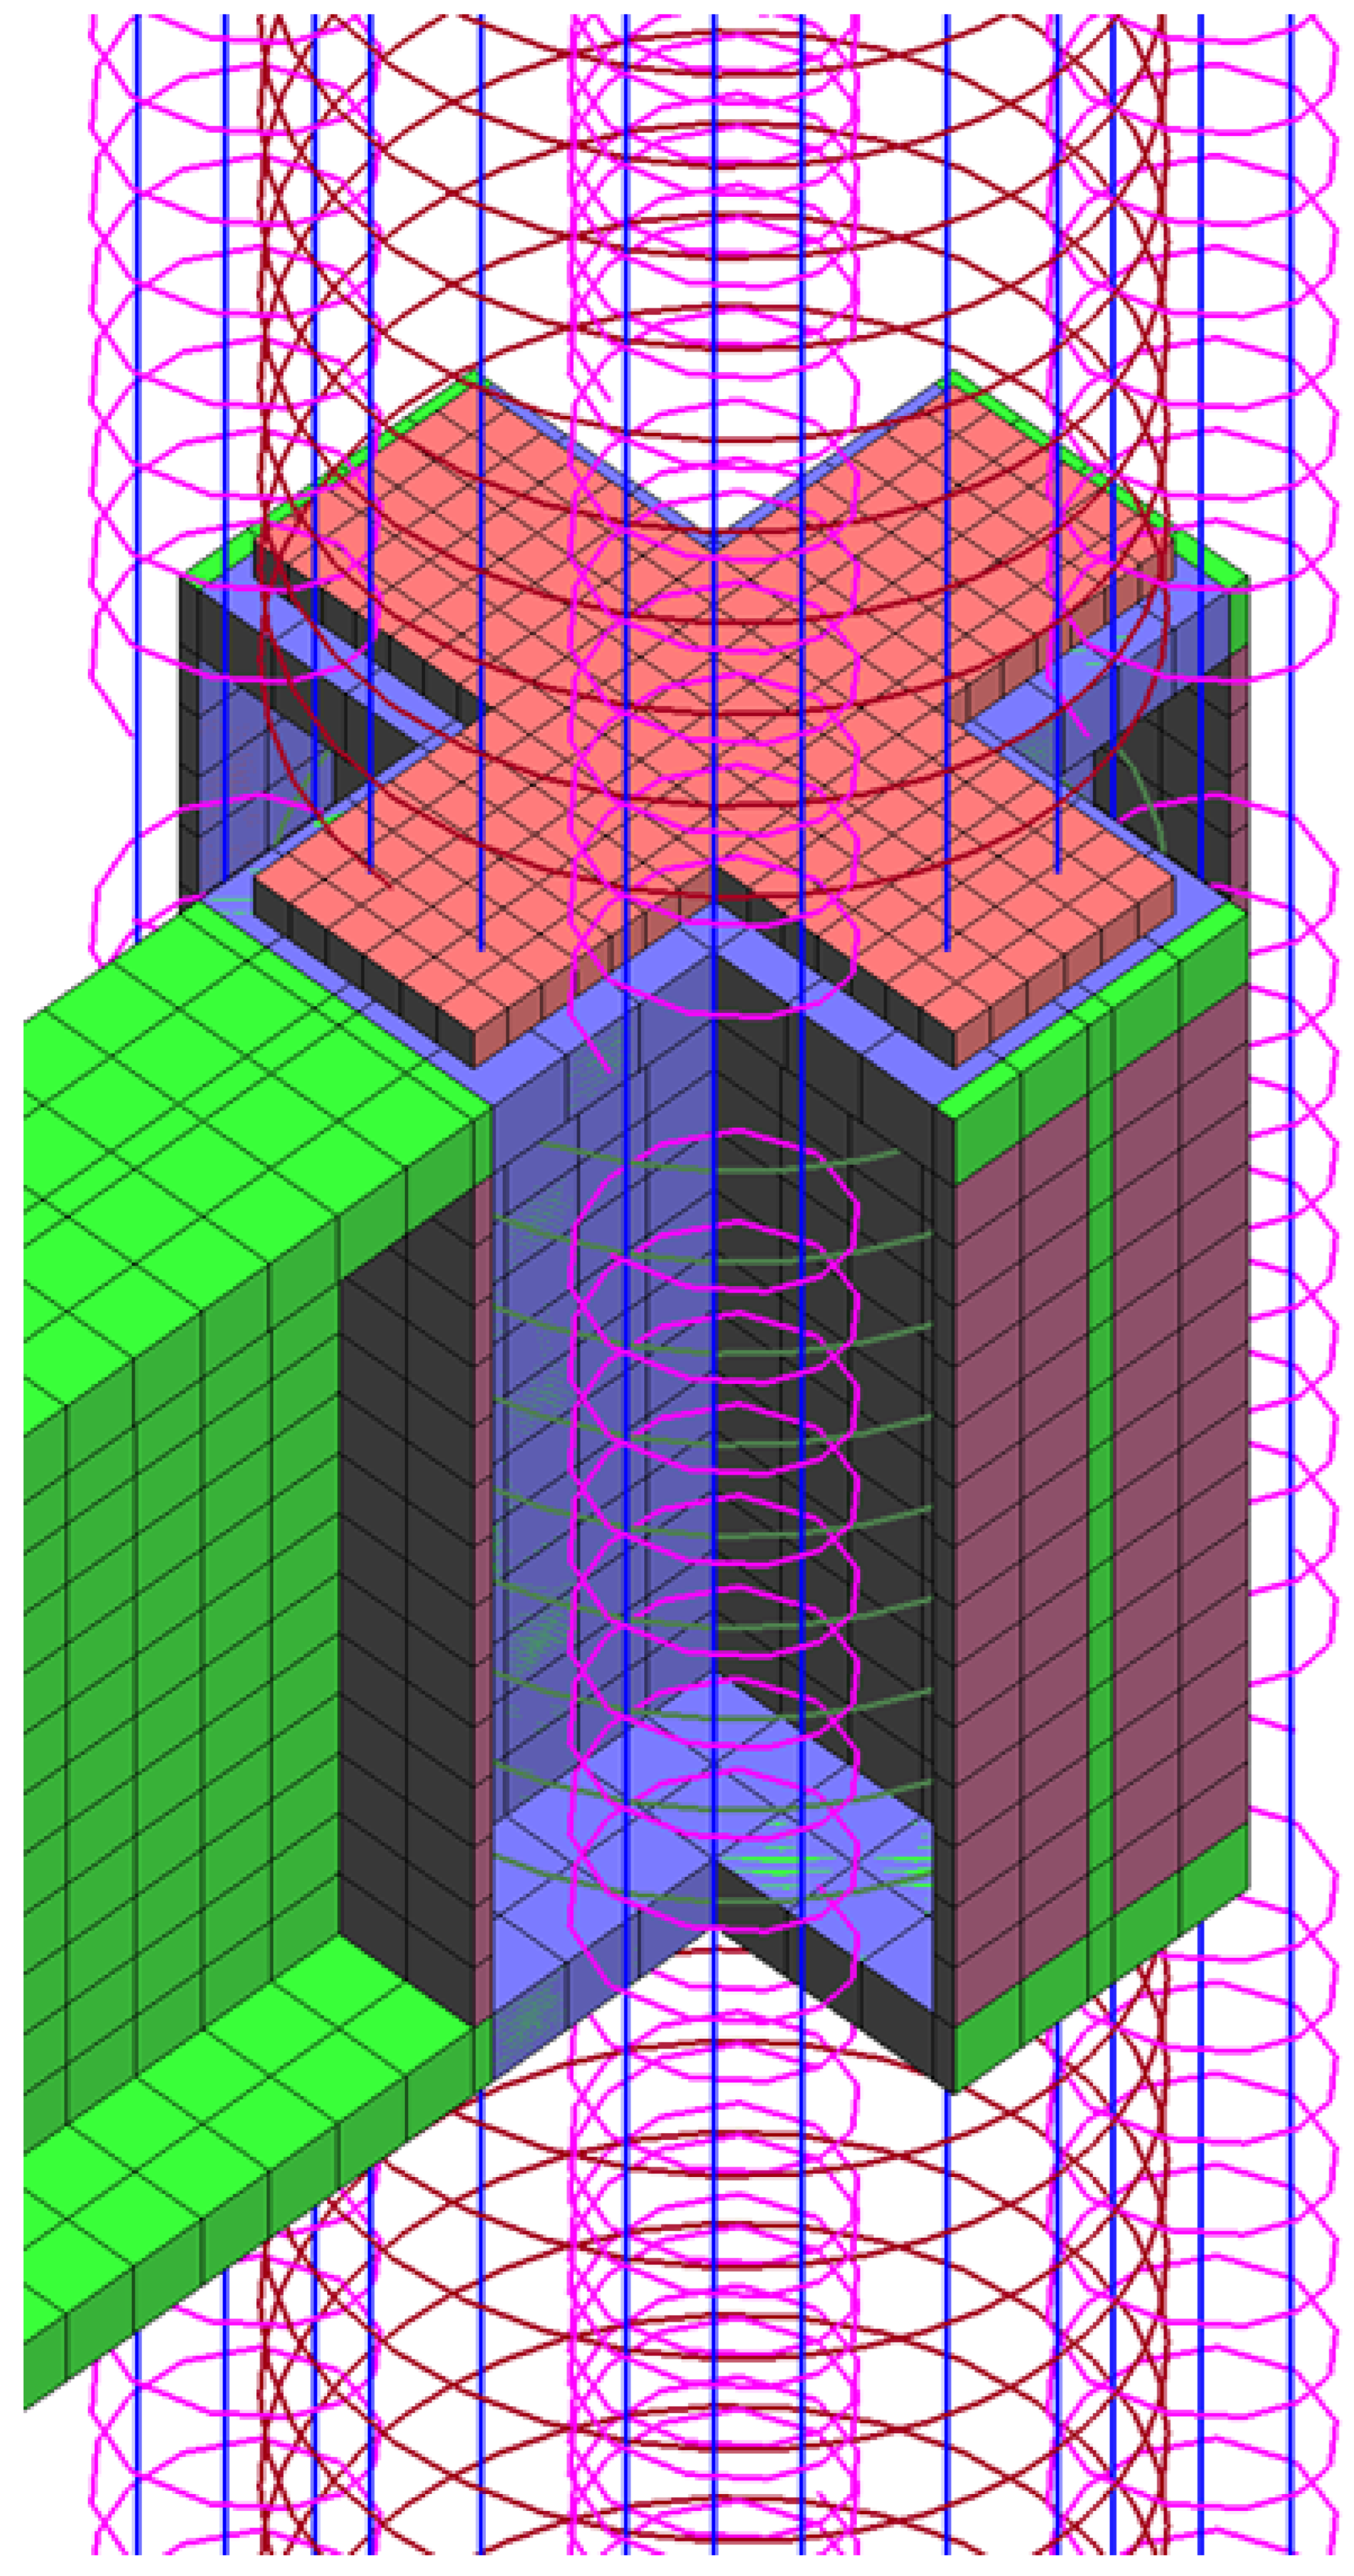
To account for the possibility of yielding of the steel beam at the edge of the joint, interface elements in the flanges and web of the beam were introduced that allow the transfer of forces in the compressive direction, but also allow for separation of adjacent surfaces in tension should the tensile stress exceed the critical value, as shown in Figure 4. The loading was performed in the cyclic regime by vertically displacing the outer edge of the steel beam according to the histogram shown in Figure 5.

2.3. Material Models

2.3.1. Concrete Material Model

For all concrete parts, the well-tested and robust NLCEM2 model [16] was used. This model applies a combined fracture-plasticity model [17]. The formulation of the material model assumes small strains and is based on the decomposition of total strain into elastic ( ε i j e ), plastic ( ε i j p ), and fracture ( ε i j f ) components. Stress development can be described using the following equations, which represent progressive degradation (formation of cracks in concrete) and plastic deformation (concrete crushing):
σ ˙ i j = D i j k l · ε ˙ k l ε ˙ k l p ε ˙ k l f
The constitutive equations of both models can be summarized as follows. Below is outlined the evolution of plastic and fracture strains:
The plastic model:
ε ˙ i j p = λ ˙ p · m i j p , m i j p = g p σ i j
The fracture model:
ε ˙ i j f = λ ˙ f · m i j f , m i j f = g f σ i j
where λ ˙ p is the plastic multiplier and g p is the plastic potential function. Considering the unified theory of elastic degradation by Carol [18], we can analogously define the values for the fracture model, i.e., λ ˙ f is the inelastic fracture multiplier and g f is the potential defining the direction of inelastic fracture strains in the fracture mechanics model.
Consistency conditions can then be applied to evaluate the evolution of plastic and fracture multipliers:
f ˙ p = n i j p · σ ˙ i j + H p · λ ˙ p = 0 , n i j p = f p σ i j
f ˙ f = n i j f · σ ˙ i j + H f · λ ˙ f = 0 , n i j f = f f σ i j
H p and H f are the hardening moduli for the plastic and fracture models, respectively. This problem represents a system of two equations for the two unknown multipliers λ ˙ p and λ ˙ f and is analogous to the multi-surface plasticity problem [19]. Details of the implementation of this model are provided in [17,20].
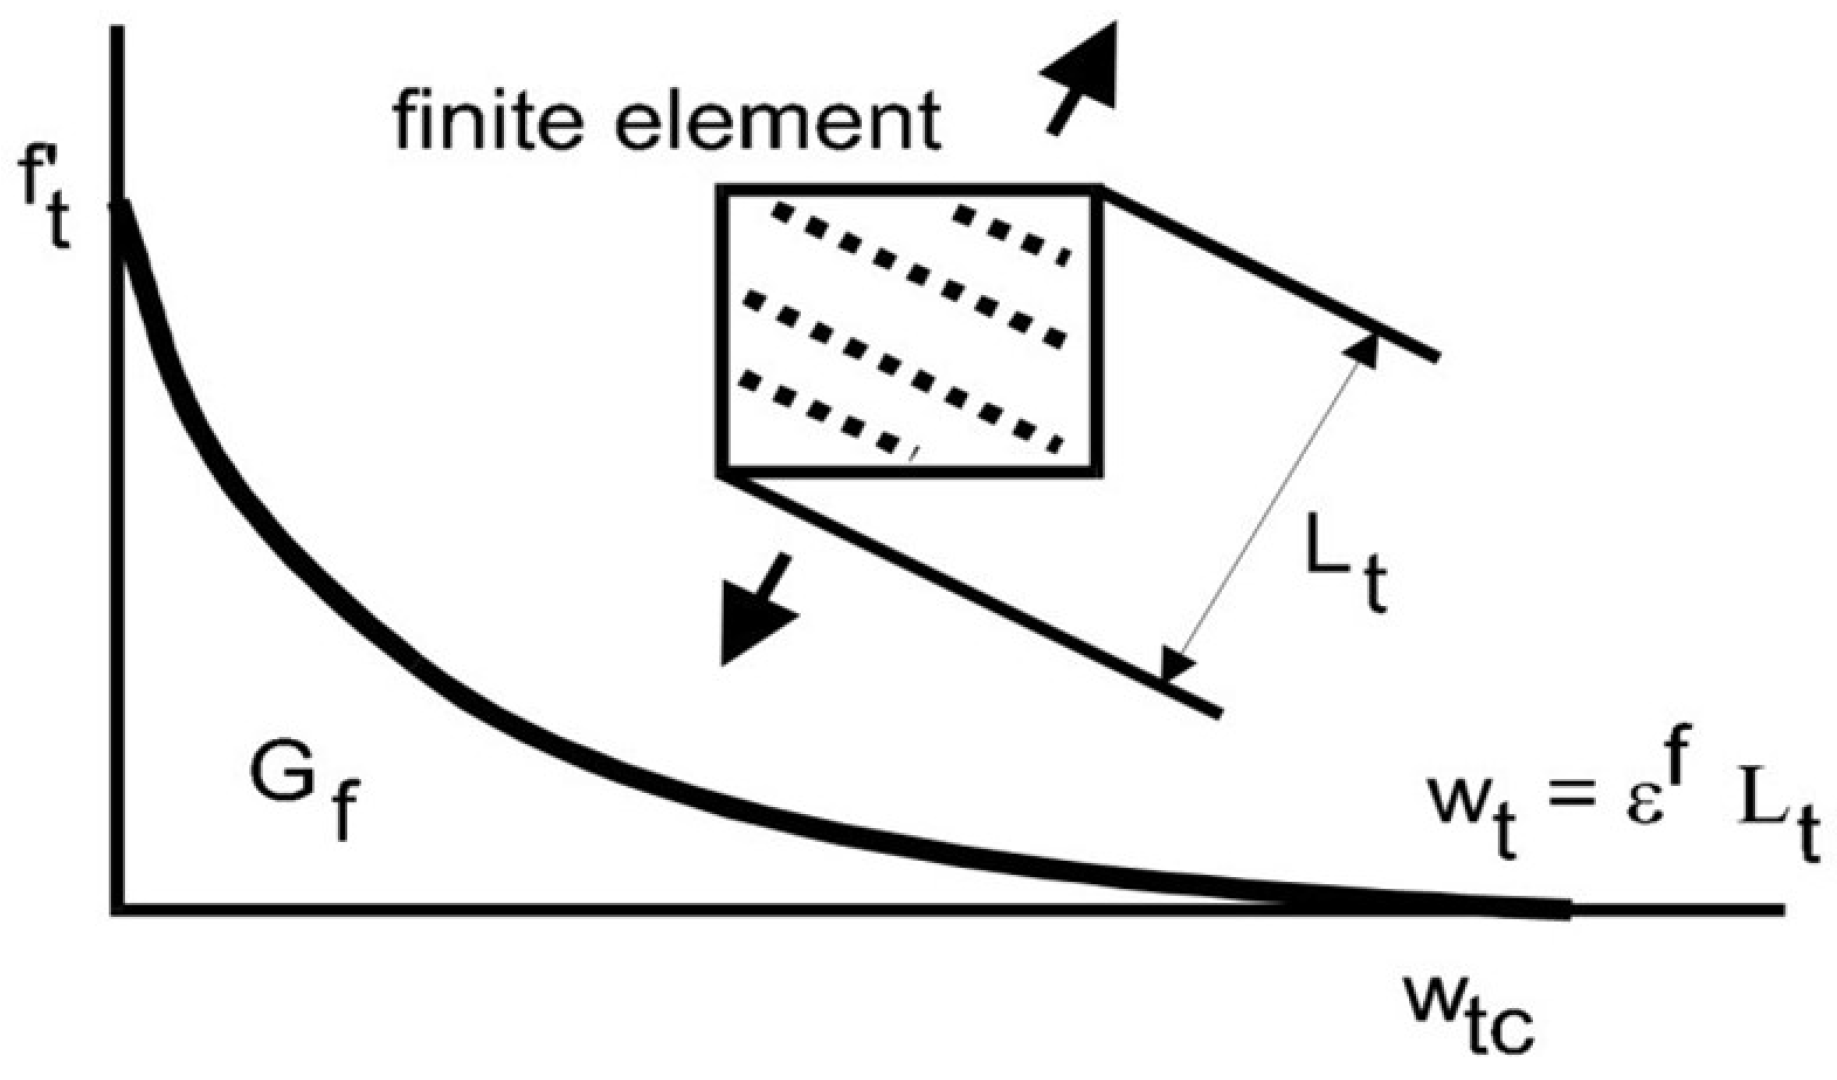
The model uses Hordijk’s exponential softening law [21], along with Rankine’s plasticity formulation for tensile failure, as shown in Figure 6 and Figure 7, respectively.
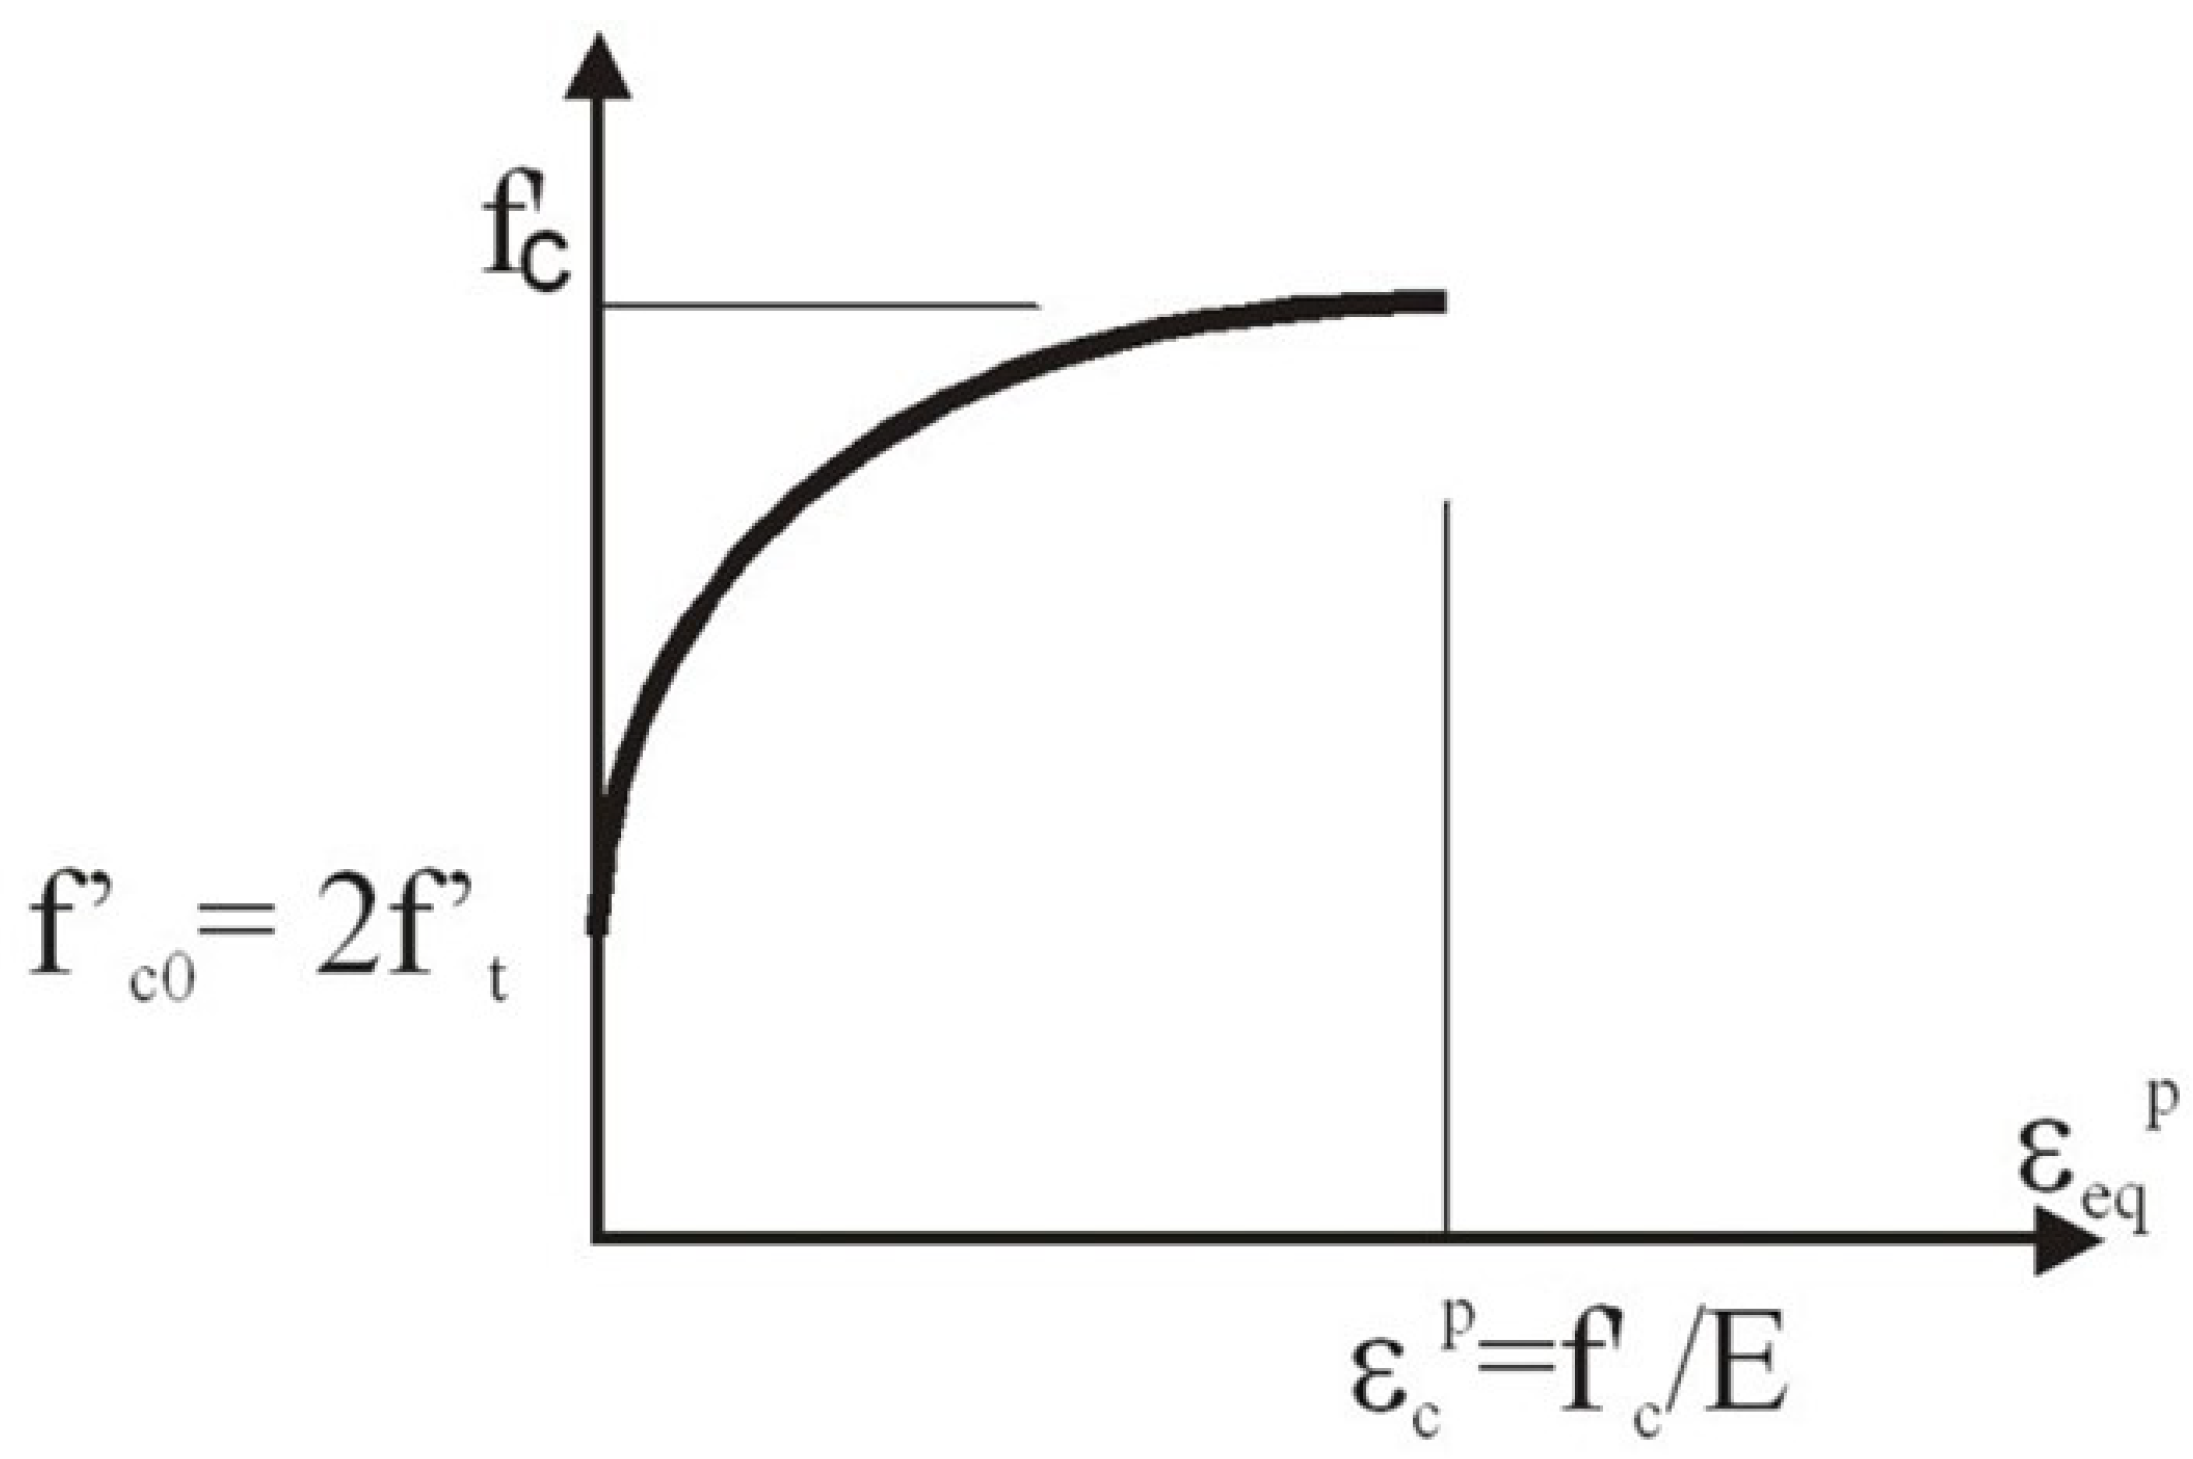
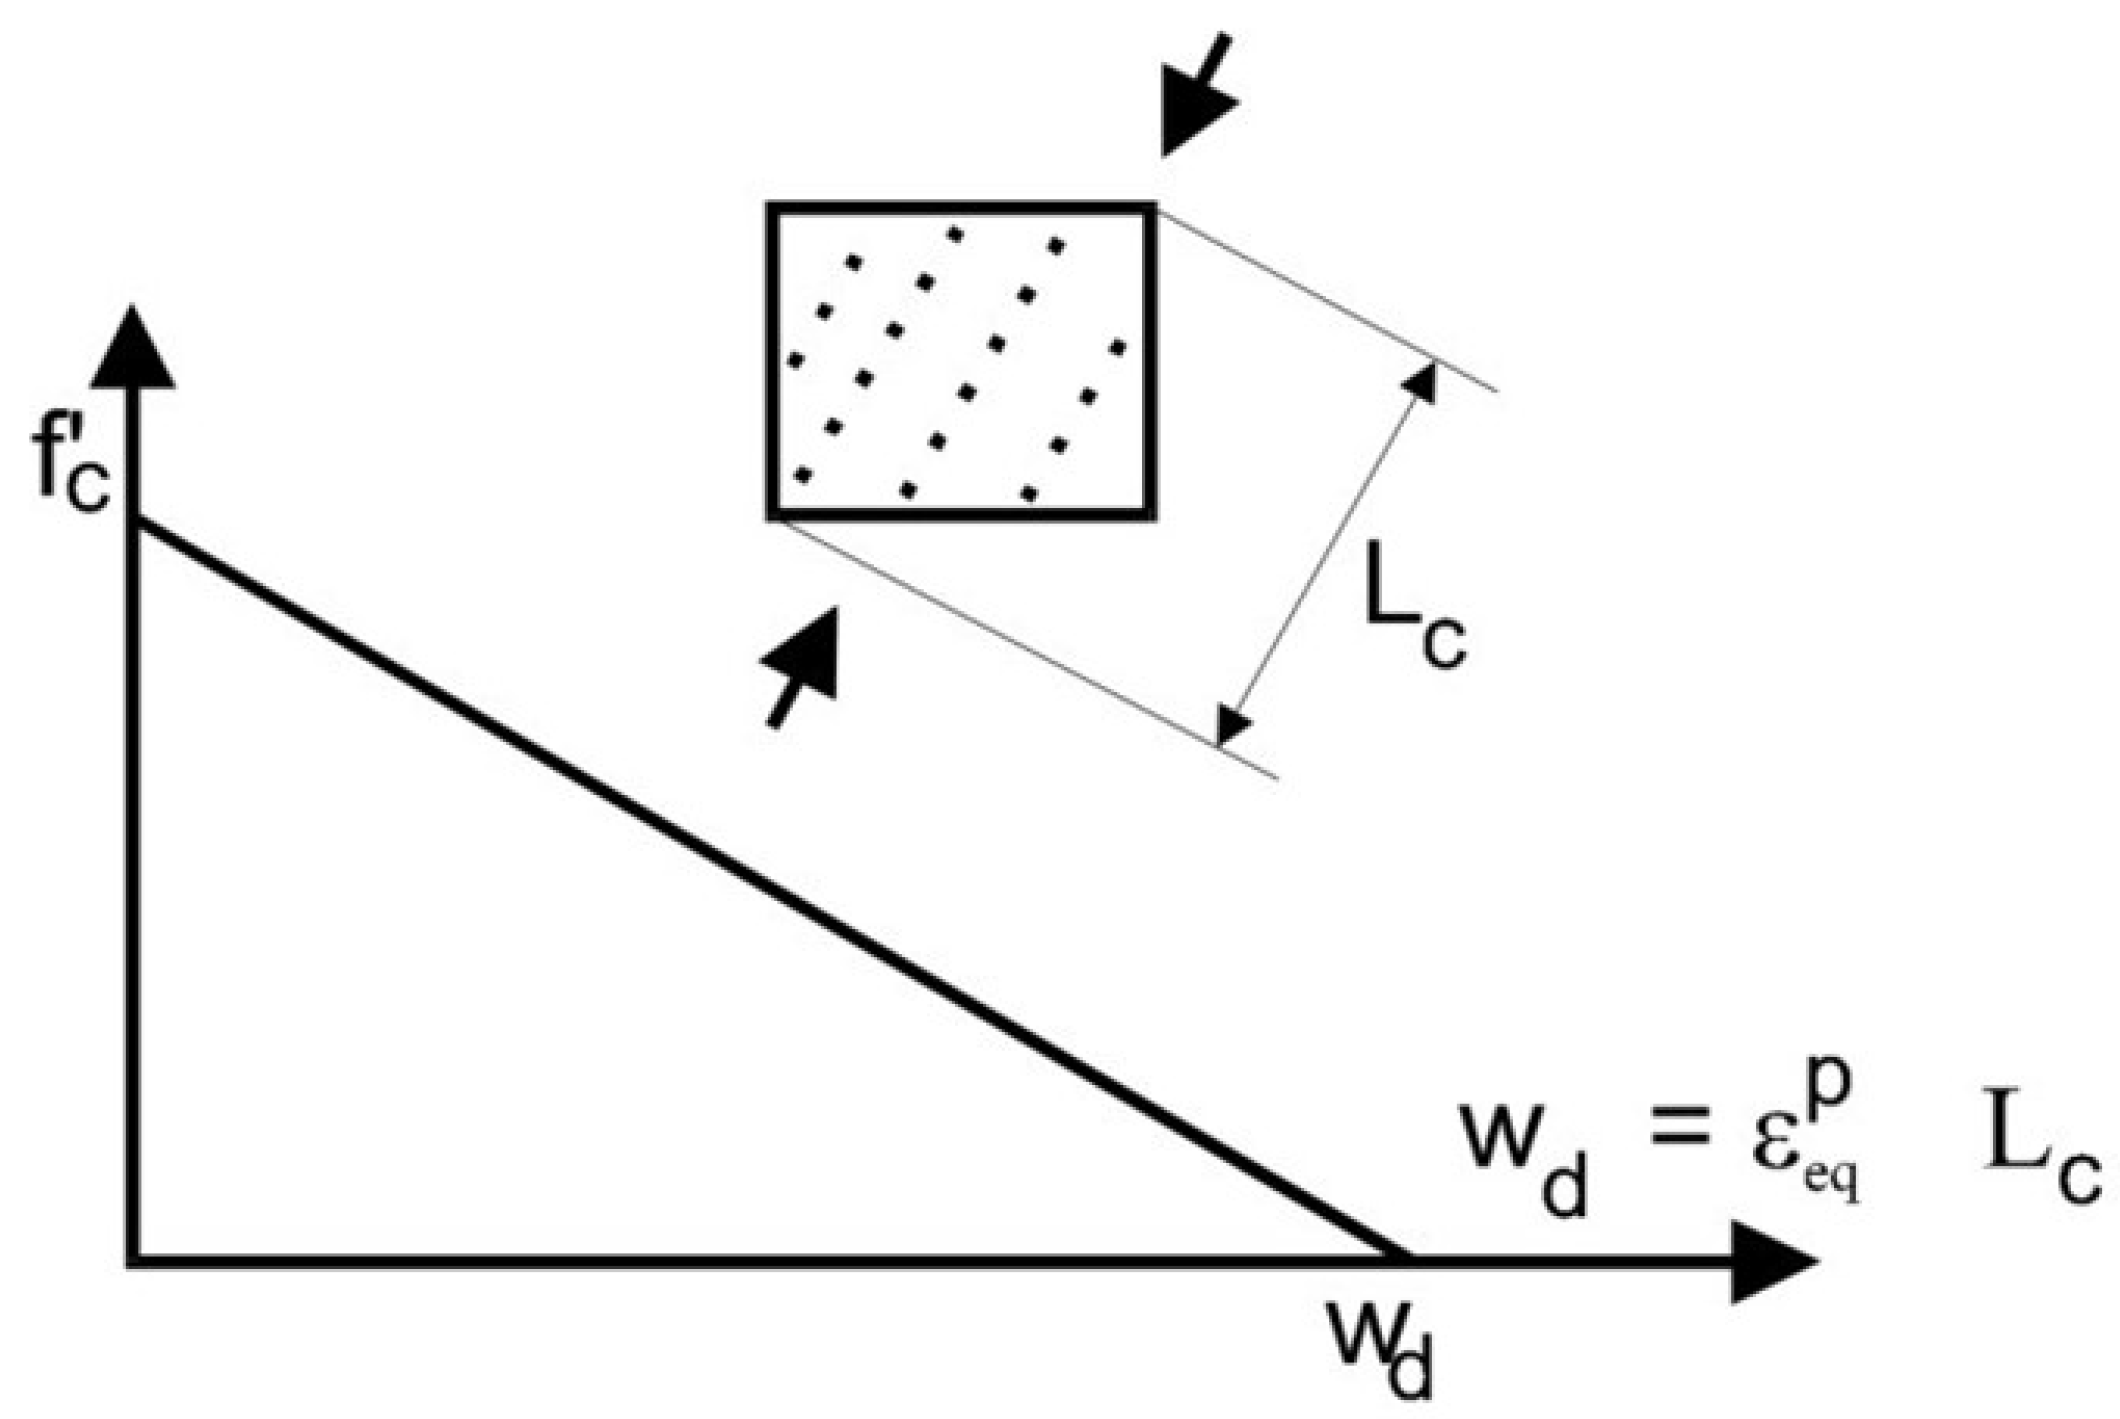
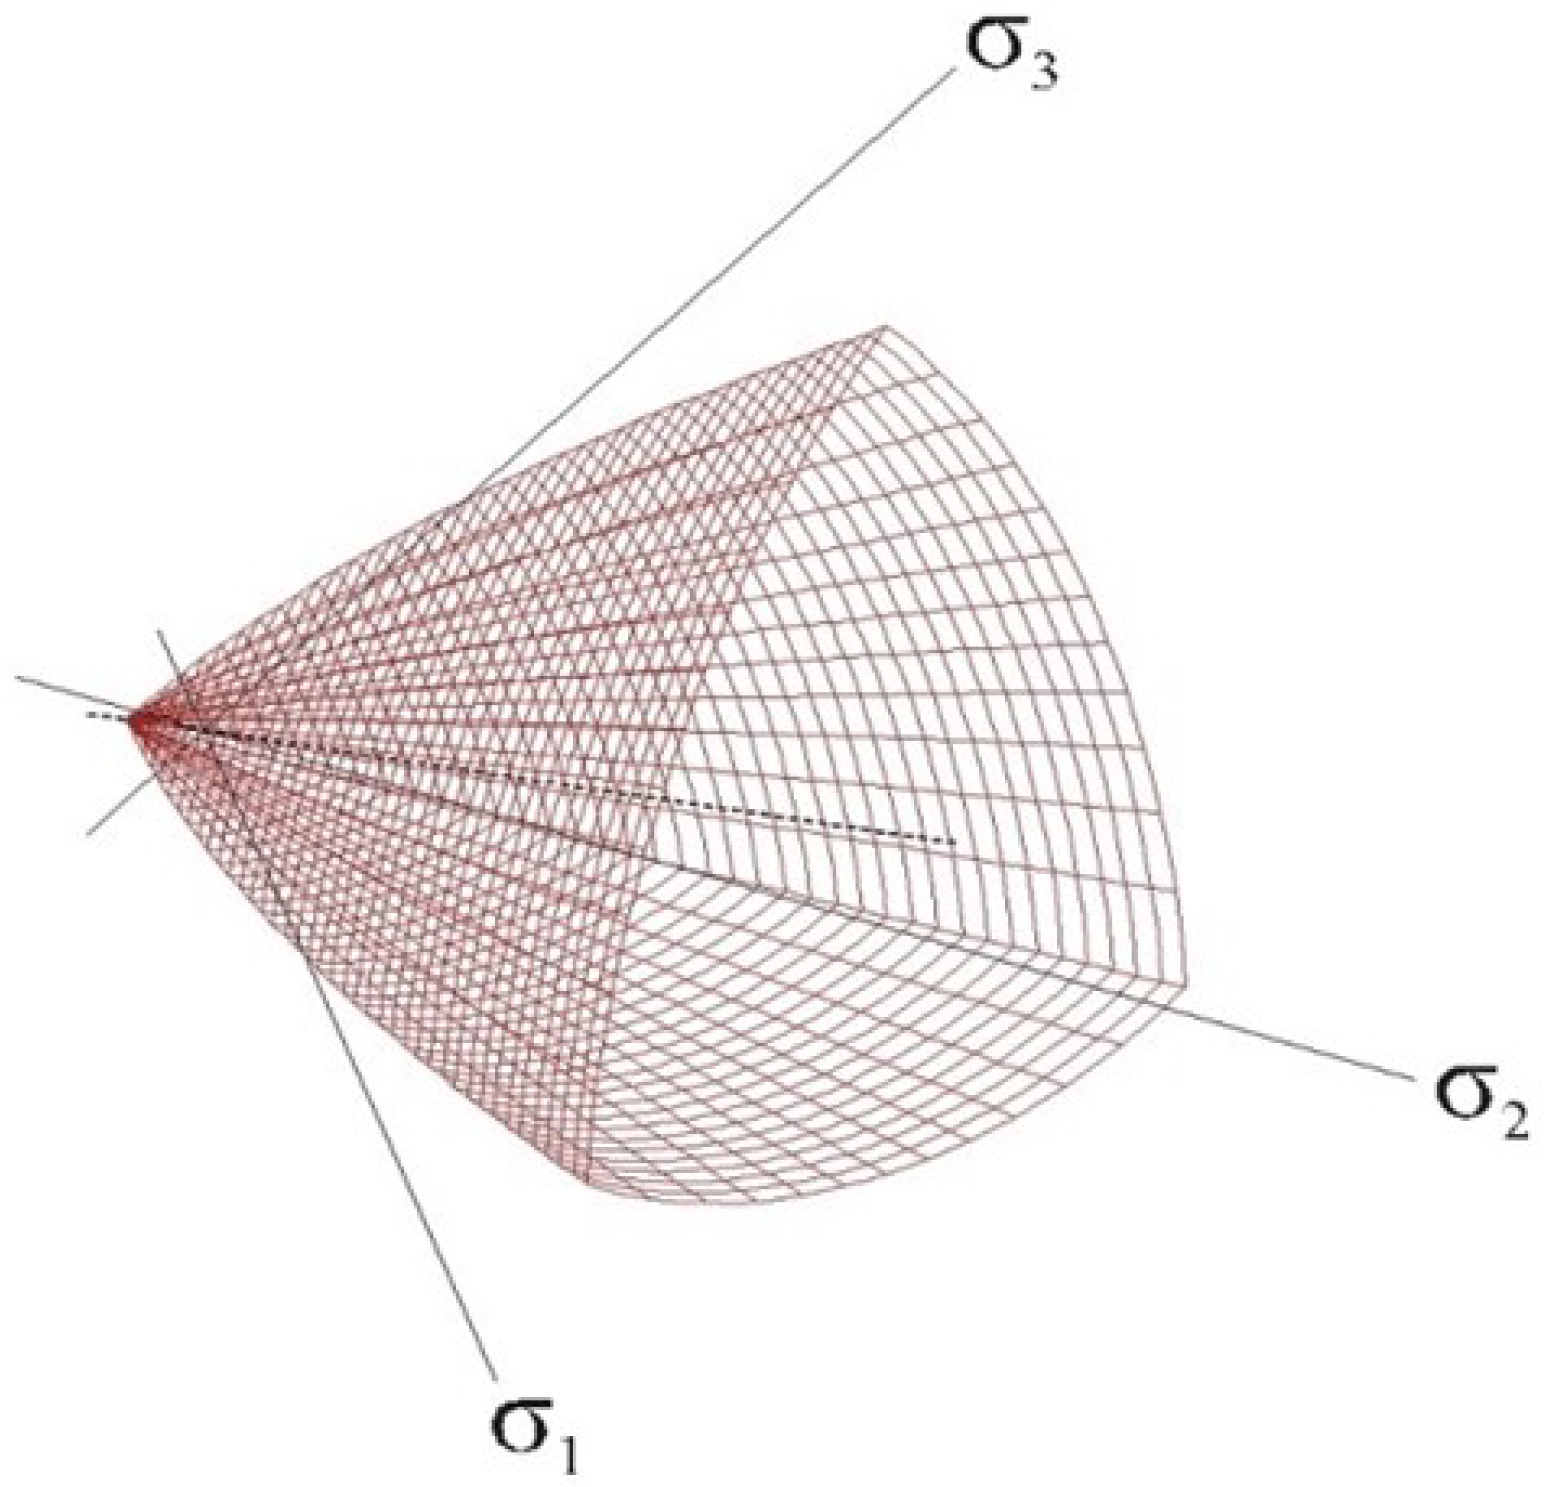
Compressive behavior is modeled using a plasticity-based approach with a three-parameter failure surface proposed by Menetrey et al. [23] (see Figure 8). The hardening and softening are defined by the laws shown in Figure 9 and Figure 10, respectively, where ε e q p is the equivalent plastic strain. Softening in both tension and compression is adjusted using the crack band approach proposed by Bažant [24].
The crack band width L t , as well as its effective size L c , is modified based on the orientation of cracks according to [25]. This method is illustrated in Figure 9 and Figure 10 and described by Equations (6) and (7).
L t = γ L t and L c = γ L c
γ = 1 + ( γ m a x 1 ) · θ 45 , θ 0 ; 45
The central idea is to adjust the size of the crack band depending on its orientation θ relative to the element edges when the crack is not parallel to them.
In nonlinear analysis of reinforced concrete when reinforcement must be considered, it is crucial to account for additional factors related to the presence of reinforcement and the composite behavior of concrete and steel. The most important aspects are the following:
1.
Shear stiffness and residual stiffness of cracked concrete (aggregate interlock effect);
2.
Reduction in compressive strength due to cracks perpendicular to the load;
3.
Bond slip of reinforcement;
4.
Tension stiffening;
5.
Dowel action and bending stiffness of reinforcement;
6.
Loss of bond between reinforcement and concrete.
In the constitutive model used, aspects (1) and (2) are considered according to the Modified Compression Field Theory (MCFT) [26]. In this theory, compressive strength is reduced according to the following equations:
σ c = r c · f c
r c = 1 0.8 + 170 ε 1 , r c l i m r c 1.0
where ε 1 is the tensile strain in the crack. In ATENA, ε 1 is determined as the maximum fracture strain, and the reduction in compressive strength is limited by the parameter r c l i m .
The shear strength of cracked concrete is reduced according to MCFT [26], as follows:
σ i j 0.18 f c 0.31 + 24 w a g + 16
where f c is the compressive strength in MPa, a g is the maximum aggregate size in mm, and w is the maximum crack width in mm in the analyzed region.
MCFT does not provide a direct expression for shear stiffness, which is an important parameter significantly affecting the response of reinforced concrete. In the current formulation, the shear stiffness of the crack is calculated directly from the normal stiffness.
Reinforcement is modeled as an embedded element using truss elements and a multilinear stress–strain diagram to accurately capture bond slip and the yielding characteristics. An optional effect of increased tensile stiffness can also be specified. The hysteretic behavior of the steel rebar is modeled using the commonly utilized [27] Menegotto–Pinto model [28].

2.3.2. Steel Material Model

Experimental stress–strain diagrams determined through separate experiments mentioned in [13] were used for all steel materials (beam web, flange, doubler plate, and face bearing plate), which were incorporated into ATENA as a steel elastic material with a bilinear elastic diagram using the von Mises yield criterion (Equation (11)). Since the yielding was not expected to occur in the steel components of the joint, this measure significantly reduced the computational requirements.
σ v M = σ y 3 = J 2
where the σ v M component represents the von Mises stress criterion. This criterion is set to σ y , the yield stress. The second invariant of the deviatoric part of Cauchy stress J 2 , which the Cauchy stress tensor components can substitute, is shown in Equation (12).
σ v M = 1 6 · ( σ 1 σ 2 ) 2 + ( σ 2 σ 3 ) 2 + ( σ 3 σ 1 ) 2 = = 1 2 · ( σ 11 σ 22 ) 2 + ( σ 22 σ 33 ) 2 + ( σ 33 σ 11 ) 2 + 6 · ( σ 12 2 + σ 23 2 + σ 31 2 )

2.4. Boundary Conditions and Model Properties

Numerical simulations were performed in the ATENA v.5.9.2 software using advanced material models and experience from various research projects and forms of blind predictions with similar setups. The numerical model was developed with respect to the correct geometry, column fixing, load, material interfaces, and materials used. The basic geometry of the model is shown in Figure 2.
Reinforcement is modeled as embedded, and its mesh is made as one element for each 1D member, and subsequently division is made after the creation of hexahedral elements for concrete. Steel and concrete materials use linear hexahedral elements, and contact between individual bodies is created either by fixed contacts for neighboring bodies for fixed entities or via an interface material for the steel beam–concrete interface that only allows for the transfer of compressive forces but allows for the separation of materials in the tensile direction (Figure 4).
To accurately represent the boundary conditions of the experiment Figure 2, the column was fixed by a stiff metal slab on both ends and allowed to rotate along a surface-dividing line on top and allowed to translate in the direction of the x-axis. Loading was performed by displacing the tip of the steel beam in the vertical direction. Since the inside of the joint is a complicated geometry with multiple material interfaces, the contacts between individual bodies must be prepared carefully. Figure 11 shows the internal parts of the joint without concrete members. We can observe many important details in the joint. Separation of the reinforcement between the joint and column was modeled (as performed in the experiment), column concrete (not visible in Figure 11) was connected to steel beam members via a compression-only interface, the connection of beam web and flanges as well as the front bearing plates was conducted using compatible hexahedral mesh and the flange doubler plate was modeled to be in fixed contact with both steel and concrete neighboring volumes.
The openings for reinforcement and concreting, which were present in the real experiment, were not modeled for the sake of simplicity, reduction in computational times, or to allow good-quality meshing with hexahedral elements. This omission is justified, as the mass removed is negligible and the openings are small and circular (not indicative of stress concentrations). Since the multispiral reinforcement is also discontinued at the column–joint junction, it is safe to assume the overall response does not change. However, a more in-depth analysis of this simplification in the future would confirm this simplified approach. The lateral brace seen in Figure 11 was modeled simply by fixing the y-axis displacement of some of the elements after meshing. Evaluation of stress–strain diagrams was conducted by monitoring the overall force reaction at the beam’s tip and plotting it against the drift ratio (beam tip displacement divided by beam length of 3500 mm). There were two variants of the tested columns with different values of axial pre-load. Those were the LP (lower prestress of 0.1× concrete strength—3018 kN) variant and the HP variant (0.5× concrete strength—15,556 kN).
The main concrete NLCEM2 model properties are listed in Table 1. The reinforcement was modeled as multilinear with varying properties for each kind of reinforcement according to the used experiment (individual points with specified strain and stress]. Therefore, reinforcement properties are not included for brevity, but can be found in [13].

2.5. Parametric Model Generation

ATENA Preprocessor 2025 (Červenka Consulting, Prague, Czechia) offers advanced support for creating custom plugins that allow the user to extend and customize the standard functionality of the software to their specific needs. Users can design their own graphical interface for entering input data according to the specific requirements of a particular task, which simplifies and streamlines the entire model preparation process. This flexibility allows for more effective use of the software in solving specific engineering problems without having to modify the core of the program. The created plugin subsequently enables automatic generation of the entire computational task, i.e., creation of model geometry, definition of materials, element types, mesh parameters, boundary conditions, and all other input data, which are set by the user via a graphical interface as standard. This approach significantly increases work efficiency and reduces the error rate in model preparation, especially in cases of repetitive or parametric analyses.
Figure 12 shows the Geometry tab of the plugin that was created for the purpose of generating MRCCs. On this tab, it is possible to set some basic model parameters, such as column dimensions, dimensions of concrete and steel parts, flange and web thickness of the I-beam, etc. This graphical environment is simply defined using an XML part (see Appendix A.1), in which individual types of control elements are defined, while interaction and model generation is implemented using Python version 3.9.7 scripts (see Appendix A.2). After pressing the Create geometry button, a method defined in Python will be launched, which will generate the geometry according to the user-defined parameters.
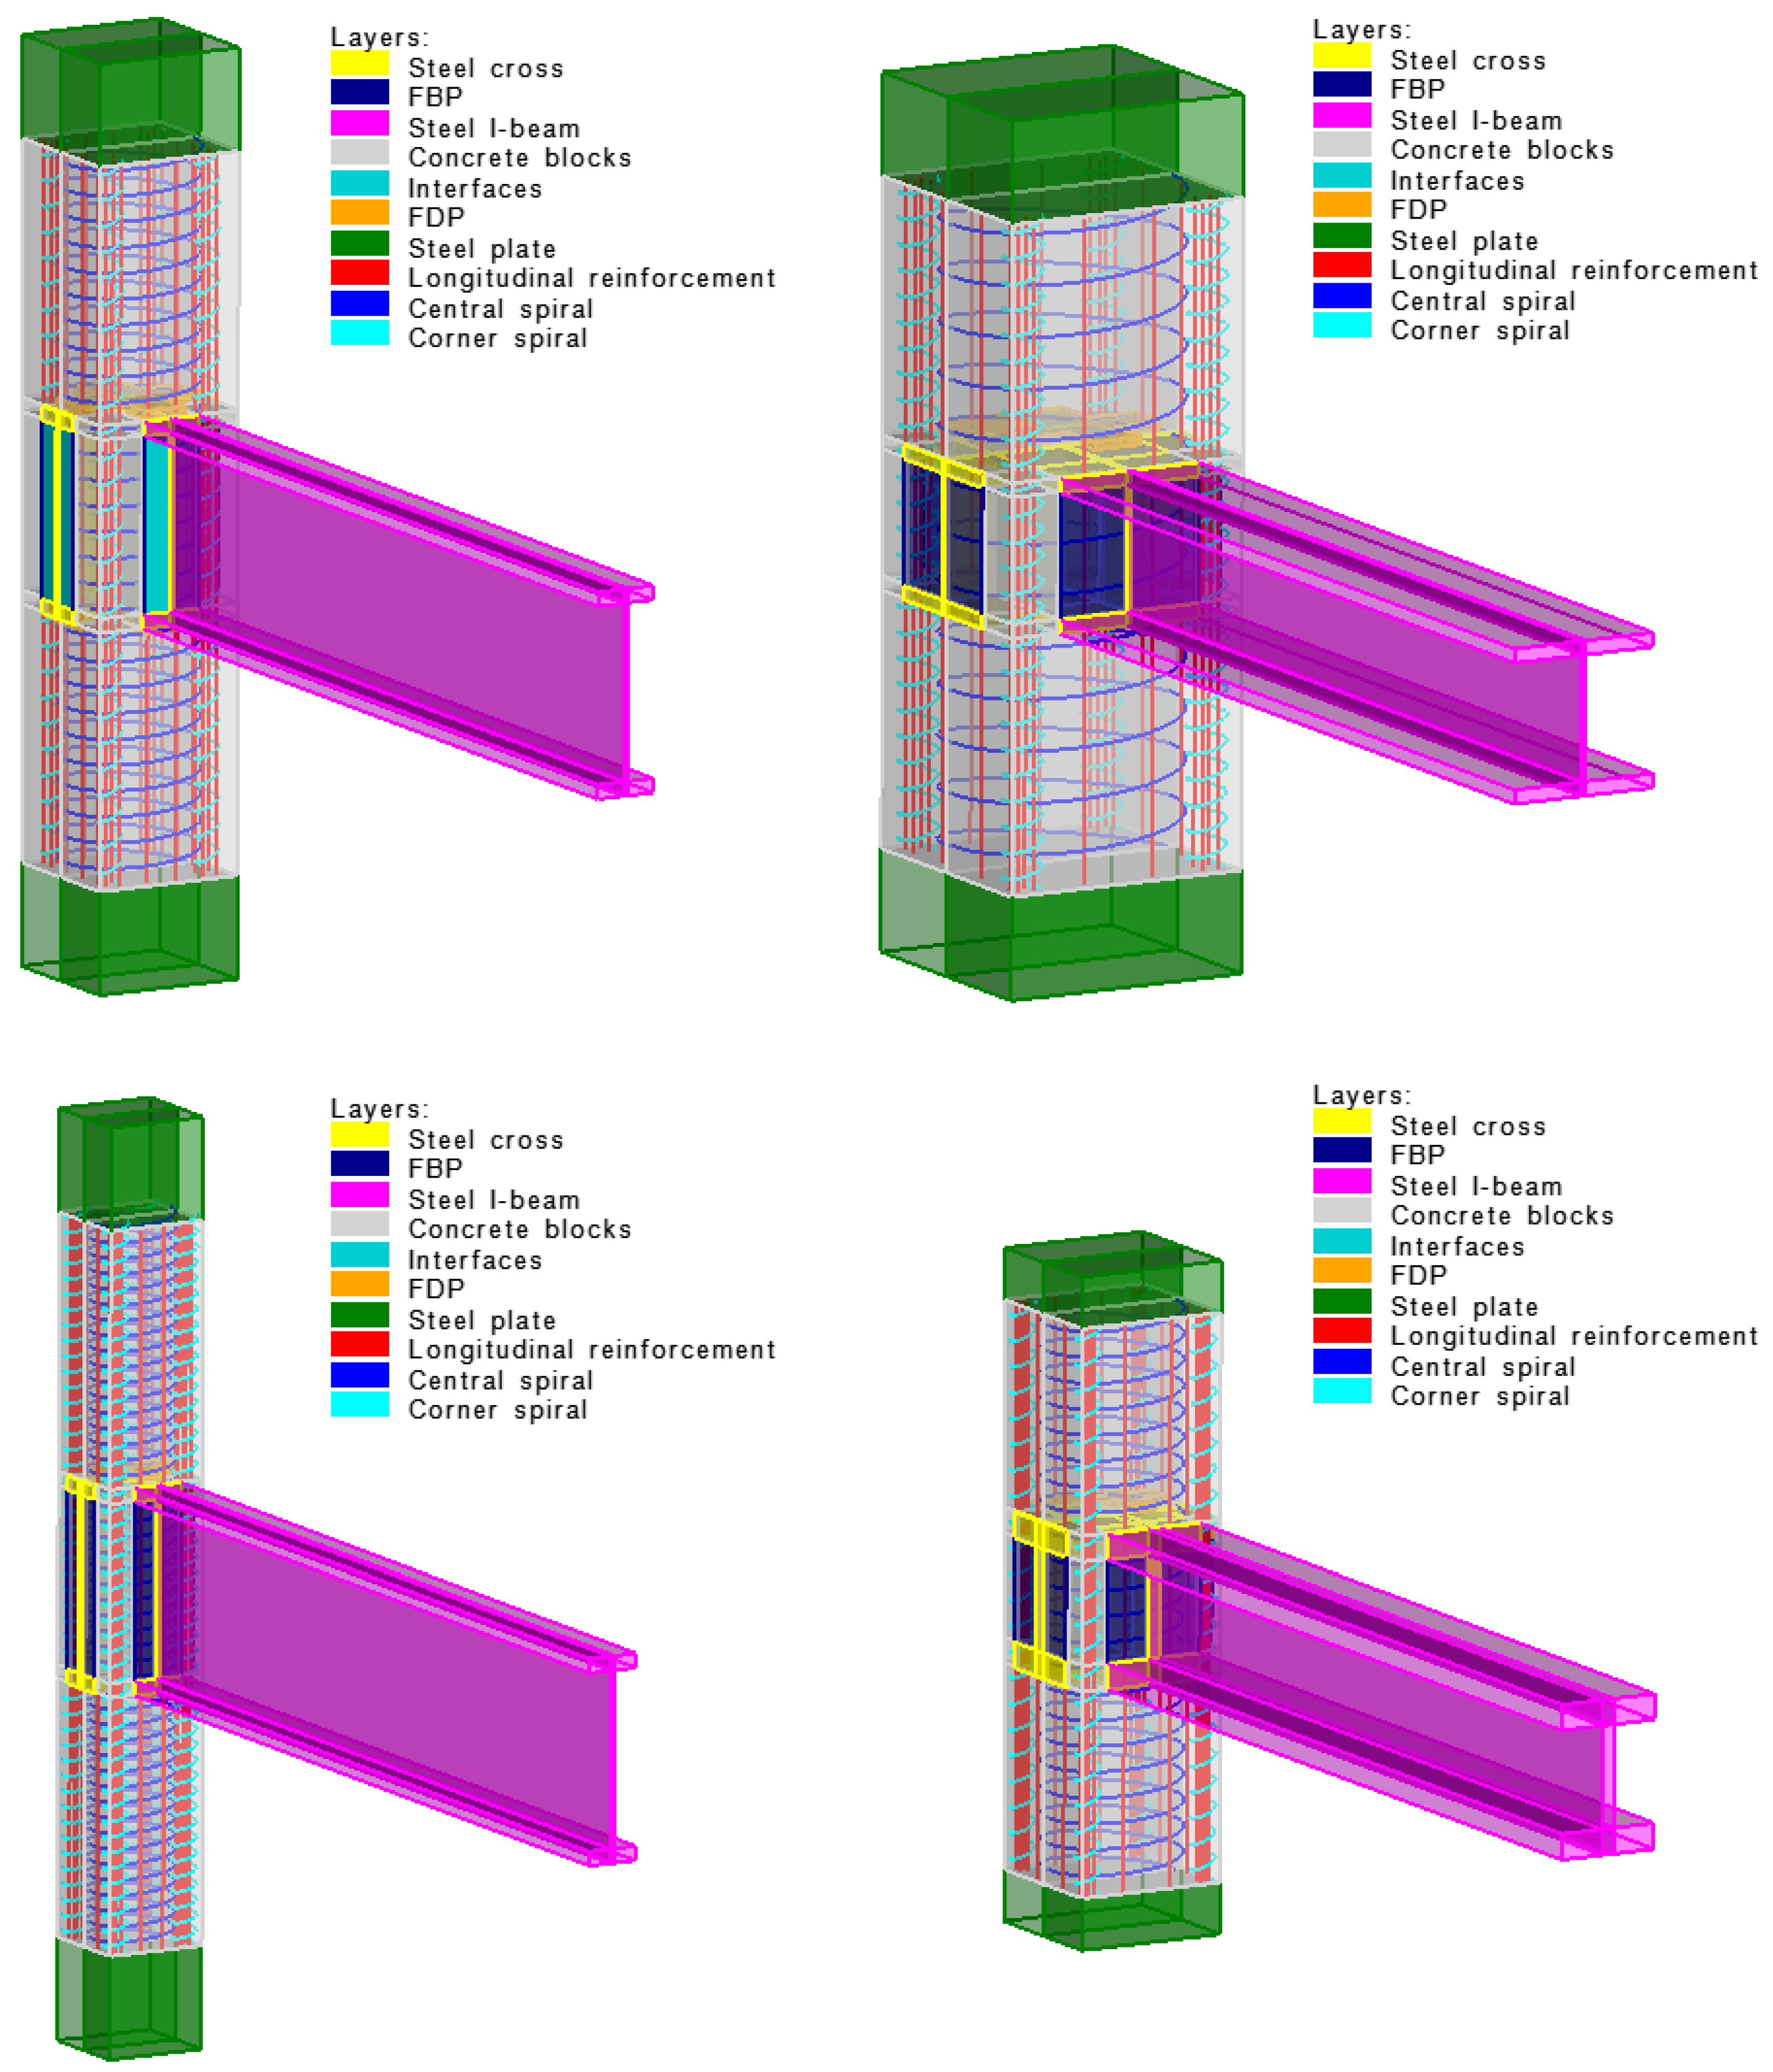
Figure 13 shows examples of four generated MRCC geometries. In these examples, Column side a, Height of concrete part v1, Height of steel part v2, Beam width b, Beam height h, Thickness of flange t f , and Thickness of web t w were modified. Other parameters remained unchanged. Along with the geometry, materials and element types are automatically created during generation and are assigned to the created elements. All elements are created in the corresponding layers, as can be seen in Figure 13. The next tab, Reinforcement, is responsible for generating the reinforcement. Three types of reinforcement are created here: longitudinal, central spiral, and corner spiral (this reinforcement is visible in Figure 13 due to the transparent visualization). The final tab Analysis adds all the necessary load cases, boundary conditions, and monitors to the model and creates the analysis task. The example is thus ready to run the calculation directly without any further user intervention. Creating one’s own plugins thus offers significant time savings when modeling repetitive construction processes.

3. Results

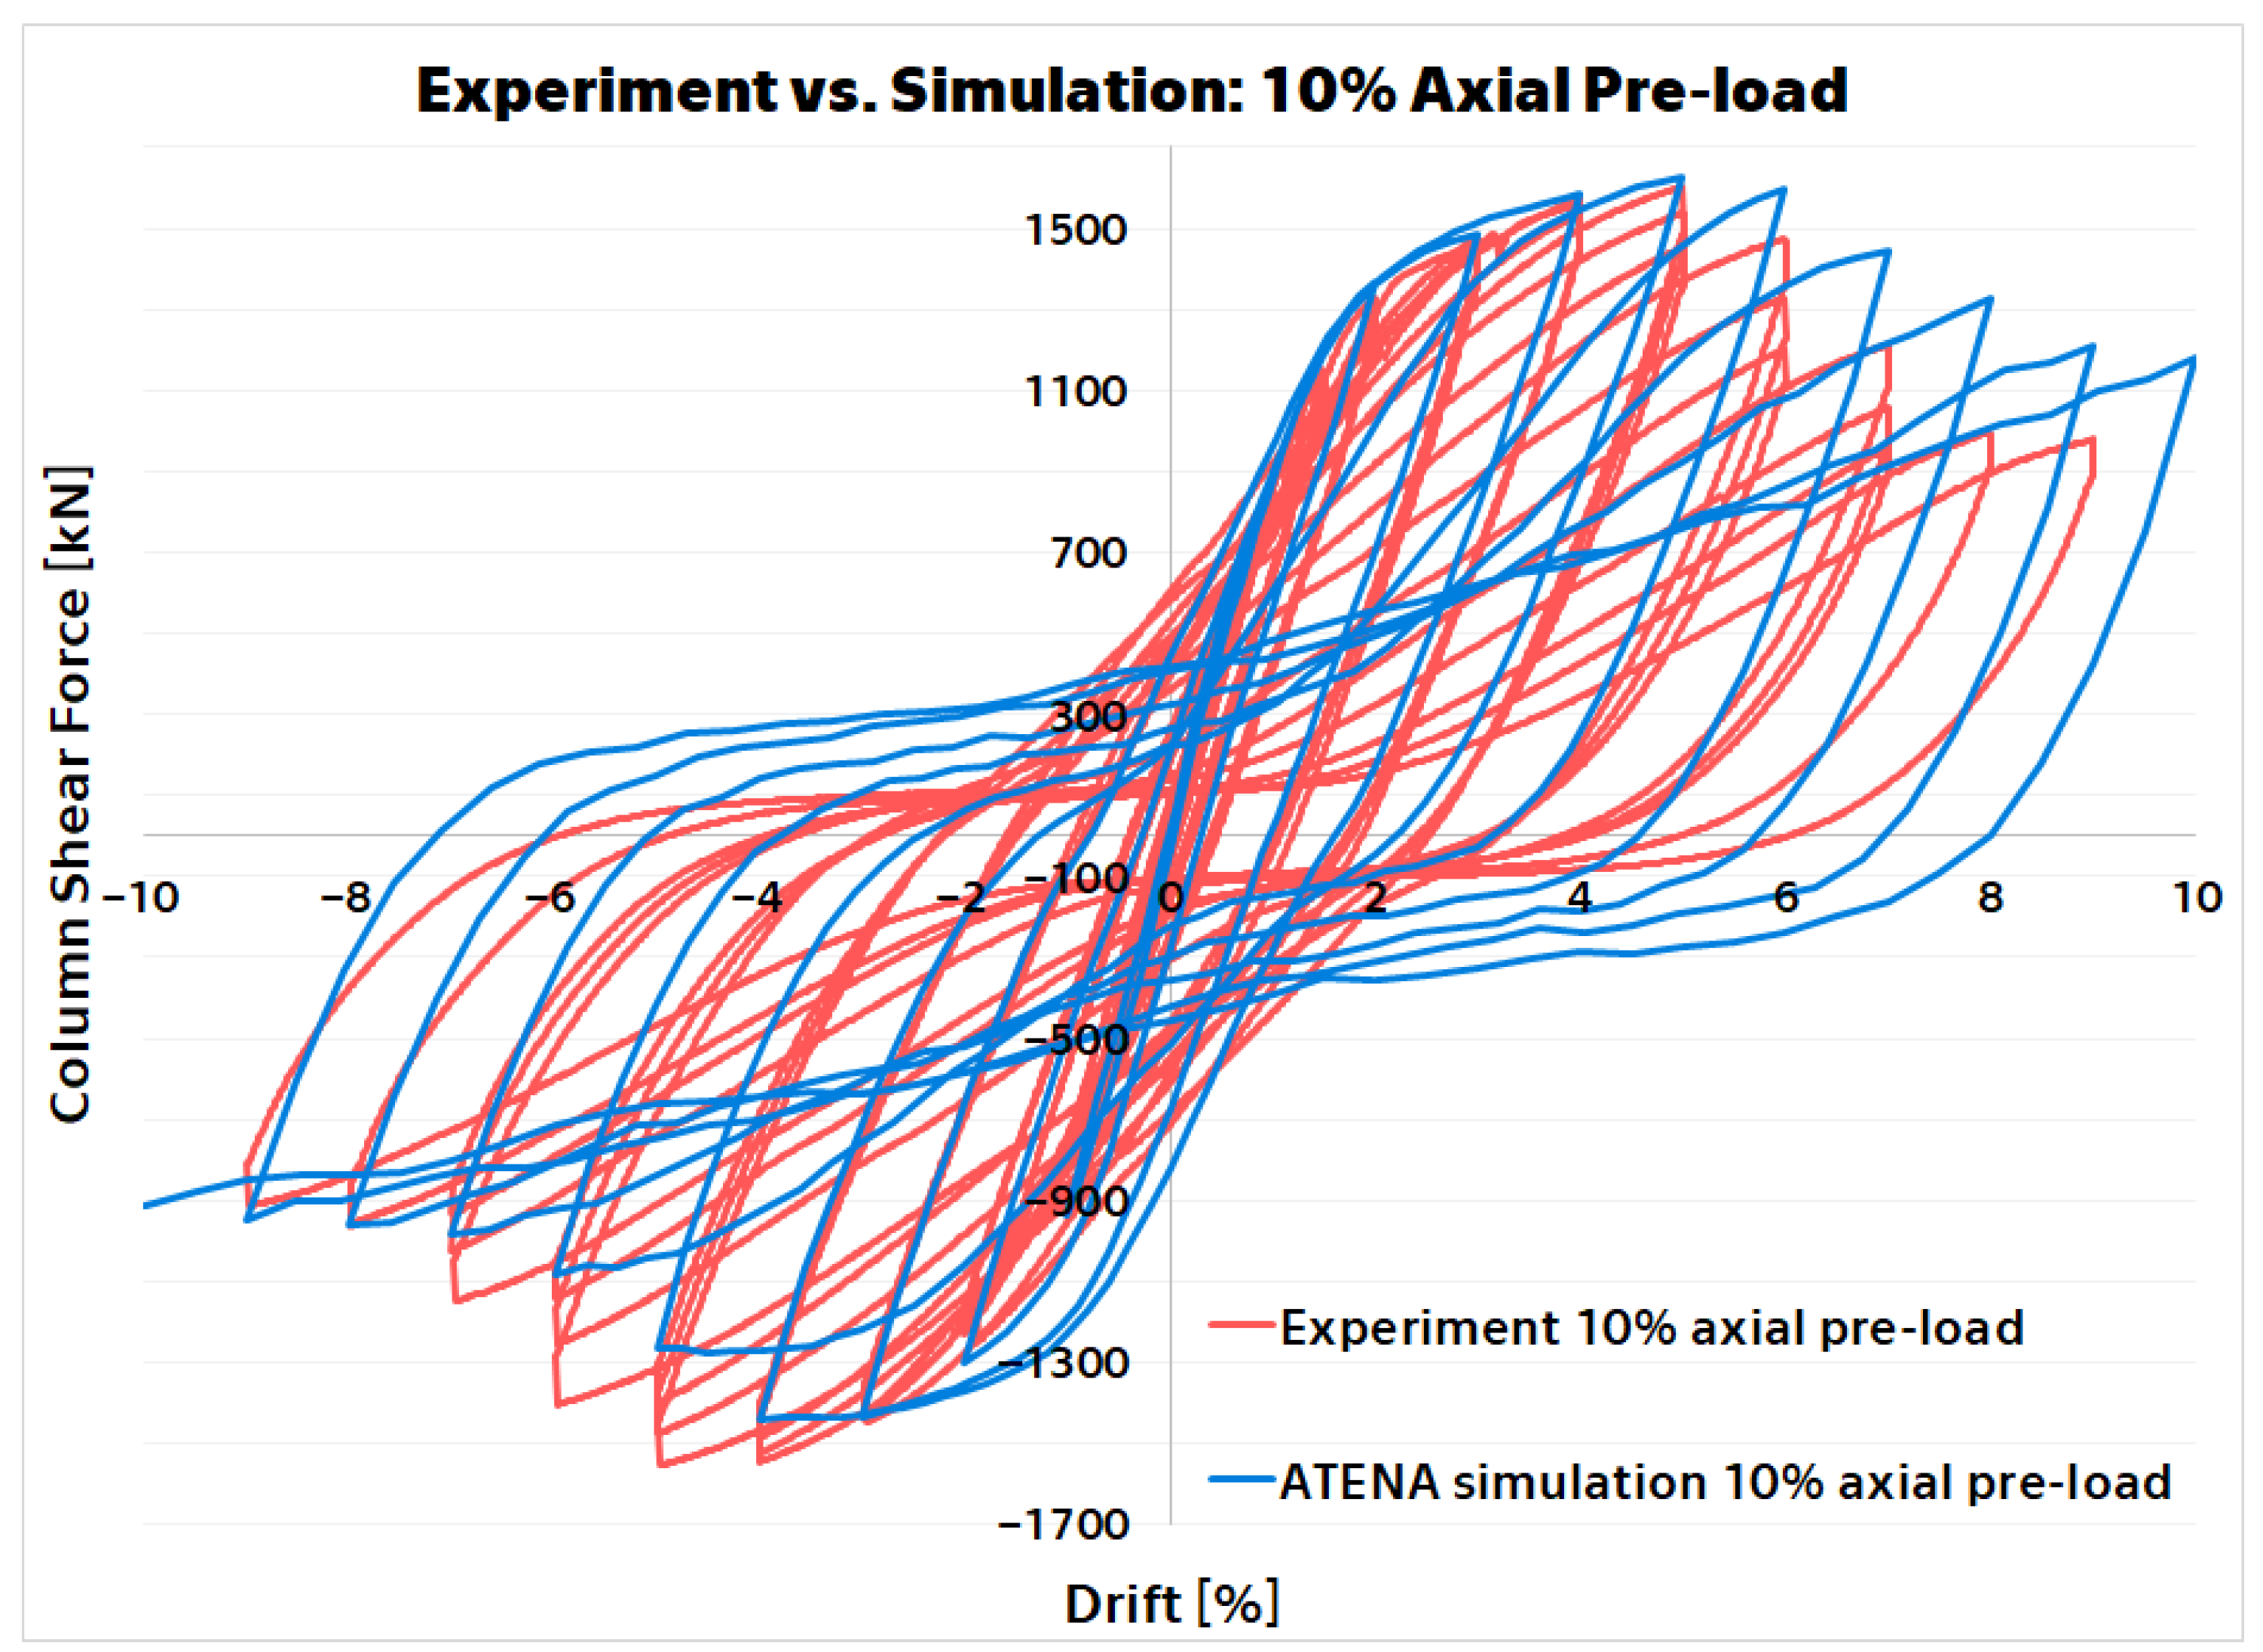
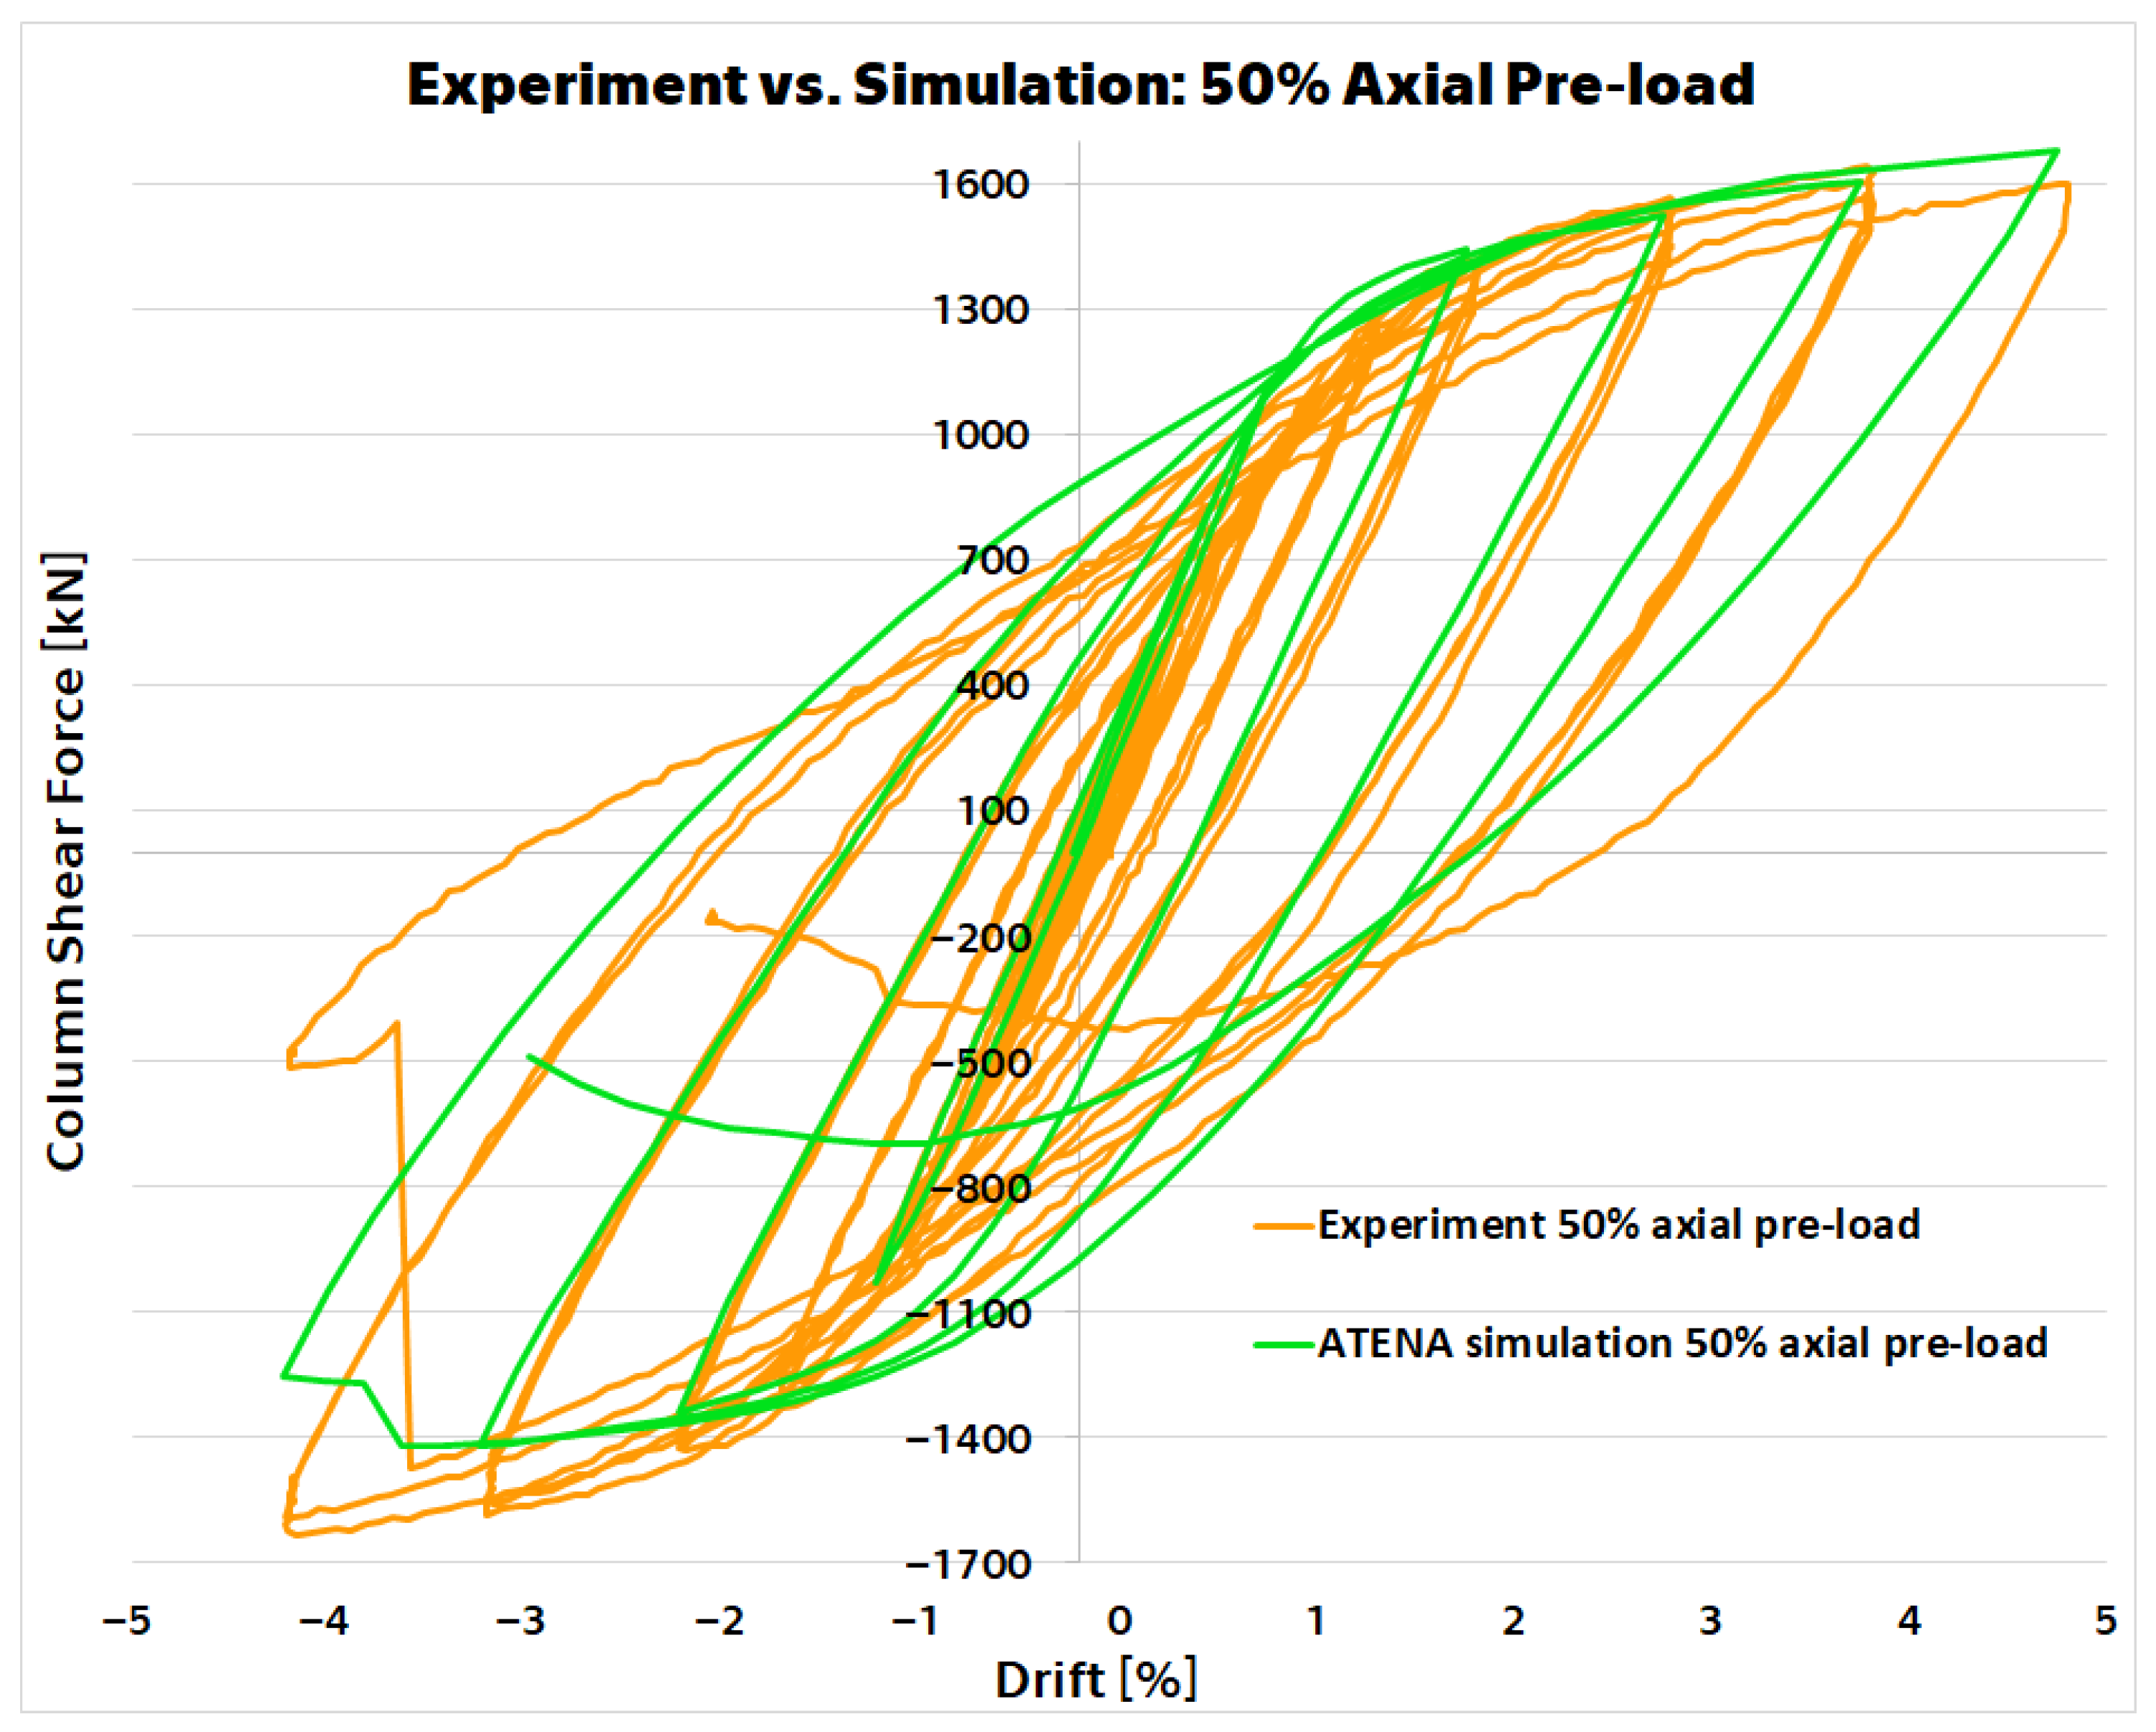
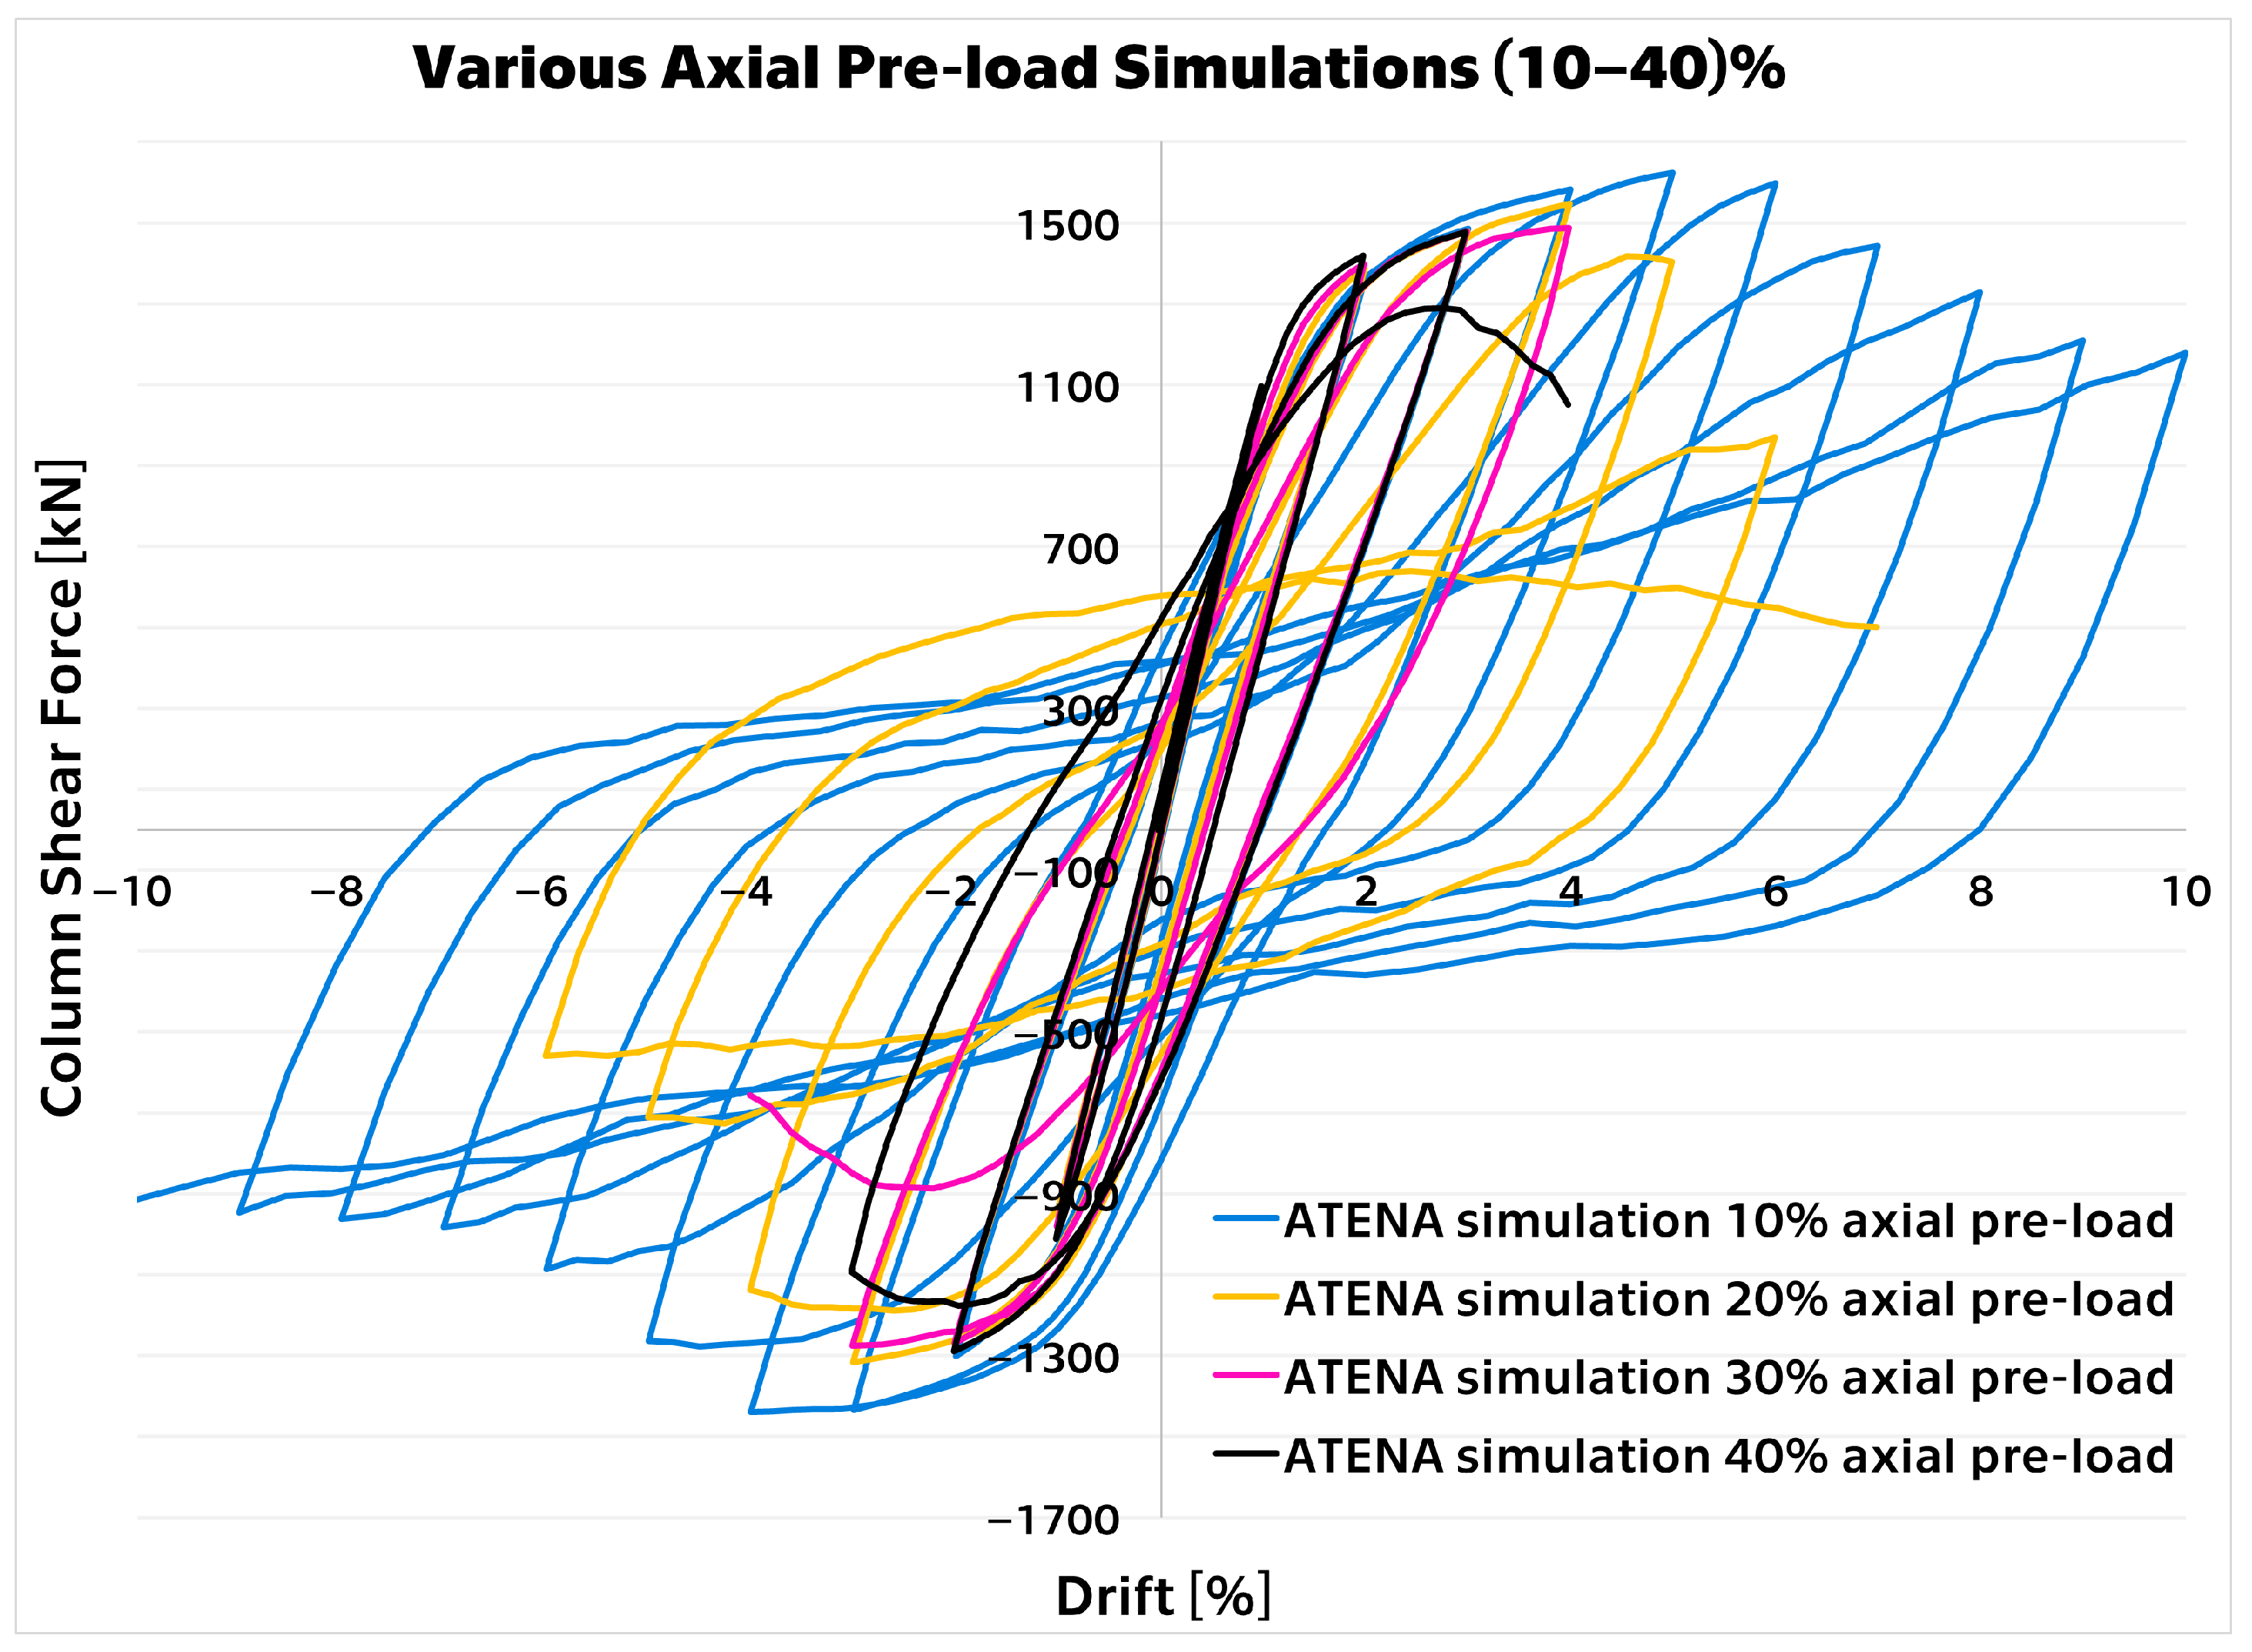
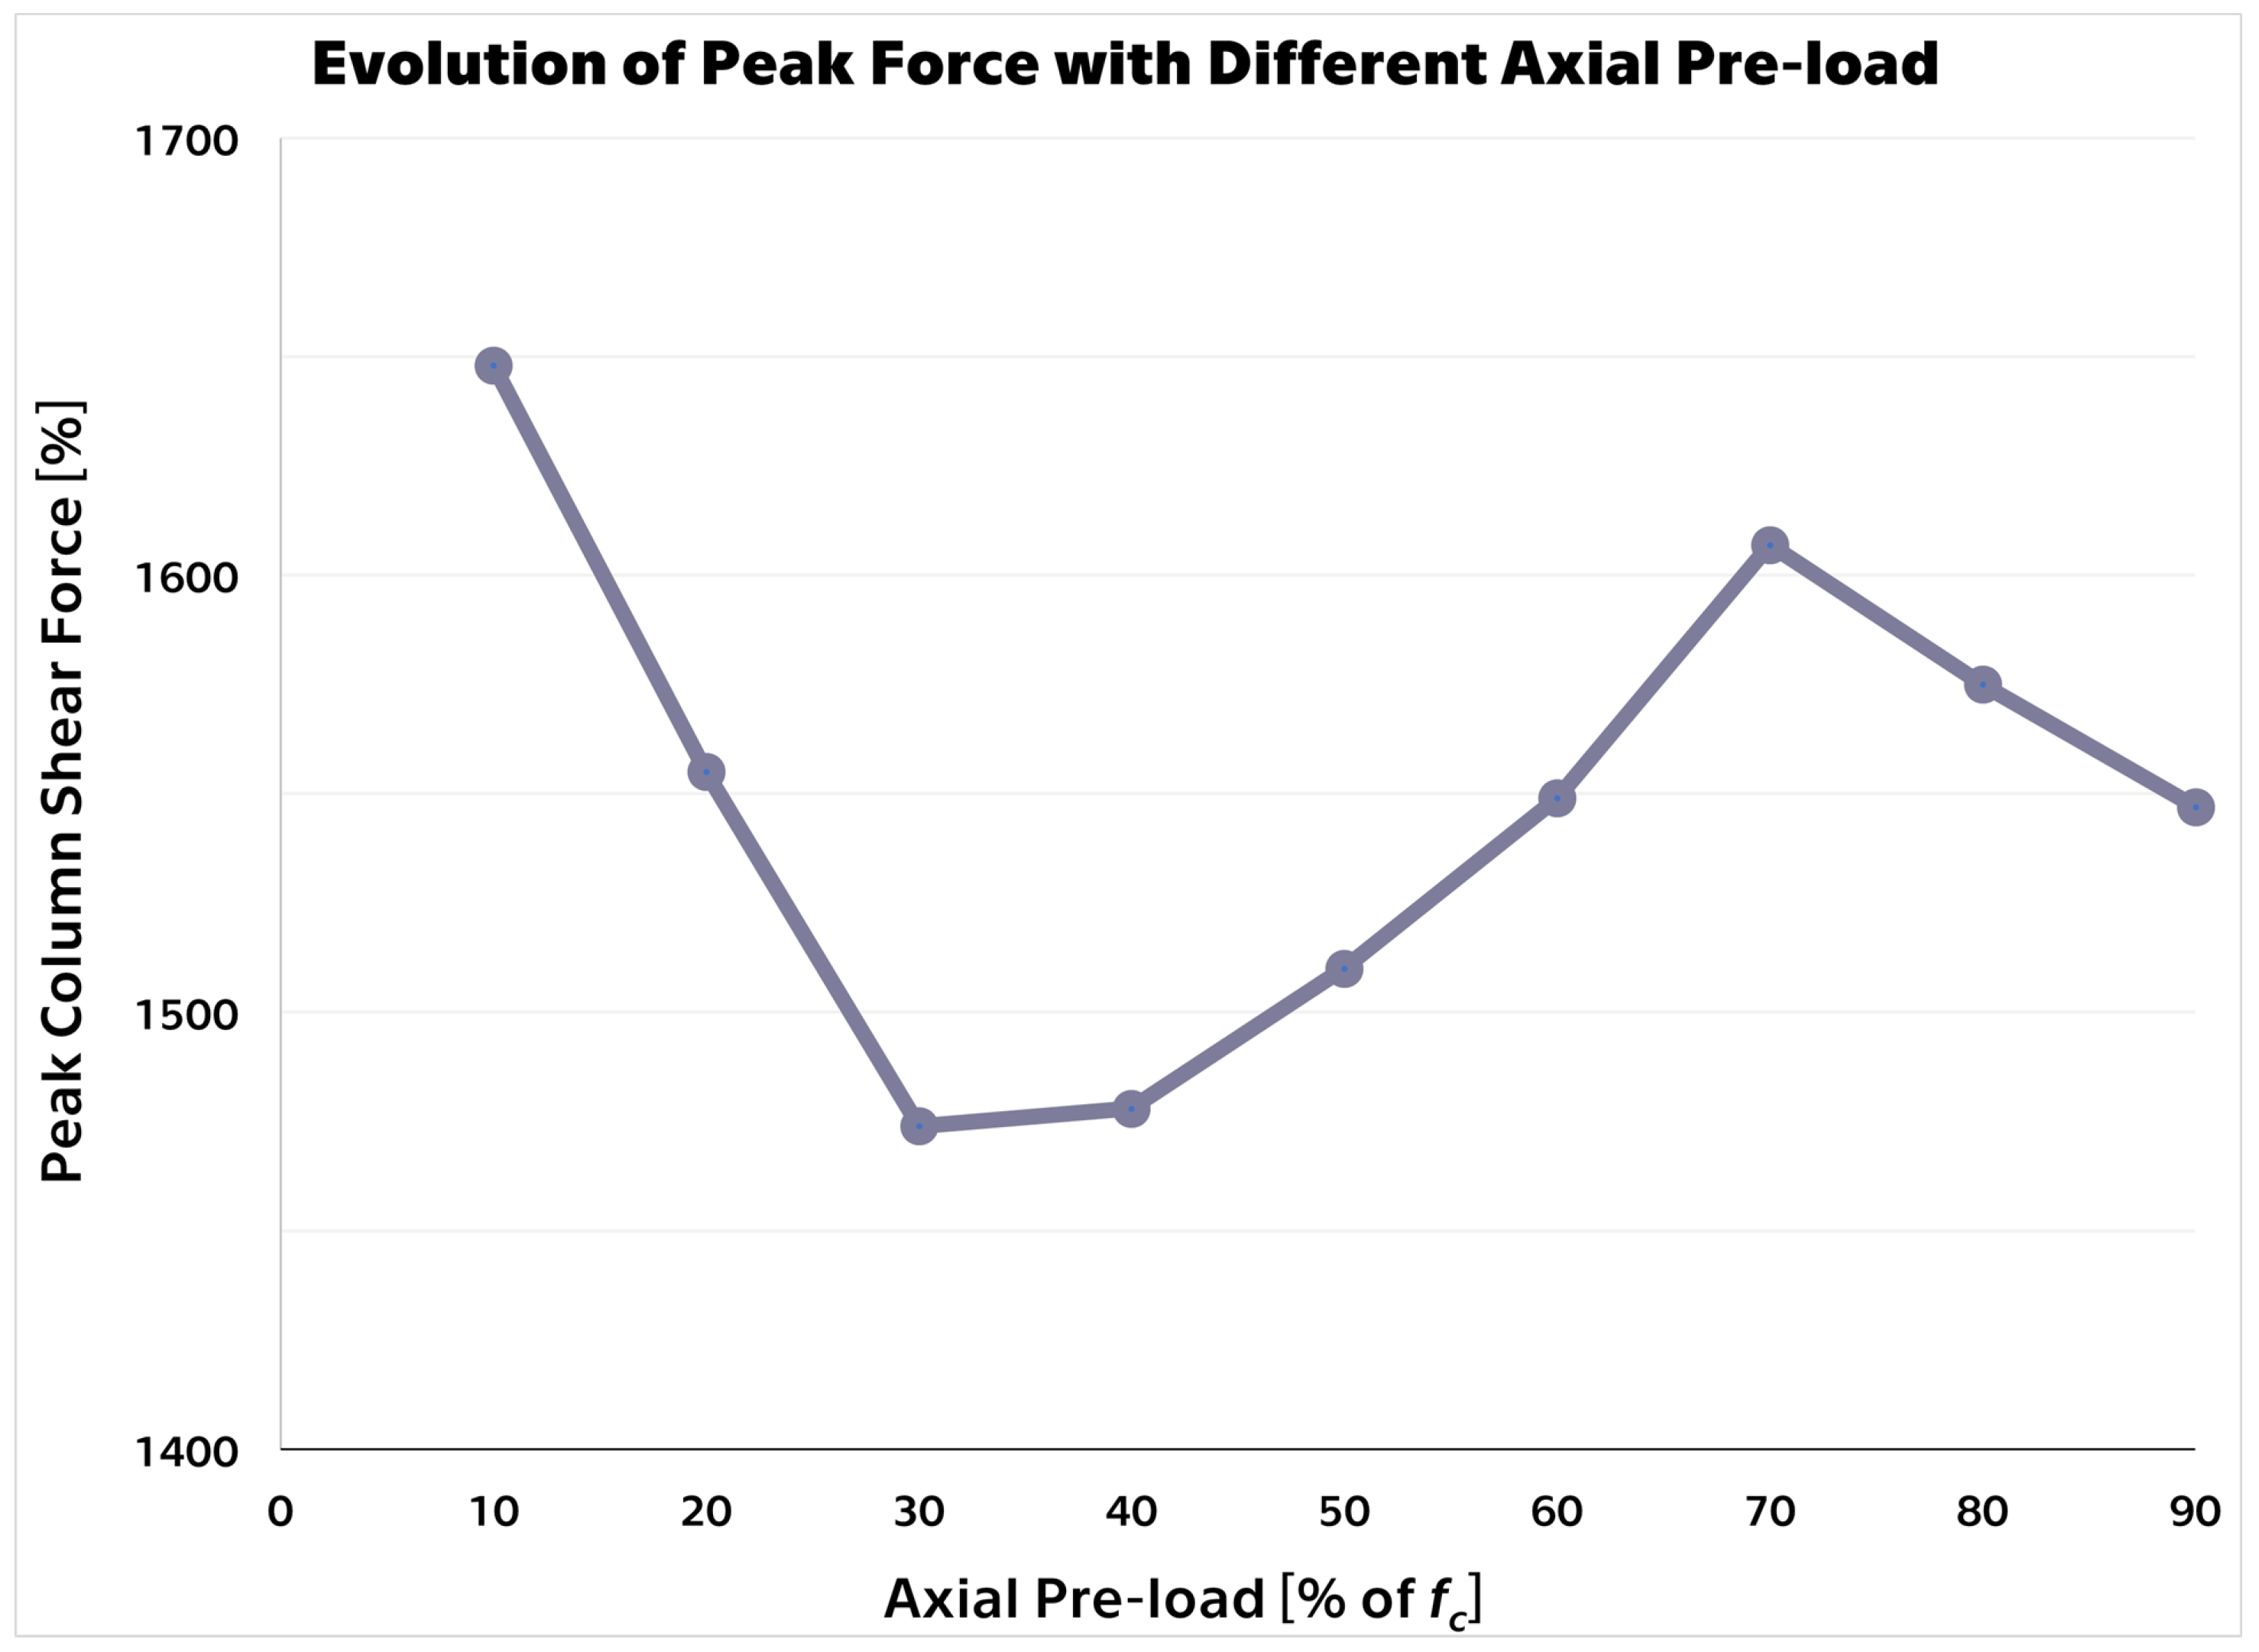
In this section, results obtained from the simulations are shown and described. The simulations mainly show that increasing the axial pre-load does not increase the peak achieved force, but influences the post-peak behavior as the system ductility decreases (Figure 14 and Figure 15). The accuracy of the FEA results vs. the performed experiment is evaluated later in the Section 4, as well as in Table 2 in this section.
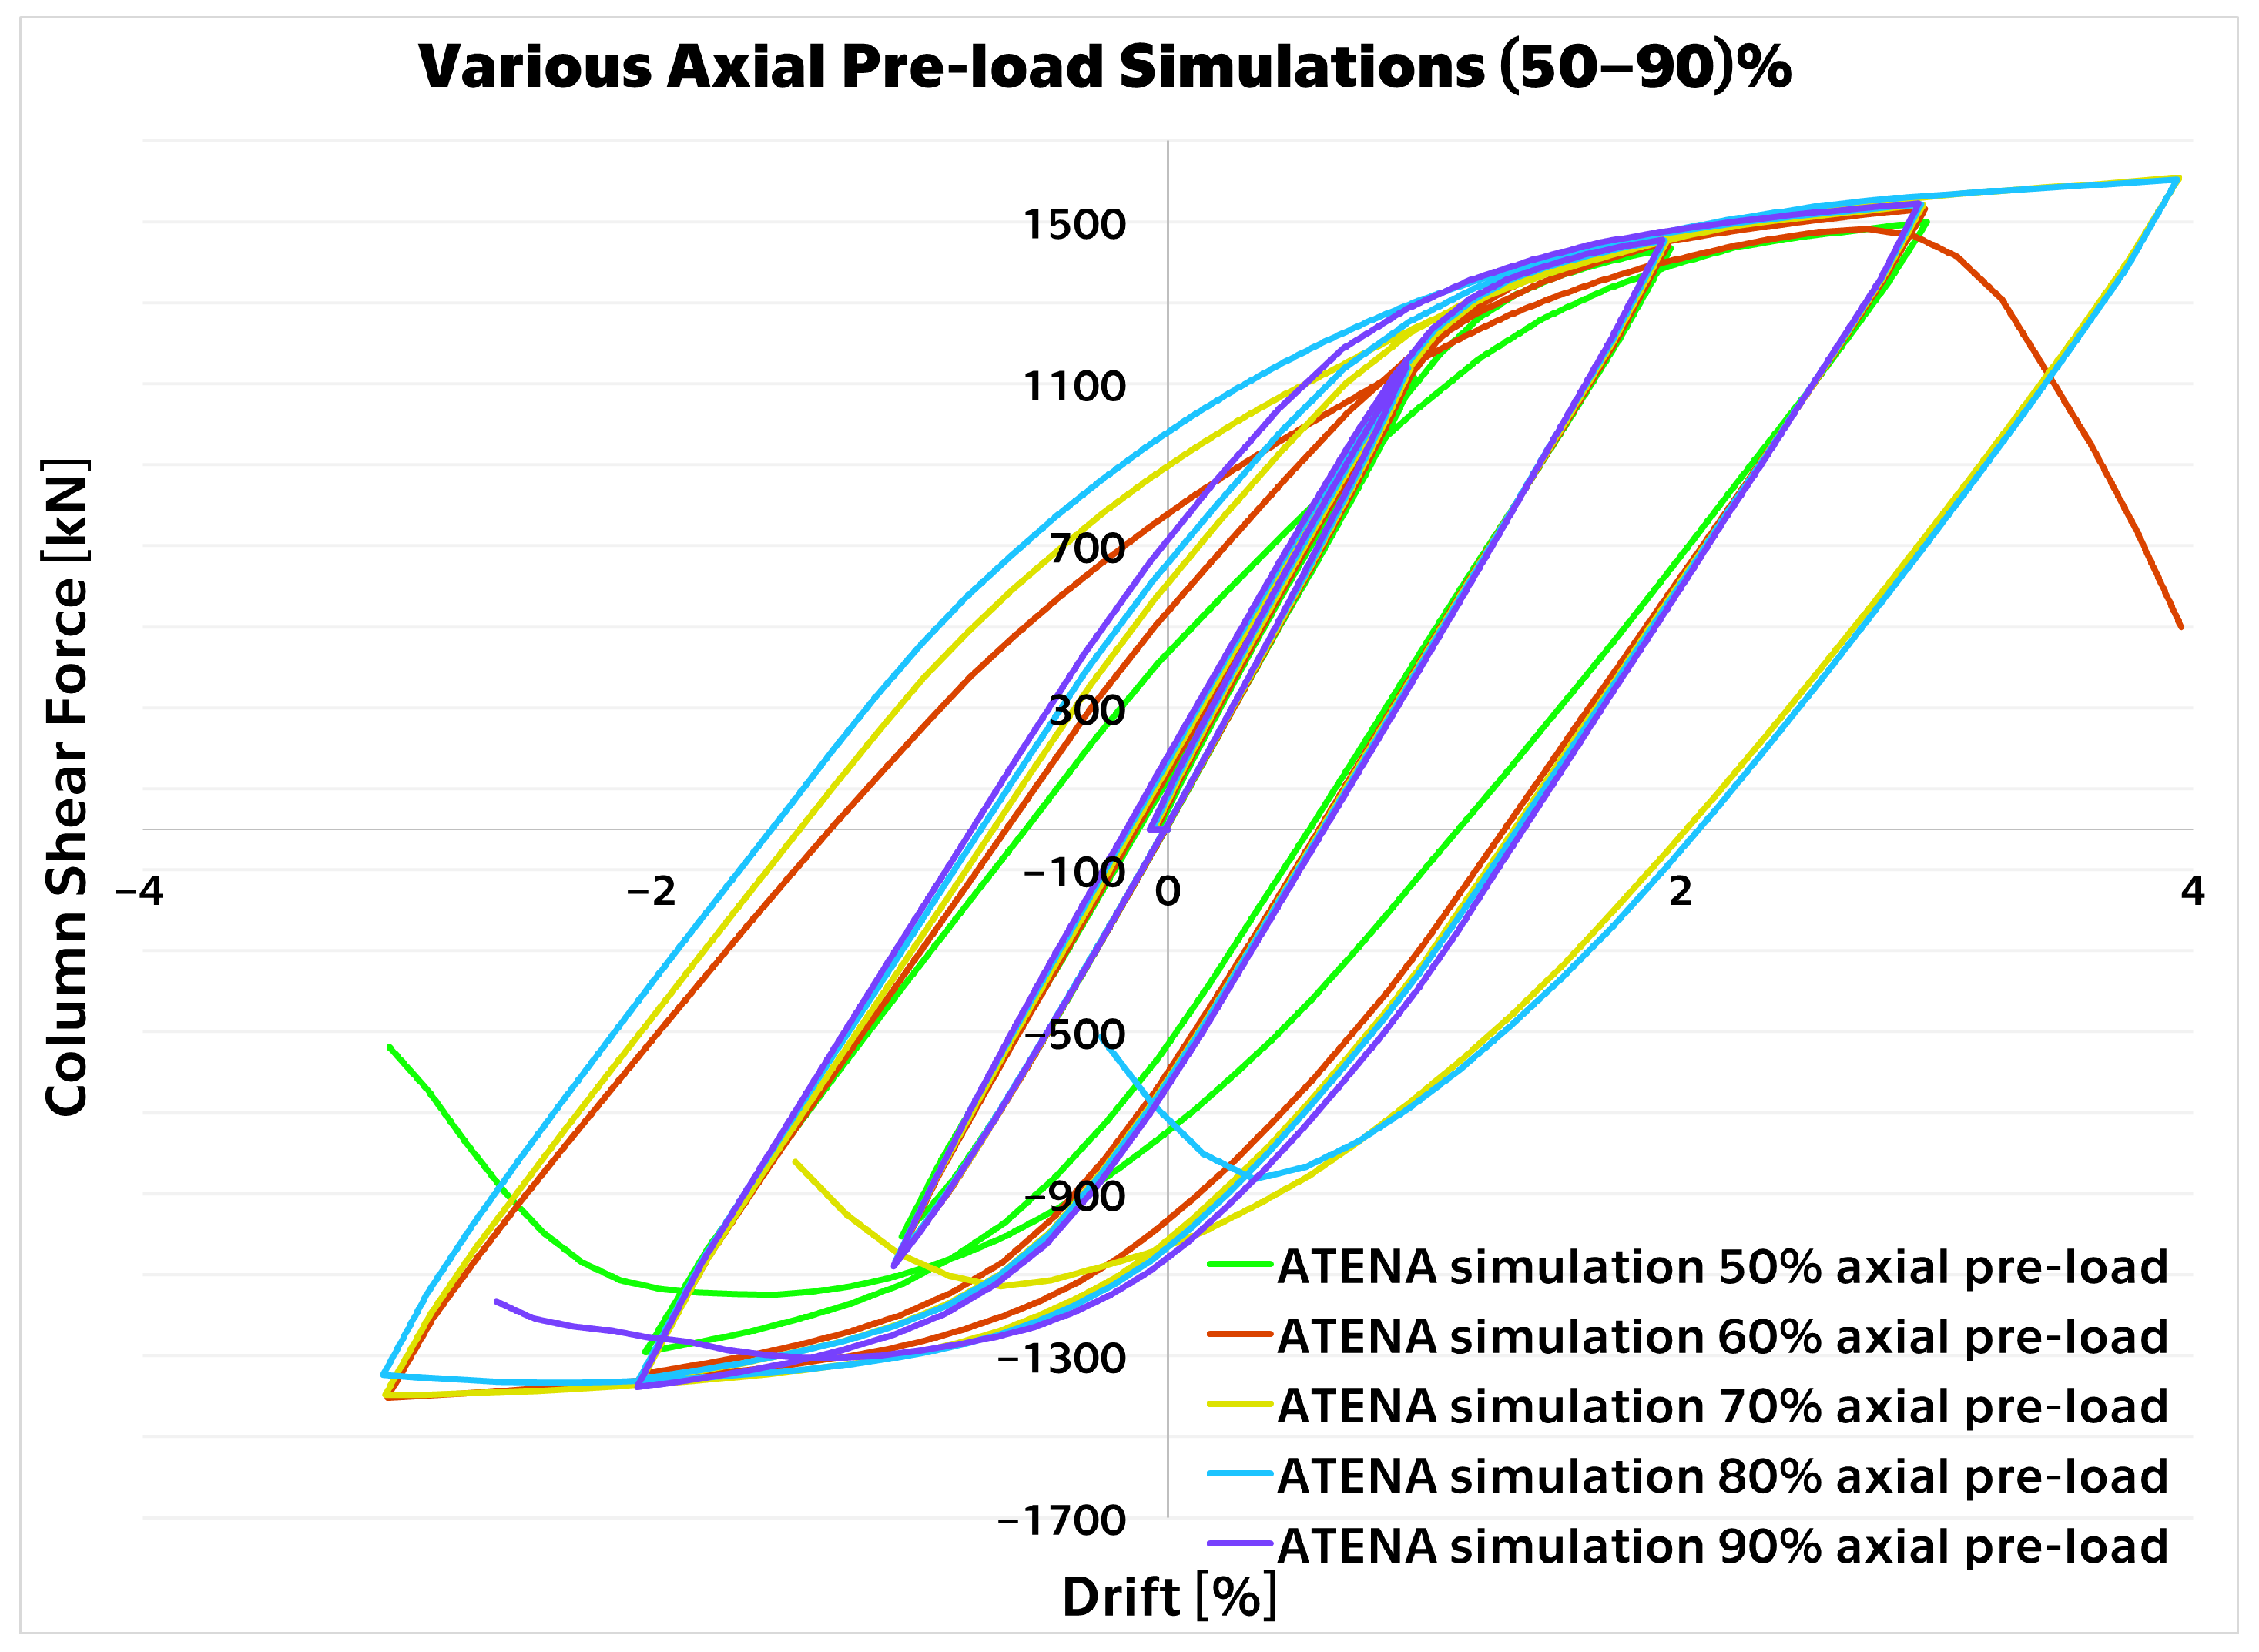
A comparison between various axial pre-load simulations ranging from 10 to 90% of the concrete compressive strength was made to extrapolate the results of the experiments and provide some insight into the effect of axial pre-load without the need to perform many experiments and save on time and labor. The results are shown in Figure 16 and Figure 17.

4. Discussion

The main goal of this research was to determine whether FEM is a viable approach towards conserving resources on the very costly and time-consuming process of preparing real-scale specimens. Datasets of two experiments (LP—lower, and HP—higher pre-load) were available, and on the basis of those experiments, a numerical model that shows good potential was developed.
The proposed numerical approach and the simulations show good agreement for both experimental values (LP—10 and HP—50% of concrete strength axial pre-load). In terms of achieved force, the model’s deviation from the experiment for the LP variant is within 2% at the peak and within 18% at the largest drift ratio. For the HP variant, the deviation is within 1.5% at the peak and within 5.5% at the largest drift ratio. The larger, post-peak discrepancies can be attributed to the damage the joint suffers during cyclic loading and repeated closing and opening of cracks, as those are harder to conceptualize in the model. Other deviations between the simulations and the experiment can be attributed to the fact that analyses were performed with a truncated version of the loading histogram. To determine the amount of error introduced by limiting the number of damaging cycles, additional comparative, detailed studies would be necessary. Since the geometry was modeled (with the exception of small steel openings) with accuracy, a detailing mismatch is unlikely. However, further efforts could be directed towards determining the optimal values of cycling-related parameters of both the steel and concrete material models and determining the magnitude of their influence on the pitching effect and matching of the hysteresis loop.
With the numerical model developed and validated, it is now possible to begin the process of optimizing the geometry and materials of the MRCC variants to better suit individual structural needs and individual budgets. However, it is important to note that this model is only validated on two datasets, and results could potentially deviate for other variants of geometry (offset through-beams, circular columns, etc.). In the future, the authors would like to test the precision of the numerical model on a wider variety of experimental setups to determine its viability for other applications.
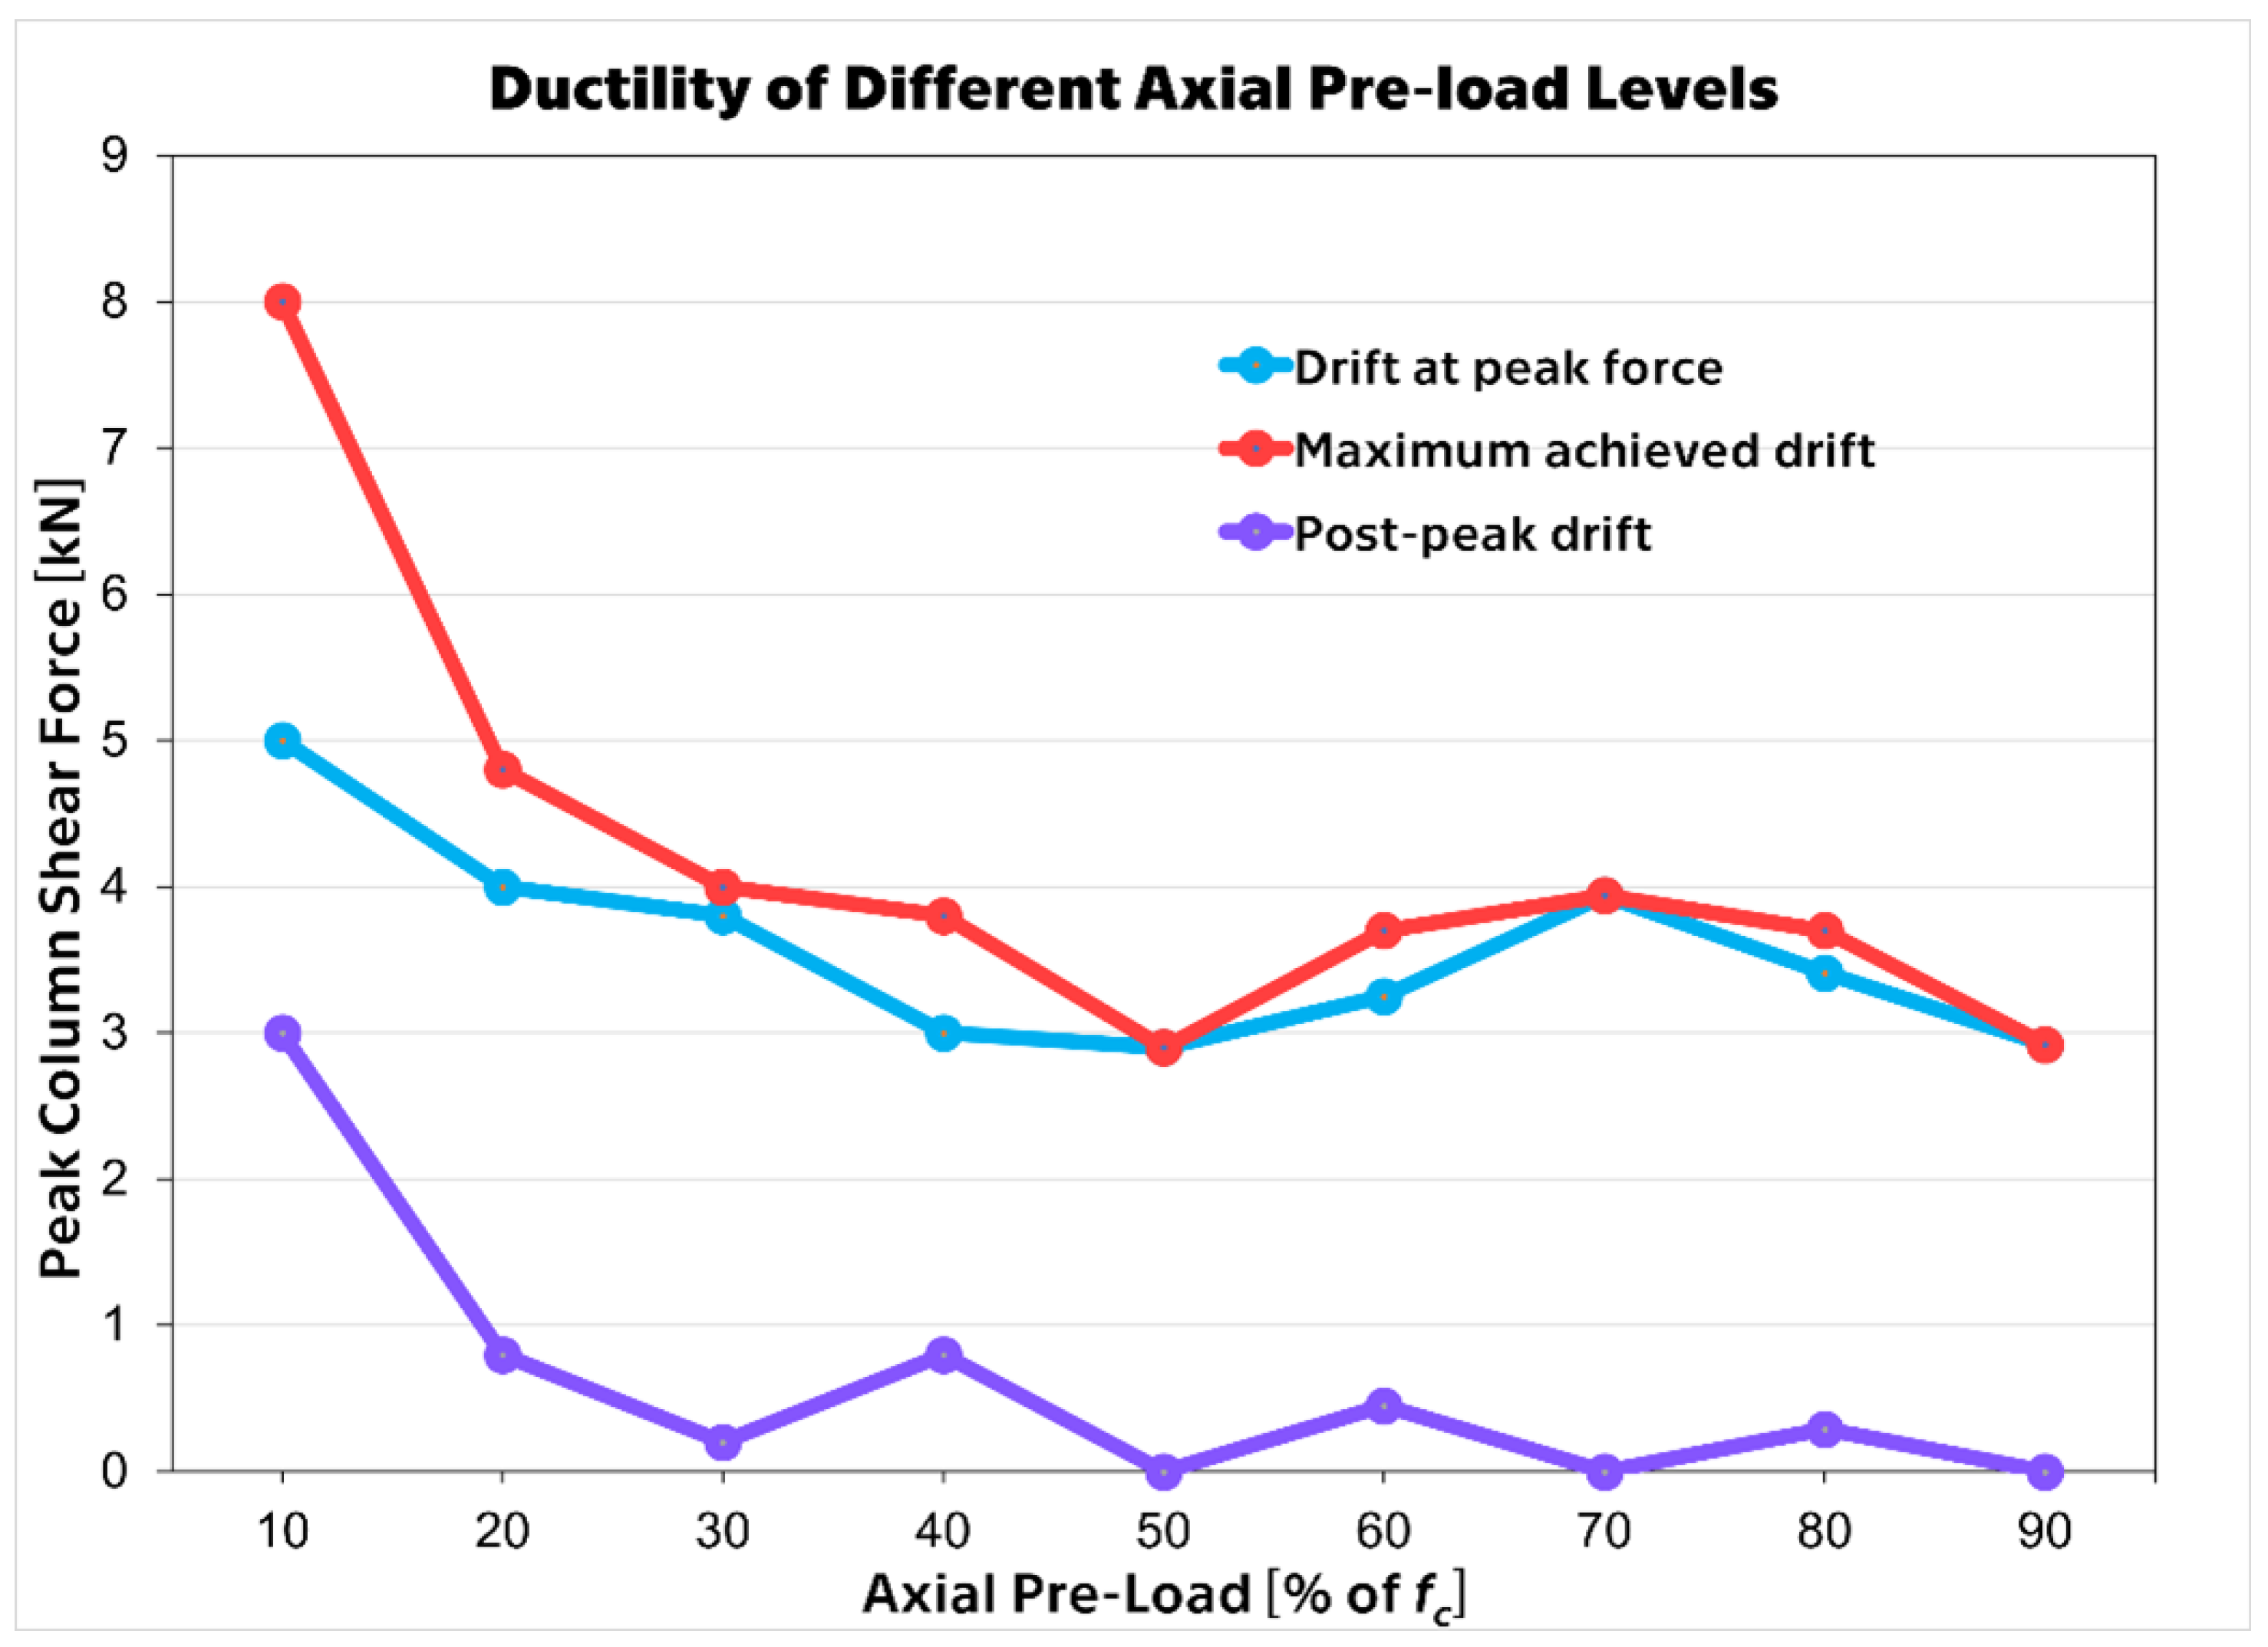
Intra- and extrapolating simulations were also performed that show that increasing the axial pre-load decreases ductility, as shown in Figure 18, with little to no effect on the achieved peak force. Figure 19 shows ductility as drift achieved within 70% of peak force. Furthermore, a simulation with a perfect reinforcement bond was performed and found that the deviation from an imperfect bond in the achieved force was negligible (<1%), suggesting the setup is not sensitive to the bond but rather to the bulk stiffness, in this case.
To facilitate the modeling of MRCCs, a plugin that allows users to generate a complete model in ATENA Preprocessor 2025 was developed. The model is generated based on user-defined parametric input, including the geometry of the column and the steel beam, as well as the position, shape, and diameter of both the spiral and longitudinal reinforcement. The generation process also includes the setup of the analysis, i.e., the definition of boundary conditions, monitors, and the final creation of the task. This plugin can be used to aid in rapid model preparation in case there is a larger dataset to be used. It can be used in the future on a broader set of geometries to either refine the model, confirm its validation on a larger number of experiments, or simply aid in model preparation.

Author Contributions

Conceptualization, L.Ř.; methodology, L.Ř.; software, M.Ž.; validation, L.Ř.; writing—original draft preparation, L.Ř. and M.Ž.; writing—review and editing, L.Ř. All authors have read and agreed to the published version of the manuscript.

Funding

The simulation examples presented in this study have been performed as a part of the research project TM04000013 “Virtual modeling of green concrete-structures with novel multi-spiral reinforcement and steel members”, co-financed from the state budget by the Technology Agency of the Czech Republic under the DELTA 2 Programme.

Data Availability Statement

The plugin for rapid generation of MRCC geometry is available at: https://www.cervenka.cz/projects/rd-projects/cestar-3 (accessed on 4 September 2025).

Conflicts of Interest

Author Michal Ženíšek was employed by the company Červenka Consulting. The remaining authors declare that the research was conducted in the absence of any commercial or financial relationships that could be construed as a potential conflict of interest.

Abbreviations

The following abbreviations are used in this manuscript:
FEAFinite Element Analysis
FEMFinite Element Method
HPHigh Pre-load
LPLow Pre-load
MCFTModified Compression Field Theory
MRCCsMultispiral-Reinforced Concrete Columns

Appendix A. Code Samples

Appendix A.1. XML Part
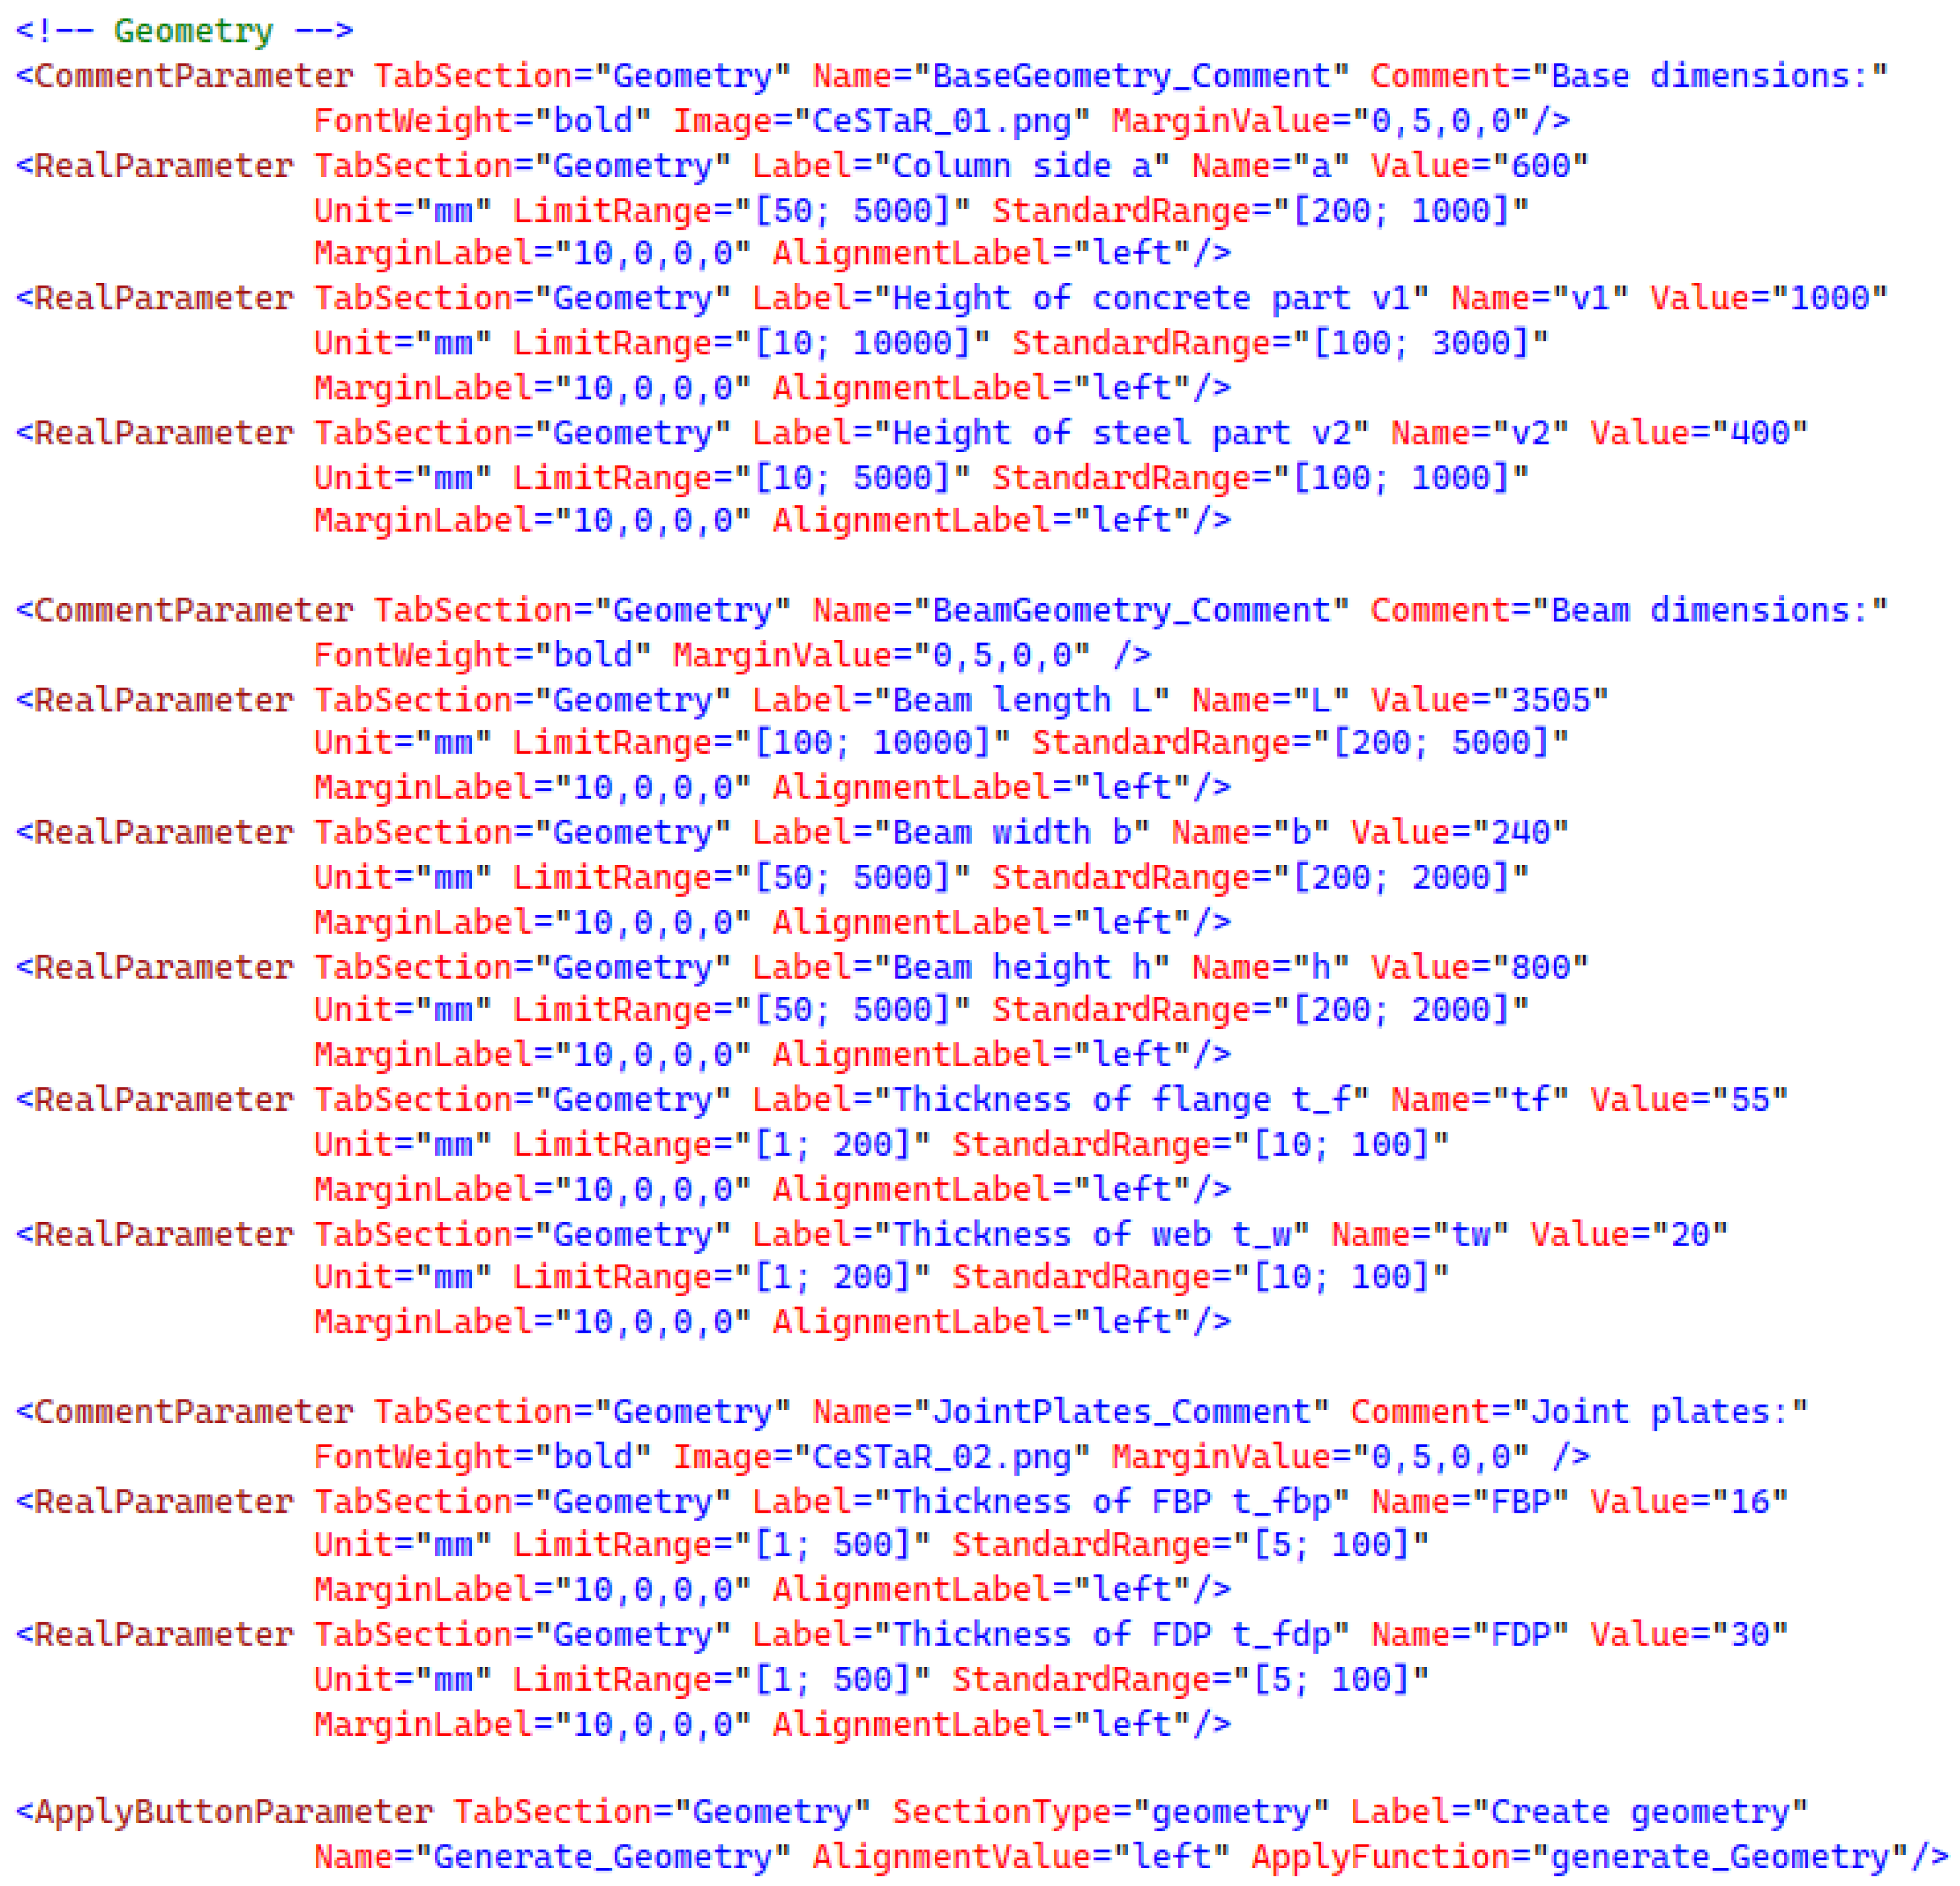
A sample part of the XML code for creating the graphical interface of the application can be seen in Figure A1. Each line of XML code defines a control element that is automatically created when the plugin is launched. For example, in this code, the CommentParameter type creates only a Label, which can be used as a title or as a comment for some part of the dialog. The RealParameter type creates a label with a textbox for entering a real number and a combobox for changing units. The ApplyButtonParameter type creates a button to run a method defined in Python. In addition to these types, further types are documented in the user manual of the ATENA Preprocessor 2025.
Figure A1. XML part for generating the “Geometry” tab—see Figure 12.
Buildings 15 03855 g0a1

Appendix A.2. Python Part

A sample part of the Python code for model generation—see Figure A2. At the beginning of the generate_Geometry method, global variables from the XML form are loaded and subsequently used during geometry generation. For example, the first line creation command uses the variables Beam width b and Web thickness t w . All of these scripting commands are automatically generated during the use of the preprocessor, so you can simply extract them from the scripting history, replace specific values with variables, and create an arbitrarily parameterized model. The result of this sample Python code is shown in Figure A3.
Figure A2. Python part for geometry generation based on data from XML part.
Buildings 15 03855 g0a2
Figure A3. Result after running the Python code sample.
Buildings 15 03855 g0a3

References

  1. Yin, S.Y.L.; Wang, J.C.; Wang, P.H. Development of multi-spiral confinements in rectangular columns for construction automation. J. Chin. Inst. Eng. 2012, 35, 309–320. [Google Scholar] [CrossRef]
  2. Kim, H.G.; Jeong, C.Y.; Kim, D.H.; Kim, K.H. Confinement effect of reinforced concrete columns with rectangular and octagon-shaped spirals. Sustainability 2020, 12, 7981. [Google Scholar] [CrossRef]
  3. Zhang, Y.; Xiong, X.; He, L.; Zhang, X.; He, M. Behavior of large-scale concrete columns reinforced with high-strength and high-toughness steel bars under axial and eccentric compression. J. Build. Eng. 2023, 79, 107766. [Google Scholar] [CrossRef]
  4. Havlásek, P.; Jirásek, M.; Bittnar, Z. Modeling of precast columns with innovative multi-spiral reinforcement. In Proceedings of the fib Symposium, Krakow, Poland, 27–29 May 2019; pp. 2301–2307. [Google Scholar]
  5. Algamati, M.; Al-Sakkaf, A.; Bagchi, A. Energy Dissipation Technologies in Seismic Retrofitting: A Review. CivilEng 2025, 6, 23. [Google Scholar] [CrossRef]
  6. Hao, M.; Zheng, W.; Chang, W. Compression behavior of reinforced concrete columns jacketed with multi-spiral transverse reinforcement. Struct. Concr. 2022, 23, 2942–2967. [Google Scholar] [CrossRef]
  7. Chen, Y.; Feng, J.; Yin, S. Compressive behavior of reinforced concrete columns confined by multi-spiral hoops. Comput. Concr. 2012, 9, 341–355. [Google Scholar] [CrossRef]
  8. Ou, Y.C.; Ngo, S.H.; Yin, S.Y.; Wang, J.C.; Wang, P.H. Shear behavior of oblong bridge columns with innovative seven-spiral transverse reinforcement. ACI Struct. J. 2014, 111, 1339. [Google Scholar] [CrossRef]
  9. Wang, P.H.; Chang, K.C.; Yin, S.Y.L.; Wang, J.C.; Sung, Y.C.; Hung, H.H. Seismic performance of large-scale rectangular reinforced concrete bridge columns with multi-spiral reinforcement. Earthq. Spectra 2023, 39, 1837–1858. [Google Scholar] [CrossRef]
  10. Liu, B.; Fan, W.; Guo, W.; Chen, B.; Liu, R. Experimental investigation and improved FE modeling of axially-loaded circular RC columns under lateral impact loading. Eng. Struct. 2017, 152, 619–642. [Google Scholar] [CrossRef]
  11. Fawaz, G.; Murcia-Delso, J. Three-dimensional finite element modeling of RC columns subjected to cyclic lateral loading. Eng. Struct. 2021, 239, 112291. [Google Scholar] [CrossRef]
  12. Cervenka, V.; Cervenka, J.; Pukl, R. ATENA—A tool for engineering analysis of fracture in concrete. Sadhana 2002, 27, 485–492. [Google Scholar] [CrossRef]
  13. Joju, J. Development of Composite Beam-Column Joints for New RCS Systems. Ph.D Thesis, National Taiwan University, Taiwan, China, 2024. [Google Scholar]
  14. CIMNE. GiD: The Personal Pre and Post Processor; Version 17.0.5; International Center for Numerical Methods in Engineering (CIMNE): Barcelona, Spain, 2025; Available online: https://www.gidhome.com/ (accessed on 25 September 2025).
  15. Hasan, A.M.; Torky, A.A.; Rashed, Y.F. Geometrically accurate structural analysis models in BIM-centered software. Autom. Constr. 2019, 104, 299–321. [Google Scholar] [CrossRef]
  16. Cervenka, V.; Jendele, L.; Cervenka, J. ATENA Program Documentation Part 1 Theory; Červenka Consulting s.r.o.: Prague, Czech Republic, 2007; Volume 231. [Google Scholar]
  17. Červenka, J.; Papanikolaou, V.K. Three dimensional combined fracture–plastic material model for concrete. Int. J. Plast. 2008, 24, 2192–2220. [Google Scholar] [CrossRef]
  18. Carol, I.; Rizzi, E.; Willam, K. A unified theory of elastic degradation and damage based on a loading surface. Int. J. Solids Struct. 1994, 31, 2835–2865. [Google Scholar] [CrossRef]
  19. Simo, J.; Kennedy, J.; Govindjee, S. Non-smooth multisurface plasticity and viscoplasticity. Loading/unloading conditions and numerical algorithms. Int. J. Numer. Methods Eng. 1988, 26, 2161–2185. [Google Scholar] [CrossRef]
  20. Červenka, J.; Kishen, J.C.; Saouma, V.E. Mixed mode fracture of cementitious bimaterial interfaces:; Part II: Numerical simulation. Eng. Fract. Mech. 1998, 60, 95–107. [Google Scholar] [CrossRef]
  21. Hordijk, D.A.; Reinhardt, H.W. Growth of discrete cracks in concrete under fatigue loading. In Toughening Mechanisms in Quasi-Brittle Materials; Springer: Berlin/Heidelberg, Germany, 1991; pp. 541–554. [Google Scholar]
  22. Červenka, V.; Jendele, L.; Červenka, J. ATENA Program Documentation–Part 1; Červenka Consulting s.r.o.: Prague, Czech Republic, 2021. [Google Scholar]
  23. Menetrey, P.; Willam, K.J. Triaxial failure criterion for concrete and its generalization. Struct. J. 1995, 92, 311–318. [Google Scholar]
  24. Bažant, Z.P.; Oh, B.H. Crack band theory for fracture of concrete. Matériaux Constr. 1983, 16, 155–177. [Google Scholar] [CrossRef]
  25. Cervenka, V. Mesh sensitivity effects in smeared finite element analysis of concrete fracture. FRAMCOS-2 1995, 2, 1387–1396. [Google Scholar]
  26. Solanki, H.T. Simplified Modified Compression Field Theory for Calculating Shear Strength of Reinforced Concrete Elements. Paper by Evan C. Bentz, Frank J. Vecchio, and Michael P. Collins/AUTHORS’CLOSURE. ACI Struct. J. 2007, 104, 378. [Google Scholar]
  27. Bai, Y.L.; Bai, S.C.; Mei, S.J.; Jia, J.F. Experimental and numerical study of PEN FRP-strengthened circular RC columns under lateral cyclic loading with high axial compression ratio. Eng. Struct. 2023, 294, 116711. [Google Scholar] [CrossRef]
  28. Menegotto, M. Method of analysis for cyclically loaded RC plane frames including changes in geometry and non-elastic behavior of elements under combined normal force and bending. In Proceedings of the IABSE Symposium on Resistance and Ultimate Deformability of Structures Acted on by Well Defined Repeated Loads, Lisbon, Portugal, 13–14 September 1973. [Google Scholar]
Figure 1. The workflow of the model validation process.
Buildings 15 03855 g001
Figure 2. The modeled geometry of the MRCC. There are visible multispiral and longitudinal reinforcement rebars (black), the steel through-beam (green), stiff end blocks (red), and face bearing plate and flange doubler plate (lighter red). There are also concrete blocks in the middle portion of the model and an interface material, both omitted for clarity.
Buildings 15 03855 g002
Figure 3. The modeled cross-section of the column. Dimensions can be seen in [13]. (Left)—the experimental layout, (right)—the FE mesh. Red—longitudinal reinforcement, green—small corner spirals, blue—large central spiral. Our approach is to conserve solution times by modeling the Non-Uniform Rational B-Splines (NURBS) with rough, linear elements that are divided by the concrete FE mesh. The choice of 6 elements per side comes from experience with ATENA modeling using hexahedral meshes with good aspect ratio, as the difference between using 5 and 6 elements is usually less than 1% in terms of achieved force.
Buildings 15 03855 g003
Figure 4. The detail of the material interfaces at the joint. The steel through-beam (green) and the interface materials connecting the steel (blue) and the four inner concrete blocks (omitted from display for clarity). The division of the green element presents the aforementioned interface for the possibility of capturing a flange rupture.
Buildings 15 03855 g004
Figure 5. The original experiment histogram used in the work of Joju [13] (red) and the truncated version used for the ATENA simulations (blue).
Buildings 15 03855 g005
Figure 6. Tensile softening [21,22].
Buildings 15 03855 g006
Figure 7. Plasticity criterion for concrete [22,23].
Buildings 15 03855 g007
Figure 8. Adjustment of crack band size based on crack orientation in ATENA [22].
Buildings 15 03855 g008
Figure 9. The concrete hardening law [22].
Buildings 15 03855 g009
Figure 10. The concrete softening law [22].
Buildings 15 03855 g010
Figure 11. The GiD geometry render of the numerical model used in ATENA for the simulations. Concrete around the spirals is not displayed for improved visibility.
Buildings 15 03855 g011
Figure 12. Example of a plugin geometry creation tab.
Buildings 15 03855 g012
Figure 13. Example of four generated MRCCs in ATENA Preprocessor 2025. Transparent display with visible reinforcement elements.
Buildings 15 03855 g013
Figure 14. The force-drift diagram of the LP experiment in red and the ATENA simulation in blue, showing a moderately good agreement between the experiment and simulation (2 and 18% error at the peak and largest drift, respectively). The ATENA simulation predicts a slightly stiffer behavior in the post-peak region, but the peak force is a very good match and the softening trend follows.
Buildings 15 03855 g014
Figure 15. The force-drift diagram of the HP experiment in orange and the ATENA simulation in green (the deviation is 1.5 and 5.5% error at the peak and largest drift, respectively). The experiment was terminated by rupturing of the beam’s flange ([13]) at only ca. half the drift of the LP experiment. The simulation follows this trend by also predicting failure sooner.
Buildings 15 03855 g015
Figure 16. The force-drift diagrams of different axial pre-load values up to 40% of the concrete compressive strength. The peak force does not change dramatically (in agreement with experiment between 10 and 50%), but the ductility decreases substantially with increased axial pre-load.
Buildings 15 03855 g016
Figure 17. The force-drift diagrams of different axial pre-load values from 50% to 90% of the concrete compressive strength. Above 50%, there are no experimental data, and ATENA simulations show less ductile behavior similar to that of the 50% experiment.
Buildings 15 03855 g017
Figure 18. Graphs of different drift levels and the resulting post-peak drift symbolizing a ductility reserve in purple. Ductility decreases with increasing axial pre-load in simulations as well as in experiments. This is a welcome match, as it will allow for a degree of extrapolation and optimization of geometries in the future without the need for a large-scale test for every combination of geometry and axial pre-load.
Buildings 15 03855 g018
Figure 19. The evolution of ductility described as maximum drift achieved within at least 70% of the peak load plotted against the different axial pre-load simulations.
Buildings 15 03855 g019
Table 1. Used concrete material properties.
Concrete Material PropertyUnitsFEA Value
Young’s ModulusGPa42
Tensile StrengthMPa3.4
Compressive StrengthMPa−83.8
Fracture Energy 1MNm−18.5 × 10 5
Plastic Strain-−0.0015
Onset of CrushingMPa−7.14
Critical compressive
displacement w d
m−0.004
Fc crack reduction-1
1 Material parameters which were not identified by the experiment were generated by ATENA according to the EuroCode 2-specified concrete of the same compressive strength.
Table 2. Results obtained in the experiment compared to FEM simulations.
Physical QuantityLP ExperimentLP FEADeviation [–]HP ExperimentHP FEADeviation [–]
Peak Force [kN]160116240.014165616180.023
Max. Drift Force [kN]97912090.235160016760.048
Max. Drift [%]9100.1550
Disclaimer/Publisher’s Note: The statements, opinions and data contained in all publications are solely those of the individual author(s) and contributor(s) and not of MDPI and/or the editor(s). MDPI and/or the editor(s) disclaim responsibility for any injury to people or property resulting from any ideas, methods, instructions or products referred to in the content.