Article

Performance Assessment of a Landfill Expansion Stabilized with Reinforced Fill Structure Using Numerical Analysis

by
Ahsan Rehman Khan
* and
Gemmina Di Emidio
UGent Geotechnical Institute, Department of Civil Engineering, Ghent University, 9052 Gent, Belgium
*
Author to whom correspondence should be addressed.
Buildings 2025, 15(21), 3853; https://doi.org/10.3390/buildings15213853
Submission received: 31 August 2025 / Revised: 20 October 2025 / Accepted: 22 October 2025 / Published: 24 October 2025

Abstract

This study investigates the feasibility of landfill expansion using the limit equilibrium and finite element methods. A 15.5 m high reinforced fill structure (RFS) was analyzed to assess how fill type, consolidation rate, geometric configuration, waste strength, compaction and the inclusion of banquettes affect horizontal displacement, differential settlement, reinforcement strain and facing behavior. The baseline configuration demonstrated acceptable settlement, reinforcement strain, and gabion performance but exceeded allowable horizontal displacement limits. The scenarios including increasing consolidation rate and substitution with sand fill further aggravated displacements, whereas banquettes significantly reduced lateral movement and settlement, demonstrating their effectiveness in stabilizing slopes. Enhancing the industrial waste properties decreased displacements substantially improving overall stability. Geometric modifications, such as widening the reinforced zone, enhanced displacement control, while higher compaction achieved the best global performance, albeit with increased gabion compressibility. Extending geogrid length provided only marginal improvements beyond a certain threshold. Overall, banquettes, enhanced waste properties, and improved compaction were identified as the most effective strategies for stable efficient landfill expansion, emphasizing the importance of displacement control and reinforcement–facing interaction.

1. Introduction

Slope stability is a major challenge in a landfill design due to the heterogeneous nature of the waste and the presence of leachate, which often necessitate adopting low slope angles that, in turn, reduce overall storage capacity [1]. To overcome this limitation, landfill expansion is usually proposed as a strategy to maximize available capacity while simultaneously supporting economical and sustainable waste management for future waste streams.
In recent years, geosynthetics have been increasingly applied in landfills to enhance stability during vertical expansions, where the overall height of the waste is increased. For example, Zhou et al. [2] presented a case study of a landfill in China, where a reinforced earth berm was constructed to extend the landfill under severe space constraints. Their findings confirmed that steep, geosynthetic-reinforced berms can provide a viable solution for landfill expansion when land availability is limited.
Zornberg and Kavazanjian [3] conducted a study on geogrid-reinforced slopes constructed over a solid waste foundation. By combining experimental tests with numerical finite element simulations, and considering both differential settlement and seismic loading, they showed that even under settlements as large as 600 mm over ten years, the geogrid strains remained within acceptable limits. Their findings demonstrate that performance-based reinforcement over waste substrates is feasible and effective.
This research presents a comprehensive assessment of the conceptual design and feasibility of expanding a landfill site through advanced numerical modeling and analysis using the finite element method. The proposed design accommodates a landfill height of 48 m, necessitating robust stabilization measures. To provide structural support and ensure long-term stability, RFS are provided on both the right and left sides of the landfill area. These reinforced sections will each have a height of 15.5 m and act as retaining structures to prevent slope failure and control deformation. The primary objective of this study is to evaluate the mechanical behavior and performance of the RFS under the substantial load exerted by the landfill. The results are presented in terms of horizontal displacements, differential settlement, strain in HDPE and geogrid, and the alignment and compressibility of gabions, following Eurocode 7 and related standards.
Beginning with a baseline configuration involving conventional RFS, a series of parametric studies were performed to investigate the influence of various design modifications. These include:
  • Consolidation rate (3 m/year vs. 5 m/year)
  • Layer-by-layer compaction
  • Addition of banquettes
  • Fill material type
  • Variation in the industrial waste properties
  • RFS width and geogrid length changes
In classical infrastructure design, only basic performance aspects, such as structural safety and economic efficiency, are considered. In modern design, more advanced performance aspects, such as resilience and sustainability, are also taken into account [4]. In this context the integration of geosynthetics within geotechnical engineering has become increasingly essential in modern civil infrastructure. Geosynthetic reinforcement strengthens soil by introducing materials with high tensile capacity and rigidity. This modification not only improves shear resistance and deformation control but also makes it feasible to construct steep slopes [5]. Specifically, geogrids, when embedded within soil as a reinforcement layer, are widely applied in geotechnical engineering to address challenges in structures such as slopes, embankments, retaining walls, and various other earthworks [6,7,8,9,10]. These materials now represent a mature, innovative, and sustainable solution from a design perspective. In line with the objectives of the United Nations 2030 agenda for sustainable development, geosynthetics contribute to several key goals, including clean water and sanitation, resilient infrastructure, sustainable consumption and production, climate action, and global partnerships [11]. Life cycle CO2 studies provide clear evidence of the environmental benefits of geosynthetics. For example, Miyata [12] compared the Life cycle CO2 analysis results for a geosynthetic MSE wall, L-shaped concrete retaining wall, and unreinforced embankment reveals that among the all, the L-shaped retaining wall generates the highest life-cycle CO2 (LCCO2) emissions. In contrast, the geosynthetic mechanically stabilized earth (MSE) wall with greening shows the lowest emissions. Notably, assuming a service life of 50 years, the CO2 emissions for this type of wall become negative. This suggests that geosynthetic MSE walls can actively contribute to carbon neutrality.
Geosynthetics are commonly used for reinforcement purposes in a variety of geotechnical applications. The key applications are as follows as per Eurocode 7 [13].
  • Reinforced Walls and Abutments
  • Reinforced Slopes
  • Basal Reinforcement for Embankments
  • Veneer Reinforcement on Landfill Slopes
RFS primarily consists of four components which include reinforcement material, reinforced fill, retained fill and facing material. Their use facilitates faster and more economical construction compared to traditional methods. This is due to simplified installation, reduced demand for skilled labor and heavy equipment, and the ability to reuse site-excavated materials, thereby minimizing environmental impact and transportation cost [14,15,16,17]. Economically, the short-term cost savings of RFS can range from 25% to 50% compared to conventional retaining walls. In transportation infrastructure, their application in embankments allows for steeper slopes and thus reduced land acquisition costs. Beyond construction, geosynthetics also offer long-term savings through lower maintenance requirements and superior seismic performance [18,19].
Advanced numerical techniques, particularly the finite element method (FEM), simulate complex problems under realistic field conditions, accurately predicting stress–strain behavior and structural response [20,21,22,23,24]. In landfill slope stability assessments, limit equilibrium method (LEM) evaluates safety by balancing driving and resisting forces along potential slip surfaces, while FEM accounts for complex material behavior, stress–strain relationships, and multi-loading scenarios for more realistic predictions [25,26].
Deformation in RFS is becoming a more significant design concern as construction tolerances become increasingly stringent. As a composite structure, combining them with the benefits of compressively strong soil and tensile-resistant polymer-based reinforcement, there are many potential factors that can influence the deformation performance of RFS. These include, but are not limited to, geometrical properties such as structural height and reinforcement length, as well as the long-term creep characteristics of the polymeric reinforcement. By their nature, RFS are flexible structures and as such they deform during their service life. These structures tend to deform outwards horizontally from the face as a result of geogrid strain, and vertically due to settlement, consolidation and vertical displacement [27].
Helwany et al. [28] performed large scale testing using different geosynthetic reinforcements, backfills and wall configurations, resulting in 144 analysis combinations. The author concluded that the type of backfill had the most influence on the behavior of the RFS.
Ehrlich et al. [29,30,31] conducted a laboratory study to examine the effects of compaction-induced stress on RFS using both light and heavy compaction efforts. The results indicated that the total mobilized tension along the reinforcement layers at the end of construction was significantly higher under heavy compaction compared to light compaction. The study also found that approximately 80% of the lateral movement of the geosynthetic-reinforced soil (GRS) wall occurred before the application of the surcharge, while the remaining 20% developed gradually as the surcharge increased.
Ambauen et al. [32] investigates the complex behavior of reinforced soil walls under a spread footing load, focusing on key design factors such as earth pressures, settlements, and reinforcement strains. Their findings highlight that lateral earth pressure is dependent not only on reinforcement stiffness but spacing as well. Use of stiffer reinforcements or smaller vertical spacing will both result in higher earth pressures, but smaller vertical and horizontal displacements in service.
Khan and Emidio [33] evaluated three fill types for RFS: untreated weak onsite fill, lime-stabilized onsite fill, and recycled construction and demolition waste. The untreated fill showed insufficient shear strength and stiffness, causing excessive lateral displacements, instability, and geosynthetic tensile strains exceeding serviceability limit due to poor soil–geogrid interaction and high compressibility. In contrast, the stabilized and recycled fills achieved Eurocode-compliant safety factors and reduced deformation by providing higher interface shear strength and effective geogrid mobilization within acceptable strain limits. The results emphasize that untreated weak fills are unsuitable for RFS, while stabilized and recycled fills significantly enhance structural performance.
The present research is unique in that it addresses the conceptual design of a landfill expansion through a performance-based design approach, incorporating multiple case scenarios and systematically evaluating their influence on key performance indicators which includes horizontal displacement, vertical settlement, tensile strains in HDPE and geogrid, and gabion compressibility and alignment. Given the complexity of waste behavior, the heterogeneity of fill materials, and the long-term stability requirements of RFS in landfill applications, such an investigation is essential. The objective of this study is to evaluate the feasibility and performance of RFS for landfill expansion by integrating limit equilibrium and finite element methods under a range of design scenarios. The significance of this research lies in providing data-driven guidance on design refinements that minimize deformation risks, improve serviceability, and ensure safe, durable, and cost-effective landfill expansions.

2. Materials and Methods

A feasibility study for the expansion of landfill involves industrial waste was conducted as part of the conceptual study to assess how the sensitivity of variations affects the critical factors, i.e., horizontal displacements, vertical settlements, strain in HDPE and geogrid, and the alignment and compressibility of gabions. The different scenarios investigated include the effect of consolidation time, the impact of compaction on each layer, the use of banquets on each side, variations in cohesion (c) and friction angle (ϕ) of industrial waste. Additionally, the study compares the use of two different types of fill materials. The assessment, conducted in accordance with Eurocode 7 and related guidelines. The complete research methodology is illustrated in Figure 1 as shown below.

2.1. Numerical Analysis

In the design of RFS, stability must be assessed with respect to both ultimate limit states and serviceability limit states, in accordance with Eurocode 7. External stability, which includes sliding, overturning, and bearing capacity, is primarily associated with ultimate limit states, as failure in these modes can result in global structural collapse. Internal stability, which encompasses reinforcement rupture, pullout, and connection failure, also falls under ULS due to the potential for structural failure within the reinforced zone. Additionally, internal mechanisms are closely linked to serviceability limit states, particularly in terms of deformation behavior. Excessive settlements, lateral displacements, reinforcement strain compromise the structure’s performance, even in the absence of collapse. Therefore, both external and internal stability considerations are essential for ensuring the overall safety and serviceability of RFS. In this study, a 15.5 m high RFS was analyzed on both sides of a proposed landfill expansion. The stability of the structure was evaluated using the limit equilibrium method, focusing on potential failure modes such as sliding, overturning, and bearing capacity. These analyses were carried out using the RSWall program developed by ROCSCIENCE, while the Key performance indicators which include horizontal displacement, differential settlement, tensile strain in the HDPE geomembrane and geogrids, and alignment and compressibility of gabions were evaluated using FEM.

2.2. Limit Equilibrium Method

Limit-equilibrium approaches are usually adopted to evaluate the external stability of RFS. In this study a program RSWall from ROCSCIENCE is used to determine the potential failure mechanisms, such as sliding, overturning, and bearing capacity failures. These are analyzed by comparing driving and resisting forces or moments acting on the structure. According to Eurocode 7, partial factors are applied to actions (loads) and material properties to account for uncertainties, ensuring a robust design. The resulting factor of safety (FOS), often referred to in Eurocode terminology as the design value of the resisting-to-driving ratio, typically targets a minimum value of 1.0 when all recommended partial factors are applied. The results are shown in Table 1.

2.3. Finite Element Method

A finite element method software, Plaxis-2D (PLAXIS 2D 2023.2.1) is used to design and analyze this RFS. The different performance indicators which include horizontal displacement, differential settlement, strain in the HDPE geomembrane and geogrids, gabions alignment and gabions compressibility were investigated. The geometric configuration of the RFS is shown in Figure 2. Geometry within the model is defined through points, lines, and clusters. Each triangular element comprises six nodes and three stress points. While displacements are computed at the nodes, stresses are evaluated at the stress points. The construction process of RFS is simulated using stage-wise construction to accurately replicate the sequential steps of the actual field construction process, thereby enabling the analysis to capture stress redistribution, deformation which ultimately leads to more realistic predictions of soil-structure behavior and overall stability.

2.4. Soil Properties

Table 2 presents the soil properties, which include foundation strata, and two different types of fill materials. The term waste in Table 2 refers specifically to industrial waste, characterized by the geotechnical properties listed. This material primarily consists of industrial by-products. The strata exhibited complete heterogeneity and a mixed geological origin. Due to confidentiality agreements with our industry collaborator, detailed descriptions and certain geotechnical properties of the soil strata and industrial waste have not been included in this study. The hardening soil (HS) model is used to replicate the behavior of soil as it takes into account the stress dependency of soil stiffness and better estimate of deformation analysis. The actual stiffness of soil is non-linear and the HS Model is able to predict this behavior. The model introduces stress-dependent stiffness moduli, specifically the triaxial loading stiffness E50 and the unloading/reloading stiffness Eur both defined by Equations (1) and (2) as follows:
E 50 = E 50 r e f c cot ϕ σ 3 c cot ϕ + p r e f m
E u r = E u r r e f c cot ϕ σ 3 c cot ϕ + p r e f m
  • E 50   = Tangent stiffness modulus for primary (first-time) loading in a triaxial test.
  • E 50 r e f   = Reference secant modulus at reference pressure pref
  • E u r = Stiffness modulus for unloading/reloading
  • E u r r e f = Reference unloading-reloading modulus at reference pressure pref
  • σ 3 = Minor principal effective stress (confining pressure in triaxial tests).
  • c′ = Effective cohesion of the soil.
  • Φ′ = Effective angle of internal friction.
  • m = Power exponent that controls how strongly stiffness depends on pressure
  • pref = Reference pressure
The above two equations capture the non-linear behavior of soil stiffness by incorporating stress dependency. As the minor principal effective stress increases, the ratio within the stiffness equation decreases, resulting in a lower value of E50. This indicates that the soil becomes less stiff under higher confining stress. The degree to which stiffness changes with stress is controlled by the exponent m, a higher value of m signifies a greater sensitivity of stiffness to stress variations. This stress-dependent formulation enables the HS Model to realistically simulate both soil hardening and softening under various loading and unloading conditions. In contrast to the Mohr Coulomb model, which assumes constant stiffness, the HS Model provides a more accurate and reliable prediction of soil deformation by accounting for the influence of stress levels on stiffness behavior.

2.5. Geogrid Modeling in PLAXIS

The RFS used in this research comprises a combination of geogrids and wire mesh, serving as primary and secondary reinforcement materials, respectively. Geogrids are employed as primary reinforcements as they are instrumental in preventing potential rupture surfaces within the structure. Additionally, wire mesh acted as secondary reinforcement, providing strength at the facing [34]. In PLAXIS, geogrids are represented as line elements with no bending stiffness, resisting only tensile forces. In the present study, geogrids were modeled as elastoplastic materials characterized by two primary parameters:
  • Np: Maximum axial tensile force (also referred to as allowable tensile strength).
  • EA: Axial stiffness.
The explanation of how to calculate these parameters are explained below. As per BS 8006 [35], design strengths of the reinforcing materials should be derived on the basis of the following two principles and both limit states should be satisfied in the design.
  • Reinforcement should not exceed its ultimate limit state during the design life of the structure, i.e., the reinforcement should not rupture.
  • Reinforcement should not exceed its serviceability limit state during the design life of the structure, i.e., creep in the reinforcement should remain within prescribed limits.
For the ultimate limit state, the base strength (TB) is TCR, the tensile creep rupture strength at the appropriate times and design temperature as mentioned below in Equation (3):
T B = T C R = T c h a r R F C R
where Tchar is the characteristic short-term strength & RFCR is the reduction factor for creep. The design strength for the ultimate limit state can be calculated from Equations (4) and (5).
T D = T C R f m
f m = R F I D × R F W × R F C H × f s
where,
  • T D is the design strength
  • fm is the material safety factor
  • RFID is the reduction factor for installation damage
  • RFW is the reduction factor for weathering
  • RFCH is the reduction factor for chemical/environmental effects
  • fs is the factor of safety for the extrapolation of data
For the serviceability limit state, the base strength (TB) is TCS can be calculated from Equations (6) and (7). Where TCS is the maximum tensile load in the reinforcement that does not cause the prescribed serviceability limit state strain to be exceeded during the design life. The design strength for the serviceability limit state is to be calculated as:
T D = T C S f m
f m = R F I D × R F W × R F C H × f s
where,
  • T D is the design strength
  • fm is the material safety factor
  • RFID is the reduction factor for installation damage
  • RFW is the reduction factor for weathering
  • RFCH is the reduction factor for chemical/environmental effects
  • fs is the factor of safety for the extrapolation of data
Table 3a, presents the properties of geogrid, which were determined under the serviceability simit state conditions using Equations (6) and (7) while Table 3b presents the properties of the geogrid which were determined under the ultimate limit state using Equations (3)–(5). A vertical spacing of 1 m between the reinforcements is selected.

2.6. Gabions & Wiremesh Properties

As shown in Figure 2, the facing of the wall is composed of gabion encased in wire-mesh, so gabion block is modelled as soil cluster. Here the Geogrids serve as the primary reinforcement, while wire mesh acting as secondary reinforcement [36]. Table 4 and Table 5 represent the properties of the gabions and wire mesh respectively. These parameters were adopted from [37].

2.7. Performance Parameters

This study aims to evaluate the performance of RFS supporting a landfill in accordance with Eurocode 7 and related recommendations. The study involves determination of the following performance parameters:
  • Horizontal displacement: the lateral outward movement of the RFS, used to evaluate serviceability and global stability. Particular attention was given to the displacement at the toe of the reinforced zone, as this location typically governs overall slope deformation and serviceability. In Plaxis, this parameter was obtained from the numerical output using Equation (8).
u x = u x ,   t o e
where:
u x , toe = horizontal displacement along the toe of the RFS
  • Differential settlement: the variation in vertical settlement across the structure, expressed in cm/m. The analysis focused on the settlement occurring directly beneath the RFS, since excessive differential settlement in this zone can affect reinforcement performance and facing stability. Also, this parameter was obtained from the numerical output using Equation (9).
δ D = s max s min L   ×   100
where:
δD is the differential settlement
s max and s min = maximum and minimum settlements along the RFS base
L = horizontal length between those points
  • Geogrid strain: the tensile strain developed within the geogrid layers, representing the mobilization of reinforcement capacity relative to allowable strain limits and can be found using Equation (10).
ε g = F g E A g   ×   100
where:
ε g is the strain in geogrid
F g = axial tensile force mobilized in the geogrid
E A g   = axial stiffness of the geogrid
  • Geomembrane strain: the tensile strain in the HDPE geomembrane lining, assessed to ensure deformation remains within tolerable limits for durability and environmental protection and can be found using Equation (11).
ε m = F m E A m   ×   100
where:
ε m is the strain in geomembrane
F m = axial tensile force mobilized in the geomembrane
E A m   = axial stiffness of the geomembrane
  • Gabions alignment: refers to the outward displacement of the gabion facing units relative to their original vertical alignment. It was used as a serviceability indicator to assess potential bulging or misalignment of the facing system under landfill loading. The values were obtained directly from the numerical output by measuring the horizontal displacement at the outer face of the gabion elements at the crest relative to the base. The difference in displacements between the top and bottom of the facing provides the total misalignment, as per Equation (12).
G a = u x , t o p u x , b a s e
where:
Ga = gabion alignment
u x , top = horizontal displacement at top of gabion facing
u x , base = horizontal displacement at base of gabion facing
  • Gabions compressibility: the relative deformation of the gabion units under loading, expressed as a percentage, indicating the ability of the facing system to accommodate stresses without compromising integrity. This parameter was obtained from the numerical output using Equation (13).
G c = h 0 h f h 0   ×   100
where:
Gc = gabion compressibility
h 0 = original gabion height,
h f = deformed gabion height under load
The limit values of the performance parameters are shown in Table 6.

2.8. Details of Different Scenarios

  • 1a. Baseline design with local fill stabilized with lime
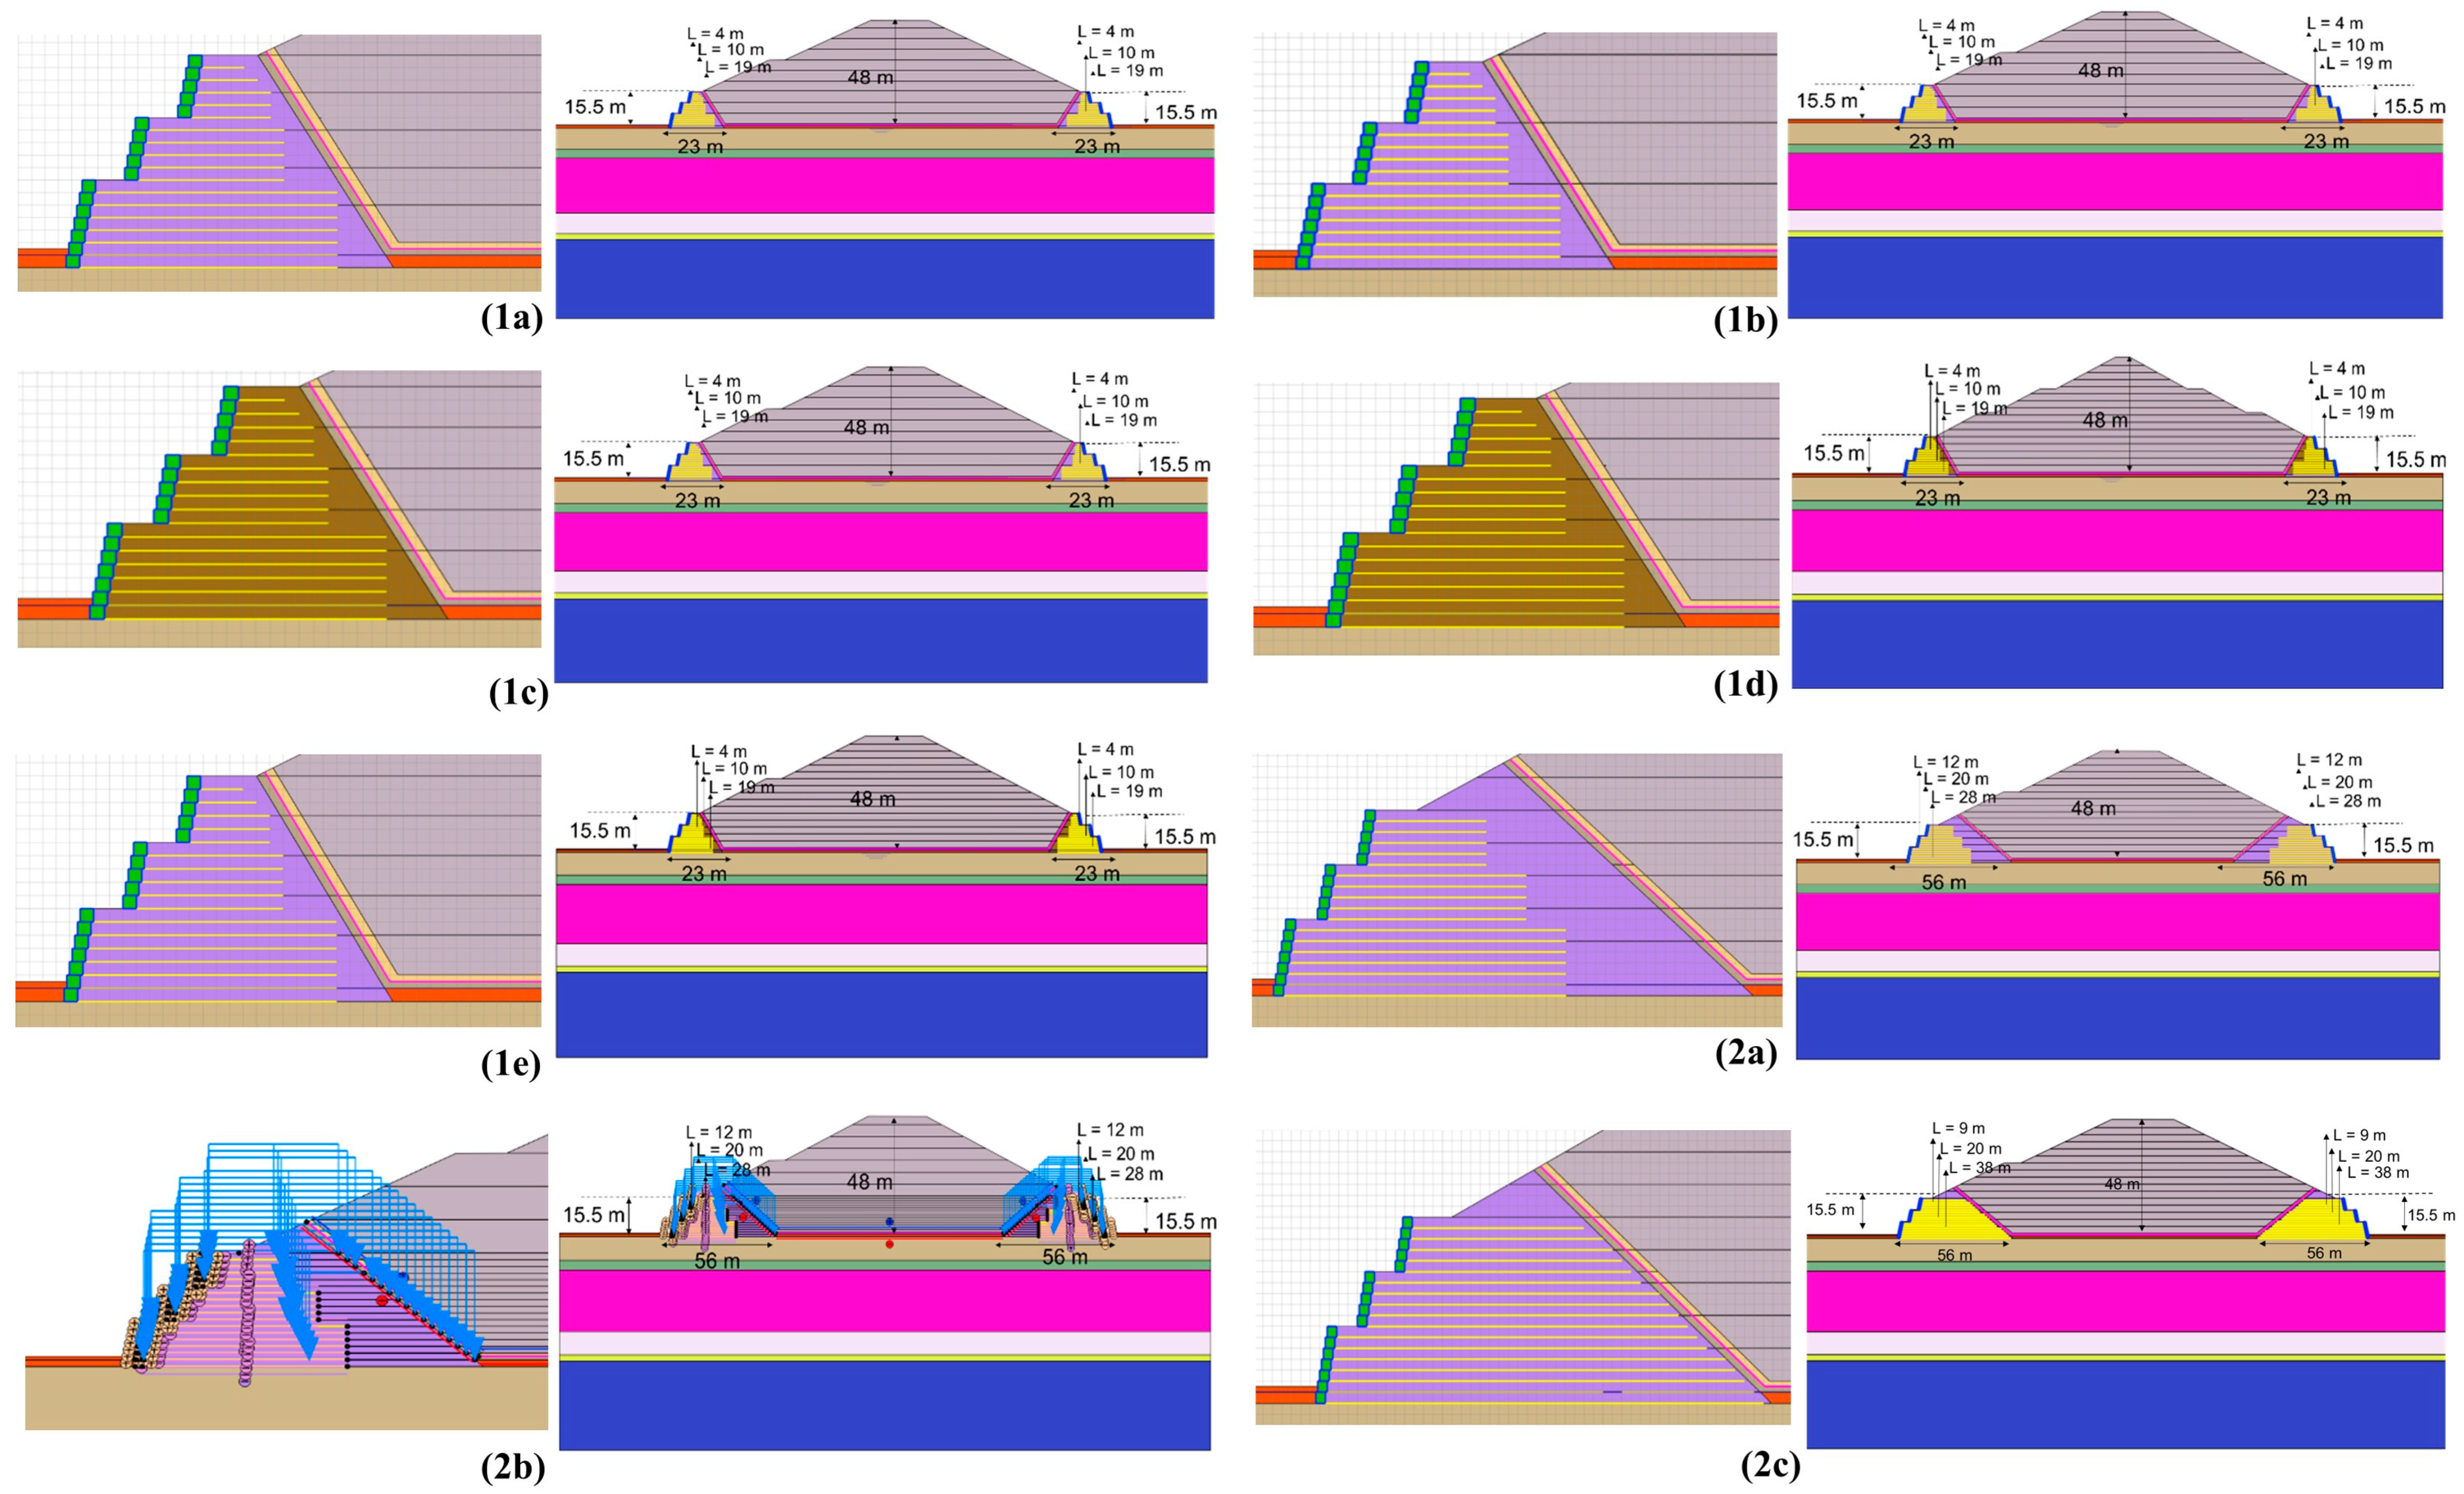
The baseline configuration represents a landfill expansion stabilized using a RFS with lime-stabilized local soil as fill. To ensure stability of the 48 m high landfill, 15.5 m high RFS were provided on both sides (Figure 2). The reinforcement system consisted of a combination of geogrids and wire-mesh gabions, commonly adopted as primary and secondary reinforcement materials. Geogrids were assigned as the primary reinforcement owing to their high tensile stiffness and slender geometry, which make them effective in resisting tensile forces and limiting deformations. Gabions constructed with double-twisted wire mesh acted as secondary reinforcement, serving both as erosion control and as a facing system to retain the fill mass. In the numerical model, gabions were represented as soil clusters, welded wire mesh panels as plate elements, and geogrids as elastoplastic geogrid elements.
To realistically capture construction sequencing and time-dependent effects, the RFS was simulated using a staged construction approach. Each 3 m thick layer of reinforced fill was placed and compacted over a construction period of approximately 60 days, followed by a consolidation period of 365 days. This procedure allowed the stresses to redistribute progressively, thereby replicating realistic deformation and settlement behavior.
An HDPE geomembrane was incorporated directly beneath the landfill waste at a depth of 5 m from the base, forming a continuous liner at the interface between the waste body and the underlying foundation layers. The liner extended laterally across the entire landfill base and was anchored into the reinforced fill sections on both sides, thereby ensuring containment and providing a realistic representation of stress transfer and tensile demand at the landfill base.
Appropriate boundary conditions were assigned to avoid artificial influences on the results. The base of the model was fully fixed in both vertical and horizontal directions to prevent rigid body motion, while the lateral boundaries were fixed horizontally but free vertically, allowing settlement to occur. This configuration ensured realistic confinement and deformation behavior while minimizing boundary effects.
This configuration served as the reference case against which all parametric scenarios were compared.
  • 1b. Effect of Consolidation time
This scenario differs from the baseline configuration only in the consolidation rate. Instead of a 3 m thick lift followed by one year of consolidation, the reinforced fill was placed in 5 m thick layers as shown in Figure 3(1b), each constructed over approximately 60 days and then subjected to a 365-day (one year) consolidation period. This modification was introduced to investigate the influence of accelerated placement and increased lift thickness on the deformation and stability performance of the landfill system.
  • 1c. Effect of different fill material on landfill stability
In this scenario, the reinforced fill was constructed using sand instead of lime-stabilized local soil adopted in the baseline design as shown in Figure 3(1c). The purpose of this variation was to evaluate how a cohesionless, lower-stiffness fill influences the stability and deformation behavior of the landfill system. By substituting sand as the fill material, the analysis captures the effect of reduced shear strength and confinement on horizontal displacement, settlement, reinforcement and facing performance.
  • 1d. Influence of Banquettes on Landfill Stability
In this scenario, banquettes were introduced on both sides of the landfill as shown in Figure 3(1d) to enhance lateral stability and improve load distribution within the RFS. The stepped geometry provided by the banquettes acts as intermediate berms, reducing outward deformations by offering additional resistance against lateral soil movement. Beyond improving stability, banquettes also represent a practical construction measure, creating intermediate working platforms that facilitate staged construction, inspection, and long-term maintenance of the landfill slopes.
  • 1e. Influence of the variation in industrial waste properties
In this scenario, the shear strength parameters of industrial waste were modified by increasing both cohesion and the angle of internal friction as shown in Figure 3(1e). This adjustment was introduced to examine how an improvement in the mechanical properties of the underlying waste mass influences the global stability of the landfill system. By enhancing the strength characteristics of the waste, the analysis captures the potential reduction in lateral displacements and improved reinforcement performance, thereby highlighting the importance of foundation material properties in the overall behavior of reinforced landfill structures.
  • 2a. Impact of increasing RFS width
In this scenario, the width of the RFS was increased from 23 m in the baseline design to 56 m as shown in Figure 3(2a). At the same time, the lengths of the geogrid layers were extended to maintain appropriate embedment within the wider zone. This modification was introduced to investigate the role of reinforcement geometry in controlling global stability and deformation. A wider reinforced zone with longer geogrids provides greater confinement, improves stress distribution, and reduces the tendency for outward bulging, thereby enhancing the overall stiffness and stability of the landfill system.
  • 2b. Influence of Compaction
In this scenario, the effect of compaction on each layer within the RFS was examined as shown in Figure 3(2b). To simulate the compaction process, an additional vertical load was applied to each layer during construction, following the type 1 approach adopted by Mirmoradi and Ehrlich [29] and subsequently consolidated at the same rate as the baseline case (3 m/year). This approach increased the stiffness of the fill material, thereby reducing deformations and settlements within the RFS. The analysis was intended to capture how higher compaction levels influence global stability, deformation control, and the interaction between the reinforced fill and the facing system.
  • 2c. Impact of Maximum Geogrid Length on Landfill Stability
In this scenario, the geogrid layers were extended to their maximum practical length while keeping the overall geometry of the RFS consistent with the previous case as shown in Figure 3(2c). The objective was to assess whether additional reinforcement length would significantly improve global stability and deformation control. Extending the geogrids enhances anchorage and pullout resistance, which is expected to benefit the facing system by reducing outward bulging and improving alignment. However, the analysis also allowed evaluation of whether further increases in geogrid length beyond the design optimum yield measurable gains in landfill stability.

3. Interface Coefficient

The interaction between geogrids and surrounding soil is a key factor influencing the overall stability of a RFS. In numerical modeling, this interaction is represented through an interface element positioned between the reinforcement and the soil mass. The interface enables the realistic transfer of stresses, ensuring that the structural response under varying load conditions is accurately reproduced. Proper assessment of shear resistance along this interface is essential for predicting potential sliding and deformation. In the present study, the interface coefficient was selected in accordance with the manufacturer’s recommendations and incorporated into the PLAXIS model. Table 7 summarizes the recommended coefficient values for different fill types. For confidentiality purposes, the exact values used in the analysis are not disclosed in this publication.

4. Validation of Model

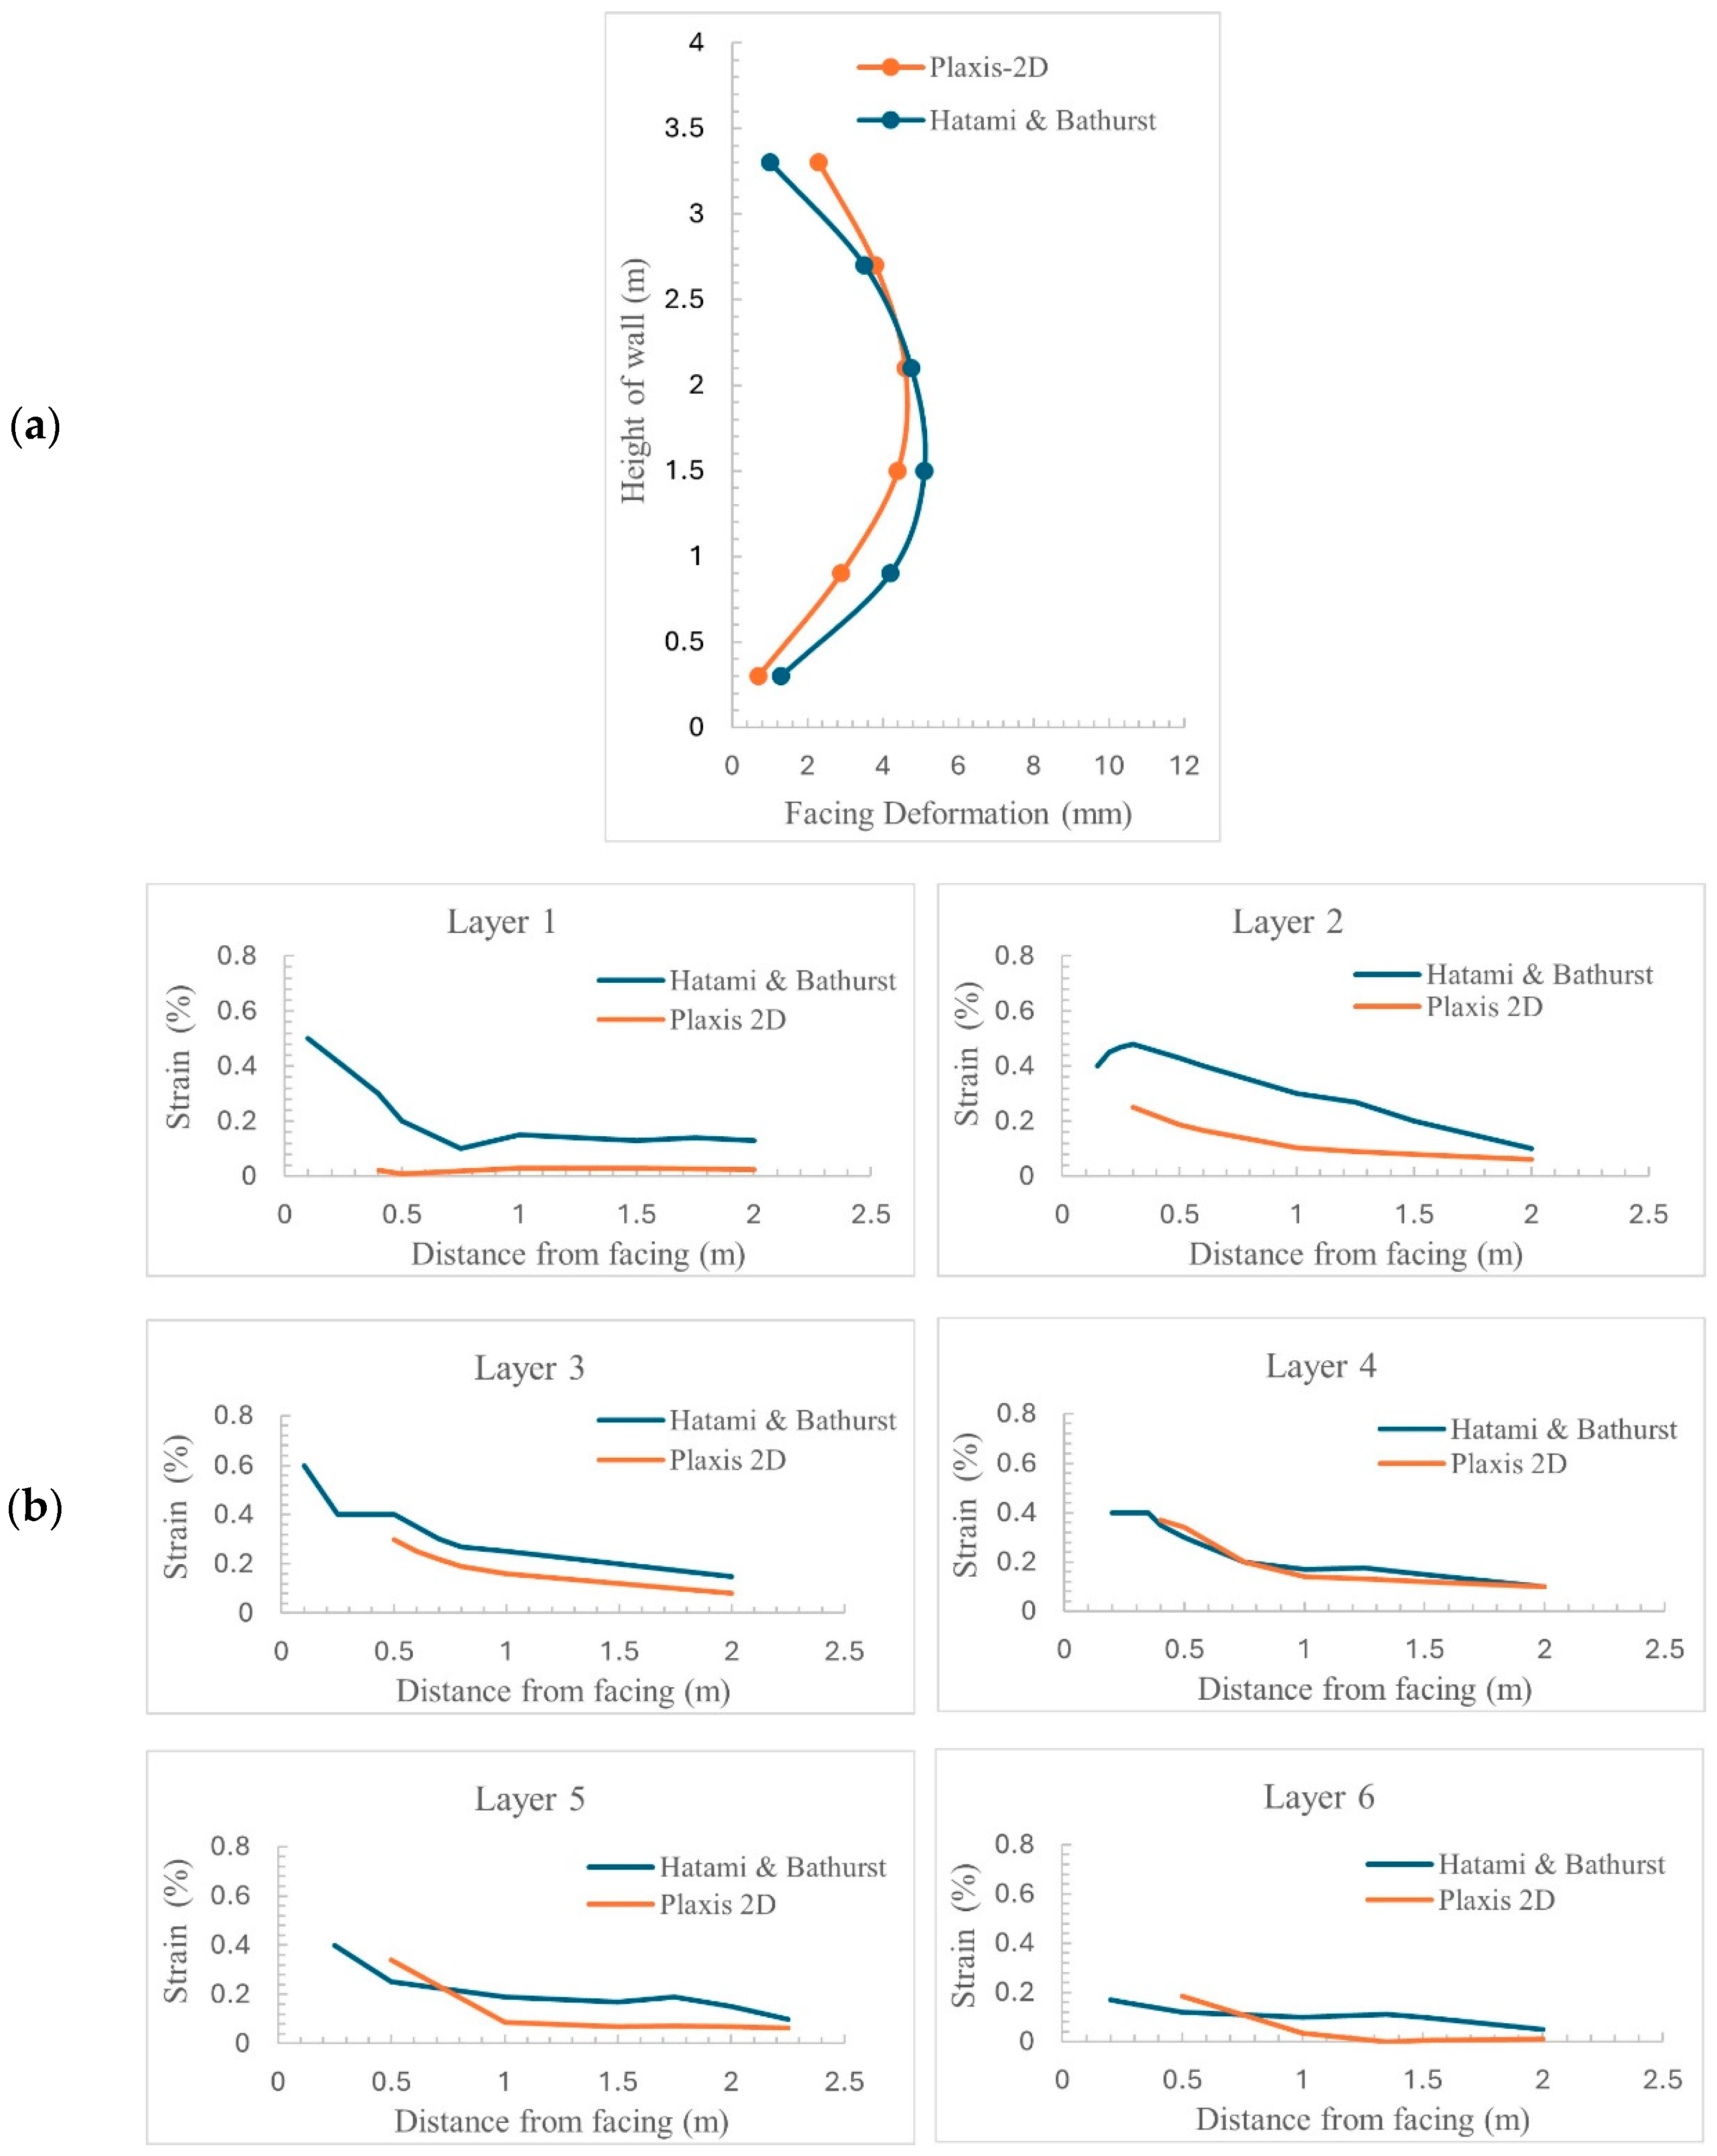
For the purpose of validation, the test results on a full-scale wall setup at Royal Military College, Canada, reported by Bathurst and Walters [40], were used to calibrate our finite element model. A two-dimensional PLAXIS 2D model was developed to simulate a modular block wall 3.6 m in height, reinforced with geosynthetic layers 2.52 m in length and spaced at 600 mm intervals as shown in Figure 4. The properties of the soil, modular block, and reinforcements are mentioned in Table 8, Table 9 and Table 10, respectively, and adopted from a documented source [20,40]. The staged construction procedure was incorporated in the numerical model to replicate the sequential placement of soil and reinforcement layers. Model validation was carried out by comparing the simulated facing deformations and reinforcement strain distributions with the experimental measurements from the reference study. The strong agreement between the numerical predictions and the measured results, as shown in Figure 5a,b, confirms the model’s reliability in representing the behavior of RFS under comparable conditions. The full details of this validation study are provided in one of our previous papers [33].

5. Results

This research presents a conceptual study that evaluates the performance of an expanded landfill through a sensitivity analysis, varying key parameters and assessing their impact on critical performance indicators.
A visual representation of all the aforementioned scenarios is provided in Figure 3, whereas their corresponding effects on the performance indicators are summarized in Table 11.

Comparison of Different Scenarios

  • 1a. Baseline Design with local fill stabilized with lime
The baseline configuration used a 23 m wide reinforced fill zone with lime-stabilized local soil. The Serviceability Limit State (SLS) evaluation, based on standard performance criteria, highlights that horizontal displacements reach 47 cm and 55 cm on the left and right sides, respectively, exceeding the recommended limit of 25 cm and raising serviceability concerns as shown in Figure 6b and Table 11. The excessive horizontal displacement is likely due to the mobilized shear stress at the base of the structure exceeding the available shear strength of the soil, because of the significant load imposed by the large landfill, which results in lateral deformations beyond the acceptable limit. However, differential settlements remain within the acceptable threshold of 2 cm/m, with measured values of 1.7 cm/m on left side and 1.8 cm/m on right side, as shown in Figure 6c. Geogrid strain is maintained below 1% as shown in Figure 6d, which is significantly lower than the 5% allowable limit, indicating that the reinforcement remains unstressed. Similarly, strain within the HDPE geomembrane is within 3%, as shown in Figure 6e, consistent with values specified by Rowe & Yu, 2019 [39]. The compressibility of the gabions is maintained within the 5% limit prescribed by BS EN 14475:2006 [38], as shown in Figure 6g. The alignment of the gabions is also maintained within the specified tolerance limits as shown in Figure 6f. The limit values of all the performance parameters are shown in Table 6.
  • 1b. Effect of change in Consolidation time (scenario 1a vs. 1b)
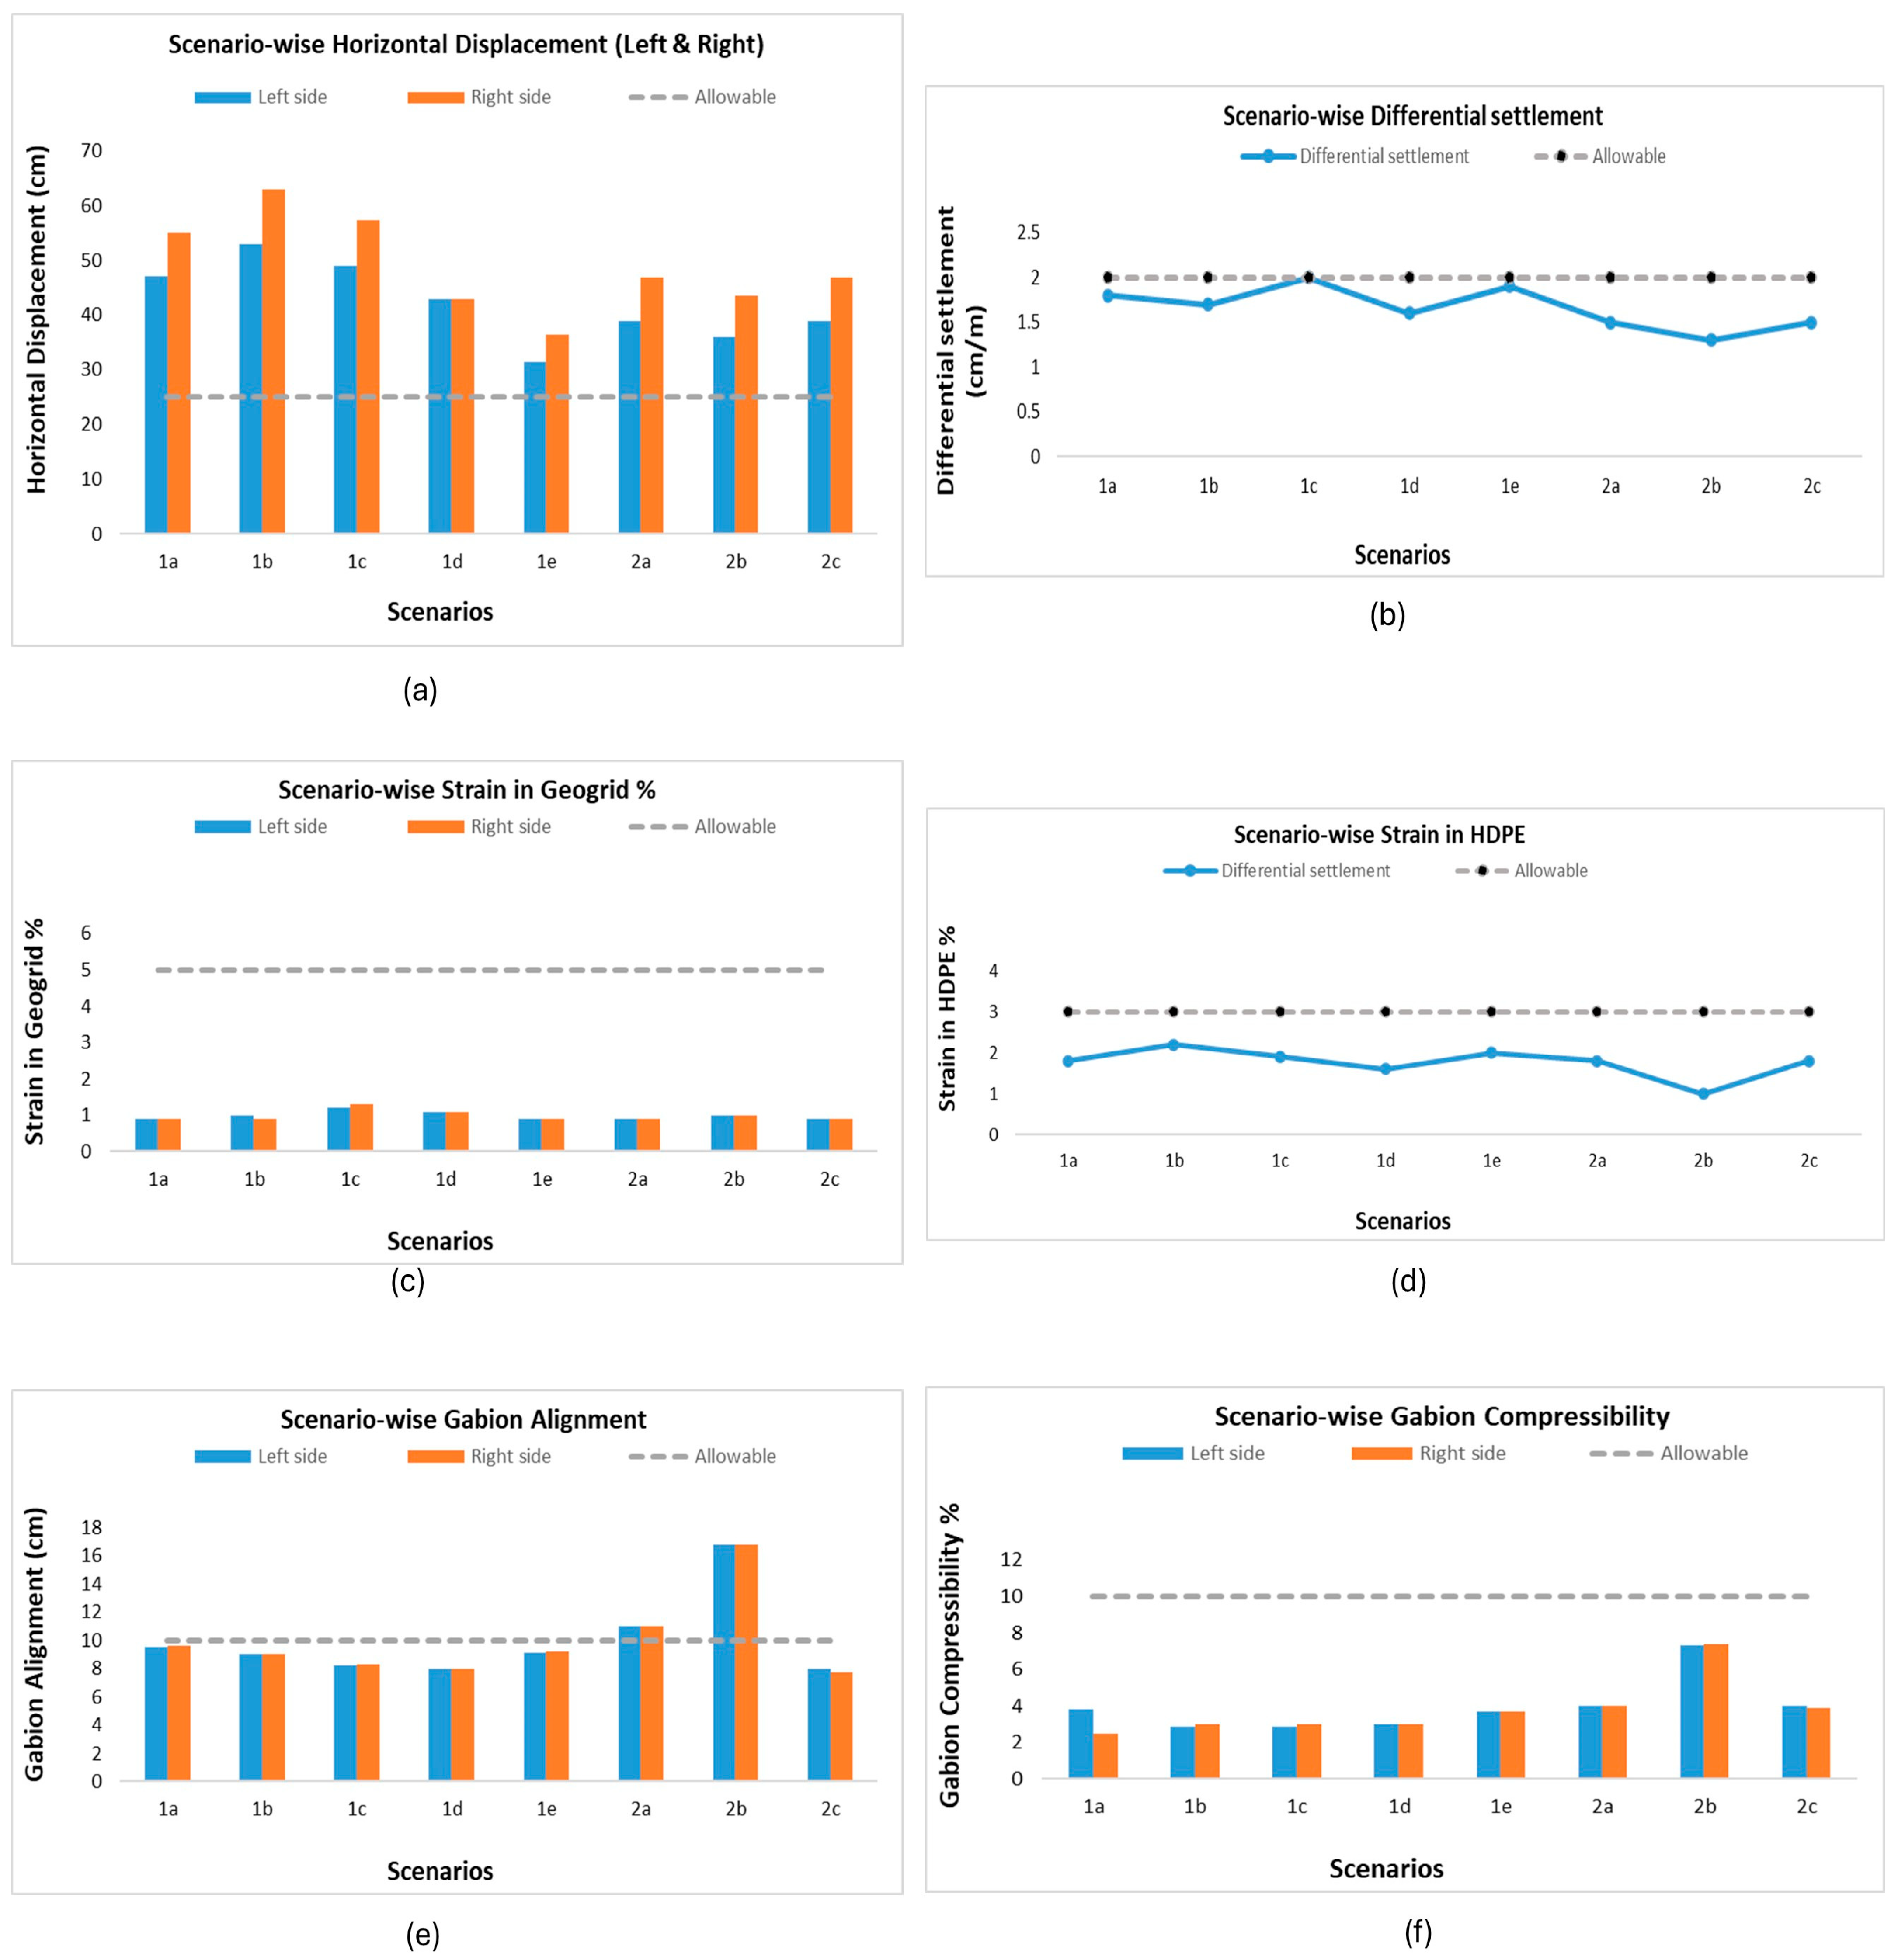
Increasing the consolidation rate from 3 m/year to 5 m/year increased horizontal displacements to 53 cm (left) and 63 cm (right) as illustrated in Figure 7a. This increase is attributed to the faster consolidation rate, which creates greater lateral movements in the soil mass because the forces within the ground do not have as much time to dissipate or be redistributed gradually. As a result, the soil pushes more against the sides, leading to increased horizontal displacements. Differential settlement remains almost unchanged as shown in Figure 7b. The strain in the HDPE geomembrane increases from 1.8% to 2.2%, suggesting greater tensile demand (Figure 7d). Similarly, geogrid strain rises marginally (Figure 7c). Gabion alignment changes slightly, from 9.5 cm to 9 cm on both sides as depicted in Figure 7e, reflecting minor positional adjustments due to greater soil pressure. Meanwhile, gabion compressibility is also maintained within the specified tolerance limits (Figure 7f). All these observations are summarized in Table 11.
  • 1c. Effect of different fill material on landfill stability (scenario 1a vs. 1c)
Replacing lime-stabilized fill with sand (both at 3 m/year) increased displacements to 49 cm (left) and 57.4 cm (right) as illustrated in Figure 7a. Differential settlement rose slightly to 1.95 cm/m (Figure 7b). Geogrid strain increased from 0.9% to 1.2% (left) and 1.3% (right), while strain in HDPE increased from 1.8% to 1.9% as shown in Figure 7c and Figure 7d, respectively. These variations can be attributed to the inherent properties of sand compared to lime-stabilized fill. Sand, with lower cohesion and comparatively less internal friction than stabilized material, provides reduced lateral confinement and stiffness to the reinforced system. This results in greater lateral and vertical deformation, increased tensile demand in the reinforcement elements. There were also changes in the gabion alignment and gabion compressibility, but the values were maintained within the specified tolerance limits as shown in Figure 7e and Figure 7f, respectively. The numerical values supporting these observations are presented in Table 11.
  • 1d. Influence of Banquettes on Landfill Stability (scenario 1c vs. 1d)
A comparative analysis between scenarios 1c and 1d, both utilizing sand as fill material under an identical consolidation rate of 3 m/year, highlights the positive effects of incorporating banquettes in scenario 1d. The introduction of banquettes results in a substantial reduction in horizontal displacements, from 49 cm (left) and 57.4 cm (right) in scenario 1c to a uniform 43 cm on both sides in scenario 1d as shown in Figure 7a, indicating enhanced lateral stability of the landfill slope. This reduction can be attributed to the additional lateral support and confinement provided by the banquettes, which effectively limit the magnitude of horizontal soil movements. Differential settlement is also reduced, improving from 2 cm/m in 1c to 1.6 cm/m in 1d as shown in Figure 7b. The presence of banquettes facilitates a more uniform stress distribution across the slope, mitigating localized settlement variations. The strain in the HDPE geomembrane decreases from 1.9% in 1c to 1.6% in 1d as depicted in Figure 7d, reflecting the reduced tensile demand due to lower lateral displacements and improved overall stability. Geogrid strains in scenario 1d (1.1% on both sides) are marginally lower than in 1c (1.2% left, 1.3% right) as evidenced in Figure 7c. Furthermore, there was an improvement in the gabion compressibility and gabion alignment values as shown in Figure 7e and Figure 7f, respectively, which indicate the regularity and stability of the facing system. A detailed listing of these performance indicators is provided in Table 11.
  • 1e. Influence of the variation in the industrial waste properties (scenario 1a vs. 1e)
Increasing industrial waste cohesion from 20 kPa to 30 kPa and friction angle from 30° to 40° significantly reduced horizontal displacement to 31.5 cm (left) and 36.5 cm (right) as shown in Figure 7a. This decrease in lateral deformation is attributed to the elevated shear strength of industrial waste, which enhances its resistance to lateral movement and contributes to improved global stability of the structure. Differential vertical settlement exhibited a minor increase (Figure 7b). The strain in the HDPE geomembrane increased from 1.8 kN/m to 2 kN/m, indicating a modest rise in tensile demand, while the geogrid strain remained essentially constant as shown in Figure 7d and Figure 7c, respectively, suggesting that reinforcement loads were not substantially affected by the changes in strength of the industrial waste. Gabion alignment indices decreased from 9.5 cm and 9.6 cm to 9.1 cm and 9.2 cm on the left and right, respectively, as evidenced in Figure 7e, suggesting a slight improvement in the structural regularity of the facing as a consequence of reduced lateral deformation. Gabion compressibility remained nearly unchanged on the left side, while it increased from 2.5% to 3.7% on the right as shown in Figure 7f. This localized increase may be attributed to non-uniform stress transfer and possible concentration of loads at the facing interface associated with the higher stiffness of the improved industrial load. These results, along with the associated performance metrics, are presented in Table 11.
  • 2a. Impact of increasing RFS width (scenario 1a vs. 2a)
A comparative evaluation of scenarios 1a and 2a demonstrates the influence of geometric configuration and reinforcement layout on the performance of the RFS. Scenario 2a is characterized by a wider reinforced zone and the use of longer geogrid layers relative to scenario 1a. This geometric enhancement effectively increases the width-to-height ratio and the anchorage length of the reinforcement, thereby improving the internal stability and load distribution within the system. As a result, scenario 2a exhibits significantly reduced horizontal displacements of 39 cm (left) and 46.8 cm (right) as compared to 47 cm (left) and 55 cm (right) in scenario 1a as shown in Figure 7a. Differential settlement is also lower in 2a, decreasing from 1.8 cm/m in 1a to 1.5 cm/m (Figure 7b), indicative of improved settlement control and more uniform stress distribution across the base of the structure. Strain measurements in both the HDPE geomembrane layers and geogrid remain consistent between the two scenarios as shown in Figure 7c and Figure 7d, respectively, suggesting that the primary benefit of the wider configuration is realized in global deformations rather than in reinforcement demand. However, gabion alignment and compressibility values show a slight increase as evidenced in Figure 7e and Figure 7f, respectively. All the quantitative outcomes for this case are compiled in Table 11.
  • 2b. Influence of Compaction (scenario 2a vs. 2b)
A comparative assessment of scenarios 2a and 2b underscores the influence of fill material compaction on the mechanical behavior of the RFS. The primary distinction in scenario 2b is the compaction of the fill layer by layer, resulting in increased stiffness, and shear strength relative to scenario 2a. This enhancement in fill properties is reflected in the performance indicators: horizontal displacements are further minimized in scenario 2b, with values reducing to 36 cm (left) and 43.5 cm (right), compared to 39 cm and 46.8 cm in scenario 2a as shown in Figure 7a. Differential settlement is also improved, decreasing from 1.5 cm/m in 2a to 1.3 cm/m in 2b (Figure 7b), indicative of more uniform load transfer and reduced compressibility of the fill mass.
The strain in the HDPE geomembrane shows a noticeable reduction from 1.8% to 1.0%, whereas the strain in the geogrid slightly increases due to enhanced load transfer within the stiffer fill as shown in Figure 7d and Figure 7c, respectively. This behavior suggests that compaction improves the interaction between the fill and reinforcement system, reducing tensile demand on the geomembrane but mobilizing higher tensile resistance in the geogrid. Conversely, gabion alignment and compressibility indices increase in scenario 2b, with alignment reaching 16.8 cm and compressibility rising to 7.3–7.4%, as compared to 11 cm and 4% in scenario 2a as evidenced in Figure 7e and Figure 7f, respectively. The elevated values are likely a consequence of the stiffer and denser fill imposing higher lateral pressures against the facing system, resulting in increased outward movement and deformation of the gabion units. In summary, the compaction of fill material in scenario 2b leads to a pronounced improvement in global stability and deformation control, as evidenced by reduced horizontal displacement, lower differential settlement, and diminished reinforcement strain. However, the increased rigidity of the fill may impose greater demands on the facing system, as indicated by the higher gabion alignment and compressibility values, highlighting the importance of integrated design between fill compaction and facing stability in RFS. These observations are further substantiated by the data in Table 11.
  • 2c. Impact of Maximum Geogrid Length on Landfill Stability (scenario 2a vs. 2c)
A comparison between scenarios 2a and 2c highlights the effect of geogrid length on the performance of the RFS. In scenario 2c, the maximum geogrid length is employed, while all other geometric and material properties remain consistent with scenario 2a. Performance metrics such as horizontal displacement (39 cm left, 46.8 cm right), differential settlement (1.5 cm/m), and strain values in the HDPE and geogrid layers (1.8% and 0.9%, respectively) are identical between the two scenarios as shown in Figure 7a–d. This indicates that the global deformation behavior is primarily governed by overall geometry and boundary conditions rather than the geogrid length. However, the extension of geogrid length in scenario 2c results in improved facing performance, as evidenced by reduced gabion alignment values (8 cm left, 7.7 cm right in 2c versus 11 cm in 2a) and a slight reduction in gabion compressibility on the right side (3.9% in 2c versus 4% in 2a) as shown in Figure 7e and Figure 7f, respectively. These improvements are attributed to enhanced anchorage and pullout resistance provided by the longer geogrid layers, which lead to more effective load transfer and better confinement of the facing system. The complete set of values corresponding to this analysis is given in Table 11.

6. Conclusions

This study systematically evaluated the performance of a RFS under various design scenarios using key performance indicators including horizontal displacement, differential settlement, reinforcement strain, gabion alignment and compressibility. It will help to assess their effectiveness in controlling deformation, settlement and reinforcement strain. The following conclusions are as follows:
  • The baseline configuration (scenario 1a), using lime-stabilized local fill, demonstrated acceptable performance in terms of differential settlement and reinforcement strain. However, horizontal displacements significantly exceeded the allowable limit, raising serviceability concerns. This highlighted the need for design enhancements to manage lateral movements under heavy loading conditions.
  • Increasing the consolidation rate (scenario 1b) resulted in greater horizontal displacements and geomembrane strain, indicating that faster consolidation accelerates lateral soil movement due to insufficient time for stress redistribution.
  • The substitution of lime-stabilized fill with sand (scenario 1c) led to increased displacements and strain levels due to the sand’s lower cohesion and stiffness.
  • Incorporating banquettes (scenario 1d) proved highly effective in reducing lateral displacement and enhancing overall slope stability.
  • The enhancement of industrial waste properties (scenario 1e) substantially improved lateral stability by reducing horizontal displacements. While this led to a modest rise in geomembrane strain, it did not significantly affect geogrid performance, making it a favorable approach for improving global stability.
  • From a geometric perspective, increasing the width of the reinforced fill system and the length of the geogrid (scenario 2a) improved deformation control, suggesting that geometry plays a critical role in managing global stability. Wider reinforced zones and longer geogrid embedment allow stresses to be distributed more efficiently, reduce the tendency for outward bulging, and improve the overall stiffness of the soil–reinforcement composite.
  • Improving the degree of compaction of the fill material (scenario 2b) proved effective in reducing horizontal displacements and vertical settlements, thereby enhancing the overall stability of the reinforced fill system. However, higher compaction also increased the tensile demand on the geogrid and the stiffness of the fill, which in turn transferred greater lateral pressures to the gabion facing. This resulted in higher compressibility and greater alignment demands on the facing units.
  • Lastly, maximizing geogrid length (scenario 2c) resulted in only marginal improvements in terms of overall landfill stability and deformation control. The additional reinforcement length did not significantly reduce displacements or strains within the reinforced soil mass, suggesting that after a certain point, adding more geogrid length does not bring much extra benefit to the overall stability. However, the longer reinforcement layers contributed positively to the facing system by improving alignment, reducing outward bulging, and distributing loads more evenly across the gabions.
The numerical results are inherently dependent on the adopted modelling approach and parameter selection and are intended to illustrate overall trends under the specified conditions.
Future work should focus on extending the current 2D FEM analyses to 3D FEM modelling. While 2D simulations are computationally efficient, they tend to be conservative, often overestimating horizontal displacements. Three-dimensional modelling would allow a more realistic representation of stress redistribution, deformation mechanisms, and out-of-plane effects, thereby improving the reliability and practicality of design recommendations for landfill expansions.

Author Contributions

Conceptualization, A.R.K.; methodology, A.R.K.; software, A.R.K.; validation, A.R.K.; formal analysis, A.R.K.; investigation, A.R.K.; resources, A.R.K. and G.D.E.; data curation, A.R.K.; writing—original draft preparation, A.R.K.; writing—review and editing, A.R.K. and G.D.E.; visualization, A.R.K.; supervision, G.D.E.; project administration, G.D.E.; funding acquisition, A.R.K. and G.D.E. All authors have read and agreed to the published version of the manuscript.

Funding

The work presented in this study was supported by Higher Education Commission of Pakistan (HEC/HRD/OSS-III/Blg-B2/2021) and Pollux Consulting.

Data Availability Statement

The data presented in this study is available on request from the corresponding author due to privacy reasons.

Conflicts of Interest

The authors declare no conflicts of interest.

References

  1. Keskin, M.S.; Kezer, S. Stability of MSW Landfill Slopes Reinforced with Geogrids. Appl. Sci. 2022, 12, 11866. [Google Scholar] [CrossRef]
  2. Zhou, X.; Jiang, H.; Zhou, M.; Hu, Y. Case Study: Extension of MSW landfill with reinforced earth berm. Waste Manag. 2023, 164, 37–46. [Google Scholar] [CrossRef]
  3. Zornberg, J.G.; Kavazanjian, E. Prediction of the performance of a geogrid-reinforced ssslope founded on solid waste. Soils Found. 2001, 41, 1–16. [Google Scholar] [CrossRef]
  4. Lounis, Z.; McAllister, T.P. Risk-based decision making for sustainable and resilient infrastructure systems. J. Struct. Eng. 2016, 142, F4016005. [Google Scholar] [CrossRef]
  5. Bathurst, R.J.; Naftchali, F.M. Geosynthetic reinforcement stiffness for analytical and numerical modelling of reinforced soilstructures. Geotext. Geomembr. 2021, 49, 921–940. [Google Scholar] [CrossRef]
  6. Sun, Y.; Xu, H.; Gu, P.; Hu, W. Application of FBG Sensing Technology in Stability Analysis of Geogrid-Reinforced Slope. Sensors 2017, 17, 597. [Google Scholar] [CrossRef] [PubMed]
  7. Leshchinsky, D.; Imamoglu, B.; Meehan, C.L. Exhumed Geogrid-Reinforced Retaining Wall. J. Geotech. Geoenviron. Eng. 2010, 136, 1311–1323. [Google Scholar] [CrossRef]
  8. Chen, R.P.; Wang, Y.W.; Ye, X.W.; Bian, X.C.; Dong, X.P. Tensile force of geogrids embedded in pile-supported reinforced embankment: A full-scale experimental study. Geotext. Geomembr. 2016, 44, 157–169. [Google Scholar] [CrossRef]
  9. Al-Qadi, I.L.; Dessouky, S.H.; Kwon, J.; Tutumluer, E. Geogrid-reinforced low-volume flexible pavements: Pavement response and geogrid optimal location. J. Transp. Eng. 2012, 138, 1083–1090. [Google Scholar] [CrossRef]
  10. Abdesssemed, M.; Kenai, S.; Bali, A. Experimental and numerical analysis of the behavior of an airport pavement reinforced by geogrids. Constr. Build. Mater. 2015, 94, 547–554. [Google Scholar] [CrossRef]
  11. Cardile, G.; Pisano, M. Advances in soil reinforcement with geosynthetics: From laboratory tests to design practice. Riv. Ital. Geotech. 2020, 54, 52–82. [Google Scholar] [CrossRef]
  12. Miyata, Y. Geosynthetic MSE walls research and practice: Past, present, and future (2023 IGS Bathurst Lecture). Geosynth. Int. 2024, 32, 62–81. [Google Scholar] [CrossRef]
  13. prEN-1997-3:2022; Eurocode 7 Geotechnical Design-Part 3 Geotechnical Structures. British Standards Institution (BSI): London, UK, 2022; pp. 1–293.
  14. Koerner, R.M. Designing with Geosynthetics; Xlibris Corporation: Bloomington, IN, USA, 2012; Volume 1. [Google Scholar]
  15. Zornberg, J.G.; Christopher, B.R. Chapter 37—Geosynthetics. In The Handbook of Groundwater Engineering, 2nd ed.; CRC Press/Taylor & Francis Group: Boca Raton, FL, USA, 2007; pp. 1–36. [Google Scholar]
  16. Tatsuoka, F.; Uchimura, T.; Tateyama, M.; Koseki, J. Geosynthetic-reinforced soil retaining walls as important permanent structures 1996–1997 mercer lecture. Geosynth. Int. 1997, 4, 81–136. [Google Scholar] [CrossRef]
  17. Bathurst, R.J.; Allen, T.M.; Walters, D.L. Short-term strain and deformation behavior of geosynthetic walls at working stress conditions. Geosynth. Int. 2002, 9, 451–482. [Google Scholar] [CrossRef]
  18. Jones, C. Geoguide 6: Guide to Reinforced Fill Structures and Slope Design; Geotechnical Engineering Office: Hong Kong, China, 2002. [Google Scholar]
  19. Berg, R.R.; Christopher, B.R.; Samtani, N.C. Design and Construction of Mechanically Stabilized Earth Walls and Reinforced Soil Slopes—Volume I; Federal High Way Administration (FHWA): Washington, DC, USA, 2009. [Google Scholar]
  20. Majumder, M.; Venkatraman, S.; Bheda, M.; Patil, M. Numerical Studies on the Performance of Geosynthetic Reinforced Soil Walls Filled with Marginal Soil. Indian Geotech. J. 2023, 53, 805–826. [Google Scholar] [CrossRef]
  21. Korulla, M.; Padmaja, G.; Beena, K.S. Numerical Modelling of Reinforced Soil Structures Through Live Projects. Indian Geotech. J. 2022, 52, 1171–1181. [Google Scholar] [CrossRef]
  22. Cai, F. Finite element modeling of mechanical behavior of geogrid reinforced soil retaining walls. Proc. Indian Natl. Sci. Acad. 2025, 91, 484–497. [Google Scholar] [CrossRef]
  23. Jiang, Y.; Han, J.; Zornberg, J.; Parsons, R.L.; Leshchinsky, D.; Tanyu, B. Numerical analysis of field geosynthetic-reinforced retaining walls with secondary reinforcement. Geotechnique 2019, 69, 122–132. [Google Scholar] [CrossRef]
  24. Damians, I.P.; Bathurst, R.J.; Olivella, S.; Lloret, A.; Josa, A. 3D modelling of strip reinforced MSE walls. Acta Geotech. 2021, 16, 711–730. [Google Scholar] [CrossRef]
  25. Jiang, H.; Zhou, X.; Xiao, Z. Stability of Extended Earth Berm for High Landfill. Appl. Sci. 2020, 10, 6281. [Google Scholar] [CrossRef]
  26. Koerner, R.M.; Soong, T.Y. Leachate in landfills: The stability issues. Geotext. Geomembr. 2000, 18, 293–309. [Google Scholar] [CrossRef]
  27. Scotland, I.; Dixon, N.; Frost, M.; Wackrow, R.; Fowmes, G.J.; Horgan, G. Measuring deformation performance of geogrid reinforced structures using a terrestrial laser scanner. In Proceedings of the 10th International Conference of Geosynthetics, Berlin, Germany, 21–25 September 2014. [Google Scholar]
  28. Helwany, S.M.B.; Reardon, G.; Wu, J.T.H. Effects of backfill on the performance of GRS retaining walls. Geotext. Geomembr. 1999, 17, 1–16. [Google Scholar] [CrossRef]
  29. Mirmoradi, S.H.; Ehrlich, M. Numerical Simulation of Compaction-Induced Stress for the Analysis of RS Walls under Working Conditions. Geotext. Geomembr. 2018, 46, 354–365. [Google Scholar] [CrossRef]
  30. Mirmoradi, S.H.; Ehrlich, M. Modeling of the compaction-induced stress on reinforced soil walls. Geotext. Geomembr. 2015, 43, 82–88. [Google Scholar] [CrossRef]
  31. Ehrlich, M.; Mirmoradi, S.H.; Saramago, R.P. Evaluation of the effect of compaction on the behavior of geosynthetic-reinforced soil walls. Geotext. Geomembr. 2012, 34, 108–115. [Google Scholar] [CrossRef]
  32. Ambauen, S.; Leshchinsky, B.; Xie, Y.; Rayamajhi, D. Service-state behavior of reinforced soil walls supporting spread footings: A parametric study using finite-element analysis. Geosynth. Int. 2016, 23, 156–170. [Google Scholar] [CrossRef]
  33. Khan, A.R.; Di Emidio, G. Reinforced Fill Structure with Alternative Fill Materials: An Application of Geogrid Creep Strain Analysis Using Numerical Modeling. Materials 2025, 18, 1346. [Google Scholar] [CrossRef]
  34. Khan, A.R.; Di Emidio, G. Numerical analysis using FEM on the behavior of reinforced fill structure having geogrid and steel wire mesh as a reinforcing element. In Geosynthetics: Leading the Way to a Resilient Planet; CRC Press: Rome, Italy, 2023; pp. 991–996. [Google Scholar] [CrossRef]
  35. BS 8006-1:2010+A1:2016; Code of Practice for Strengthened/Reinforced Soils and Other Fills. BSI Standards Publication: London, UK, 2016.
  36. Lelli, M.; Laneri, R.; Rimoldi, P. Innovative reinforced soil structures for high walls and slopes combining polymeric and metallic reinforcements. Procedia Eng. 2015, 125, 397–405. [Google Scholar] [CrossRef]
  37. Maccaferri. FAQ on PLAXIS FEM. Available online: https://www.maccaferri.com/faq-on-plaxis-fem/ (accessed on 1 October 2023).
  38. BS EN 14475:2006; Execution of Special Geotechnical Works—Reinforced Fill. BSI Standards Publication: London, UK, 2004.
  39. Rowe, R.K.; Yu, Y. Magnitude and significance of tensile strains in geomembrane landfill liners. Geotext. Geomembr. 2019, 47, 439–458. [Google Scholar] [CrossRef]
  40. Hatami, K.; Bathurst, R.J. Parametric analysis of reinforced soil walls with different backfill material properties. In Proceedings of the NAGS’ Conference, Las Vegas, NV, USA, 1–3 December 2006; pp. 1–15. [Google Scholar]
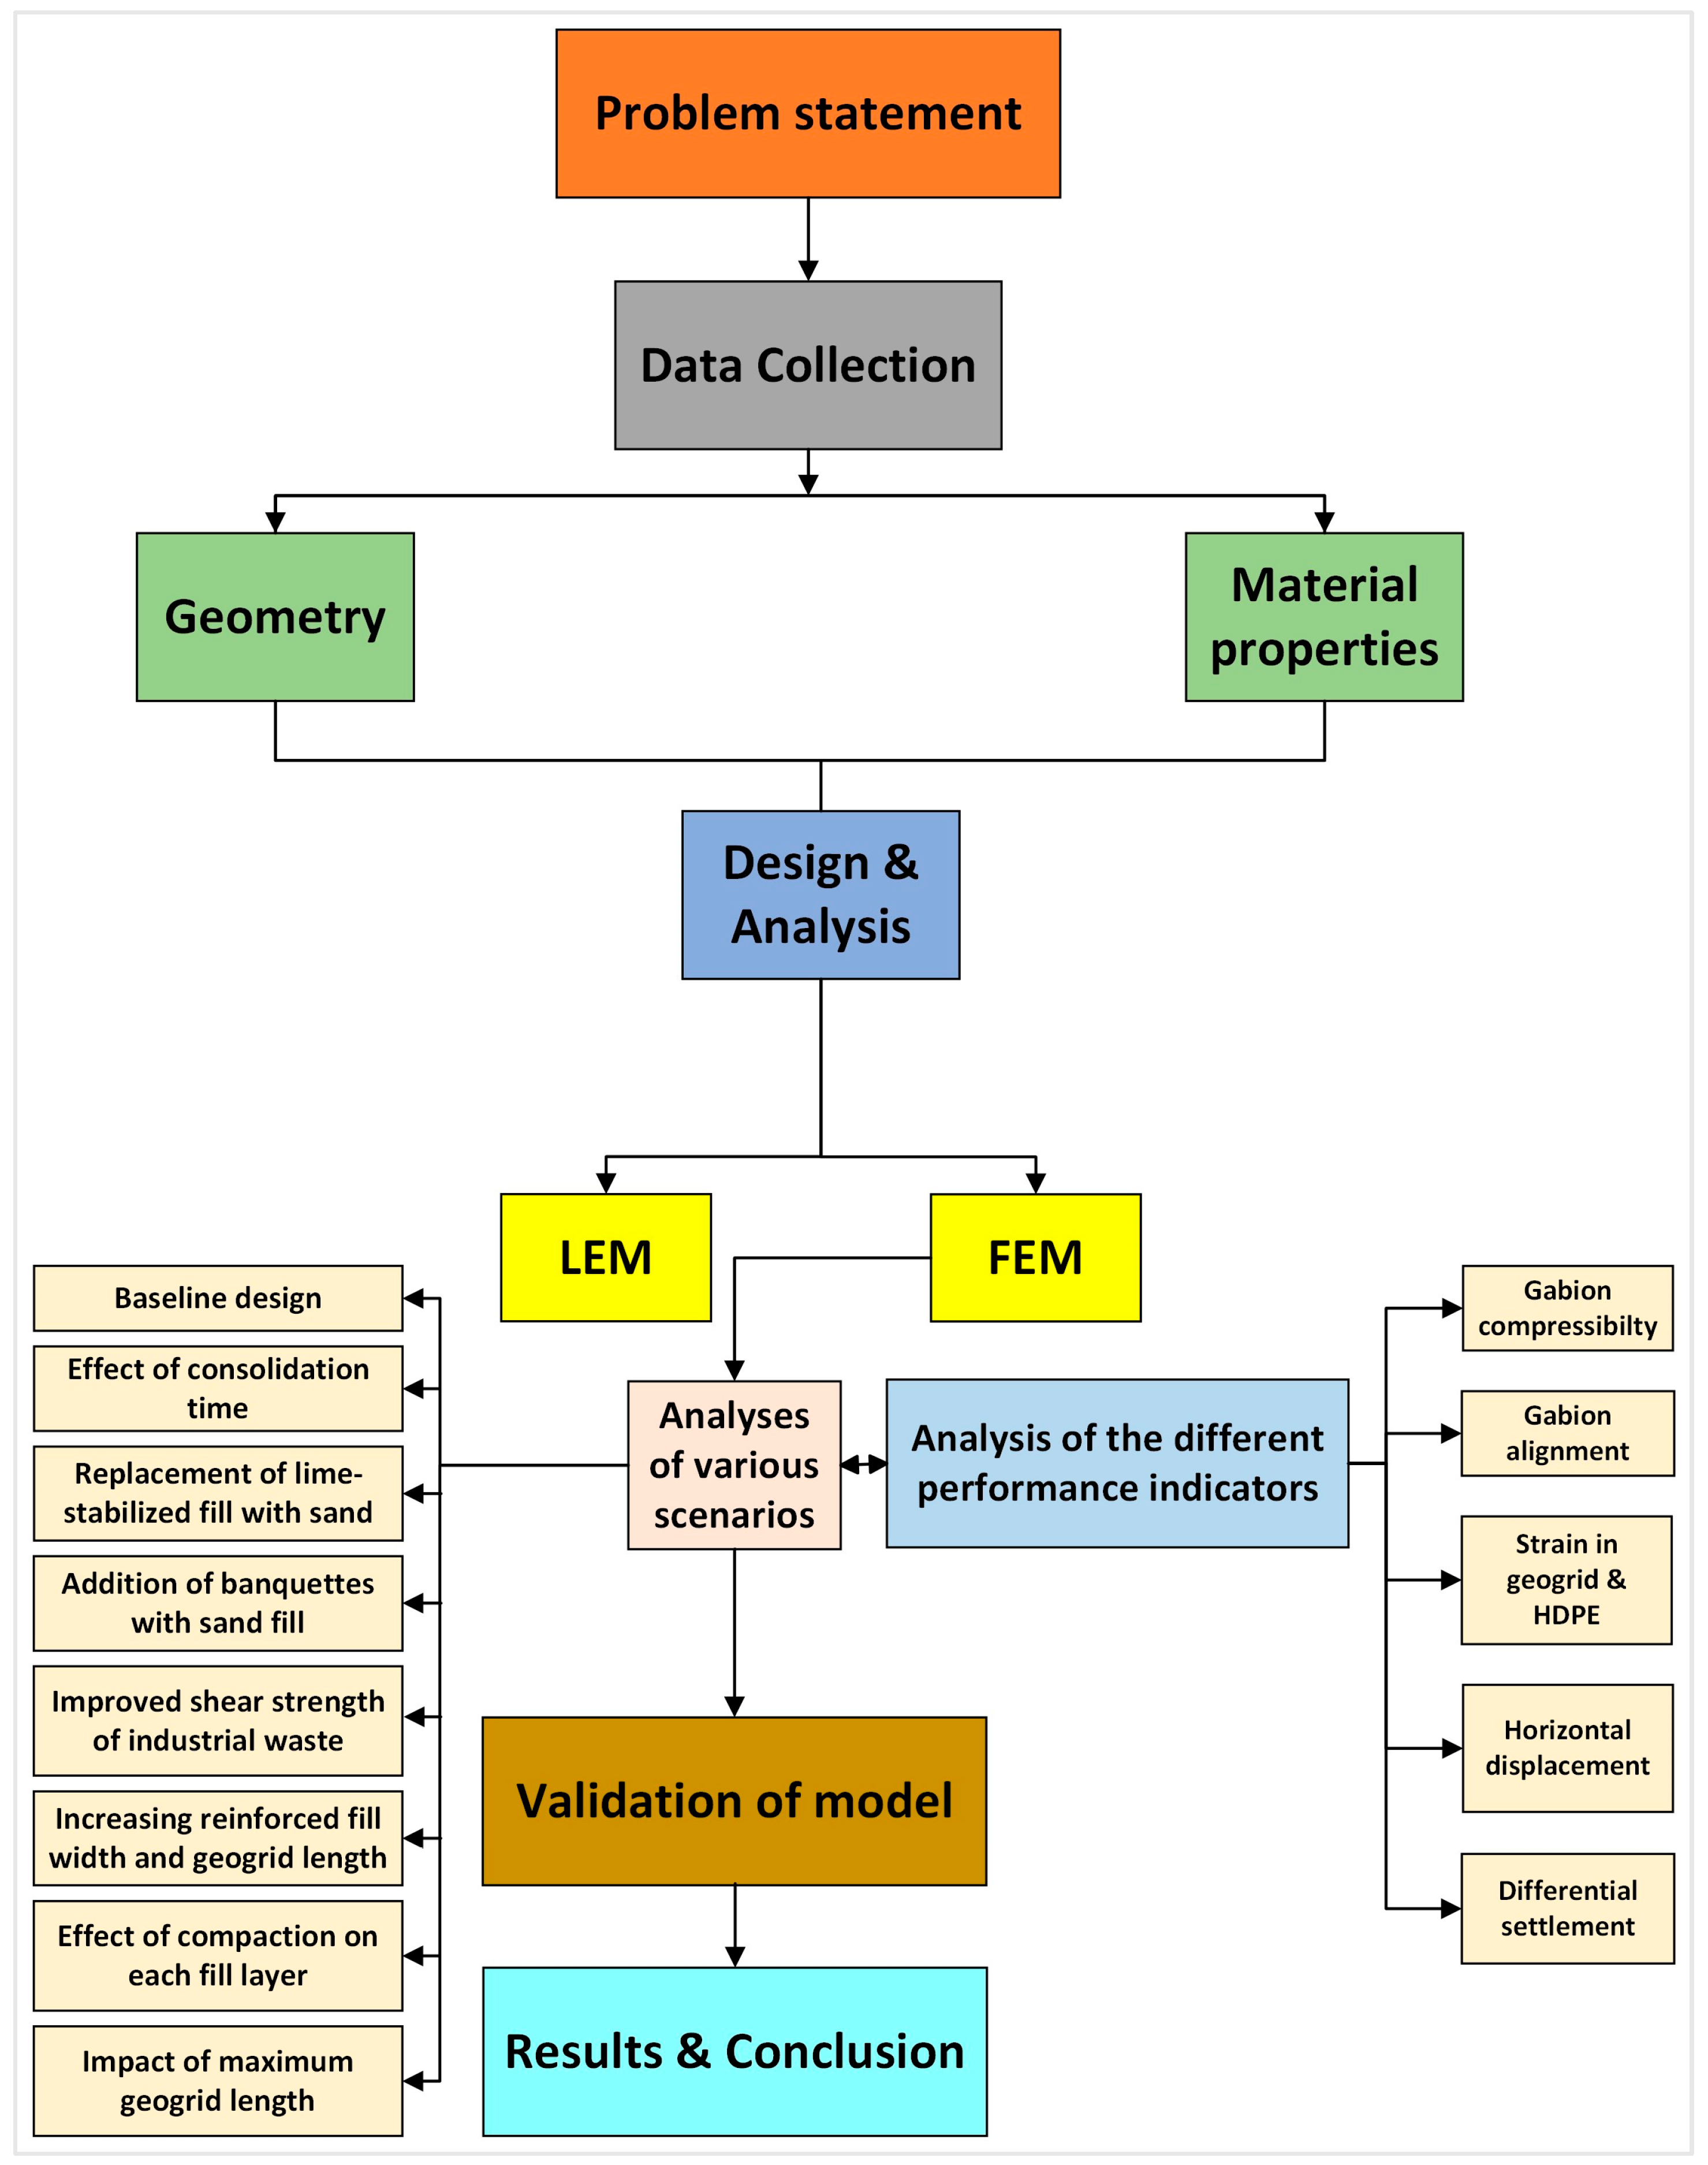
Figure 1. Research methodology.
Buildings 15 03853 g001
Figure 2. Numerical model of a Reinforced fill structure in Plaxis.
Buildings 15 03853 g002
Figure 3. Schematic representation of the different case scenarios analyzed in this study. (1a) Baseline design, (1b) Effect of consolidation time, (1c) Replacement of lime-stabilized fill with sand, (1d) Addition of banquettes with sand fill, (1e) Improved shear strength of industrial waste, (2a) Increasing reinforced fill width and geogrid length, (2b) Effect of compaction on each fill layer, and (2c) Impact of maximum geogrid length.
Buildings 15 03853 g003
Figure 4. Full scale wall modelled in Plaxis-2D.
Buildings 15 03853 g004
Figure 5. (a) Facing deformation of the wall along its height. (b) Strain (longitudinal) in %, on different layers of the wall along the length of the geogrid (adapted from our paper [33]).
Buildings 15 03853 g005
Figure 6. Performance indicators obtained from the analysis of the baseline design: (a) Failure mechanism, (b) Horizontal displacement at the toe, (c) Differential settlement under the reinforced fill structure, (d) Geogrid strain, (e) Geomembrane strain, (f) Gabion alignment, (g) Gabion compressibility.
Buildings 15 03853 g006
Figure 7. Comparison of performance indicators across different scenarios: (a) horizontal displacement, (b) differential settlement, (c) geogrid strain, (d) HDPE strain, (e) gabion alignment, and (f) gabion compressibility.
Buildings 15 03853 g007
Table 1. Safety factors obtained from Limit Equilibrium Analysis.
Factor of safety against Sliding1.09 > 1
Factor of safety against Overturning5.14 > 1
Factor of safety against Bearing1.96 > 1
Table 2. Properties of soil for Plaxis-2D.
ϒdry
kN/m3
ϒwet
kN/m3
Modelc’ref
kPa
ϕ’
[°]
Fill (lime stabilized)1819HS2040
Fill (sand)1819HS235
Waste (industrial)17.420HS2030
Clay 11719HS822
Sand 11820HS327
Sand 22020HS235
Clay 21919HS1520
Sand 31618HS230
Sand 41818HS227
Clay 31719HS820
Table 3. (a,b) Properties of geogrid for Plaxis-2D.
PropertyUnitsGeogrid
(a)
Axial StiffnesskN/m23160
Axial forcekN/m2158
Material type---Elastoplastic
(b)
Axial StiffnesskN/m21992
Axial forcekN/m299.6
Material type---Elastoplastic
Table 4. Properties of gabion for Plaxis-2D (adapted from [37]).
PropertyUnitsGabion
Unit weightkN/m318
Angle of internal frictionDegree40
CohesionkPa27
Poisson’s ratio-0.3
Elastic modulusMPa40
Material model-Mohr-Coulomb
Table 5. Properties of wire mesh for Plaxis-2D (adapted from [37]).
PropertiesSymbolUnitsValue
Axial stiffnessEAkN/m62,832
Flexural RigidityEIkNm2/m0.251
WeightWkN/m/m0.023
Poisson’s ratioV-0.3
Maximum bending momentMpkN/m/m0.23
Maximum axial forceNpkN/m135
CohesionCkPa27
Table 6. Limiting values of the performance parameters.
ParameterLimit ValueReference
Horizontal displacement (ux)25 cm Decided by the stakeholders
Differential settlement (δD)2%BS EN 14475:2006 [38]
Geogrid strain5%BS 8006 [35]
Geomembrane strain3%Rowe & Yu, 2019 [39]
Gabion compressibility5%BS EN 14475:2006 [38]
Gabion alignment±100 mmBS EN 14475:2006 [38]
Table 7. tan δ/tan φ friction coefficients for wire mesh and geogrid (adapted from [37]).
Soiltan δ/tan φ
(Wire Mesh)
tan δ/tan φ
(Geogrid)
Clay0.30.4
Silt0.40.7
Sand0.650.9
Gravel0.90.9
Table 8. Material properties of soil for the full-scale wall model for Plaxis.
PropertySymbolValue
DensityΡ1680 kg/m3
Angle of internal frictionØ44°
Dilation angleΨ11°
CohesionC1 kPa
Poisson’s ratiov0.3
Young’s modulusE48 MPa
Table 9. Material properties of concrete facing for the full-scale wall model for Plaxis.
PropertySymbolValue
Young’s modulusE20 MPa
Poisson’s ratiov0.2
Densityρ2500 kg/m3
Table 10. Material properties of geogrid for the full-scale wall model for Plaxis.
PropertySymbolValue
Axial stiffnessEA119 kN/m
Young’s modulusE37.8 MPa
Poisson’s ratiov0.5
Table 11. Effect of different scenarios on performance indicators.
ScenarioConsolidation TimeProperties of
Industrial Waste
C (kPa), Ø (°)
Properties of Fill
Cohesion (kPa),
Friction Angle (°)
Horizontal
Displacement
Differential
Settlement
cm/m
Strain in HDPE
%
Strain in
Geogrid
Gabion
Alignment
Gabion
Compressibility
(Left)
cm
(Right)
cm
Left
%
Right
%
(Left)
cm
(Right)
cm
Left
%
Right
%
1a.3 m/yearC = 20,
Ø = 30
Local fill stabilized with limeC = 20, Ø = 40
E = 30 × 103 kPa
47 55 1.8 1.80.90.99.59.63.82.5
1b.5 m/yearC = 20,
Ø = 30
Local fill stabilized with limeC = 20, Ø = 40
E = 30 × 103 kPa
53631.72.210.9 992.93
1c.3 m/yearC = 20,
Ø = 30
SandC = 2, Ø = 35
E = 30 × 103 kPa
4957.421.91.2 1.38.28.32.9 3
1d.3 m/yearC = 20,
Ø = 30
sandC = 2, Ø = 35
E = 30 × 103 kPa
43 431.61.61.1 1.1 883 3
1e.3 m/yearC = 30,
Ø = 40
Local fill stabilized with limeC = 20, Ø = 40
E = 30 × 103 kPa
31.536.51.92.0.90.99.19.23.73.7
2a.3 m/yearC = 20,
Ø = 30
Local fill stabilized with limeC = 20, Ø = 40
E = 30 × 103 kPa
39 46.8 1.5 1.80.90.9 11 11 4 4
2b.3 m/yearC = 20,
Ø = 30
Local fill stabilized with limeC = 20, Ø = 40
E = 30 × 103 kPa
3643.51.311116.816.87.37.4
2c.3 m/yearC = 20,
Ø = 30
Local fill stabilized with limeC = 20, Ø = 40
E = 30 × 103 kPa
3946.8 1.5 1.80.90.98 7.743.9
Disclaimer/Publisher’s Note: The statements, opinions and data contained in all publications are solely those of the individual author(s) and contributor(s) and not of MDPI and/or the editor(s). MDPI and/or the editor(s) disclaim responsibility for any injury to people or property resulting from any ideas, methods, instructions or products referred to in the content.