Author Contributions
Conceptualization, Z.L., F.W., Y.C. and L.W.; methodology, Z.L.; F.W., and X.F.; investigation, X.F., Y.C., and F.W.; writing—original draft preparation, X.F., F.W., L.W., and Y.C.; project administration, X.F., Y.C., and W.Y.; and funding acquisition, F.W. All authors have read and agreed to the published version of the manuscript.
Figure 1.
Cross-sectional view of thermal heat testing in the concrete box girder of the 60 m railway (unit: cm).
Figure 1.
Cross-sectional view of thermal heat testing in the concrete box girder of the 60 m railway (unit: cm).
Figure 2.
Measuring points of T1, T2, and T3 sections (unit: cm).
Figure 2.
Measuring points of T1, T2, and T3 sections (unit: cm).
Figure 3.
Test process of 60 m precast concrete box girder of the railway.
Figure 3.
Test process of 60 m precast concrete box girder of the railway.
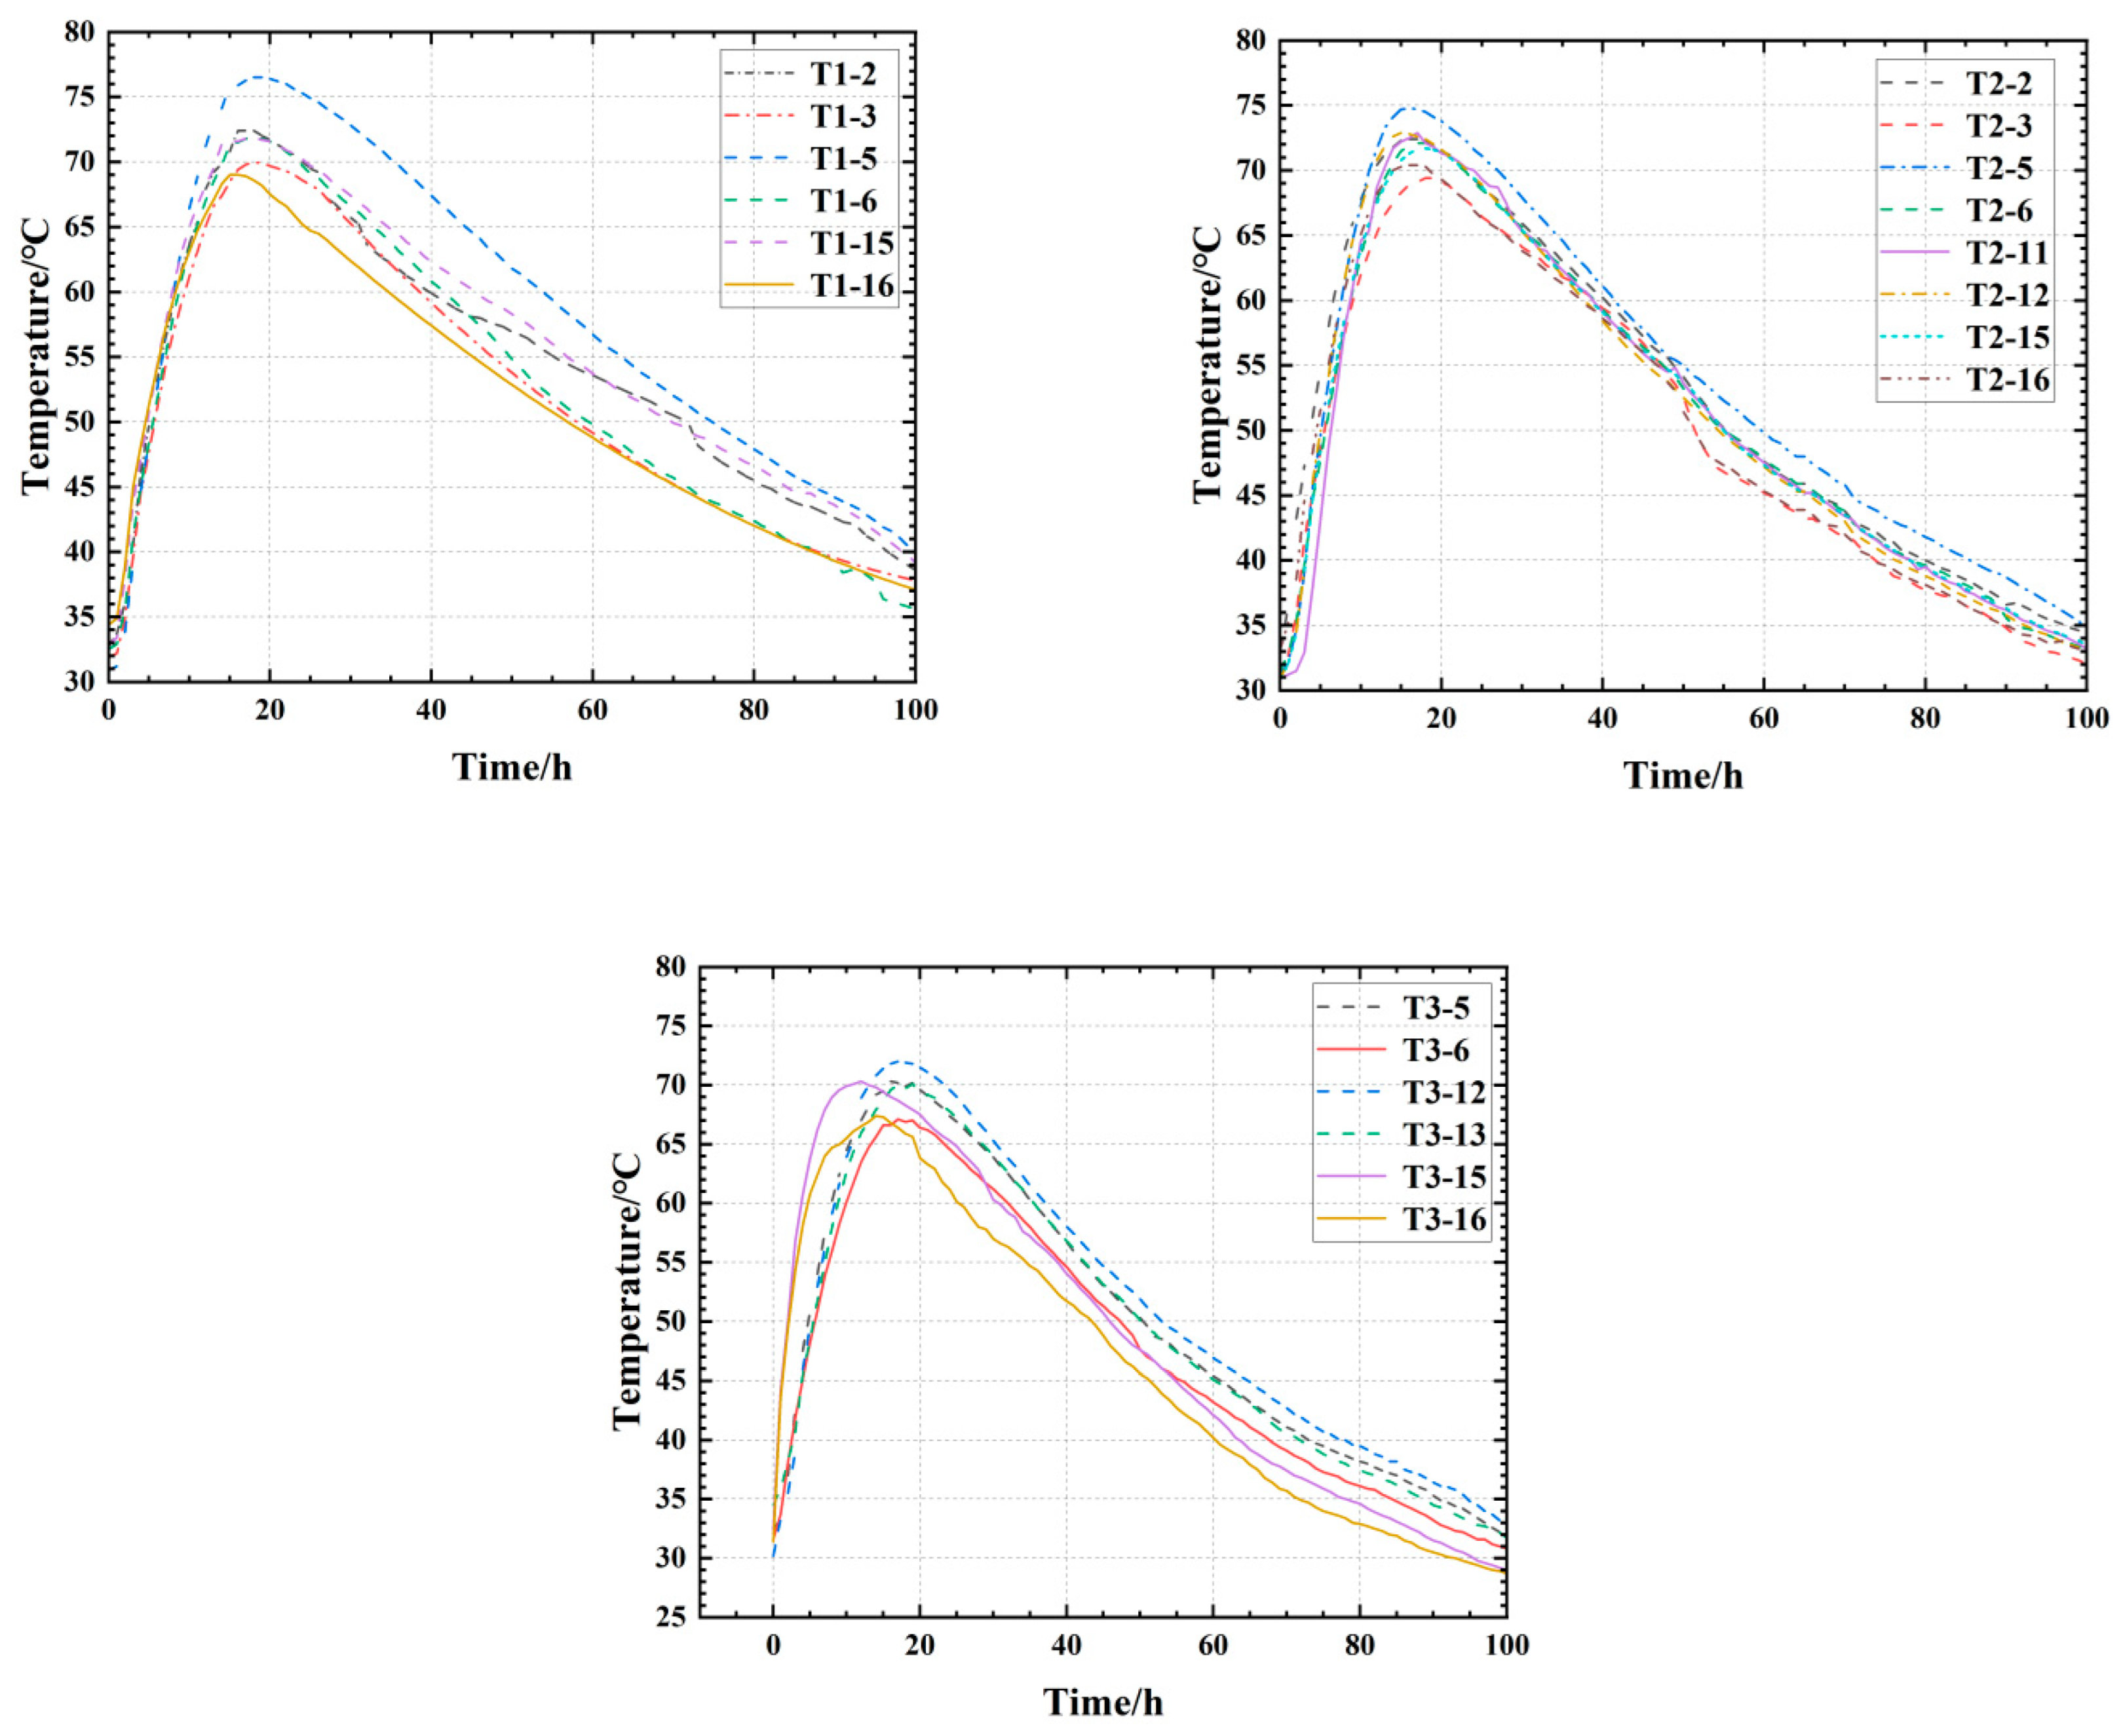
Figure 4.
Measured temperature curves of T1, T2, and T3 sections.
Figure 4.
Measured temperature curves of T1, T2, and T3 sections.
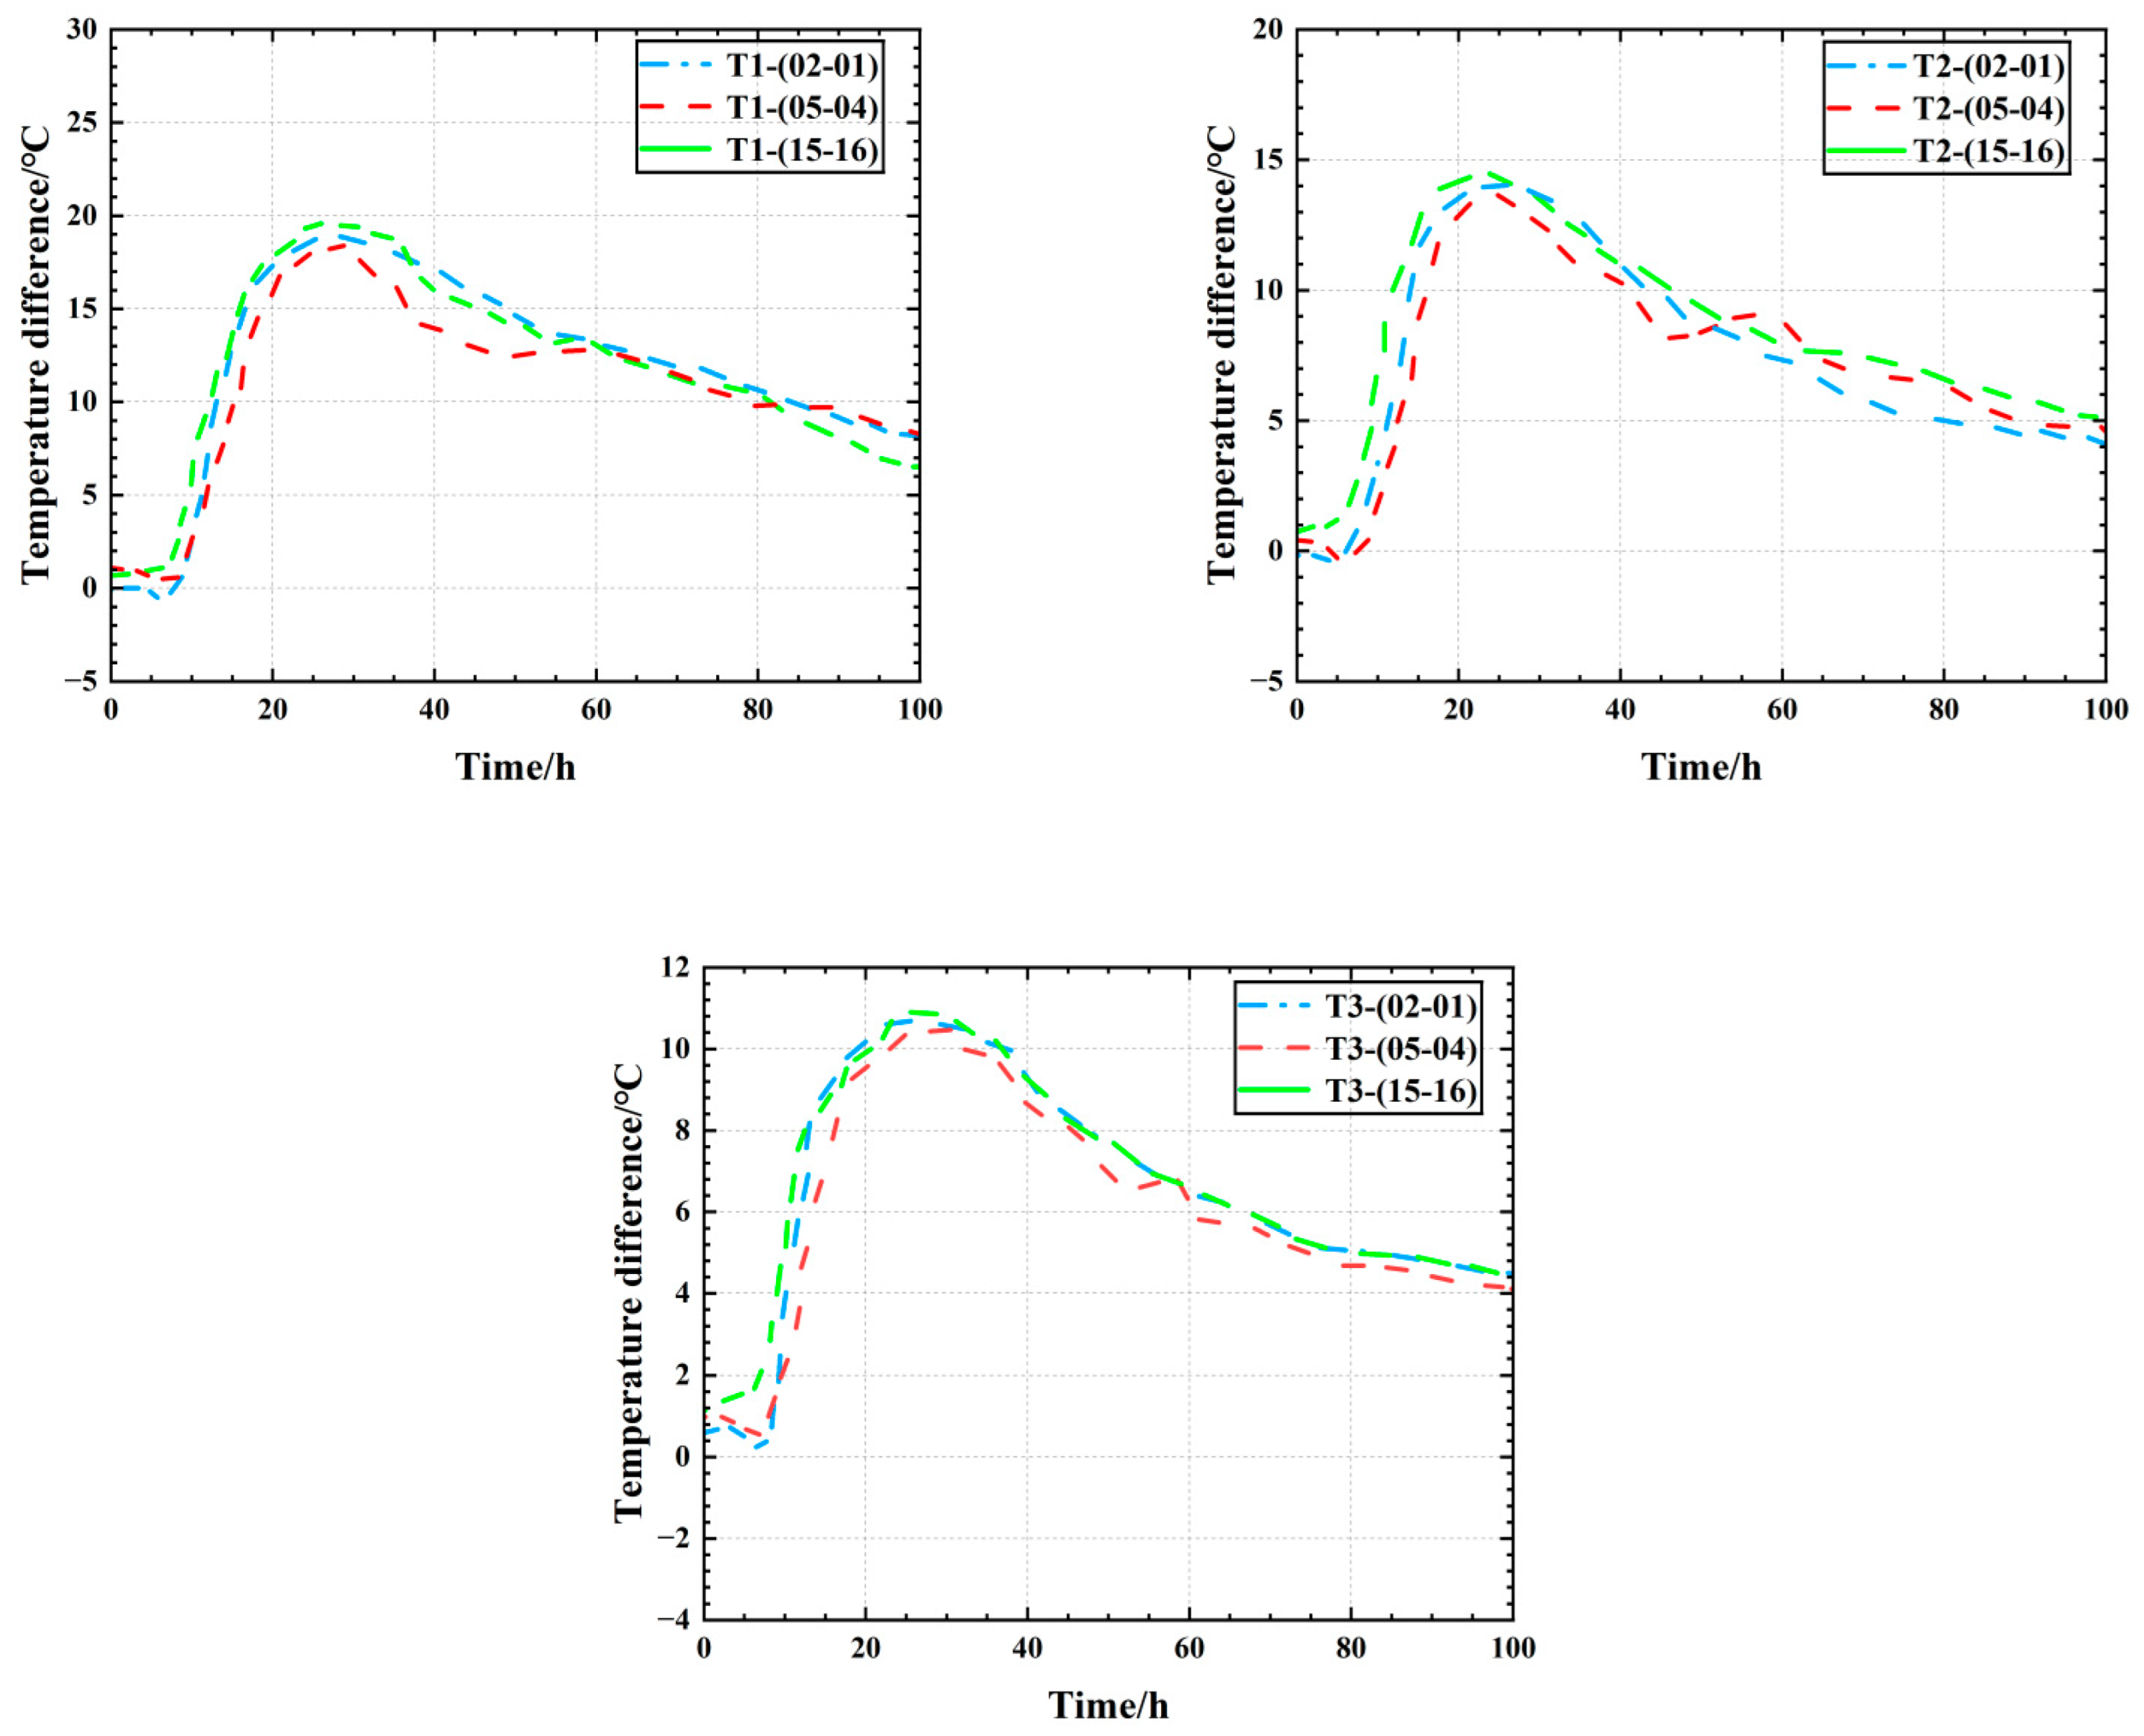
Figure 5.
Measured temperature difference curve of T1, T2, and T3 sections.
Figure 5.
Measured temperature difference curve of T1, T2, and T3 sections.
Figure 6.
Calculation process of the UMATHT subroutine.
Figure 6.
Calculation process of the UMATHT subroutine.
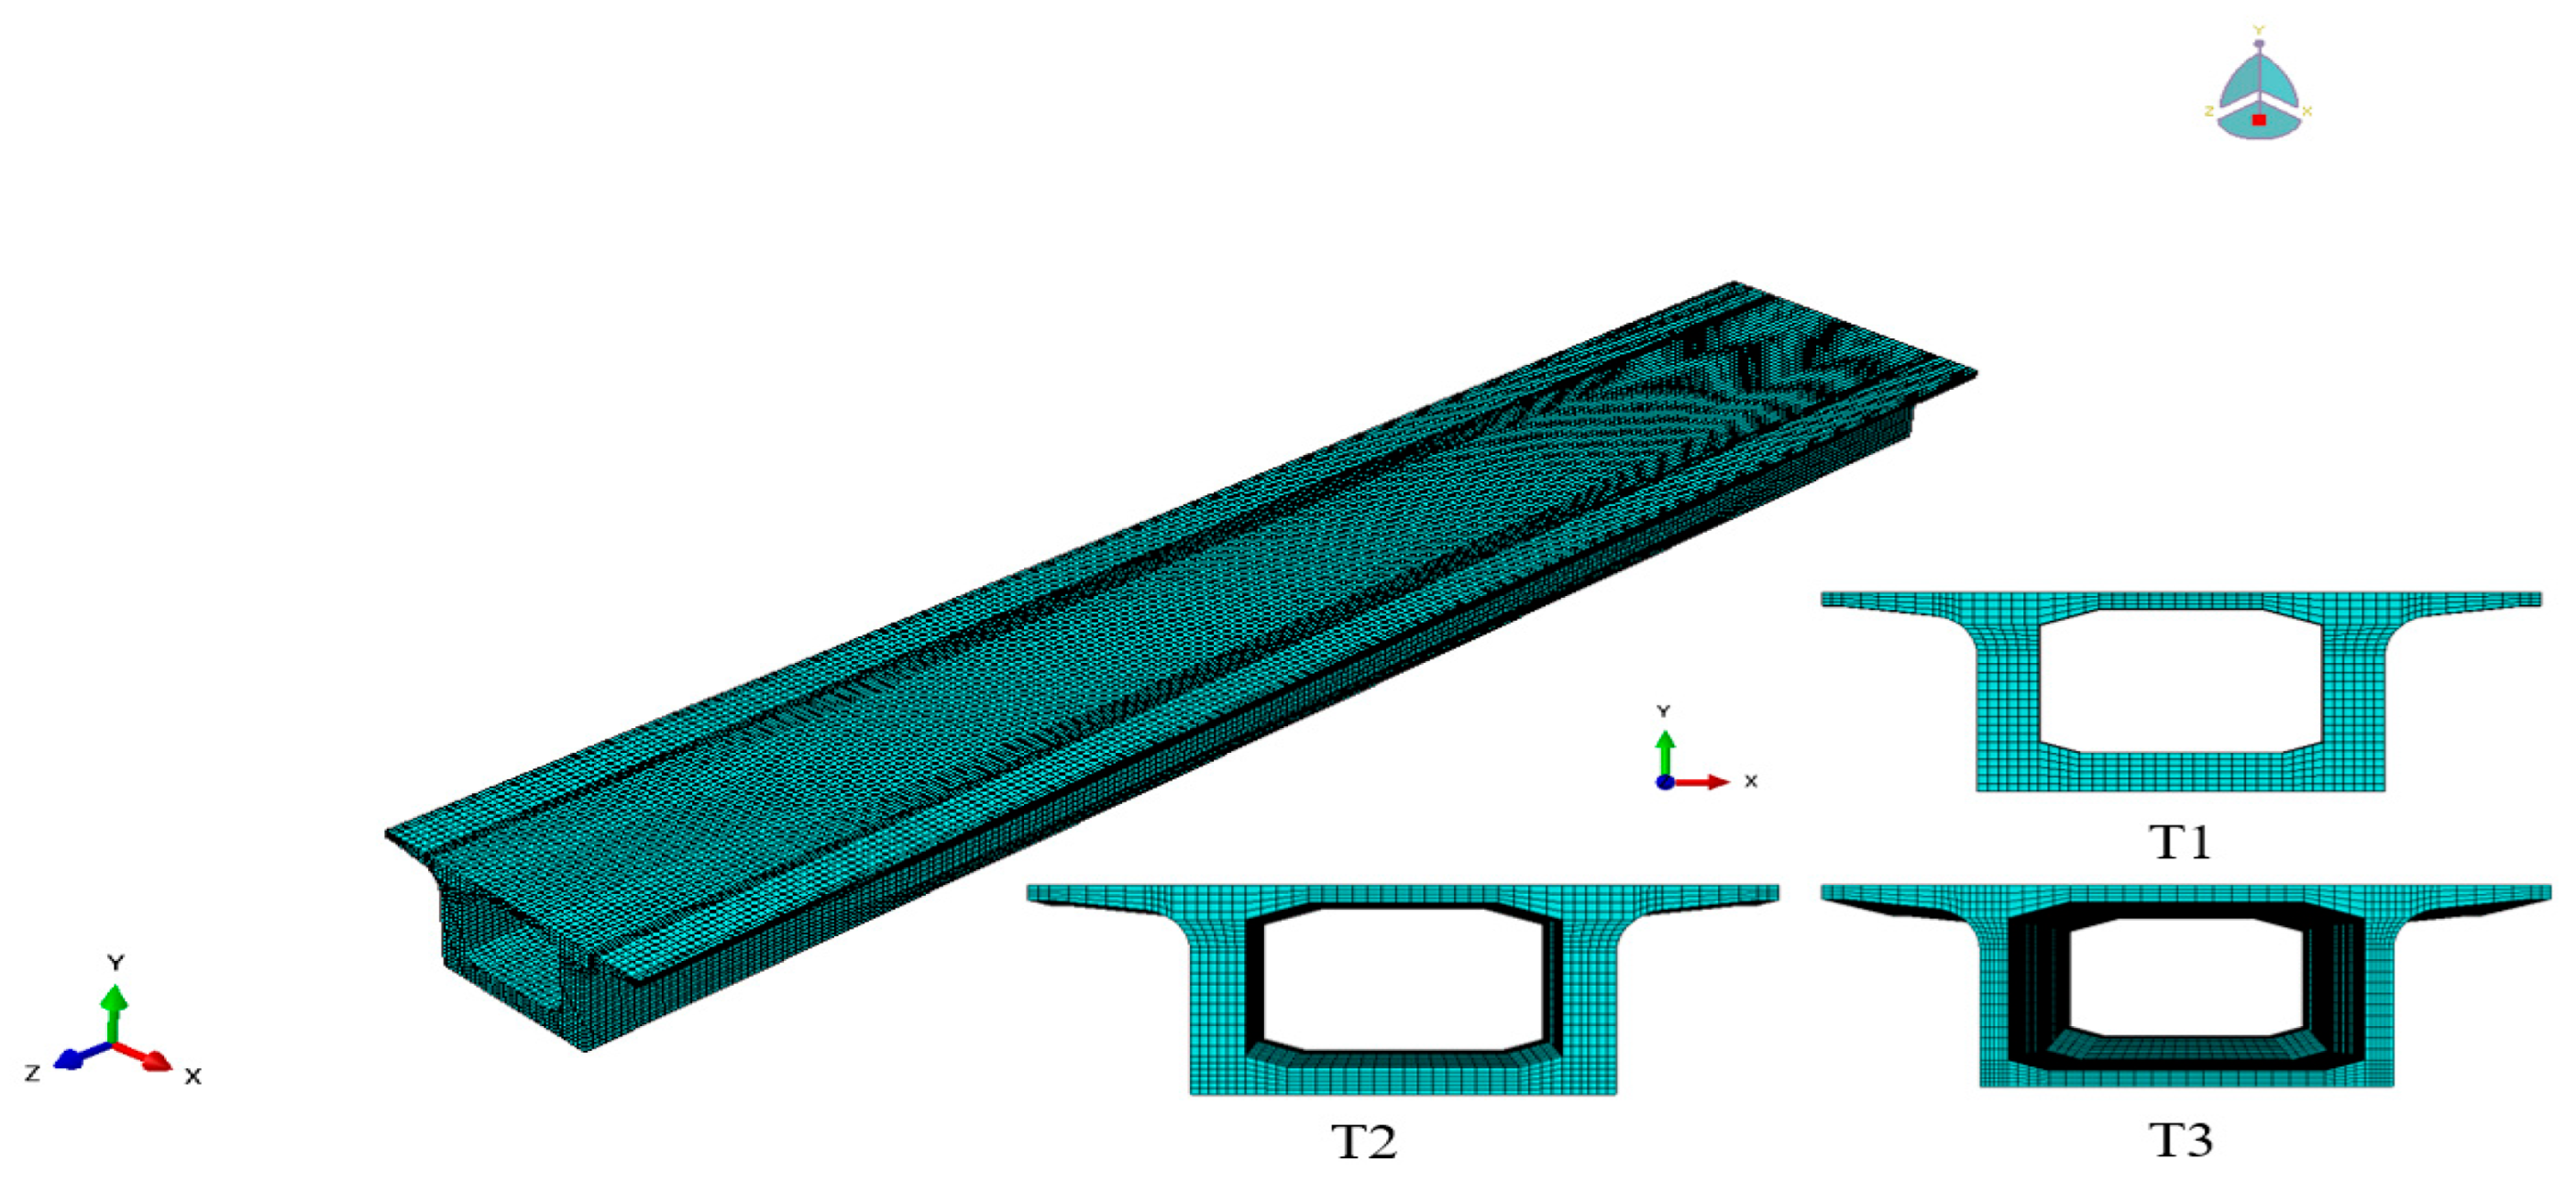
Figure 7.
Finite element model of a 60 m precast concrete box girder for railway applications (The red, green, and blue coordinate arrows represent the positive directions of the X, Y, and Z axes in the global Cartesian coordinate system).
Figure 7.
Finite element model of a 60 m precast concrete box girder for railway applications (The red, green, and blue coordinate arrows represent the positive directions of the X, Y, and Z axes in the global Cartesian coordinate system).
Figure 8.
Ambient temperature.
Figure 8.
Ambient temperature.
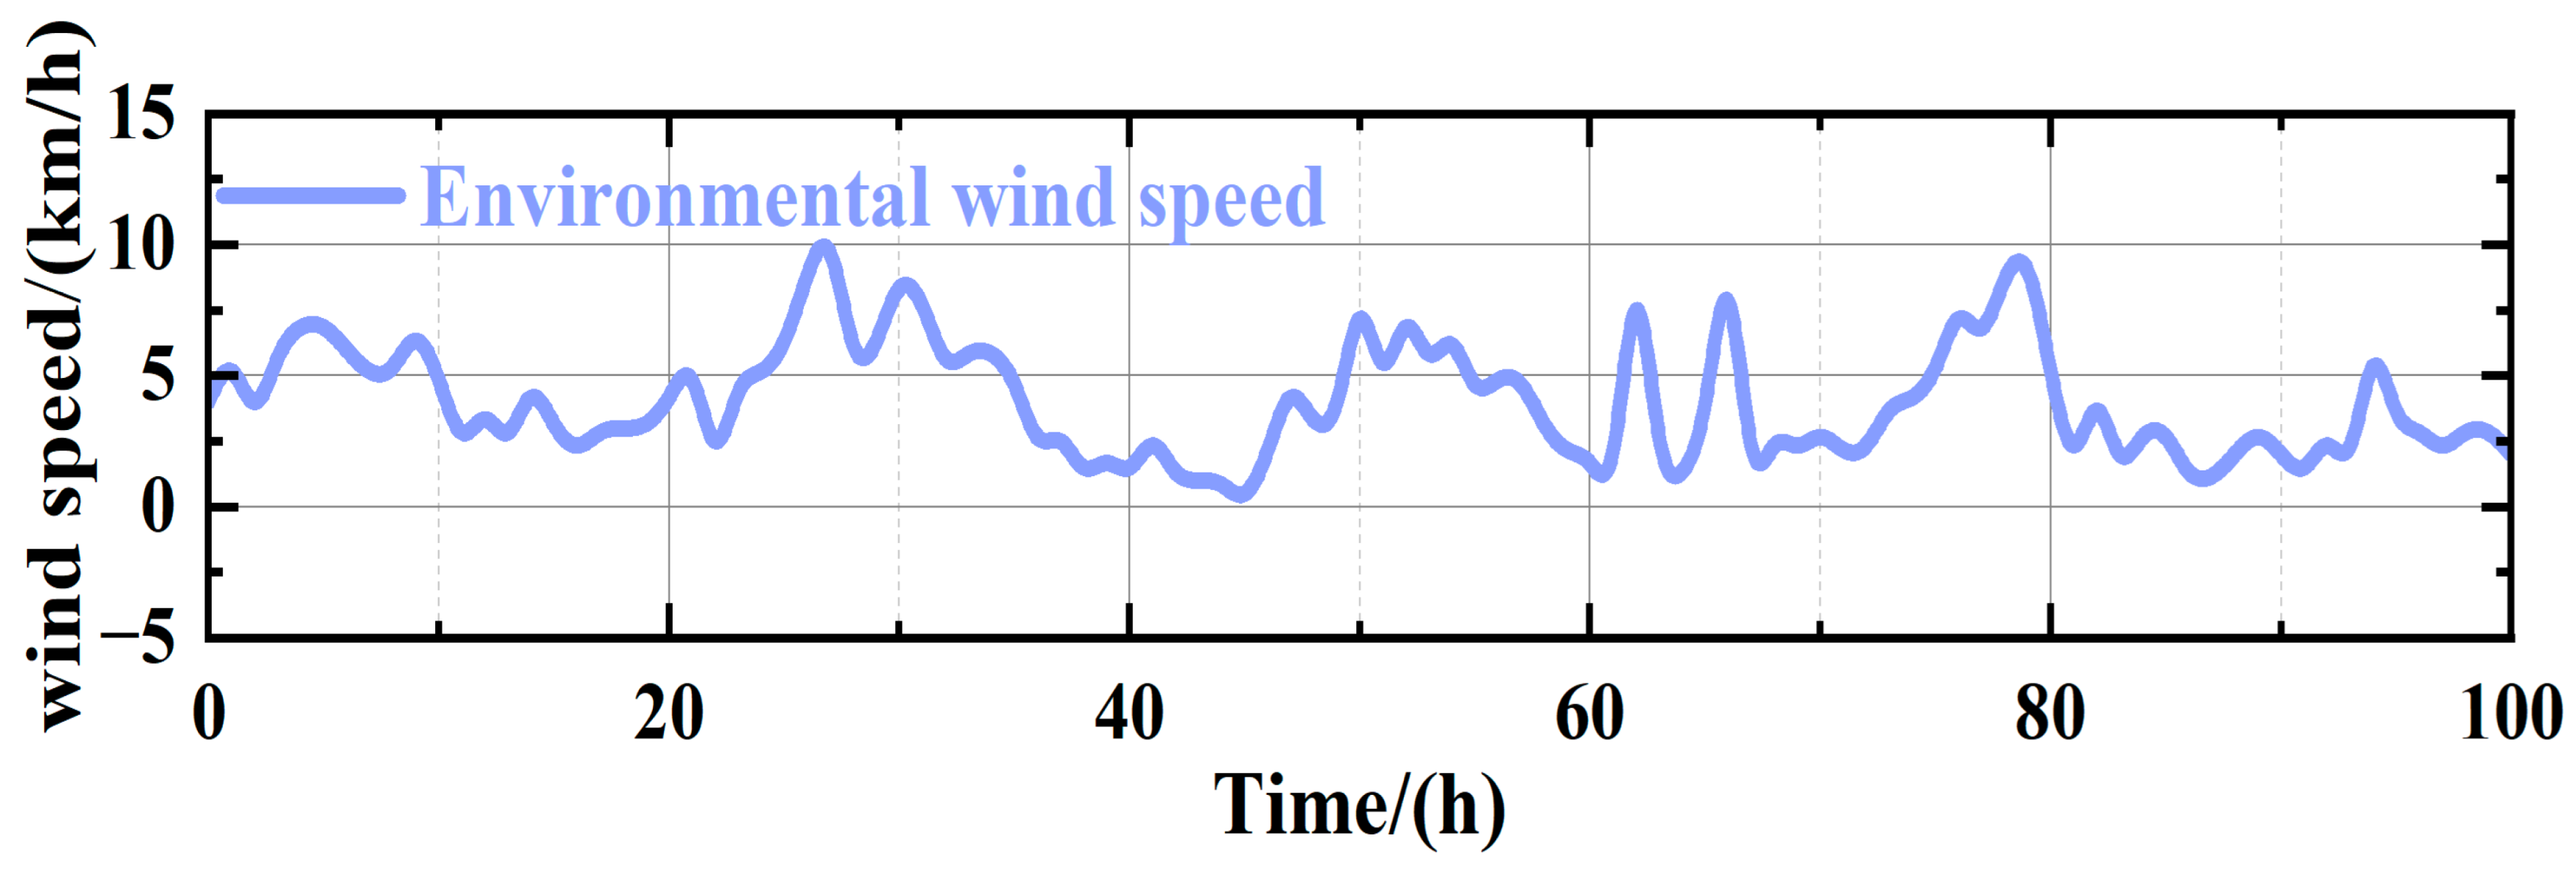
Figure 9.
Environmental wind speed.
Figure 9.
Environmental wind speed.
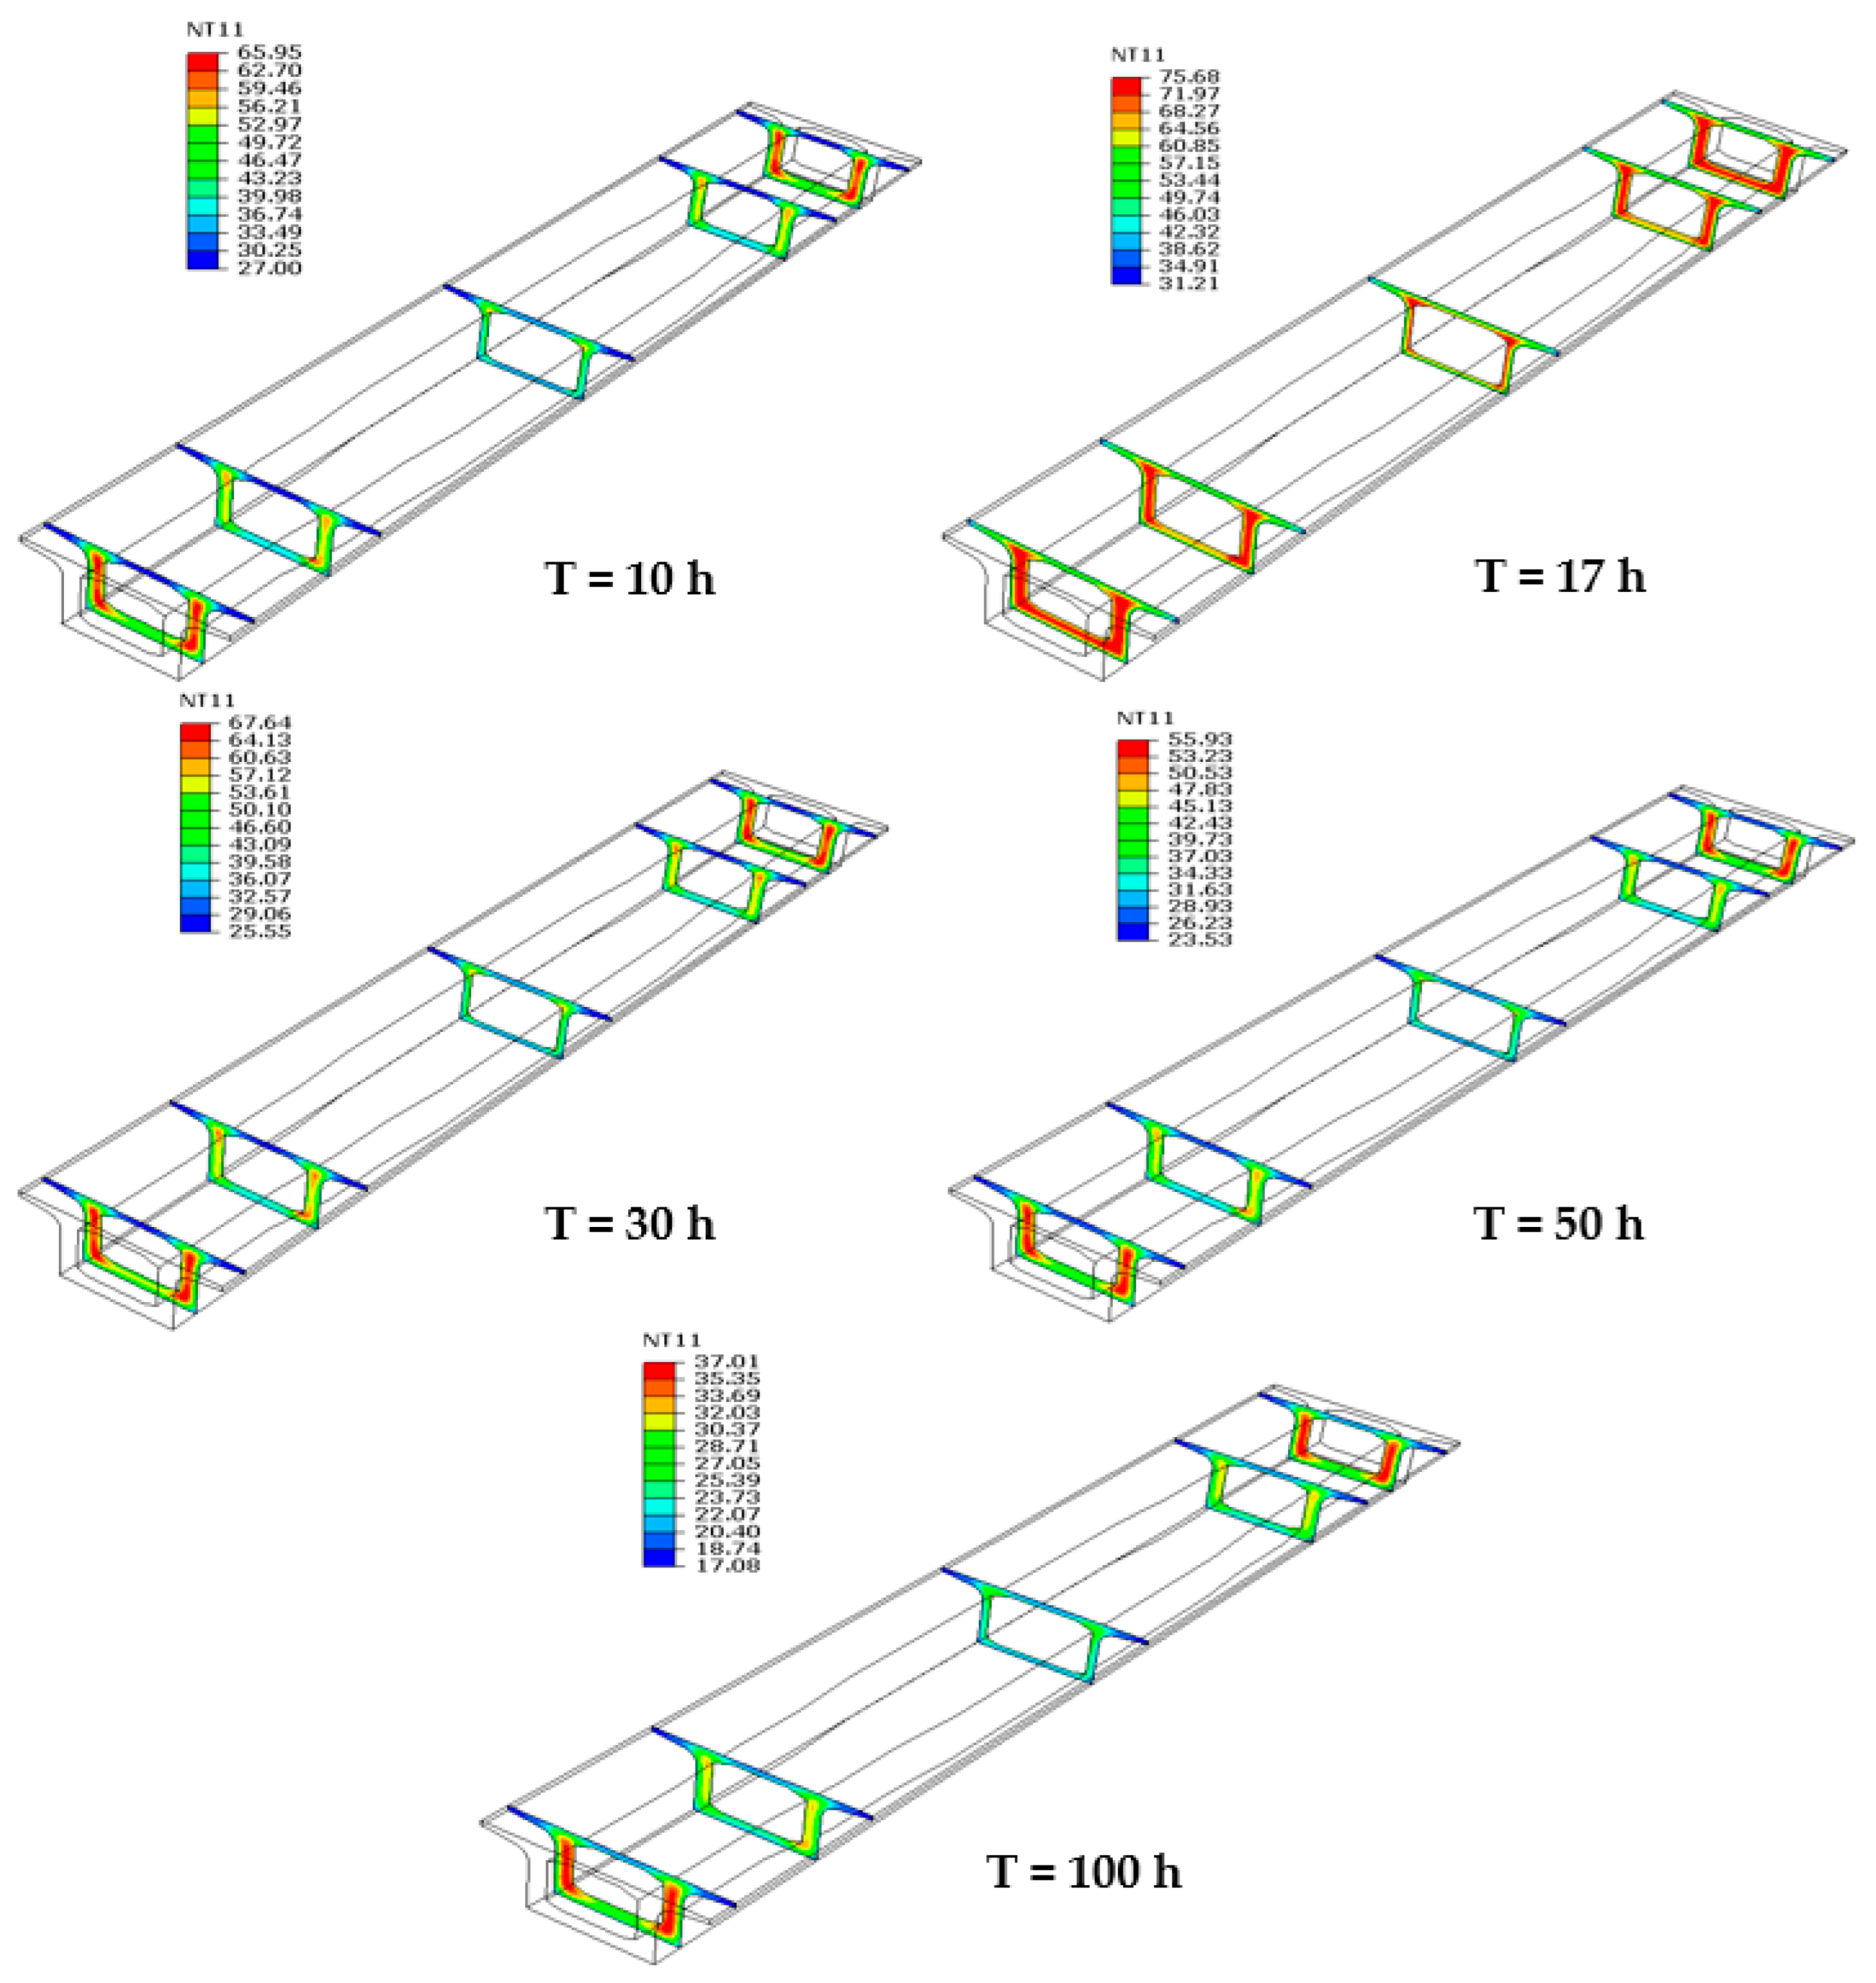
Figure 10.
Time-dependent temperature fields across cross-sections of the 60 m box girder.
Figure 10.
Time-dependent temperature fields across cross-sections of the 60 m box girder.
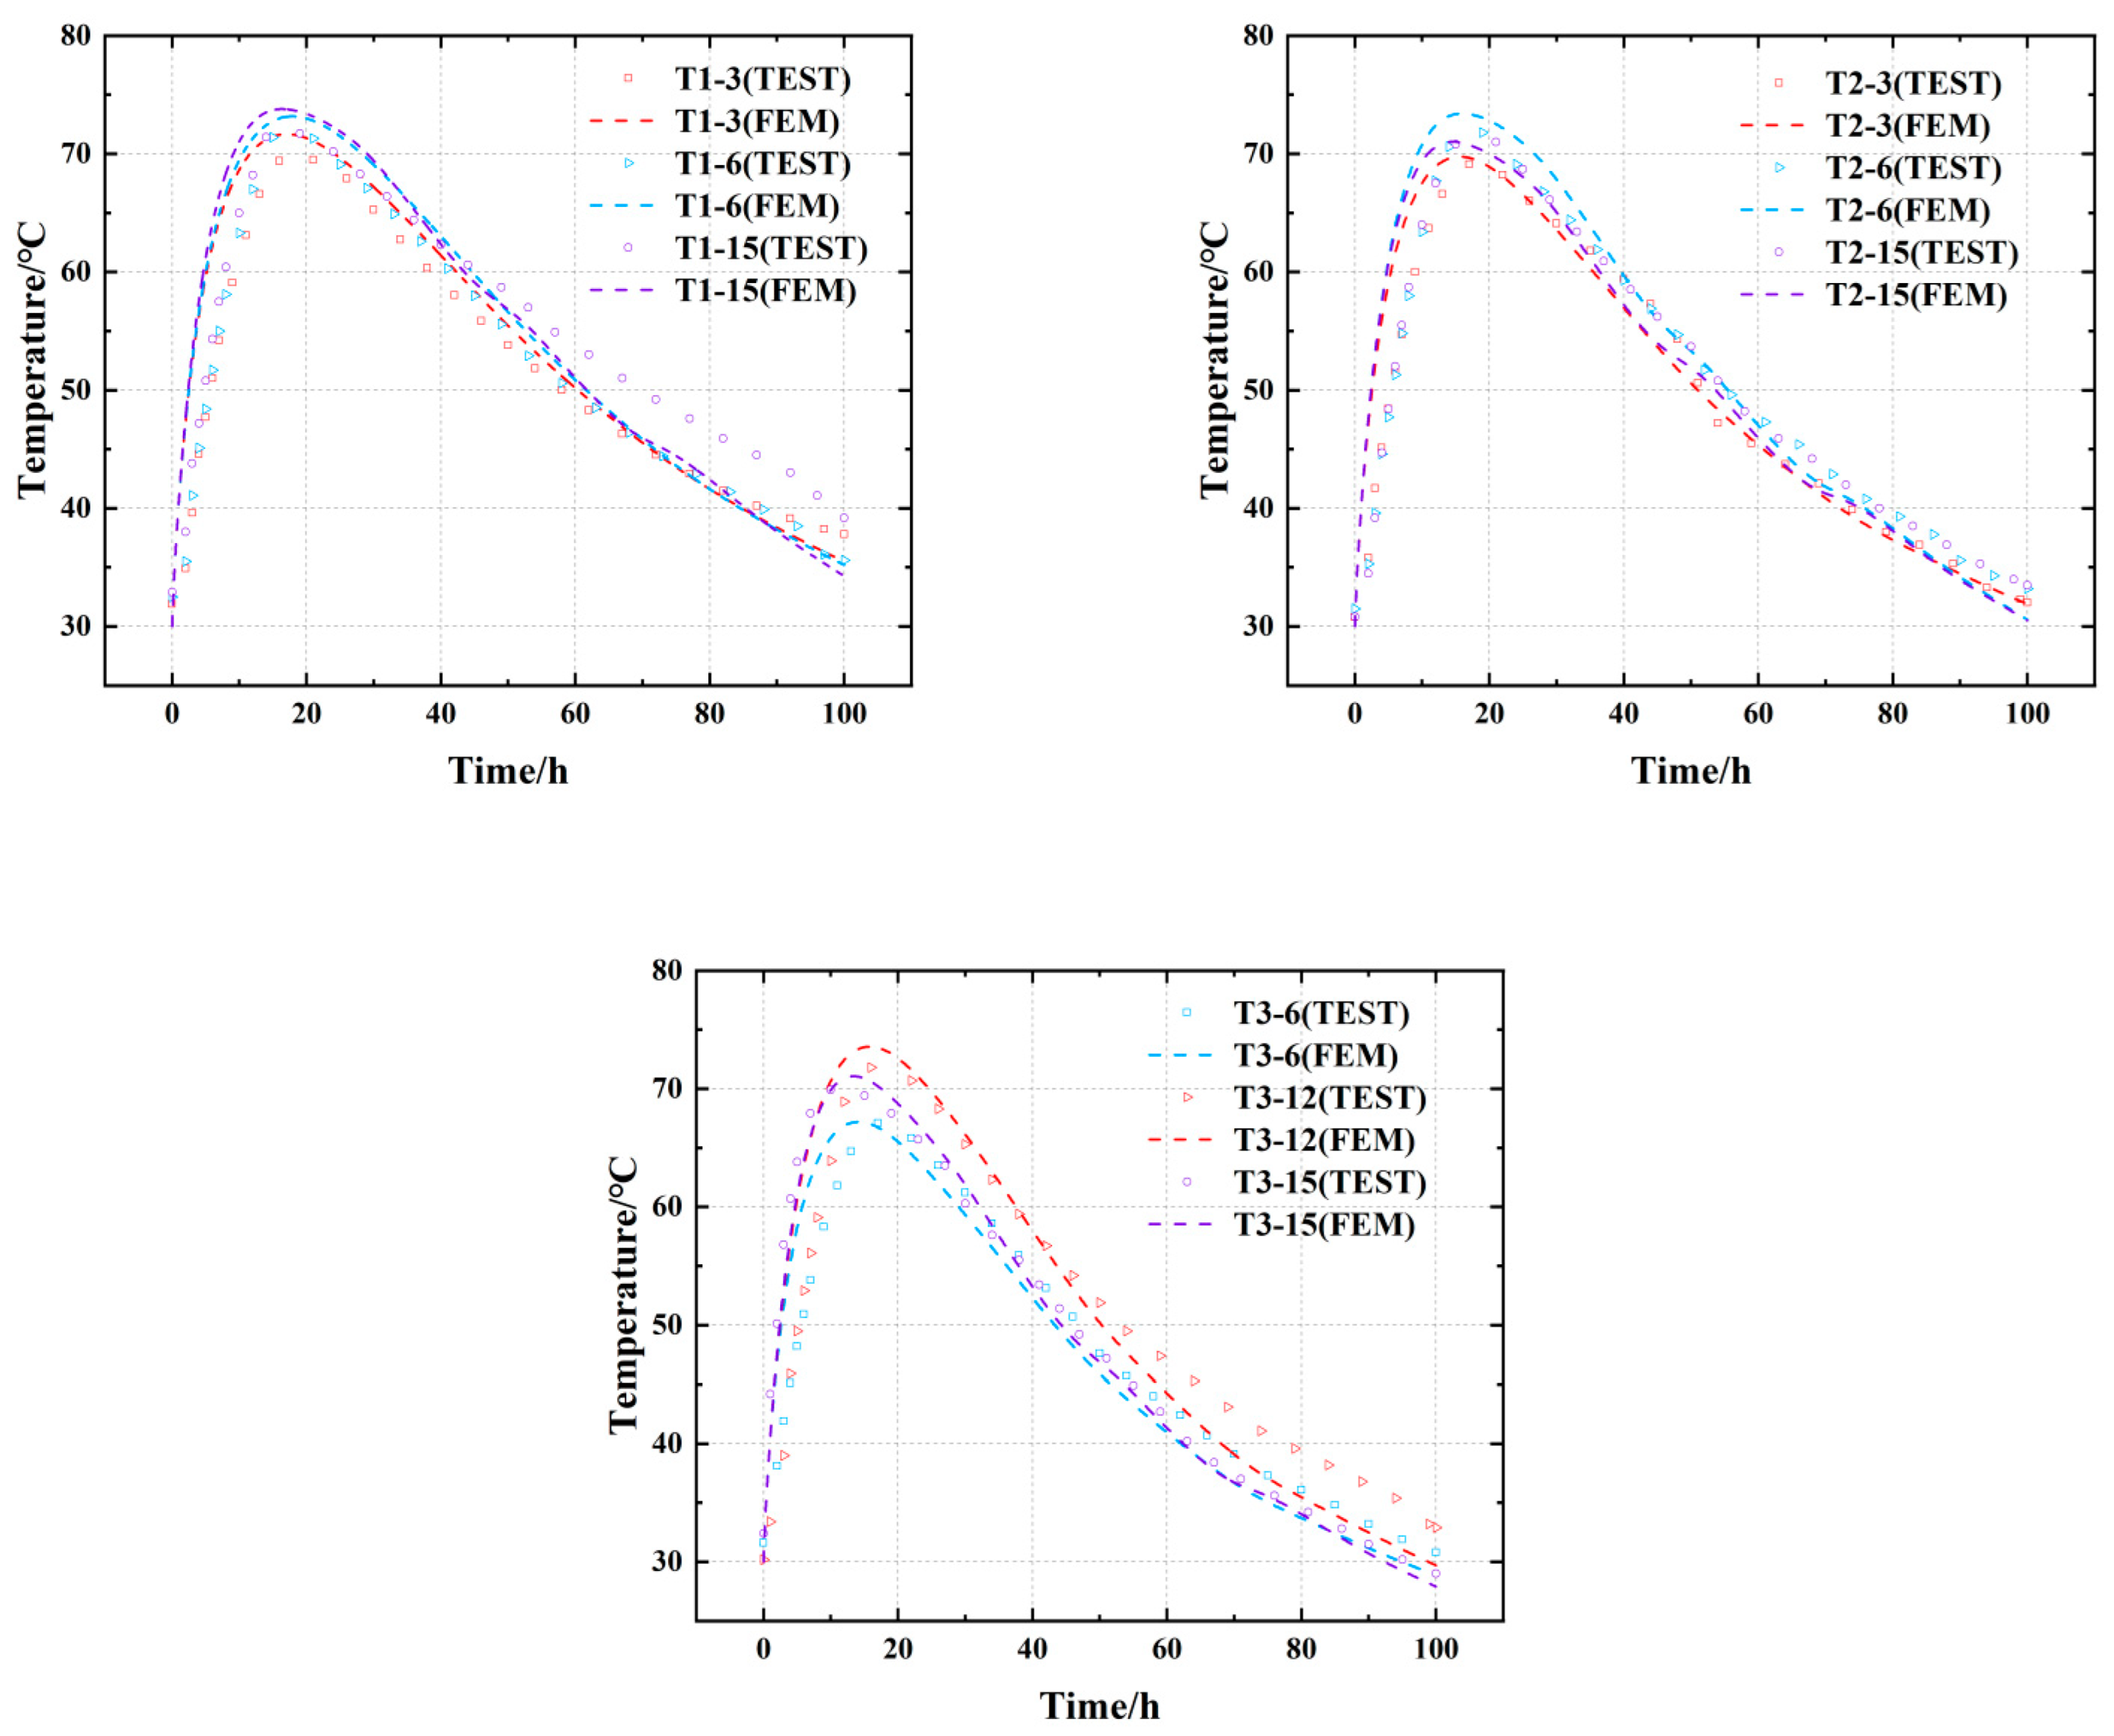
Figure 11.
Comparison of measured values and simulated values of 60 m concrete precast box girder measuring points.
Figure 11.
Comparison of measured values and simulated values of 60 m concrete precast box girder measuring points.
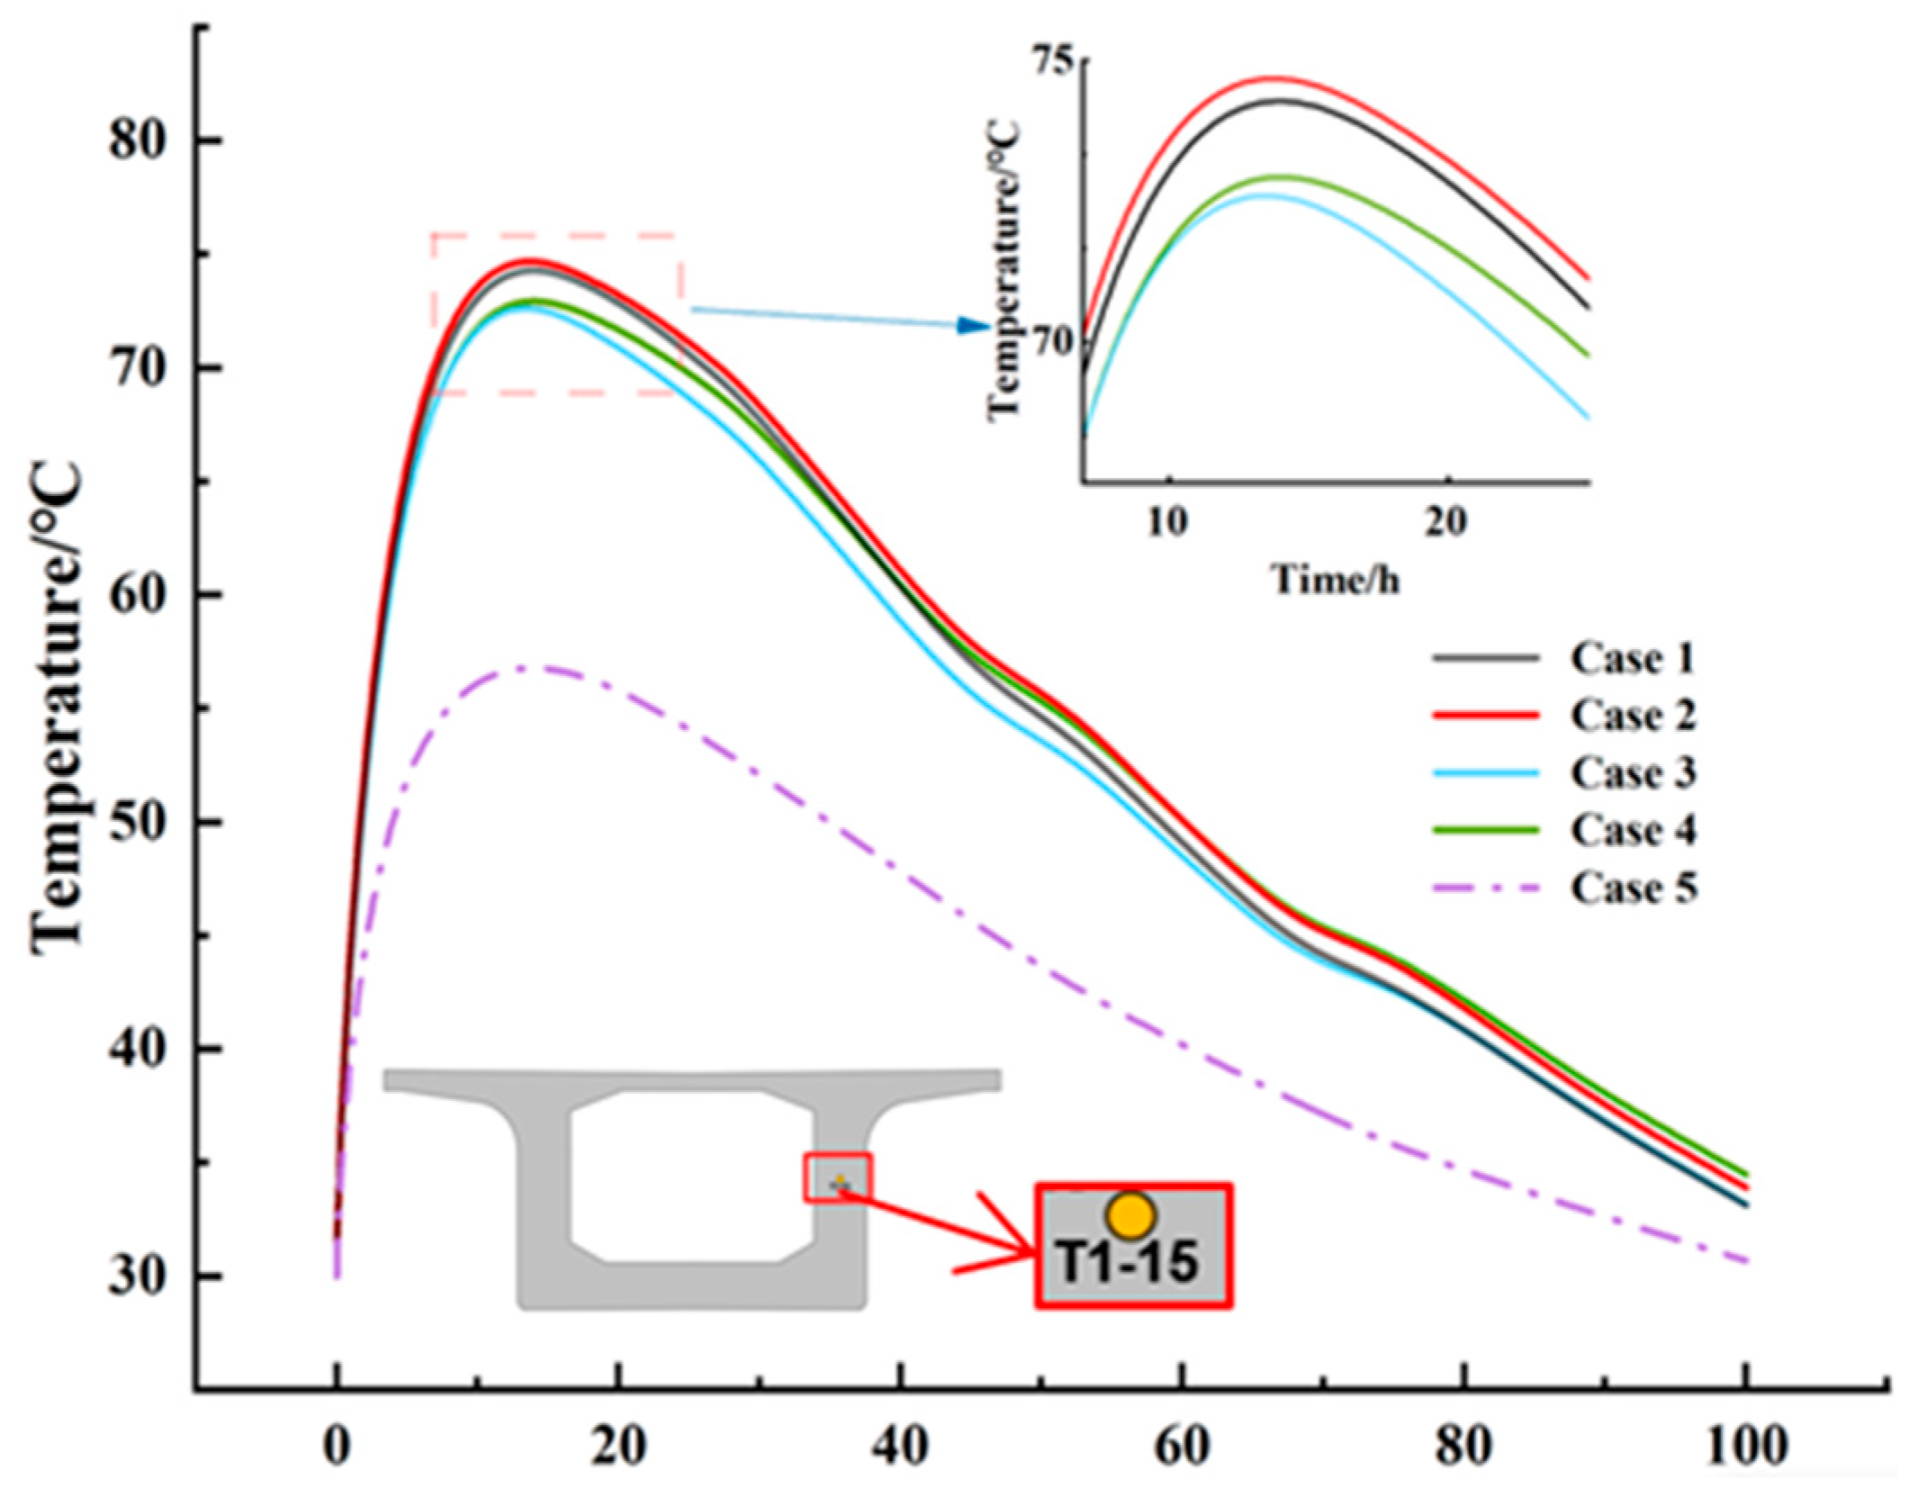
Figure 12.
Temperature variation curve of section T1’s web core under different cases.
Figure 12.
Temperature variation curve of section T1’s web core under different cases.
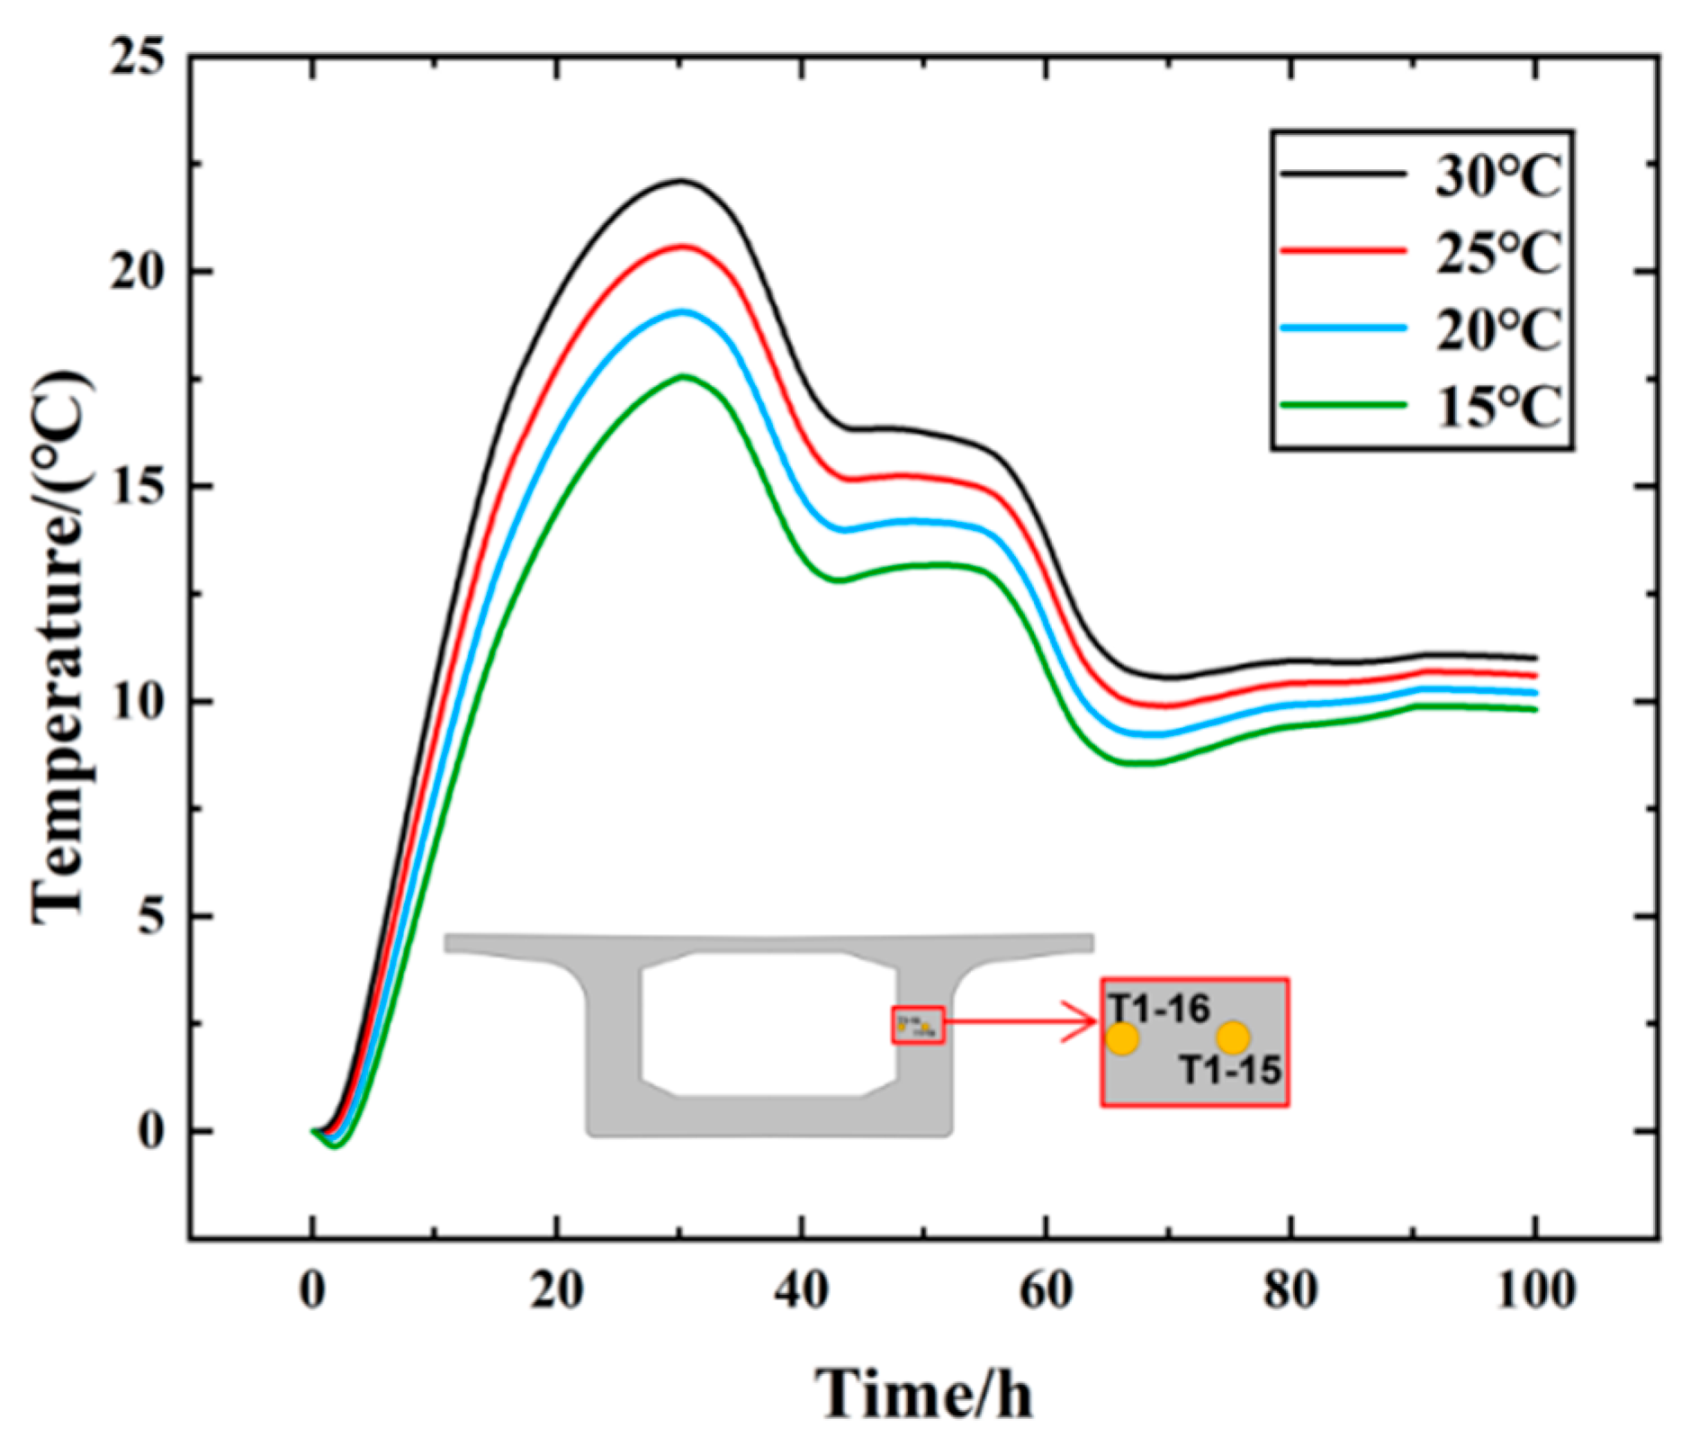
Figure 13.
Variation in different pouring temperatures.
Figure 13.
Variation in different pouring temperatures.
Figure 14.
Peak temperature Tmax and corresponding time T1.
Figure 14.
Peak temperature Tmax and corresponding time T1.
Figure 15.
Curve chart of temperature difference variation in different pouring temperatures.
Figure 15.
Curve chart of temperature difference variation in different pouring temperatures.
Figure 16.
Maximum temperature difference ∆Tmax and corresponding time T2.
Figure 16.
Maximum temperature difference ∆Tmax and corresponding time T2.
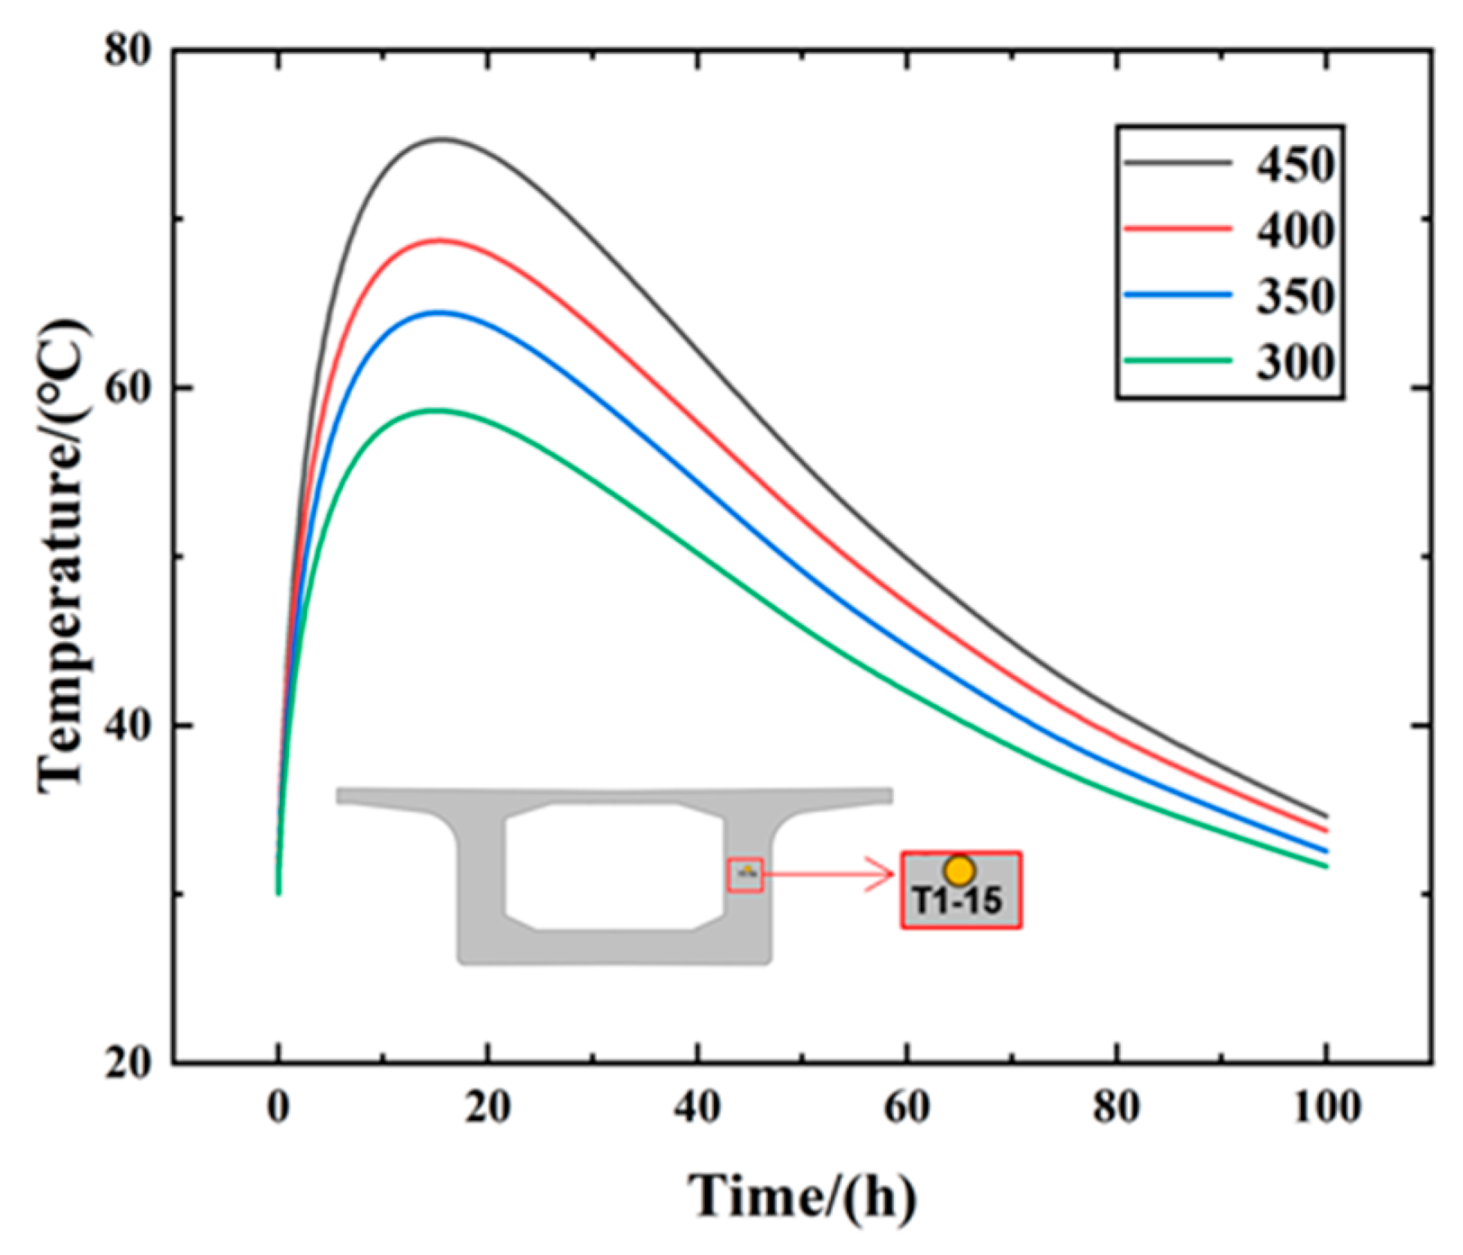
Figure 17.
Temperature variation diagram of different cement contents.
Figure 17.
Temperature variation diagram of different cement contents.
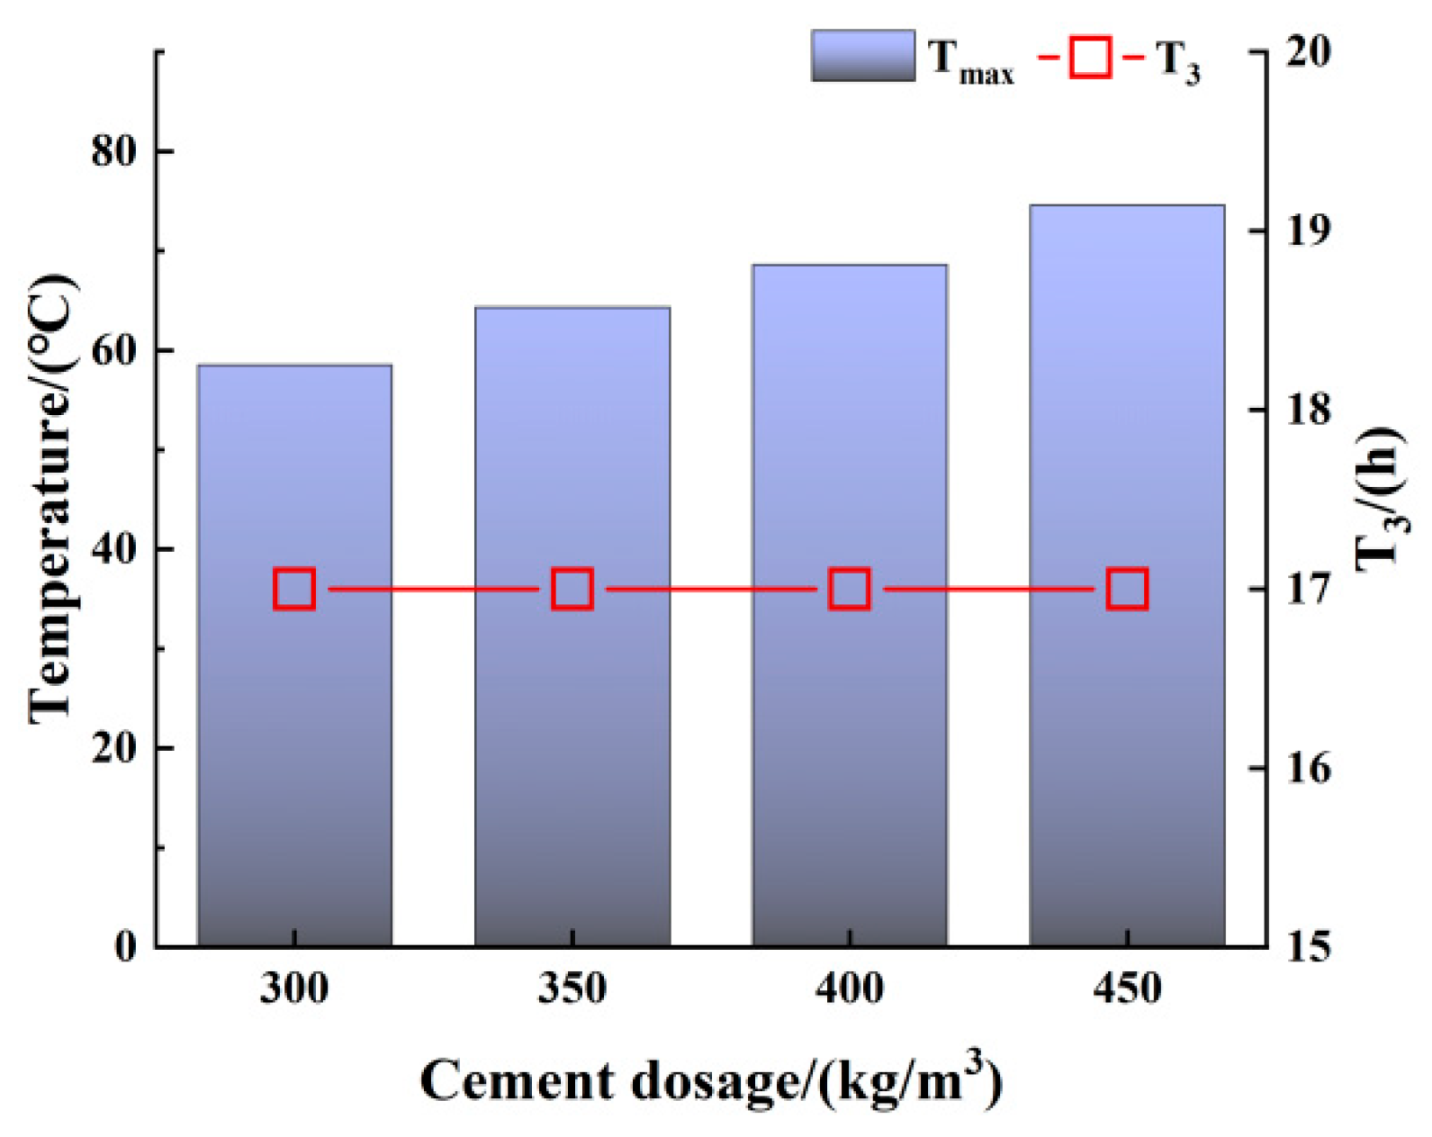
Figure 18.
Peak temperature Tmax and corresponding time T3.
Figure 18.
Peak temperature Tmax and corresponding time T3.
Figure 19.
Temperature increment curve for different cement contents.
Figure 19.
Temperature increment curve for different cement contents.
Figure 20.
Temperature variation curve at different ambient wind speeds.
Figure 20.
Temperature variation curve at different ambient wind speeds.
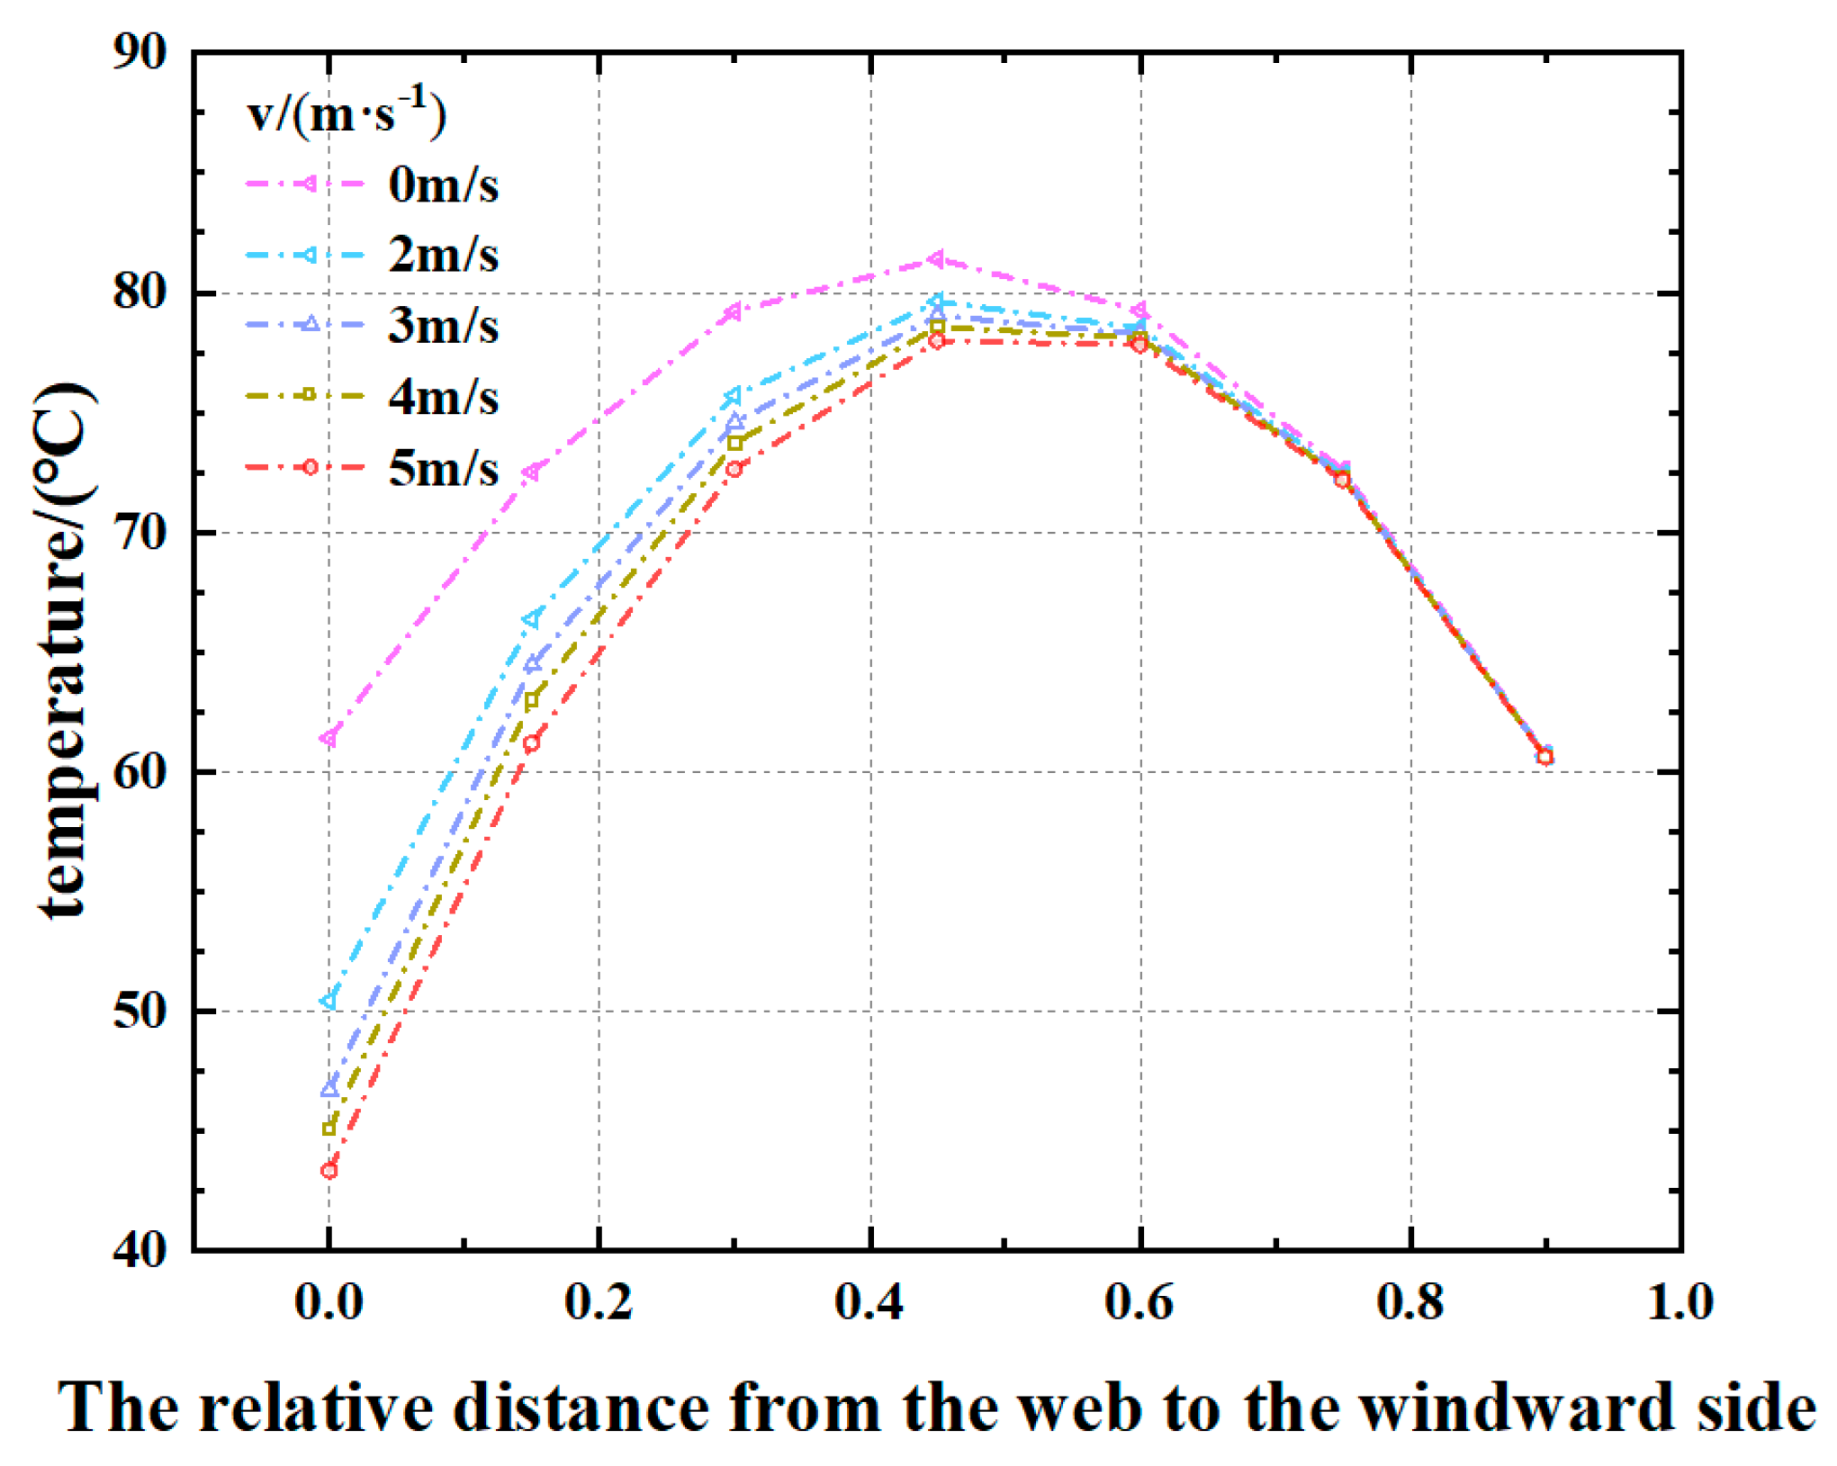
Figure 21.
Side temperature curve of the web with different wind speeds.
Figure 21.
Side temperature curve of the web with different wind speeds.
Table 1.
Concrete mix proportion design (kg/m3).
Table 1.
Concrete mix proportion design (kg/m3).
| Cement | Coal Ash | Mineral Powder | Sand | Gravel | Water | Water-Binder Ratio | Water Reducer |
|---|
| 260 | 95 | 118 | 698 | 1048 | 156 | 0.33 | 4.73 |
Table 2.
Typical chemical and mineral composition of P.II 52.5 cement.
Table 2.
Typical chemical and mineral composition of P.II 52.5 cement.
| Chemical Composition | Content (wt%) | Mineral Composition | Content (wt%) |
|---|
| CaO | 62.0–65.0 | C3S | 50–55 |
| SiO2 | 20.0–22.0 | C2S | 18–22 |
| Al2O3 | 4.5–5.5 | C3A | 7.0–9.0 |
| Fe2O3 | 3.0–3.5 | C4AF | 9.0–11.0 |
| MgO | ≤3.0 | / | / |
| SO3 | ≤3.5 | / | / |
| Loss on Ignition | ≤3.0 | / | / |
Table 3.
Concrete strength.
Table 3.
Concrete strength.
| Time/h | 24 | 36 | 48 | 60 | 72 | 96 |
|---|
| Strength/MPa | 23.9 | 27.2 | 31.9 | 35.6 | 41.7 | 44.4 |
Table 4.
Measured temperature peak value, occurrence time, and corresponding position of each test section.
Table 4.
Measured temperature peak value, occurrence time, and corresponding position of each test section.
| Test Section | Peak Temperature/°C | Peak Temperature Occurrence Time/h | Measurement Point Location |
|---|
| T1 | 76.5 | 17 | T1-5 |
| T2 | 74.8 | 16 | T2-5 |
| T3 | 72.0 | 17 | T3-5 |
Table 5.
Measured maximum temperature difference, time of maximum temperature difference, and corresponding position of each test section.
Table 5.
Measured maximum temperature difference, time of maximum temperature difference, and corresponding position of each test section.
| Test Section | Maximum Temperature Difference/°C | Time of Maximum Temperature Difference/h | Maximum Temperature Difference Measuring Point |
|---|
| T1 | 19.0 | 23 | T1-(02-01) |
| T1 | 18.1 | 23 | T1-(05-04) |
| T1 | 19.8 | 23 | T1-(15-16) |
| T2 | 14.1 | 22 | T2-(02-01) |
| T2 | 13.8 | 23 | T2-(05-04) |
| T2 | 14.7 | 23 | T2-(15-16) |
| T3 | 10.7 | 23 | T3-(02-01) |
| T3 | 10.5 | 24 | T3-(05-04) |
| T3 | 10.9 | 23 | T3-(15-16) |
Table 6.
Parameter descriptions.
Table 6.
Parameter descriptions.
| Symbol | Meaning | Estimated Value | Unit |
|---|
| Concrete density | 2400 | |
| Specific heat | | |
| The mass of cement | 450 | |
| The mass of aggregate | 1746 | |
| The mass of water | 156 | |
| Assigned specific heat | | |
| Specific heat of cement | 930 | |
| Specific heat of the concrete aggregate | 678 | |
| Adiabatic temperature rise equation parameter | 350,000 | |
| Equivalent age | | |
| Chemical reaction activation energy | 33.5 | |
| Ideal gas constant | 8.314 | |
| Reference temperature | 293 | |
| Thermal insulation | 8830 | |
| Reaction parameter | 0.36 | |
| Reaction parameter | 0.74 | |
| Hydration | | |
Table 7.
Table of different cases.
Table 7.
Table of different cases.
| Cases | Variations in Thermal Conductivity | Variations in Specific Heat Capacity | Equivalent Age |
|---|
| 1 | ✓ | ✓ | ✓ |
| 2 | ✕ | ✓ | ✓ |
| 3 | ✓ | ✕ | ✓ |
| 4 | ✕ | ✕ | ✓ |
| 5 | ✕ | ✕ | ✕ |
Table 8.
Parameters of different working conditions.
Table 8.
Parameters of different working conditions.
| Working Conditions | Working Condition 1 | Working Condition 2 | Working Condition 3 | Working Condition 4 |
|---|
| Pouring temperature | 30 °C | 15 °C | 20 °C | 25 °C |
Table 9.
Parameters for working conditions with different cement contents.
Table 9.
Parameters for working conditions with different cement contents.
| Working Conditions | Working Condition I | Working Condition V | Working Condition VI | Working Condition VII |
|---|
| Cement content (kg/m3) | 450 | 400 | 350 | 300 |
Table 10.
Different ambient wind speeds.
Table 10.
Different ambient wind speeds.
Working
Conditions | Working Condition I | Working Condition II | Working Condition III | Working Condition IV | Working Condition V |
|---|
| wind speed (m/s) | 0 | 2 | 3 | 4 | 5 |
Table 11.
Temperature of the right web at different distances from the windward side at different wind speeds.
Table 11.
Temperature of the right web at different distances from the windward side at different wind speeds.
| Windward Side Distance (cm) | 0 | 15 | 30 | 45 | 60 | 75 | 90 |
|---|
| wind speed 0 m/s | 61.4 °C | 72.5 °C | 79.2 °C | 81.4 °C | 79.3 °C | 72.6 °C | 60.7 °C |
| wind speed 2 m/s | 50.4 °C | 66.4 °C | 75.7 °C | 79.6 °C | 78.5 °C | 72.4 °C | 60.7 °C |
| wind speed 3 m/s | 46.7 °C | 64.5 °C | 74.6 °C | 79.0 °C | 78.3 °C | 72.3 °C | 60.6 °C |
| wind speed 4 m/s | 45.1 °C | 63.0 °C | 73.7 °C | 78.6 °C | 78.1 °C | 72.3 °C | 60.6 °C |
| wind speed 5 m/s | 43.3 °C | 61.2 °C | 72.6 °C | 78.0 °C | 77.8 °C | 72.2 °C | 60.6 °C |


