Article

Experimental Study on the Out-of-Plane Seismic Performance of Shear Walls with Bolted Connections in Nuclear Power Plants

College of Civil Engineering, Tongji University, Shanghai 200092, China
*
Author to whom correspondence should be addressed.
Buildings 2025, 15(20), 3787; https://doi.org/10.3390/buildings15203787
Submission received: 20 August 2025 / Revised: 10 October 2025 / Accepted: 17 October 2025 / Published: 20 October 2025
(This article belongs to the Section Building Structures)

Abstract

Nuclear power plant (NPP) shear walls are typically ultra-thick and heavily reinforced, posing significant challenges for conventional cast-in-place (CIP) construction. To overcome these issues, this study proposes a precast concrete shear wall (PCSW) system with bolted connections. Owing to orthogonal wall layouts dictated by functional requirements, these structures are subjected to significant out-of-plane seismic demands, making their performance under such loading a critical design concern. Therefore, this paper investigates the out-of-plane seismic performance of scaled (1:2) models of PCSWs (300 mm thick) under an axial pressure ratio of 0.2 and without axial pressure through low-cycle repeated load tests, and compares them with corresponding CIP shear walls. All specimens exhibited flexural failure, while damage in PCSWs was relatively minor and concentrated within the grouting layer. Compared with CIP specimens, the precast specimens showed more pinching and smaller residual deformation, with cumulative energy dissipation reaching 70–80% of CIP specimens. The flexural load-bearing capacity of the precast specimens was close to that of the CIP specimens, with differences within 5%. The ductility of the precast specimens under axial pressure ratios of 0 and 0.2 was 4.54 and 2.68, respectively, differing from the CIP specimens by 16% and −10%. The stiffness degradation trends of both systems were essentially consistent. Overall, the results demonstrate that the out-of-plane seismic performance of PCSWs with bolted connections is broadly equivalent to that of CIP counterparts, confirming their feasibility for application in NPPs.

1. Introduction

Nuclear power plants (NPPs) are critical components of sustainable energy infrastructure and rely heavily on reinforced concrete (RC) shear walls as their primary lateral force-resisting system [1]. Compared with conventional building structures, NPP shear walls are markedly thicker (400–2400 mm) and more heavily reinforced, requiring stringent safety margins [2,3]. Traditional CIP construction often struggles to meet both efficiency and quality demands under these conditions. Precast concrete systems, with their factory-controlled production and on-site rapid assembly, have demonstrated advantages in speed, quality assurance, and sustainability [4,5,6,7,8,9]. These benefits indicate strong potential for application in NPPs.
In the precast concrete structures, the connection of vertical reinforcement between adjacent wall segments is a critical factor influencing both the construction efficiency and mechanical performance of precast concrete shear walls (PCSWs), especially in the seismic zones [10]. Based on whether grouting is required for longitudinal reinforcement connections, precast shear wall systems can be categorized into two primary types: wet-connected and dry-connected systems [7]. Wet connections, such as grouted sleeves or corrugated ducts, demand bar-by-bar installation and precise alignment. Moreover, alternative post-cast strip connection methods—such as ring-reinforcement lap splices—typically require temporary bracing [11,12]. These limitations are particularly critical for NPP shear walls, where dense reinforcement and large wall dimensions further complicate alignment and the installation of formwork. Moreover, the need for temporary bracing for heavy precast walls interferes with the tight construction schedule of nuclear facilities, where civil works and equipment installation must often proceed simultaneously.
In contrast, dry connection techniques aim to simplify on-site assembly by eliminating grouting and curing requirements. Among them, methods such as welded and post-tensioned connections have been explored, but these often require complex detailing or specialized equipment, limiting their applicability to ultra-thick shear walls. Bolted connections, however, directly address the limitations of wet joints. First, they reduce construction precision demands: bolts pre-installed in the lower panel can be quickly aligned with the reserved holes in the upper panel, avoiding bar-by-bar positioning. Second, bolted joints minimize temporary bracing and local formwork needs, enabling faster installation and allowing civil works and equipment erection to proceed in parallel [13]—a key requirement for NPP construction. Finally, high-strength bolts can substitute for multiple reinforcement bars at the joint, easing reinforcement congestion and simplifying detailing. These advantages make bolted connections the most practical and scalable dry-connection method for precast shear walls in NPPs.
Extensive research has been conducted, both domestically and internationally, on the in-plane seismic performance of precast concrete shear wall systems with bolted connections, particularly in the context of residential buildings. Soudki et al. [14] proposed a bolted-to-HSS connection for rebars. Compared to grouted sleeves, it showed better ductility but 20–25% lower stiffness, strength, and energy dissipation due to early HSS failure. Connector optimization was advised. Han et al. [15] tested precast shear walls with high-strength bolt–steel connectors and found that mid-height flexural deformation was reduced compared to CIP specimens, with damage successfully redirected from joints to plastic hinge regions. Wang et al. [16] evaluated dry-connected precast walls using bolts and embedded steel plates, demonstrating that their strength, ductility, and energy dissipation met seismic design requirements. Liu et al. [17] proposed a novel semi-rigid box-type connection and conducted full-scale cyclic tests on both precast and CIP specimens. Results showed similar flexural failure modes and deformation patterns, confirming the connection’s viability. Xue et al. [18,19] investigated a hybrid system combining mid-wall vertical bolts and grouted sleeve-connected boundaries. Parameters such as axial compression ratio and sleeve arrangement were examined. Compared with CIP walls, the precast walls exhibited flexural failure modes, fuller hysteresis loops, and enhanced energy dissipation and ductility. Gou et al. [20] developed a bolted precast wall system and validated its seismic performance via 1:2 shake-table tests, showing high stiffness, strength, and collapse resistance. Previous studies have demonstrated that precast shear walls with bolted connections can achieve in-plane seismic performance comparable to that of CIP counterparts.
Under seismic excitation, shear walls in NPPs are subjected to in-plane loading or out-plane loading. due to their orthogonally intersecting spatial configuration [21]. In other words, the layout in nuclear facilities induces significant out-of-plane seismic demands that must be explicitly addressed in structural design and safety assessment [22]. And hence, several research has been conducted on the out-of-plane behavior of CIP RC shear walls [3,23,24]. More recently, several studies have examined precast or composite shear walls with out-of-plane loading. Xue et al. [25,26] reported that double-sided composite walls and PCSWs connected with grouted sleeves both exhibited flexural failure modes and achieved out-of-plane seismic performance comparable to their CIP counterparts. Li et al. [27] investigated double-steel-plate composite shear walls designed for nuclear facilities and found that although they provided favorable strength and stiffness, their ductility at failure was inferior to conventional RC walls. These findings suggest that while the out-of-plane seismic behavior of CIP and precast RC shear walls has been partly addressed, research specifically targeting PCSWs with dry connections such as bolted joints remains scarce.
Based on the above literature review, several key research gaps have been identified:
(1)
Precast concrete structural systems offer advantages such as simplified construction procedures, reduced demand on on-site formworks, and improved assembly efficiency. Despite these benefits, the development and application of precast NPPs has not been conducted, and relevant experimental and numerical studies remain limited.
(2)
Bolted connections, as a representative dry connection technique, can offer strong potential for application in NPPs. Existing studies have confirmed that bolted connections can provide in-plane seismic performance comparable to that of CIP shear walls. However, due to the orthogonal layout of walls and the inherently high lateral stiffness associated with the large thickness of shear walls in NPPs, significant out-of-plane seismic demands are inevitably introduced. And the out-of-plane seismic behavior of PCSWs with bolted connections has received limited attention, and to date, no experimental investigations have been reported in this regard.
(3)
Current domestic and international design codes provide analytical procedures for evaluating the out-of-plane capacity of CIP shear walls and steel–concrete composite shear walls in nuclear structures. However, no dedicated design methods exist for assessing the out-of-plane seismic behavior of bolted connection PCSWs in NPPs.
To address the out-of-plane seismic behavior of precast shear walls in NPPs, this study proposes a PCSW system employing double-row bolted vertical connectors. A scaled experimental model was developed to reflect the ultra-thick wall characteristics typical of NPP structures. The influence of axial compression ratio on seismic behavior was examined through quasi-static cyclic loading tests, with CIP specimens serving as benchmarks for comparison. The experimental evaluation included analyses of load–displacement responses, envelop curves, stiffness degradation, and energy dissipation capacity. Seismic performance was further evaluated following NEHRP (National Earthquake Hazards Reduction Program) criteria, providing essential understanding of the out-of-plane behavior of PCSWs in NPPs with bolted connections.

2. Experimental Program

2.1. Test Specimens

The prototype shear wall was based on a typical reinforced concrete wall in an NPP, with dimensions of 4000 mm in height and 600 mm in thickness. The wall had double-layer vertical and horizontal reinforcement of 28 mm diameter at 200 mm spacing, together with 10 mm transverse reinforcement at 400 mm spacing across the thickness to resist out-of-plane shear. The concrete grade was C40, and the reinforcement grade was HRB400E.
Considering both the research objectives and laboratory capacity, a 1:2 geometric scale was adopted. The scaled specimens measured 2000 mm in height, 870 mm in width, and 300 mm in thickness. To preserve reinforcement ratios, vertical and horizontal reinforcement consisted of 14 mm bars at 100 mm spacing, while transverse reinforcement comprised 6 mm bars at 200 mm spacing. The material grades remained consistent with the prototype.
The precast specimens were assembled using commercially available bolted connectors (Figure 1b). The geometric parameters of the connectors were selected in accordance with the design provisions of Peikko’s “SUMO Wall Shoes Manual” [28]; their detailed dimensions are shown in Figure 1b. After bolts were tightened, high-strength grout was injected through the connector hand holes to ensure integrity, and a 20 mm bedding mortar layer was placed above the base. Additionally, horizontal reinforcement was locally densified within the connection zone and further within a height of 300 mm above the connectors, in accordance with Chinese standards [29,30,31]. Construction details are shown in Figure 1.
A total of four shear wall specimens were designed and grouped according to axial compression ratio. Group 1 comprised a precast specimen (POW1) and its CIP counterpart (ROW1), both tested with an axial compression ratio of 0.2, representing a relatively high axial load level typical of nuclear power plant structures. Group 2 comprised a precast specimen (POW2) and its CIP counterpart (ROW2), tested without axial load, simulating the most unfavorable condition for out-of-plane response. Apart from the axial compression ratio, all other parameters were identical. The key design parameters are summarized in Table 1.

2.2. Material Properties

Before initiating the loading process, tests were carried out in the building structure laboratory, to determine the material properties of the concrete and reinforcement, following the procedures specified in GB/T 50152-2012 [32]. The results for concrete and steel bars are summarized in Table 2, Table 3 and Table 4.

2.3. Cast of Specimens

Figure 2 illustrates the construction process of the precast concrete shear wall, which comprised the following steps:
(1)
Strain gauges were first attached to the reinforcement. Subsequently, the reinforcement cages for both the wall panel and the base were tied and placed into the steel formwork. The bolt connectors were fixed to the formwork, after which the forms were assembled and the connector hand holes were sealed to prevent mortar ingress during concrete casting.
(2)
Concrete was poured into the formwork. Once the required strength was achieved, the forms for both the wall panel and the base were removed, preparing the components for subsequent assembly.
(3)
The precast wall panel was then lifted by a crane and positioned above the base.
(4)
Using temporary supports, the wall panel was aligned vertically, and the bolts were tightened with a torque wrench to 150 N·m. The joint between the wall panel and base was sealed with formwork, followed by injection of high-strength grout using a grouting pump.
At the time of testing, the measured concrete strength of all specimens satisfied the C40 grade requirement.

2.4. Loading Protocol and Experimental Program

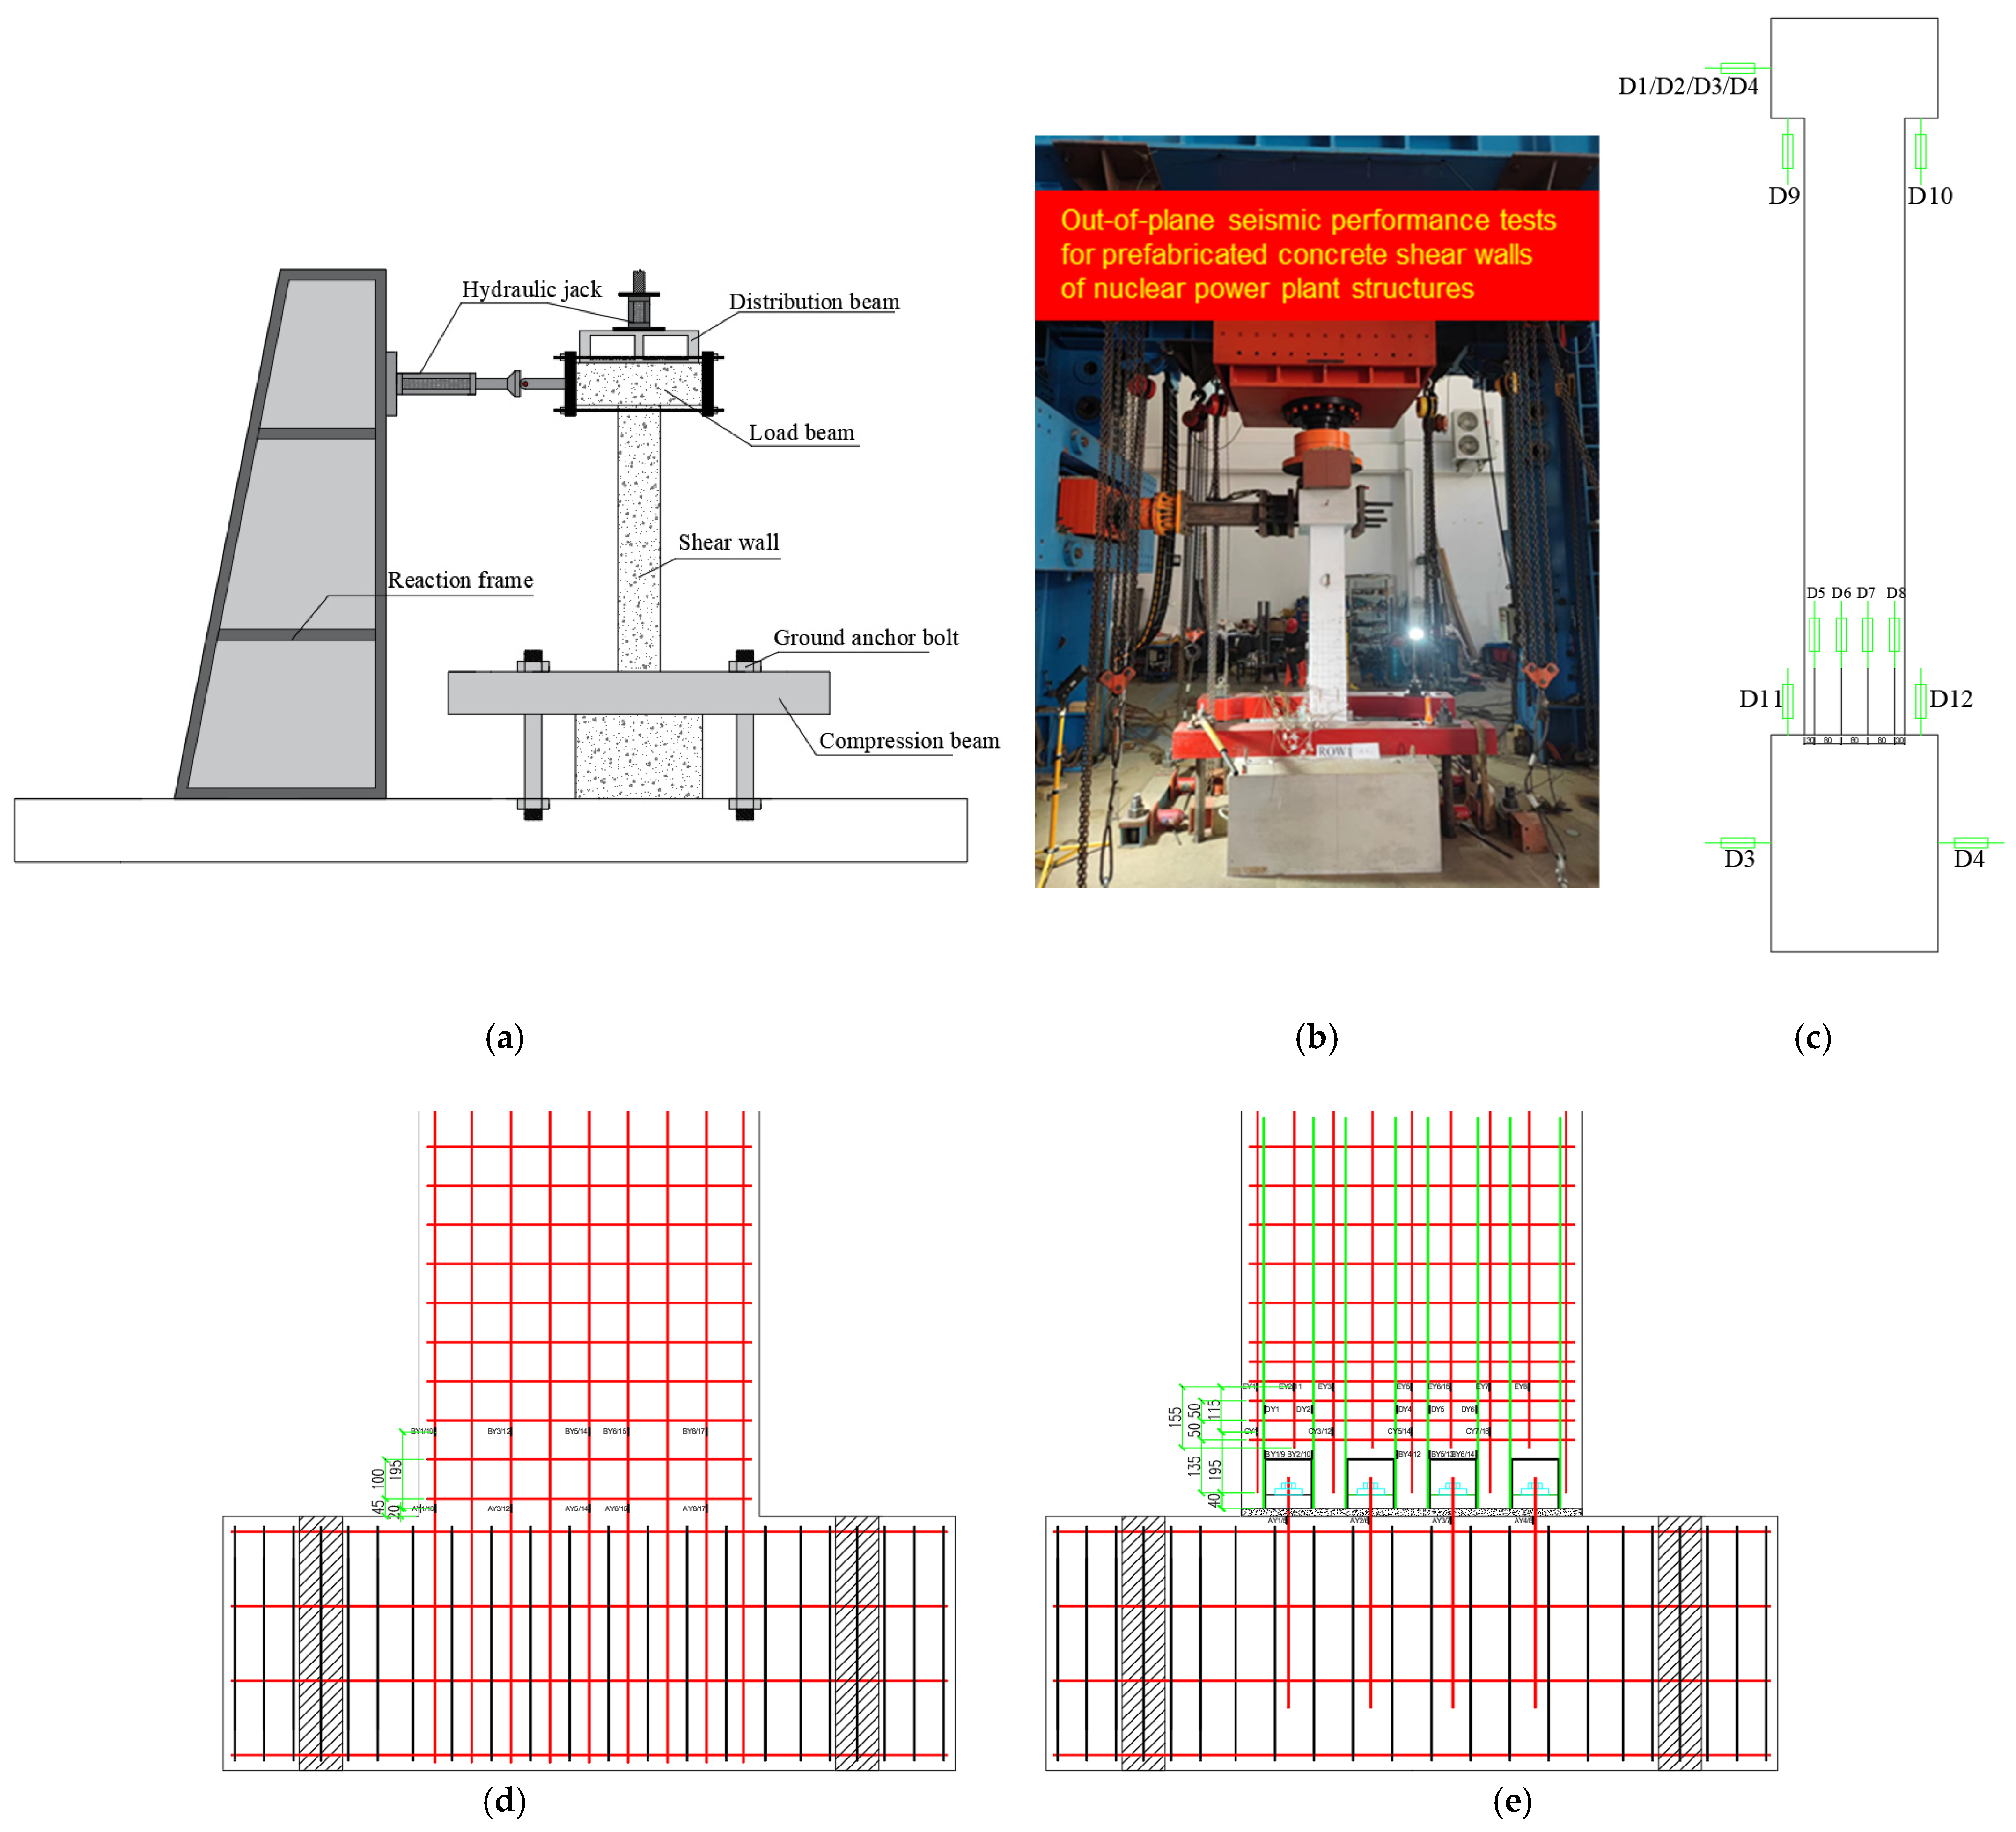
The shear wall specimens were tested using a multifunctional structural loading system. Each specimen was anchored to the strong floor with two compression beams and four ground anchor bolts. Vertical loading was applied by a 10,000 kN hydraulic actuator capable of accommodating horizontal displacement to maintain constant axial force, followed by cyclic horizontal loading from a 3000 kN jack. The system automatically adjusted vertical load in response to lateral displacement to account for the P-Δ effect.
Horizontal displacements of the loading and ground beams were measured with LVDTs (Figure 3c), and the out-of-plane deformation of the wall was calculated as their difference. Figure 3d,e illustrate the placement of strain gauges in the cast-in-place (CIP) and precast specimens, respectively. In the precast specimens, strain gauges on the bolts were positioned beneath the bedding mortar layer, while others were applied to the anchor bars and spliced rebars. For the CIP specimens, two rows of gauges were affixed to the rebar above the foundation, at a height comparable to those on the anchor bars in precast specimens.
The loading protocol comprised force control to determine the cracking load (one positive and one negative cycle), followed by displacement control with increments of H/100 = 20 mm, where H is the distance from the loading point to the wall base (2000 mm), three cycles per level, until horizontal resistance dropped below 85% of peak or severe damage occurred. The test setup is shown in Figure 3.

3. Results and Discussion

3.1. Global Response and Failure Mode

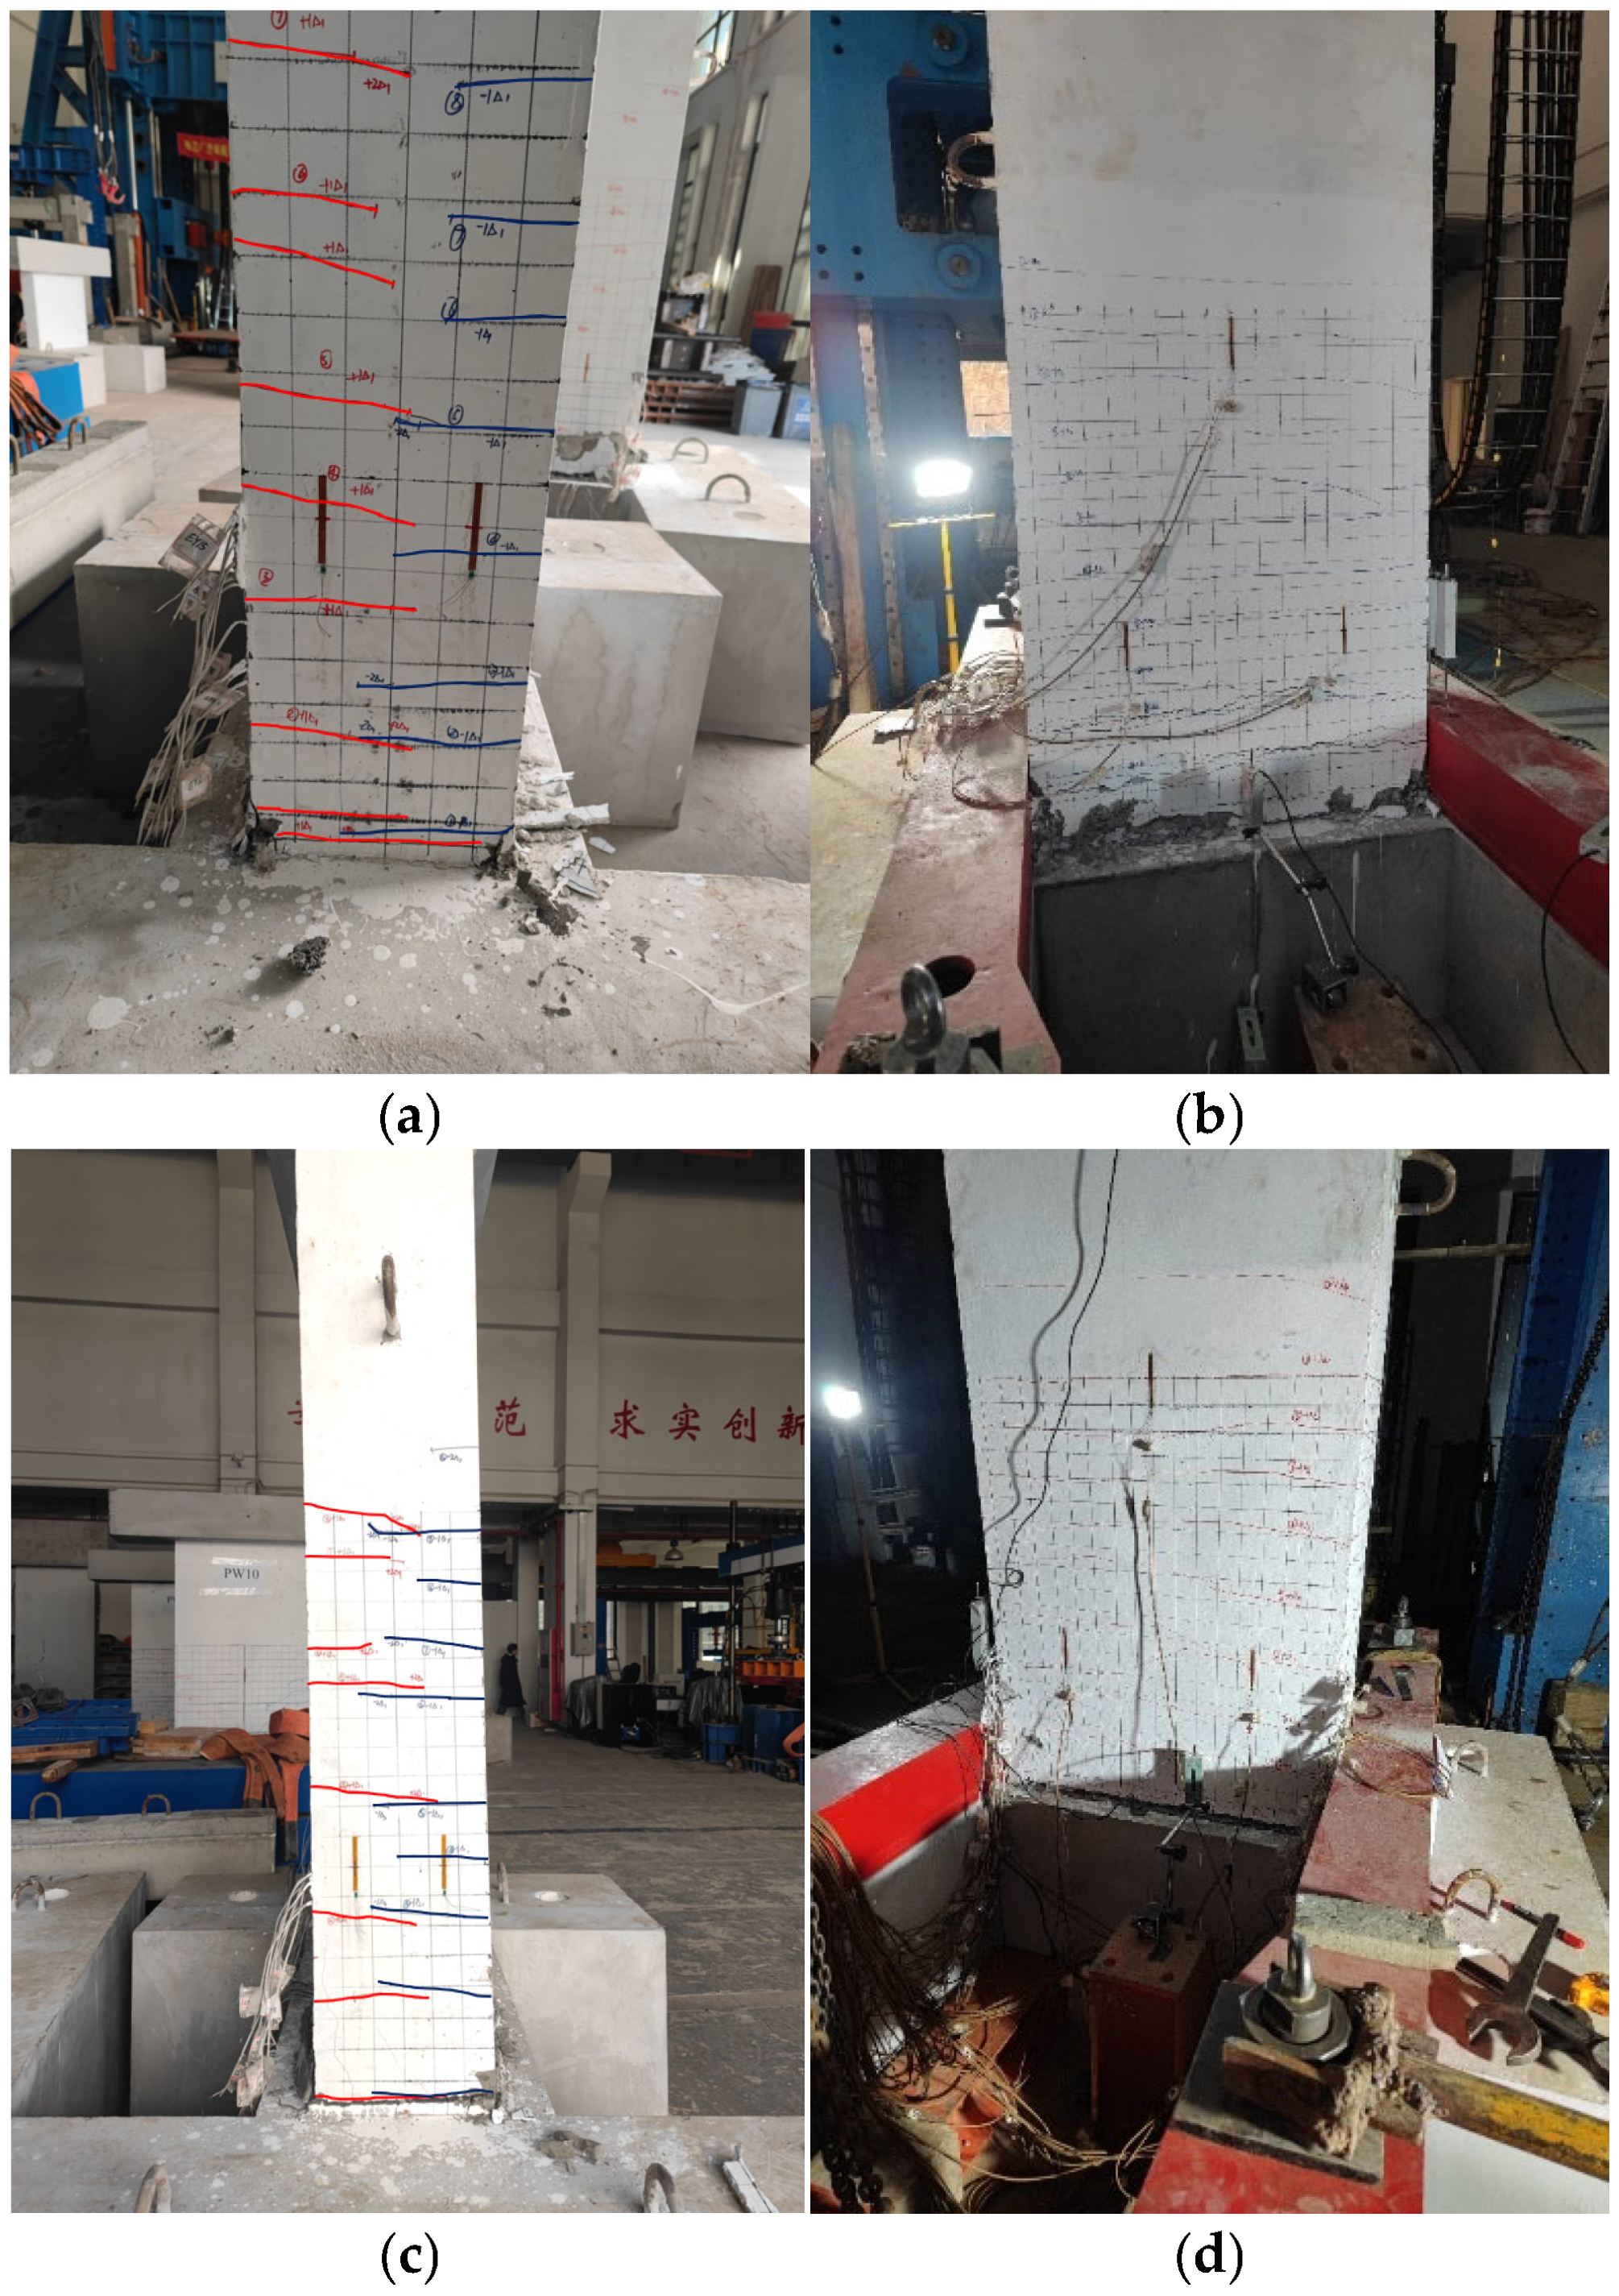
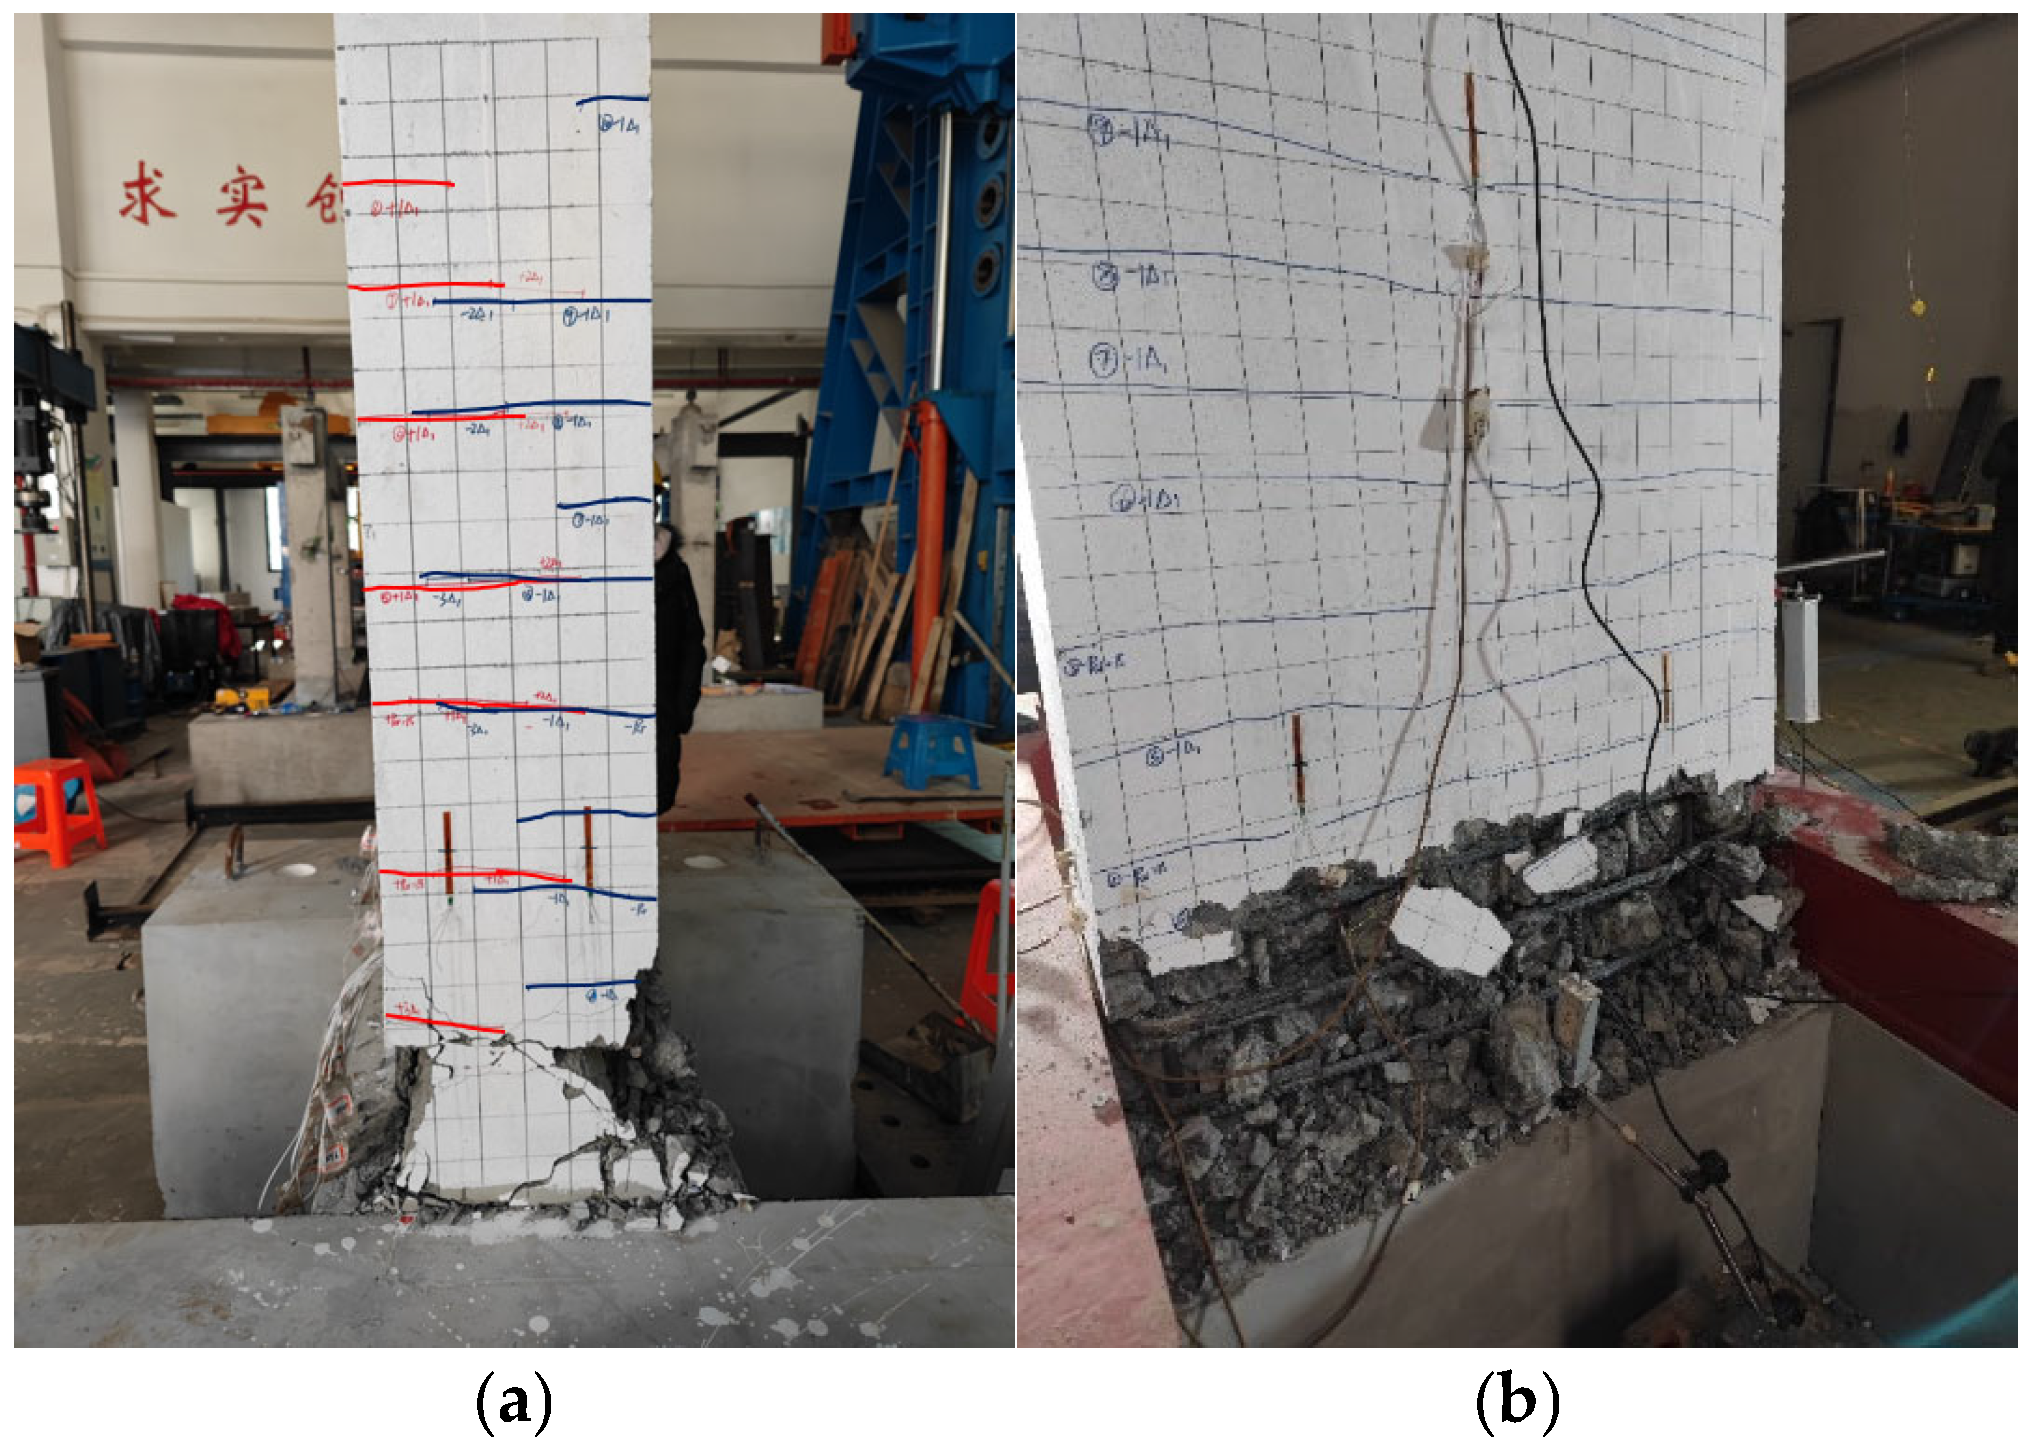
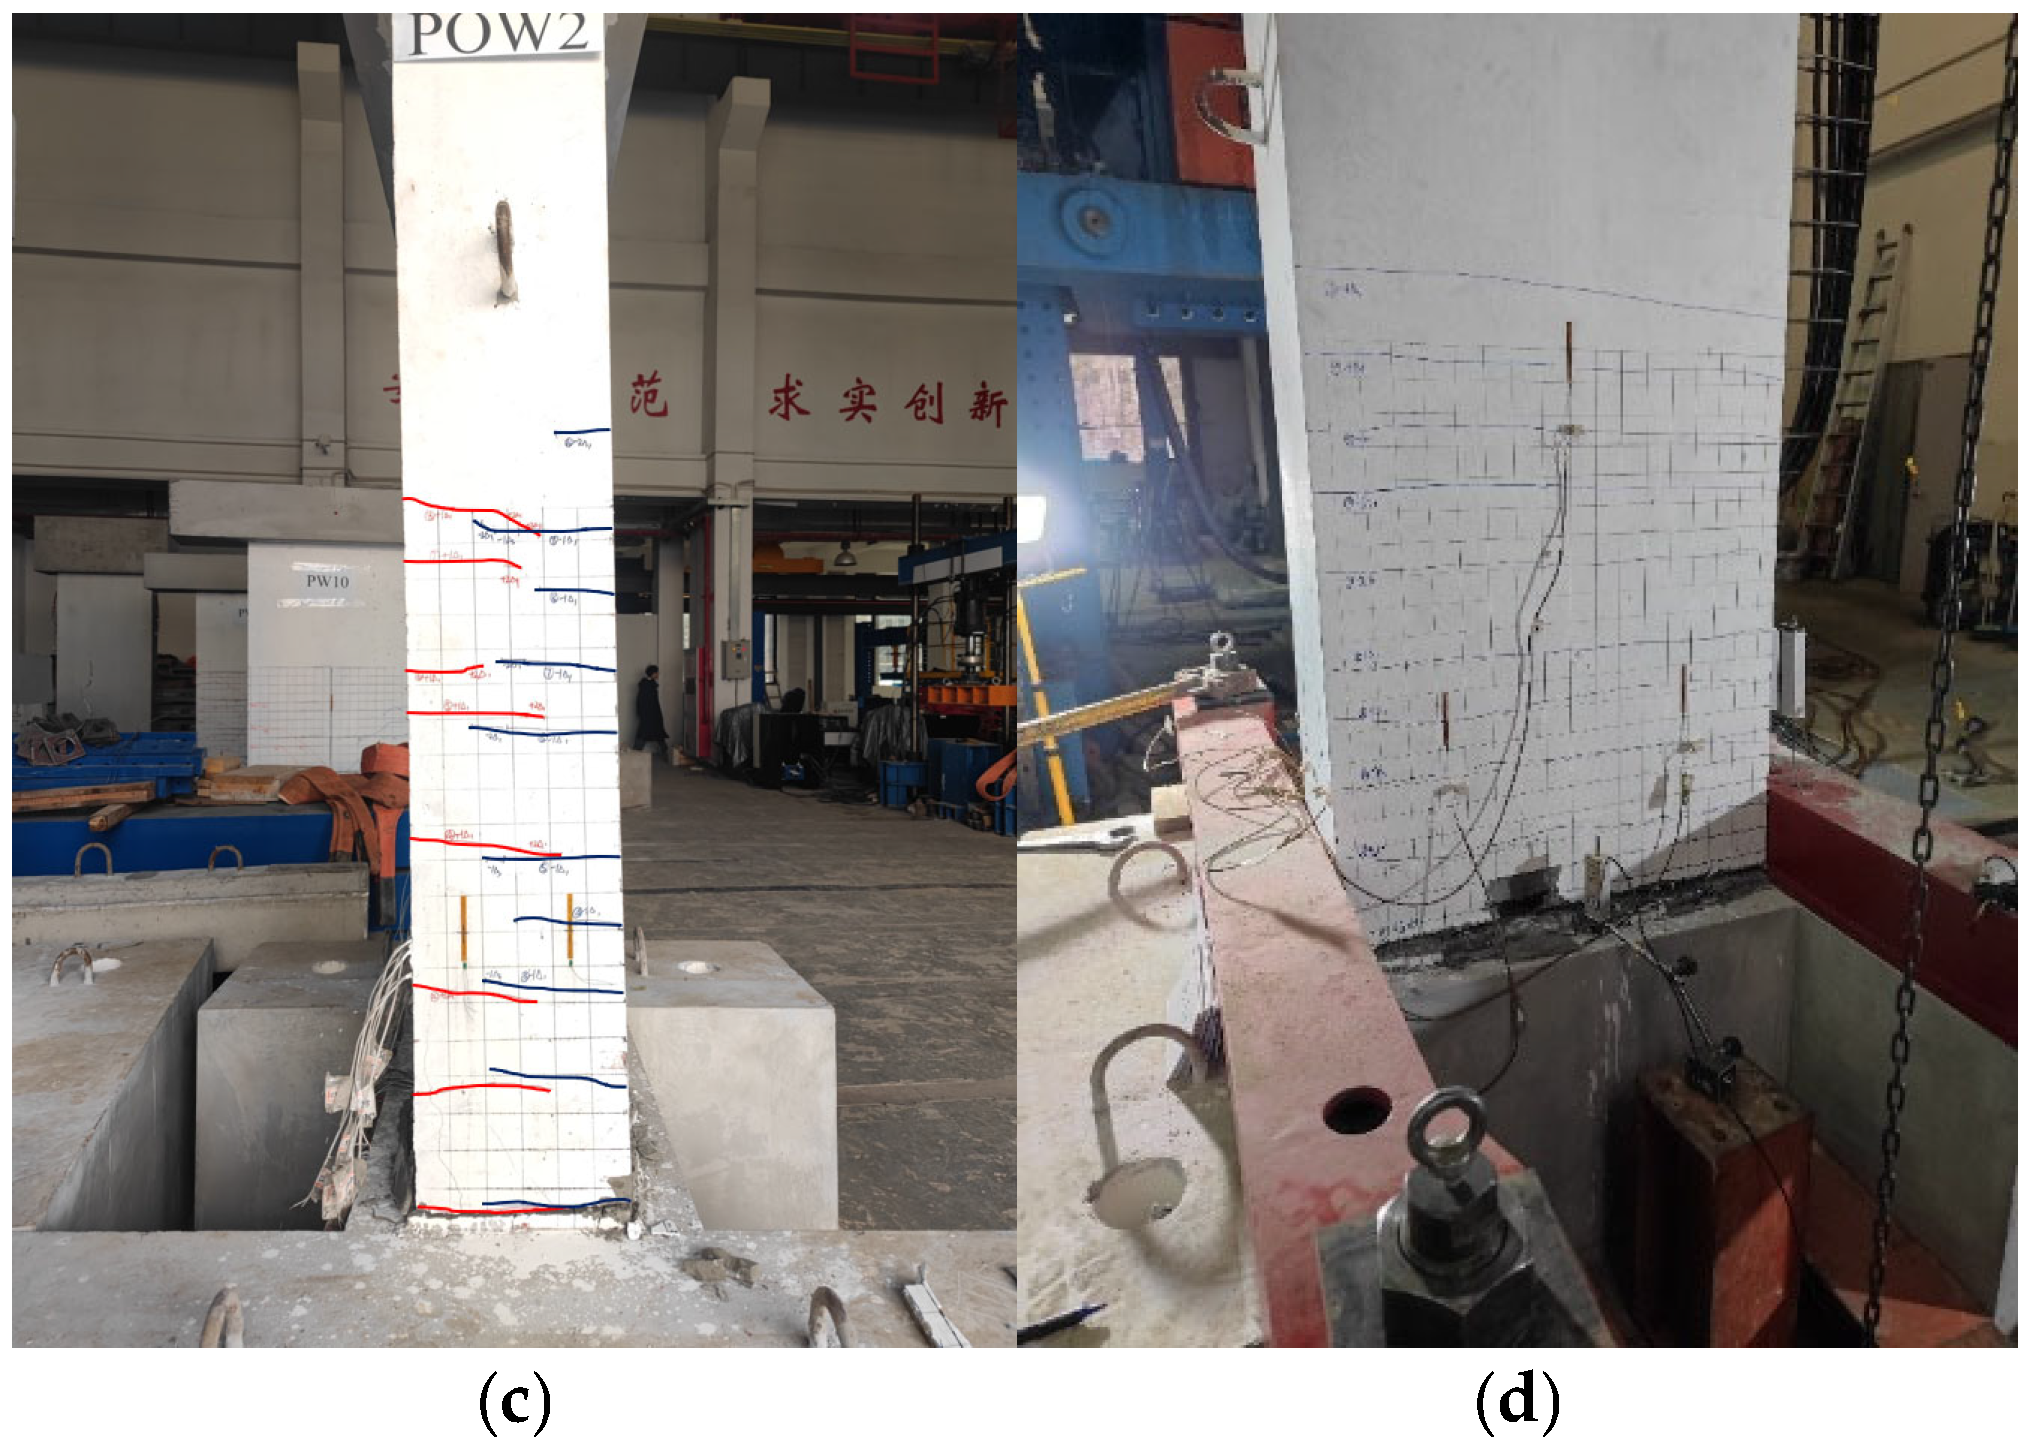
Under low-cycle reversed loading, the first (POW1, ROW1) and second (POW2, ROW2) specimen groups—comprising precast and CIP walls under different axial compression ratios—exhibited comparable load–deformation responses and failure modes. As shown in Figure 4 and Figure 5, all specimens ultimately failed in a flexure-dominated manner. In specimens with axial compression, both the connector bolts and longitudinal reinforcement yielded in tension but did not fracture, while the concrete in compression crushed. In contrast, in specimens without axial compression, both bolts and longitudinal reinforcement fractured in the later loading stages. In the first group, the peak lateral capacities of ROW1 and POW1 were 147.5 kN and 138.9 kN, respectively, which were 62.4% and 62.6% higher than those of the second group without axial compression, ROW2 (90.8 kN) and POW2 (85.4 kN). The loading process of all specimens can be divided into four distinct stages:
(1)
Cracking stage: For the first group (axial compression ratio = 0.2), the cracking loads of ROW1 and POW1 were 25 kN and 65 kN, respectively. For the second group without axial compression, the cracking loads of ROW2 and POW2 were 15 kN and 35 kN, respectively. In the CIP specimens, the first cracks appeared at the interface between the wall and the ground beam, while in the precast specimens, they occurred at the interface between the bedding mortar layer and the upper wall. The cracking load increased with axial compression.
(2)
Yield stage: As the horizontal displacement increased, existing cracks propagated, vertical splitting cracks developed at the wall corners, and more horizontal flexural cracks formed and extended through the wall thickness. At a drift ratio of 1%, the connector bolts in POW1 and POW2 exceeded 2000 με, indicating yielding, while the longitudinal reinforcement in ROW1 and ROW2 reached strains of 2200–2600 με, also indicating yielding. With further drift, additional reinforcement yielded in tension, and concrete spalling initiated at the wall base.
(3)
Peak stage: When the drift ratio reached 2–6%, all specimens attained their maximum lateral capacity. For ROW1, the peak load was 147.5 kN at a crack height of 1300 mm, followed by the formation of two wide cracks at heights of 150 mm and 250 mm, and crushing of concrete below 100 mm. ROW2 reached its peak load of 90.8 kN at a drift ratio of 6%, with cracks extending up to 1200 mm, three wide cracks forming at 50 mm, 150 mm, and 250 mm, and crushing below 300 mm. For POW1 and POW2, peak loads of 138.9 kN and 85.4 kN were reached at a drift ratio of 2%, with cracks distributed up to heights of 1600 mm and 1300 mm, respectively.
(4)
Failure stage: Beyond the peak load, the lateral capacity began to decline. Severe spalling occurred on both sides of the wall base. In the first group, the reinforcement and bolts yielded in tension but did not fracture; in the second group, some reinforcement and bolts fractured. Failure was defined when the lateral load dropped to 85% of the peak value.
In summary, all specimens failed in a flexure-dominated mode, characterized by crushing of the concrete at the base edges and yielding or fracture of the tension reinforcement and bolts. Within the same group, precast and CIP specimens showed comparable capacities. Axial compression increased both the cracking load and the peak lateral capacity but reduced deformation capacity. Damage in precast specimens was concentrated in the bedding mortar layer (approximately 20 mm above the ground beam), whereas in CIP specimens it occurred 100–300 mm above the ground beam. This difference is attributed to the strengthening effect of the connector steel plate and high-strength grout above the bedding layer, while the bedding mortar itself remained a relatively weak zone.

3.2. Hysteresis Loops

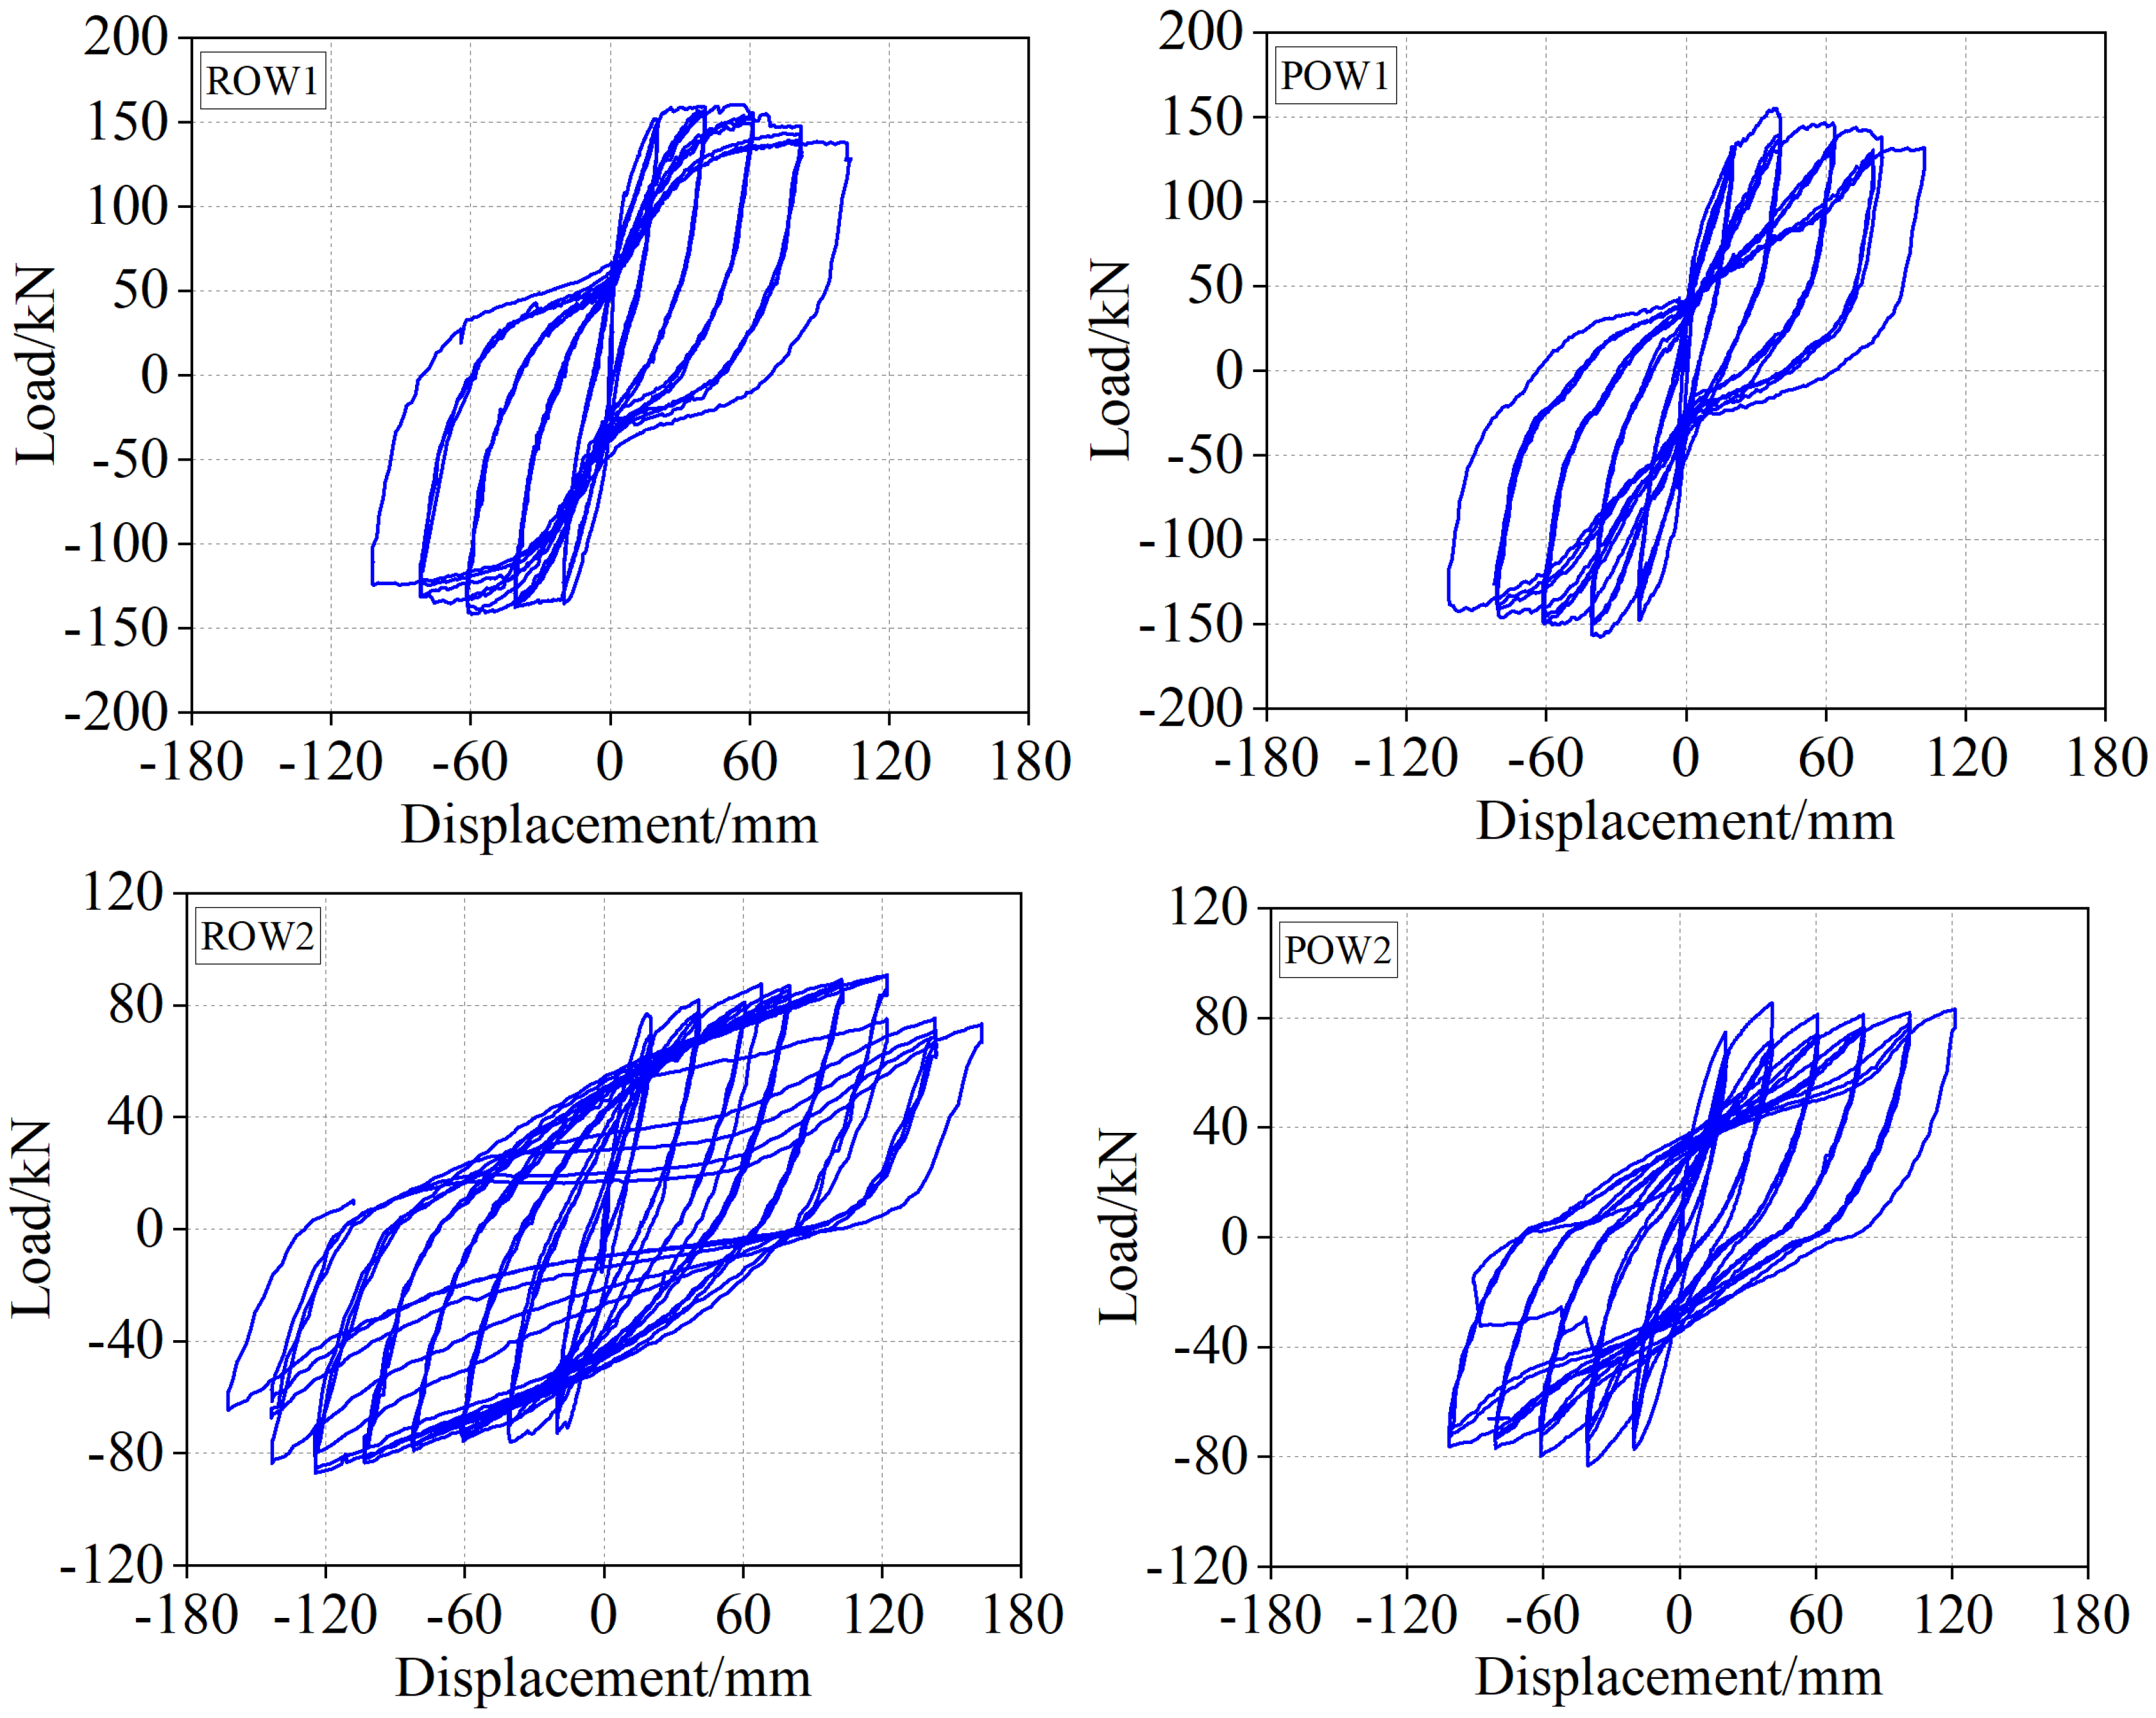
The hysteresis curve (P-Δ curve) illustrates the relationship between horizontal force and displacement under cyclic loading, providing insight into the seismic performance of the wall. Figure 6 shows the hysteresis curves for all tested specimens. From the hysteretic curve analysis, the following observations can be made:
In general, the hysteretic curve evolution of precast and CIP specimens followed a similar trend. In the early loading stages, all specimens were primarily in the elastic range, with the enclosed area of the hysteresis loops being small. As the lateral displacement at the wall top increased, the loops became fuller, the enclosed area increased, and the energy dissipation capacity improved. Due to concrete cracking, reinforcement–concrete slip, and concrete crushing, varying degrees of pinching were observed in the curves.
The precast and CIP specimens exhibited the same number of hysteresis loops with similar shapes, generally arch-shaped and showing a certain degree of pinching. While both systems showed comparable hysteretic behavior in the early loading cycles, the precast specimens exhibited slightly more pronounced pinching during reversed cyclic loading. This minor difference is primarily attributed to interface slip and micro-cracking in the bedding mortar, which may delay the engagement of internal reinforcement and connectors upon load reversals. In addition, the bolts in the precast walls were positioned closer to the neutral axis, resulting in a reduced lever arm and slightly lower moment resistance during initial load reversals. Nevertheless, the overall pinching behavior and hysteretic shape of the precast specimens were largely comparable to those of the CIP walls, particularly under moderate drift levels.
Before the wall-top displacement reached 100 mm, both precast and CIP specimens exhibited full, spindle-shaped loops without significant pinching. Beyond 100 mm displacement, the loops of precast specimens became irregular during reverse loading due to bolt fracture, causing a sudden drop in capacity. In CIP specimens, the loops transitioned from spindle-shaped to Z-shaped, with evident pinching, caused by widening of the three main cracks at the wall base, concrete crushing, and increased reinforcement–concrete slip. The enclosed area of the loops for precast specimens was also smaller than that of CIP specimens.
The number of loading levels for specimens with axial compression was smaller than for those without axial compression. At the same loading level, specimens with axial compression exhibited higher peak strength, larger enclosed loop areas, and better energy dissipation. The hysteresis loops could generally be categorized as spindle-shaped, arch-shaped, reverse-S-shaped, and Z-shaped. Spindle-shaped loops indicated fuller curves with better energy dissipation; arch-shaped loops suggested a reduction in initial stiffness during subsequent loading due to damage; and reverse-S and Z shapes indicated large slip and poorer energy dissipation [33]. In the early loading stage, axial compression caused the loop shape to change from spindle to arch. In the later stage, due to varying degrees of wall damage and reinforcement slip, the loop shapes differed among specimens.

3.3. Envelop Curves

The backbone curve, constructed by linking the peak responses of each loading cycle in a consistent loading direction, serves as a representative envelope of the hysteresis behavior. It effectively captures the progressive evolution of structural response characteristics, such as strength development, stiffness degradation, ductility, and energy dissipation. Figure 7 illustrates the backbone curves corresponding to the four tested shear wall specimens, while the key characteristic parameters identified along these curves are summarized in Table 5, where Py, Pmax and Pu represent the yield load, peak load, and ultimate load, respectively. Similarly, Δy, Δmax and Δu represent the yield displacement, peak displacement, and ultimate displacement, respectively.
Under cyclic loading, all four specimens underwent three distinct stages: cracking, yielding, and ultimate failure. Prior to cracking, the specimens were in the elastic range, with load and displacement increasing approximately linearly. After cracking, stiffness began to decrease, and following yielding, the stiffness degradation became more pronounced as displacement increased. Beyond the peak load, the lateral capacity declined until failure occurred.
For specimens with an axial compression ratio of 0.2, the skeleton curves of the precast and CIP specimens were generally similar. The peak displacement of the precast specimens was slightly larger than that of the CIP specimens, primarily because the bolt positions at the joints were located closer to the central axis. The peak loads were comparable, with the average positive and negative lateral capacities being 140.4 kN for the precast specimens and 137.2 kN for the CIP specimens, the former being approximately 2% higher.
For specimens without axial compression, the precast and CIP specimens exhibited similar initial stiffness. The precast specimen reached its peak load at a displacement of approximately 40 mm, after which the capacity remained at a relatively high level due to effective bolt anchorage, until bolt fracture occurred and the load dropped sharply. The CIP specimen reached its peak load at a displacement of about 120 mm, although the distributed reinforcement had already yielded at around 20 mm displacement, indicating that under zero axial compression, the overall performance of the CIP specimen was superior, with full reinforcement anchorage. Subsequently, extensive concrete spalling and reinforcement fracture led to a rapid loss of capacity. The average positive and negative lateral capacities of the precast and CIP specimens were 84.4 kN and 88.9 kN, respectively, with a difference within 5%.
Based on the American ACI code [34], the theoretical capacities of the specimens were calculated and compared with the experimental results. For specimens with an axial compression ratio of 0.2, the test values, after accounting for the P-Δ effect, were approximately 12% higher than the theoretical predictions, indicating a certain safety margin. For specimens without axial compression, the test results were close to the theoretical values, with a difference within 5%.
The presence of axial compression increased the load-carrying capacity of the specimens by approximately 54–66% compared with those without axial compression. In the absence of axial compression, the post-peak capacity degradation was slower than that of specimens with axial compression. For both the zero axial compression and 0.2 axial compression cases, the average capacity difference between precast and CIP specimens was within 5%, indicating comparable performance. This satisfies the equal load-bearing capacity design requirement and confirms the reliability of the bolted connections.

3.4. Displacement Ductility

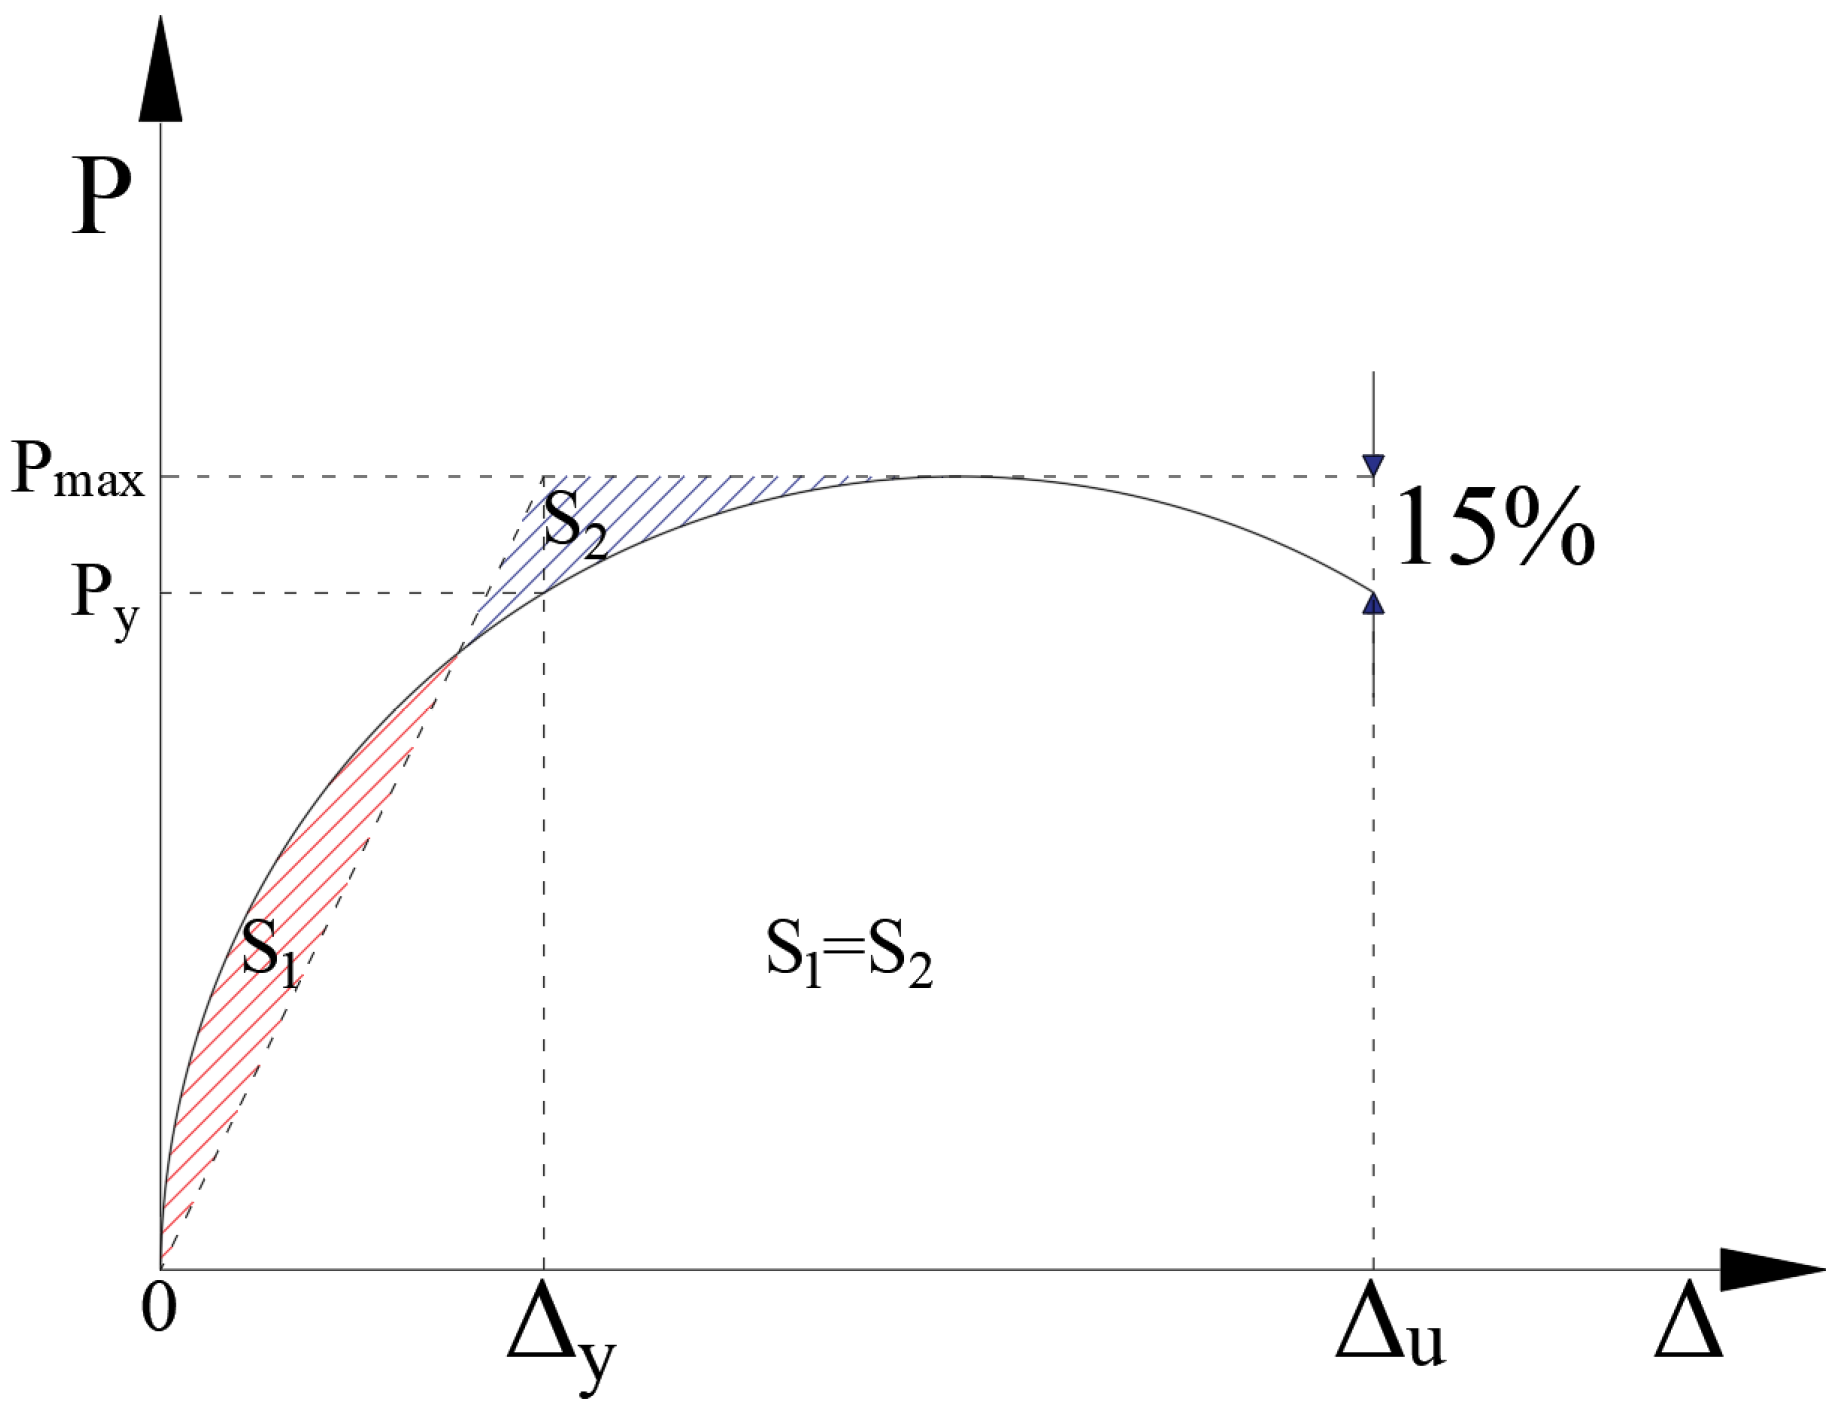
Ductility reflects the deformation capacity of a structure and is typically quantified by the displacement ductility coefficient, defined as the ratio of ultimate displacement to yield displacement. When the yield point on the load–displacement curve is not clearly identifiable, the equivalent energy method [35] (Figure 8) is adopted. This method approximates the actual response with a bilinear elastic–plastic model of equivalent energy dissipation to determine the yield displacement. The ultimate displacement is defined as the lateral displacement corresponding to the point where the applied load drops to 85% of the peak load. If this condition is not reached, the displacement at the end of the test is taken as the ultimate displacement. The calculated ductility coefficients for all specimens are summarized in Table 5.
In group I, the precast specimen POW1 exhibited a later yielding point compared with the CIP specimen ROW1, with differences in positive and negative yielding displacements ranging from 2% to 20%, and differences in ultimate displacements ranging from –3% to 7%. The ultimate drift ratio of POW1 was 1/34, while that of ROW1 was 1/33, indicating essentially equivalent deformation capacities. The ductility coefficient was 2.68 for POW1 and 2.96 for ROW1, a difference of approximately 10%, suggesting comparable ductility between the two. Under an axial compression ratio of 0.2, all specimens had ductility coefficients greater than 2.6 but less than 3.8, and according to the Eurocode 8 [36] classification, they can be categorized as walls with medium ductility.
In group II, the precast specimen POW2 yielded earlier than its CIP counterpart ROW2. Before the completion of the sixth displacement loading level, the reinforcement/anchor bolts in POW2 fractured, causing a sudden drop in capacity and preventing accurate determination of the ultimate load and ultimate displacement. Therefore, the peak load and corresponding displacement from the preceding loading level were taken as the ultimate values. Results show that the differences in positive and negative yielding displacements ranged from 2% to 20%, while the differences in ultimate displacements were approximately –30% to –20%, the latter being due to the inability to obtain the true ultimate displacement of POW2. The ultimate drift ratio was 1/18 for POW2 and 1/14 for ROW2, both indicating good deformation capacity. The ductility coefficient of POW2 was 4.54, compared to 3.89 for ROW2, 16% higher than ROW2 (3.89), and both satisfied the Eurocode 8 requirement for the high-ductility class (DCM, >3.8).
The presence of axial compression reduced both the ductility and deformation capacity compared with specimens without axial compression. Nevertheless, all four specimens satisfied the deformation capacity requirements specified in existing design codes, including the Chinese code (1/100) [37], the Japanese Building Standard Law (1/50) [38], and the European code (1/50) [36].

3.5. Stiffness Degradation

Stiffness degradation characterizes the progressive decline in lateral stiffness of a structure or component under repeated cyclic loading. It is typically evaluated using the cyclic secant stiffness Kj, defined as the ratio of lateral load to corresponding displacement during each loading cycle. The cyclic stiffness is defined as
K j = i = 1 n P j i / i = 1 n Δ j i
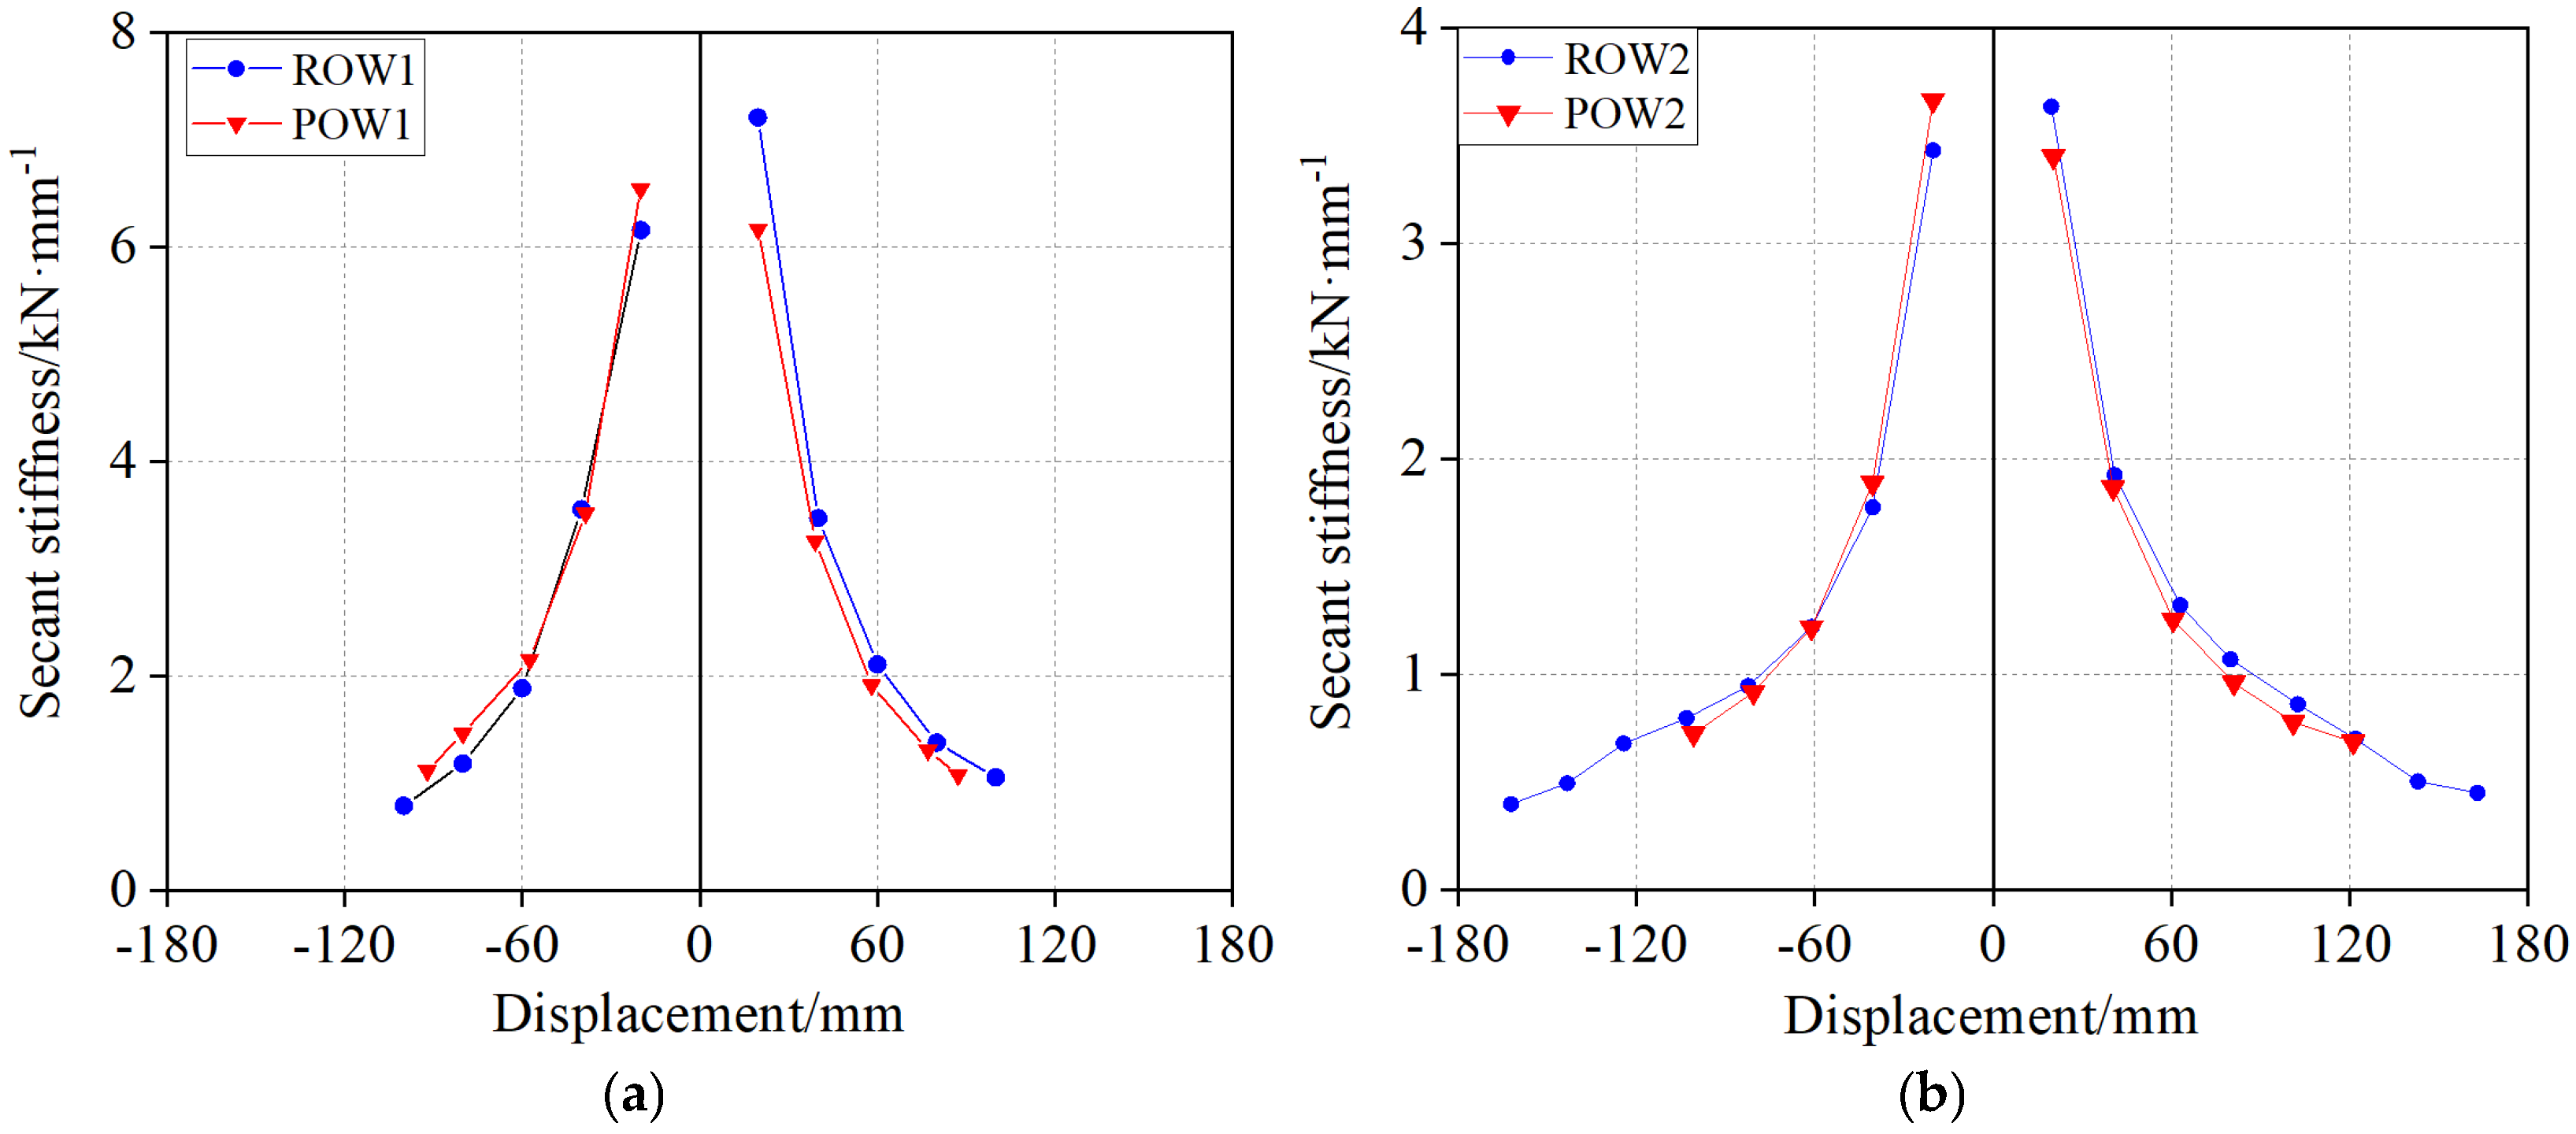
where P j i and Δ j i represent the horizontal load and displacement at the top of the wall during the (j)th cycle of the (i)th level loading, respectively. n represents the cycle count. The evolution of cyclic stiffness with increasing displacement amplitude and loading cycles reflects the degradation trend, as illustrated in Figure 9.
Throughout the cyclic loading process, specimens with the same axial compression ratio exhibited significant stiffness degradation, which was most pronounced during the stage from cracking to yielding. After yielding, the rate of stiffness degradation slowed, primarily because most crack initiation and propagation occurred prior to yielding. Post-yielding, few new cracks formed, and only a small number of existing cracks continued to widen.
In the early loading stage, the initial stiffness in the positive loading direction of the precast specimens was lower than that of the CIP specimens. This was attributed to the bolts in the precast specimens being located closer to the central axis and the absence of additional restraint in the bedding mortar layer. However, the initial stiffness in the negative loading direction was greater for the precast specimens, indicating that positive loading caused more severe damage to the CIP specimens, leading to faster stiffness degradation. This observation is consistent with the more extensive damage observed in the CIP walls. In the later loading stage, the rate of stiffness degradation in the precast specimens was noticeably lower than that in the CIP specimens, as damage in the precast walls was concentrated at the joints, whereas the CIP walls exhibited several wide cracks and more severe concrete deterioration.
For the same axial compression ratio, the specimens exhibited similar stiffness degradation patterns, with comparable trends and only minor differences in the degradation curves. The presence of axial compression increased the initial stiffness compared with specimens without axial compression but also resulted in a faster rate of stiffness degradation.

3.6. Energy Dissipation

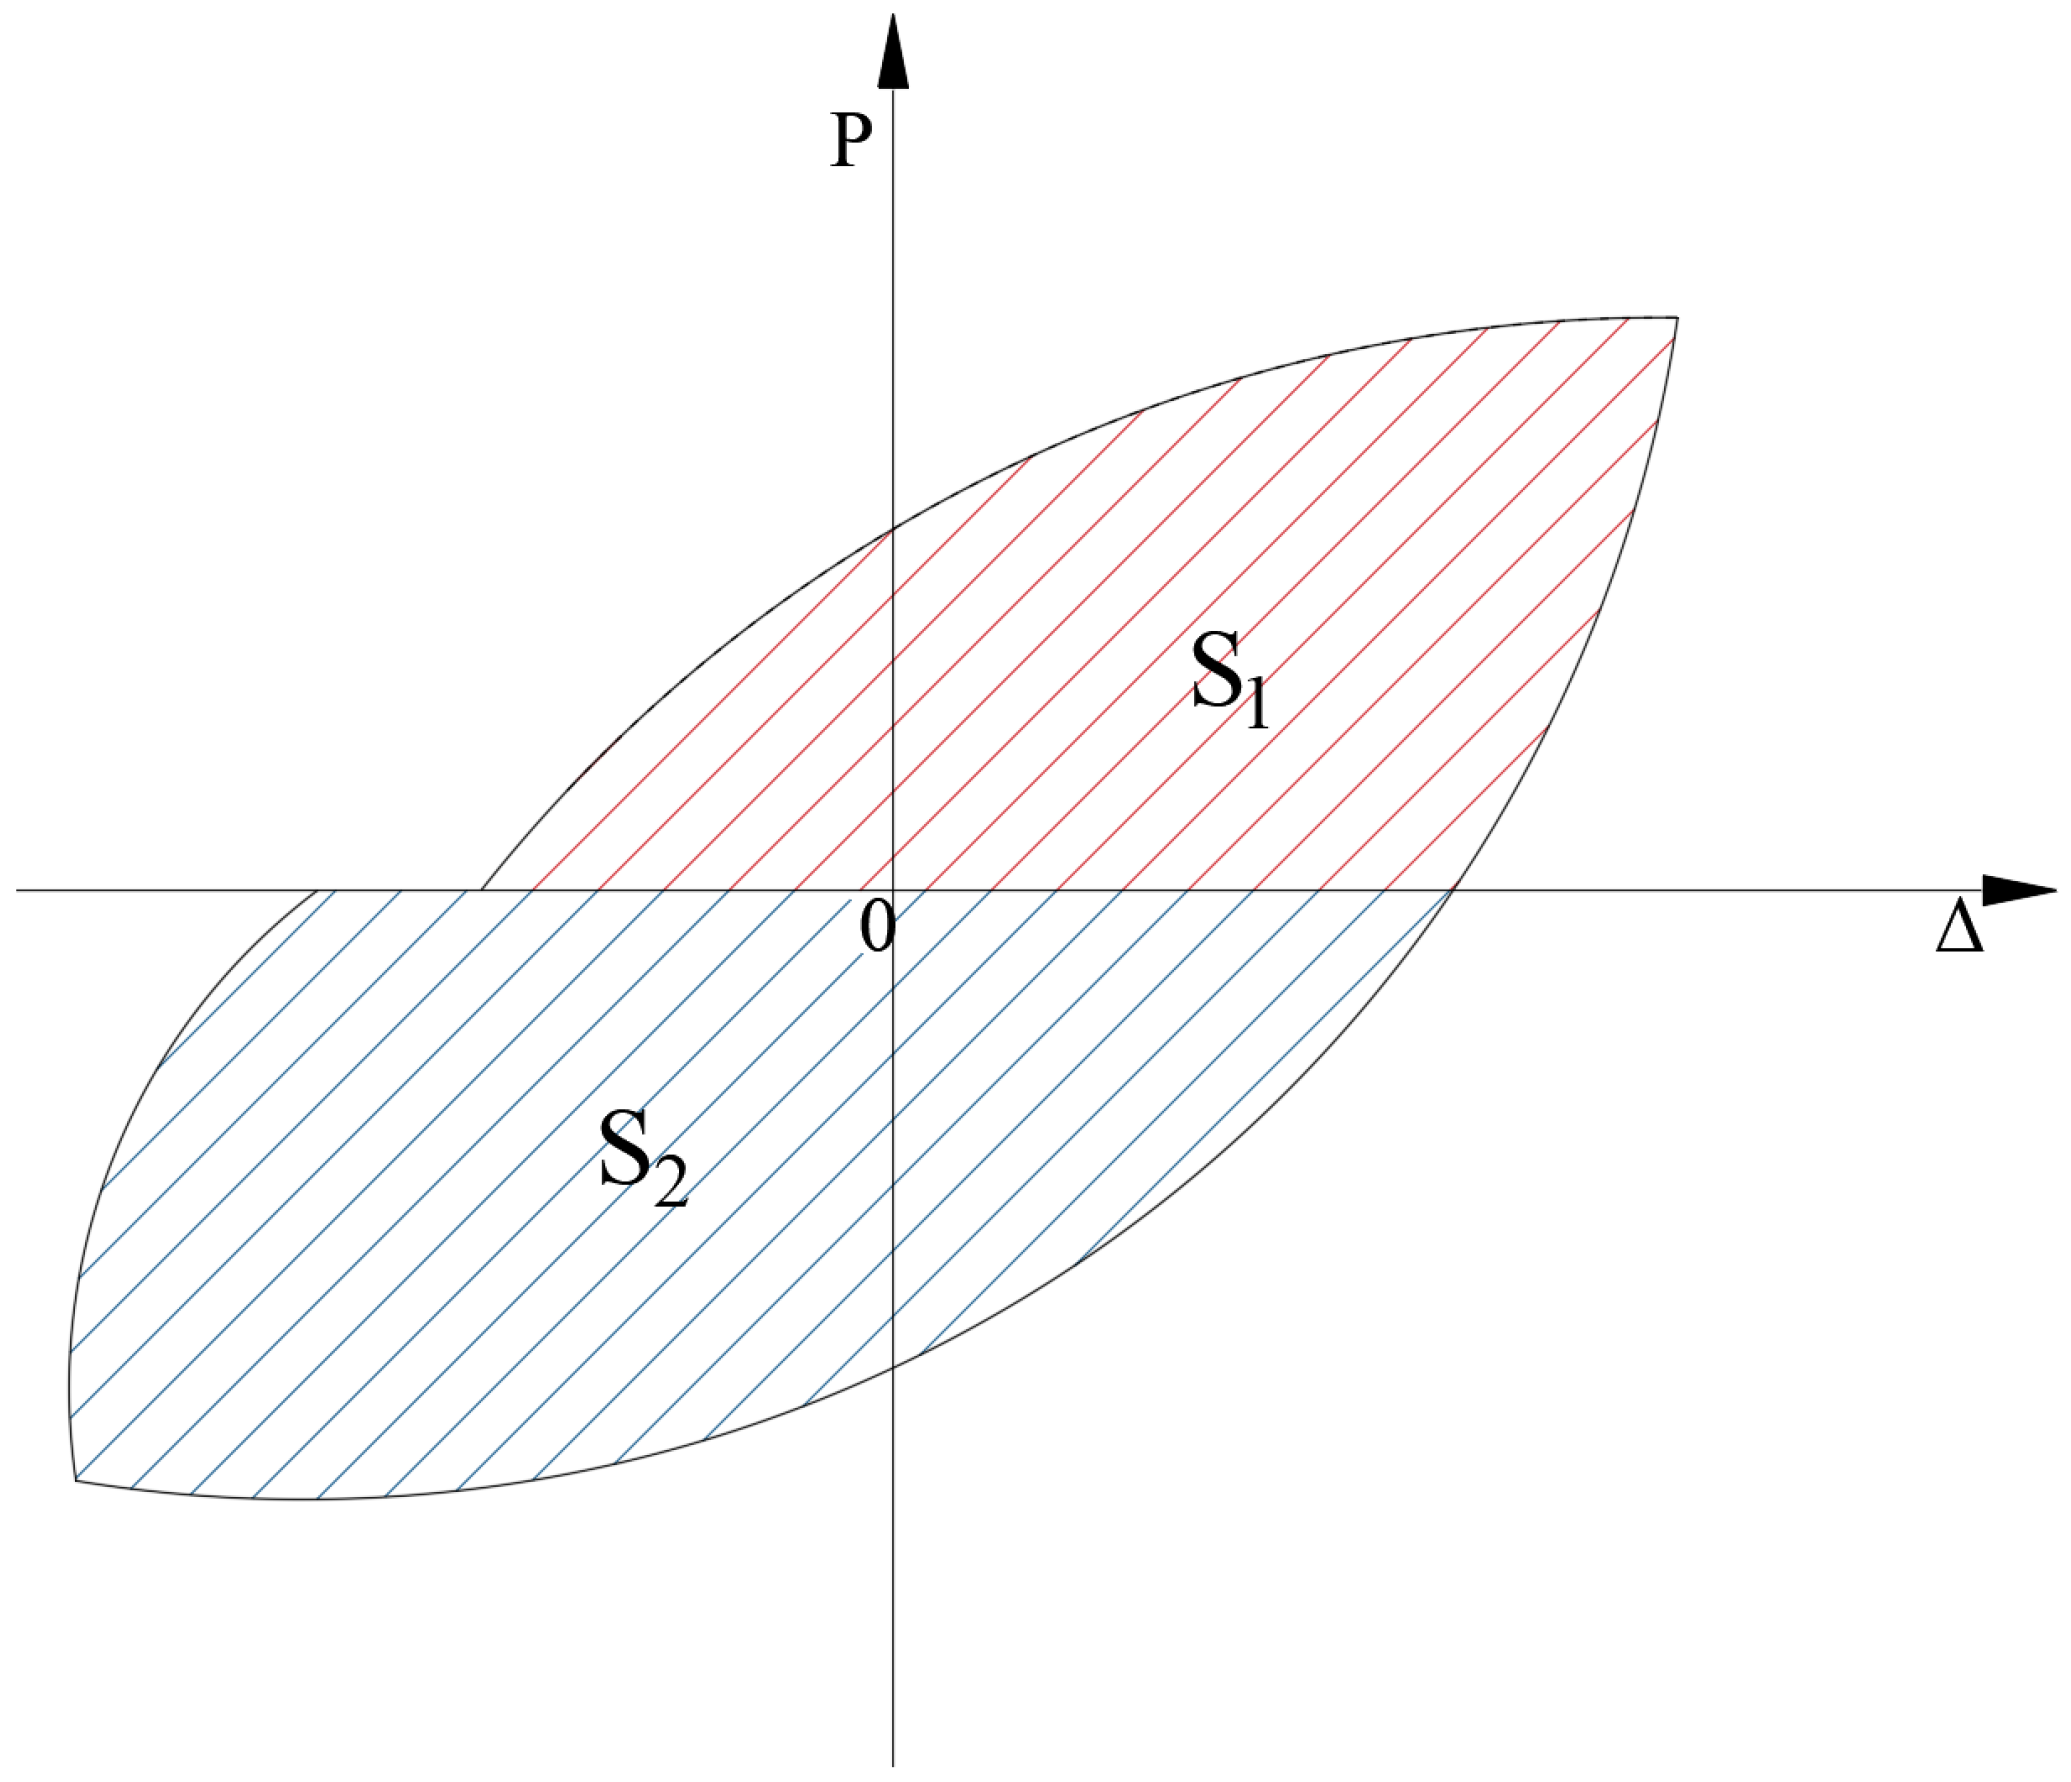
The hysteretic behavior of the specimens provides the fundamental basis for evaluating their energy dissipation capacity under both elastic and inelastic states. As shown in Figure 10, a typical hysteresis loop can be used to characterize this behavior, where the shaded areas (S1 and S2) in the forward and reverse loading directions represent the dissipated energy. In practice, the total energy dissipation is obtained through numerical integration of the force–displacement history, which is generally approximated by summing the areas of multiple trapezoidal segments. The cumulative energy dissipation of each specimen at different displacement levels is summarized in Figure 11.
When the lateral displacement at the wall top was relatively small, all specimens remained predominantly in the elastic range, resulting in limited cumulative energy dissipation. As the top displacement increased and the number of loading cycles grew, the shear walls gradually entered the elastic–plastic stage. Although the load-carrying capacity increased only slightly thereafter and began to decline after reaching the peak, the tensile–compressive energy dissipation of the reinforcement continued to be effectively mobilized throughout the loading process, enabling the overall energy dissipation capacity of the walls to keep increasing.
At comparable displacement levels, the CIP specimens exhibited significantly greater cumulative energy dissipation than their precast counterparts. Specifically, the precast specimens achieved 66–87% of the energy dissipation observed in the CIP specimens, with this ratio further decreasing at larger displacements. This discrepancy is primarily attributed to the localized concentration of damage in the bedding mortar layer of the precast specimens, whereas the CIP specimens developed wider damage zones, with more extensive cracking, severe concrete crushing, and reinforcement placed farther from the neutral axis compared to the bolts in the precast configuration. This reinforcement layout in CIP walls allowed better mobilization of tensile and compressive forces, enhancing overall energy absorption. Nevertheless, at a drift ratio of 2%, the precast specimens still retained approximately 80% of the energy dissipation capacity of the CIP specimens, indicating a comparatively favorable energy dissipation performance despite the inherent limitations of the bolted connection system.
In addition, axial compression was found to enhance the load-carrying capacity and expand the hysteresis loop area, thereby improving the energy dissipation capacity of the specimens compared with those tested without axial compression.

4. Performance Evaluation

The U.S. National Earthquake Hazards Reduction Program (NEHRP) [39] provides recommended performance criteria for shear walls in buildings and other structures, as summarized in Table 6. The ratio Pmax/Ent, defined as the experimental peak load divided by the theoretical capacity calculated using the actual material properties, indicates that all specimens possessed a certain safety margin in load-carrying capacity. The parameter λ was used to evaluate the energy dissipation capacity by comparing the area enclosed by the hysteresis loops with that of two parallelograms bounded by Kinitial. Here Kinitial and Kf refer to the initial secant stiffness and the secant stiffness between ±0.1 times the ultimate displacement, respectively. Except for ROW2 under reverse loading, where significant stiffness degradation occurred, the ratios Kf/Kinitial for all other specimens exceeded 0.1. In summary, the key response parameters of all specimens did not exceed the code limits, confirming their safety under the design-level earthquake.

5. Conclusions

In view of the characteristics of shear walls in NPPs—namely, large wall thickness, high reinforcement ratio, and complex construction—this study proposes a precast shear wall system with double-row bolted vertical connections. This configuration reduces reinforcement connections and facilitates on-site assembly. Its out-of-plane seismic performance was assessed through low-cycle reversed loading tests under axial compression and non-compression conditions (with axial compression ratios of 0.2 and 0, respectively). The results were compared with those of CIP shear walls, and the main findings are as follows:
(1)
All shear wall specimens failed in a flexure-dominated mode, characterized by concrete crushing and spalling at the wall base, as well as yielding or even fracturing the boundary reinforcement/bolts. The primary difference was that damage in the precast specimens was concentrated in the bedding mortar layer, whereas in the CIP specimens, the damage height ranged from 100 mm to 300 mm above the base.
(2)
Precast and CIP specimens showed similar hysteretic patterns. Due to differences in longitudinal reinforcement and bolt locations relative to the central axis, and variations in wall damage, the hysteresis loops of precast specimens were slightly less full. Specimens under axial compression exhibited fewer hysteresis loops and more pronounced pinching compared with specimens without axial compression.
(3)
The skeleton curves of precast and CIP specimens followed consistent trends. Peak displacements varied slightly due to structural detailing and axial compression effects, and peak load differences were within 5%, satisfying the principle of equivalent load-bearing capacity. This confirms the reliability of the bolted connection system and indicates that design approaches for CIP walls can be directly applied to the precast system.
(4)
Regardless of axial compression, precast specimens showed slightly lower deformation capacity than CIP counterparts, but all met international code requirements. The ductility parameters of the PCSWs complied with European code provisions for medium- and high-ductility classes under the tested axial compression conditions. Additionally, the precast specimens exhibited smaller residual deformations compared with CIP walls.
(5)
Stiffness degradation curves were generally similar for both precast and CIP specimens. In later loading stages, precast specimens displayed slower stiffness degradation due to damage concentration in the bedding mortar layer. At a 2% drift ratio, the cumulative energy dissipation of PCSWs reached 80% of that of CIP walls. To further improve the energy dissipation performance of bolted connection shear walls, future research may consider increasing the horizontal reinforcement ratio in the connection zone to enhance confinement or incorporating high-ductility cementitious materials.
The experimental results demonstrate that the proposed bolted PCSW system for NPPs achieves seismic performance comparable to that of CIP walls. All specimens satisfied the performance criteria for reinforced concrete shear walls stipulated in NEHRP, validating the structural adequacy and practical applicability of the proposed system under design-level out-of-plane seismic loading.

Author Contributions

J.J.: Methodology, Supervision, Writing—review & editing. L.H.: Investigation, Writing—original draft preparation, Visualization. H.Y.: Investigation, Formal analysis. W.X.: Conceptualization, Supervision, Project administration, Funding acquisition. All authors have read and agreed to the published version of the manuscript.

Funding

This research received no external funding.

Data Availability Statement

The datasets in the current study are available from the corresponding author upon reasonable request.

Conflicts of Interest

The authors declare that there are no conflicts of interest.

References

  1. ACI 349-06; Code Requirements for Nuclear Safety-Related Concrete Structures and Commentary. American Concrete Institute: Farmington Hills, MI, USA, 2006.
  2. AISC N690s1; Specification for Safety-Related Steel Structures for Nuclear Facilities Including Supplement No. 1. American Institute of Steel Construction: Chicago, IL, USA, 2015.
  3. Parsi, S.S.; Mertz, G.; Whittaker, A.S. Evaluation of design equations for out-of-plane shear strength of deep concrete sections in nuclear power plant buildings. Nucl. Eng. Des. 2022, 386, 111545. [Google Scholar] [CrossRef]
  4. Hu, X.; Xue, W.; Lv, Y. Seismic Behavior of a New Type of Precast Concrete Shear Wall Using UHPC Connections at Boundary Elements. Eng. Struct. 2024, 302, 117468. [Google Scholar] [CrossRef]
  5. Xue, W.; Lei, J.; Zhang, B.; Huang, Q. Hysteretic Behavior of Full-Scale Precast U-Shaped Composite Beam–Column Connections with Large-Diameter Reinforcements under High Axial Compression. Buildings 2024, 14, 317. [Google Scholar] [CrossRef]
  6. Xue, W.; Zhang, B.; Liao, X. Cyclic Loading Response of Precast Concrete Frame with Composite Beams Prestressed by Partially Bonded Draped Tendons under High Axial Compression. Eng. Struct. 2025, 334, 120229. [Google Scholar] [CrossRef]
  7. Singhal, S.; Chourasia, A.; Chellappa, S.; Parashar, J. Precast Reinforced Concrete Shear Walls: State-of-the-Art Review. Struct. Concr. 2019, 20, 886–898. [Google Scholar] [CrossRef]
  8. Al-Noaimat, Y.A.; Chougan, M.; Albar, A.; Skibicki, S.; Federowicz, K.; Hoffman, M.; Ghaffar, S.H. Recycled brick aggregates in one-part alkali-activated materials: Impact on 3D printing performance and material properties. Dev. Built Environ. 2023, 16, 100248. [Google Scholar] [CrossRef]
  9. Liu, F.; Liu, A.; Wang, L.; Zhang, Q. Accurate Modeling and Wave Propagation Analysis of Cracked Slender Structural Members by the Spectral Element Method. Struct. Control Health Monit. 2023, 2023, 5569434. [Google Scholar] [CrossRef]
  10. Precast/Prestressed Concrete Institute (PCI). PCI Design Handbook, 8th ed.; Precast/Prestressed Concrete Institute: Chicago, IL, USA, 2017. [Google Scholar]
  11. Gong, Y.; Chu, Y.; Liu, Y.; Wang, Z. Experimental and Numerical Study on Mechanical Properties of PC Shear Wall Bolted Connection Joints. Adv. Struct. Eng. 2025, 28, 227–245. [Google Scholar] [CrossRef]
  12. Xue, W.; Bai, H.; Dai, L.; Xu, J. Seismic Behavior of Precast Concrete Beam–Column Connections with Bolt Connectors in Columns. Struct. Concr. 2021, 22, 1297–1314. [Google Scholar] [CrossRef]
  13. Liu, J.; Liu, Y.; Yu, D. Experimental and Numerical Studies on the Seismic Performance of New Assembled Concrete Frame Beam–Column Joints. Buildings 2023, 13, 329. [Google Scholar] [CrossRef]
  14. Soudki, K.A.; Rizkalla, S.H.; LeBlanc, B. Horizontal Connections for Precast Concrete Shear Walls Subjected to Cyclic Deformations. Part 1: Mild Steel Connections. PCI J. 1995, 40, 78–96. [Google Scholar] [CrossRef]
  15. Han, Q.; Wang, D.; Zhang, Y.; Zhang, J.; Liu, F. Experimental Investigation and Simplified Stiffness Degradation Model of Precast Concrete Shear Wall with Steel Connectors. Eng. Struct. 2020, 220, 110943. [Google Scholar] [CrossRef]
  16. Liu, H.; Guo, R.; Wang, Z.; Zhang, L.; Li, M. Experimental Study on Seismic Performance of Precast Concrete Shearing Walls Connected by High-Strength Bolts. J. Build. Eng. 2025, 101, 111817. [Google Scholar] [CrossRef]
  17. Liu, Q.; Wu, T.; Kong, Z.; Wang, S.; Cheng, R.; Zhou, Y.; Zhang, Y. Effects of Semi-Rigid Behavior on the Seismic Performance of the Precast Shear Wall with a Box-Shaped Connection Joint. Steel Compos. Struct. 2025, 56, 67–82. [Google Scholar]
  18. Xue, W.; He, L.; Liu, Y.; Dai, L.; Zhang, B. Cyclic Response of Precast Concrete Shear Walls with Bolt-Sleeve Hybrid Connections. J. Build. Eng. 2025, 101, 111846. [Google Scholar] [CrossRef]
  19. Xue, W.; Chen, S.; Hu, X.; Zhang, B.; Dai, L. Full-Scale Cyclic Test on Hybrid Connection Precast Shear Wall under High Axial Compression Ratio. Structures 2025, 77, 109150. [Google Scholar] [CrossRef]
  20. Guo, W.; Zhai, Z.; Cui, Y.; Zhang, M.; Zhang, J. Seismic Performance Assessment of Low-Rise Precast Wall Panel Structure with Bolt Connections. Eng. Struct. 2019, 181, 562–578. [Google Scholar] [CrossRef]
  21. Bhardwaj, S.R.; Varma, A.H.; Wazalwar, P. Axial Force–Biaxial Moment–Vector Shear (PMV) Interaction for Steel-Plate Composite (SC) Wall Piers. Nucl. Eng. Des. 2019, 349, 162–173. [Google Scholar] [CrossRef]
  22. Varma, A.H.; Malushte, S.R.; Sener, K.C.; Lai, B. Steel-Plate Composite (SC) Walls for Safety Related Nuclear Facilities: Design for In-Plane Forces and Out-of-Plane Moments. Nucl. Eng. Des. 2014, 269, 240–249. [Google Scholar] [CrossRef]
  23. Niroomandi, A.; Pampanin, S.; Dhakal, R.P.; Ashtiani, M.S.; Torre, C.D.L. Out-of-Plane Shear–Axial Failure in Slender Rectangular Reinforced Concrete Walls. Earthq. Eng. Struct. Dyn. 2022, 51, 2426–2448. [Google Scholar] [CrossRef]
  24. Cheng, Y.; He, H.; Sun, H.; Cheng, S. Experimental Study and Mechanism Analysis of Out-of-Plane Seismic Performance of Reinforced Concrete Shear Walls. J. Build. Eng. 2023, 80, 108058. [Google Scholar] [CrossRef]
  25. Xue, W.-C.; Li, Y.; Cai, L.; Hu, X. In-Plane and Out-of-Plane Mechanical Behavior of Double-Faced Superposed Concrete Shear Walls. Eng. Mech. 2018, 35, 47–53. (In Chinese) [Google Scholar]
  26. Xue, W.; Huang, Q.; Xu, Z.; Liu, Y.; Dai, L. Out-of-Plane Response of Precast Concrete Shear Walls Connected via Grouted Sleeves. Struct. Concr. 2024, 25, 3570–3582. [Google Scholar] [CrossRef]
  27. Li, X.; Li, X. Out-of-Plane Flexural Capacity of Double Steel Plates and Concrete Infill Composite Shear Walls for Nuclear Power Engineering. J. Harbin Eng. Univ. 2017, 38, 1238–1246. [Google Scholar]
  28. Peikko Group. SUMO Wall Shoe for Bolted Wall Connections. Peikko Technical Manual. 2014. Available online: https://www.peikko.com/products/product/sumo-wall-shoe/ (accessed on 20 August 2025).
  29. DGJ 08-2154-2022; Code for Design of Monolithic Precast Concrete Public Buildings. Tongji Press: Shanghai, China, 2022.
  30. GB/T 51231-2016; Technical Code for Assembled Buildings with Concrete Structure. China Architecture & Building Press: Beijing, China, 2016.
  31. JGJ 1-2014; Technical Specification for Precast Concrete Structures. China Architecture & Building Press: Beijing, China, 2014.
  32. GB/T 50152-2012; Standard for Test Method of Concrete Structures. China Architecture & Building Press: Beijing, China, 2012.
  33. Teng, M.-R.; Feng, P.; Lin, H.-W.; Qu, Z. Seismic performance assessment based on hysteresis curves: Index definition, algorithm optimization and automatic identification. Eng. Mech. 2025, 42, 89–101. [Google Scholar]
  34. ACI 318-19; Building Code Requirements for Structural Concrete and Commentary. American Concrete Institute: Farmington Hills, MI, USA, 2019.
  35. Park, R. Evaluation of ductility of structures and structural assemblages from laboratory testing. Bull. N. Z. Soc. Earthq. Eng. 1989, 22, 155–166. [Google Scholar] [CrossRef]
  36. EN 1998-1:2004; Eurocode 8: Design of Structures for Earthquake Resistance—Part 1: General Rules, Seismic Actions and Rules for Buildings. CEN: Brussels, Belgium, 2004.
  37. GB50011-2010; Code for Seismic Design of Buildings. Ministry of Housing and Urban-Rural Development of the People’s Republic of China: Beijing, China, 2016.
  38. JASS 10; Precast Concrete Engineering. AIJ: Tokyo, Japan, 2003. (In Japanese)
  39. National Earthquake Hazards Reduction Program (NEHRP). Recommended Seismic Provisions for New Buildings and Other Structures; Building Seismic Safety Council: Washington, DC, USA, 2020. [Google Scholar]
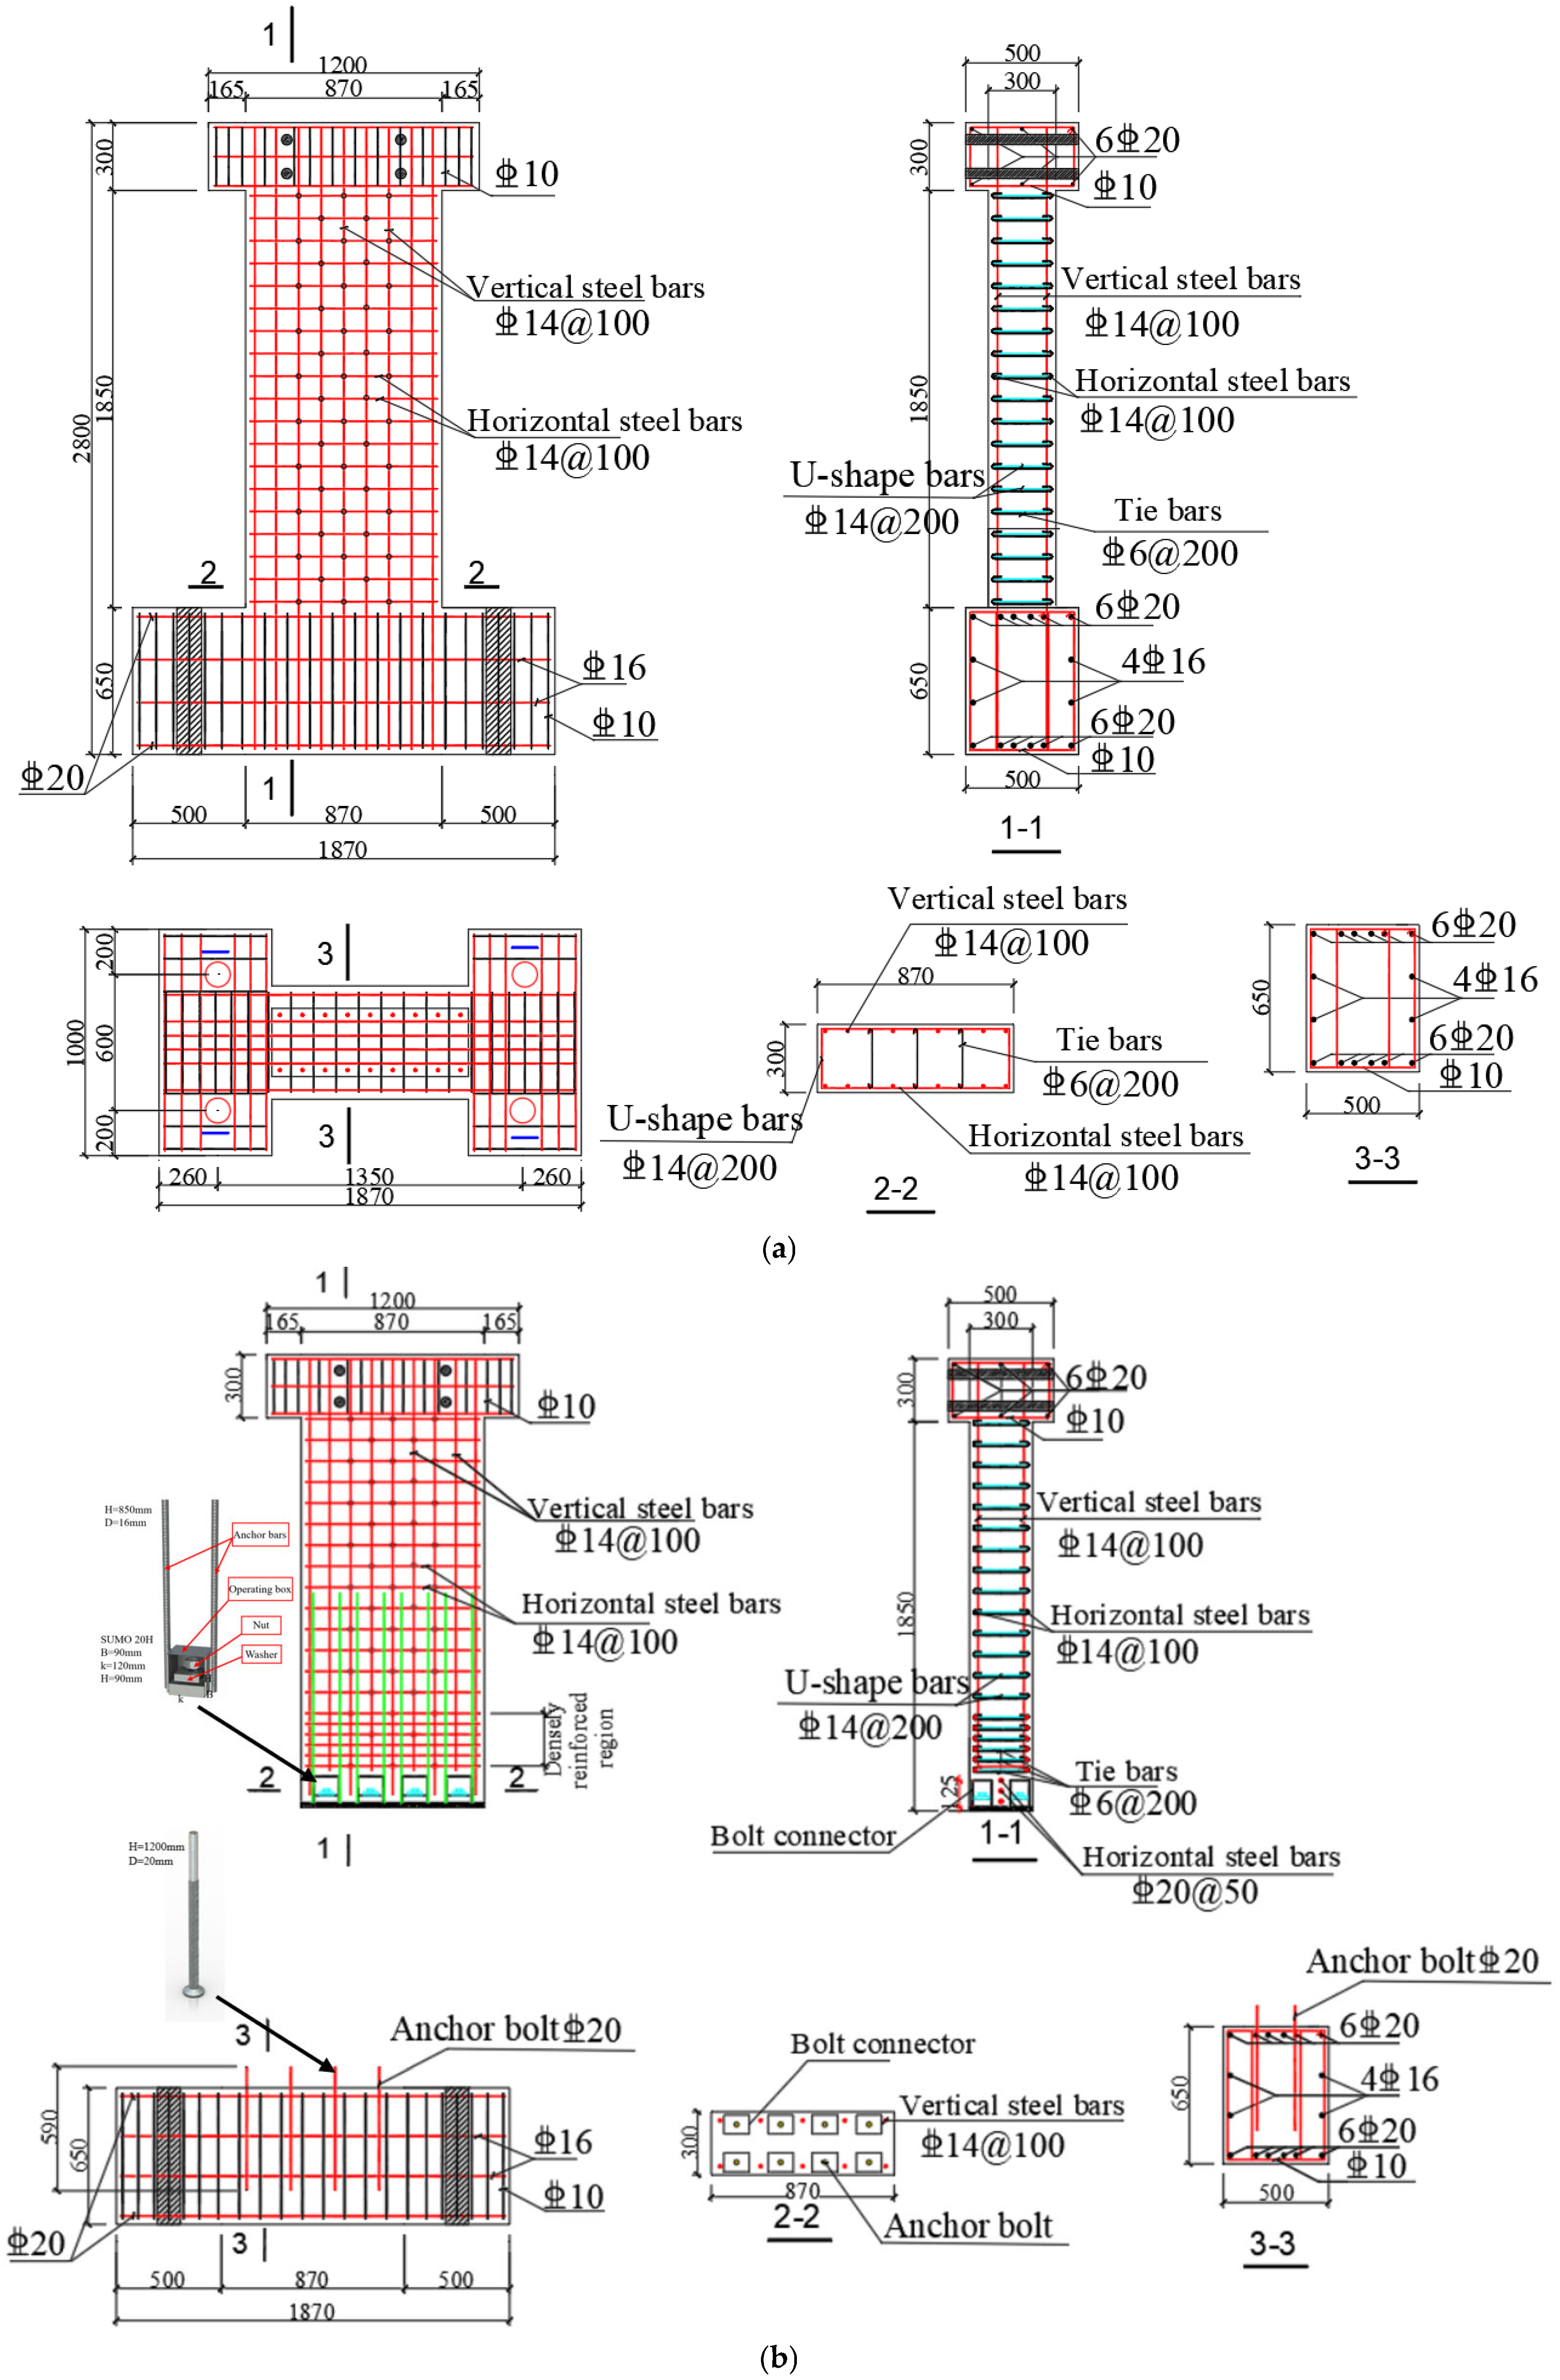
Figure 1. Geometric configurations of test specimens. (a) ROW1 and ROW2; (b) POW1 and POW2.
Buildings 15 03787 g001
Figure 2. Casting of specimens: (a) placement of reinforcement and bolt connector; (b) casting the wall panel concrete; (c) assemble of wall panel; (d) grouting.
Buildings 15 03787 g002
Figure 3. Test setup: (a) loading schematic diagram; (b) test loading diagram; (c) details of LVDT layout; (d) details of the strain gauge layout in the CIP specimen; (e) details of strain gauge layout in the precast specimen.
Buildings 15 03787 g003
Figure 4. Response of group Ⅰ: (a) crack pattern of ROW1; (b) failure pattern of ROW1; (c) crack pattern of POW1; (d) failure pattern of POW1.
Buildings 15 03787 g004
Figure 5. Response of group II: (a) crack pattern of ROW2; (b) failure pattern of ROW2; (c) crack pattern of POW2; (d) failure pattern of POW2.
Buildings 15 03787 g005aBuildings 15 03787 g005b
Figure 6. Hysteresis curves.
Buildings 15 03787 g006
Figure 7. Envelopes of hysteresis loops: (a) group I; (b) group II.
Buildings 15 03787 g007
Figure 8. Schematic diagram of the energy approach.
Buildings 15 03787 g008
Figure 9. Stiffness degradation: (a) Group Ι; (b) Group ΙΙ.
Buildings 15 03787 g009
Figure 10. Schematic diagram of energy dissipation.
Buildings 15 03787 g010
Figure 11. Accumulative dissipated energy: (a) Group Ι; (b) Group II.
Buildings 15 03787 g011
Table 1. Shear wall specimen parameters list.
Specimens №Specimen TypeAxial Compression RatioVertical Reinforcement Connection Method
ROW1CIP0.2
POW1Precast0.2Bolt
ROW2CIP0
POW2Precast0Bolt
Table 2. Properties of wall concrete.
SpecimensCube Strength
fcu (MPa)
Prism Strength
fc (MPa)
tensile Strength
ft (MPa)
Elastic Modulus
Ec (×104 MPa)
ROW144.332.43.53.01
POW141.229.83.22.96
ROW248.834.13.73.29
POW247.535.13.63.26
Table 3. Properties of high-strength grouting material.
SpecimensCube Strength fcu (MPa)Flexural Strength ff
(MPa)
Elastic Modulus Ec (×104 MPa)
ROW1
POW183.710.164.15
ROW2
POW282.59.623.88
Table 4. Properties of reinforcing bars.
Diameter (mm)Yield Strength fy (N/mm2)Maximum Strength fu (N/mm2)Elastic Modulus Ec (×105 MPa)Elongation (%)
Φ20 (screw)5206622.0225
Φ144255882.0724
Φ64185562.0521
Table 5. Characteristic values of the envelop curves.
SpecimenPy (kN)Δy (mm)Pmax (kN)Δmax (mm)Pu (kN)Δu (mm)ΔuyAvgΔu/HAvg
ROW1P125.724.66138.937.56118.161.162.482.681/321/33
N139.420.7714236.77120.759.942.881/33
POW1P144.119.72147.525.99125.456.872.882.961/351/34
N124.920.23126.921.58107.961.893.051/32
ROW2P77.3725.2885.440.6283.2121.184.794.541/171/18
N78.0923.0083.340.3276.2100.824.281/20
POW2P80.1233.2990.812277.18140.44.223.891/141/14
N75.8742.9787.0124.473.95152.73.561/13
Note: P denotes that the positive direction; N denotes that the negative direction; H is the wall height measuring from the loading point to the bottom of the wall.
Table 6. Evaluation indicators of the proposed walls.
n = 0.2n = 0Acceptance Criteria
POW1ROW1POW2ROW2
P max / E n t 1.1251.0451.0301.0350.90–1.20
Relative   Energy   dissipation   ratio   λ 0.3540.4880.2610.272≥0.125
K f / K i n i t i a l Pos.0.1160.1930.1200.110≥0.1
Neg.0.3130.1840.1180.076
Disclaimer/Publisher’s Note: The statements, opinions and data contained in all publications are solely those of the individual author(s) and contributor(s) and not of MDPI and/or the editor(s). MDPI and/or the editor(s) disclaim responsibility for any injury to people or property resulting from any ideas, methods, instructions or products referred to in the content.