Article

Shear Behavior of Dowel–Stud Hybrid Connectors for HSS-HPC Composite Structures: Geometry Optimization and Material Synergistic Effects

1
College of Civil Engineering, Xiangtan University, Xiangtan 411105, China
2
China Construction Fifth Engineering Division Corp., Ltd., Changsha 410004, China
*
Author to whom correspondence should be addressed.
Buildings 2025, 15(20), 3748; https://doi.org/10.3390/buildings15203748
Submission received: 28 August 2025 / Revised: 4 October 2025 / Accepted: 11 October 2025 / Published: 17 October 2025
(This article belongs to the Section Building Structures)

Abstract

The growing adoption of steel–concrete composite beams has spurred extensive use of high-strength steel (HSS) and high-performance concrete (HPC) in composite structures, capitalizing on their superior mechanical properties. To address the limited shear capacity of conventional stud connectors and unitary steel dowels, this study proposed a dowel–stud hybrid connector for advanced composite systems. Push-out tests were conducted on one conventional shear stud specimen, one monolithic steel dowel specimen, and four dowel–stud hybrid connector specimens. Experimental and finite element analyses were employed to evaluate the effects of the stud length, diameter, and layout on the failure modes and shear performance of composite connectors. The findings demonstrated that the hybrid connectors exhibited significantly enhanced shear capacity and ductility compared to those of both conventional stud connectors and monolithic steel dowels. Failure primarily occurred at the roots of the steel dowels and shear studs, with the underlying concrete exhibiting crushing failure. Increasing the diameter from 6 mm to 22 mm marginally influenced the ultimate shear capacity (the variation was <4%) but notably improved the initial stiffness. For composite connectors with 13 mm diameter studs, increasing the stud length from 40 mm to 80 mm and 120 mm raised the ultimate capacity by 4.7% and 8.8%, respectively. Conversely, for composite connectors with 16 mm diameter studs, length variations exerted negligible influence (<4%) on the ultimate capacity. In addition, the study layout critically influenced the performance. At a fixed 16 mm diameter, relocating studs from the dowel center to the sub-root region increased the shear capacity by 23%.

1. Introduction

Compared to conventional concrete bridges, steel–concrete composite bridges offer superior fabrication and erection efficiency, accelerated construction speed, and optimal utilization of the performance characteristics of both steel and concrete. These advantages have driven their widespread adoption in medium- and small-span bridges in recent decades [1,2,3].
In recent years, leveraging ultrahigh-performance concrete (UHPC), with its exceptional compressive strength and fracture toughness, along with high-strength steel (HSS), exhibiting superior yield strength and ductility, research on their application in steel–concrete composite structures has gained significant momentum [4,5]. In early research, Ban and Bradford [6] demonstrated, through a parametric study of 40 cases, that composite beams utilizing HSS grades of 460 MPa, 690 MPa, and 960 MPa exhibit significantly reduced nonlinear deformations under identical loads compared to those with mild steel rated at 235 MPa. Shamass and Cashell [7] further validated the applicability of HSS with yield strengths ranging from 460 to 700 MPa in composite beams through finite element analysis. Their work highlighted that the plasticity analysis methods specified in Eurocode 4 tend to overestimate the performance of HSS composite beams, thus necessitating the introduction of reduction factors. Zhang et al. [8] demonstrated through flexural tests that steel–UHPC composite beams with shear stud connections achieve a 340% increase in the cracking load and a 26% higher ultimate capacity compared to those of conventional steel–concrete composite beams while exhibiting significantly slower crack propagation characterized by 75% narrower crack widths at critical sections, attributable to UHPC’s superior tensile resistance and fiber-bridging mechanisms. Tong et al. [9] revealed through a comparative study that high-strength steel HSS-UHPC composite beams exhibit significantly less damage in concrete slabs under identical deflection conditions. Their study showed that these beams achieve a 22% higher ultimate load-bearing capacity compared to that of HSS-C60 composite beams. These studies collectively demonstrate the synergistic interaction between the excellent crack resistance of HPC and the superior strength of HSS. This interaction significantly enhances both the load-bearing efficiency and service performance of composite structures.
The load-slip behavior and ultimate shear capacity of shear connectors critically govern the composite action efficiency in steel–concrete composite structures [10,11,12]. Steel dowel shear connectors originated from Perfobond (PBL) shear connectors through technical evolution [13]. PBL shear connectors exhibit superior shear stiffness, shear resistance, and fatigue resistance in composite beams [14,15,16]. However, PBL connectors require reinforcing bar insertion in perforated holes, complicating construction processes, while perforated steel plates compromise concrete slab integrity, making decks prone to splitting failures [17,18]. To address these limitations, researchers have developed continuous steel dowel shear connectors fabricated by cutting I-beams [19], with subsequent geometric optimization yielding novel dowel profiles, including PZ (Puzzle Shape) and MCL (Modified Clothoidal Shape) configurations [20,21]. Steel dowel shear connectors demonstrate exceptional advantages, characterized by superior shear resistance under static loading, high stiffness in the elastic range, and outstanding ductility [22,23]. In steel dowel shear connectors, structural failure manifests as horizontal cracking at dowel roots, accompanied by significant plastic deformation, representing ductile failure behavior primarily governed by the steel’s yield strength and dowel’s thickness [24,25,26]. Concrete failure manifests as shear failure between steel dowels and the development of conical spalling on concrete surfaces along the principal stress direction adjacent to dowels [27,28,29]. The failure mode of concrete is collectively dictated by its compressive strength, shear area, and the configuration of transverse reinforcement [30].
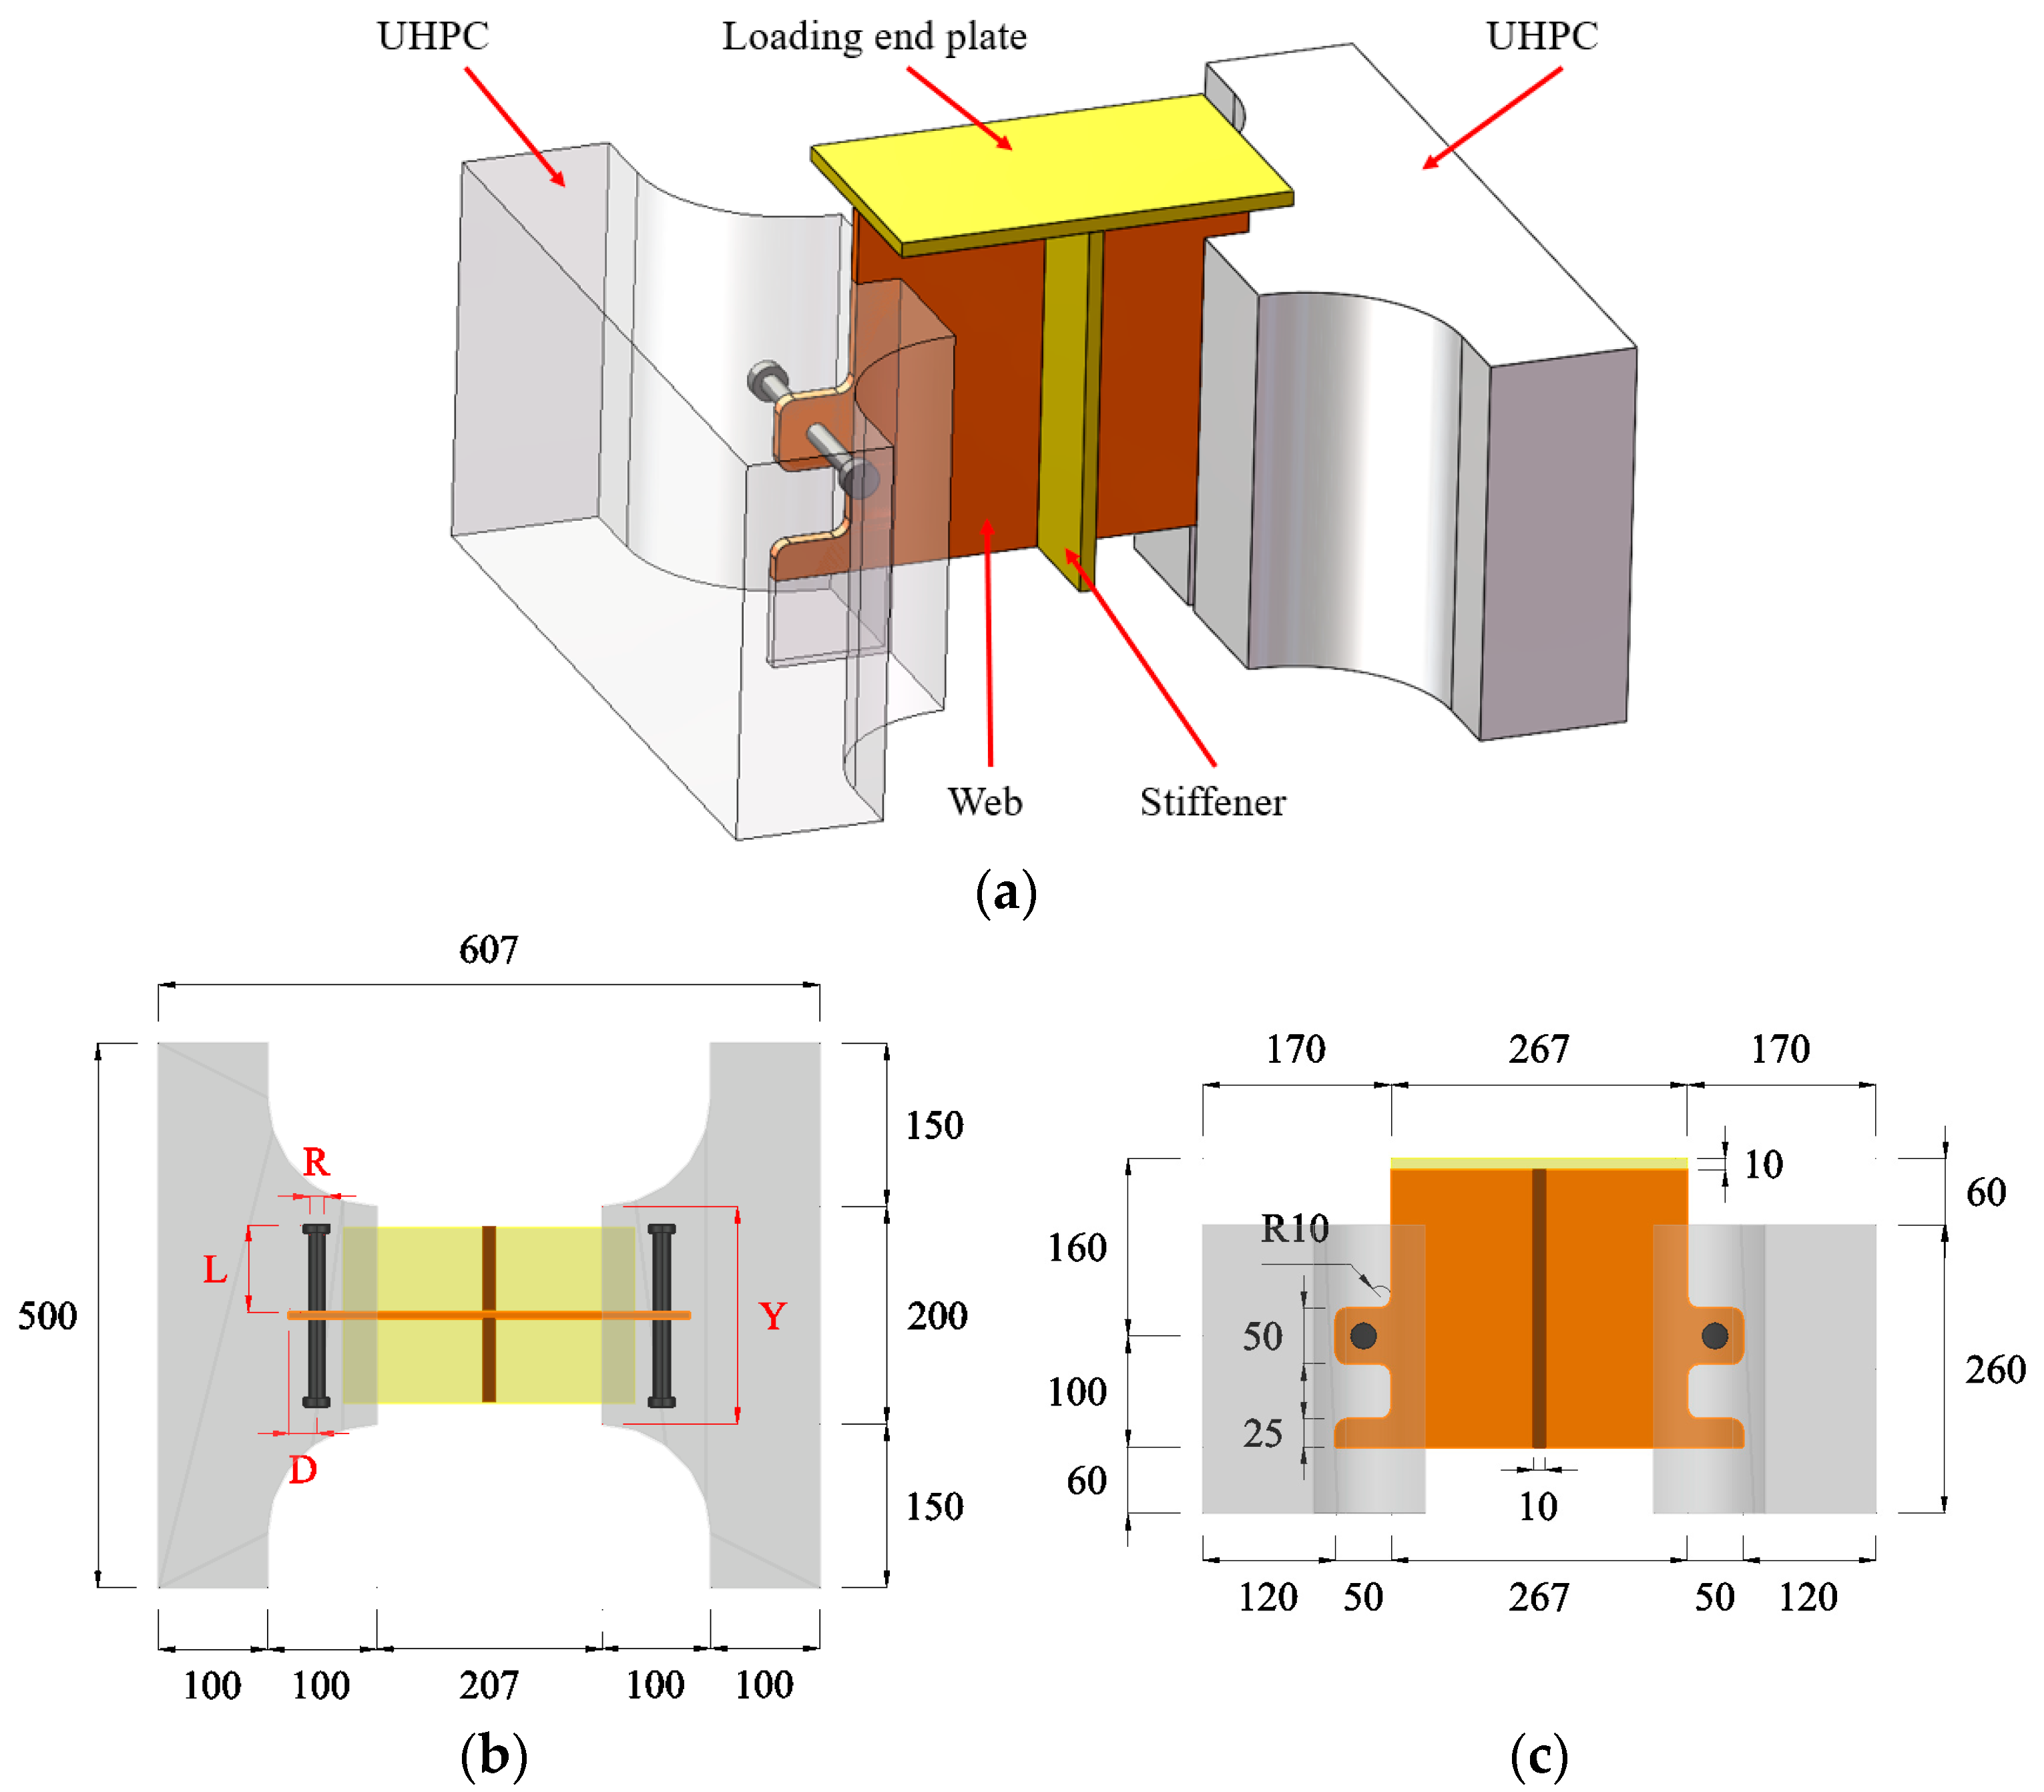
To achieve bridge lightweighting and enhance the load-bearing capacity of steel–concrete composite bridges, this study proposes a dowel–stud hybrid shear connector. As shown in Figure 1, The connector comprises T-shaped high-strength steel girders with steel dowels welded to the top flange surface, HPC bridge decks, and shear studs welded bilaterally along the steel dowels. Enhancing the yield strength of steel, compressive strength of concrete, and effective bearing area significantly improves both the stiffness and ultimate capacity of shear connectors.
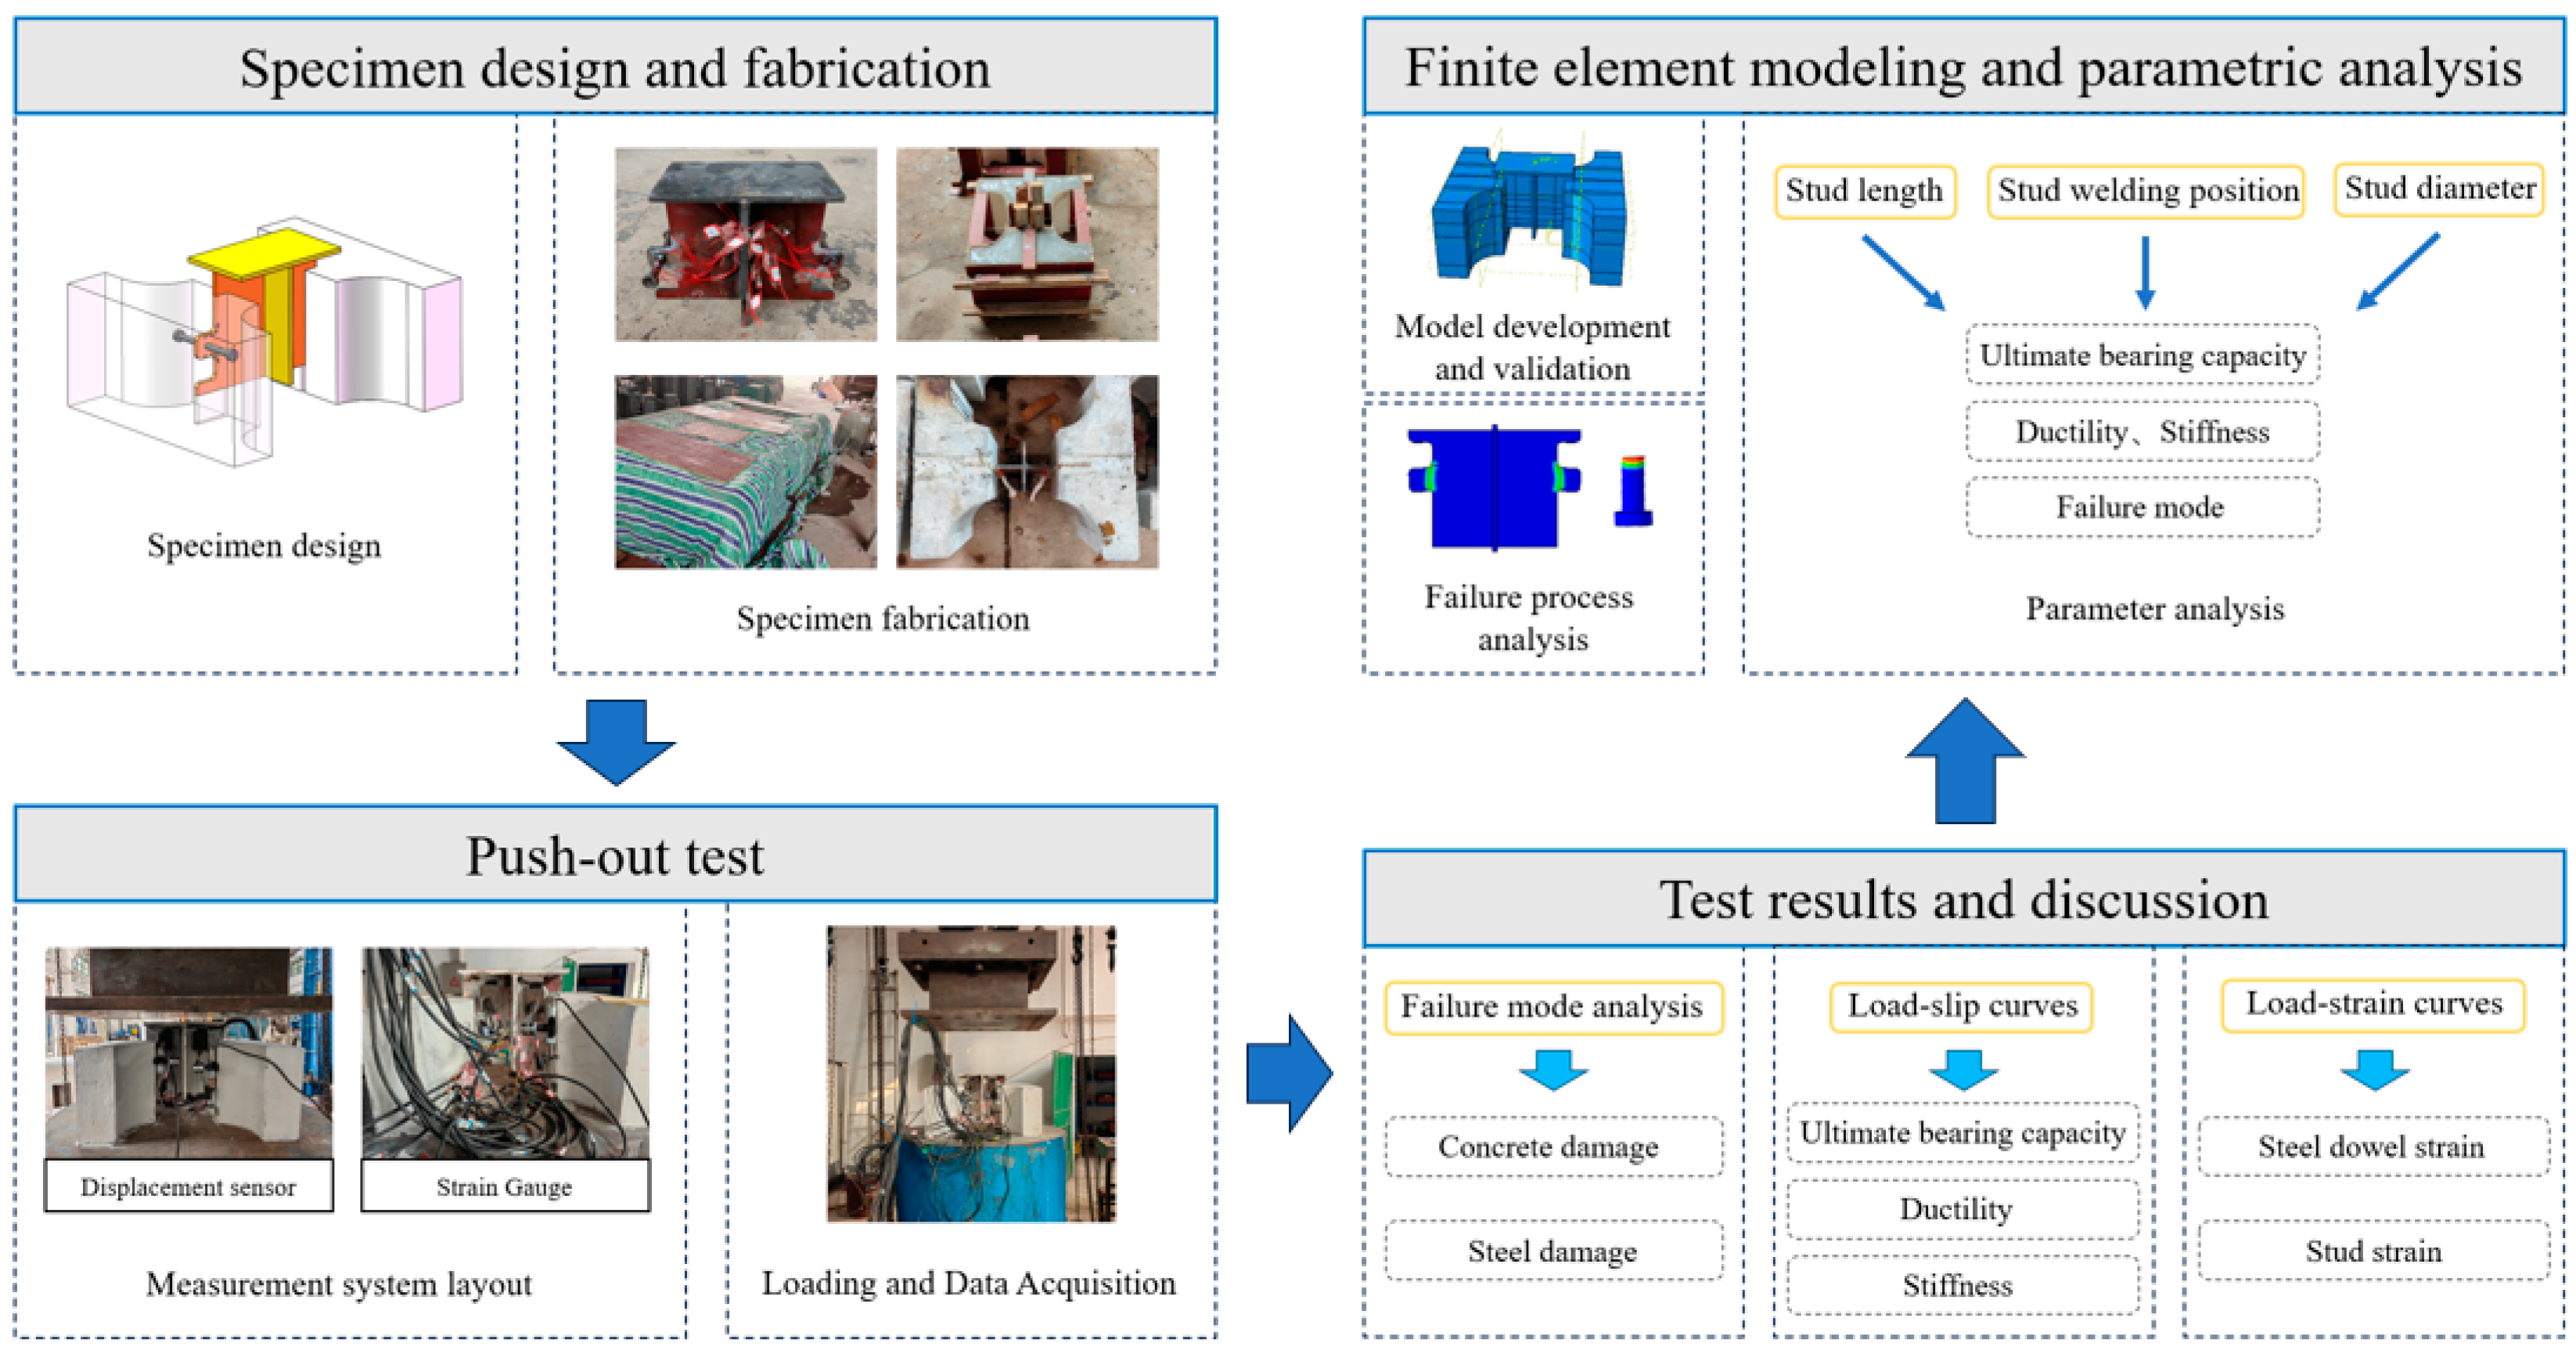
This study conducted static axial push-out tests on six specimens under the conditions of fixed high-strength steel strength, fixed concrete strength, and rectangular steel dowels with rounded corners, to analyze the failure mode, ultimate shear capacity, stiffness, and ductility of dowel–stud hybrid shear connectors. Due to the limited number of specimens, the experimental results may exhibit certain discreteness. The failure process of the connectors was further investigated through finite element analysis. Additionally, parametric studies were performed to examine the influences of the stud length, diameter, and welding layout, systematically exploring the effects of stud parameters on the mechanical behavior of the connectors while maintaining a constant concrete strength and steel dowel geometry. The research process is illustrated in Figure 2.

2. Experimental Program

2.1. Specimen Design and Fabrication

Compared with traditional composite beams, the use of high-strength materials effectively reduces the self-weight of the bridge, but there is still room for optimization in its structure. First, the top flange of the I-section steel member is located near the neutral axis of the composite beam, which may prevent it from effectively utilizing its tensile capacity. Additionally, in common stud connectors and dowel connectors, the load-bearing area at the steel–concrete interface is relatively small, making stress concentration prone to occur at the shear connectors, leading to interfacial slip failure.
As shown in Figure 3, the dowel–stud hybrid shear connector consists of T-shaped high-strength steel girders, steel dowels welded to the top flange surface, HPC bridge decks, and shear studs welded bilaterally along the steel dowels. The top flange of the I-shaped steel is removed, with the weight of the bridge deck borne by the studs welded on both sides of the steel dowels. Simultaneously, stress concentration is avoided by increasing the load-bearing area of the steel–concrete interface within the connector. Additionally, redundant portions of the concrete slabs on both sides are eliminated, with concrete fillets provided only around the connector to ensure its strength, thereby further reducing self-weight.
To investigate the shear behavior of dowel–stud hybrid connectors and the influences of stud geometric parameters on connector performance, this paper designed eight push-out test specimens. The effects of the stud diameter, welding layout, and stud length on the shear behavior of dowel–stud hybrid shear connectors were considered. The arc-shaped fillet in HPC ensures the optimal stress distribution for both steel dowels and shear studs.
The specific parameters of the specimens are shown in Table 1. Specimen numbers contain the key parameters of the specimens. Definitions of these parameters and specimen dimensions are detailed in Figure 4. For example, D25L80R16Y200 denotes a specimen with stud welding at a position 25 mm from a dowel crown, a stud length of 80 mm, a stud diameter of 16 mm, and an HPC fillet thickness of 200 mm.
During specimen fabrication, the steel plates and stud components were first cut and welded. Based on dimensional drawings, Q690 and Q345 steel plates were laser-cut to produce web plates, end plates, and stiffening ribs. Additionally, in accordance with the provisions of the Metallic Materials—Tensile Testing at Room Temperature [31], three tensile test specimens of identical dimensions were extracted from the base material. Welding positioning lines were then marked on the web surface, after which the stiffening ribs were welded to the center of the web. Positioning points for stud welding were marked on the steel pin section of the web before proceeding with stud welding. Prior to strain gauge attachment, the target areas were smoothed with fine sandpaper and wiped with alcohol cotton swabs to remove dust. Strain gauges were then affixed to designated locations on the steel dowels and studs using adhesive to monitor strain responses during loading. The attached strain gauges were coated with a layer of two-component epoxy structural adhesive for protection.
The HPC used in the test was prepared by mixing self-compacting castable materials with steel fibers. The HPC mixture maintained a water-to-glue ratio of 1:10, with steel fibers accounting for 4% of the total mass. The formwork was constructed according to the specified shapes, and continuous vibration was applied during pouring to ensure compaction. Nine 100 × 100 × 100 mm cubic test blocks were prepared alongside the specimens for concrete strength testing. All the specimens and test blocks were cured continuously for three days in a constant-temperature steam-curing chamber at 70 to 80 °C. After natural cooling, putty powder was applied to the concrete surfaces, and identification labels were marked on the sides to complete pre-test preparations. The preparation process of the specimens is shown in Figure 5.
The compressive strength of HPC test blocks was determined using specimens fabricated in compliance with the Chinese national standard GB/T 50152-2012: Test Methods of Concrete Structures [32]. The measured strength was then converted pursuant to GB/T 50107-2010: Evaluation of the Concrete Compressive Strength [33] to obtain the standardized cubic compressive strength value of the HPC. The compressive strength test results for steel fibers showed a standard deviation of 20.9 MPa and a coefficient of variation of 2.14%, demonstrating the high reliability of the concrete strength data. Stiffeners and loading endplates utilized Q345 steel (Hunan Lida Engineering Machinery Manufacturing Co., Ltd., Changsha, China), while webs employed Q620 steel (Hunan Lida Engineering Machinery Manufacturing Co., Ltd., Changsha, China). To characterize the mechanical properties of the steel, tensile specimens sourced from the identical material batch were tested in accordance with the Chinese national standard GB/T 1591-2018: High strength low alloy structural steels [34]. The key mechanical parameters of HPC and steels are listed in Table 2 and Table 3, respectively.

2.2. Layout of Measurement Points

As illustrated in Figure 6, strain gauges (3 mm × 5 mm) were strategically bonded to both steel dowels and shear studs to monitor strain distributions during testing. The strain gauge model is BFH120-5AA-D300 (Guangce Co., Ltd., Yiyang, China) with a gauge factor of 2.0 ± 1%. Strain gauges were positioned 4.8 mm from the upper and lower edges of the steel dowels, with four gauges symmetrically distributed on each side. Strain gauges on shear studs were bonded at two critical locations: stud roots and 40 mm above the roots. The strain gauge numbers designate mounting locations. The first letter specifies the orientation relative to the loading direction, where N and S denote the north side and the south side, respectively. The second letter signifies the vertical position, with S indicating the upper surface and X the lower surface.
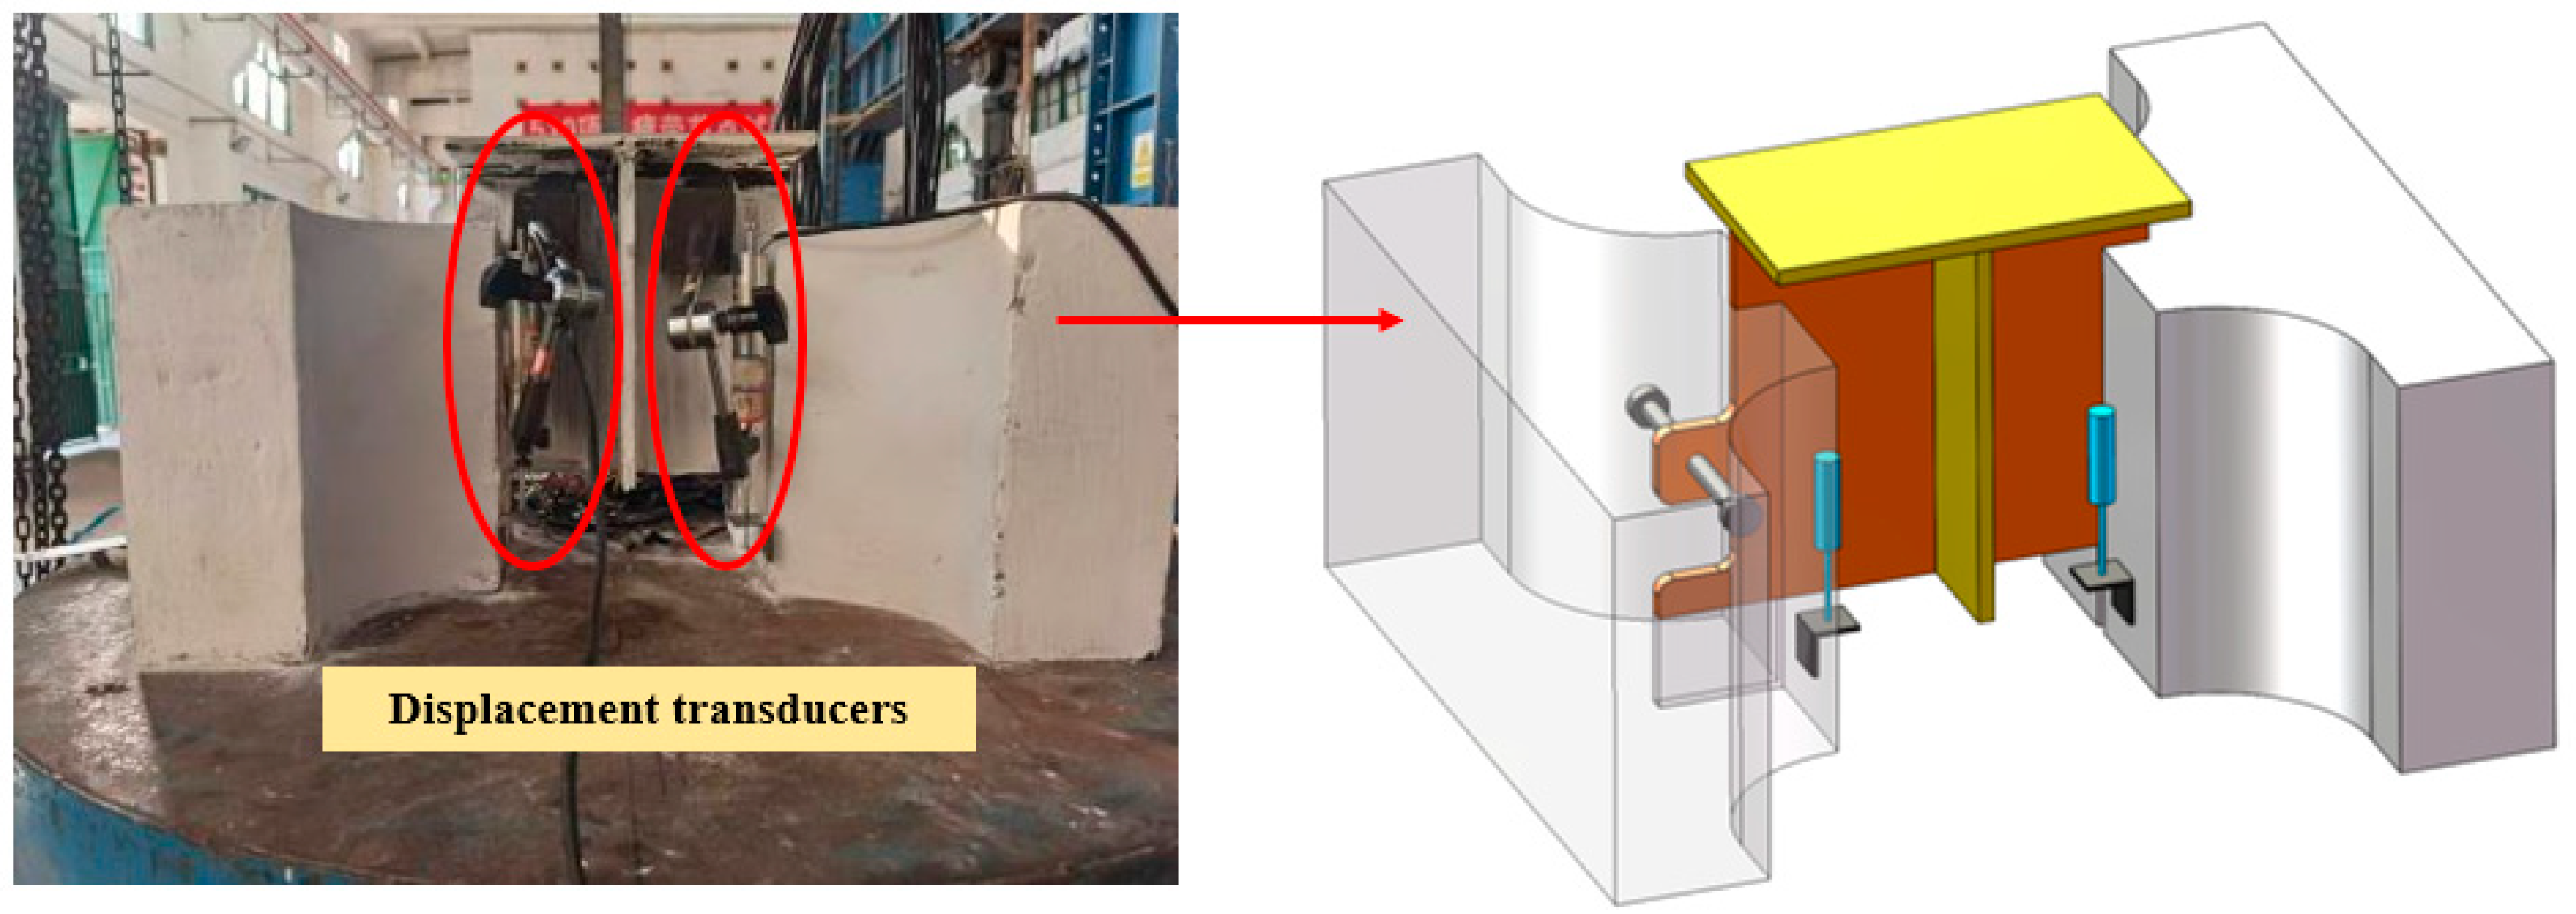
To measure the relative displacement between the steel web and HPC, two vertical displacement transducers were installed on the eastern and western faces of the specimen. The test employed YWC-type displacement transducers with a 50 mm range, a sensitivity of 0.1 mV/mm, and an accuracy of ±0.3% FS. Steel angle plates were bonded to the HPC surface 20 mm above the plate bottom edge, with transducer tips contacting the angle plate surfaces. Swivel-type magnetic bases were attached to the steel plate at the same elevation as the HPC upper surface, as detailed in Figure 7.

2.3. Test Device and Loading Procedure

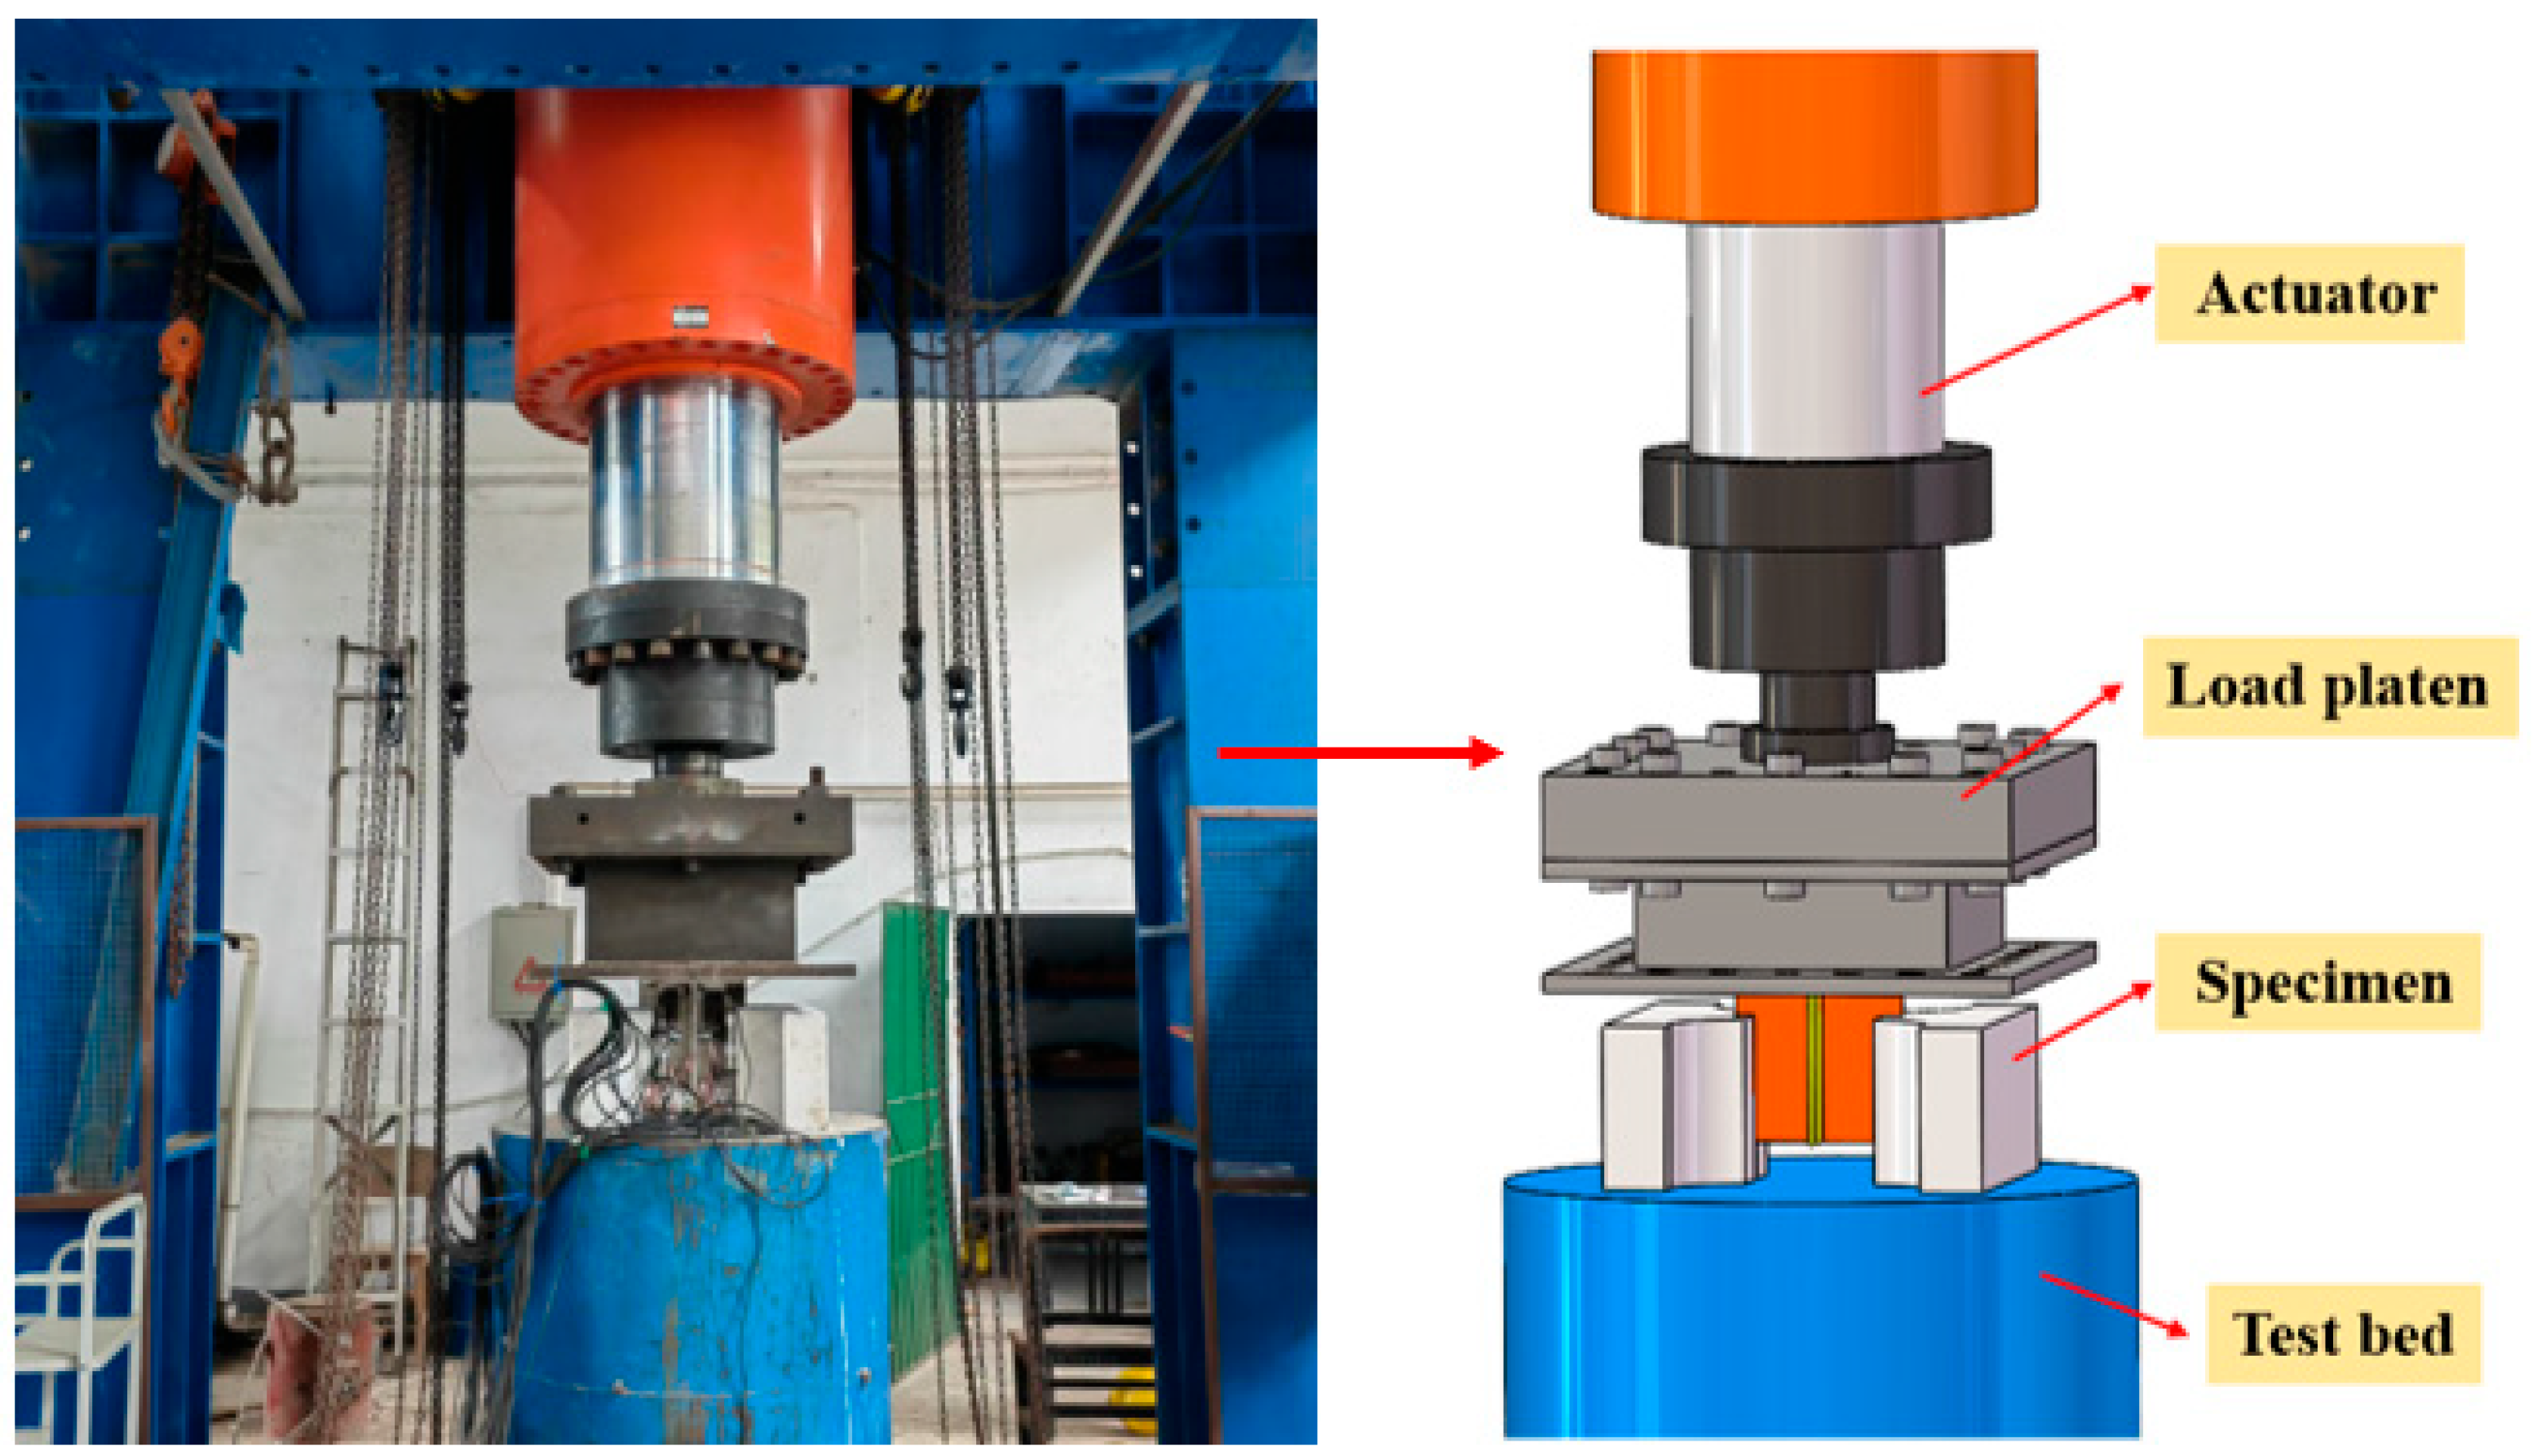
The specimens were subjected to monotonic loading using a 10,000 kN electrohydraulic servocontrolled testing system, with the loading configuration detailed in Figure 8. The test system has a maximum thrust capacity of 10,000 kN and a stroke of ±300 mm, with an accuracy of ±0.5% FS. Due to height constraints, two rigid steel platforms were installed atop the specimen. Minor surface unevenness, resulting from the wooden formwork and manual welding of end plates, was mitigated by manual sand bedding beneath the specimen prior to testing to ensure a uniform load distribution. Throughout loading, the synchronized acquisition of load, displacement, and strain data was performed using the Donghua DH3816N static data acquisition system (Jiangsu Donghua Testing Technology Co., Ltd., Taizhou, China).

3. Test Results and Discussion

3.1. Test Phenomena and Failure Mode

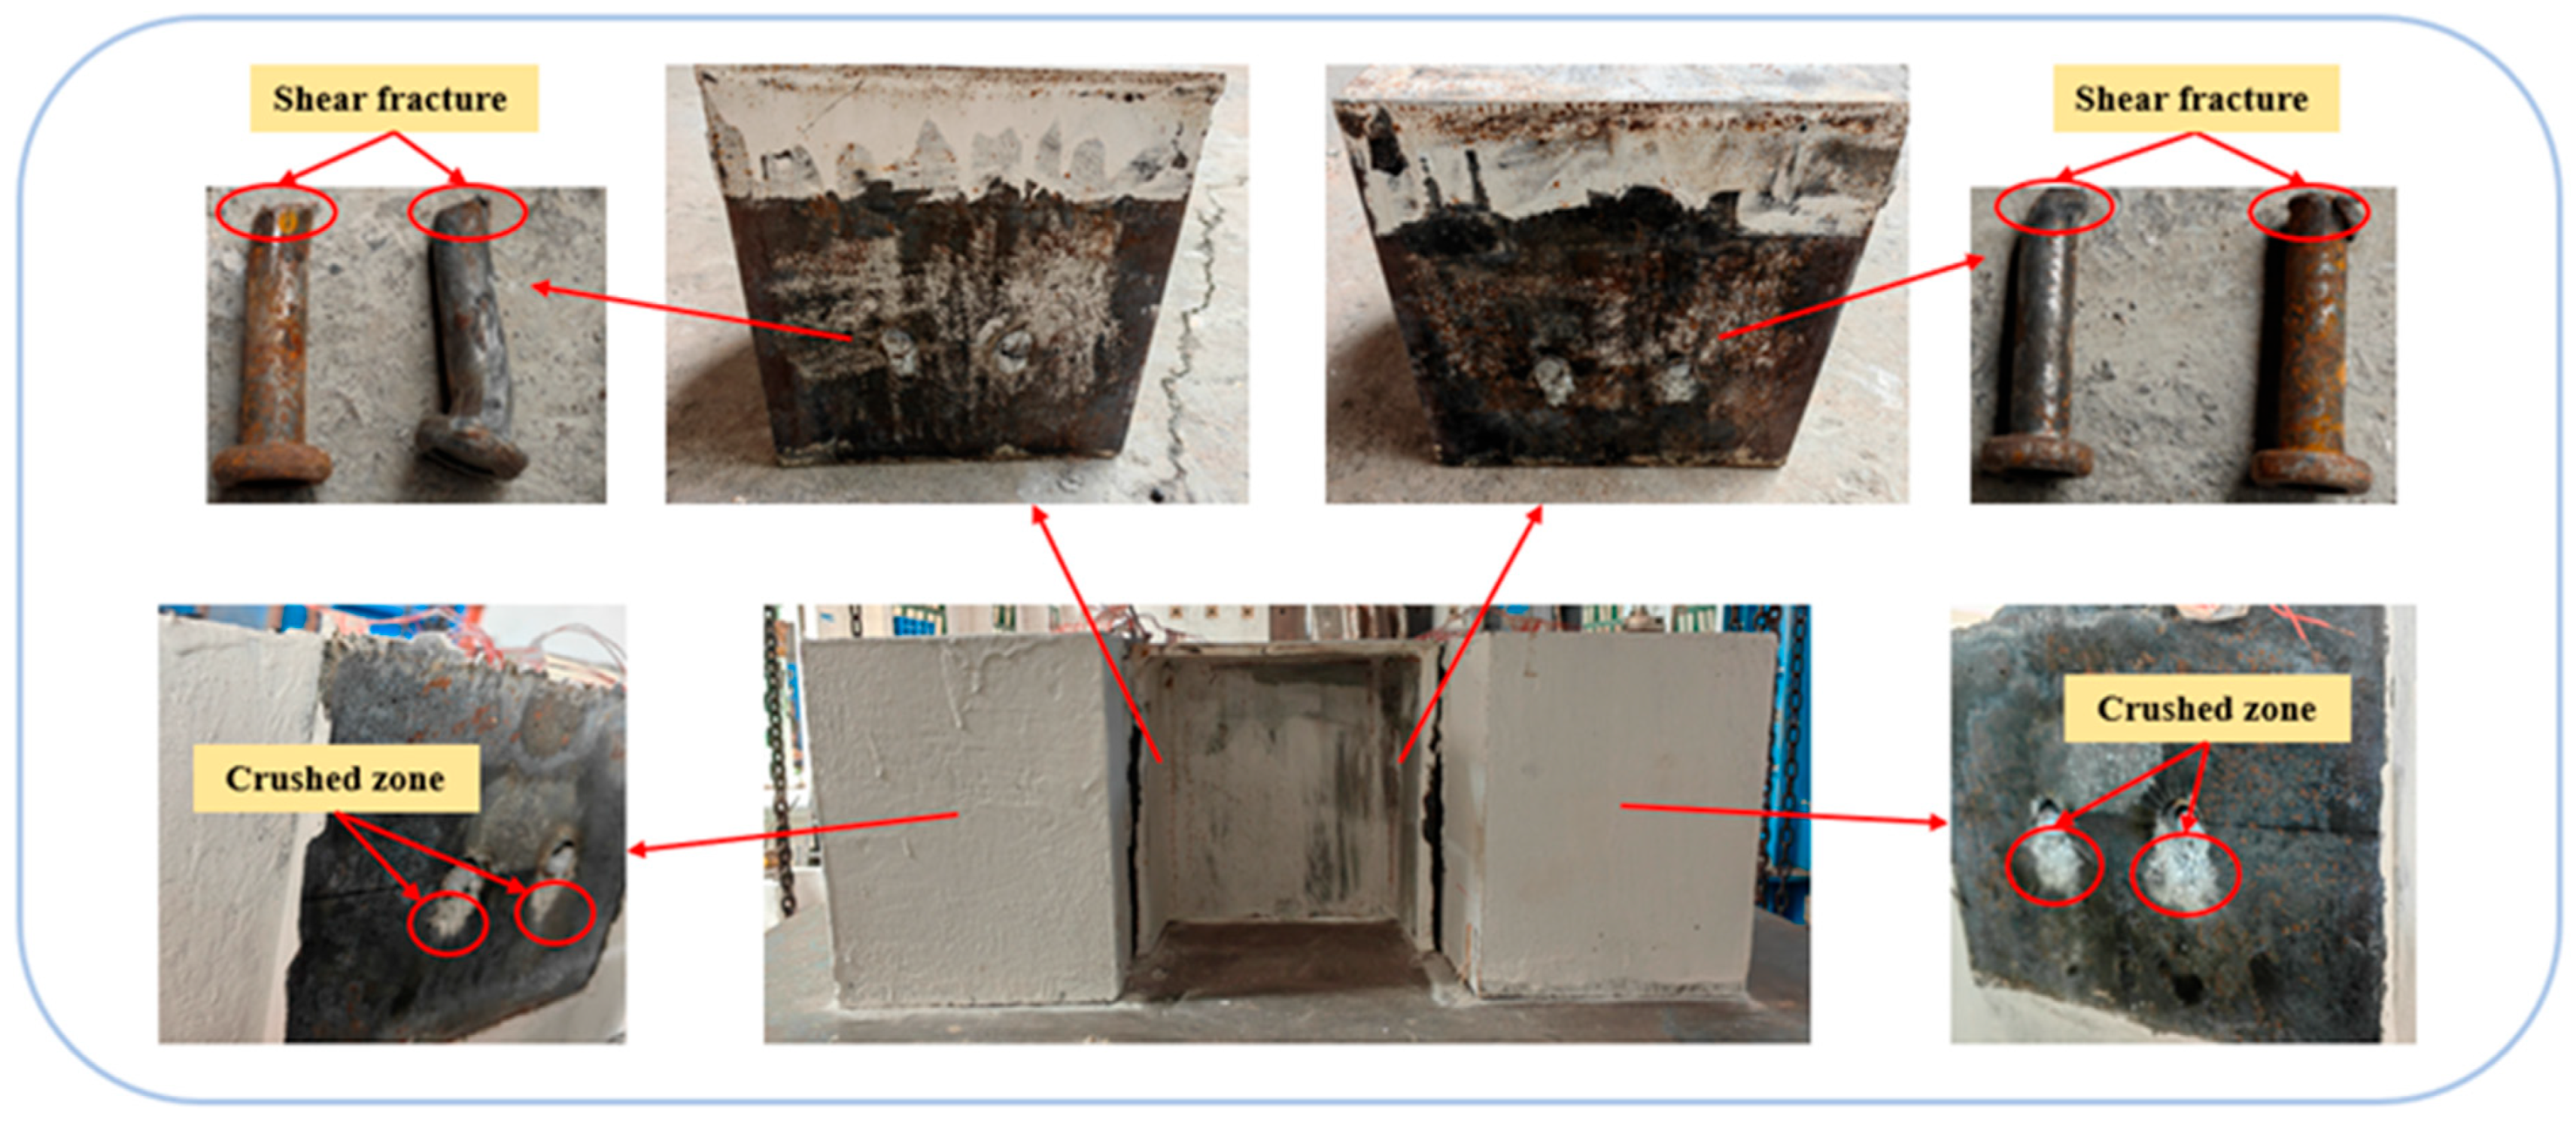
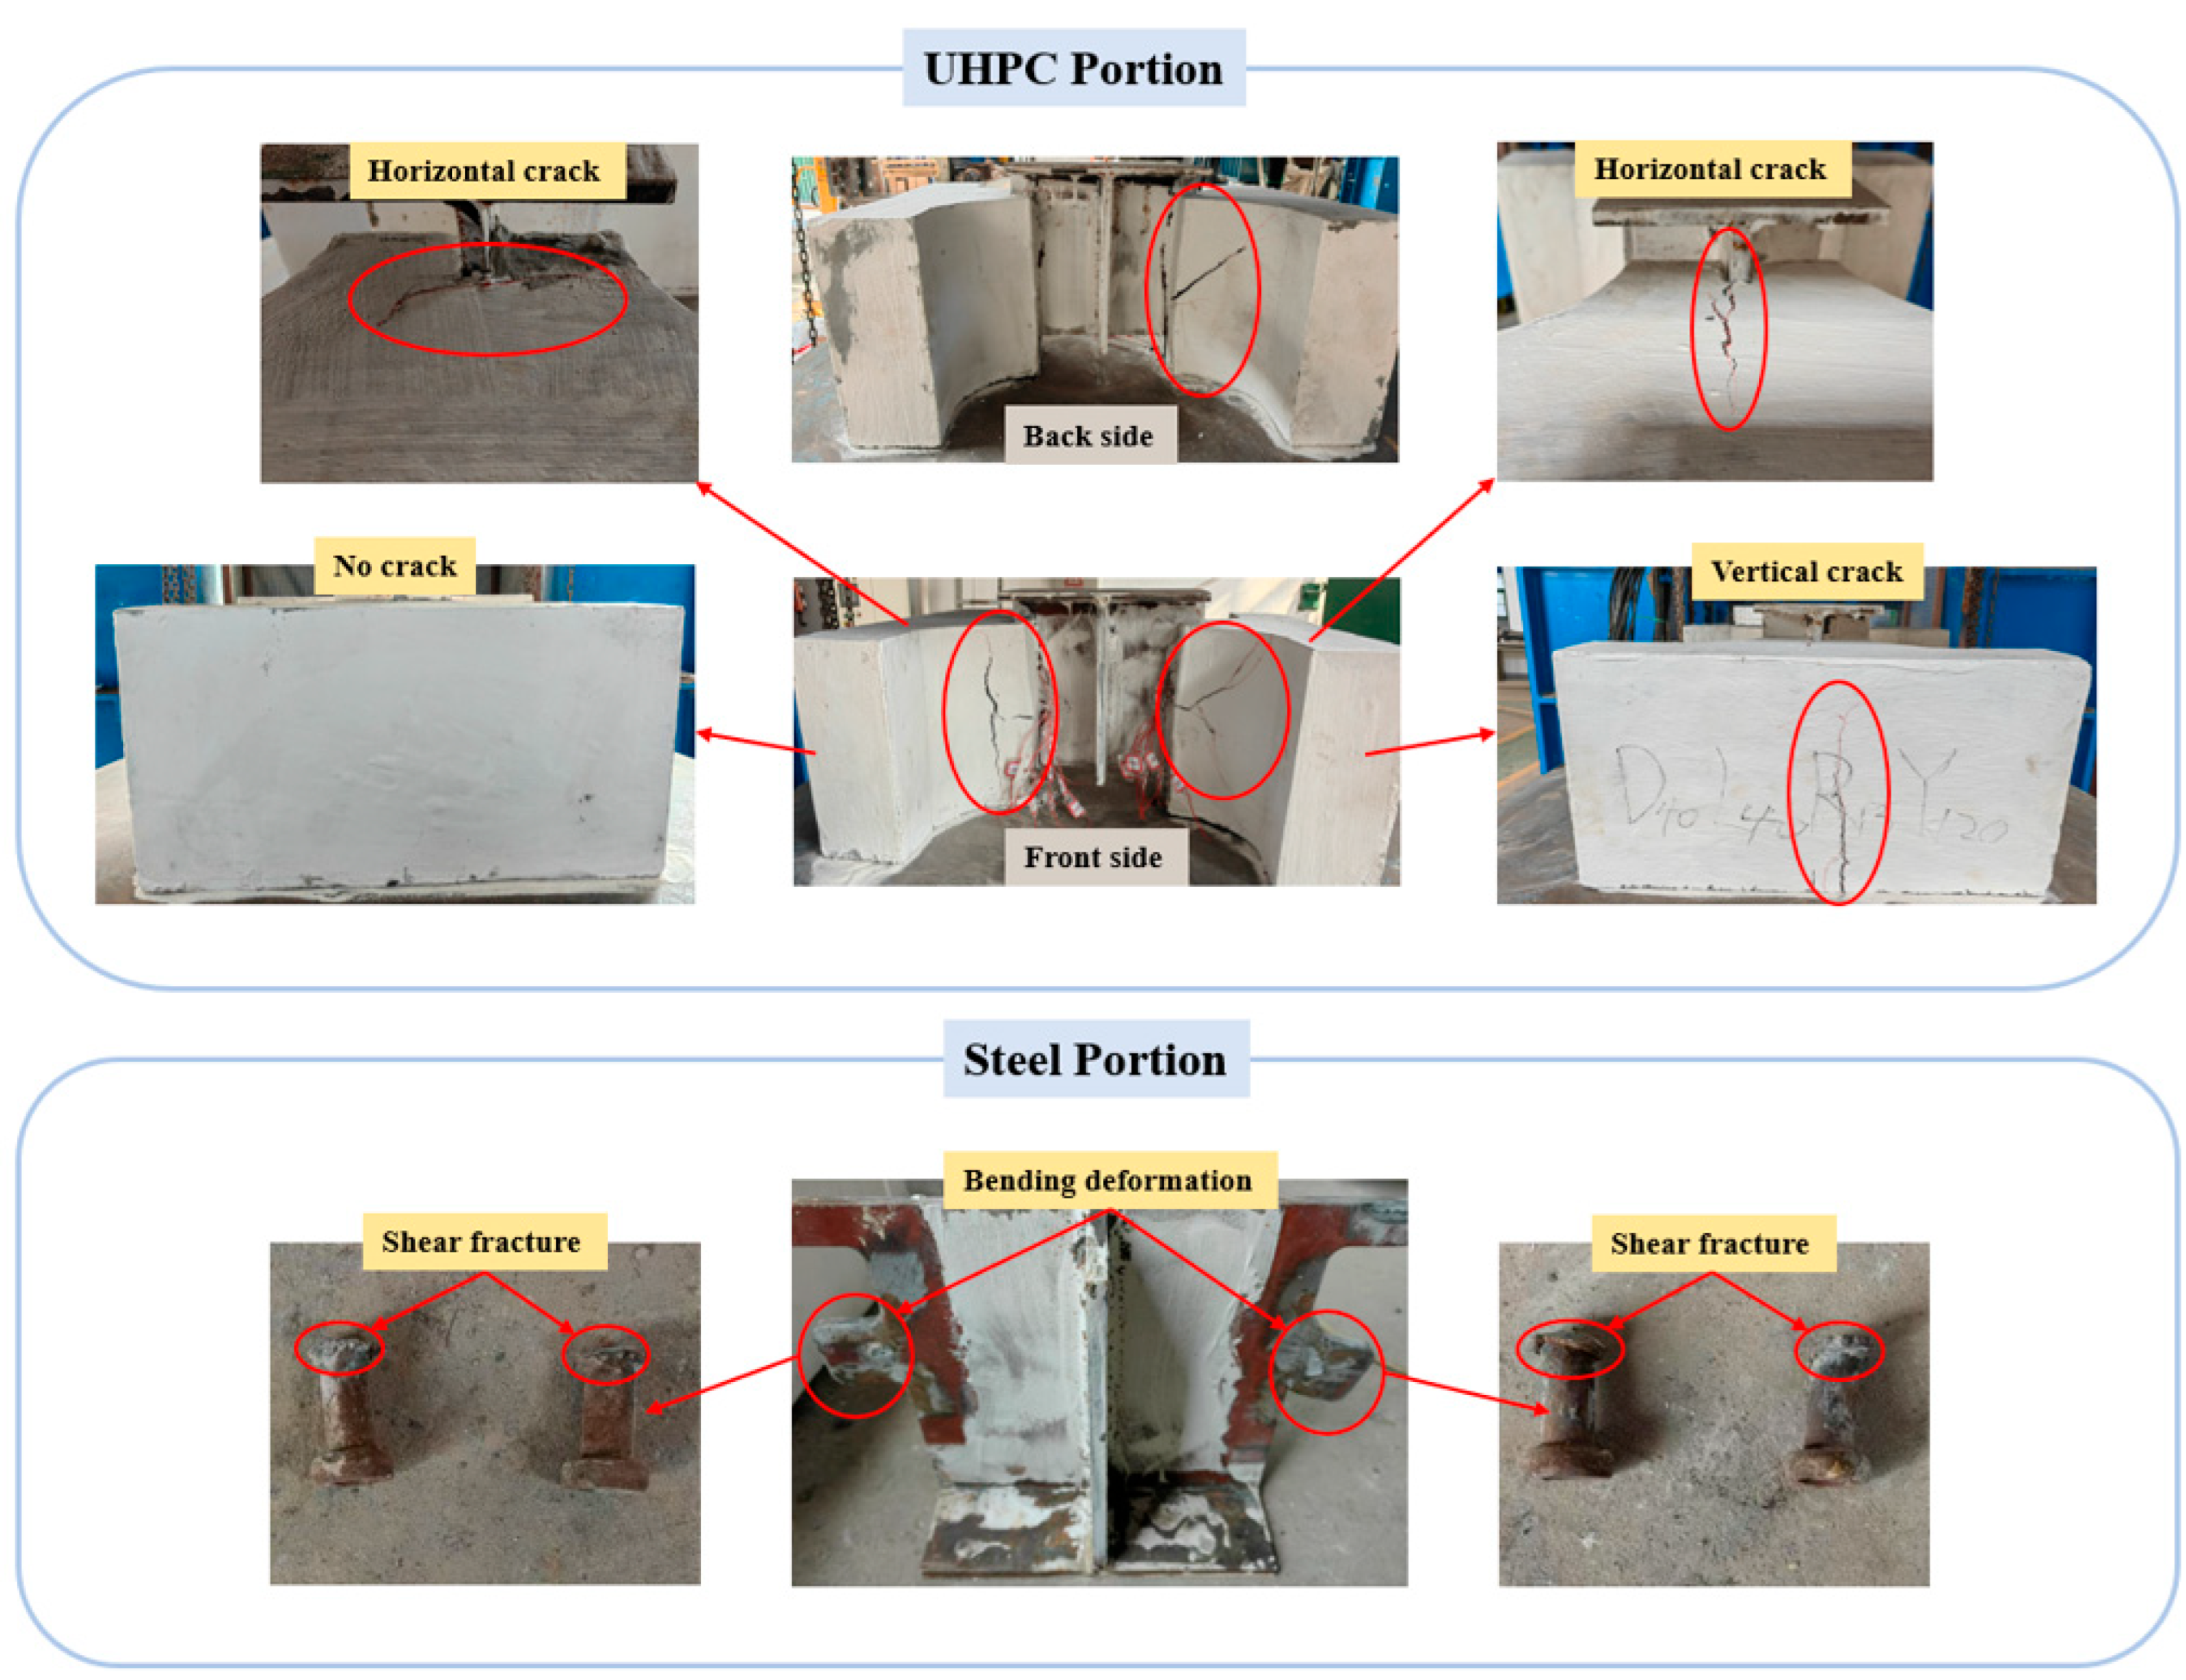
The failure mode of the conventional shear stud connector specimen (CCTC-R16) manifested as a combination of shear fracture in the studs and localized concrete crushing beneath the studs, as illustrated in Figure 9. During the initial loading stages, no significant phenomena were observed. At a 370 kN load, distinct cracking sounds, accompanied by low-frequency grinding noises, emerged, indicating the onset of progressive concrete crushing beneath the shear studs. Upon reaching 465 kN, increasingly frequent brittle cracking sounds signaled the initiation of cleavage fracture at stud roots. At the ultimate capacity of 483 kN, an abrupt explosive fracture occurred, accompanied by catastrophic specimen failure. The H-section steel experienced sudden downward displacement as all the shear studs underwent shear fracture. The concrete component exhibited no significant cracking, with only localized crushing beneath stud welds, forming 20 mm diameter conical failure zones. The fractured studs displayed characteristic oblique shear planes at roots, accompanied by minor plastic bending deformation.
As shown in Figure 10, the failure mode of the steel dowel connector specimen (D0R0L0Y200) primarily exhibited combined mechanisms of plastic deformation in steel dowels and localized concrete crushing beneath the dowels. During the initial loading stages, no significant phenomena were observed. At 350 kN, cracks initiated and propagated on the north and south concrete surfaces. At 385 kN, audible sounds of steel rupture commenced, with the rupture frequency progressively increasing as loading continued. Progressive crushing of concrete beneath the steel dowels triggered accelerated crack propagation on north–south surfaces, culminating in specimen failure.
During loading, concrete beneath steel dowels underwent crushing failure due to stress concentrations, inducing vertical splitting cracks propagating upward on north–south concrete surfaces. Concurrently, eccentric loading effects from the steel web generated bearing stresses at the concrete–steel interface, ultimately causing cracks to initiate from the web insertion points on the concrete’s top surface.
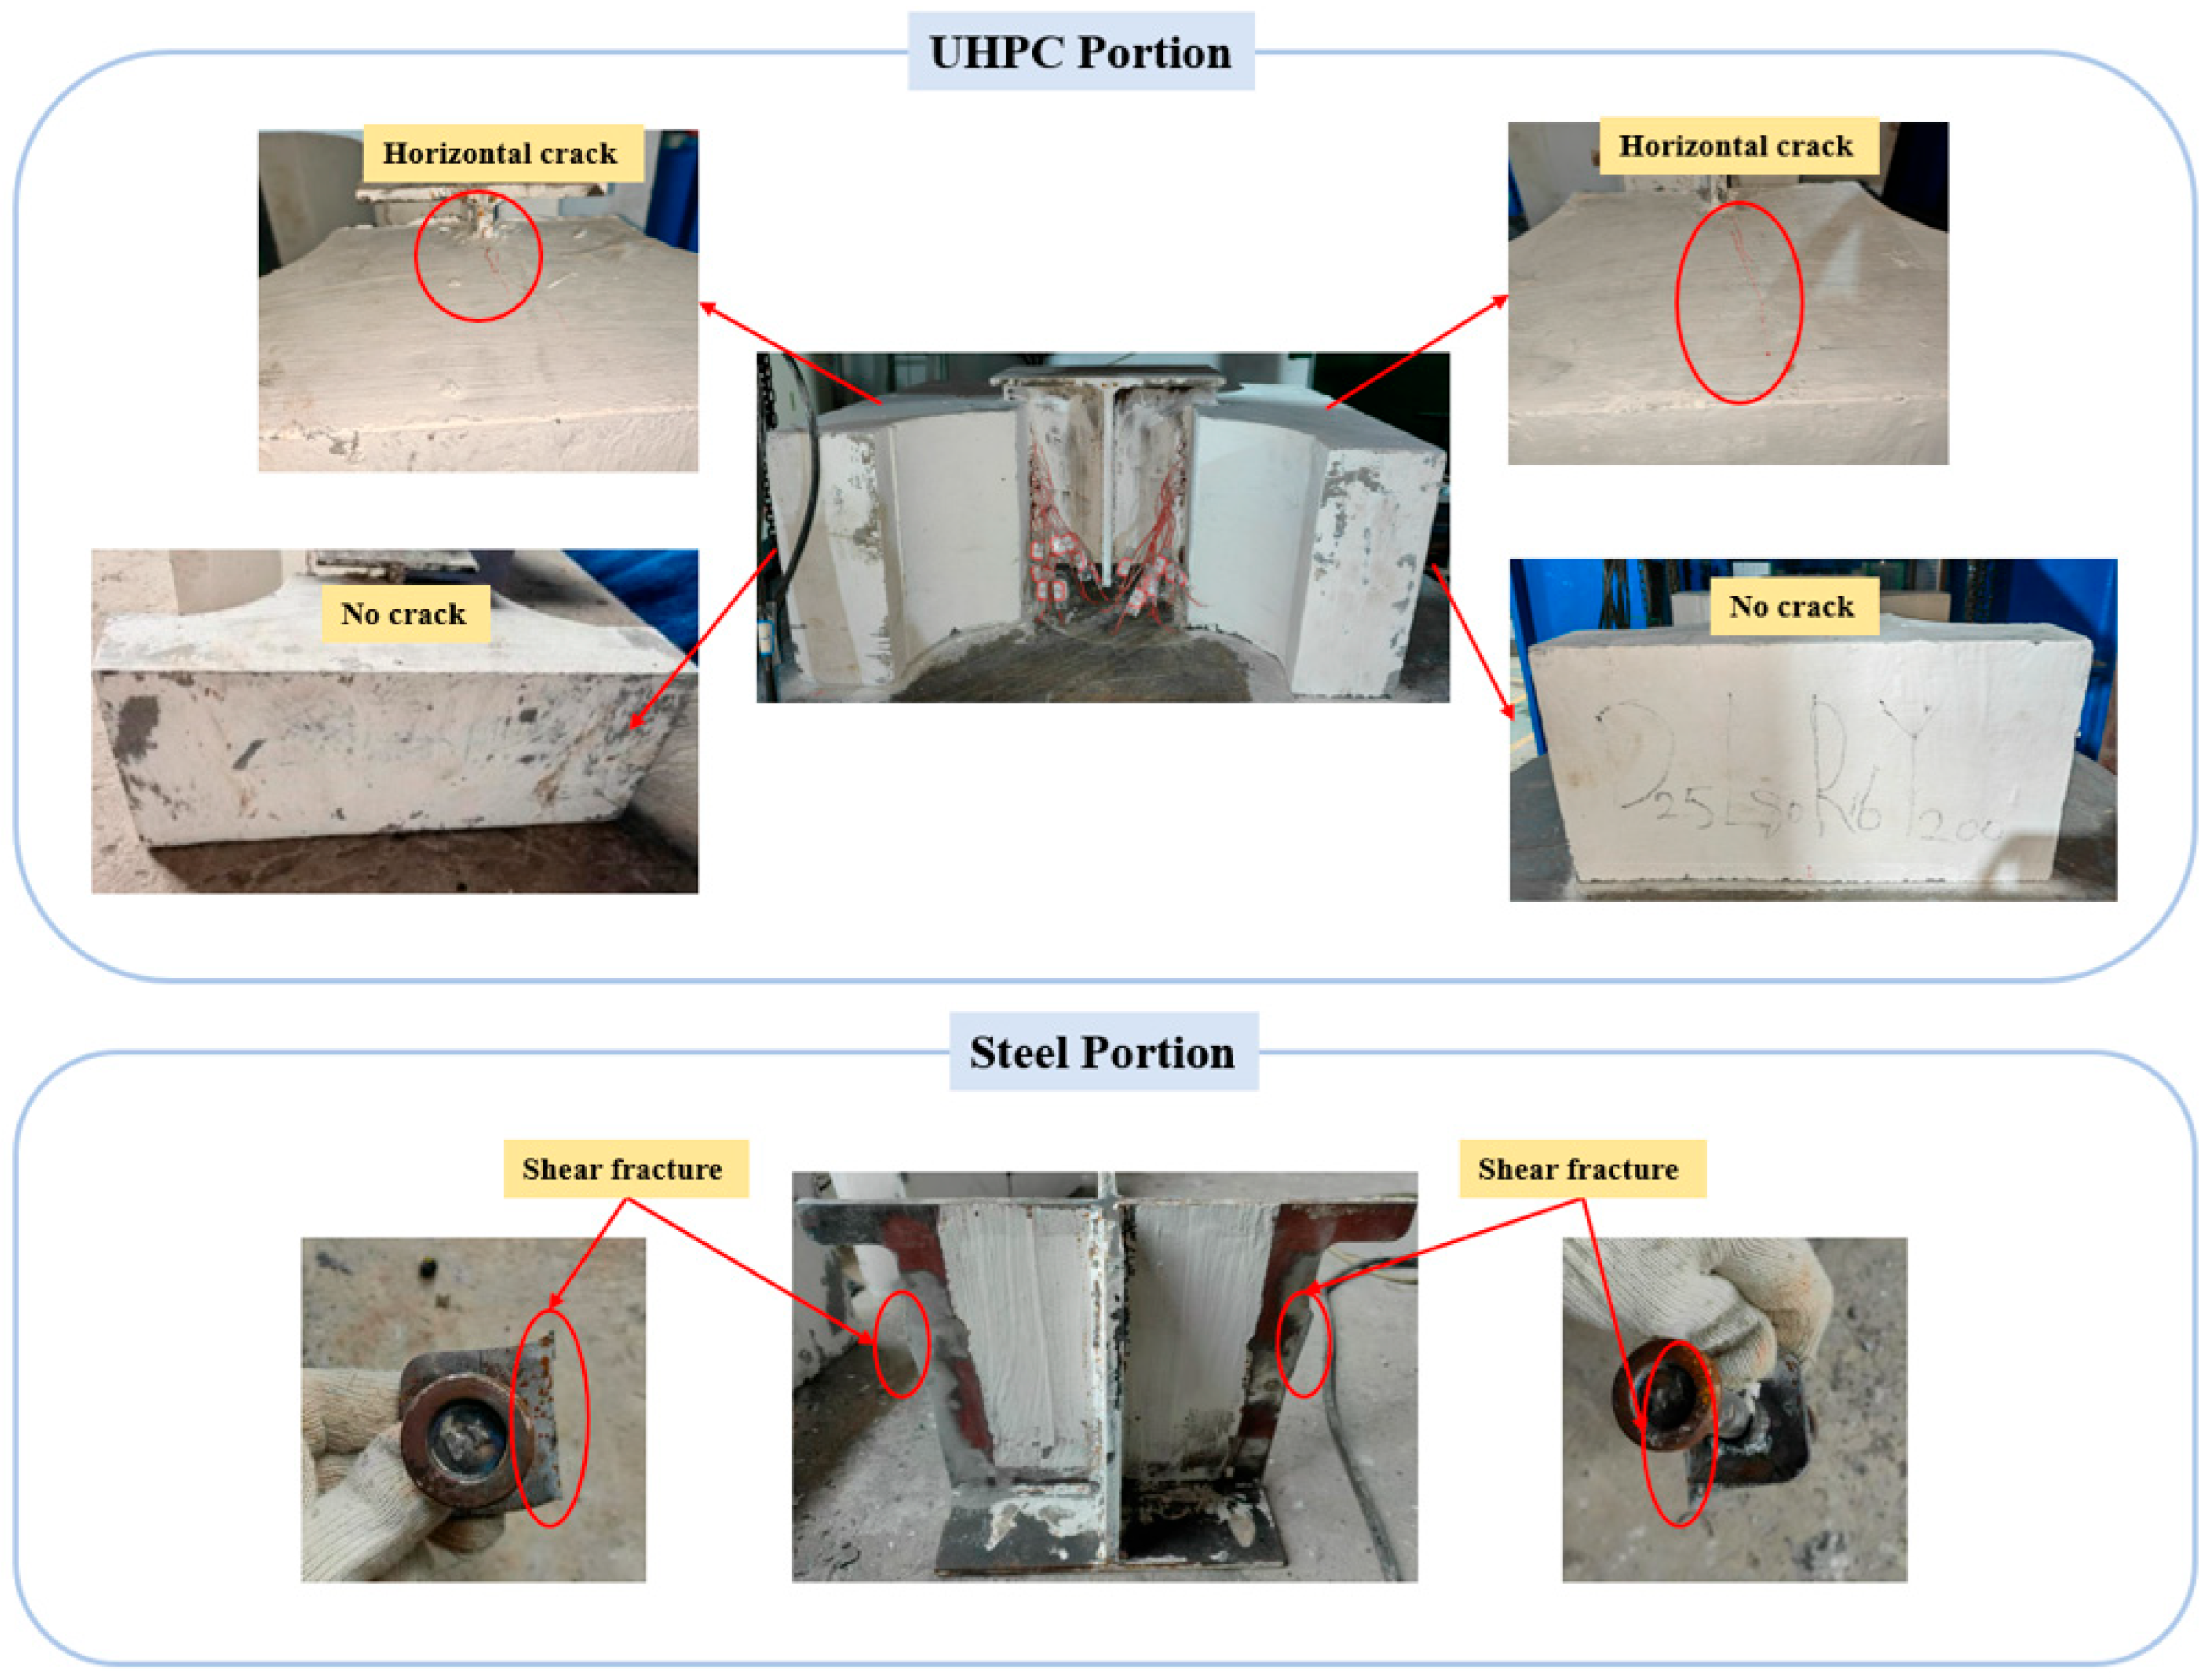
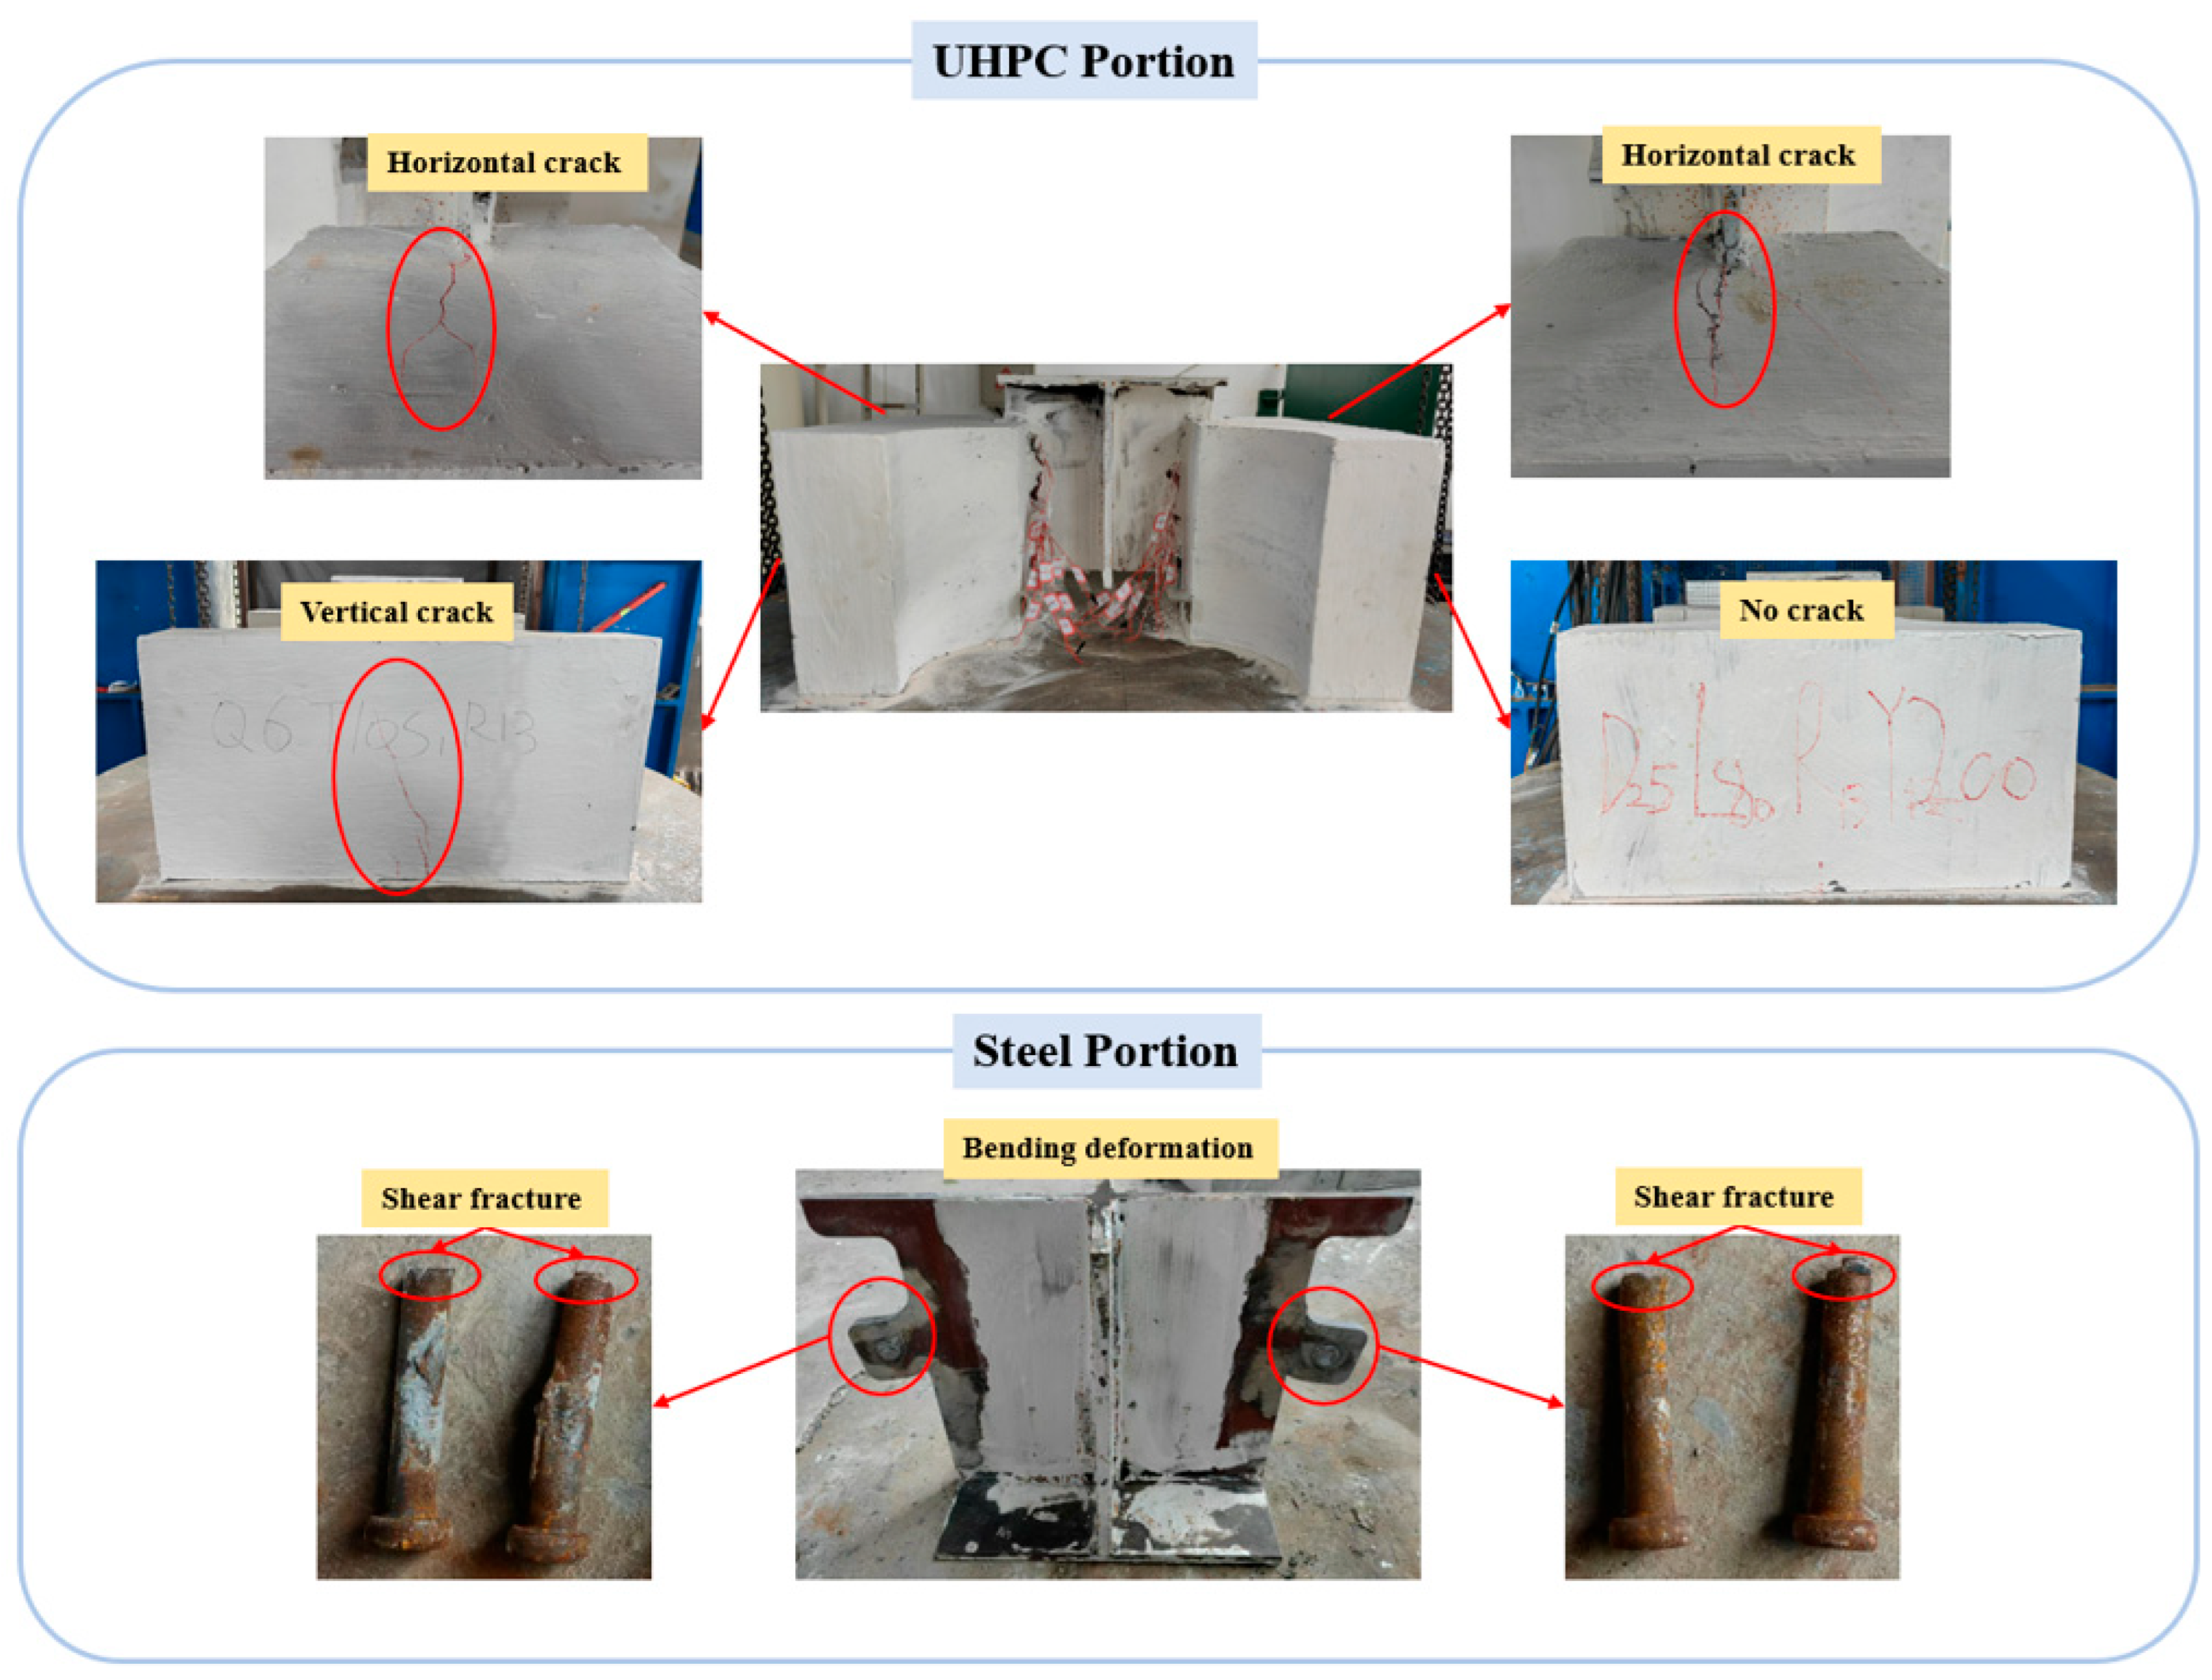
The failure modes of dowel–stud hybrid connector specimens with a minimum fillet thickness of 200 mm (D25L80R16Y200 and D25L80R19Y200) are illustrated in Figure 11 and Figure 12. Both specimens exhibited no significant phenomena during the initial loading stages. At 420 kN, crack initiation occurred on the north concrete surface of specimen D25L80R13Y200. At 440 kN and 500 kN, respectively, faint steel fracture sounds initiated in specimens D25L80R16Y200 and D25L80R13Y200, with the rupture frequency progressively accelerating as loading increased in both cases. At 600 kN, audible concrete crushing sounds emerged in both specimen groups. Ultimately, upon reaching the maximum load-bearing capacity, catastrophic failure occurred, accompanied by an explosive fracture sound.
Both specimen groups exhibited localized crushing failure of concrete beneath the steel dowels and shear studs as the primary concrete damage mode. Specimen D25L80R16Y200 developed eccentric compression-induced cracks solely on the concrete’s top surface, whereas specimen D25L80R13Y200 exhibited additional prominent cracking on the north concrete face. Both specimens exhibited plastic bending deformation of steel dowels and shear studs, while divergent fracture locations were observed: Specimen D25L80R16Y200 failed via shear fracture at steel dowel roots, while specimen D25L80R13Y200 exhibited shear fracture at shear stud roots. The difference in fracture locations may relate to the stud diameter. In specimen D25L80R13Y200, the 13 mm diameter studs’ smaller cross-section resulted in insufficient load-bearing area at weld interfaces, causing plastic deformation in weld zones under load and ultimately leading to shear failure at stud roots.
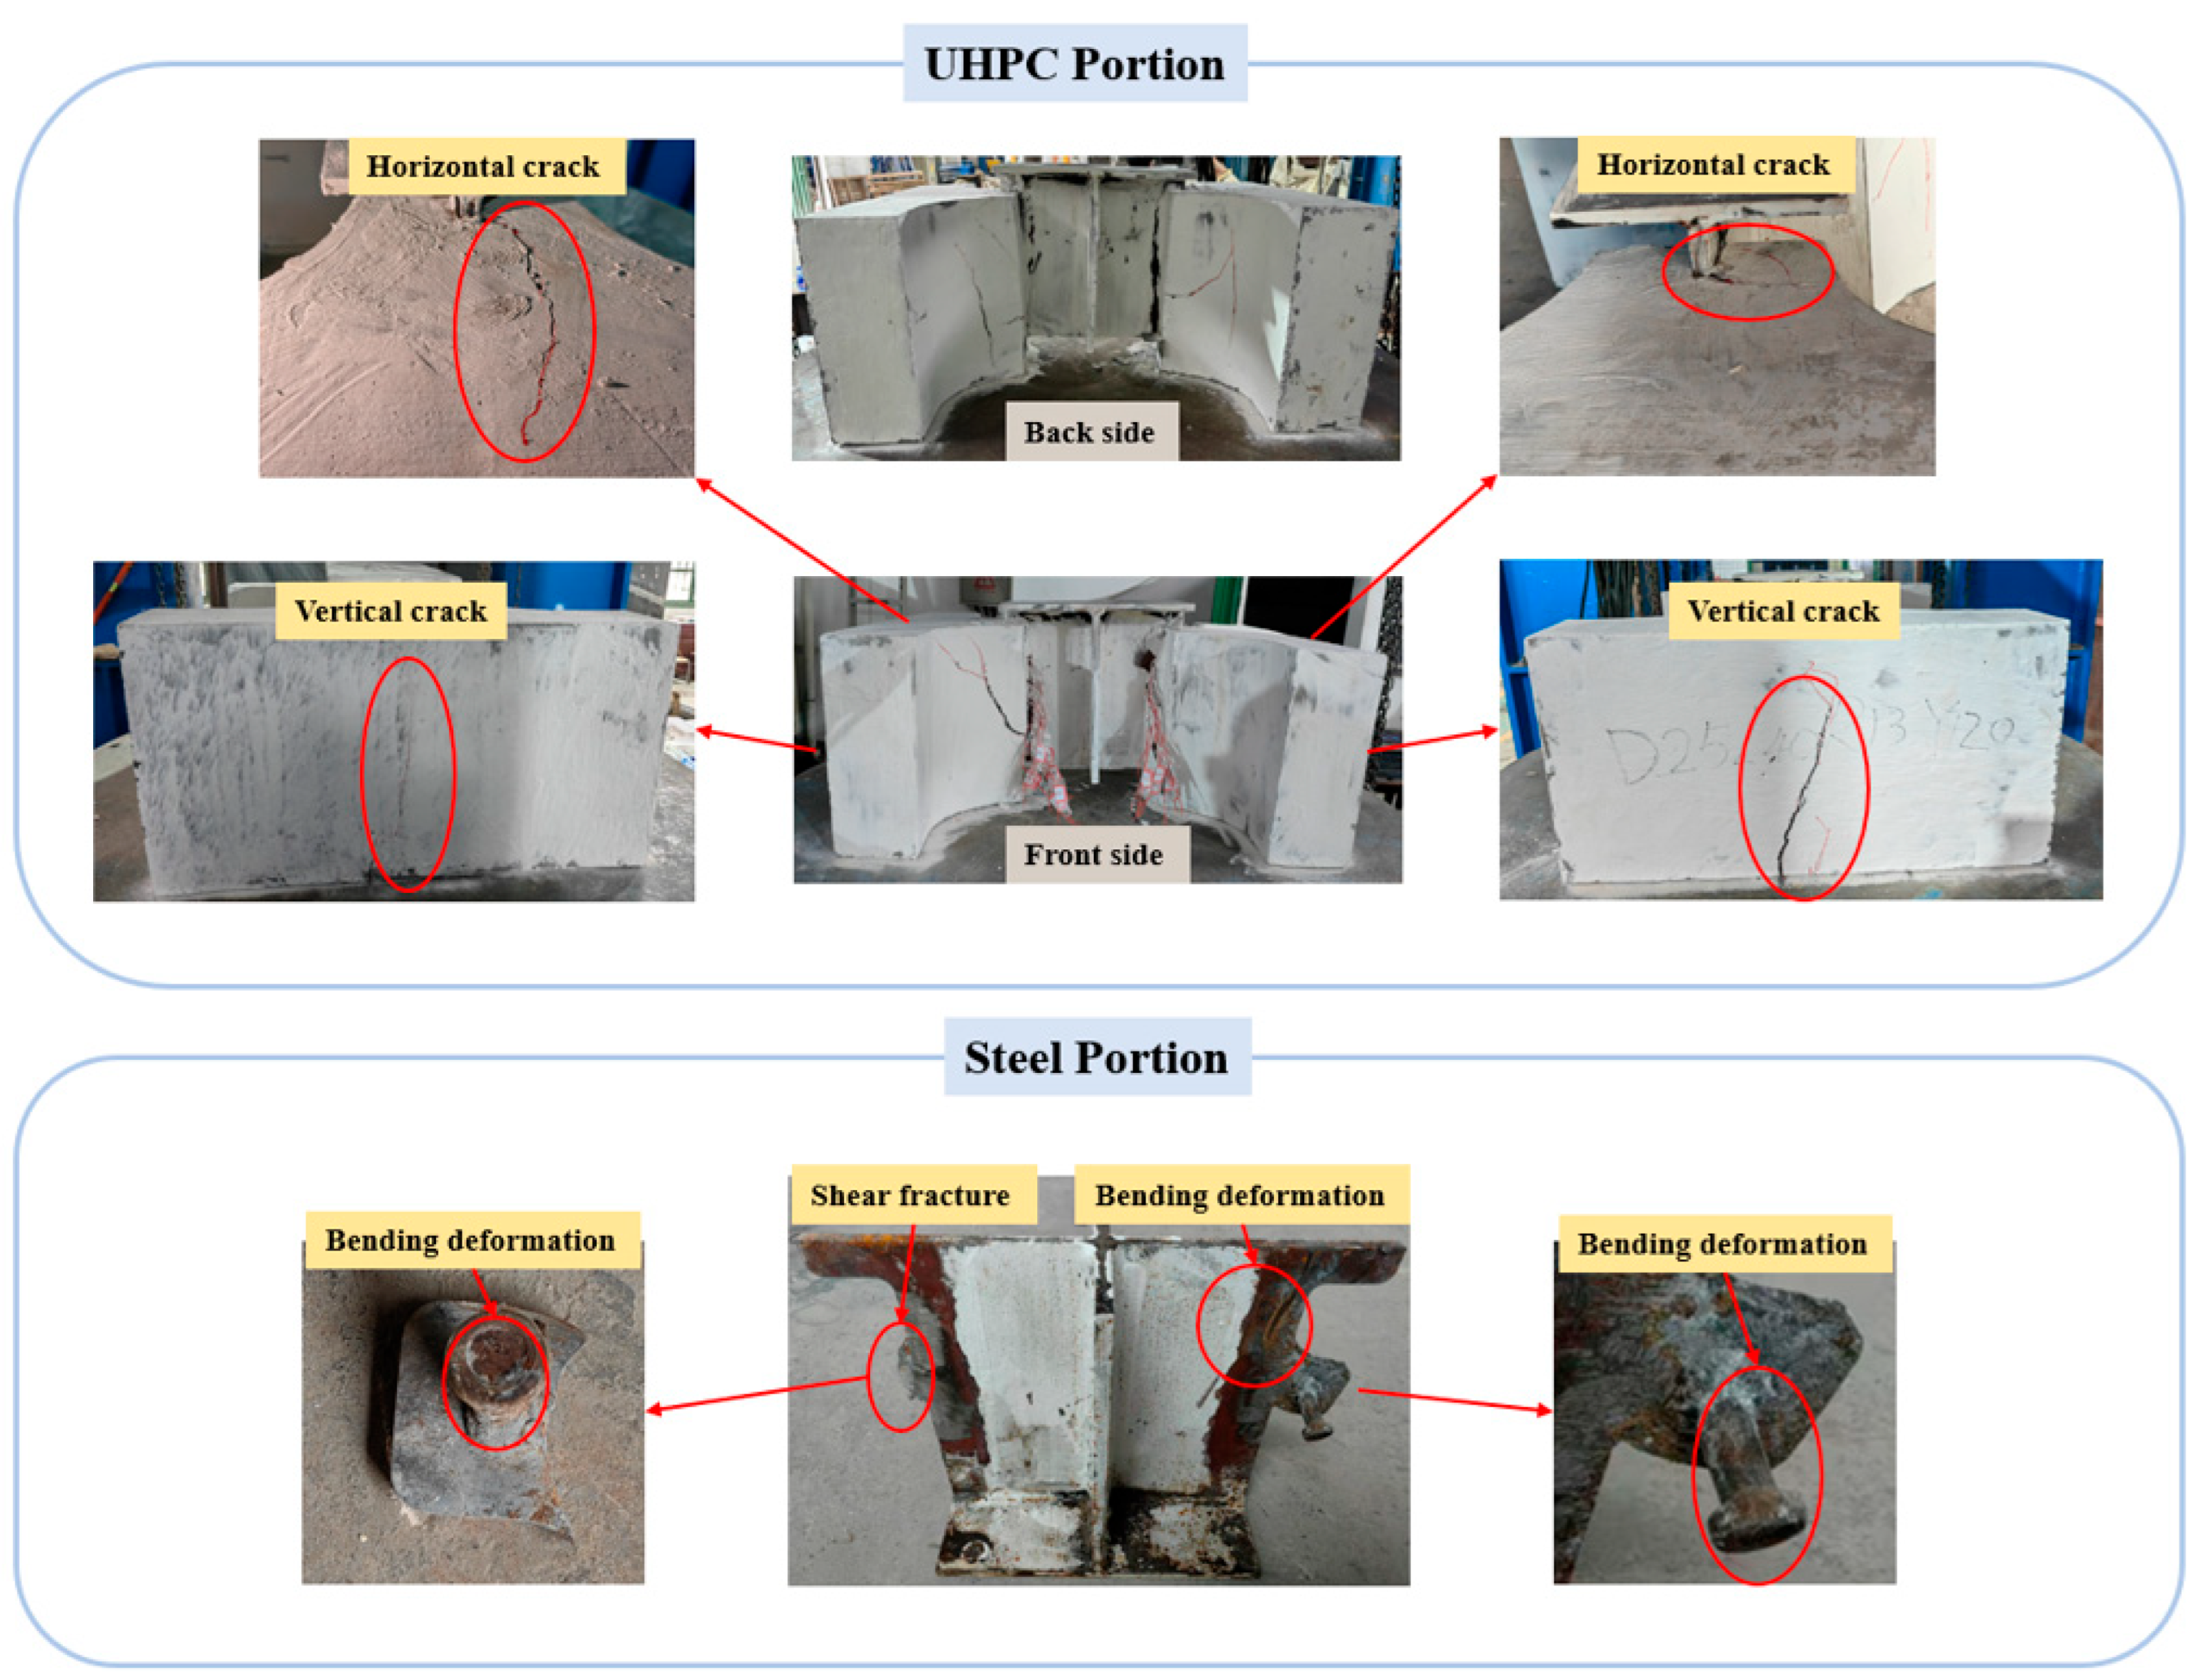
The failure modes of dowel–stud hybrid connector specimens with a minimum fillet thickness of 120 mm (D25L40R13Y120 and D40L40R13Y120) are illustrated in Figure 13 and Figure 14. Both specimens exhibited no significant phenomena during the initial loading stages. For specimen D40L40R13Y120, steel fracture sounds commenced at 300 kN, and cracks initiated in the concrete fillet region. These fillet cracks first emerged at an approximately 110 mm height on both sides of the fillet and subsequently propagated. At approximately 400 kN, cracks initiated on the south concrete surface. At around 600 kN, audible concrete crushing sounds commenced. Ultimately, upon reaching the specimen’s maximum load-bearing capacity, catastrophic failure occurred, accompanied by a sudden explosive sound. During the loading of specimen D25L40R13Y120, cracks initiated on both sides of the concrete fillet at 384 kN. At 508 kN, steel fracture sounds commenced, with the rupture frequency progressively increasing as loading continued. Ultimately, a loud, explosive sound accompanied specimen failure, at which point the test was terminated.
Specimens D25L40R13Y120 and D40L40R13Y120 developed cracks on north–south concrete surfaces and top surfaces. Additionally, prominent cracks formed in the concrete fillet regions, resulting from lateral thrust generated by the plastic deformation of shear studs during loading, which induced these cracks on both sides of the fillets. Comparative analysis of failure modes revealed that specimen D25L40R13Y120 exhibited more severe bending deformation in steel dowels, with direct shear fracture of the north dowel, while all four shear studs in specimen D40L40R13Y120 failed in shear at their roots. Relocating shear stud welding positions toward the web triggered premature cracking in concrete fillet regions and intensified damage at stud locations. This primarily occurred because shear resistance in specimen D40L40R13Y120 was primarily undertaken by shear studs, while reduced concrete thickness on both sides of the studs further contributed to premature cracking in fillet regions.

3.2. Load-Slip Curves

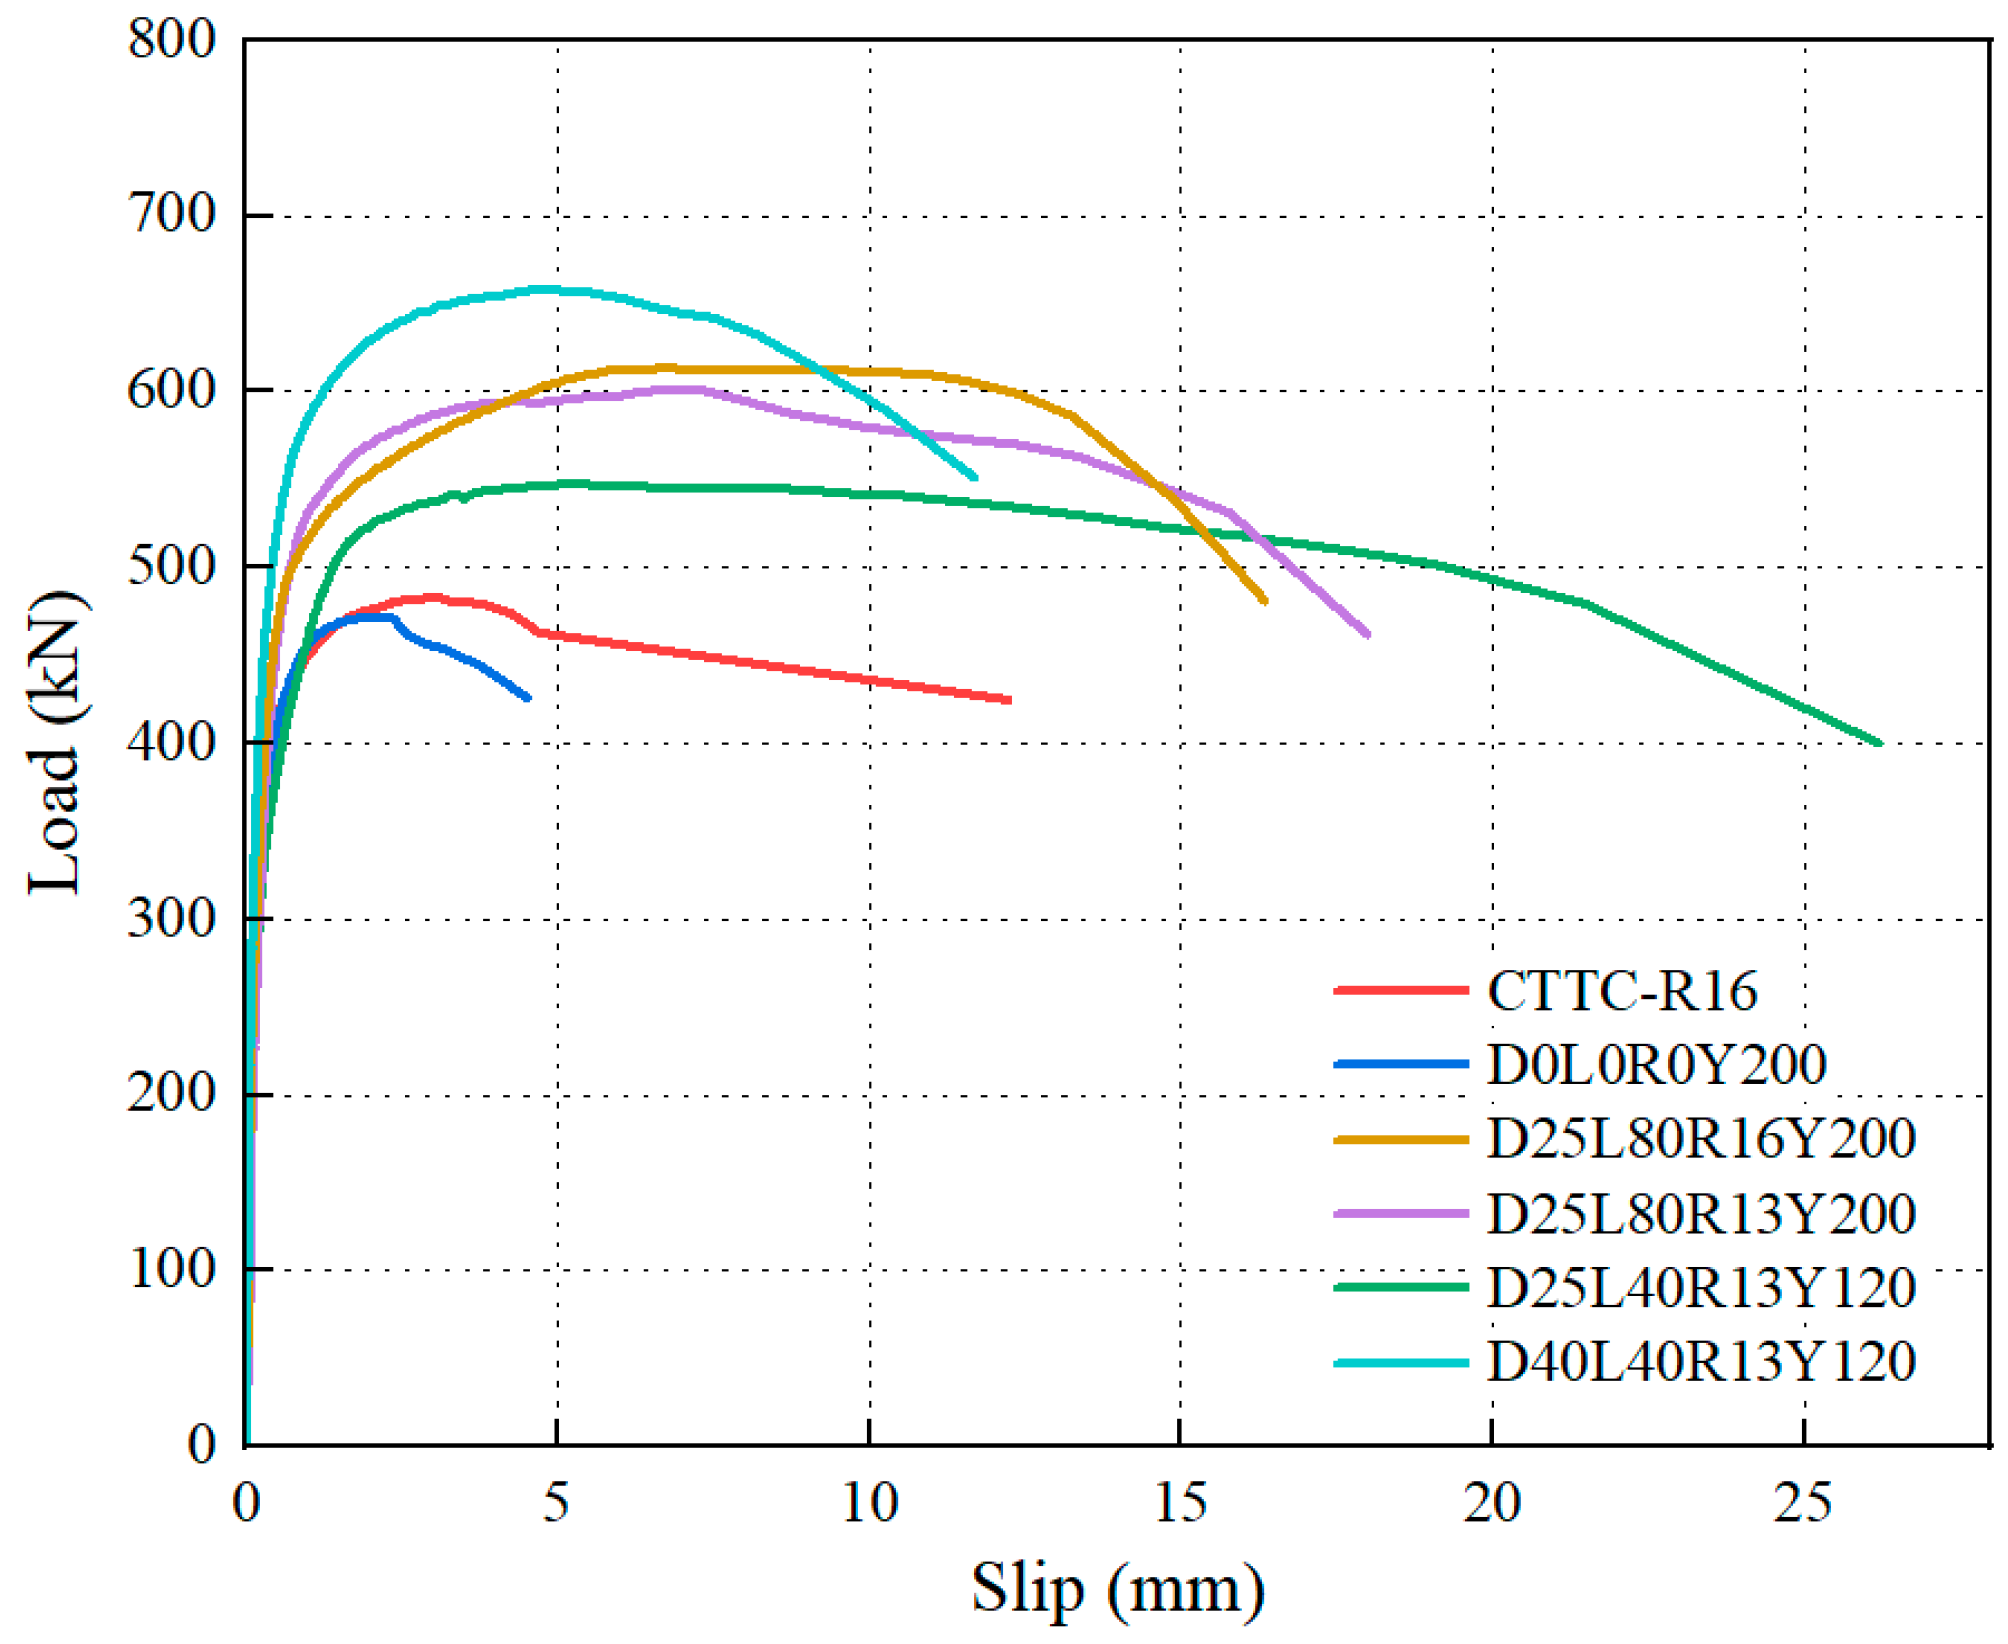
As shown in Figure 15, six sets of load-slip curves were obtained from the tests. The dowel–stud hybrid connectors demonstrated significantly higher ultimate capacity and ductility compared to those of both shear stud connectors and pure steel dowel connectors. The load-slip curves of dowel–stud hybrid connector specimens exhibit three distinct phases: an elastic phase (OA), an elastoplastic hardening phase (AB), and a plastic failure phase (Post-B). During the initial elastic stage, the load-slip curves exhibited linear slopes with minimal slip displacements, indicating linear elastic responses and high initial stiffness without any observable experimental phenomena. When the load increased beyond point A and entered the elastoplastic phase (AB), the slope of the load-slip curves began to decrease, and the rate of this decrease progressively intensified until reaching the peak load at point B, at which point the load-bearing capacity attained its maximum value. During this phase, steel fracture sounds initiated, and their frequency increased markedly as the load approached its peak value, while the stiffness of the dowel–stud hybrid shear connectors rapidly decreased. After reaching the peak load at point B, the load rapidly decreased, accompanied by rapid slip development; concrete cracks rapidly developed, ultimately resulting in specimen failure.
Figure 16a presents the load-slip curves of shear connector specimens with varied stud diameters but other identical parameters. Compared to the stud-free specimen (D0L0R0Y200), specimen D25L80R13Y200 exhibited a 27.3% enhancement in the ultimate load-bearing capacity. When the stud diameter increased to 16 mm (D25L80R16Y200), its load-bearing capacity exhibited a 29.7% higher enhancement rate compared to that of the stud-free specimen. Although increasing the stud diameter did not significantly enhance the ultimate load-bearing capacity, it improved the specimen ductility.
Figure 16b presents the load-slip curves of shear connector specimens with varied stud lengths but other identical parameters. Specimen D25L40R13Y120 exhibited an approximately 16.1% higher ultimate load-bearing capacity compared to that of the stud-free specimen (D0L0R0Y200). When the stud length increased to 80 mm (D25L80R16Y200), its enhancement rate of the load-bearing capacity increased by 27.3% compared to that of the stud-free specimen. Specimen D25L40R13Y120 exhibited significant outward bulging deformation in the concrete fillet region, indicating insufficient concrete volume at the fillet, which caused premature crushing of concrete beneath the studs. However, the shear fracture of steel dowels during testing indicated that the dowel components had fully utilized their shear capacity, and concrete crushing did not precipitate premature specimen failure.
Figure 16c demonstrates the influence of stud welding locations. For 13 mm diameter studs, specimen D25L40R13Y120, with studs welded at steel dowel roots, exhibited an approximately 20.1% higher ultimate load-bearing capacity than that of specimen D40L40R13Y120, with studs welded at dowel centers. Relocating stud welding positions to steel dowel roots shortened the load-transfer path, enabling full utilization of the studs’ shear capacity, thereby enhancing the ultimate load-bearing capacity of the specimens.

3.3. Load–Strain Curves

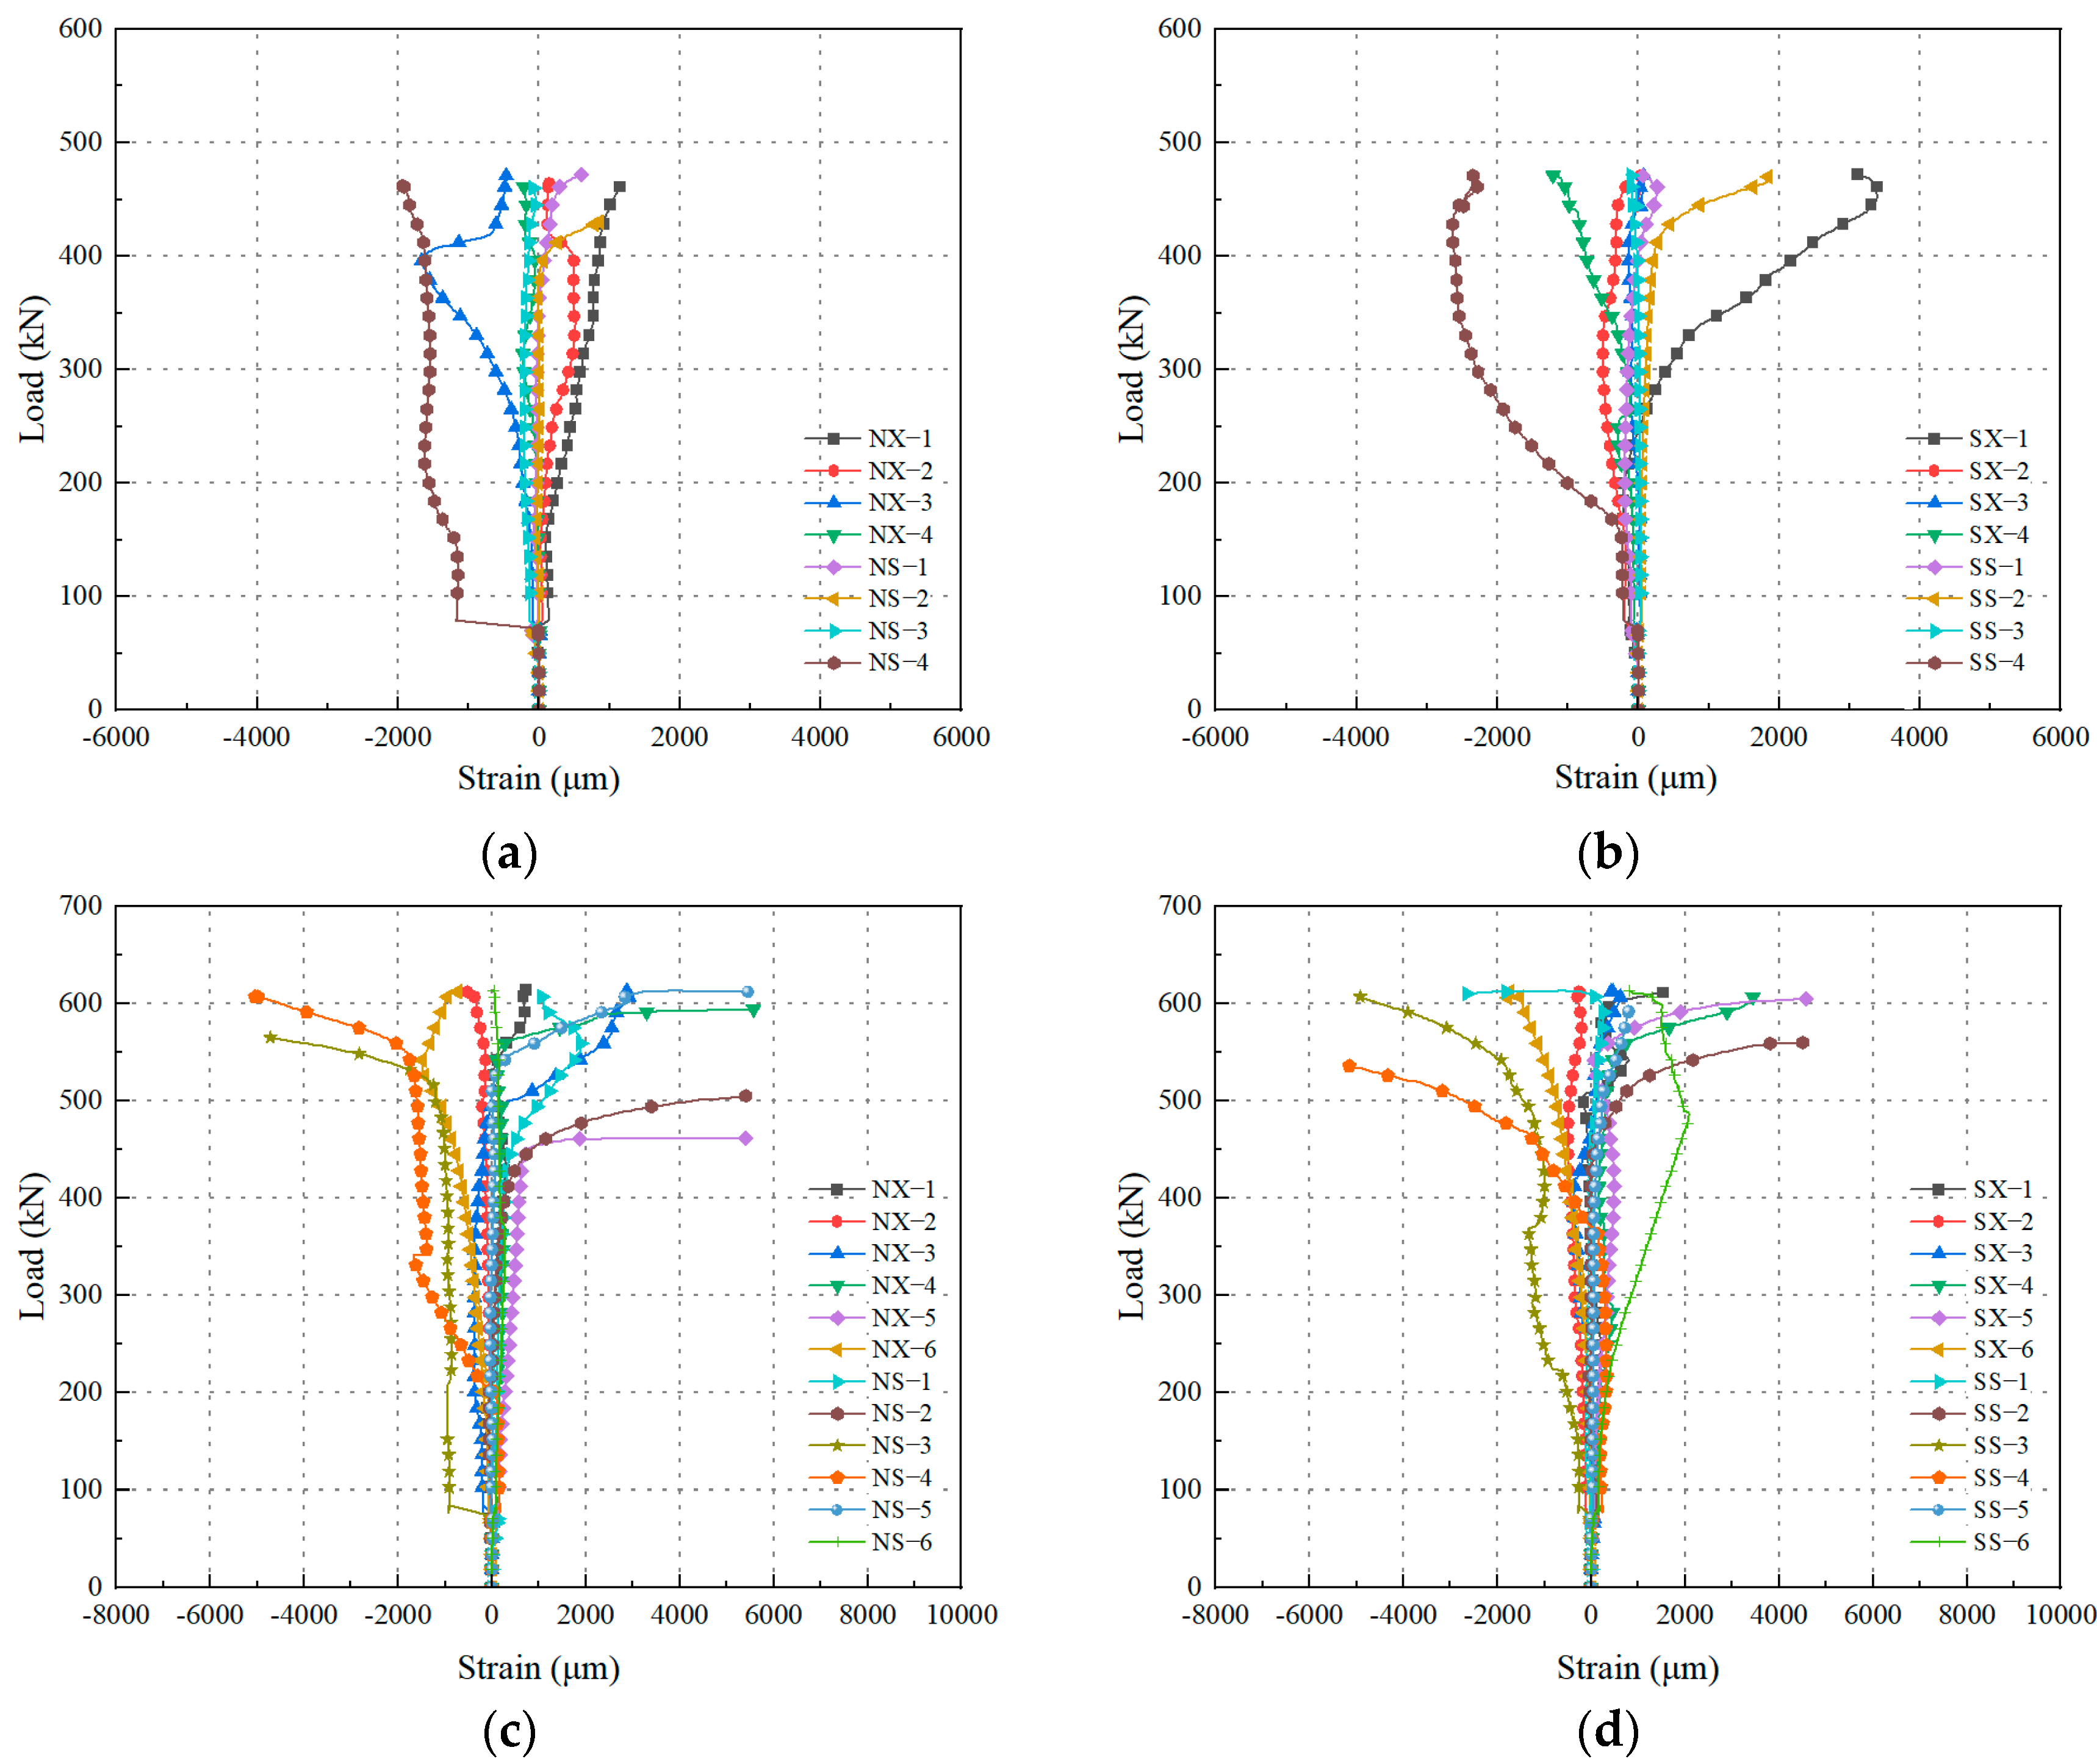
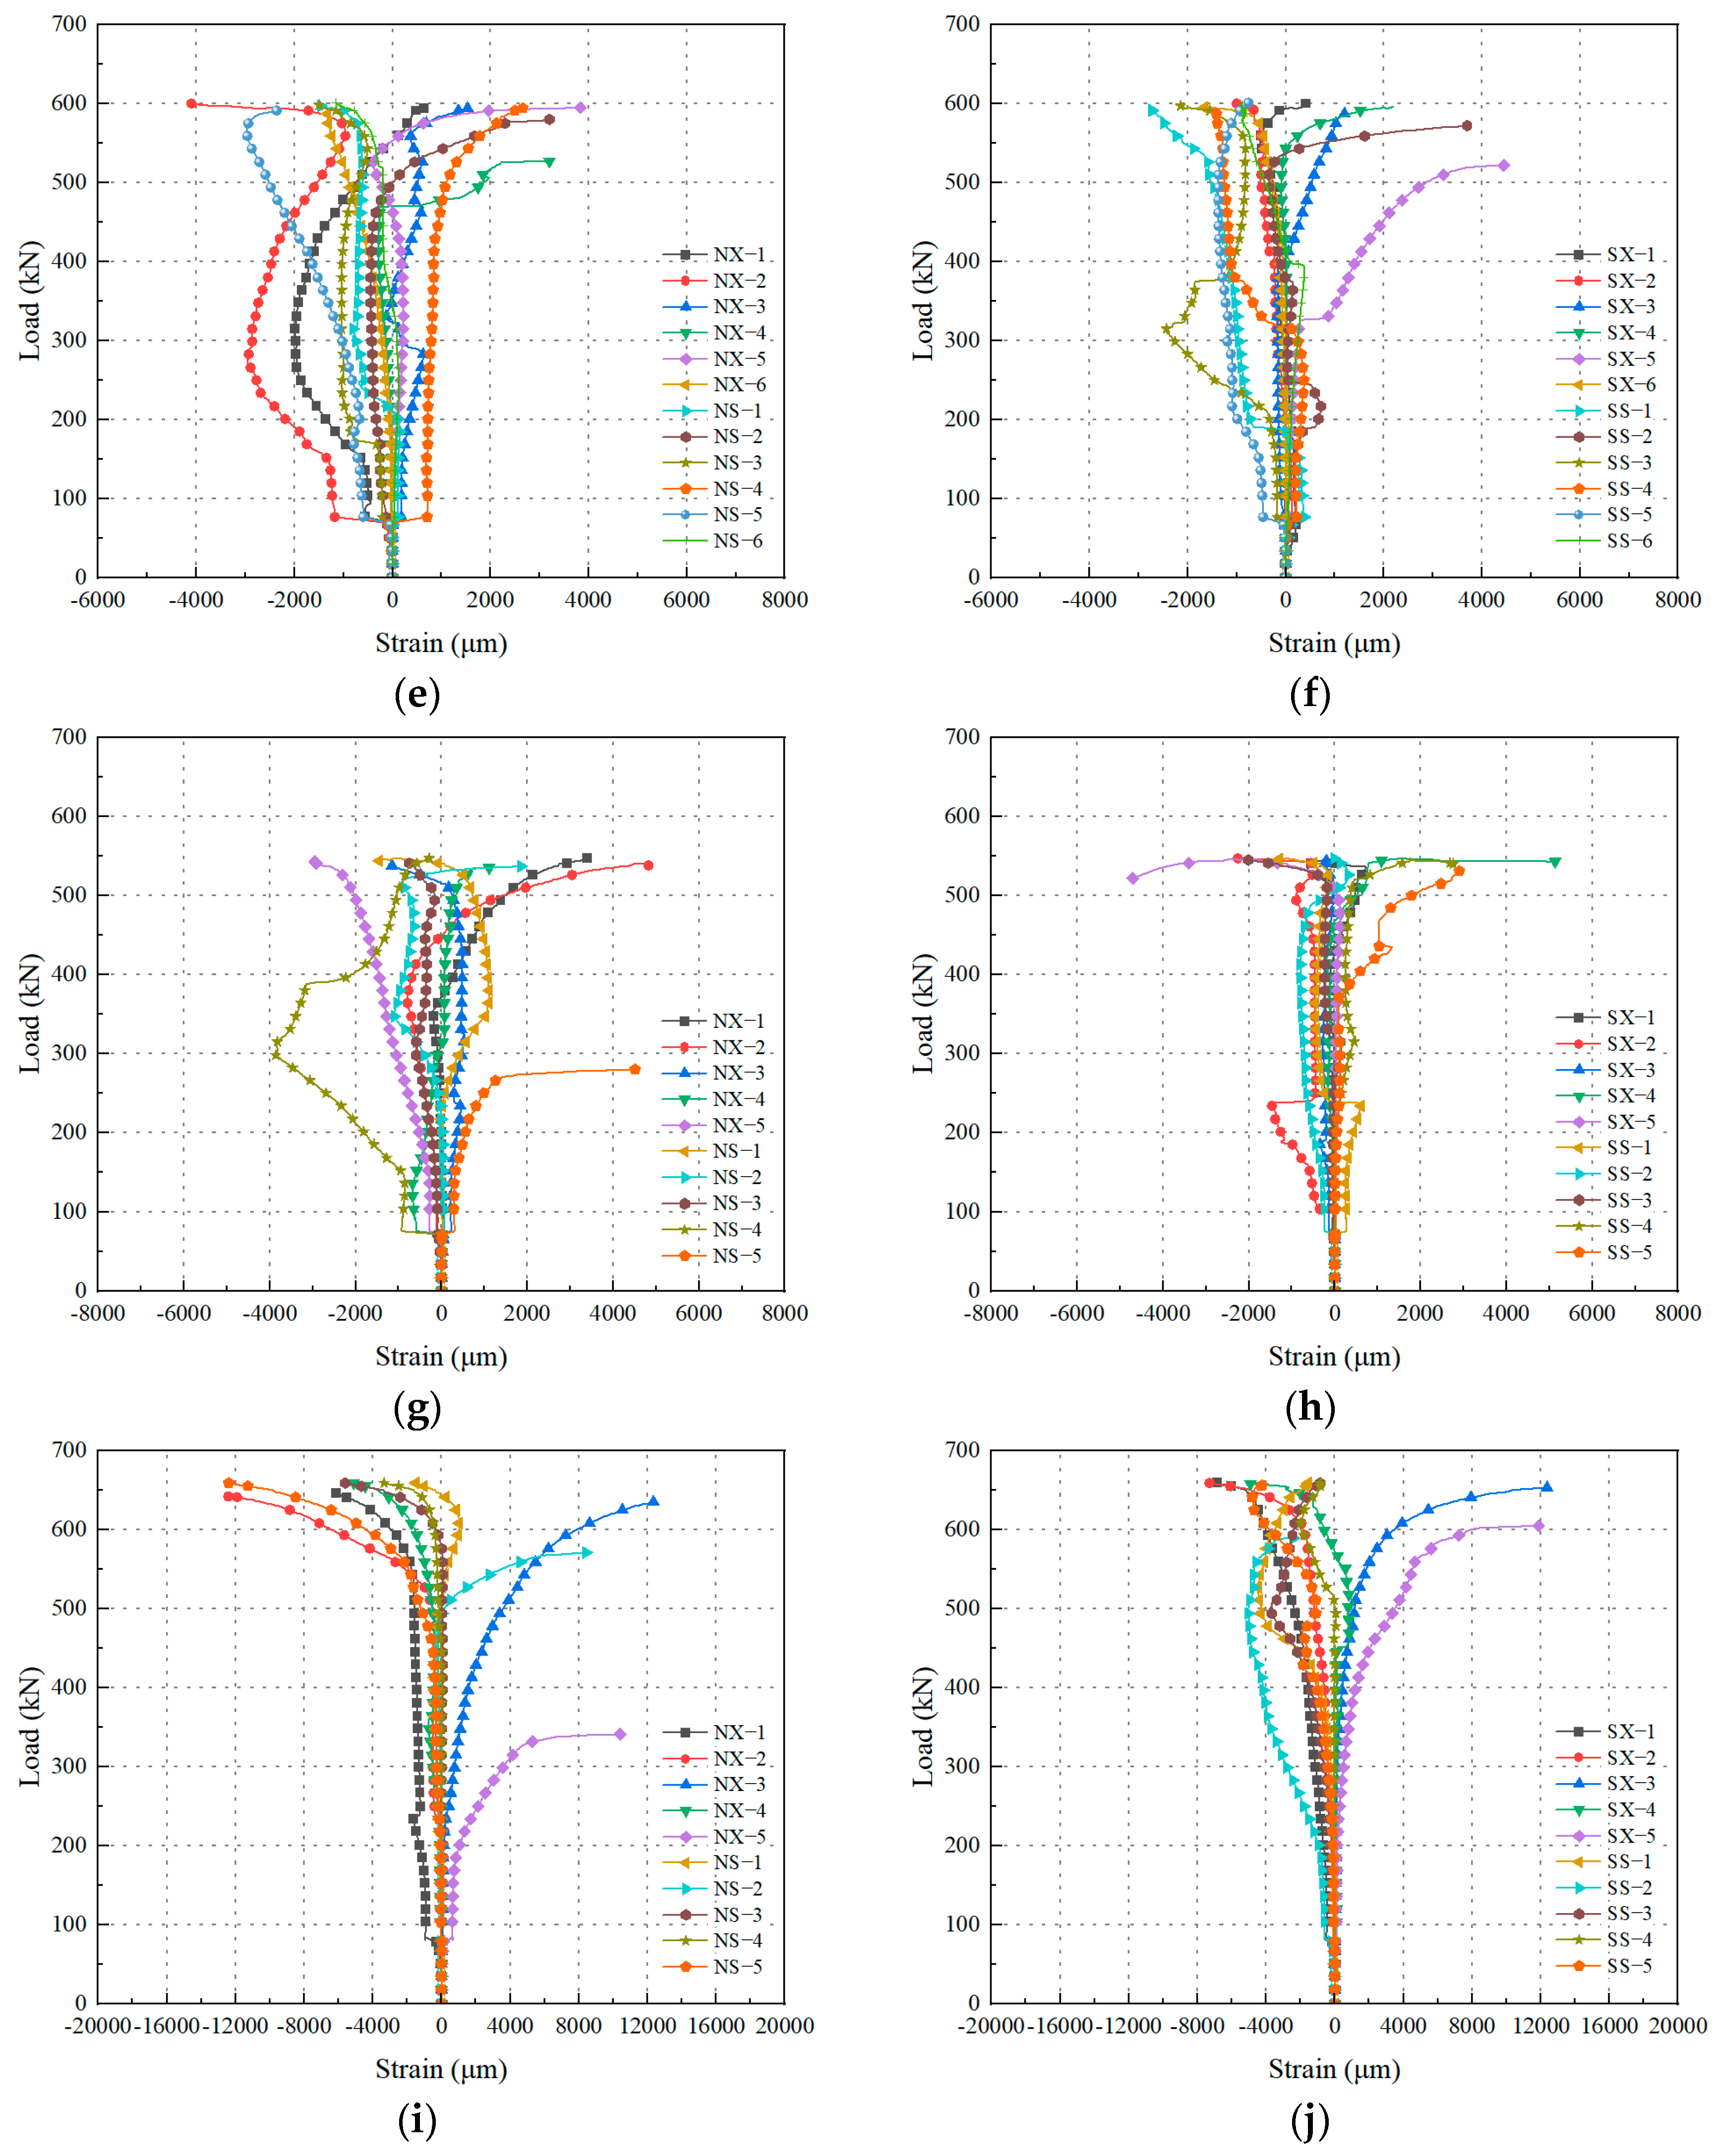
Load–strain curves derived from processed strain data collected by gauges on specimen steel dowels are presented in Figure 17. Tensile strains were recorded as positive values, while compressive strains were registered as negative values in strain gauge measurements.
Steep stress gradients near steel dowel edges profoundly influenced strain gauge measurements, directly resulting in discrepancies in strain relationships across specimen groups. At a 72 kN load, distinct abrupt strain changes were universally observed at all the measurement points on steel dowels. Strain levels in superior dowel regions consistently exceeded those in inferior regions, exhibiting a progressive reduction across sequentially ordered measurement points from point 2 to point 3 to point 4. All the welded stud specimens demonstrated superior integrated performance. The studs entered the plastic deformation phase rapidly during the initial loading, with their strain development exhibiting a monotonically increasing trend until reaching the ultimate capacity. Notably, strain responses at stud roots exhibited distinctive signatures: Elevated strain levels emerged during early loading phases, and strain values at root measurement points persistently exceeded those at stud midspans. This strain distribution pattern exhibits definitive correspondence with the ultimate failure mode of the root shear fracture in stud connectors.
From a holistic structural perspective, the strain values at all the measuring points in stud-welded specimens are significantly higher than those in pure dowel specimens. Particularly notable is the substantial strain increase observed in specimens where studs are welded at the dowel root. Comparative analysis demonstrates that positioning studs at the structurally critical zones of dowels effectively enhances synergistic load-transfer mechanisms between dowels and studs, enabling full utilization of the composite structure’s shear performance.

3.4. Static Mechanical Properties of Specimens

In Table 4, the characteristic point parameters of each load-slip curve are listed, namely, the peak load (Pu) with its corresponding ultimate slip (Du), and the yield load (Fy) with its corresponding yield slip (Dy). The secant slope at a 0.2 mm slip is taken as the initial stiffness (K0), of shear connectors, and yielding is considered to initiate when the stiffness decreases to 50% of K0. The ductility coefficient (η) of specimens is determined by the ratio of Du to Dy.
As shown in Table 4, the dowel–stud hybrid connectors demonstrated significantly higher ultimate load-bearing capacities and ductilities than both conventional shear stud connectors and steel dowel connectors. When the stud diameter increased from 13 mm to 16 mm, the specimens exhibited a 2.2% increase in the ultimate load-bearing capacity and a 4.3% enhancement in the ductility coefficient, representing marginal improvements, while the initial stiffness increased substantially by 22.6%. When the stud length increased from 40 mm to 80 mm, the specimens exhibited a 9.9% increase in the ultimate load-bearing capacity, a 10.9% enhancement in the ductility coefficient, and minor changes in the initial stiffness. When welding locations shifted from steel dowel centers to dowel root regions, specimens exhibited a 20.1% increase in the ultimate load-bearing capacity, a 36.1% enhancement in the initial stiffness, and a 3.6% decrease in the ductility coefficient.

4. Finite Element Analysis and Validation

4.1. Finite Element Analysis Model

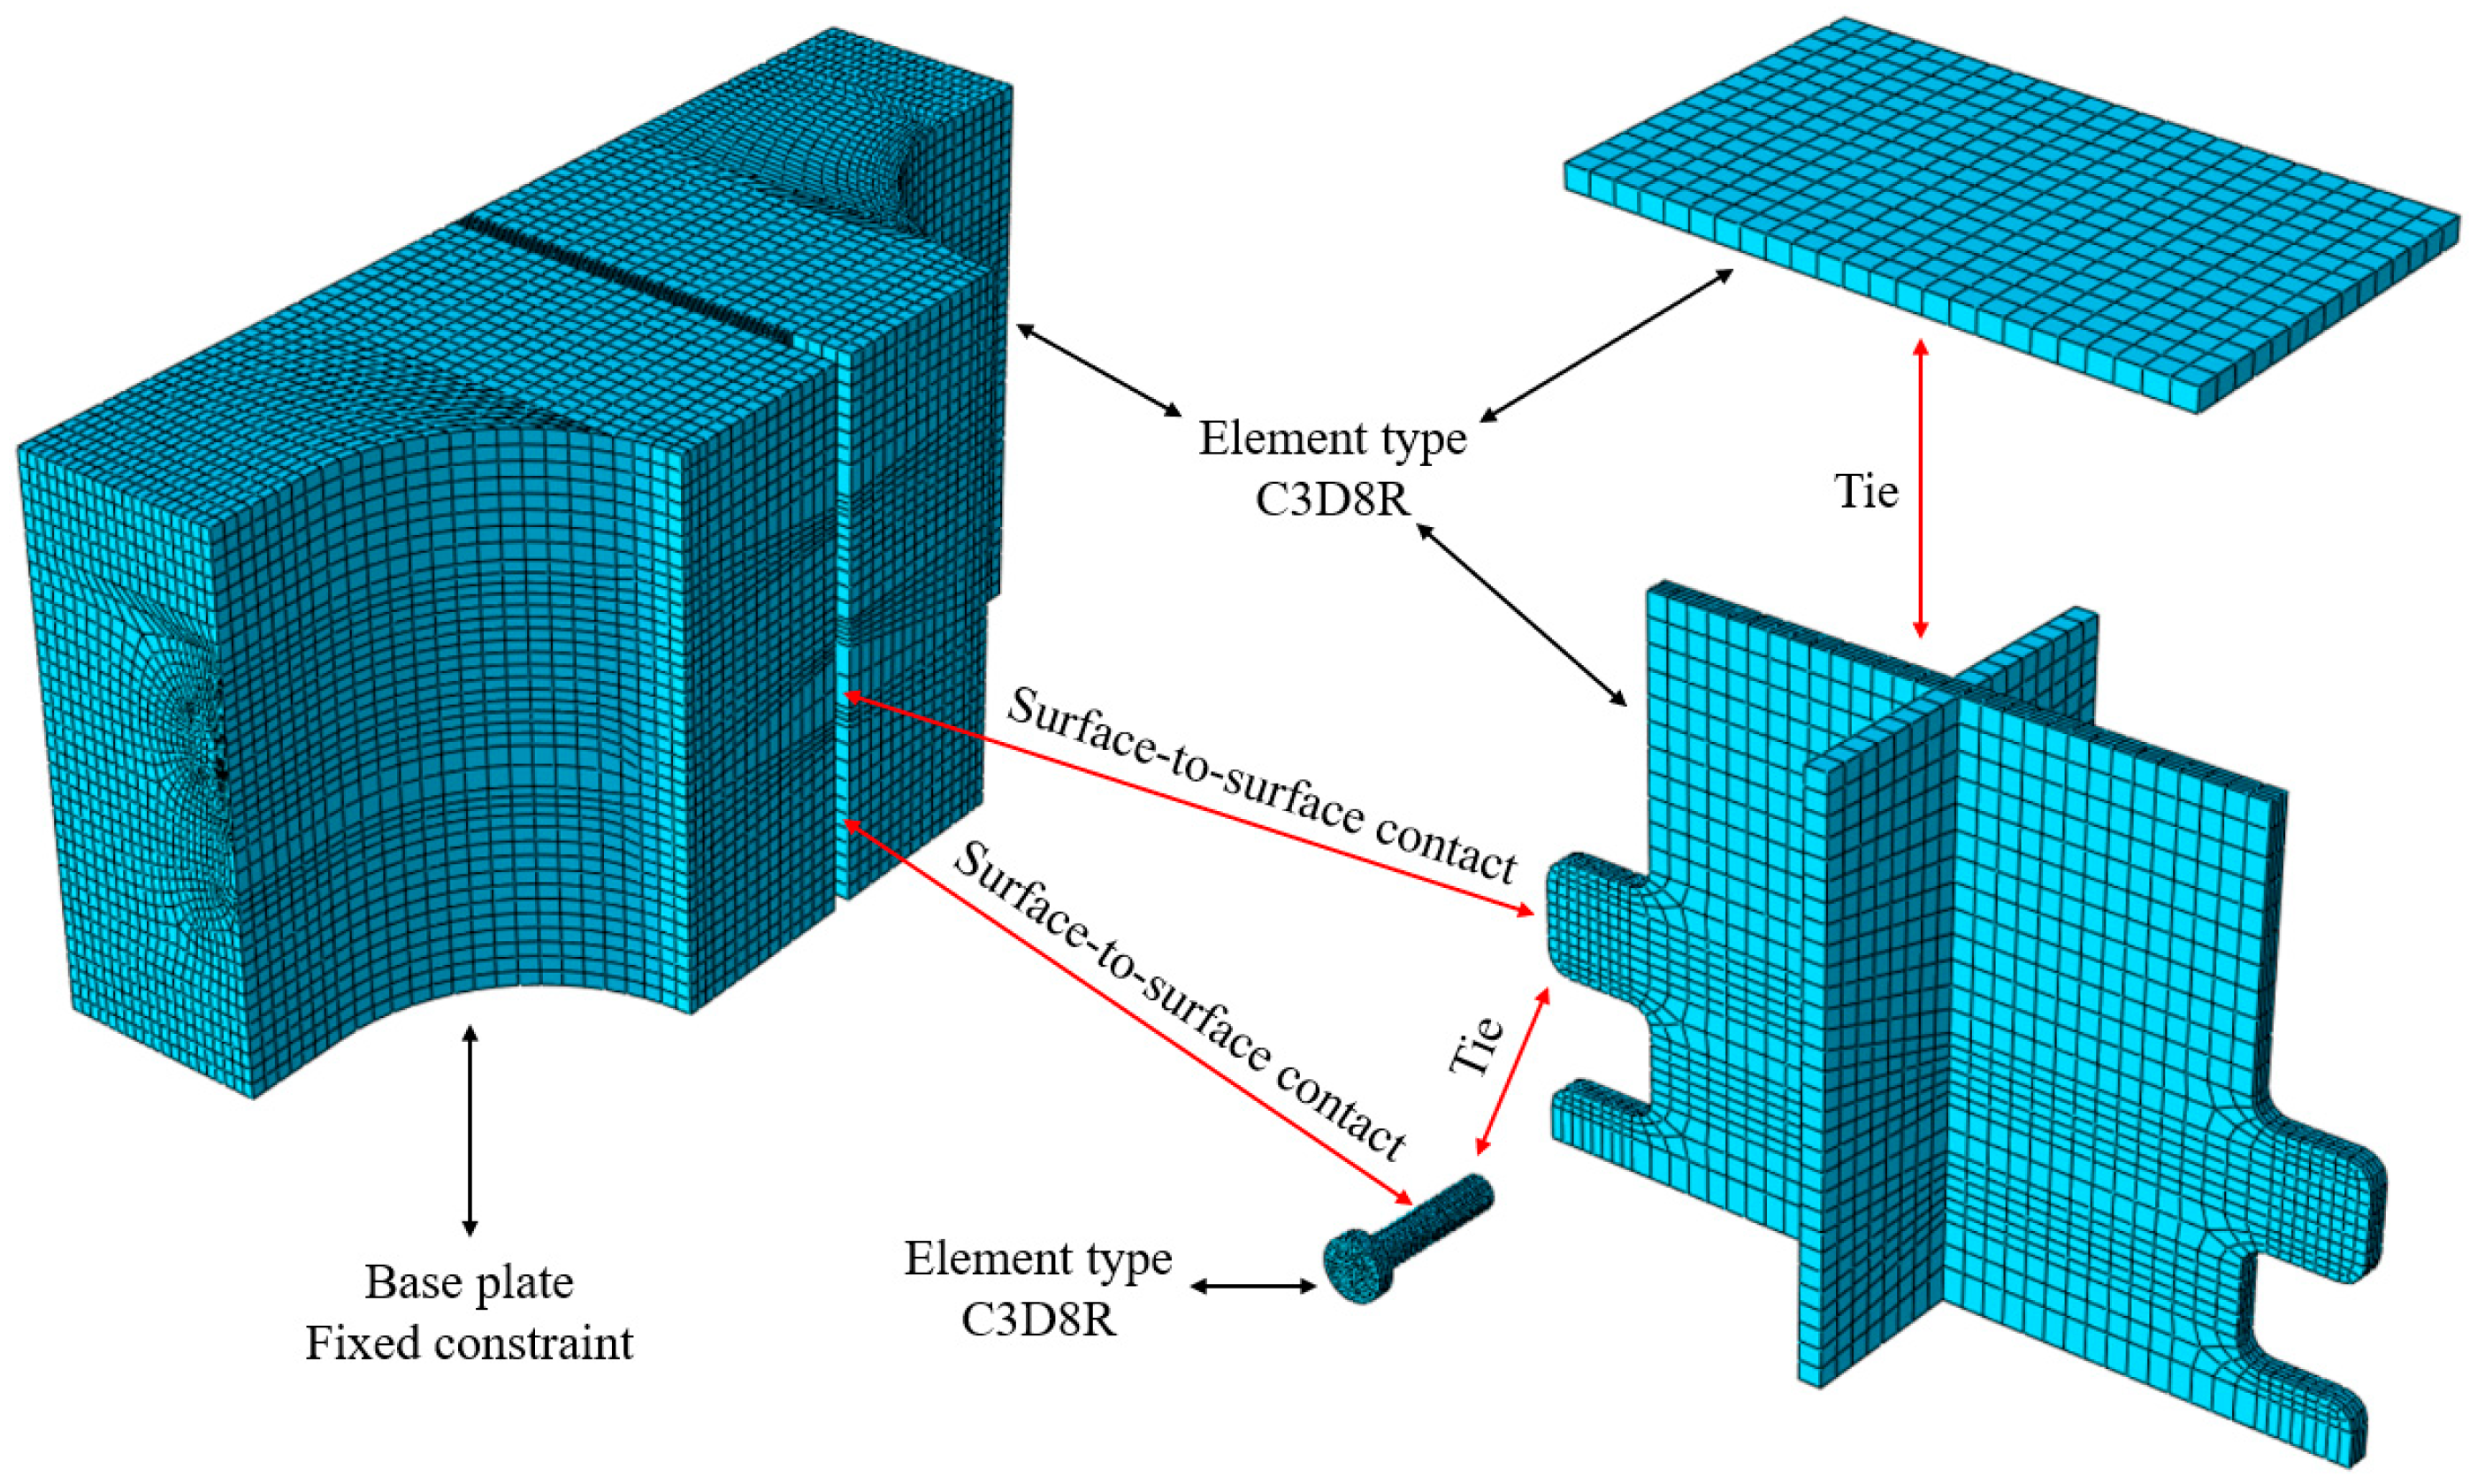
Finite element models were established using ABAQUS 2022 for analysis in this study. As illustrated in Figure 18, a complete model was established for the steel dowel–stud hybrid connector specimens to perform simulations. In this model, concrete blocks and steel plates with integrated dowels, studs, end plates, and rib plates were all modeled using C3D8R solid elements. Consistent with experimental conditions, fixed constraints were applied to the bottom surface of the concrete blocks, while vertical displacement was imposed at the reference point (RP-1) coupled to the end plate center. In the push-out test, stiffeners, end plates, and studs were integrally connected to steel plates via welding, which was modeled using tie constraints. Surface-to-surface contact was implemented between the composite shear connectors and concrete. During testing, significant mechanical interlock and frictional resistance only existed between the side surfaces of the dowel and concrete, whereas the bond strength at the front/rear faces of the dowel–concrete interfaces was negligible. Hence, in the finite element simulation, only the side surfaces of the dowel and stud surfaces were assigned as main contact surfaces, with concrete designated as a secondary surface. For the contact interactions, tangential behavior employed the penalty friction formulation, while normal behavior defaulted to hard contact, with separation permitted after contact.

4.2. Constitutive Relationship of Materials

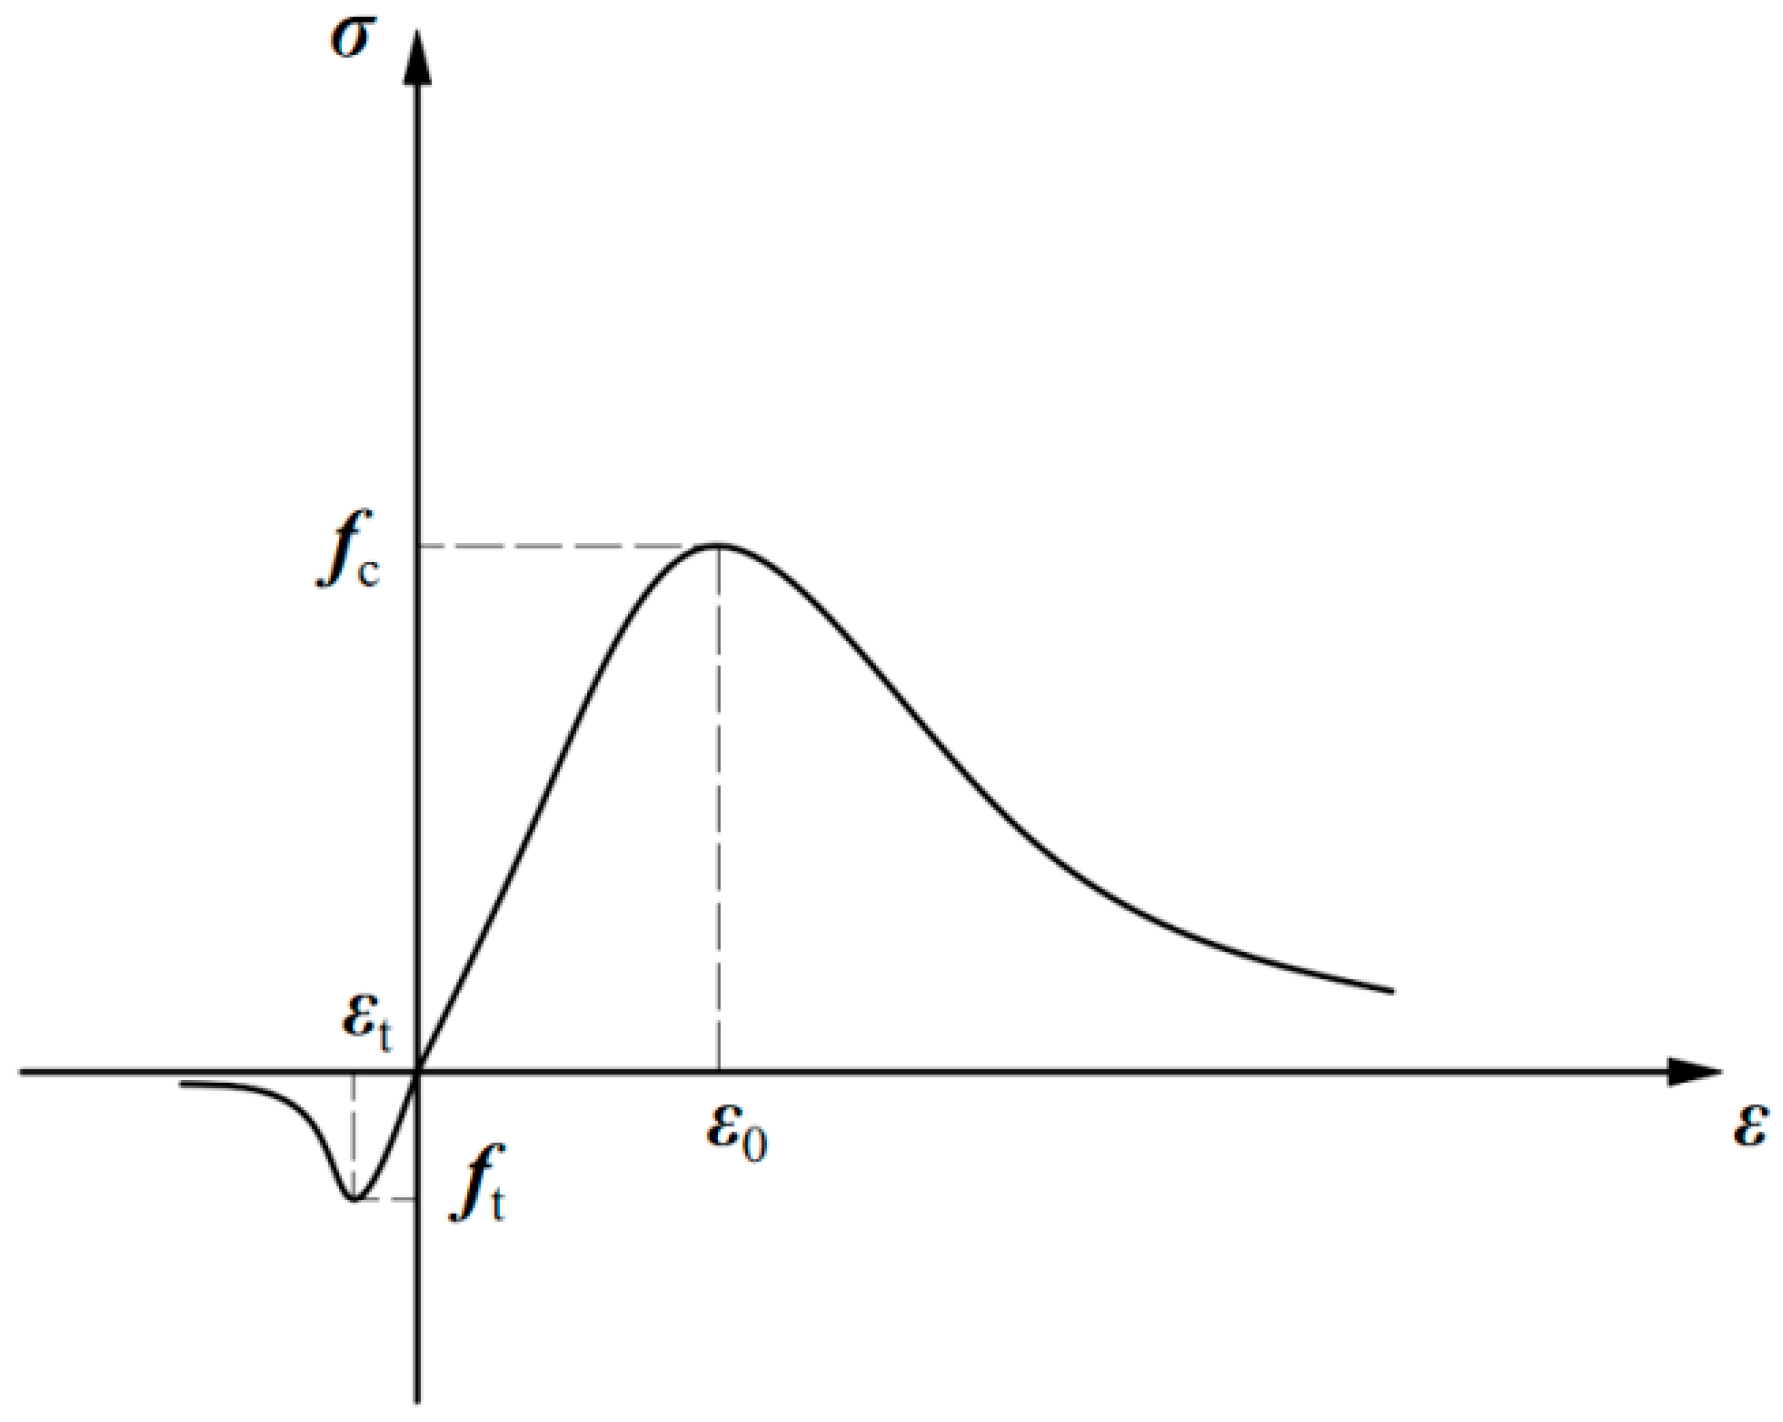
In finite element simulations, numerous constitutive models exist for concrete, with the Concrete-Damaged Plasticity (CDP) model currently adopted as the standard in ABAQUS 2022 due to its robust characterization of damage mechanisms. After comparative assessment, the stress–strain relationship proposed by Yang Jian [35] was adopted for concrete in compression, while Du Renyuan’s model [36] was implemented for the tensile constitutive behavior. The compressive stress–strain curve for concrete is given by Equation (1).
σ c = f c n ξ ξ 2 1 + n 2 ξ         ε ε 0 f c ξ 2 ξ 1 2 + ξ         ε > ε 0 .
where:
ξ = ε / ε 0 ,
n = E c / E s ,
E c = 9500 f c u 1 / 3 ,
E s = f c / ε 0 ,
ε o = ( 6.7264 f c + 2460.9 ) × 1 0 6 .
In the constitutive equation, σ c denotes the compressive stress of the HPC; ε represents the compressive strain; ε 0 signifies the peak compressive strain; f c u is the cube compressive strength; f c indicates the axial compressive strength; E c defines the initial elastic modulus; E s corresponds to the secant modulus at the peak stress point of the stress–strain curve.
Using the peak compressive strain and stress of concrete, Du Renyuan proposed a tensile constitutive model for concrete, as defined in Equation (7).
σ t f t = x 0.92 x 1.09 + 0.08 x 0.1 ( x 1 ) 2.4 + x ,
ε t = 33 f c u 1 / 3 × 1 0 6 ,
x = ε / ε 0 ,
f t = 0.24 f c u 2 / 3 .
In the constitutive equation, σ t denotes the tensile stress of the HPC, ε represents the tensile strain, ε 0 signifies the peak tensile strain, f t is the tensile strength, and f c u indicates the cube compressive strength, with Figure 19 illustrating the stress–strain curves of UHPC under both tensile and compressive loading conditions.

4.3. Model Validation

Figure 20 shows the load-slip curves for different mesh sizes. When the mesh size exceeded 9 mm, the load-slip curves exhibited oscillatory convergence. When the mesh sizes were 9 mm and 6 mm, the load-slip curves demonstrated good convergence. A global mesh size of 9 mm was adopted to improve the computational efficiency, with local refinement applied at the stud and dowel regions. The circumferential element size around the stud was controlled at 4 mm, and the element size along the length direction was controlled at 8 mm.
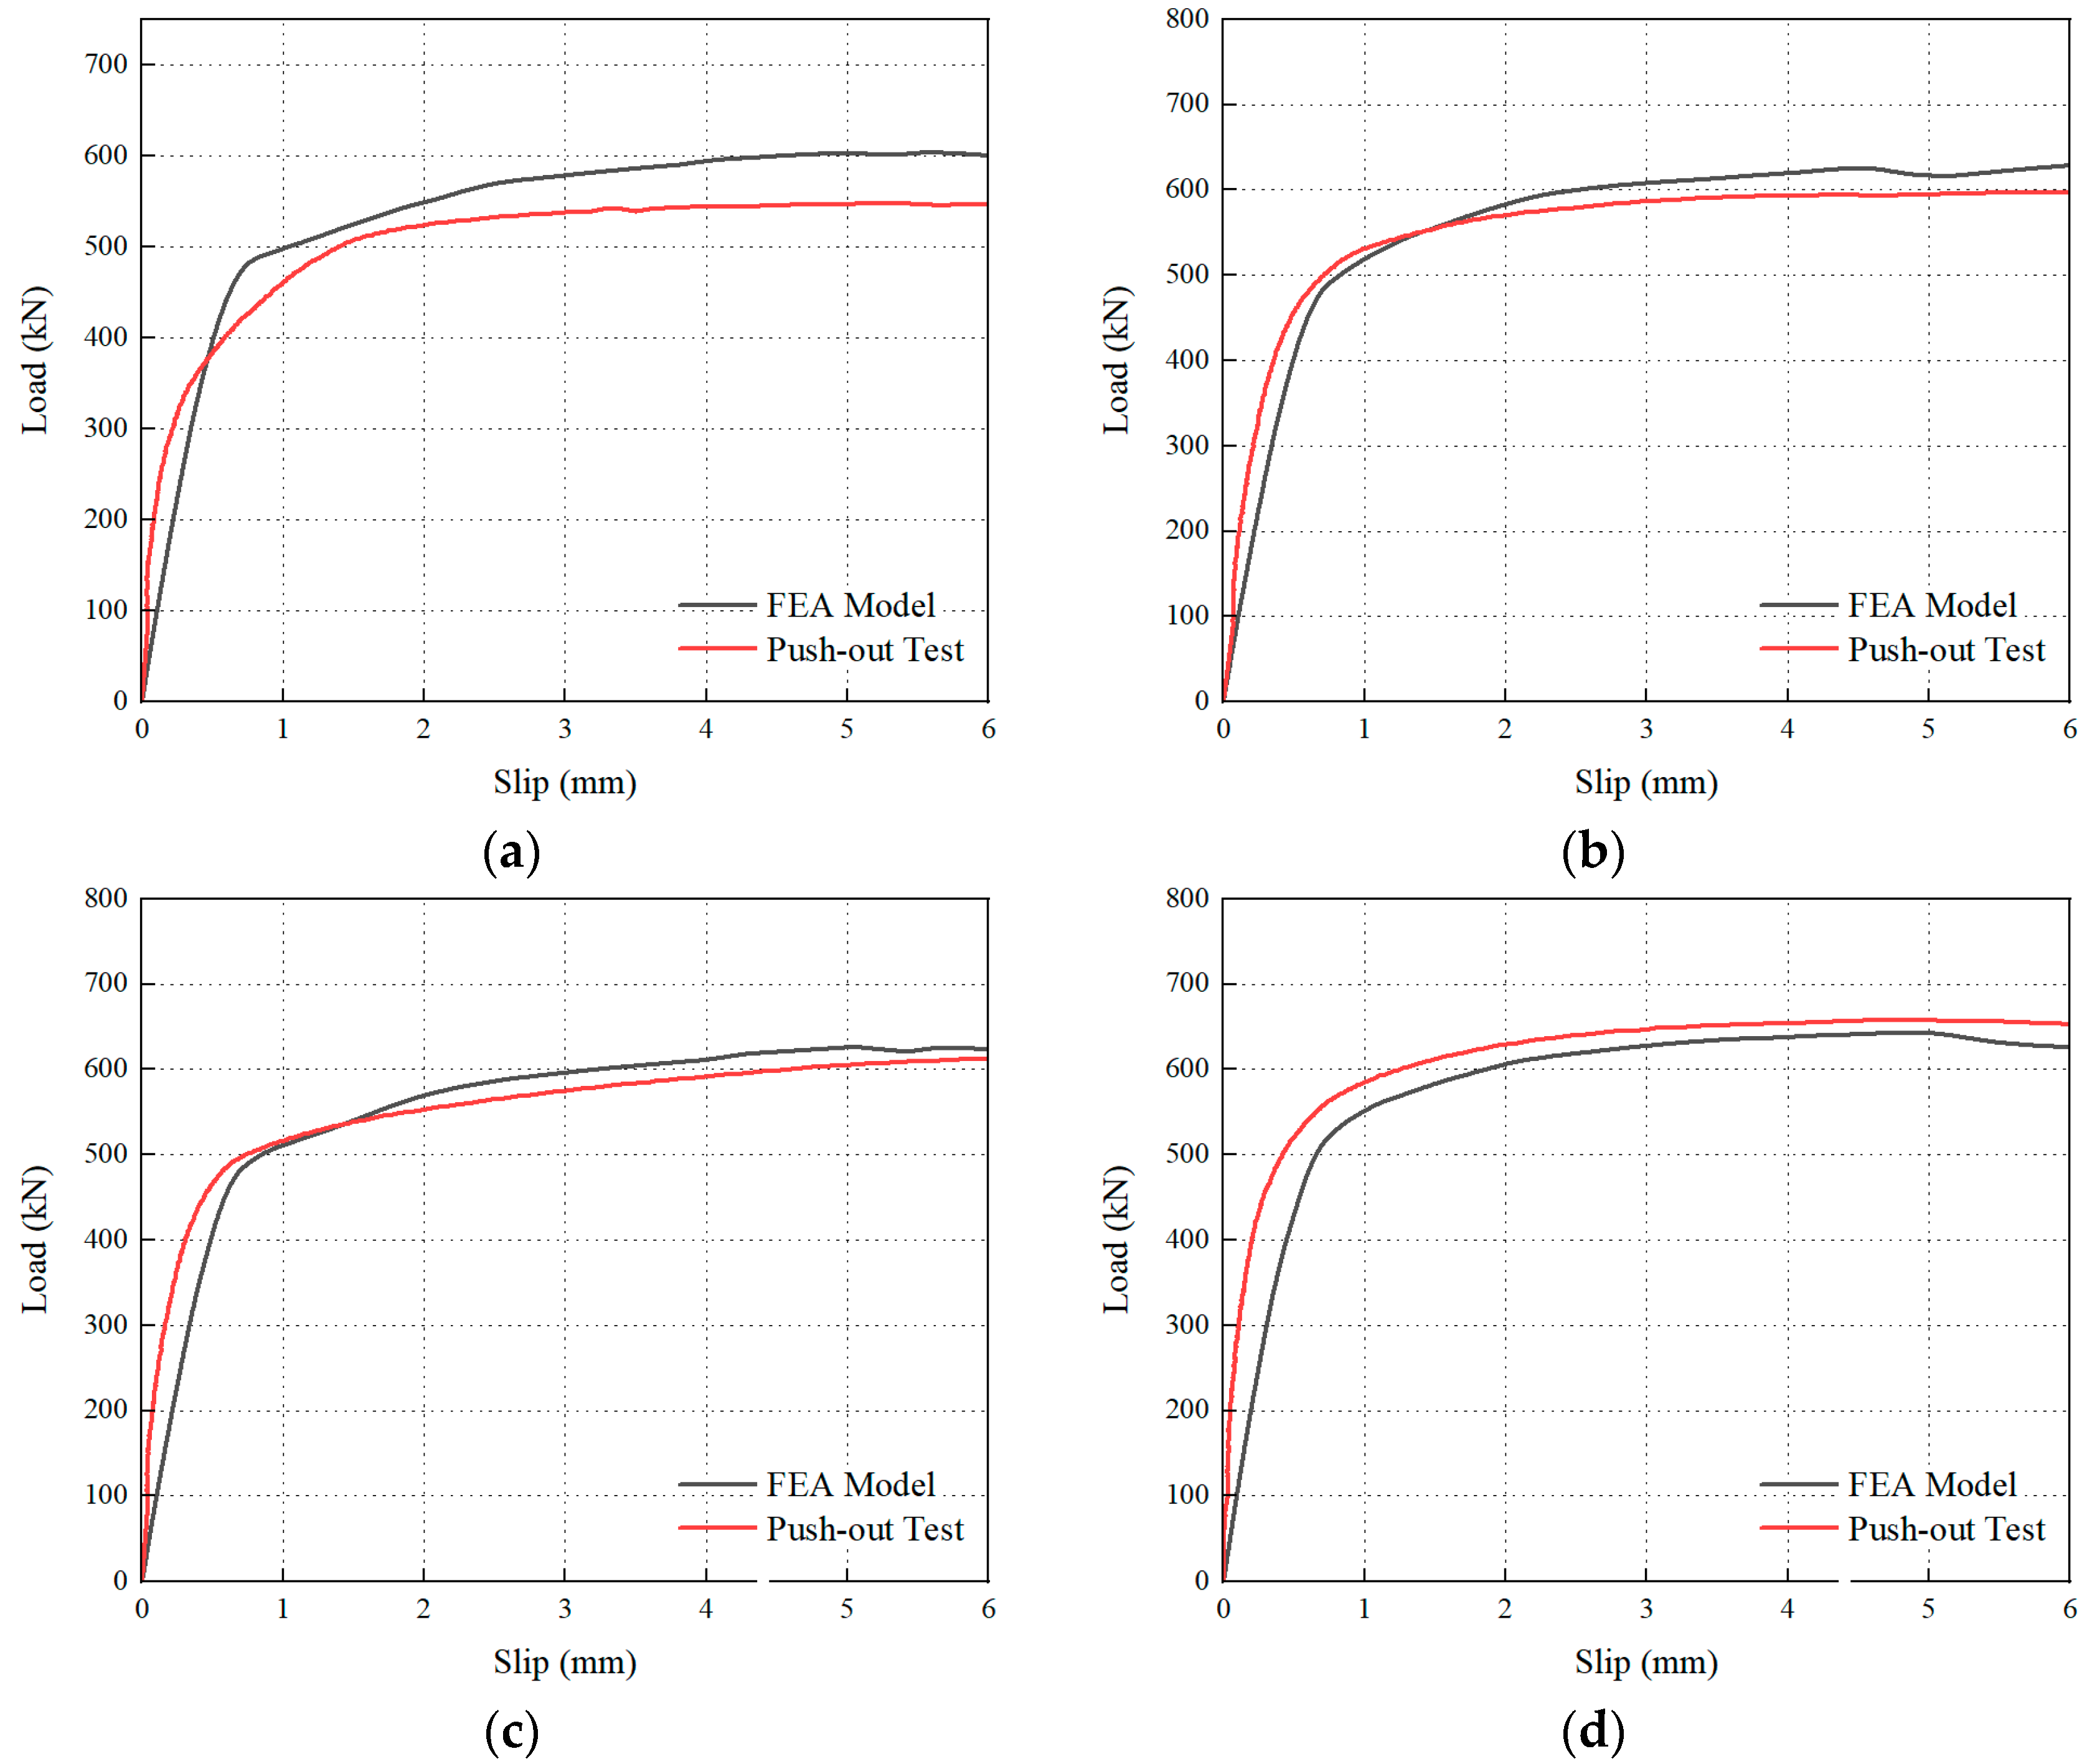
Figure 21 compares the load-slip curves from push-out tests and the FEM simulation for the identical dowel–stud hybrid connector specimen. The finite element model accurately simulated the load-slip curves of the specimen in the linear elastic stage, the initial plastic stage, and the plastic stage. When applying the CDP model to high-strength concrete simulations, concrete elements fail to exhibit material failure during computation [37], resulting in the absence of significant post-peak softening in the FEM’s load–displacement response.
Table 5 compares the shear capacities of specimens from experimental tests and simulations. For all the specimens except D25L40R13Y120, the simulation errors fell within 5%, thereby validating the accuracy and reliability of the numerical model. The lower experimental ultimate capacity of D25L40R13Y120 likely resulted from minor eccentric loading during testing, which induced uneven stress distribution and premature failure before reaching the predicted capacity.
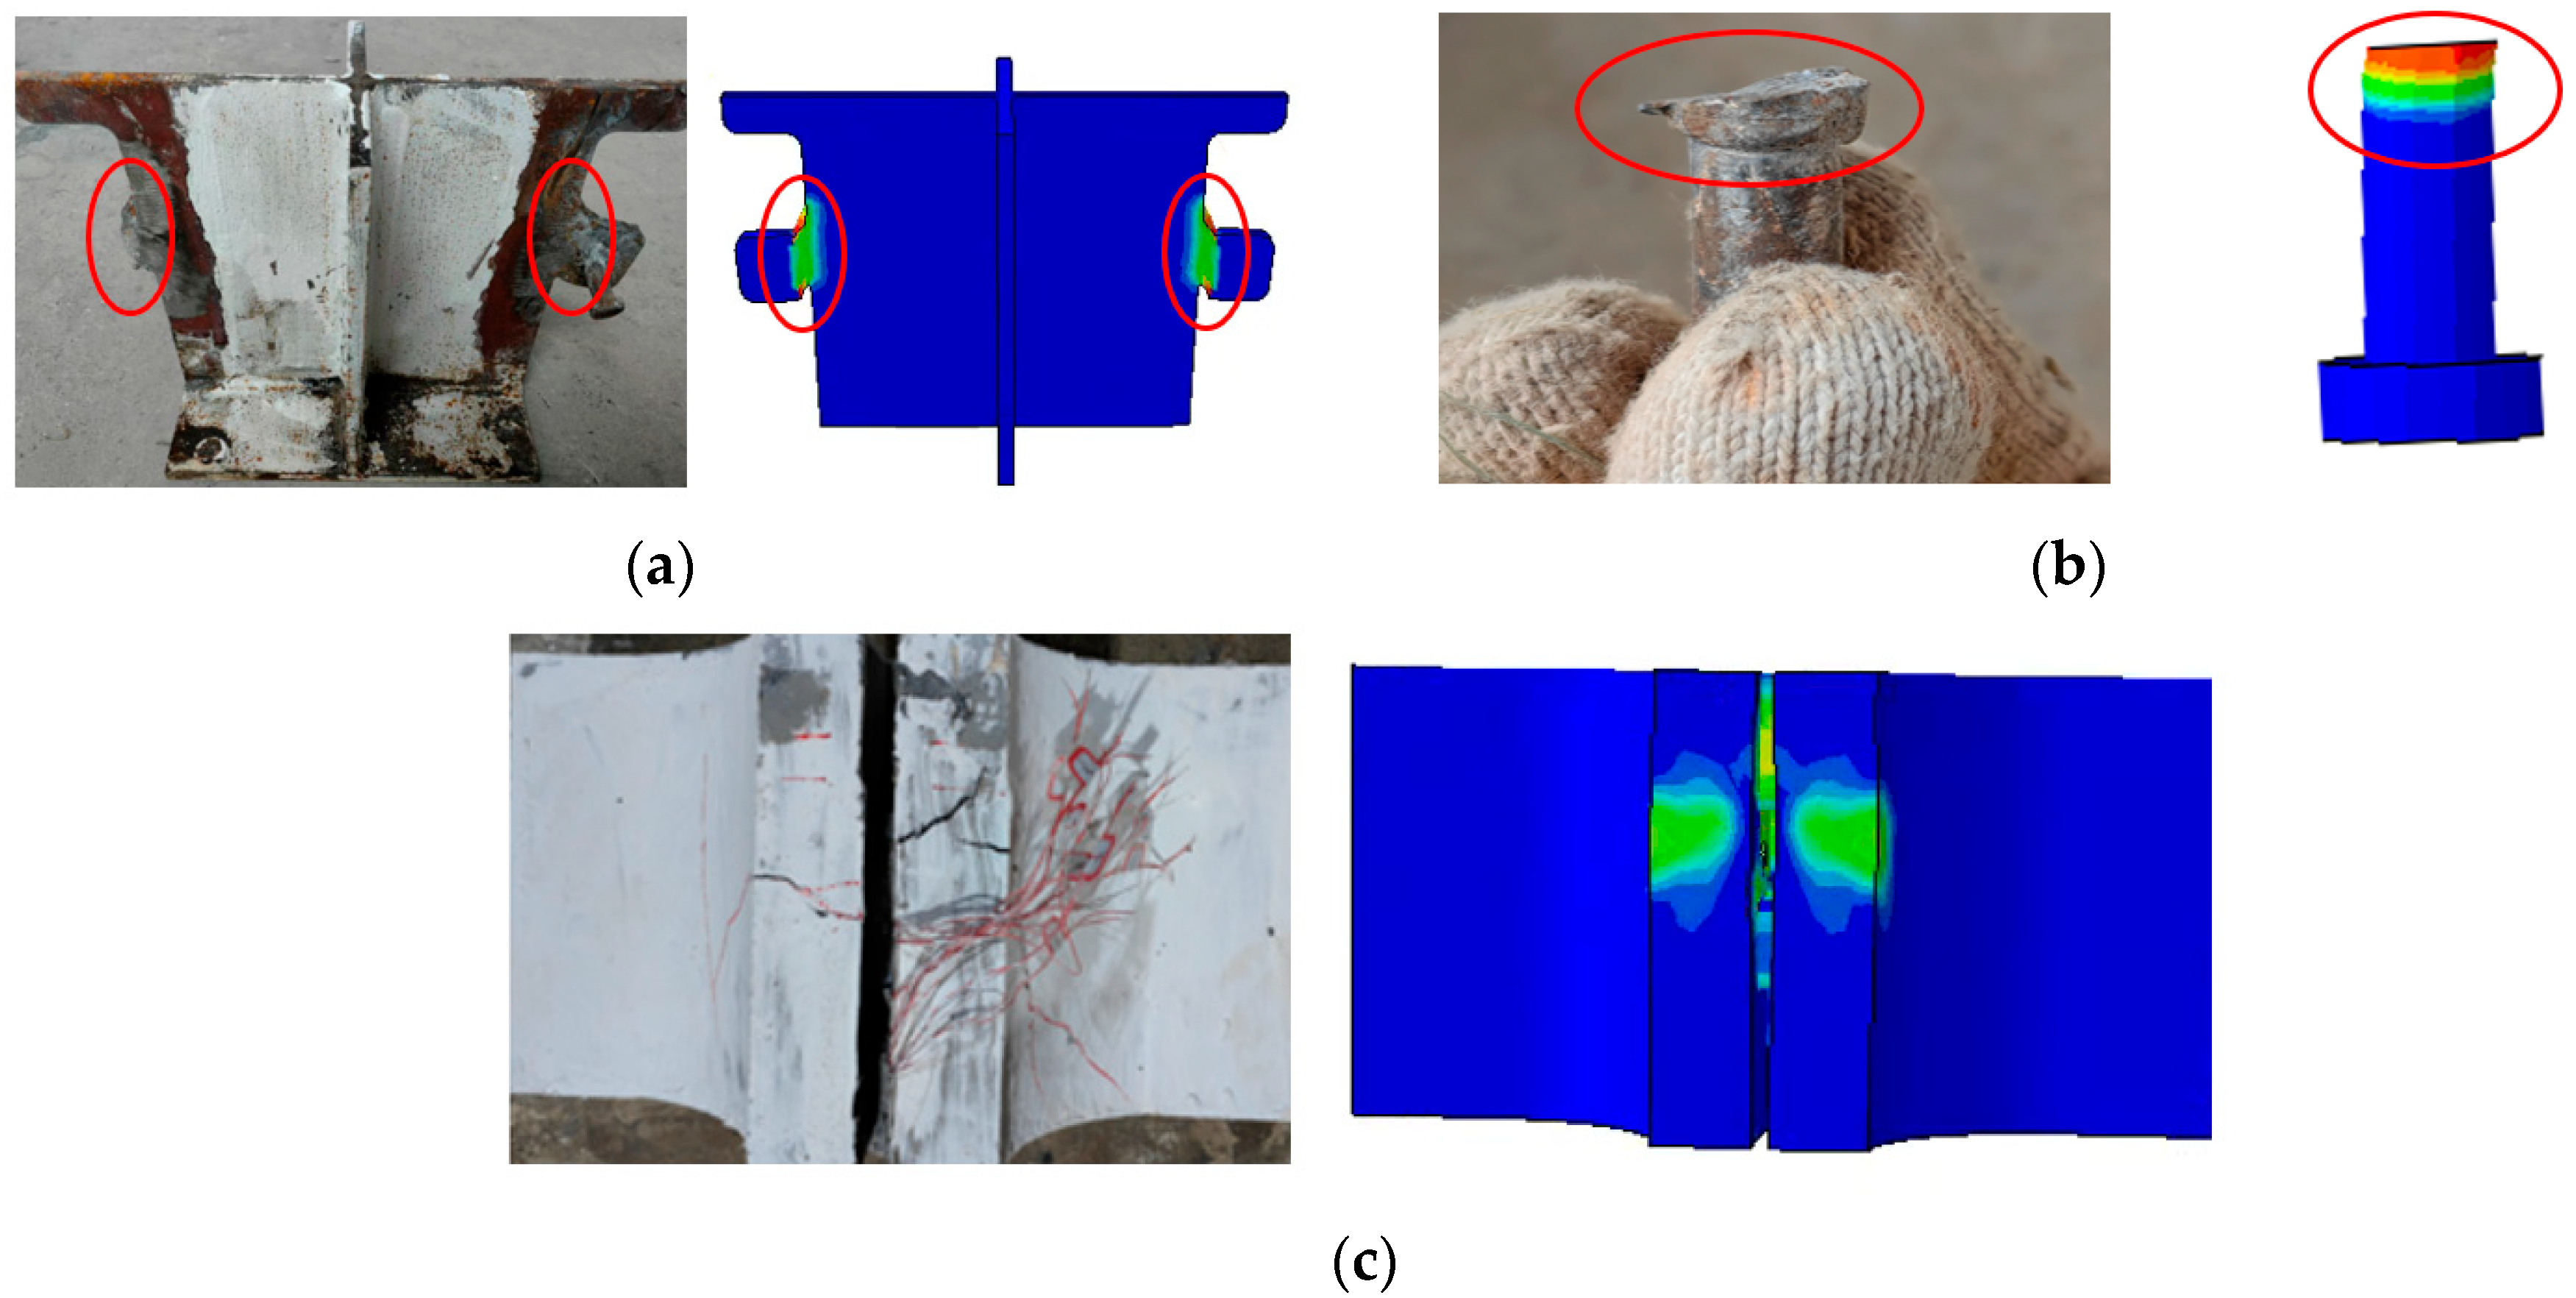
Figure 22 compares the experimental failure morphologies of specimens with the equivalent plastic strain (PEEQ) distributions from FEM simulations. In the finite element simulation, plastic damage zones in both the steel dowel and stud primarily occurred at the root sections, accompanied by global bending deformation, which was consistent with the failure modes observed in the experiment. Simultaneously, significant tensile damage appeared in the concrete fillet within the height range from 115 mm to 210 mm. The damage initially emerged on both sides of the concrete fillet and gradually propagated through the entire fillet section. Additionally, noticeable tensile failure occurred near the steel web on the top surface of the concrete, resembling the failure patterns observed experimentally. Furthermore, localized concrete crushing was observed beneath the steel dowel and stud, consistent with the test observations. The failure morphology of the specimen in the push-out test closely matched the simulation results, demonstrating that Abaqus can accurately simulate the failure modes of the specimen.

5. Failure Process Analysis

Utilizing the finite element model of specimen D25L80R13Y200, the mechanical behaviors of the steel dowels, stud connectors, and concrete during progressive loading were characterized. Finite element simulations quantified the equivalent plastic strain (PEEQ) and von Mises stress in critical regions of the model.
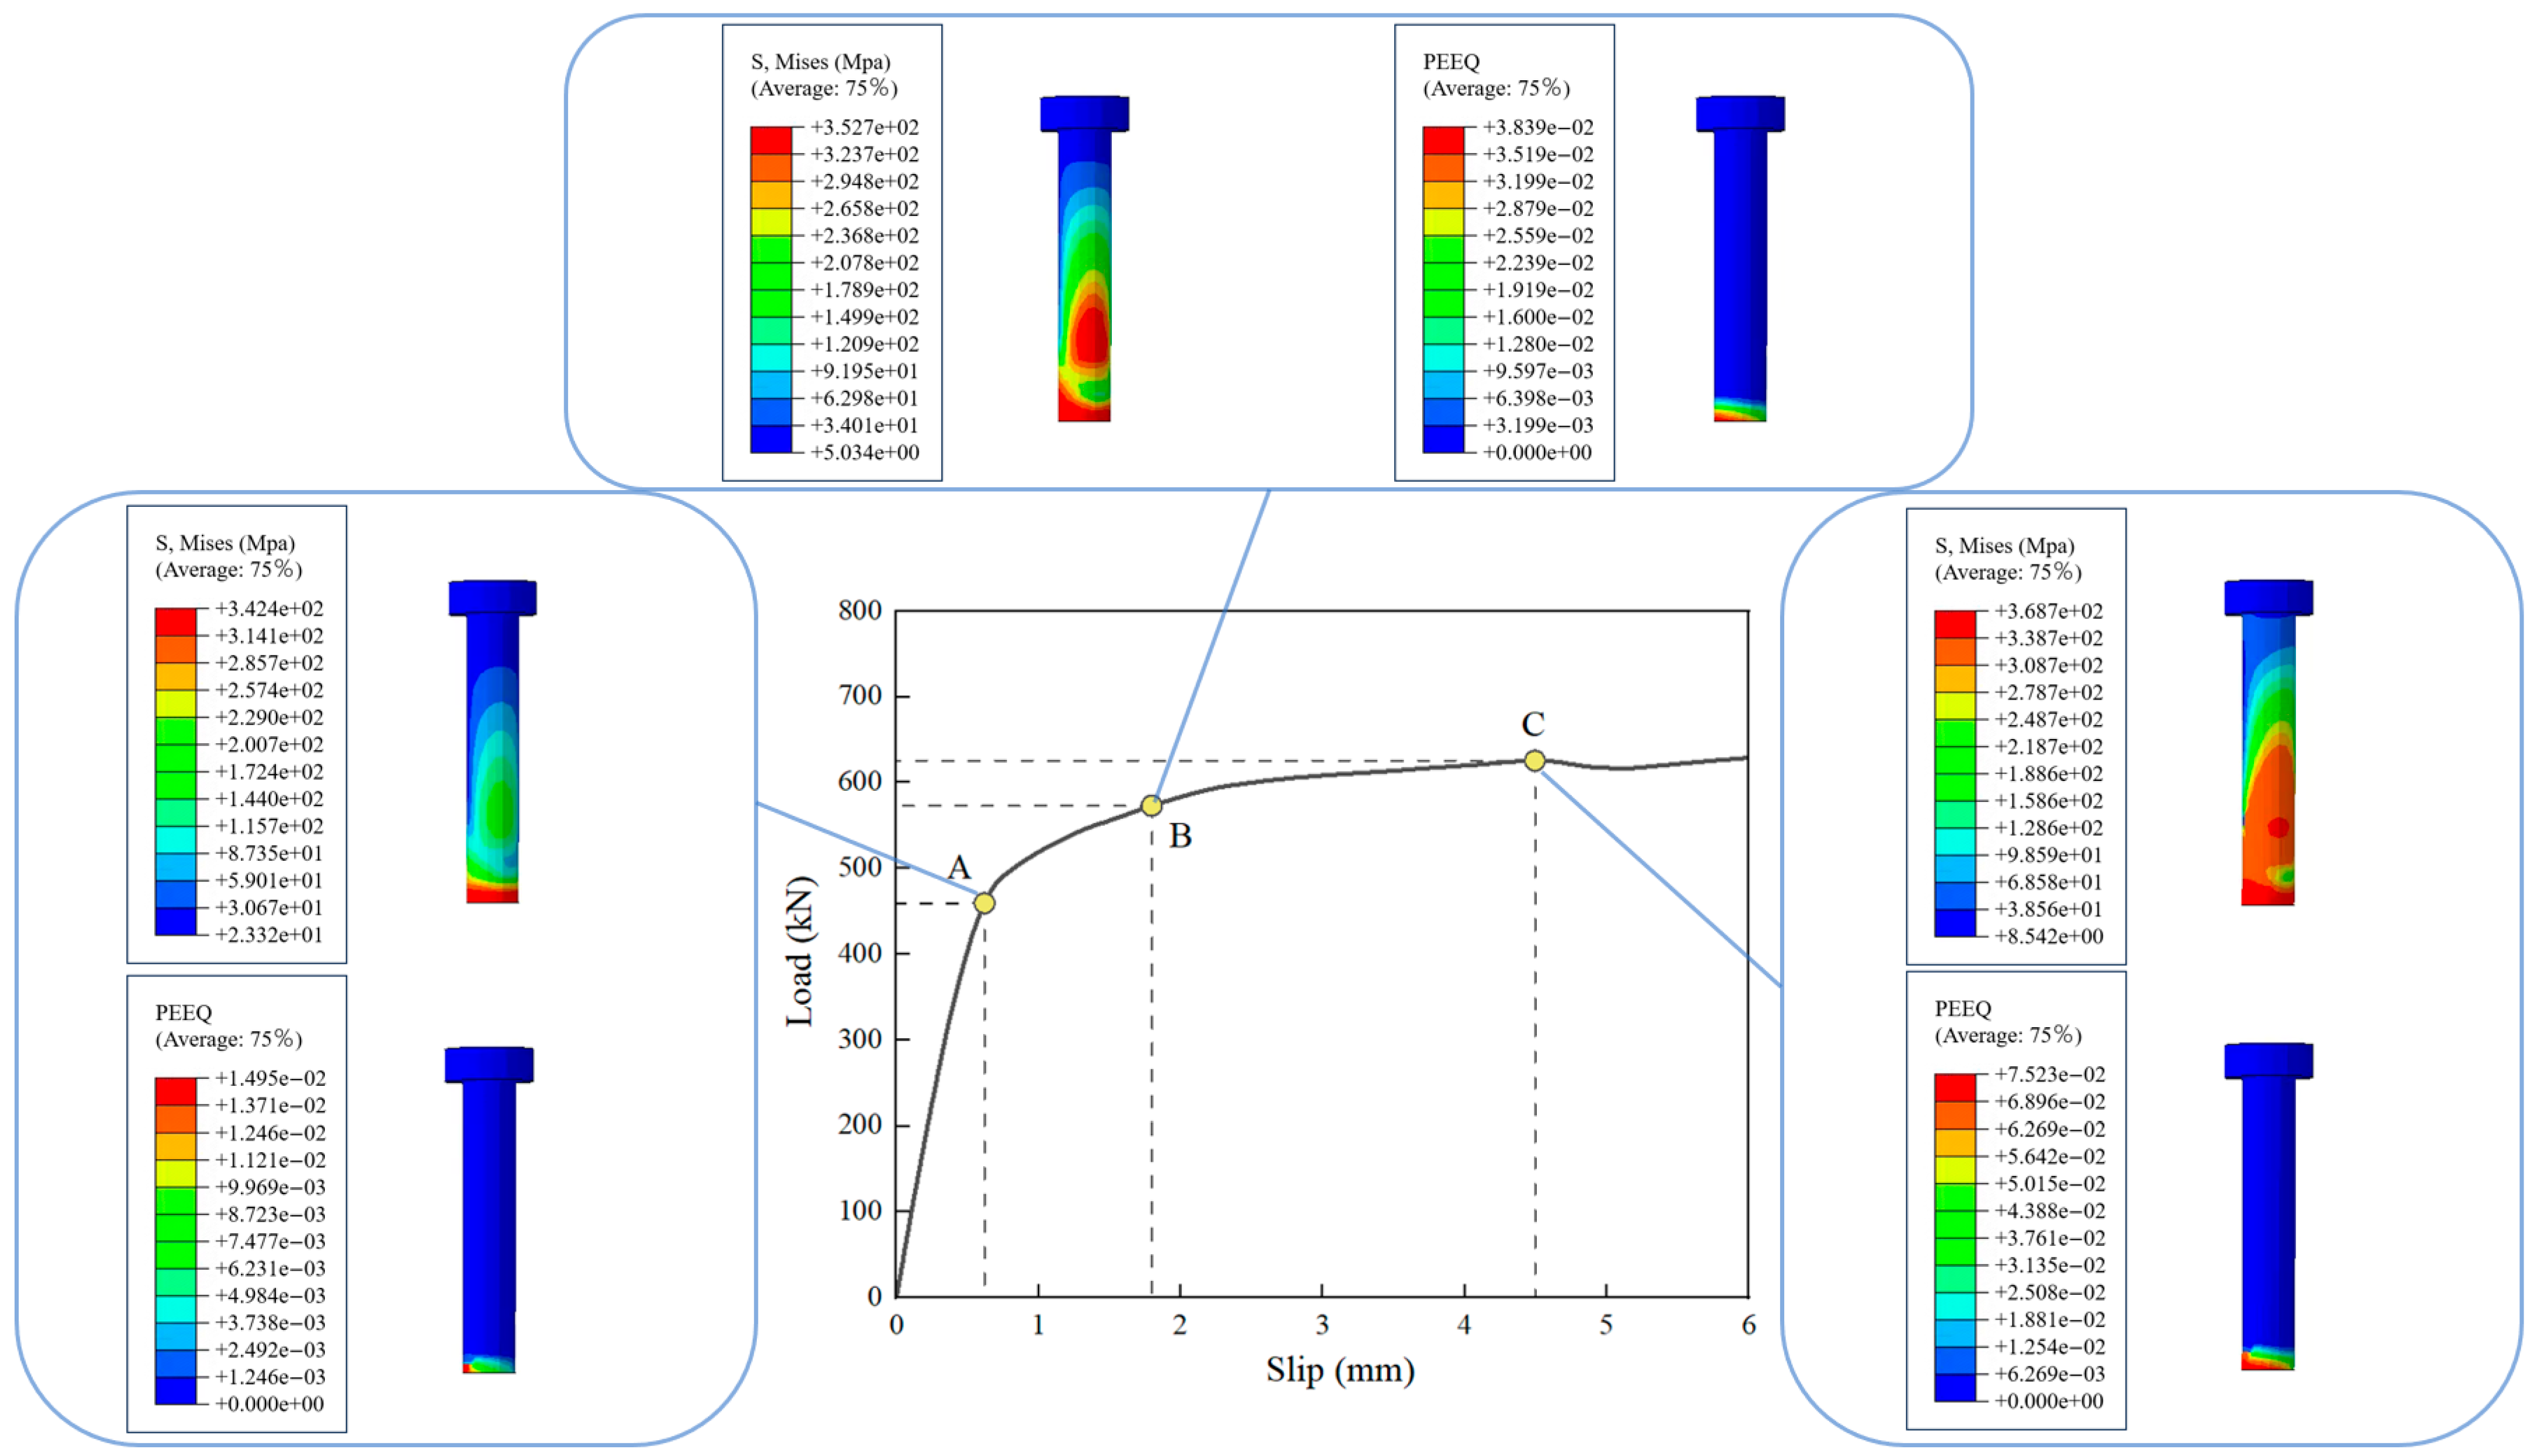
Figure 23 presents the load-slip curve of specimen D25L80R13Y200, along with the development of von Mises stress and equivalent plastic strain around the steel dowel. Points A and B in the figure represent the von Mises stress in the steel dowel reaching the yield strength and tensile strength of the steel material, respectively; point C indicates that the shear connector load reached its peak value. Before point A, the steel dowel was in the elastic stage, during which stress was concentrated at the root and rapidly increased. At point A, the steel dowel root began to reach the yield load and commenced the strain-hardening stage; after the slip displacement passed point A, the specimen stiffness decreased with further slip increases, while plastic strain rapidly accumulated at the steel dowel root. At point B, the load reached approximately 92% of the peak load, and the steel dowel completed the strain-hardening stage. Following the completion of the strain-hardening stage at the steel dowel root, stress variations diminished significantly, resulting in markedly slower load growth. A penetrating plastic strain region formed throughout the root section of the steel dowel. As the slip displacement increased to point C, the maximum plastic strain at the steel dowel root reached 0.21, triggering plastic failure of the dowel and cessation of its load-bearing function, while the shear capacity of the connector assembly concurrently attained its peak value.
Figure 24 presents the development of von Mises stress and PEEQ in the stud connector. Before point A, the von Mises stress at the stud connector root rapidly increased, and yielding commenced, with stress concentrated at the root. During this stage, only minimal plastic deformation occurred at the stud root. After point A, the von Mises stress in the stud increased at a reduced rate, while the stress concentration zone expanded upward along the stud. Concurrently, plastic strain accumulated rapidly at the stud root. After reaching point B, the stress concentration zone expanded further to the mid-height of the stud, while the plastic strain at the root increased further. Upon reaching point C, the plastic strain at the stud root peaked, while significant damage had already occurred at the steel dowel root. However, the maximum plastic strain at the stud root was only 0.075, resulting in minimal deformation. Concurrently, the maximum von Mises stress in the stud reached 368.7 MPa, indicating a substantial safety margin.
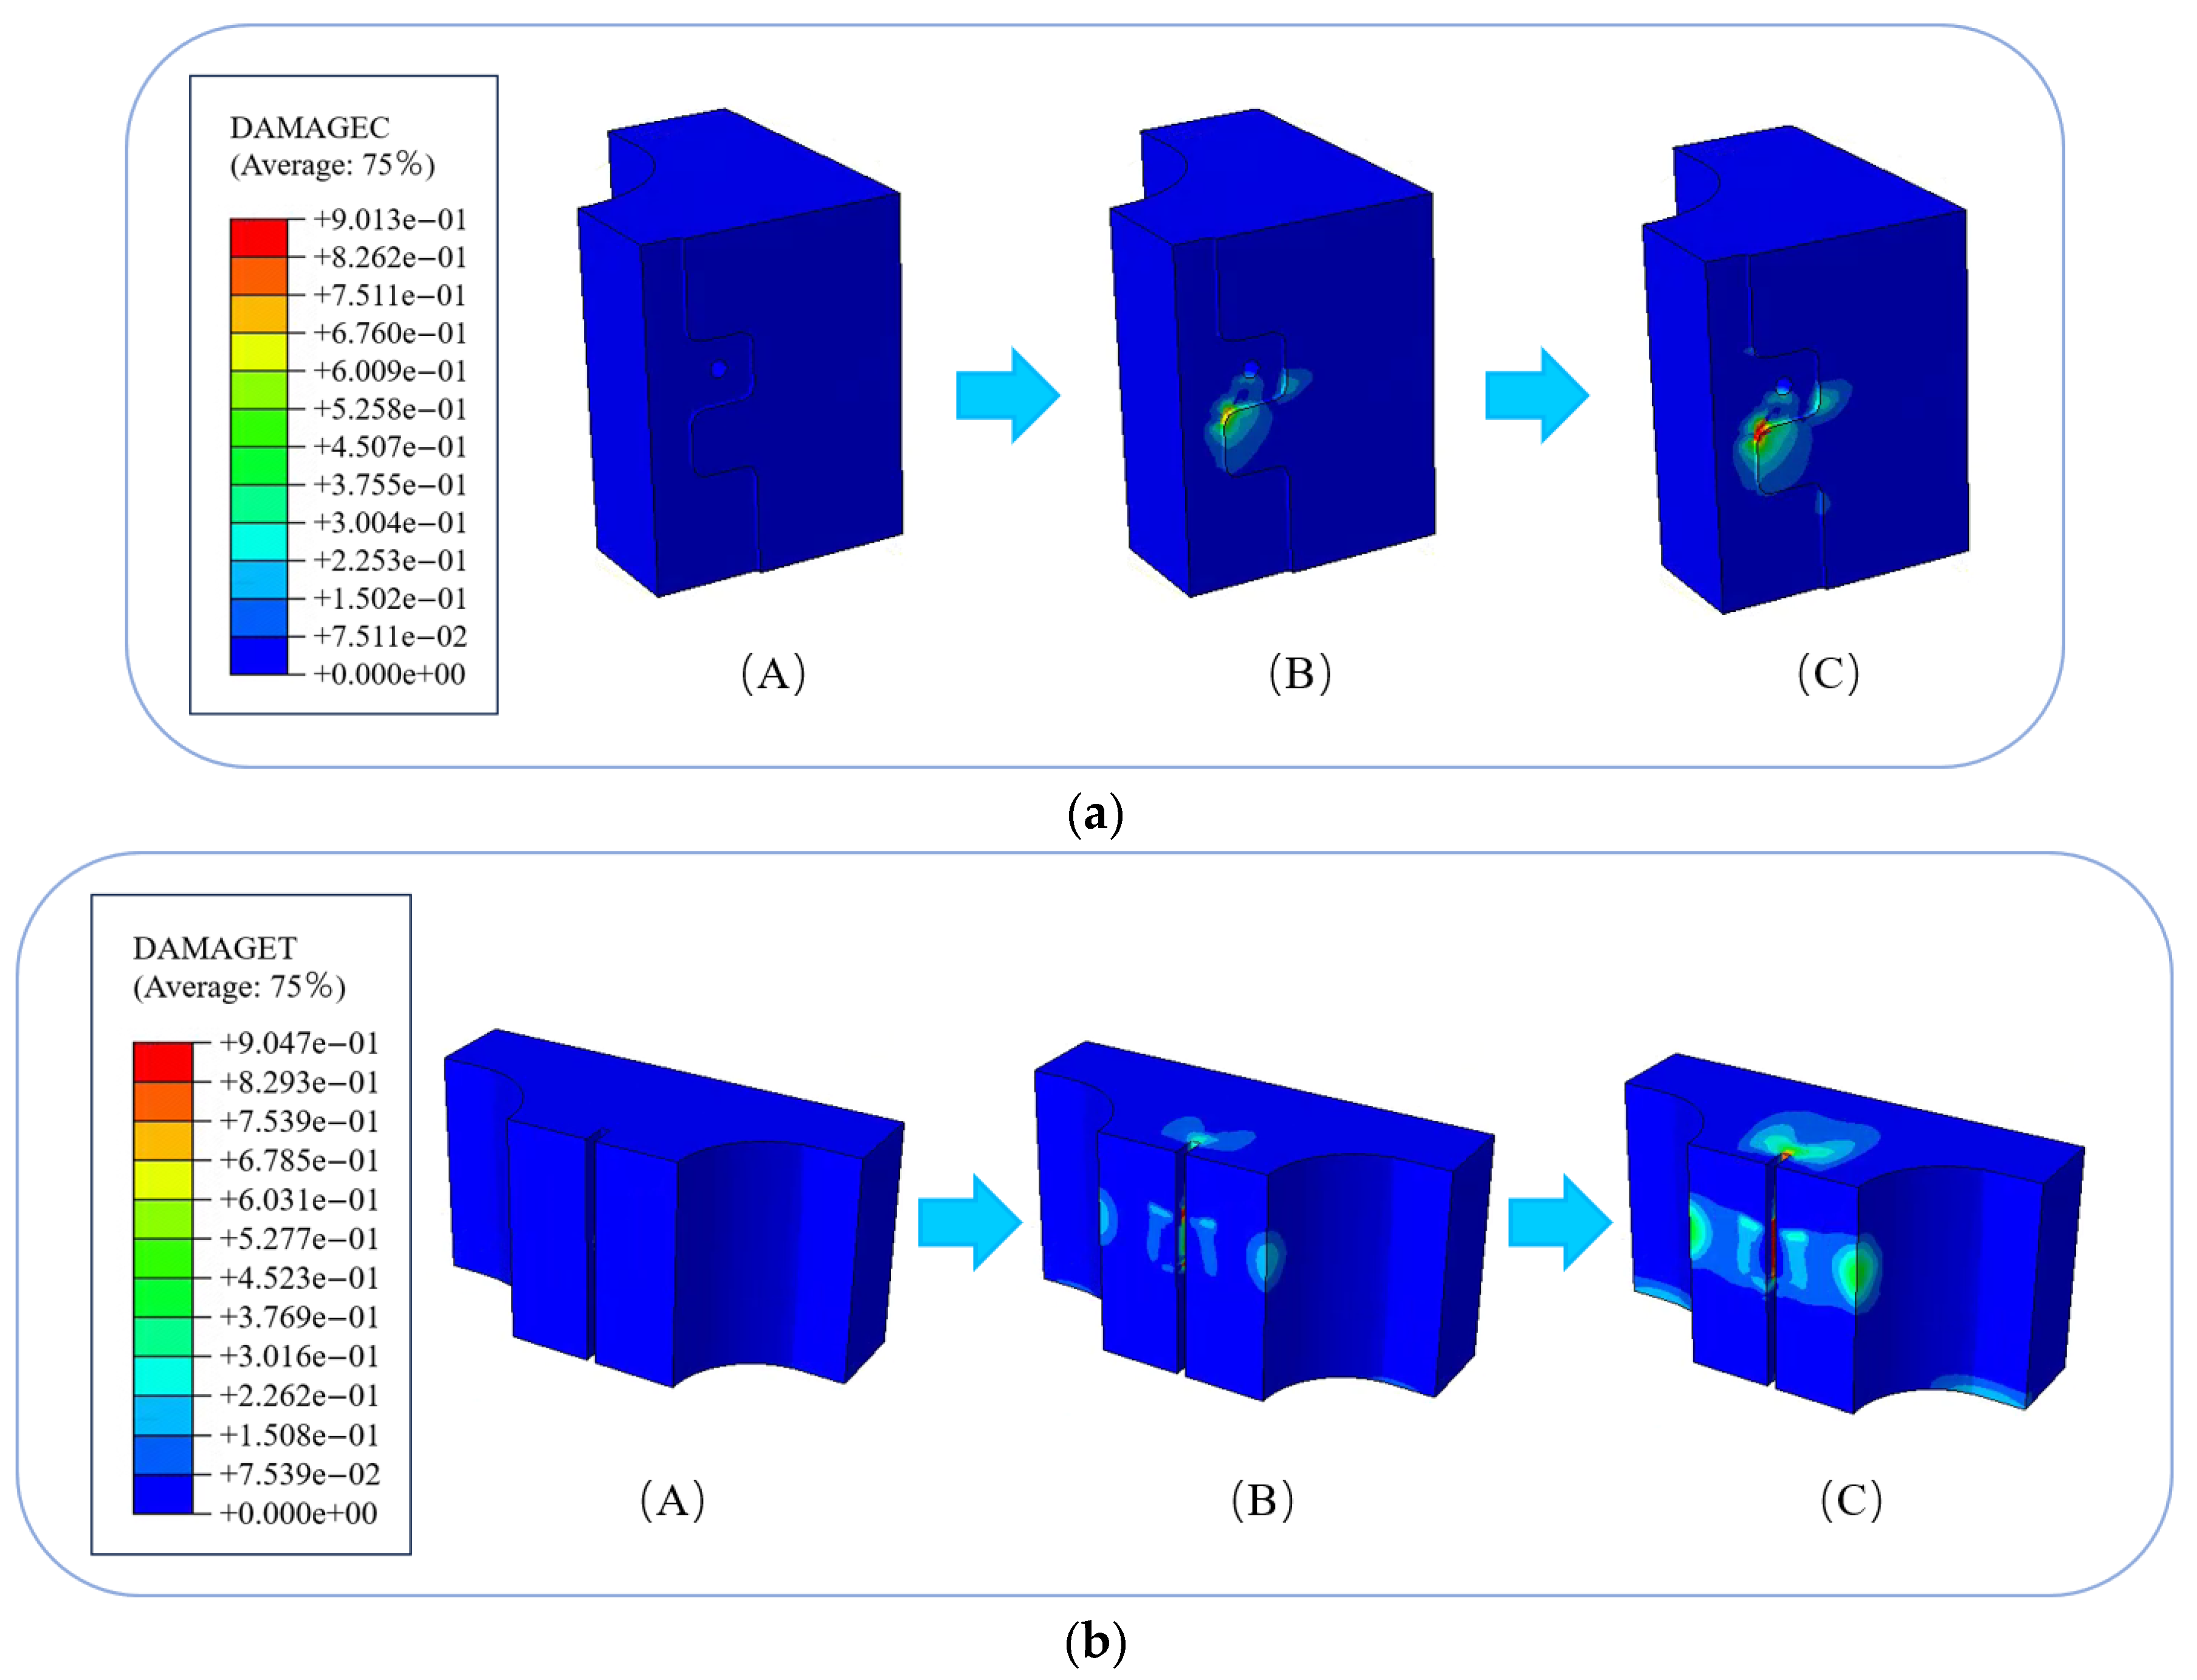
Figure 25 shows the developments of the compressive damage variable in the concrete beneath the steel dowel and stud, and the tensile damage variable at the concrete fillet, which correspond to the damage states of the concrete at points A, B, and C on the load-displacement curve. During the elastic deformation stage of the specimen, no significant damage occurred in the concrete beneath the dowel. When loaded to point B, the stress in the concrete beneath the dowel extended to deeper lower-concrete regions, and small-scale damage began to appear in the concrete beneath the stud. When loaded to point C, further damage occurred in the concrete beneath both the dowel and the stud.
At the concrete fillet, no significant damage occurred during the elastic stage of the specimen. As loading progressed to point B, tensile damage initiated at the concrete fillet near the stud and on the top surface of the concrete. As loading continued to point C, the damage at the concrete fillet gradually propagated through the entire fillet, and the damage on the top surface of the concrete further extended toward both sides.
With reduced stud diameters, the failure mode of the specimens transitioned from the shear fracture of steel dowels to the shear fracture of studs. Reduced stud diameters intensified local stress concentration in concrete near stud roots, thereby increasing concrete-crushing risk. Correspondingly, as the shear transfer share borne by concrete beneath the steel dowel rose, the proportion of the shear force transmitted by studs diminished.

6. Parametric Analysis

This section analyzes three key parameters (the stud diameter, stud length, and welding location) to evaluate their effects on the shear capacity, stiffness, and ductility of dowel–stud hybrid connectors. In practical engineering, stud diameters of 13 mm and 16 mm are commonly adopted. Thus, the parametric analysis in this study utilized the D25L80R13Y200 and D25L80R16Y200 models as baseline configurations.

6.1. Effect of the Stud Diameter

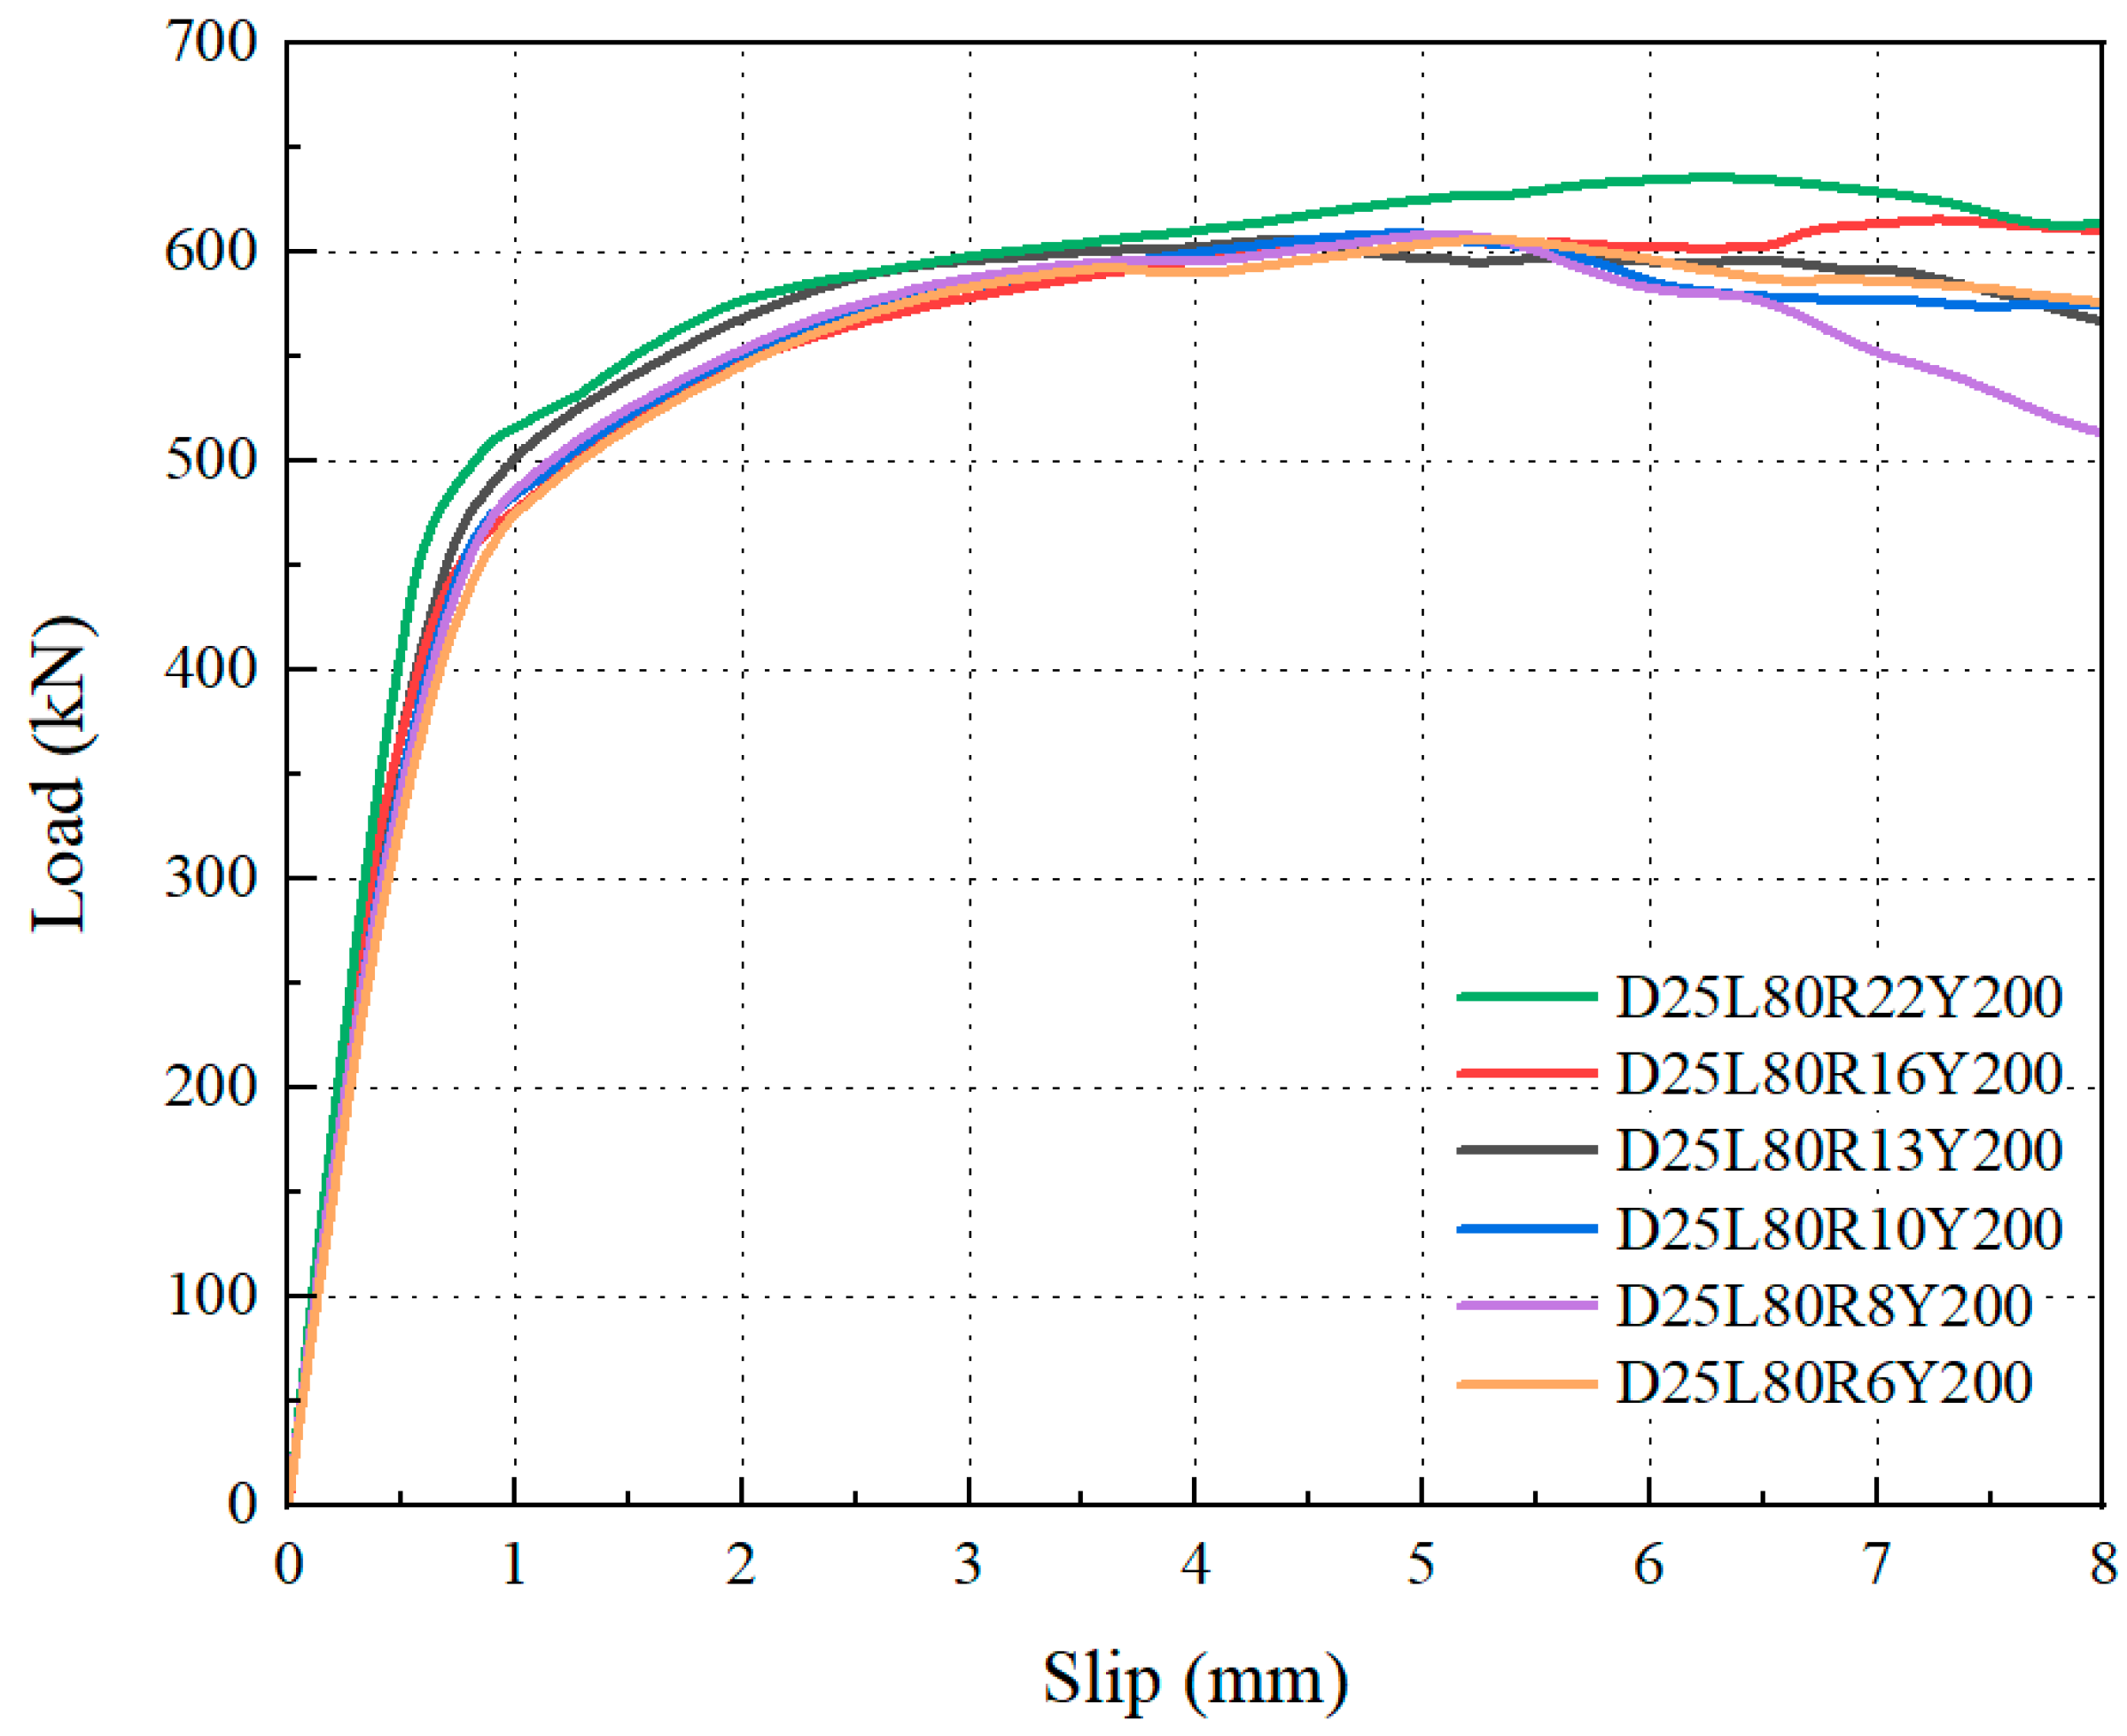
Parametric simulations were conducted to investigate the influence of the stud diameter on the hybrid connector’s shear performance, systematically evaluating six nominal diameter specifications, encompassing 6 mm, 8 mm, 10 mm, 13 mm, 16 mm, and 22 mm. The load–displacement curves of these models are presented in Figure 26. All the models exhibited typical linear elastic responses during the initial loading, with stiffness values ranging between 753 and 809 kN/mm and increasing with increasing stud diameter. After the elastic stage, D25L80R22Y200 exhibited significantly higher ductility compared to those of the other models, demonstrating superior plastic energy dissipation capacity.
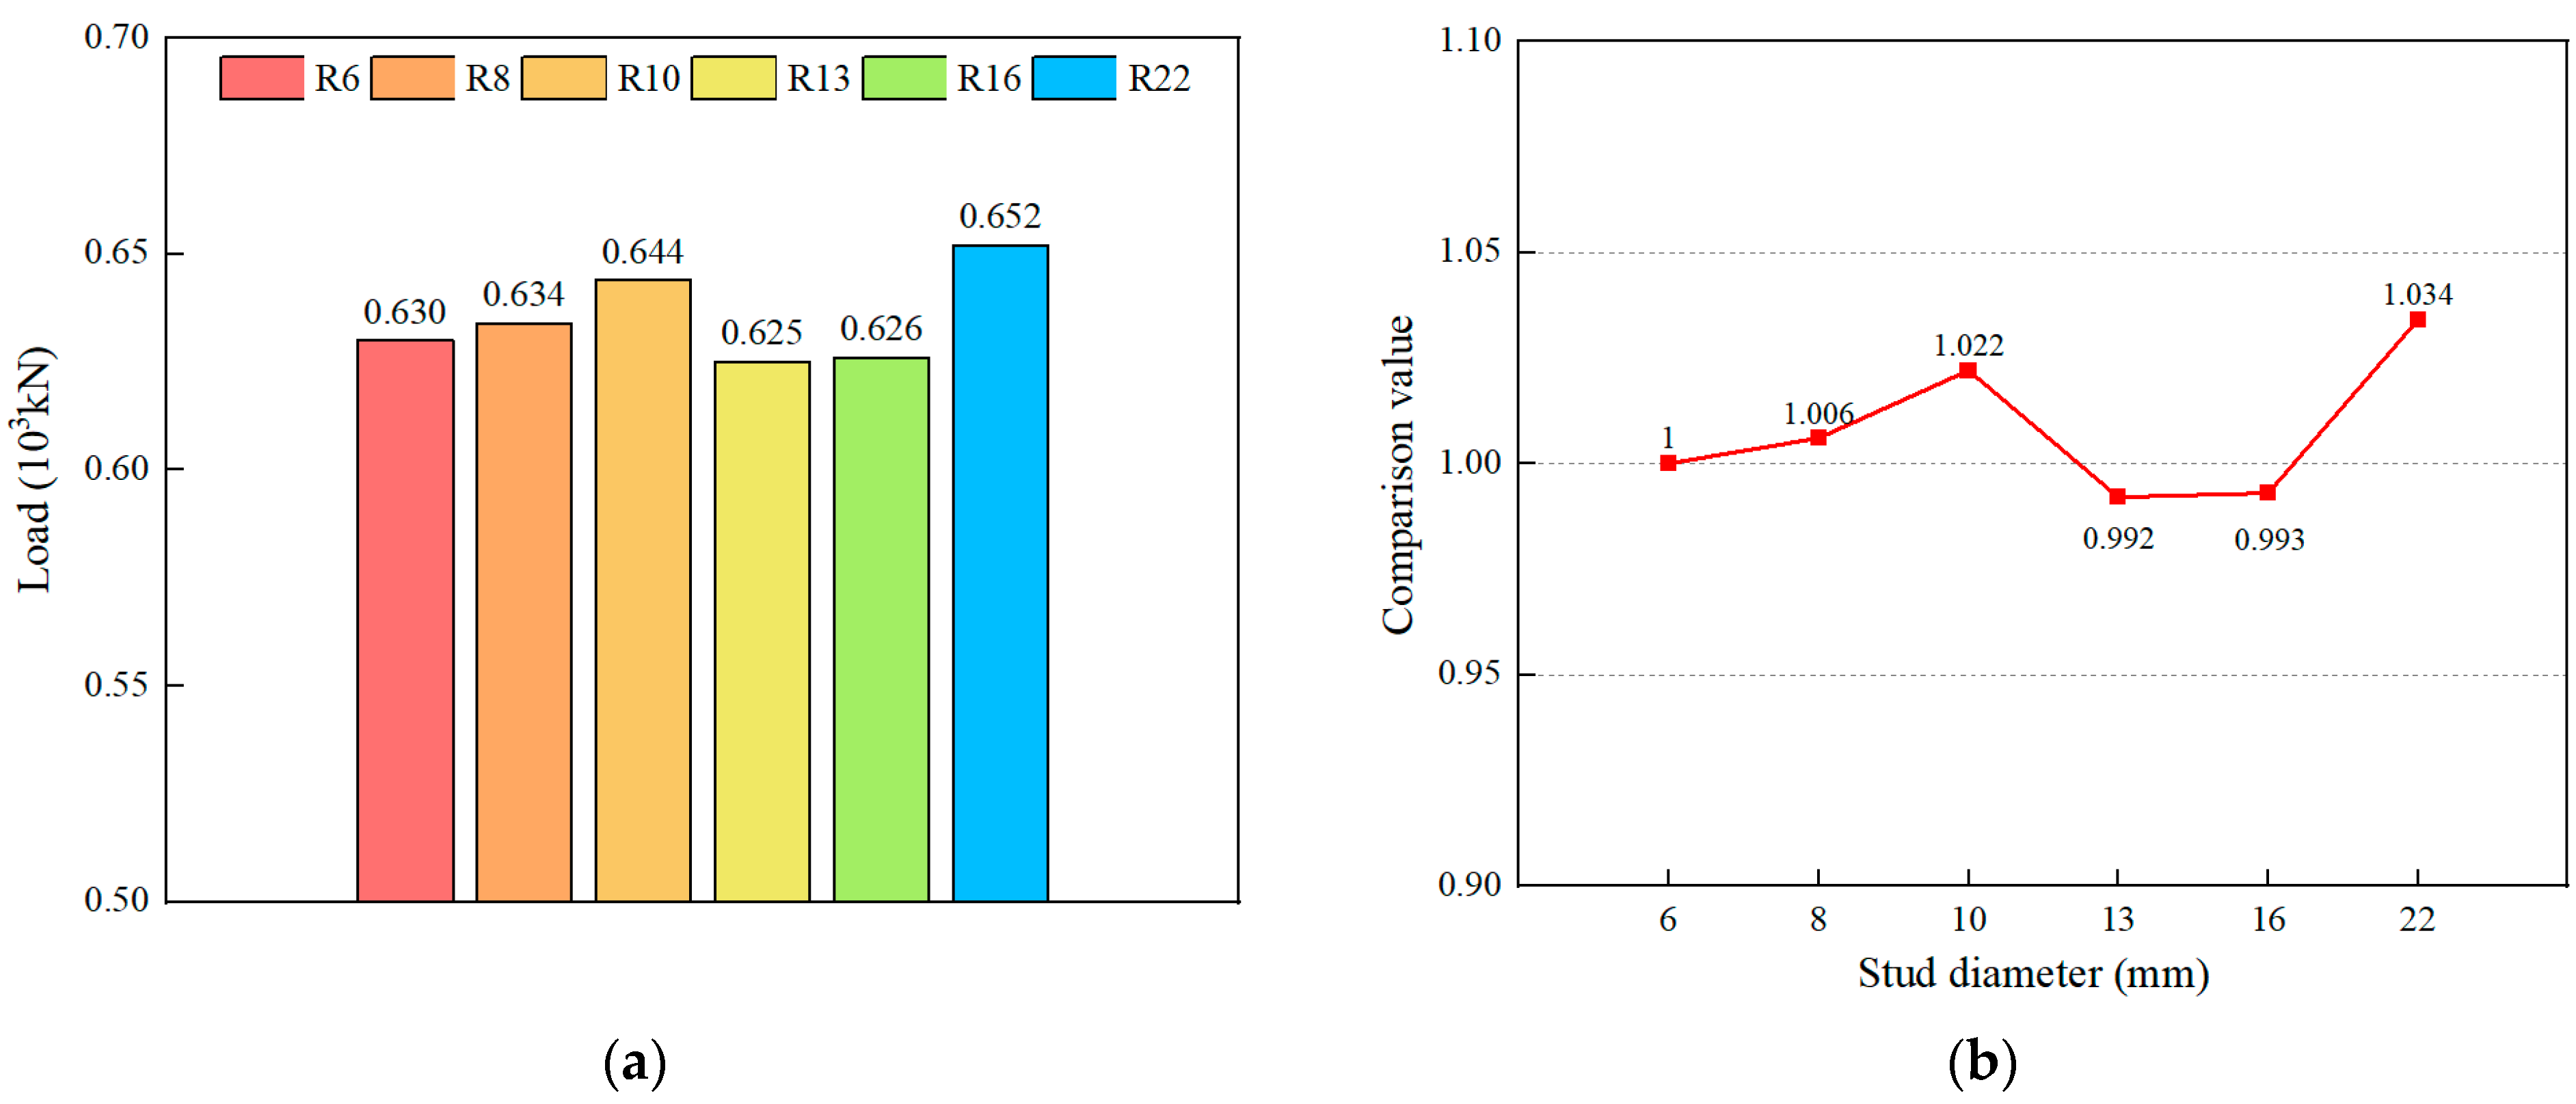
Figure 27 illustrates the influence of the stud diameter on the ultimate load-bearing capacity. As shown in Figure 17, the shear capacity variation remained within 4% with increasing stud diameter, exhibiting limited impact on the ultimate load-bearing capacity. In finite element simulations, as the stud diameter increases, the stress concentration phenomenon at the stud root is alleviated, which may be attributed to the enlarged weld area at the stud root.

6.2. Effect of the Stud Length

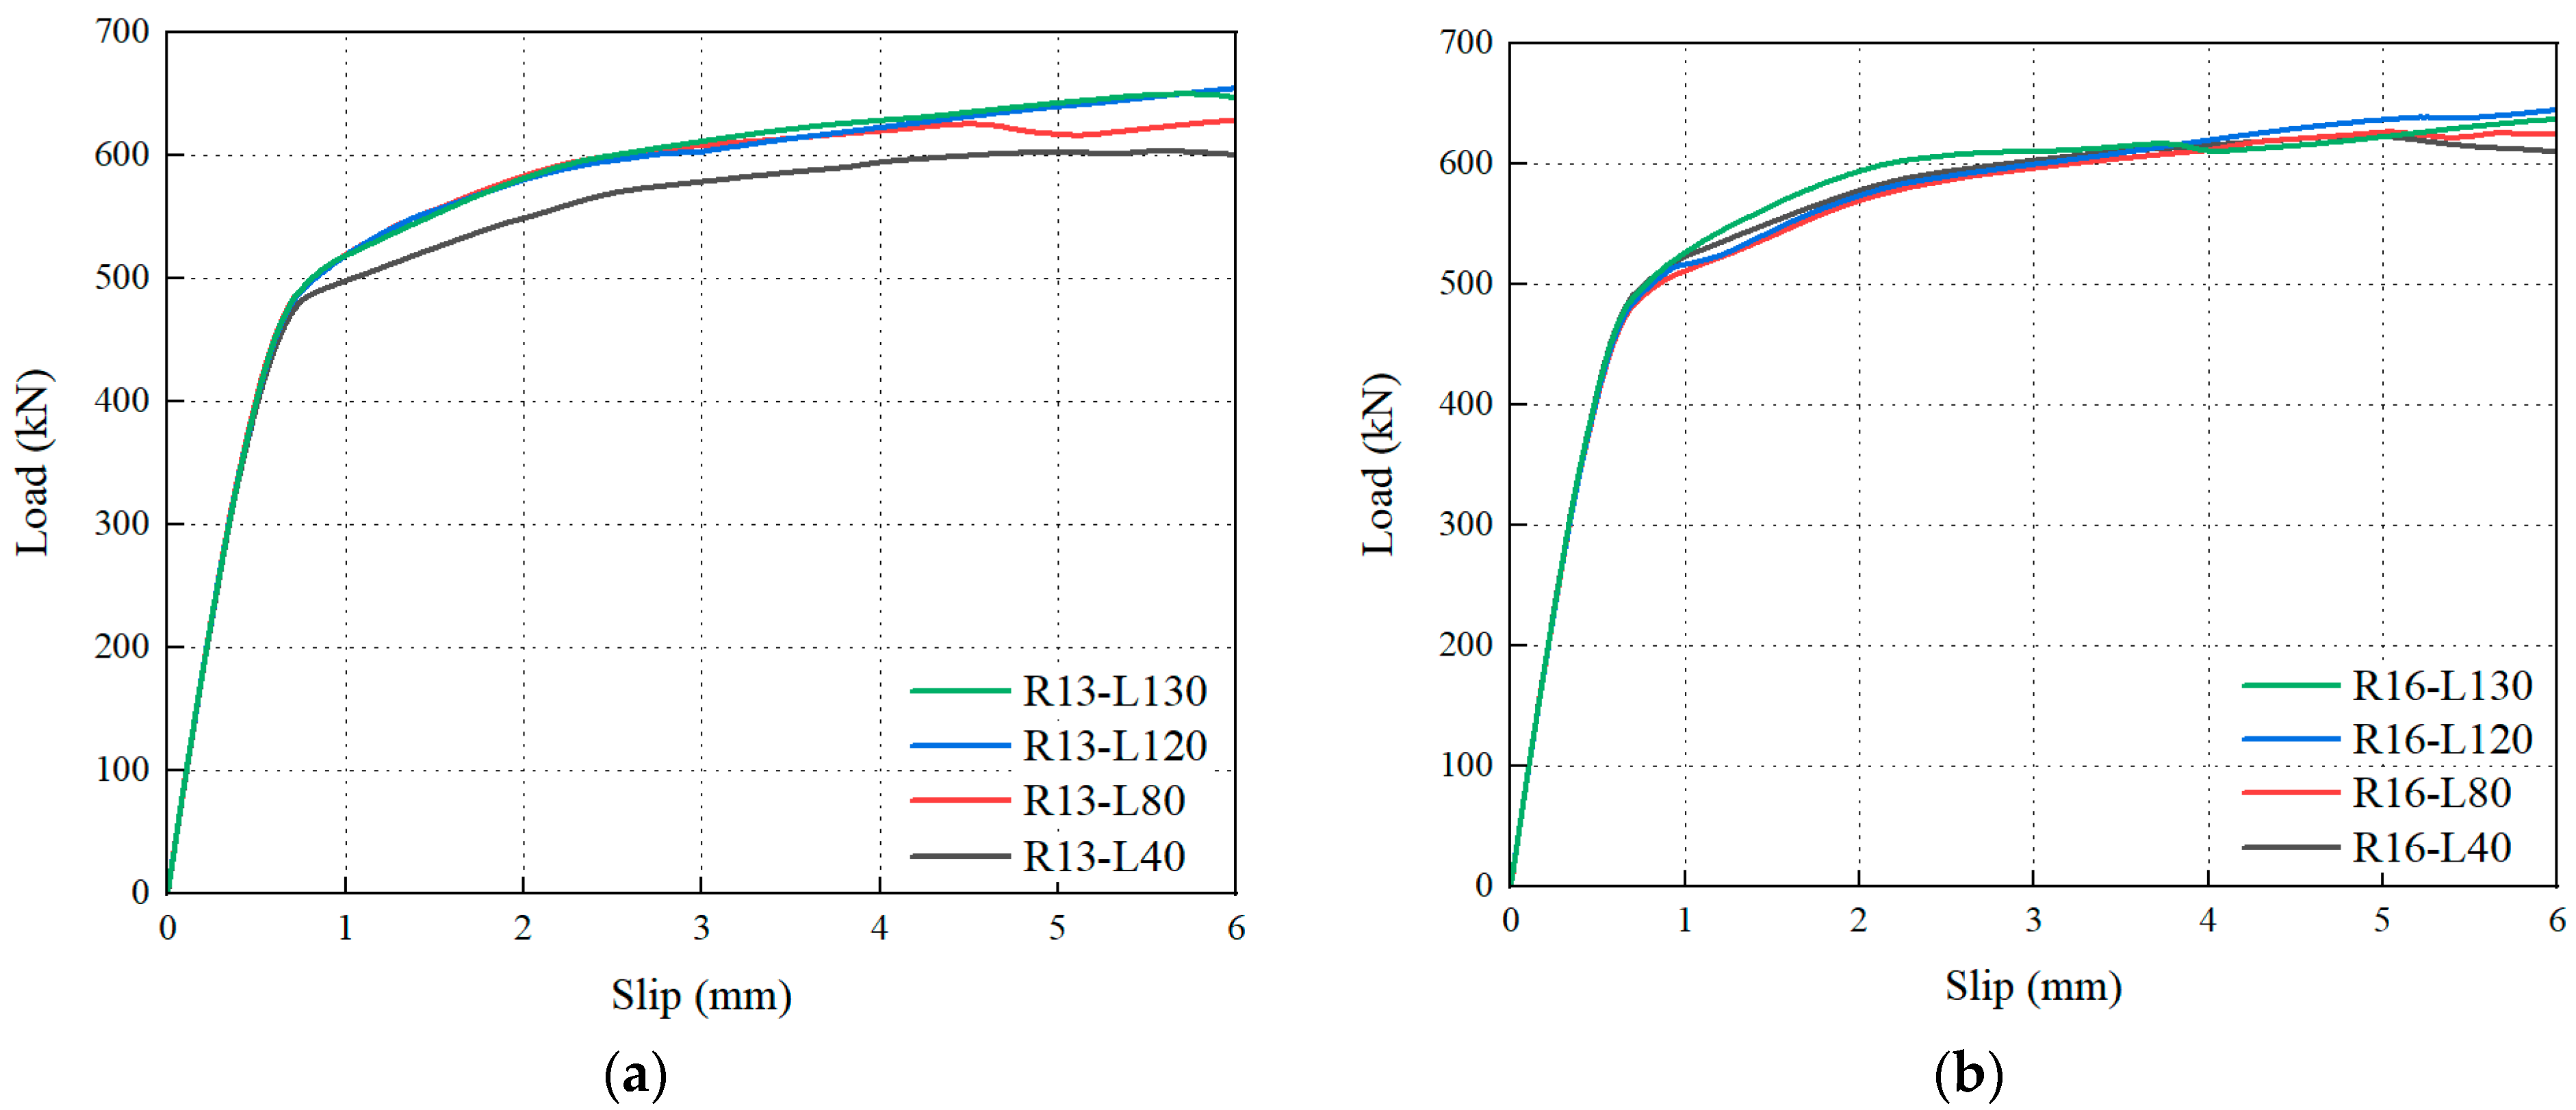
Parametric simulations investigated the influence of the stud length on hybrid connector’s shear performance by systematically evaluating four discrete stud length values of 40 mm, 80 mm, 120 mm, and 130 mm in combination with two nominal diameter configurations of 13 mm and 16 mm. The load–displacement curves of these models are presented in Figure 28.
For studs with a diameter of 13 mm, the initial stiffness was nearly identical across all four models during the elastic stage. With further slip displacement, the model with a 40 mm stud length first reached the yield strength, entering the plastic-hardening stage. When the stud length increased to 80 mm, the model exhibited a significantly enhanced yield strength and ultimate load-bearing capacity but experienced a moderate reduction in ductility. With a further increase in the stud length, the ultimate load-bearing capacity and ductility of the models were progressively enhanced. When the stud diameter was 16 mm, the initial stiffness and yield strength remained essentially consistent across all four models, and increased stud length exhibited minimal effects on the ultimate load-bearing capacity and ductility.
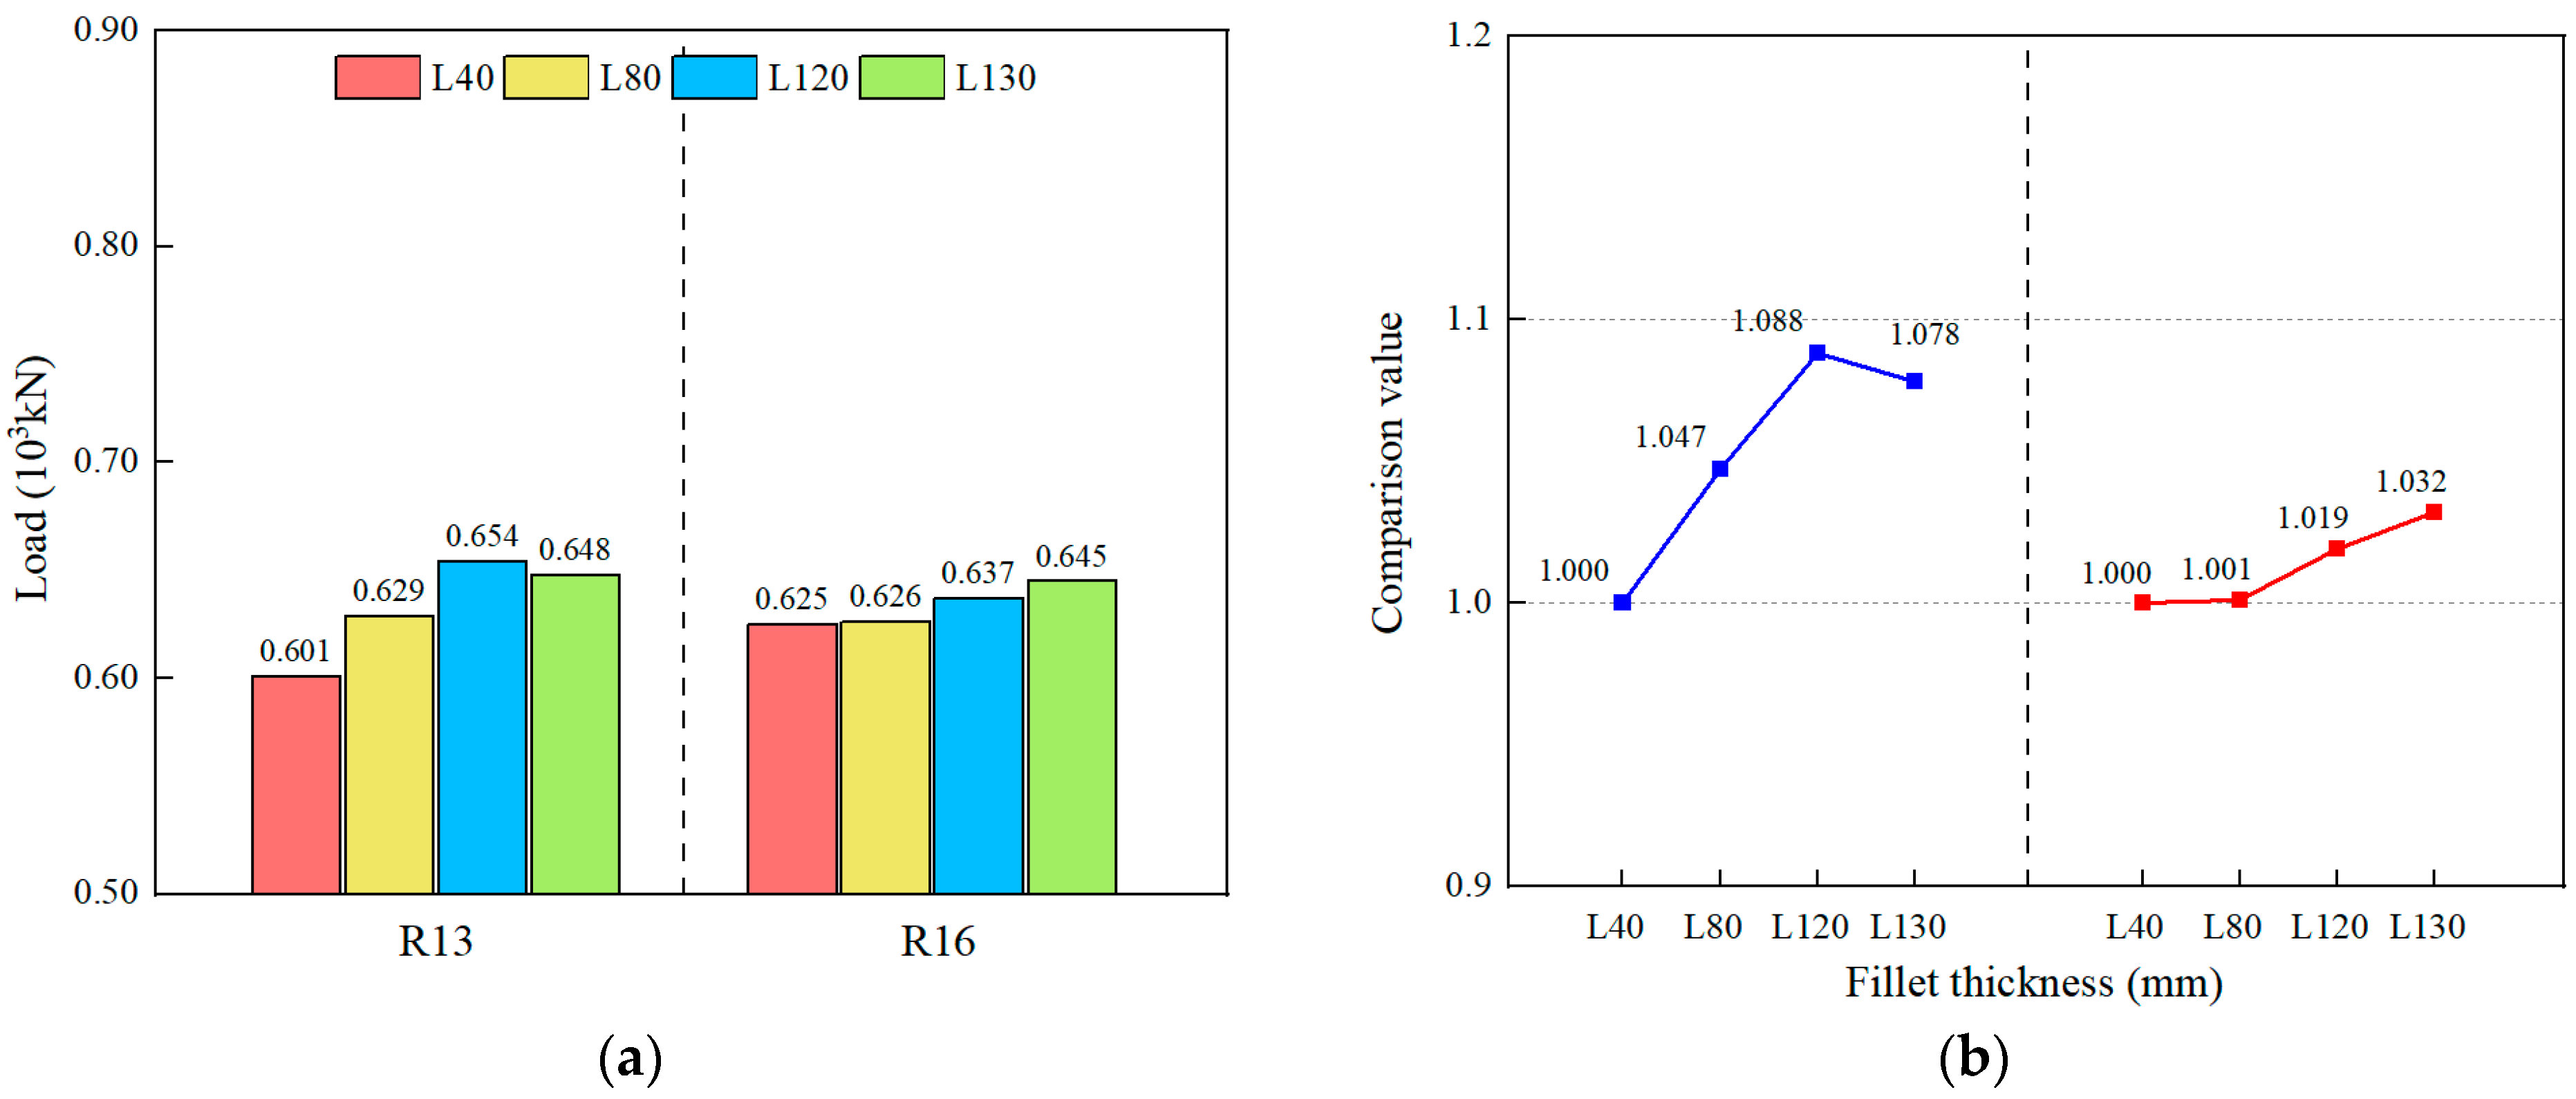
As depicted in Figure 29, under the 13 mm stud diameter condition, increasing the stud length from 40 mm to 80 mm, 120 mm, and 130 mm resulted in ultimate load-bearing capacity increases of 4.7%, 8.8%, and 7.8%, respectively. Under the 16 mm stud diameter condition, the ultimate load-bearing capacity increased by 0.1%, 1.9%, and 3.2%, respectively, with negligible effects (magnitude < 4%) on the structural performance. With increased stud length and diameter, the compressive load-bearing area of the concrete expanded, alleviating stress concentration and delaying concrete failure beneath the studs.

6.3. Effect of the Stud Welding Location

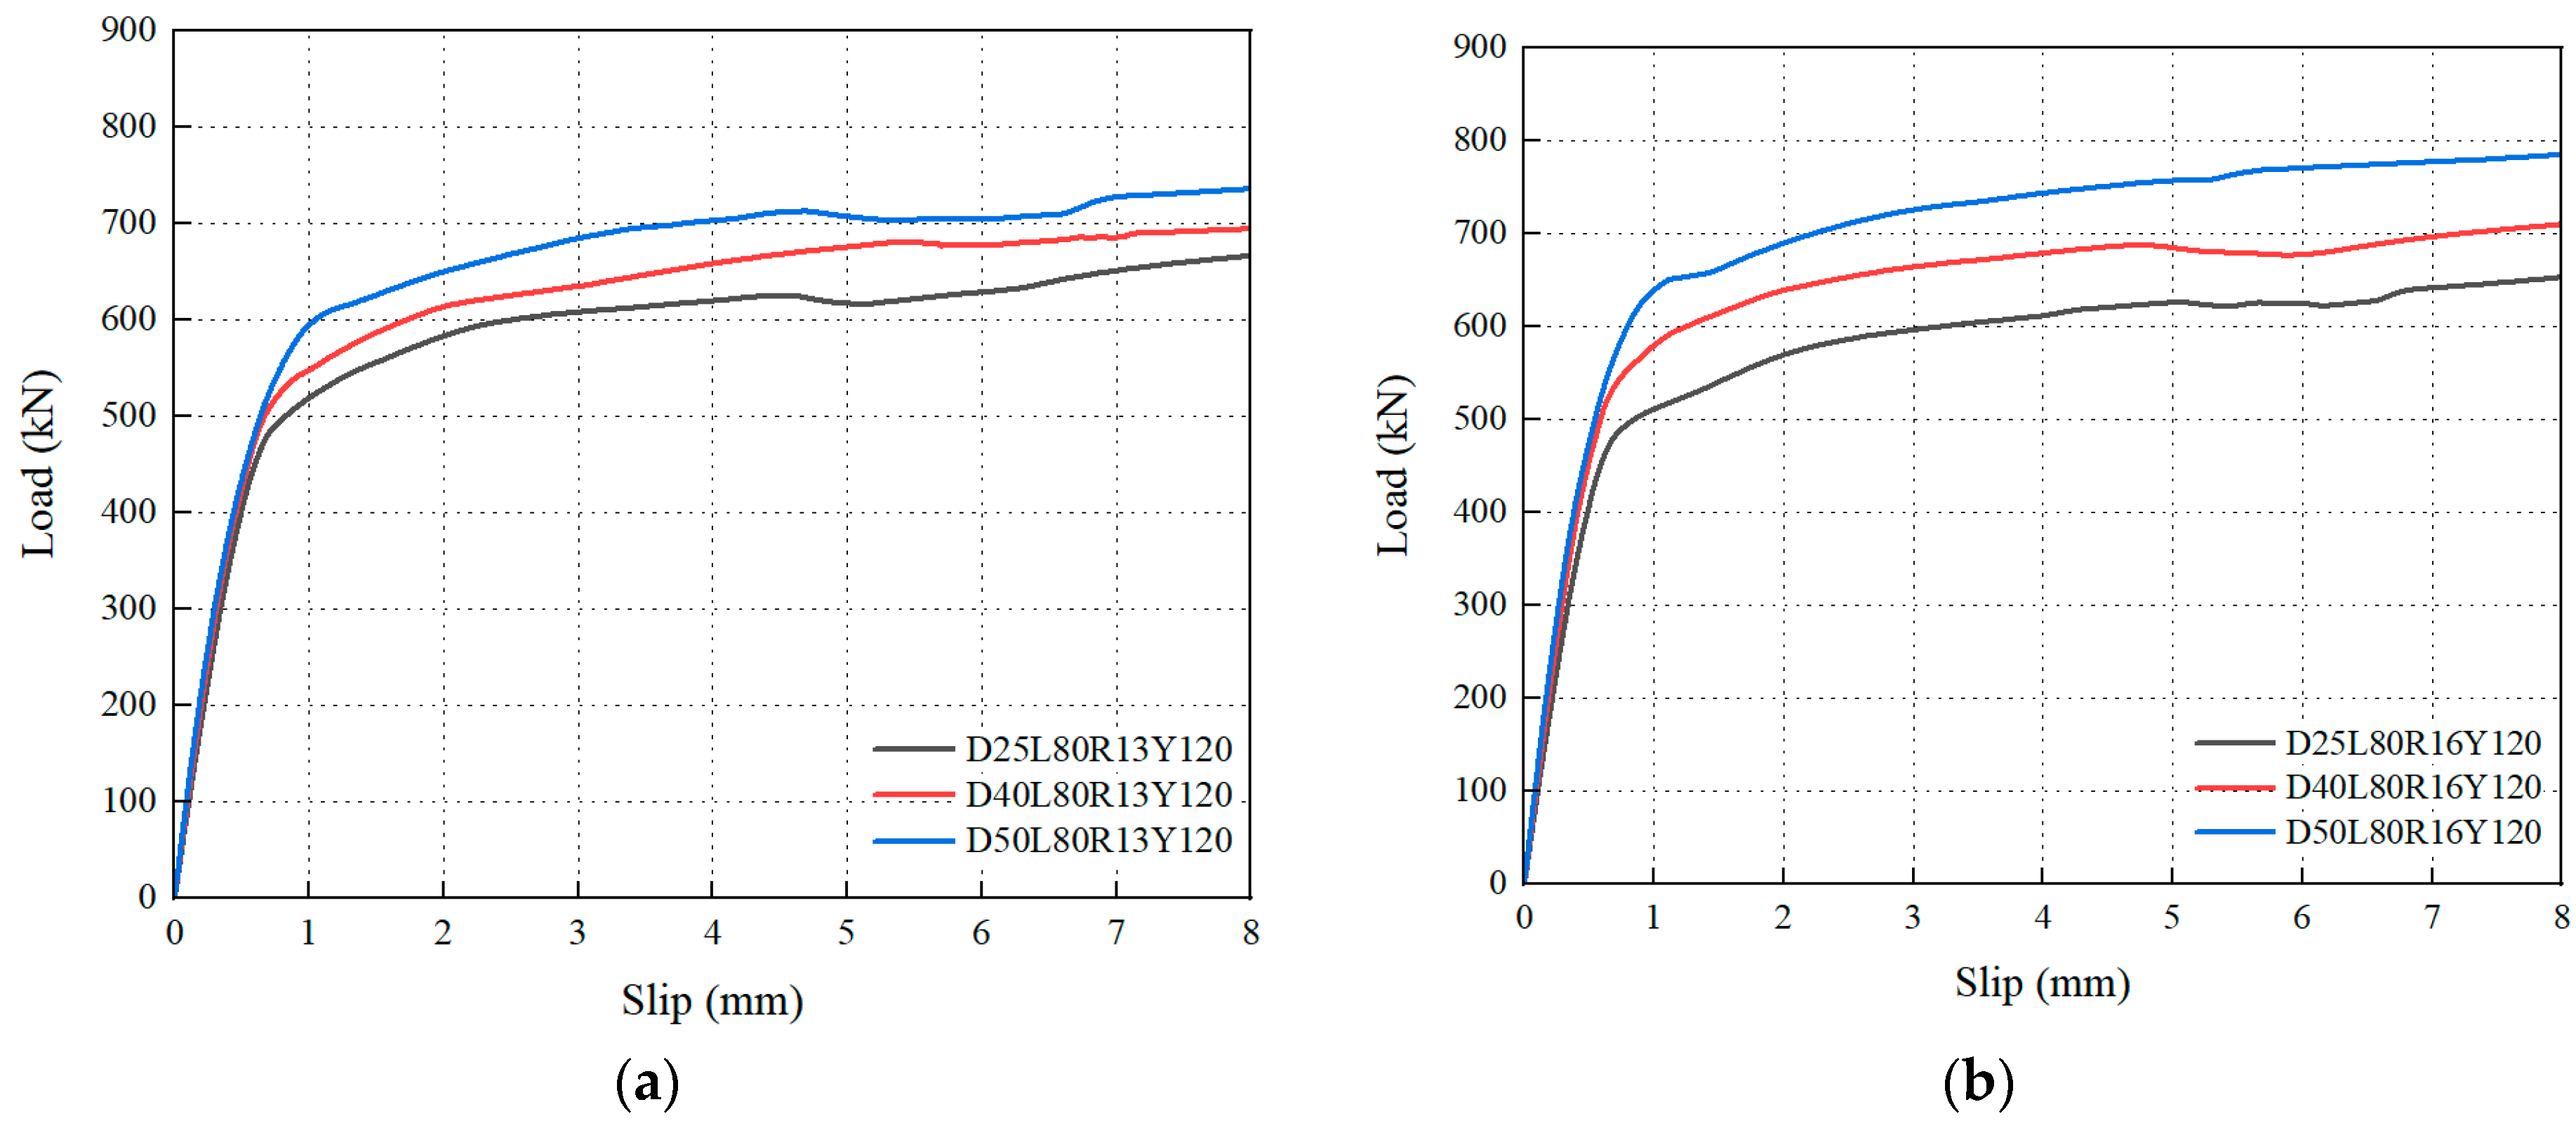
Parametric simulations investigated the influence of the welding location on the hybrid connector’s shear performance by systematically evaluating three distinct welding positions measured at offsets of 25 mm, 40 mm, and 50 mm from the steel dowel’s top surface in combination with two nominal diameter configurations of 13 mm and 16 mm. The load–displacement curves of these models are presented in Figure 30.
For studs with a diameter of thirteen millimeters, the initial stiffness across all three models during the elastic stage ranged from 1013 to 1077 kilonewtons per millimeter, exhibiting negligible variation with a maximum deviation of less than 6.3%. Following the elastic stage, the yield strength diverged significantly across the models; D50L80R13Y200, D40L80R13Y200, and D25L80R13Y200 exhibited yield strengths of 589 kN, 522 kN, and 474 kN, respectively.
For studs with a nominal diameter of sixteen millimeters, specimens D50L80R16Y200, D40L80R16Y200, and D25L80R16Y200 exhibited initial stiffness values of 1161 kilonewtons per millimeter, 1066 kilonewtons per millimeter, and 928 kilonewtons per millimeter, respectively. This phenomenon demonstrated significantly greater stiffness variation, with a coefficient of variation of 11.8%, whereas the thirteen-millimeter-diameter case showed substantially lower variation at 3.1%. The yield strengths of the three models were 638 kN, 530 kN, and 478 kN, respectively. For welding positions D25 and D40, the yield strengths remained virtually identical under both 13 mm and 16 mm stud diameters. At the D50 position, the yield strength increased by 8.3% with a diameter enlargement from 13 mm to 16 mm.
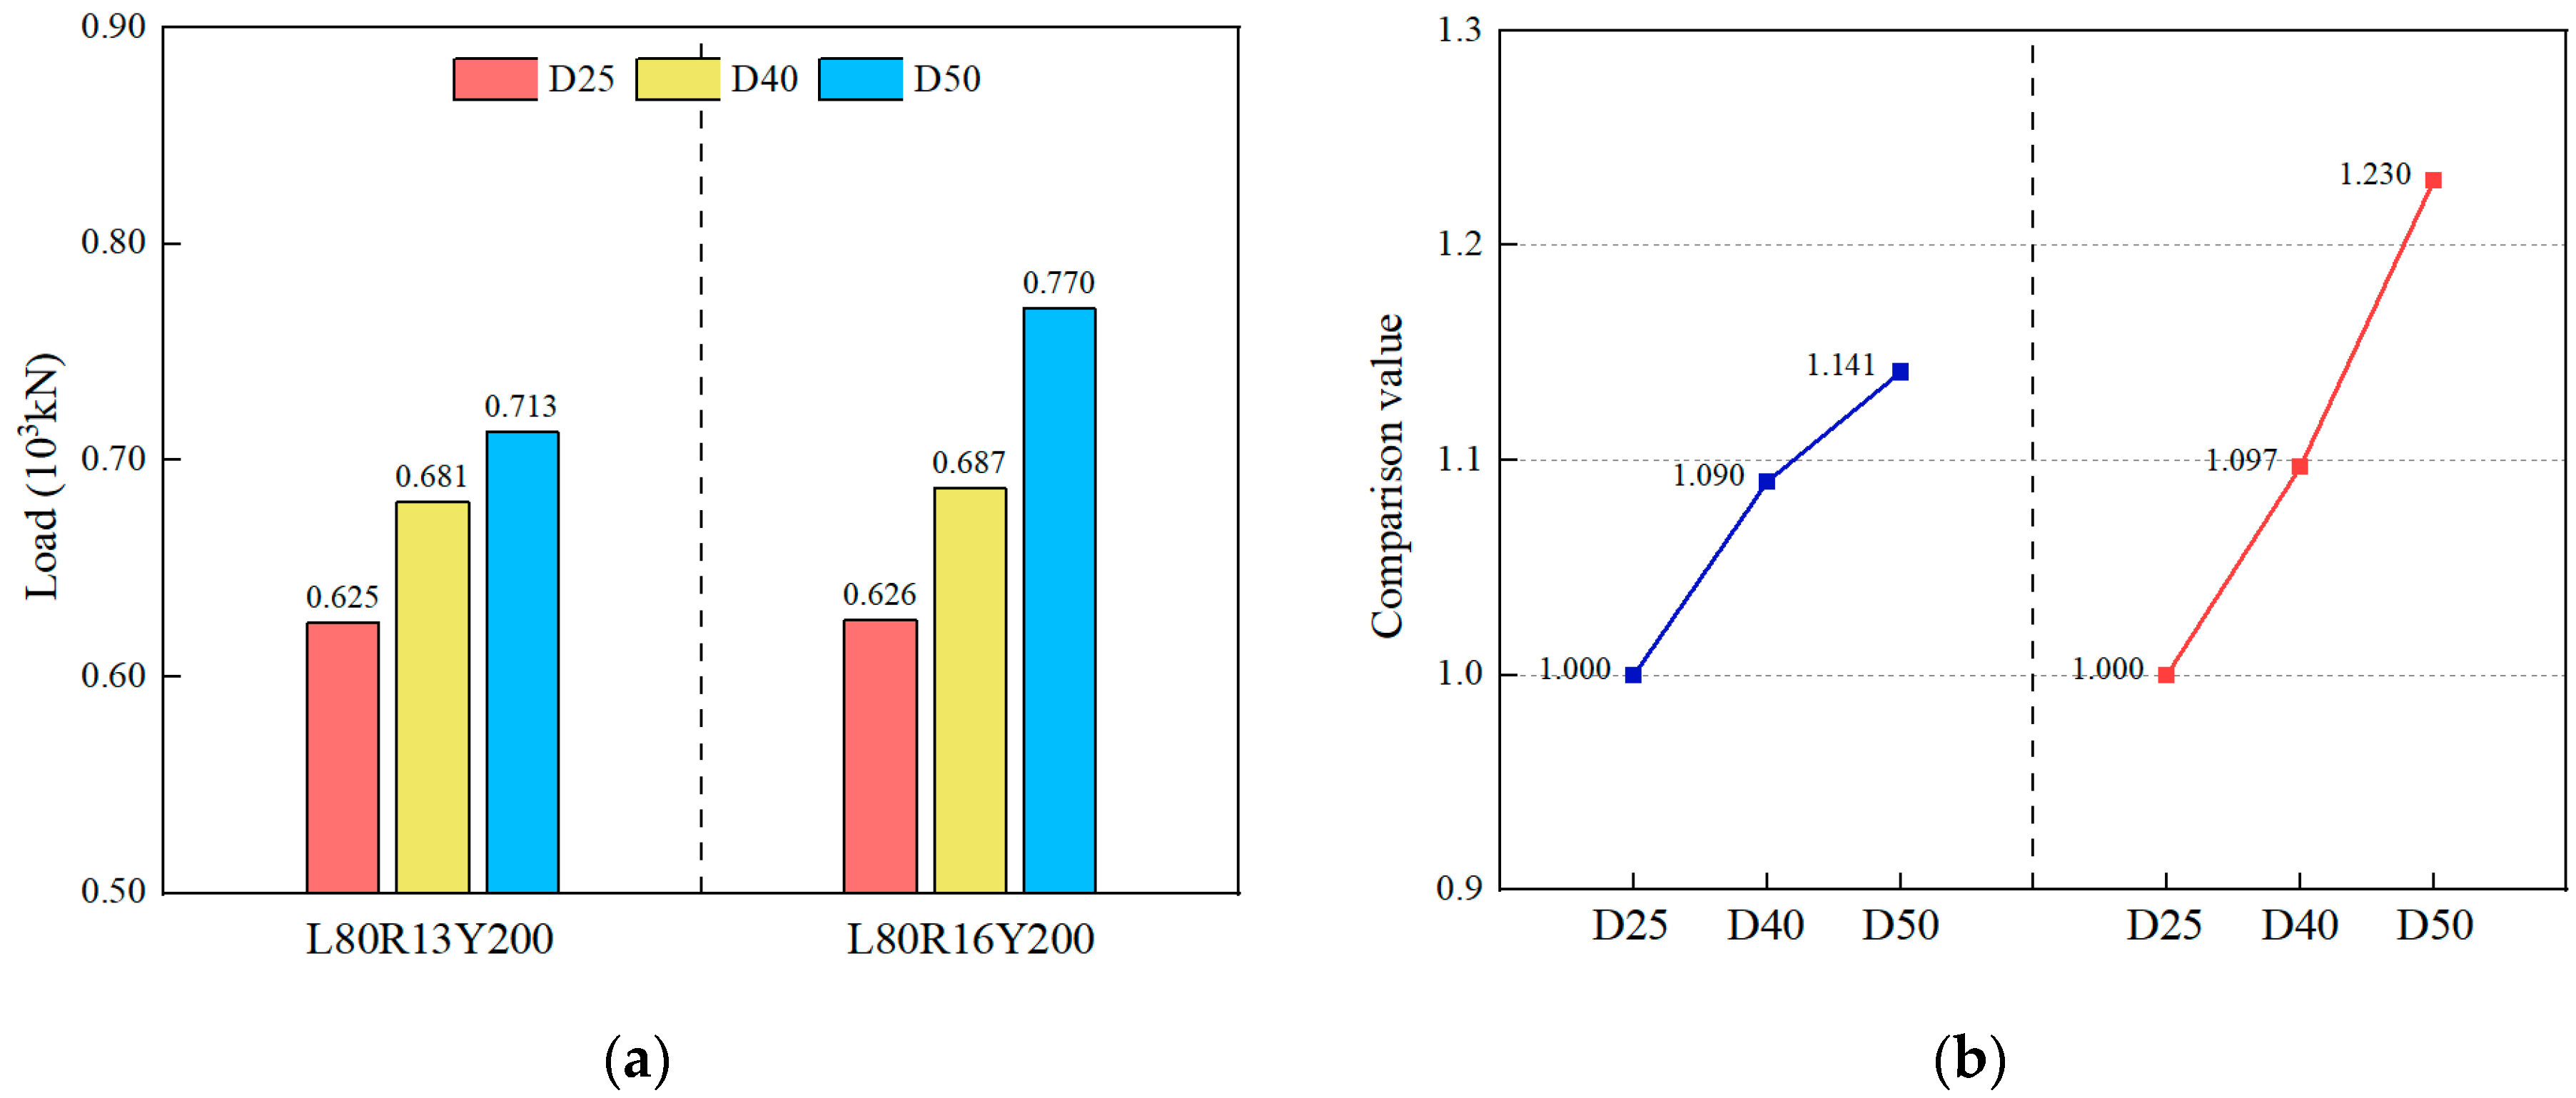
As shown in Figure 31, under the 13 mm stud diameter condition, shifting the welding location downward from D25 to D40 and D50 positions resulted in ultimate load-bearing capacity increases of 9.0% and 14.1%, respectively. Under the 16 mm stud diameter condition, shifting the welding location downward from D25 to D40 and D50 positions resulted in shear capacity increases of 9.7% and 23.0%, respectively, demonstrating enhanced sensitivity to the welding position at larger diameters. This demonstrates that the welding location significantly influences the ultimate load-bearing capacity of shear connectors. When welded at the dowel center (D25), both the steel dowel and stud jointly resisted uplift forces, resulting in plastic shear failure at the dowel root, while the stud’s shear capacity was not fully utilized. As welding shifted toward the web direction, the load-transfer path shortened, concentrating uplift resistance on the steel dowelsand enabling full mobilization of the stud’s shear capacity.

7. Conclusions

This paper proposed a novel dowel–stud hybrid connector fabricated from HPC and HSS. Its mechanical properties and failure modes were analyzed through push-out tests and finite element modeling. Parametric analysis quantified the influences of the stud diameter, welding position, and stud length on the shear capacity, initial stiffness, and ductility.
(1)
Compared to conventional stud connectors and steel dowel connectors, the dowel–stud hybrid connector possessed a higher shear capacity and ductility. The primary failure modes consisted of plastic failure at the roots of both the steel dowel and stud, accompanied by localized crushing of concrete in the lower region.
(2)
When the stud diameter increased from 6 mm to 22 mm, the variation in the shear capacity remained within 4%, indicating negligible effects on both the shear capacity and stiffness of the hybrid connectors. However, due to differences in the weld area at the stud root, caused by varying diameters, push-out tests revealed that shear failure occurred at the stud root with a diameter of 13 mm, while the failure mode transitioned to shear fracture at the steel dowel root with a diameter of 16 mm. It is recommended that the optimal value for the stud diameter be 16 mm.
(3)
For 13 mm studs, the ultimate load-bearing capacity increased with increasing stud length, reaching a maximum 8.8% enhancement at a 120 mm length. Under 16 mm diameter conditions, increased stud length exerted negligible influence on the ultimate capacity. Elongated studs intensified stress concentration in the concrete beneath studs, delaying the onset of localized concrete failure. It is recommended that the optimal value for the stud length be 80 mm.
(4)
The welding location significantly affected the shear capacity, with the shear capacity increasing by up to 23% when welding shifted from the dowel center (D25) to the root underside (D50). Relocating welds toward the web direction shortened load-transfer paths, concentrating uplift resistance on the steel dowel and enabling full mobilization of the stud’s shear capacity, thereby enhancing the overall connector performance. It is recommended that the optimal welding position for the studs be 50 mm below the top of the dowel.

Author Contributions

Conceptualization, B.C. and J.C.; methodology, B.C. and J.C.; validation, B.C., Y.G. and M.Z.; formal analysis, J.C.; investigation, B.C., J.C., Z.L. and Y.G.; resources, J.C.; data curation, B.C. and Y.G.; writing—original draft preparation, B.C.; writing—review and editing, B.C. and J.C.; visualization, B.C.; supervision, Z.L.; project administration, J.C.; funding acquisition, J.C. All authors have read and agreed to the published version of the manuscript.

Funding

The research team thanks the Natural Science Foundation of Hunan Province—Enterprise Joint Fund, Project Title: Research on the Topology Optimization of Prefabricated Bridge Structures (Grant No.: 2024JJ9067).

Data Availability Statement

The raw data supporting the conclusions of this article will be made available by the authors on request.

Conflicts of Interest

Author Zhang Li was employed by the company China Construction Fifth Engineering Division Corp., Ltd. The remaining authors declare that the research was conducted in the absence of any commercial or financial relationships that could be construed as a potential conflict of interest.

References

  1. Classen, M.; Herbrand, M.; Kueres, D.; Hegger, J. Derivation of design rules for innovative shear connectors in steel-concrete composites through the systematic use of non-linear finite element analysis (FEA). Struct. Concr. 2016, 17, 646–655. [Google Scholar] [CrossRef]
  2. El-Zohairy, A.; Salim, H.; Shaaban, H. Experimental investigation on fatigue behavior of composite beams with different studs arrangements. Structures 2022, 35, 146–159. [Google Scholar] [CrossRef]
  3. Lorenc, W.; Kurz, W.; Seidl, G. Hybrid steel–concrete sections for bridges: Definition and basis for design. Eng. Struct. 2022, 270, 114902. [Google Scholar] [CrossRef]
  4. Venkateshwaran, A.; Binglin, L.; Liew, J.Y.R. Design of Steel Fiber-Reinforced High-Strength Concrete-Encased Steel Short Columns and Beams. ACI Struct. J. 2021, 118, 45–59. [Google Scholar] [CrossRef]
  5. Lai, B.; Liew, J.Y.R. Design and testing of concrete encased steel composite beam-columns with C90 concrete and S690 steel section. Eng. Struct. 2020, 220, 110995. [Google Scholar] [CrossRef]
  6. Ban, H.; Bradford, M.A. Flexural behaviour of composite beams with high strength steel. Eng. Struct. 2013, 56, 1130–1141. [Google Scholar] [CrossRef]
  7. Shamass, R.; Cashell, K. Behaviour of composite beams made using high strength steel. Structures 2017, 12, 88–101. [Google Scholar] [CrossRef]
  8. Zhang, Y.; Cai, S.; Zhu, Y.; Fan, L.; Shao, X. Flexural responses of steel-UHPC composite beams under hogging moment. Eng. Struct. 2020, 206, 110134. [Google Scholar] [CrossRef]
  9. Tong, L.; Chen, L.; Wang, X.; Zhu, J.; Shao, X.; Zhao, Z. Experiment and finite element analysis of bending behavior of high strength steel-UHPC composite beams. Eng. Struct. 2022, 266, 114594. [Google Scholar] [CrossRef]
  10. Zou, Y.; Di, J.; Zhou, J.; Zhang, Z.; Li, X.; Zhang, H.; Qin, F. Shear behavior of perfobond connectors in the steel-concrete joints of hybrid bridges. J. Constr. Steel Res. 2020, 172, 106217. [Google Scholar] [CrossRef]
  11. Johnson, R.P. Composite Structures of Steel and Concrete: Beams, Slabs, Columns and Frames for Buildings; John Wiley & Sons: Hoboken, NJ, USA, 2018. [Google Scholar]
  12. Girhammar, U.A.; Gopu, V.K.A. Composite beam-columns with interlayer slip—Exact analysis. J. Struct. Eng. 1993, 119, 1265–1282. [Google Scholar] [CrossRef]
  13. Lorenc, W.; Kożuch, M.; Rowiński, S. The behaviour of puzzle-shaped composite dowels—Part I: Experimental study. J. Constr. Steel Res. 2014, 101, 482–499. [Google Scholar] [CrossRef]
  14. Suzuki, A.; Suzuki, K.; Kimura, Y. Ultimate shear strength of perfobond shear connectors subjected to fully reversed cyclic loading. Eng. Struct. 2021, 248, 113240. [Google Scholar] [CrossRef]
  15. Wang, B.; Huang, Q.; Liu, X. Comparison of static and fatigue behaviors between stud and perfobond shear connectors. KSCE J. Civ. Eng. 2019, 23, 217–227. [Google Scholar] [CrossRef]
  16. Zhan, Y.; Yin, C.; Liu, F.; Song, R.; Deng, K.; Sun, J. Pushout tests on headed studs and PBL shear connectors considering external pressure. J. Bridg. Eng. 2020, 25, 04019125. [Google Scholar] [CrossRef]
  17. Chen, Y.; Ning, J.; Ren, C.; Yang, Y. A strength degradation model of PBL shear connectors under fatigue load. Structures 2023, 48, 1684–1692. [Google Scholar] [CrossRef]
  18. Liu, Y.; Xiao, L.; Wei, X.; Liao, X.; Wang, S. Investigation on fatigue performance and life prediction of PBL connectors in steel-UHPC composite structure. Eng. Struct. 2025, 329, 119762. [Google Scholar] [CrossRef]
  19. Lin, T. Research on Structural Performance of New Composite Beams with Toothed Shear Connectors. Master’s Thesis, Tongji University, Shanghai, China, 2020. [Google Scholar]
  20. Lorenc, W.; Seidl, G.; Berthellemy, J. The evolution of the shape of composite dowels. Stud. Geotech. Mech. 2022, 44, 296–316. [Google Scholar] [CrossRef]
  21. Huang, P.; He, J.; Kong, F.; Mei, K.; Li, X. Experimental study on the bearing capacity of PZ shape composite dowel shear connectors with elliptical holes. Sci. Rep. 2022, 12, 2457. [Google Scholar] [CrossRef]
  22. Cheng, Z.; Zhang, Q.; Bao, Y.; Deng, P.; Wei, C.; Li, M. Flexural behavior of corrugated steel-UHPC composite bridge decks. Eng. Struct. 2021, 246, 113066. [Google Scholar] [CrossRef]
  23. Harsanyi, P.; Randl, N.; Tue, N.V. DIC-based failure analysis of high-strength continuous steel shear dowels for composite UHPFRC steel construction. Eng. Struct. 2021, 247, 113093. [Google Scholar] [CrossRef]
  24. Altoé, J.V.F.; Faria, C.S.d.; Petrauski, M.C.; Pereira, C.L.; Paes, J.L.R.; Veríssimo, G.d.S. Composite dowels shear connectors for steel-concrete composite beams: A review. Rev. IBRACON Estrut. Mater. 2025, 18, e18204. [Google Scholar] [CrossRef]
  25. Silveira, E.G.d.; Caldas, R.B.; Santos, L.R. Steel failure mode of composite dowel shear connector with rectangular regular cutoff. Rev. IBRACON Estrut. Mater. 2023, 17, e17310. [Google Scholar] [CrossRef]
  26. Suzuki, A.; Hiraga, K.; Kimura, Y. Mechanical performance of puzzle-shaped shear connectors subjected to fully reversed cyclic stress. J. Struct. Eng. 2023, 149, 04023087. [Google Scholar] [CrossRef]
  27. Classen, M.; Hegger, J. Shear-slip behaviour and ductility of composite dowel connectors with pry-out failure. Eng. Struct. 2017, 150, 428–437. [Google Scholar] [CrossRef]
  28. Almeida, R.L.J.d.; Veríssimo, G.d.S.; Ribeiro, J.C.L.; Paes, J.L.R.; Caldas, R.B.; Cardoso, H.d.S.; Fakury, R.H. Assessing the bearing capacity of Crestbond shear connectors to concrete pry-out. Rev. IBRACON Estrut. Mater. 2023, 16, e16107. [Google Scholar] [CrossRef]
  29. Christou, G.; Wolters, K.; Ungermann, J.; Classen, M.; Hegger, J. Combined shear-tension loading of composite dowels in cracked concrete—Experimental investigations and design. Appl. Sci. 2022, 12, 1449. [Google Scholar] [CrossRef]
  30. Kopp, M.; Wolters, K.; Claßen, M.; Hegger, J.; Gündel, M.; Gallwoszus, J.; Heinemeyer, S.; Feldmann, M. Composite dowels as shear connectors for composite beams–Background to the design concept for static loading. J. Constr. Steel Res. 2018, 147, 488–503. [Google Scholar] [CrossRef]
  31. GB/T 228.1-2021; Metallic materials—Tensile Testing—Part 1: Method of Test at Room Temperature. China Standard Press: Beijing, China, 2021.
  32. GB/T 50152-2012; Test Methods of Concrete Structures. China Standard Press: Beijing, China, 2012.
  33. GB/T 50107-2010; Evaluation of Concrete Compressive Strength. China Standard Press: Beijing, China, 2010.
  34. GB/T 1591-2018; High strength low alloy structural steels. China Standard Press: Beijing, China, 2018.
  35. Yang, J.; Fang, Z. Research on stress-strain relation of ultra high performance concrete. Concrete 2008, 7, 11–15. [Google Scholar]
  36. Du, R. Study on the Ultimate Bearing Capacity of Reactive Powder Concrete Beams and Arches. Master’s Thesis, Fuzhou University, Fuzhou, China, 2014. [Google Scholar]
  37. Ma, Y.; Zhang, B.; Peng, A.; Wang, L. Experimental and analytical investigation on shear mechanism of steel-UHPC composite T-Perfobond shear connectors. Eng. Struct. 2023, 286, 116061. [Google Scholar] [CrossRef]
Figure 1. Dowel–stud hybrid shear connectors.
Buildings 15 03748 g001
Figure 2. The research flowchart of the study.
Buildings 15 03748 g002
Figure 3. Cross-section of combined beams: (a) traditional steel–concrete beam; (b) HSS–HPC beam; (c) HSS–HPC beam with dowel–stud hybrid connectors.
Buildings 15 03748 g003
Figure 4. Dowel–stud hybrid connector specimen. (a) Schematic diagram of specimens; (b) top view of specimen dimensions (unit: mm); (c) front view of specimen dimensions (unit: mm).
Buildings 15 03748 g004
Figure 5. Specimen fabrication process. (a) Cutting steel plates; (b) welding steel plates and studs; (c) attaching strain gauges; (d) fabricating formwork and pouring concrete; (e) steam curing; (f) applying putty powder.
Buildings 15 03748 g005
Figure 6. Strain gauge instrumentation layout on steel dowels and shear studs.
Buildings 15 03748 g006
Figure 7. Location of displacement transducers.
Buildings 15 03748 g007
Figure 8. Test-loading system.
Buildings 15 03748 g008
Figure 9. Failure mode of CTTC-R16.
Buildings 15 03748 g009
Figure 10. Failure mode of specimen D0L0R0Y200.
Buildings 15 03748 g010
Figure 11. Failure mode of specimen D25L80R16Y200.
Buildings 15 03748 g011
Figure 12. Failure mode of specimen D25L80R13Y200.
Buildings 15 03748 g012
Figure 13. Failure mode of specimen D25L40R13Y120.
Buildings 15 03748 g013
Figure 14. Failure mode of specimen D40L40R13Y120.
Buildings 15 03748 g014
Figure 15. Load-slip curves of specimens.
Buildings 15 03748 g015
Figure 16. Load–strain curves of specimens with varied parameters. (a) Different stud diameters; (b) different stud lengths; (c) different stud welding positions.
Buildings 15 03748 g016
Figure 17. Load–strain curves of specimens. (a) North side of D0L0R0Y200; (b) south side of D0L0R0Y200; (c) north side of D25L80R16Y200; (d) south side of D25L80R16Y200; (e) north side of D25L80R13Y200; (f) south side of D25L80R13Y200; (g) north side of D25L40R13Y120; (h) south side of D25L40R13Y120; (i) north side of D40L40R13Y120; (j) south side of D40L40R13Y120.
Buildings 15 03748 g017aBuildings 15 03748 g017b
Figure 18. FEA model of the push-out specimen.
Buildings 15 03748 g018
Figure 19. Constitutive curves of HPC under compression and tension.
Buildings 15 03748 g019
Figure 20. Load-slip curves for different mesh sizes.
Buildings 15 03748 g020
Figure 21. Load-slip comparison diagram of finite element simulation and test results. (a) D25L40R13Y120; (b) D25L80R13Y200; (c) D25L80R16Y200; (d) D40L40R13Y120.
Buildings 15 03748 g021
Figure 22. Comparison of test and simulated damage patterns of specimen D25L40R13Y120. (a) Damage pattern comparison at dowel zones; (b) damage pattern comparison at stud zones; (c) damage pattern comparison at the concrete fillet.
Buildings 15 03748 g022
Figure 23. Failure progression near a steel dowel.
Buildings 15 03748 g023
Figure 24. Failure progression near a steel stud.
Buildings 15 03748 g024
Figure 25. Failure progression of the HPC. (a) Compressive damage variable in the concrete beneath the steel dowel and stud; (b) tensile damage variable at the concrete fillet.
Buildings 15 03748 g025
Figure 26. Load-slip curves of FEMs with varying stud diameters.
Buildings 15 03748 g026
Figure 27. The effect of the stud diameter on the shear capacity. (a) Ultimate load-bearing capacity; (b) ultimate load-bearing capacity ratio.
Buildings 15 03748 g027
Figure 28. Load-slip curves of FEMs with varying stud lengths. (a) Specimens with a stud diameter of 13 mm; (b) specimens with a stud diameter of 16 mm.
Buildings 15 03748 g028
Figure 29. The effect of the stud length on the shear capacity. (a) Ultimate load-bearing capacity; (b) ultimate load-bearing capacity ratio (Blue line: 13 mm diameter; Red line: 16 mm diameter).
Buildings 15 03748 g029
Figure 30. Load-slip curves of FEMs with different stud welding locations. (a) Specimens with a stud diameter of 13 mm; (b) specimens with a stud diameter of 16 mm.
Buildings 15 03748 g030
Figure 31. The effect of the welding location on the shear capacity. (a) Ultimate load-bearing capacity; (b) ultimate load-bearing capacity ratio (Blue line: 13 mm diameter; Red line: 16 mm diameter).
Buildings 15 03748 g031
Table 1. Design parameters of push-out test specimens.
Specimen NumberD (mm)L (mm)R (mm)Y (mm)
CTTC-R1616
D0L0R0Y200200
D25L80R16Y200258016200
D25L80R13Y200258013200
D25L40R13Y120254013120
D40L40R13Y120404013120
Table 2. Mechanical properties of HPC.
Specimen NumberUltimate Load (kN)fcu,o (MPa)fcu,k (MPa)
19479590
299810095
39769893
Average9739792
Table 3. Mechanical properties of steel.
Steel GradeSteel Thickness (mm)Yield Strength, fy (MPa)Tensile Strength, ft (MPa)ft/fyElongation (%)
Q34510421.7555.31.3228.5
Q62010668.6799.21.2023.5
Q6206638.1805.31.2621.5
Table 4. Static mechanical properties of specimens.
Specimen NumberPu (kN)Du (mm)Fy (kN)Dy (mm)K0 (kN/mm)η
CTTC-R164833.084180.5315655.81
D0L0R0Y2004722.004180.5515303.64
D25L80R16Y2006146.734870.61160111.03
D25L80R13Y2006017.304970.69144310.58
D25L40R13Y1205485.153910.5414559.54
D40L40R13Y1206584.975290.5419809.20
Table 5. Comparison of load-bearing capacities from tests and FEM simulations.
Specimen NumberTest Results (kN)FEA Model Results (kN)Ratio of Tested Value to Predicted Value
D25L40R13Y1205486031.10
D25L80R13Y2006016251.04
D25L80R16Y2006146261.02
D40L40R13Y1206586430.98
Disclaimer/Publisher’s Note: The statements, opinions and data contained in all publications are solely those of the individual author(s) and contributor(s) and not of MDPI and/or the editor(s). MDPI and/or the editor(s) disclaim responsibility for any injury to people or property resulting from any ideas, methods, instructions or products referred to in the content.