Article

A Novel Prediction Model for Estimating Ground Settlement Above the Existing Tunnel Caused by Undercrossing

1
Institute of Future Civil Engineering Science and Technology, Chongqing Jiaotong University, Chongqing 400074, China
2
College of Civil Engineering, Chongqing University, Chongqing 400045, China
*
Authors to whom correspondence should be addressed.
Buildings 2025, 15(20), 3708; https://doi.org/10.3390/buildings15203708
Submission received: 21 August 2025 / Revised: 18 September 2025 / Accepted: 30 September 2025 / Published: 15 October 2025
(This article belongs to the Section Building Structures)

Abstract

A new tunnel undercrossing an existing tunnel not only affects the deformation and stress response of the existing tunnel but also triggers ground settlement due to secondary excavation disturbances. By combining the equivalent layer method with the mirror method and incorporating corrections from numerical simulations based on actual intersection projects, a novel prediction model is developed to consider the impact of the existing tunnel on estimating ground settlement caused by a new tunnel that undercrosses it in an orthogonal manner. The influence of geological conditions, tunnel dimensions, and spatial layout on ground settlement patterns was investigated. The elastic moduli of smaller strata correlate with greater surface settlement. Larger existing tunnel diameters result in reduced settlement within a 15 m area near the new tunnel axis. Conversely, new larger tunnel diameters yield more pronounced settlement. A consistency assessment method was introduced to quantitatively measure the consistency between the prediction model and numerical simulations. The results indicate that the prediction model exhibits high consistency (CI > 0.9) under various conditions. Based on an actual engineering case, indoor similarity model tests were designed. When the new tunnel is directly located beneath the existing tunnel, ground settlement begins, with a maximum settlement of 0.17 mm. After the new tunnel traversed the existing one, ground settlement continued to increase within approximately 50 m on both sides of the new tunnel’s axis, ultimately reaching a value of about 0.765 mm. The CI between the predictive model and the model test results reached 0.8, confirming the model’s robust predictive capability.

1. Introduction

With the continuous development of urban underground space and the increasing maturity of railway transportation construction technology, the phenomenon of overlapping tunnels in urban underground environments has become increasingly common. By the end of 2024, the total length of urban rail transit in China had exceeded 10,000 km, with approximately 78% of the lines being underground, often involving complex situations such as overlapping tunnels [1]. Tunnel excavation causes redistribution of loads in the surrounding soil, disturbs the adjacent soil, and leads to ground deformation [2]. However, the presence of existing tunnels above new tunnels inevitably affects the propagation of disturbances induced by excavation, thereby altering the deformation patterns of the strata, which warrants further investigation.
Currently, research on constructing new tunnels beneath existing tunnels primarily focuses on the impact on the deformation of existing tunnels, including the patterns of deformation changes and settlement behavior [3,4,5]. The construction of a new tunnel undercrossing an existing tunnel can cause settlement in the existing tunnel, and the settlement range and maximum settlement value are closely related to the angle of intersection [6]. Fang et al. (2015) found that new double-line tunnels cause vertical deformation of existing tunnels to exhibit a “W”-shaped distribution [7]. Feng et al. (2024) found that the deformation of existing tunnels caused by shield tunneling can be accurately predicted using the BO-LGBM model. They identified key influencing factors such as grouting volume and thrust force [8]. Dong et al. (2025) found that ground settlement caused by shield tunneling under existing tunnels in composite soil layers exhibits specific lateral and longitudinal patterns and is significantly influenced by construction parameters [9]. Based on existing engineering data and research results, analytical methods are widely used to predict the deformation of existing tunnels caused by tunnel undercrossing. Liu et al. (2021) proposed a simplified two-stage analysis method that considers tunnel-to-tunnel interaction, which can be used to assess the impact of double-line tunnels undercrossing on the deformation of the existing tunnel above [10]. Li et al. (2024) integrated the equivalent layering method with the Peck formula to predict the deformation of existing tunnel structures under multi-factor conditions [11]. Yao et al. (2024) proposed a WOA-LSTM model for predicting and optimizing tunnel rock mass deformation under high-ground-stress conditions [12]. Chang et al. (2024) proposed a modified Peck formula for assessing the deformation of existing tunnels during the construction of multi-line tunnels [13].
When constructing new tunnels under existing tunnels, it is necessary not only to consider the deformation and stress response of the existing tunnels but also to pay attention to ground settlement caused by secondary excavation disturbances. However, research in this field remains relatively limited. Additionally, the inherent differences between tunnel structures and surrounding geological formations make it highly challenging to precisely quantify the impact of new tunnel excavation on ground settlement patterns beneath existing tunnels. Therefore, current research primarily relies on numerical simulations, laboratory experiments, and analysis of field monitoring data [14,15,16]. Additionally, calculations of ground settlement caused by new tunnel construction often neglect the presence of existing tunnels, leading to significant discrepancies in the results [17]. This oversight stems from two key factors: first, the stiffness of the tunnel lining is significantly higher than that of the surrounding rock, thereby affecting rock deformation; second, the hollow cylindrical structure of the lining introduces non-uniformity, which has a substantial impact on rock settlement. Zhou et al. (2020) proposed a method for calculating ground settlement caused by tunnel crossing by combining the equivalent layer method with the classic Peck formula [17]. However, since the Peck formula is an empirical formula based on statistical experience, its reliability under different engineering conditions has not been fully verified.
The core of accurate ground settlement prediction in tunnel crossing projects lies in the reasonable modeling of the interaction between the existing tunnel and the surrounding strata. Zhou et al. (2020) ingeniously transformed the existing tunnel into equivalent strata using the equivalent layer method, providing an effective means to simplify this complex challenge [17]. Inspired by this framework, the preliminary work of this study proposed a calculation method combining the equivalent layer method with the mirror method to predict vertical deformation in existing tunnels [18]. However, the effectiveness of this model in predicting ground settlement directly above existing tunnels caused by new tunnel construction remains an unsolved issue.
Based on actual engineering, the ground settlement directly above the existing tunnel was calculated using the calculation method from our preliminary study [18]. The model’s errors were demonstrated using measured data and numerical simulations. Subsequently, based on the differences between the preliminary model and the numerical simulation results, an improved model for predicting ground settlement was proposed. Using the modified prediction model, multiple sets of different calculation conditions were designed to investigate the influence of various parameters on ground settlement patterns. The adaptability of the model was evaluated, and the results indicated that it is highly effective in predicting ground settlement caused by the orthogonal crossing of new tunnels and existing tunnels. Finally, based on an actual engineering case, indoor similarity model tests were designed to validate the practical application value of the modified prediction model.

2. Theoretical Basis and Preliminary Model Construction

2.1. The Equivalent Layer Method

The equivalent layer method was introduced to convert non-uniform strata into uniform equivalent strata by replacing the elastic modulus and density of the upper strata with the corresponding parameters of the lower strata, and it has been widely applied and further developed [11,19,20]. The depth of the upper layer should be calculated as follows:
h 1 = h 1 E 1 ρ 2 E 2 ρ 1
where h1 is the thickness of the upper layer; h1′ is the equivalent thickness of the upper layer obtained using the equivalent layer method; E1 and E2 are the elastic moduli of the upper and lower layers, respectively; ρ1 and ρ2 are the densities of the upper and lower layers, respectively. These parameters are shown in Figure 1.
It should be noted that the equivalent layer method assumes homogeneous strata, disregarding spatial variability in stratigraphic properties, and is thus an idealized and simplified calculation method.

2.2. The Mirror Method

The mirror method was proposed by Verruijt and Booker (1996) to calculate rock mass deformation caused by tunnel excavation within a single homogeneous layer [21]. Its linear elastic analytical solution was derived to determine rock mass displacement, accounting for the variability in volume changes. Subsequently, González and Sagaseta (2001), Park (2005), Tan et al. (2019), and Li et al. (2023) further utilized the mirror method to study ground deformation caused by tunnel excavation, thereby validating the effectiveness of this method in assessing excavation-induced ground deformation [22,23,24,25]. Verruijt and Booker (1996) [21] proposed an expression for calculating the displacement at a specific point in the stratum resulting from tunnel excavation using the mirror method. The calculation formula is as follows:
U z = ε R 2 z 1 r 1 2 + z 2 r 2 2 + δ R 2 z 1 k x 2 z 1 2 r 1 4 + z 2 k x 2 z 2 2 r 2 4 + 2 ε R 2 m m + 1 z 2 r 2 2 m z x 2 z 2 2 r 2 4 2 δ R 2 H x 2 z 2 2 r 2 4 + m m + 1 2 z z 2 3 x 2 z 2 2 r 2 6
U x = ε R 2 x 1 r 1 2 + 1 r 2 2 + δ R 2 x x 2 k z 1 2 r 1 4 + x 2 k z 2 2 r 2 4 2 ε R 2 x m 1 r 2 2 2 m z z 2 r 2 4 4 δ R 2 x H m + 1 z 2 r 2 4 + m z x 2 3 z 2 2 r 2 6
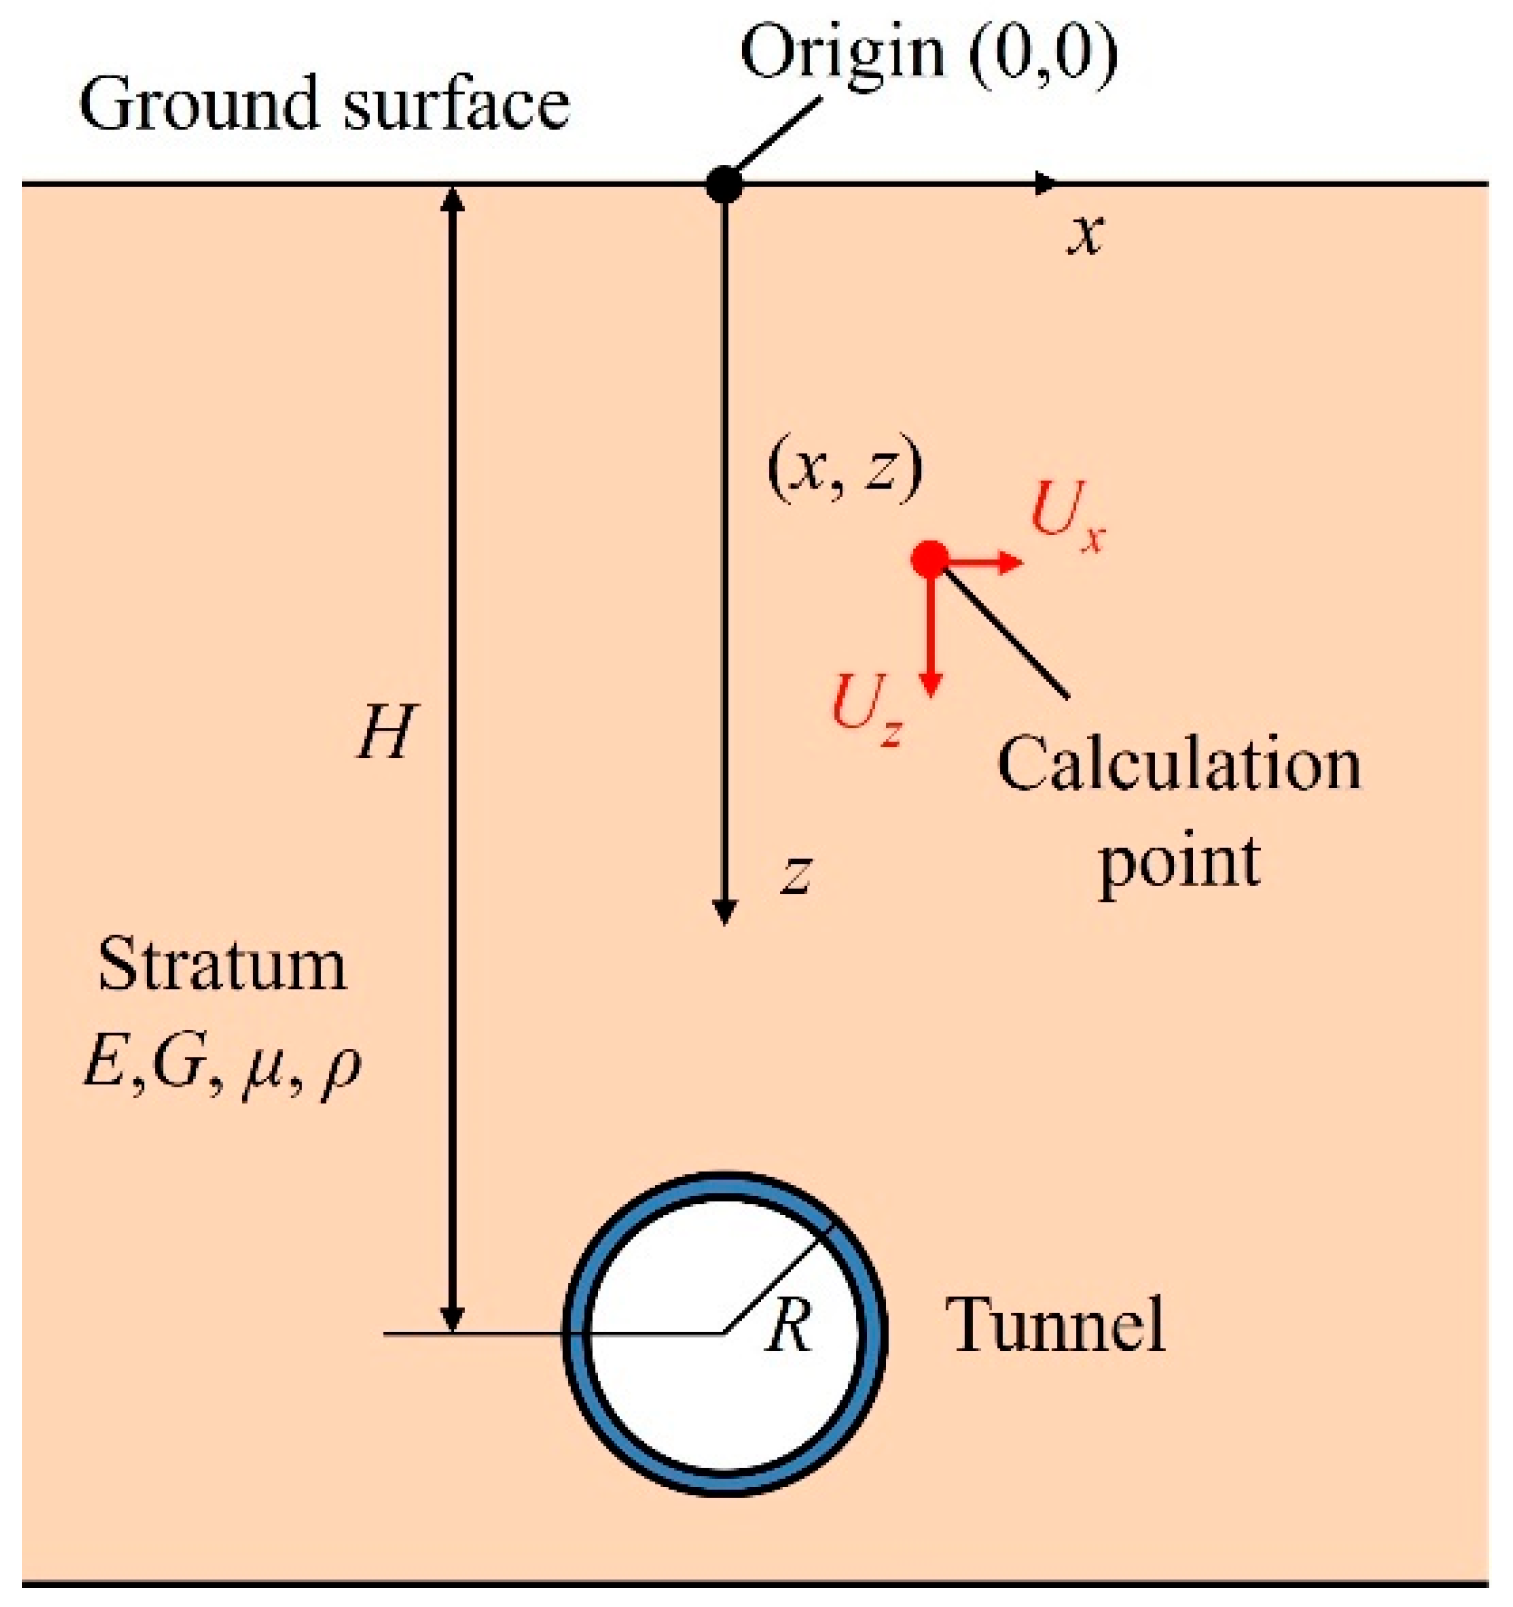
where Uz represents the vertical deformation at a certain point in the stratum caused by tunnel excavation; Ux represents the horizontal deformation at the same point in the stratum caused by tunnel excavation; z 1 = z H ; z 2 = z + H ; r 1 2 = x 2 + z 1 2 ; r 2 2 = x 2 + z 2 2 ; m = 1 1 2 μ ; k = μ 1 μ ; x and z are the coordinates of the calculation point; R is the tunnel radius; H is the axial depth of the tunnel; μ is the Poisson’s ratio of the soil; ε and Δ represent the uniform radial contraction and elliptical deformation of the tunnel, respectively, which can be calculated using the following formulas according to Verruijt and Booker (1996) [21]:
ε = P 0 P i 2 G 1 + 2 1 μ 2 H R H R H R 2 1 1 1 H R H R H R 2 1
δ = P 0 P i 2 G 1 μ 1 H R 2 1
where P0 is the vertical ground stress at the tunnel axis before excavation; Pi is the support stress after excavation; G is the shear modulus of the soil.
It should be noted that Equations (4) and (5) represent empirical calculation formulas for ε and Δ. Their theoretical analytical solutions and derivation processes can be found in reference [21]. Further elaboration is omitted here.
The above parameters are shown in Figure 2.

2.3. Preliminary Construction of the Ground Settlement Prediction Model

Based on the equivalent layer method and mirror method, a calculation model for vertical deformation of existing tunnels caused by new tunnels undercrossing was proposed in our previous research [18]. The primary implementation process of this method is as follows:
  • Convert existing tunnels into equivalent strata;
  • Homogenize multi-layer strata, including strata derived from existing tunnels through the equivalent layer method;
  • Calculate the settlement of the existing tunnel layer caused by the excavation of new tunnels in homogenized strata using the mirror method.
The following formula is used to convert existing tunnels into strata:
E b 0 h 0 3 12 = E π D 4 64 1 α 4
ρ b 0 h 0 = ρ π 4 D 2 d 2
where E is the elastic modulus of the equivalent stratum; b0 and h0 are the width and height of the equivalent stratum, respectively, and b0 = h0 = D; D is the outside diameter of the existing tunnel; E is the elastic modulus of the tunnel lining; α = d D , where d is the inside diameter of the existing tunnel; ρ is the density of the equivalent stratum; ρ is the density of the lining.
After converting the existing tunnel into a stratum, multiple layers of strata with different properties may still exist above the new tunnel. Subsequently, these various layers of strata are homogenized into a single equivalent stratum through the equivalent layer method using the following formula:
h = ρ n E n i = 1 n 1 h i E i ρ i
where h is the total thickness of the former n − 1 layers; ρn is the density of the nth layer; En is the elastic modulus of the nth layer; hi is the thickness of the ith layer; ρi is the density of the ith layer; and Ei is the elastic modulus of the ith layer.
Finally, the mirror method is used to calculate the settlement of the existing tunnel layer caused by the new tunnel excavation, as per Equation (2). It should be noted that all calculation parameters in Equation (2) are converted parameters.
When z in Equation (2) is equal to 0, the formula becomes:
U z = 2 ε R 2 m + 1 m h r 2 2 δ R 2 h x 2 h 2 r 4
where r 2 = x 2 + h 2 ; the remaining parameters are the same as those mentioned above.
Based on Equation (9), a preliminary prediction model was established to estimate ground settlement directly above the existing tunnel caused by the construction of a new tunnel.
It is crucial to emphasize that, as an idealized analytical calculation model, Equation (9) does not account for the potential stress distribution irregularities and settlement variations caused by spatial variations in soil parameters. Particularly in weak or heterogeneous strata, localized weak zones may exacerbate deformation near the crossing section [26].

3. Verification

To validate the practical applicability of the preliminary prediction model, a representative case from Liang (2016) [27] was selected, which involves the orthogonal intersection of a new tunnel and an existing tunnel. Due to the lack of monitored ground settlement data, these values were derived through numerical simulation. The other monitoring data from Liang (2016) [27] were used to verify the accuracy of the simulation.

3.1. Numerical Simulation

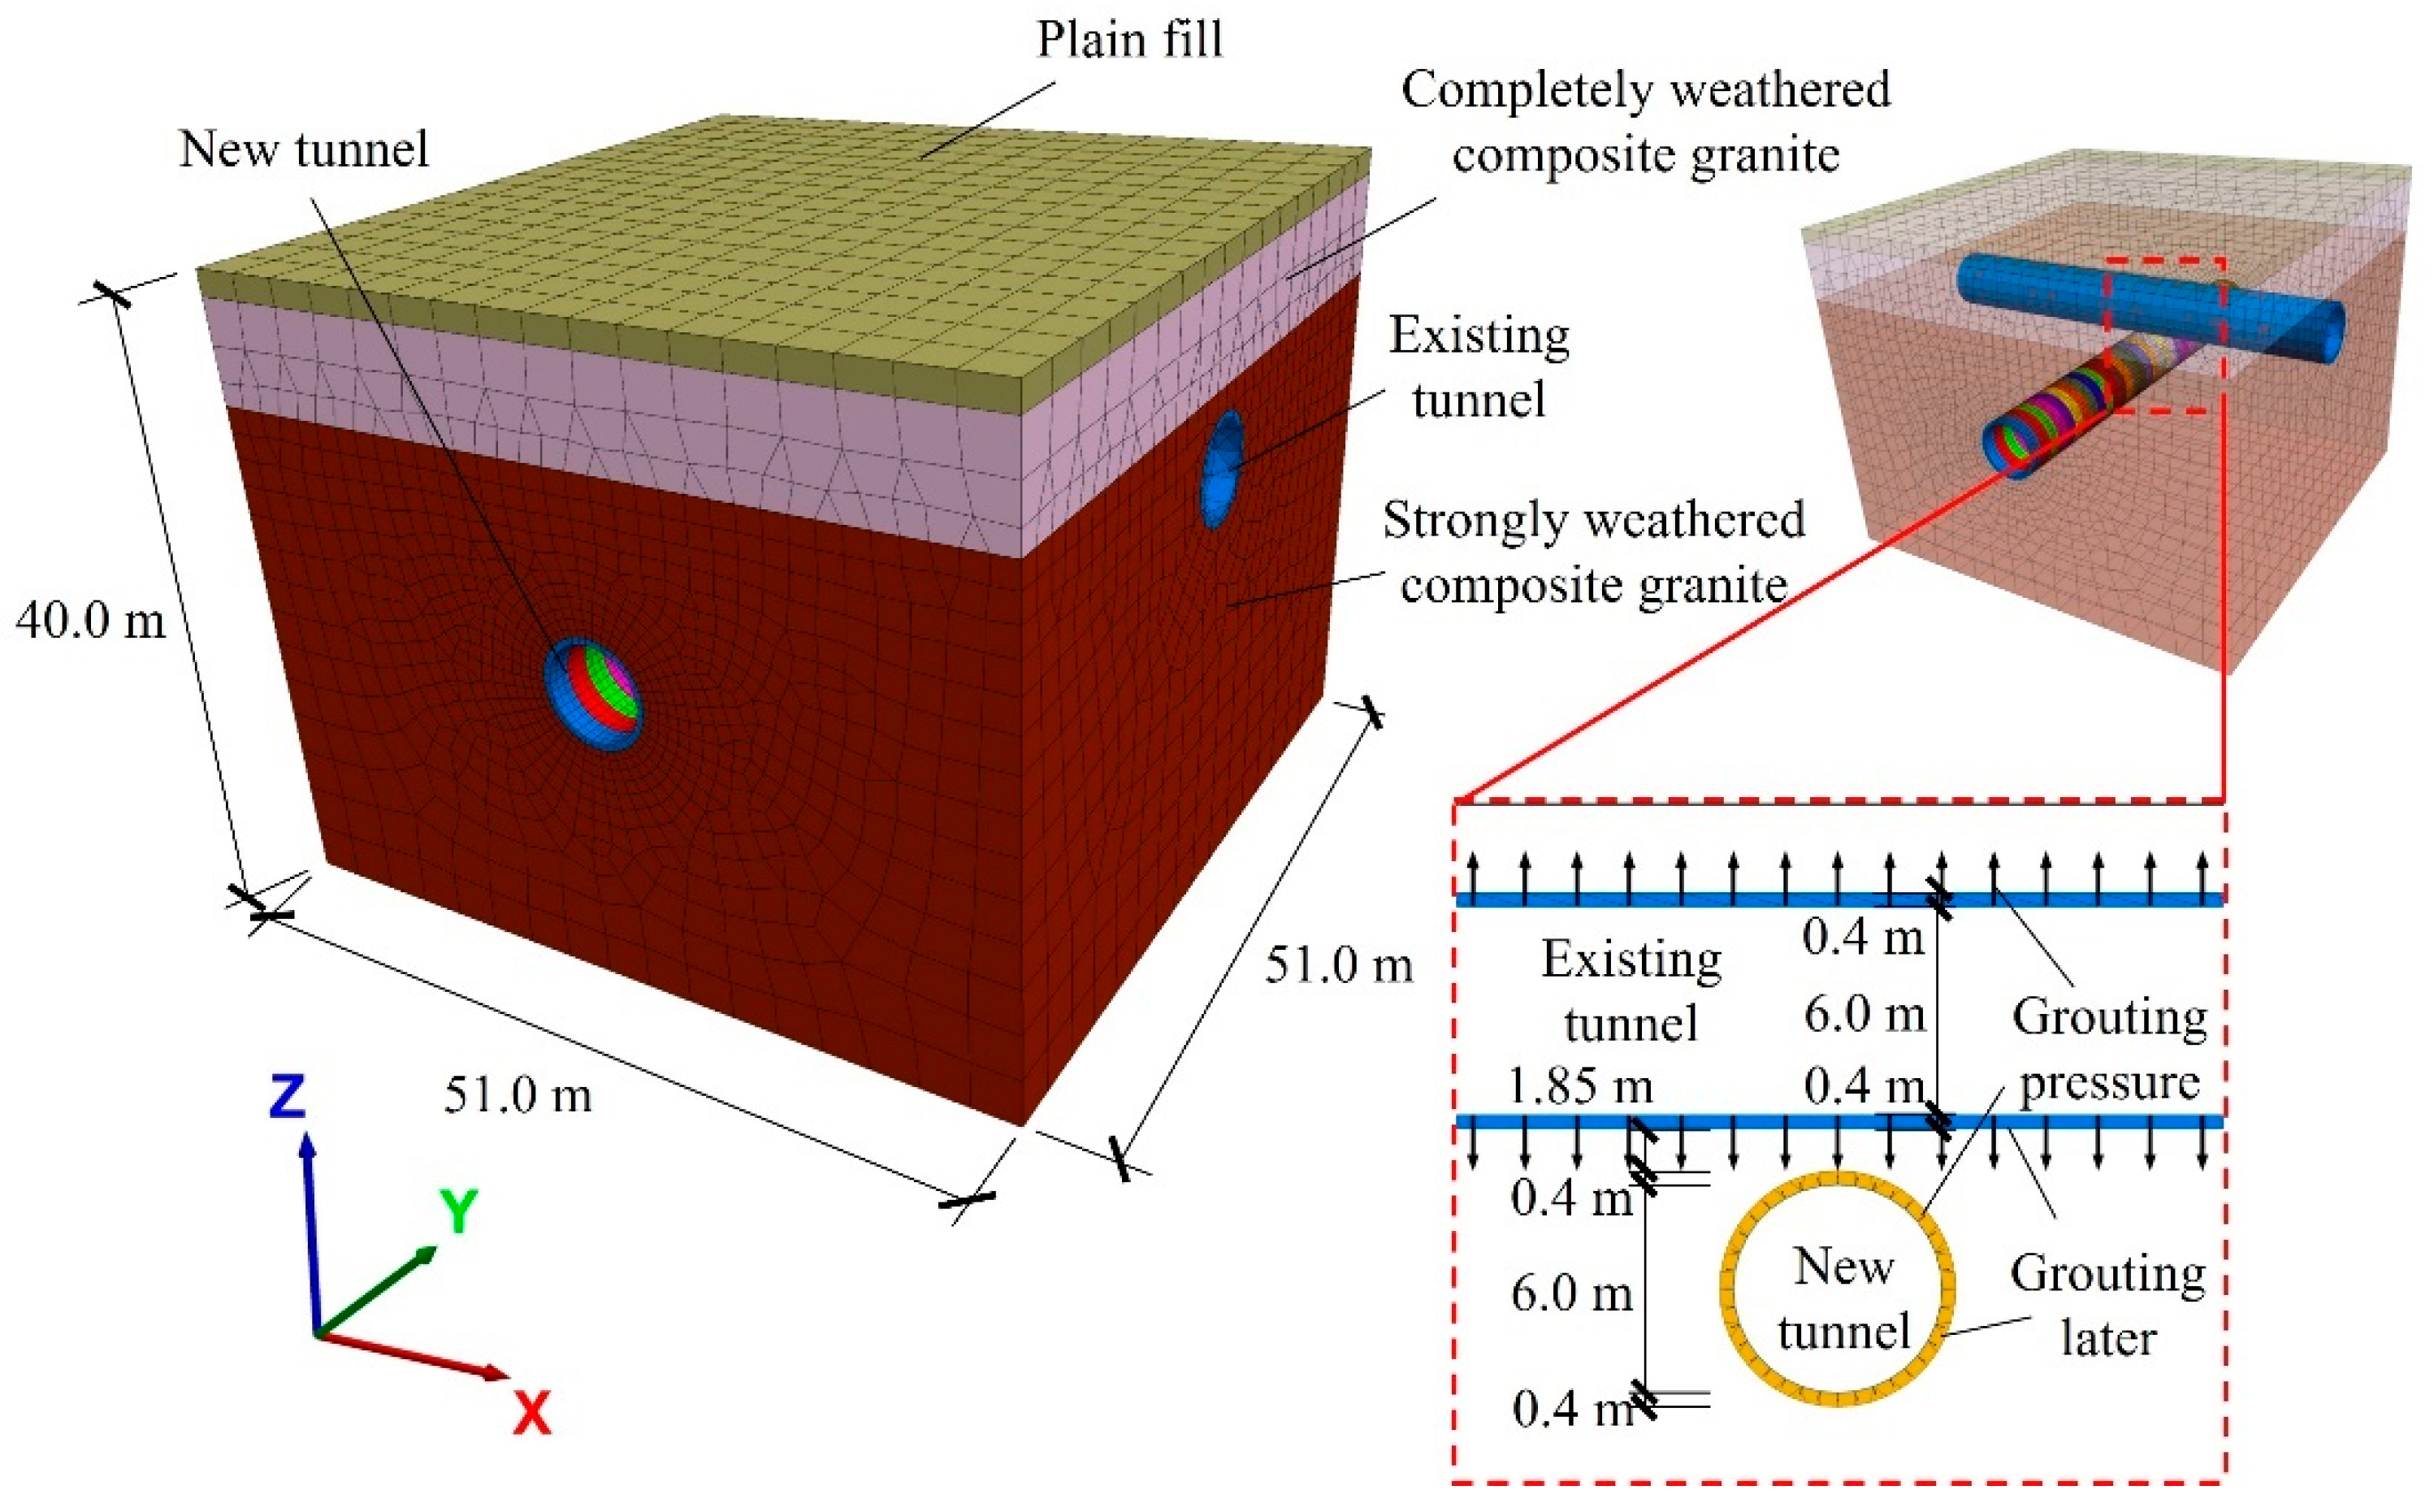
The numerical simulation model was constructed using the FEM software Midas-GTS NX 2021 [28] and then imported into the FDM software FLAC3D 5.0 [29] for numerical calculations. Figure 3 shows the main dimensions and spatial relationships of the tunnels. As shown in the figure, the existing tunnel is buried at a depth of 9.9 m, with a minimum clearance of only 1.85 m between the new and existing tunnels. This layout is highly likely to significantly impact the existing tunnel and surrounding rock layers during excavation. Both tunnels have a diameter of 6.0 m, with the lining consisting of shield segments that are 0.3 m thick and 1.5 m wide.
Given that the two lines of Line 7 were constructed independently, and that the right line of Line 7 was excavated before the left line and was not affected by it, the numerical model focuses solely on the engineering of the right line of Line 7 crossing the right line of Line 3. In subsequent analyses, the right line of Line 7 will be marked as the new tunnel, while the right line of Line 3 will be referred to as the existing tunnel.
To minimize boundary effects, the model’s length and width were extended to 3 to 5 times the diameter of the tunnel. Considering the shallow bedrock surface, a model height of 40.0 m was sufficient. The final model dimensions were 51.0 m × 51.0 m × 40.0 m (length × width × height). A hierarchical mesh approach was adopted, where finer elements (0.5 m grid size) were assigned near the new tunnel lining and excavation face. In comparison, existing tunnel sections utilized a 1.5 m grid size. Coarser elements (maximum 3.0 m) were applied to the outer model region to optimize computational efficiency. Mesh refinement was determined through convergence studies, ensuring that changes in ground settlement and tunnel deformation remained below 2% when element sizes were further reduced, thereby meeting the geotechnical simulation accuracy requirements [2]. The final numerical model comprises 79,145 elements and 45,598 nodes. The established 3D simulation model is shown in Figure 4.
Boundary conditions are defined as follows: lateral boundaries are fixed to prevent lateral deformation, simulating a semi-infinite medium; the bottom boundary is fully fixed to restrain vertical and horizontal displacements; and the top boundary is unconstrained. Following Liang’s methodology [27], a uniform 0.2 MPa load was applied to the excavation face to simulate shield support forces. An outward radial pressure of 0.3 MPa was applied to the outer wall of the 0.4-meter-thick grout layer to simulate grouting pressure, consistent with shield tunnel construction simulations [5].
The Mohr-Coulomb (M-C) model features clear parameter definitions, straightforward parameter acquisition, and high computational efficiency. It is particularly well-suited for describing the mechanical behavior of weathered granite formations and demonstrates excellent applicability in numerical simulations of tunnel undercrossing. Consequently, it is widely adopted as the constitutive model for rock in tunnel numerical simulations [30,31,32]. Therefore, the M-C model was employed for computations, with simulation parameters detailed in Table 1.
The shield lining segment is constructed using C50 concrete and simulated via shell elements. The grout layer is modeled using solid elements and an elastic constitutive model. Since no relative displacement occurs between the grout layer and the surrounding strata, no contact interface was defined, as outlined in [5]. The interaction between the lining and grout layer is reflected through the computational parameters of the shell elements. The relevant parameters are shown in Table 2.
The simulation primarily focuses on ground settlement above the existing tunnel caused by the excavation of the new tunnel. Therefore, the existing tunnel was excavated in a single operation, while the new tunnel was excavated in sections, with each section having the same width as the actual section width. The excavation step length for the new tunnel is 1.5 m, and the grouting layer was activated after each segment was excavated. To accurately capture ground settlement caused solely by the excavation of the new tunnel, all initial displacements were reset to zero before the new tunnel excavation began.
The detailed simulation process is as follows:
  • Initialize the ground stress equilibrium and reset the initial displacement;
  • Excavate the existing tunnel at one time, install the lining segments, define the grouting layers, and simultaneously apply grouting pressure; calculate and reset the displacement;
  • Excavate the new tunnel in stages, install the lining segments in each step, define the grouting layers, and apply grouting pressure until completion;
  • Extract the ground settlement directly above the existing tunnel.

3.2. Verification of the Simulation

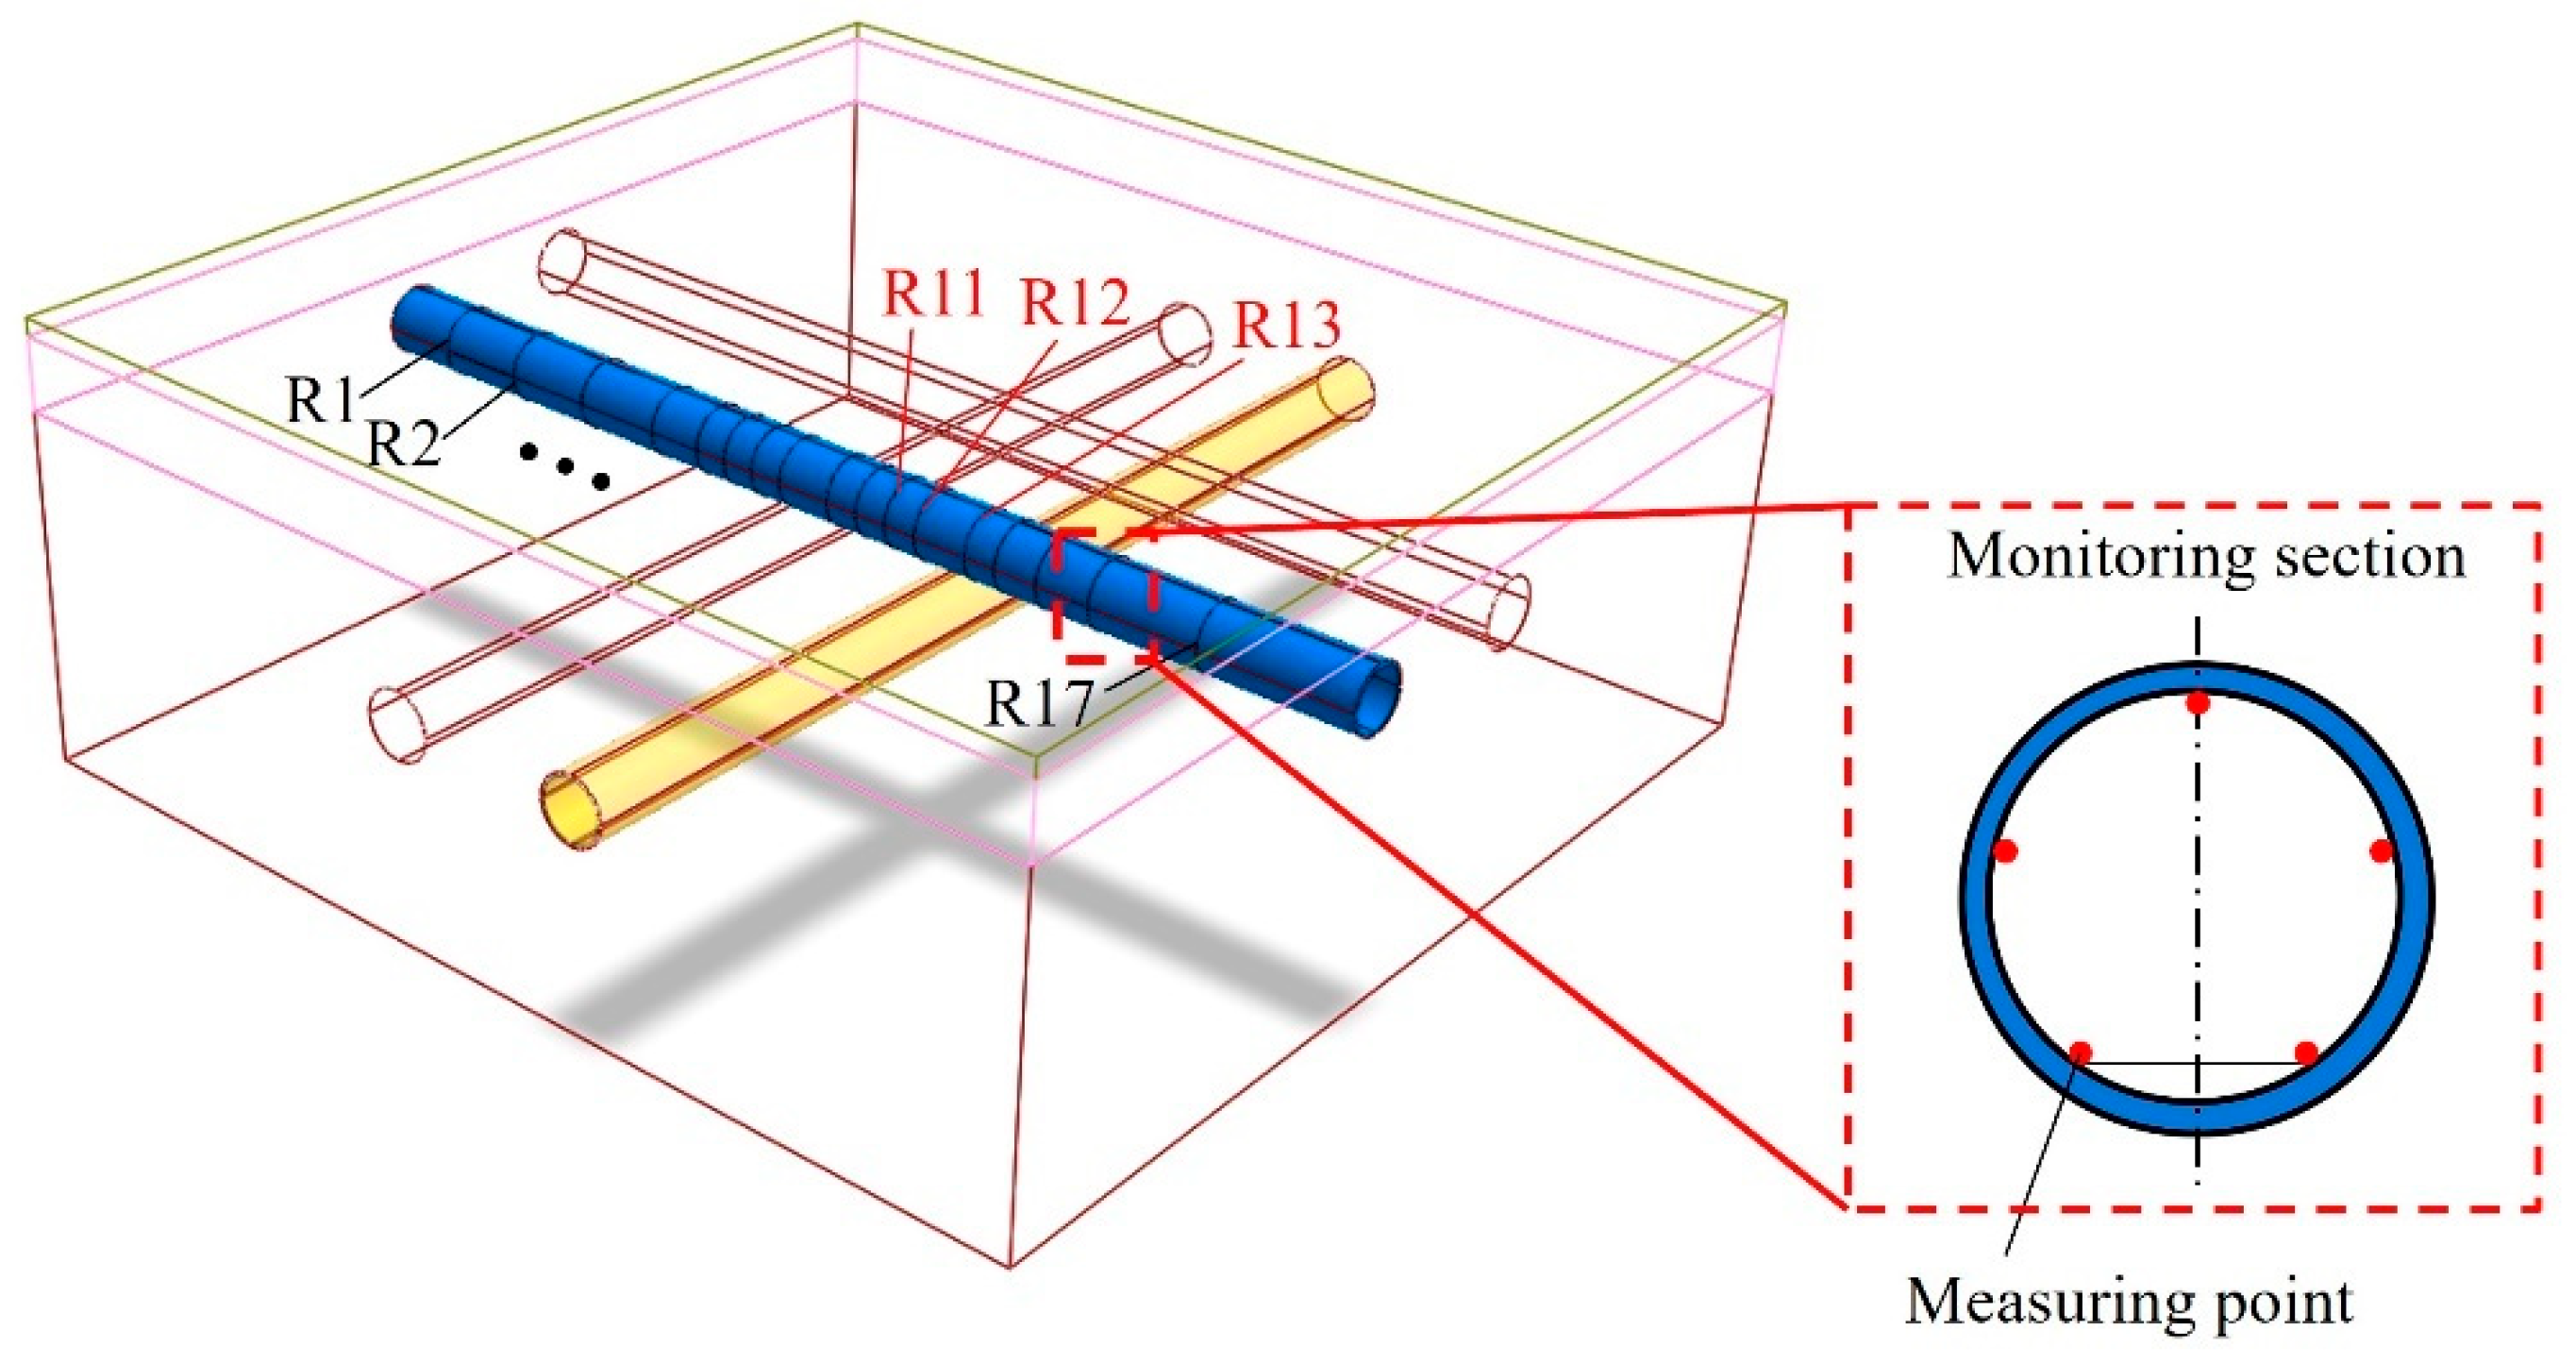
The accuracy of the simulation was verified using vertical deformation data monitored in existing tunnels. Seventeen monitoring sections were set up for each line, with five measurement points in each section. Figure 5 shows the layout of the monitoring sections for the right line of Line 3, where sections R11, R12, and R13 are located directly above the underpass section.
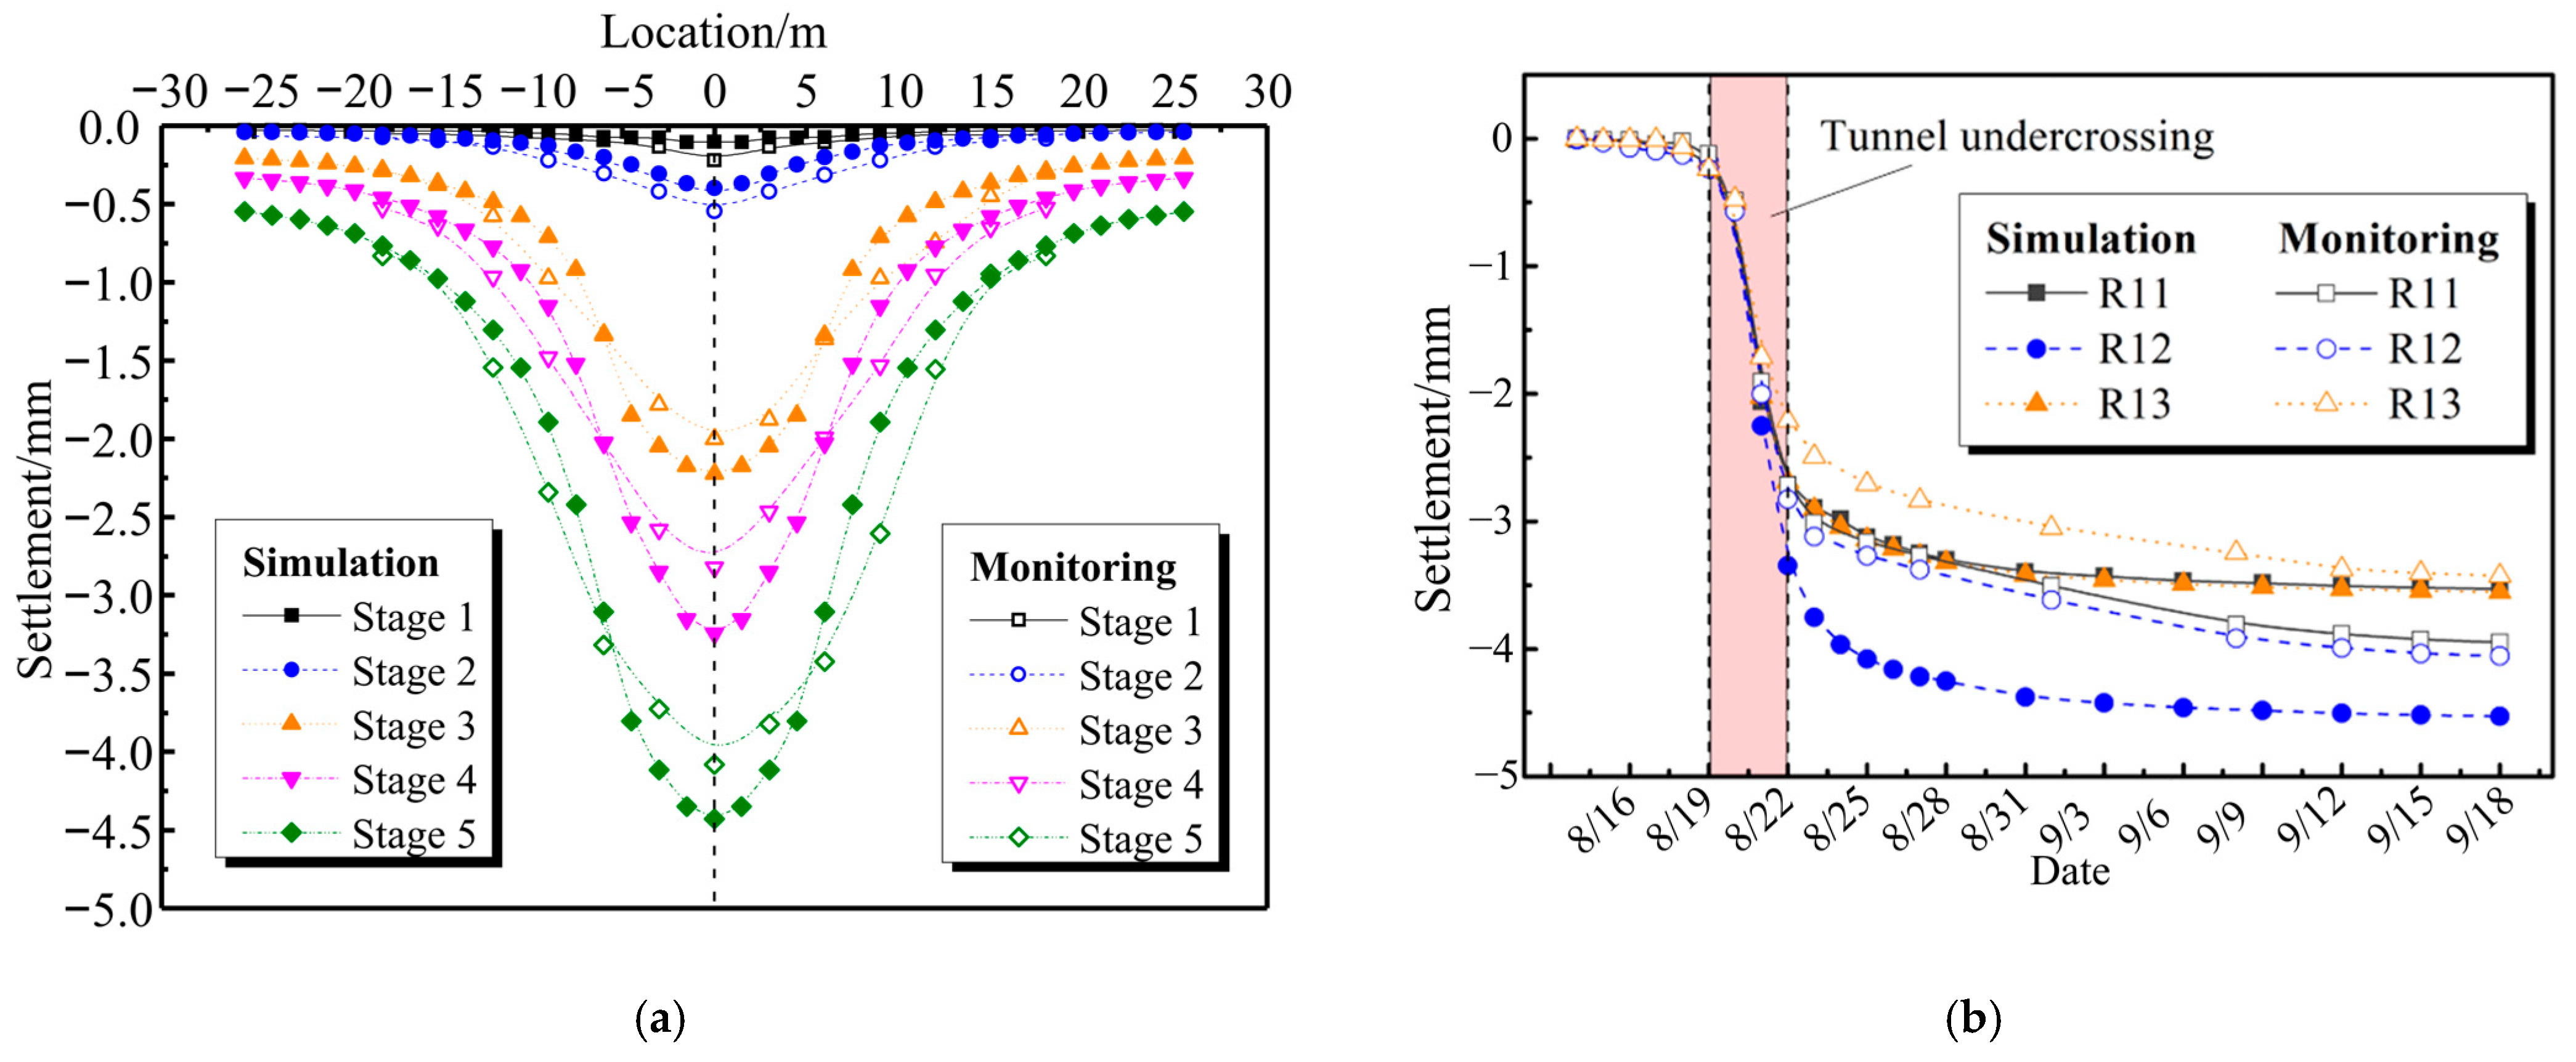
Figure 6a presents a comparison between the numerical simulation results and monitoring data along the existing tunnel’s axis direction. In contrast, Figure 6b displays the corresponding data from measurement points R11, R12, and R13 during the excavation process. In Figure 6b, the excavation steps in the numerical simulation have been converted to the actual excavation timeline to ensure alignment. As shown in the figure, the vertical deformation of the existing tunnel simulation is highly consistent with the monitoring values along the tunnel axis direction and throughout the entire excavation sequence. The maximum vertical deformation occurs directly above the crossing section, then gradually decreases toward points farther from this area until it approaches zero, forming a “trench-like” settlement curve. For sections R11, R12, and R13, vertical deformation suddenly increased from 0 to approximately 2.5–3.5 mm during the construction phase of the crossing section (19–22 August), followed by settlement stabilizing at around 3.5–4.5 mm. The primary source of differences in Figure 6a stems from the simulation’s failure to account for complex loads, such as ground loads, vehicle loads within the existing tunnels, and construction loads [18,33].

3.3. Verification of the Prediction Model

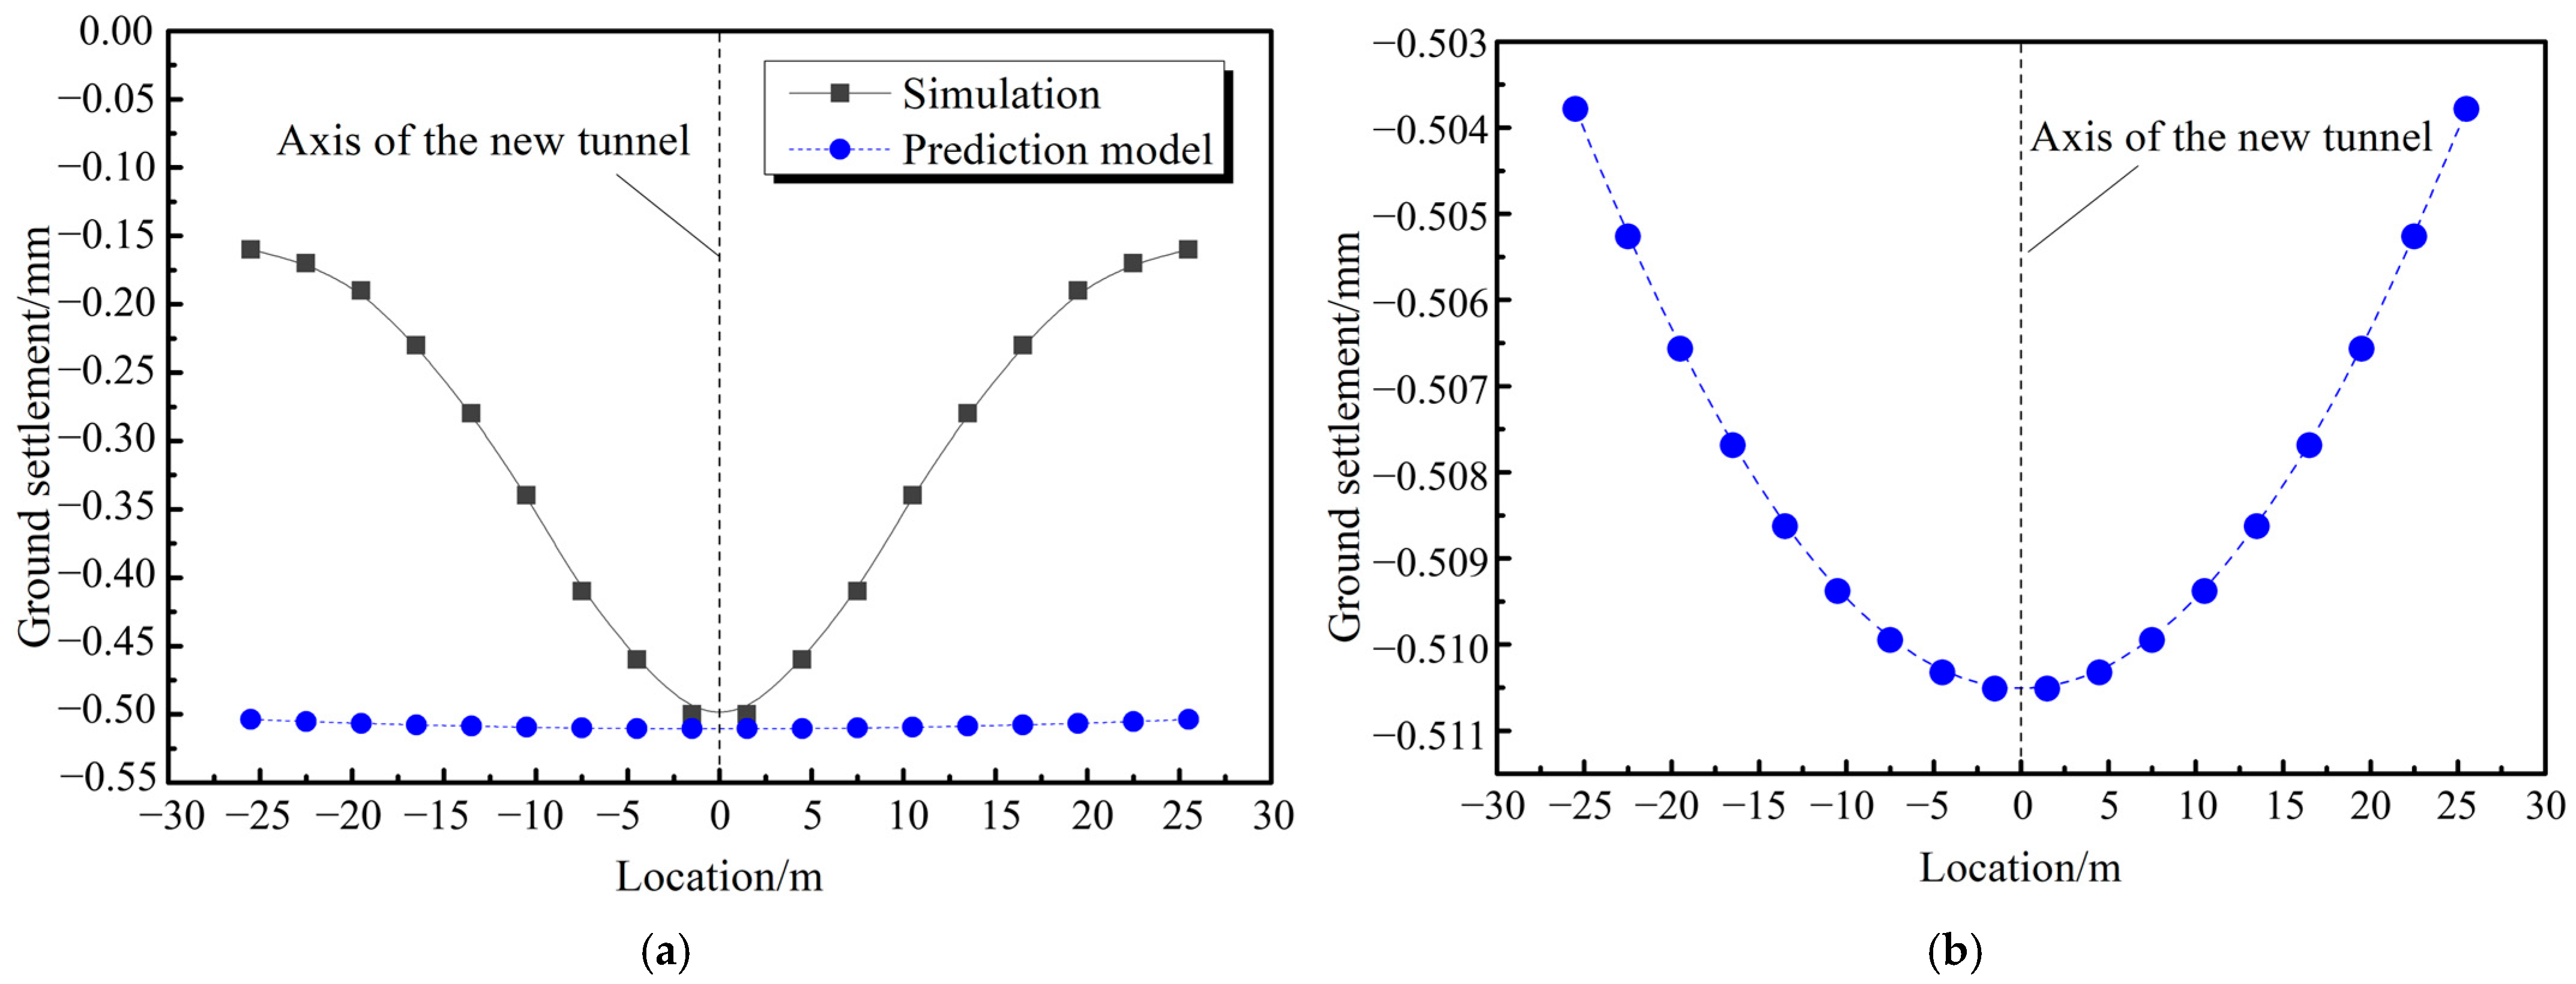
After verification with monitoring data, the numerical simulation model was used to assess the accuracy of the preliminary prediction model. Ground settlement directly above the existing tunnel was extracted and compared with the calculation results through the preliminary prediction model, as shown in Figure 7. To obtain the calculation results through the preliminary prediction model, the equivalent elastic modulus E and equivalent density ρ were first calculated using Equations (6) and (7), followed by the calculation of ground settlement directly above the existing tunnel using Equations (4), (5), (8), and (9). The calculation range extends 25.5 m on either side of the new tunnel axis, with adjacent calculation points spaced 1.5 m apart, corresponding to the width of the shield segment.
As shown in the figure, the ground settlement curves obtained through the preliminary prediction model exhibit poor consistency with the numerical simulation results. Although the values near the new tunnel axis are similar, the overall trend is significantly smoother. To facilitate analysis, Figure 7b presents the ground settlement curve from the preliminary prediction model separately, indicating a gradual decrease from 0.511 mm at the axis to 0.504 mm at 25.5 m, corresponding to a change of approximately 1.37%. This discrepancy primarily stems from the preliminary prediction model equating the existing tunnel with the surrounding strata using the stiffness equivalence method, thereby overestimating the stiffness difference between the tunnel and the strata, as well as the overall coordinated deformation capacity of the tunnel lining. Therefore, the model requires modification to enhance its predictive accuracy for ground settlement.

4. Modification of the Prediction Model

Peck (1969) proposed that the ground settlement curve caused by tunnel excavation follows a normal distribution—a concept that has since been widely adopted and refined [11,34,35,36]. The basic form of the Peck formula is:
S = S max e x 2 2 i 2
S max = V S i 2 π 0.313 V l D 2 i
where S is the ground settlement at any location; Smax is the maximum ground settlement directly above the tunnel axis; vs. is the volume of ground loss per unit length; Vl is the ground loss rate; D is the tunnel diameter; i is the horizontal distance from the tunnel axis to the inflection point of the settlement curve; and x is the horizontal distance from the tunnel axis to any point on the ground surface.
O’Reilly and New (1982) proposed the following formula to describe the relationship between i and the depth of the tunnel center z [37]:
i = K z
where K is the width coefficient of the settlement trough.
Various factors, including tunnel excavation conditions, geological formation characteristics, the burial depth-to-diameter ratio, and the grouting rate, influence the ground loss rate. Similarly, K is also affected by geological formation conditions. Based on a statistical analysis of numerous tunnel engineering projects, Wu and Zhu (2019) noted that in soil pressure balance shield tunnels in Guangzhou, China, the average ground loss rate Vl and settlement slot width coefficient K were approximately 0.95% and 0.48, respectively [38].
Use Equation (10) to fit the numerical simulation curve in Figure 7. The fitting formula is:
S = 0.47 × e x 2 2 × 14.65 2
The correlation coefficient R2 is 0.954, which validates the fitting effect.
In Equation (13), i is 14.65, indicating the specific location of the point where the curve bends in the opposite direction.
Find the second derivative of x in Equation (9), then
2 U z x 2 = 4 ε R 2 h m + 1 m r 4 + 16 ε R 2 h x 2 m + 1 m r 6 4 δ R 2 h r 4 + 32 δ R 2 h x 2 r 6 8 δ R 2 h h 2 x 2 r 6 + 48 δ R 2 h x 2 h 2 x 2 r 8
When 2 U z x 2 = 0, the value of x is the coordinate position of the point where the curve bends in the opposite direction. By substituting the corresponding parameters in the item, the value of x can be calculated as 229.47.
The difference in inflection point locations between the numerical simulation (Equation (13)) and the prediction model (Equation (9)) results in significant differences in the curve shapes. To optimize the prediction model, the curve shape can be adjusted by moving the inflection point to a closer position. Let the inflection point of the settlement curve in the numerical simulation be denoted as iS, and the inflection point in the prediction model be denoted as iP. Then
i P i S = 229.47 14.65 = 15.66
Substitute it into Equation (9), then
U z = 2 ε R 2 m + 1 m h r 2 2 δ R 2 h A x 2 h 2 r 4
where r 2 = A x 2 + h 2 ; A is the correction coefficient, with a value of 240. Other parameters are the same as in Equation (9). Equation (16) is the modified prediction model.
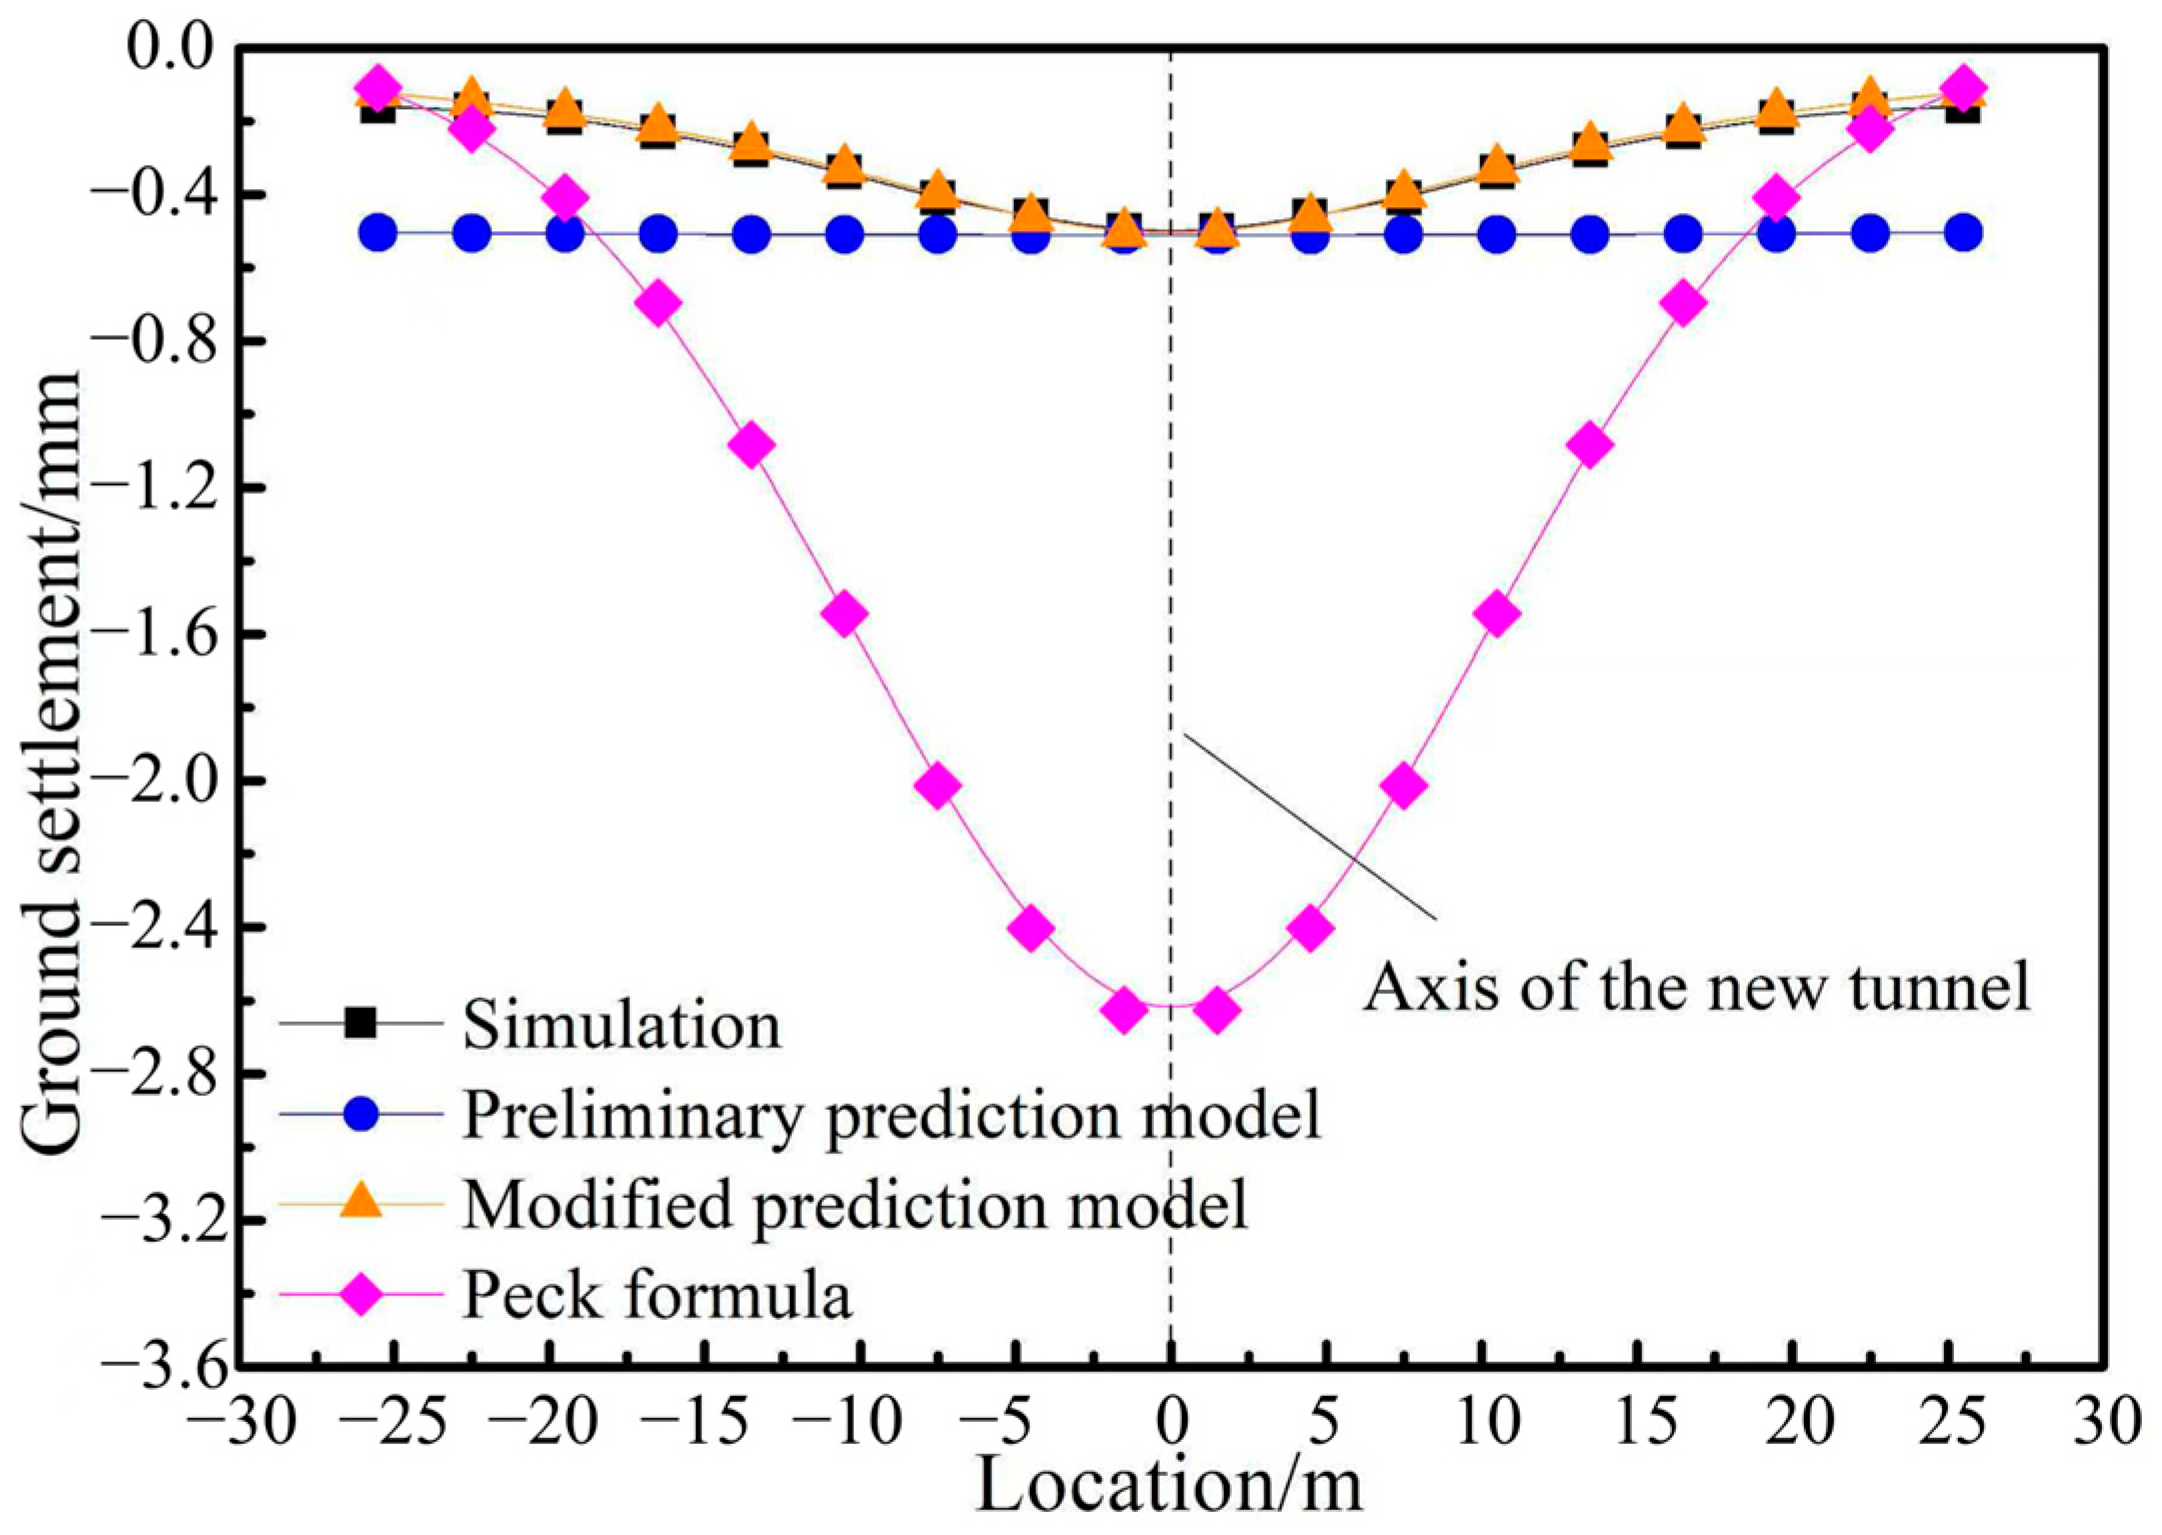
Figure 8 presents a comparison among the modified prediction model, the preliminary prediction model, the numerical simulation results, and the prediction results based on the Peck formula. It is worth noting that the Peck formula does not account for the influence of existing tunnels, resulting in significant discrepancies from the actual situation, which is manifested as an overestimation of the maximum settlement value and a steeper overall curve trajectory. This highlights the key role of the stiffness of existing tunnels in mitigating and coordinating ground deformation. Compared to the Peck formula, the preliminary prediction model produces a significantly smoother ground settlement curve, with values near the crossing section closely approximating the actual values; however, the overall trend exhibits a notable deviation. Overall, the modified prediction model demonstrates good consistency with measured data, making it suitable for predicting ground settlement resulting from the orthogonal crossing of the new tunnel and the existing tunnel.

5. Parameter Analysis and Adaptability Study

To further investigate the influence of parameters on settlement patterns in the modified prediction model, multiple sets of working conditions with different parameter configurations were designed. The modified prediction model was used to calculate the ground settlement, and the results were subjected to detailed comparative analysis. Additionally, corresponding numerical simulation models were established to assess the model’s adaptability under various conditions. In the following text, the improved prediction model will be referred to directly as the prediction model.

5.1. Elastic Modulus of the Strata

The elastic modulus and Poisson’s ratio of the strata are the primary parameters influencing stratum deformation. Since Poisson’s ratio varies relatively slightly, the elastic modulus was selected as the variable, and the prediction model was used to obtain the ground settlement curve. Based on the actual elastic modulus of the strata, coefficients of 0.25, 0.5, 2, and 4 are multiplied to establish the calculation conditions table.
Figure 9 shows the ground settlement curves under different soil elastic modulus conditions, along with corresponding numerical simulation results for comparison. The prediction model exhibits high consistency with the numerical simulation results, thereby fully validating the model’s accuracy. Changes in soil elastic modulus have a minor impact on the shape of the settlement curves but a significant influence on the overall settlement magnitude. Softer rock layers result in greater ground settlement at all locations. The stiffness and coordinated deformation capacity of existing tunnels can mitigate settlement near the crossing section. However, settlement increases at locations farther from the crossing section, particularly in softer rock layers. In practical engineering applications, especially when existing structures such as buildings, railways, or bridges are located near the crossing section, special attention should be given to mitigating uneven settlement issues.
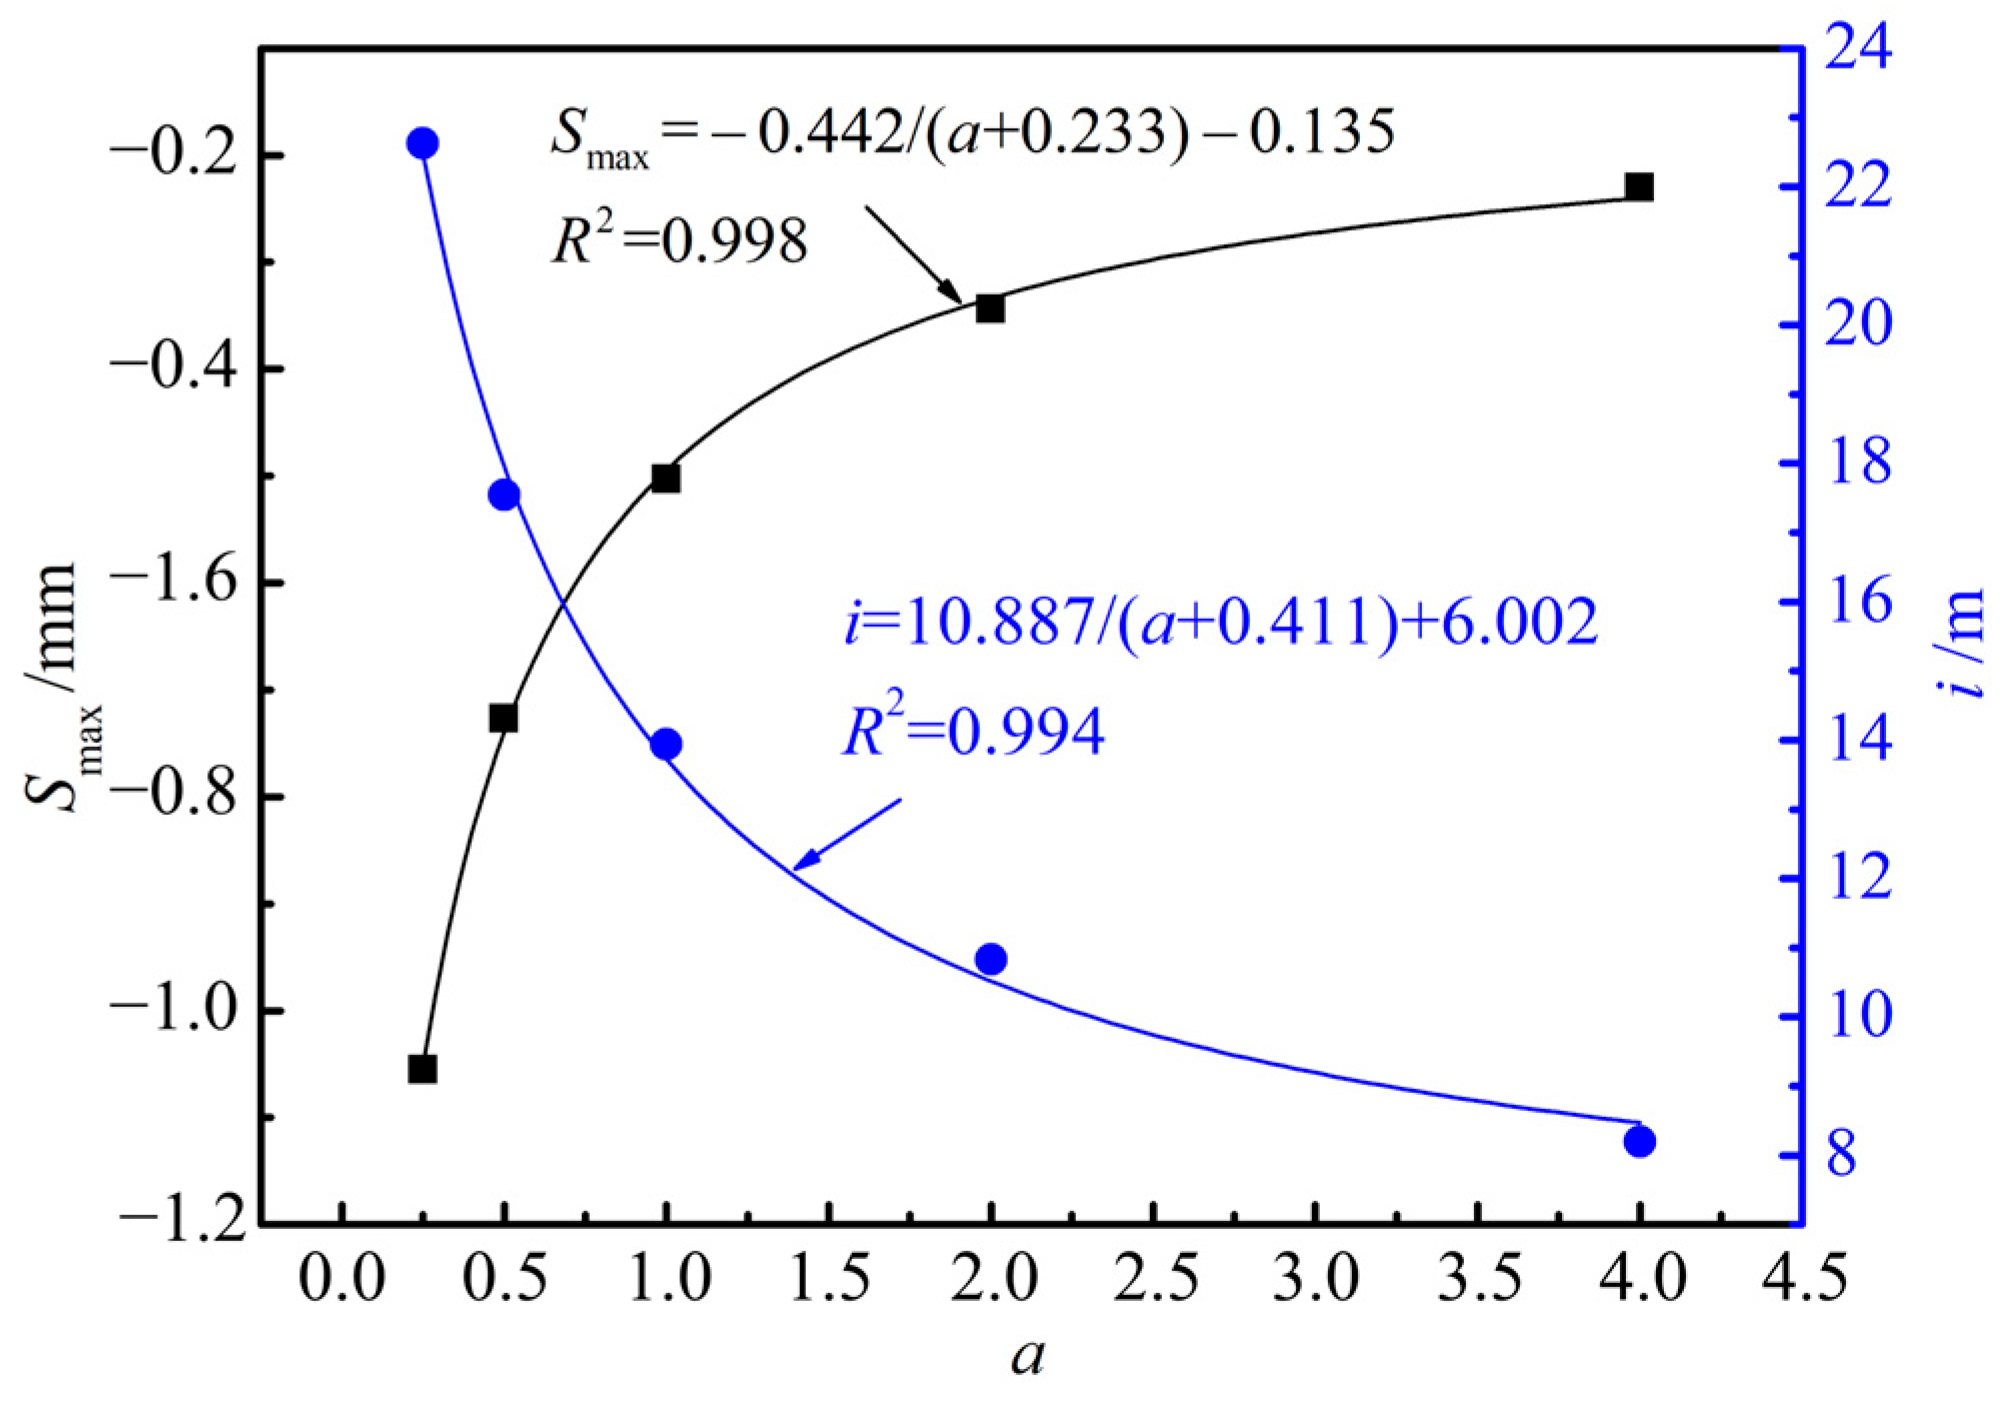
The maximum settlement value, Smax, and the horizontal distance from the inflection point of the settlement curve to the tunnel axis, i, constitute the two key parameters characterizing the ground settlement curve. Therefore, the prediction model was further adopted to analyze the variation of Smax and i under different soil elastic moduli, as shown in Figure 10. For the convenience of analysis, parameter a is introduced to represent the ratio of the elastic modulus of each strata group to the reference value. The relationships between Smax and a, as well as between i and a, both exhibit a clear inverse trend; however, the specific behavioral characteristics are quite different. As the increases (indicating harder strata), the maximum ground settlement value gradually increases, but the rate of increase gradually slows down. Meanwhile, the inflection point gradually moves closer to the new tunnel axis, and the rate of approach decreases with time. These findings can provide a basis for predicting and evaluating the impact of crossing under different geological conditions.

5.2. Dimensions and Spatial Layout of the Tunnels

The diameter of the existing tunnel (D1), the diameter of the new tunnel (D2), the depth of the existing tunnel (H1), and the spacing between the two tunnels (ΔH) are specified as variables to study the impact of tunnel dimensions and spatial layout on the engineering project. Table 3 lists the specific working condition groups, where Group 1 represents the actual situation. It is worth noting that tunnel support stresses are adjusted according to on-site stresses while maintaining a constant difference. The definitions of all parameters are shown in Figure 11.
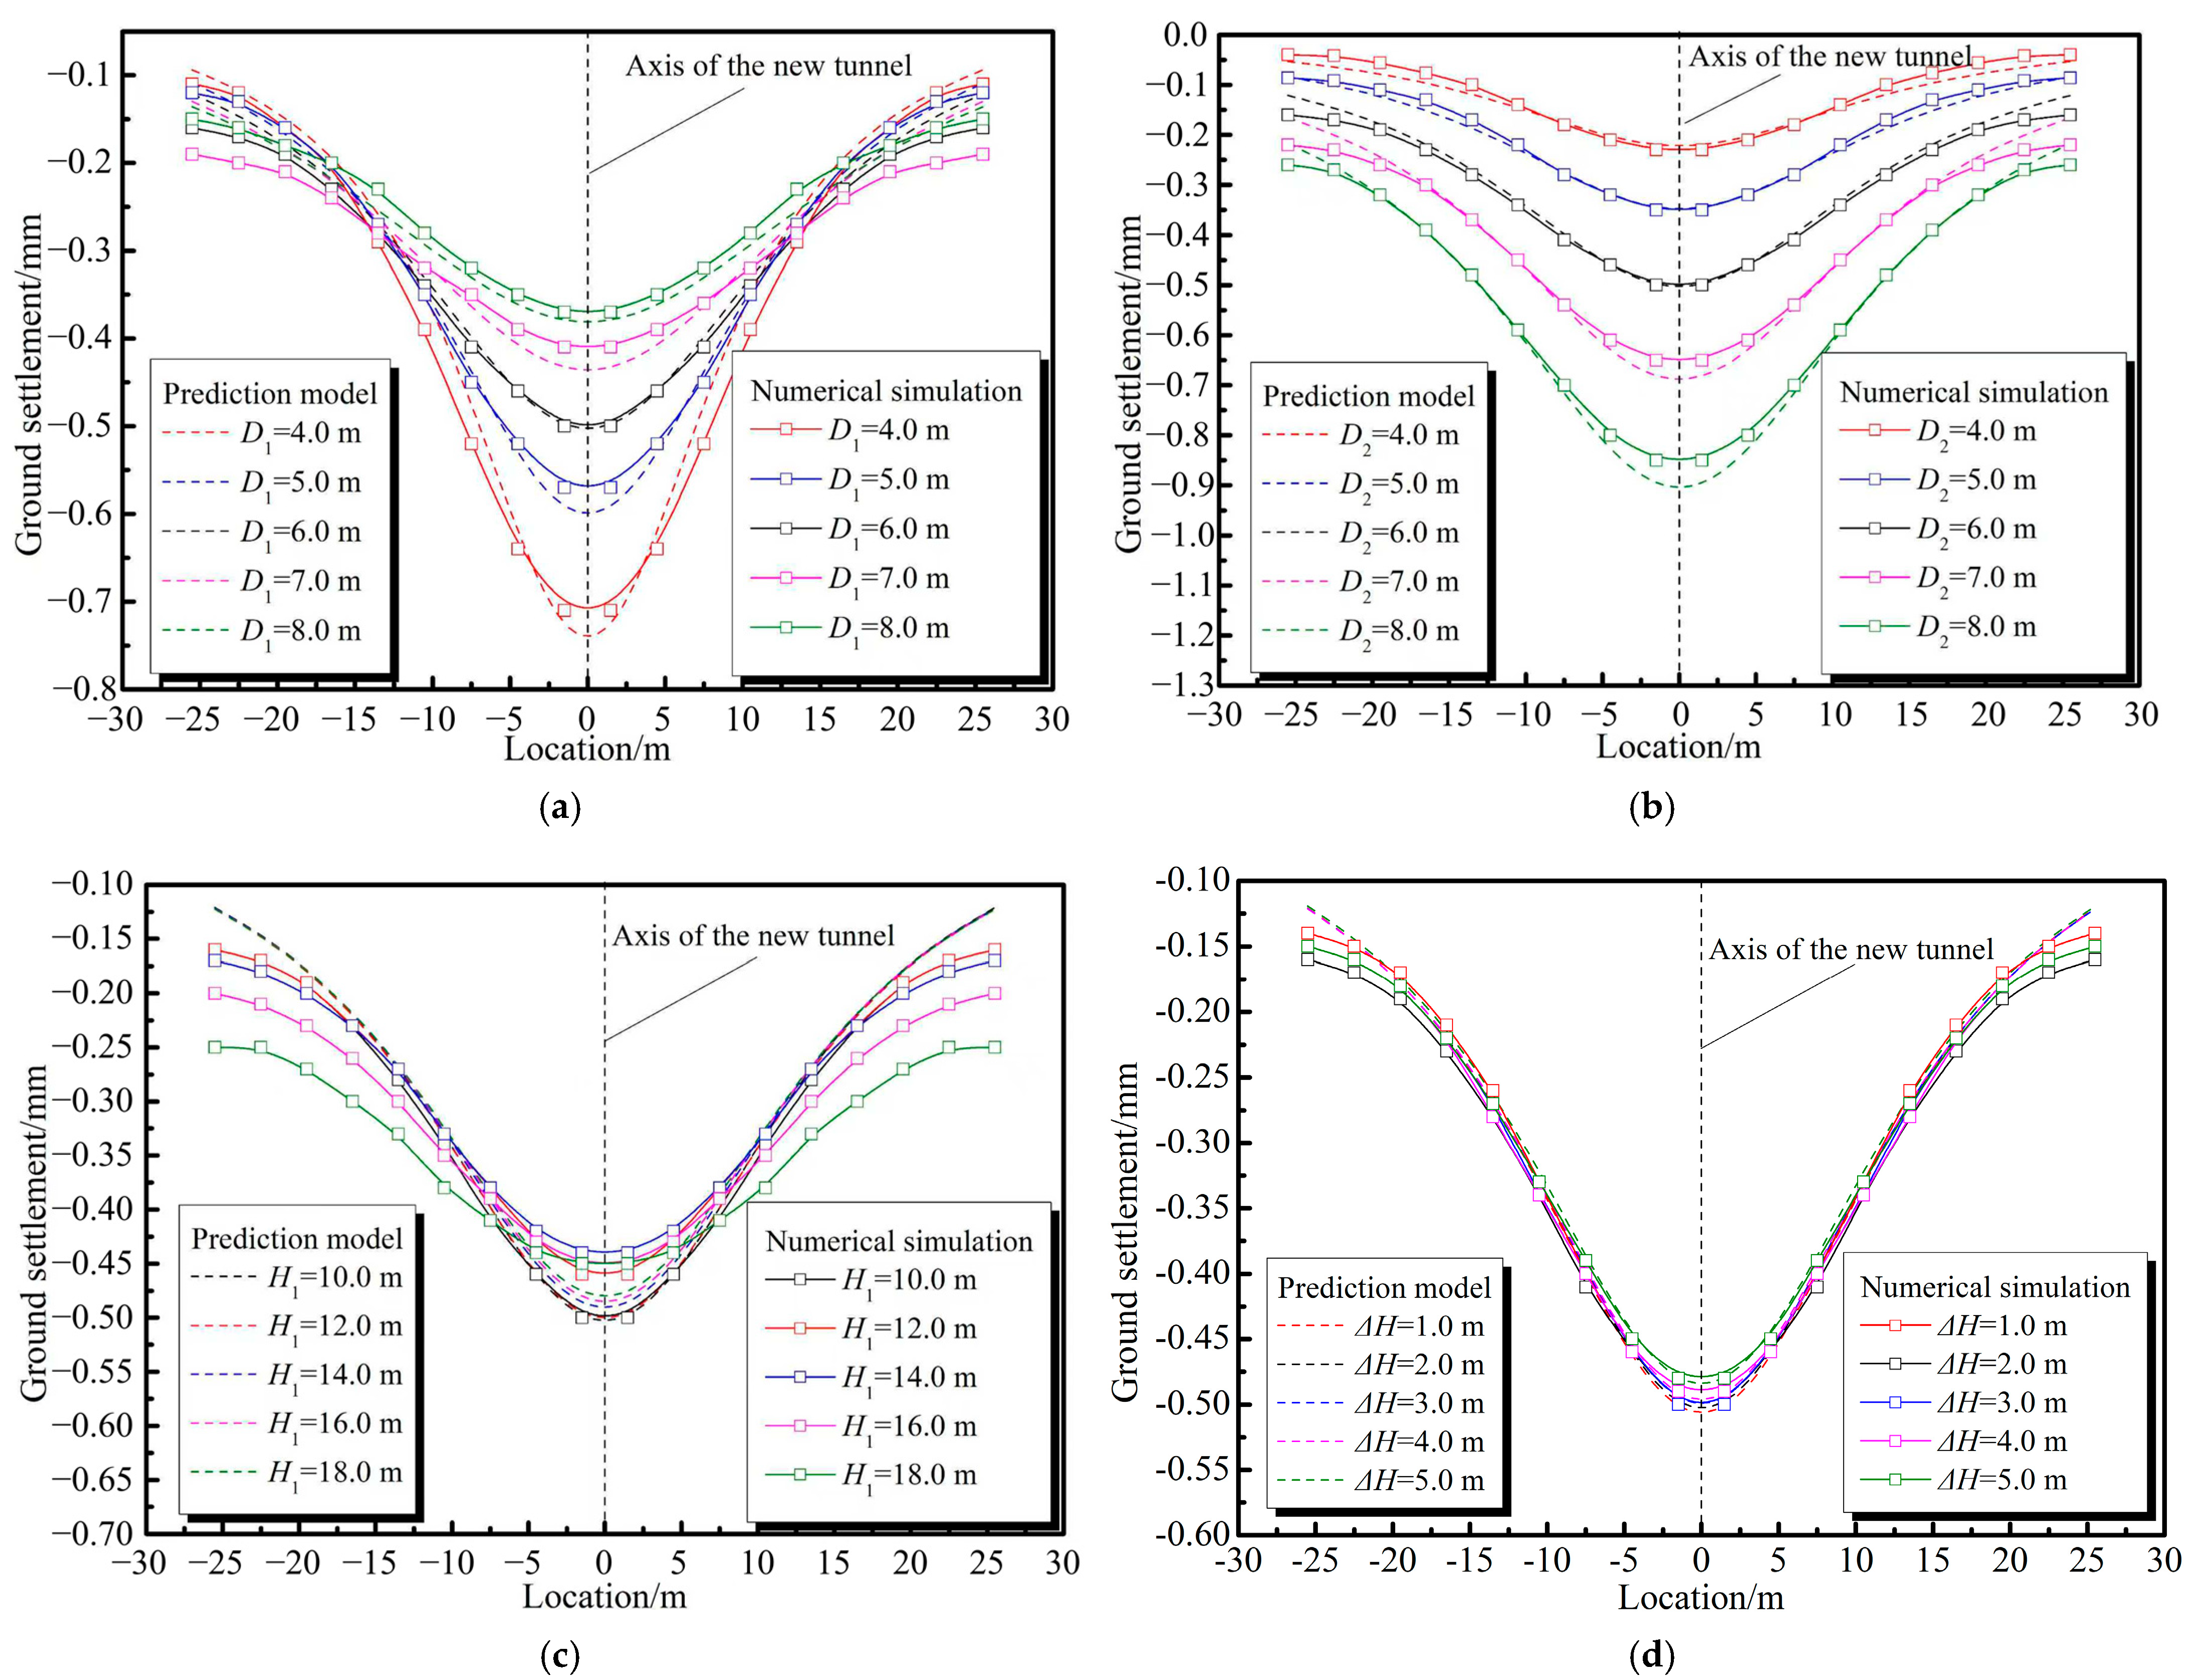
Figure 12 illustrates the ground settlement curves for various tunnel dimensions and spatial layout conditions, along with corresponding numerical simulation results for comparison and analysis. The prediction model is highly consistent with the numerical simulation results. Different parameters have a significant impact on the ground settlement curves. The diameter of existing tunnels primarily affects settlement values within approximately 15 m of the new tunnel axis. When the diameter increases from 4.0 m to 8.0 m, the maximum settlement value decreases from approximately 0.75 mm to approximately 0.35 mm. In contrast, the diameter of the new tunnel affects the entire settlement curve. As the diameter increases from 4.0 m to 8.0 m, the maximum settlement value increases from approximately 0.20 mm to 0.90 mm. However, the burial depth and spacing of the two tunnels have negligible effects on ground settlement.
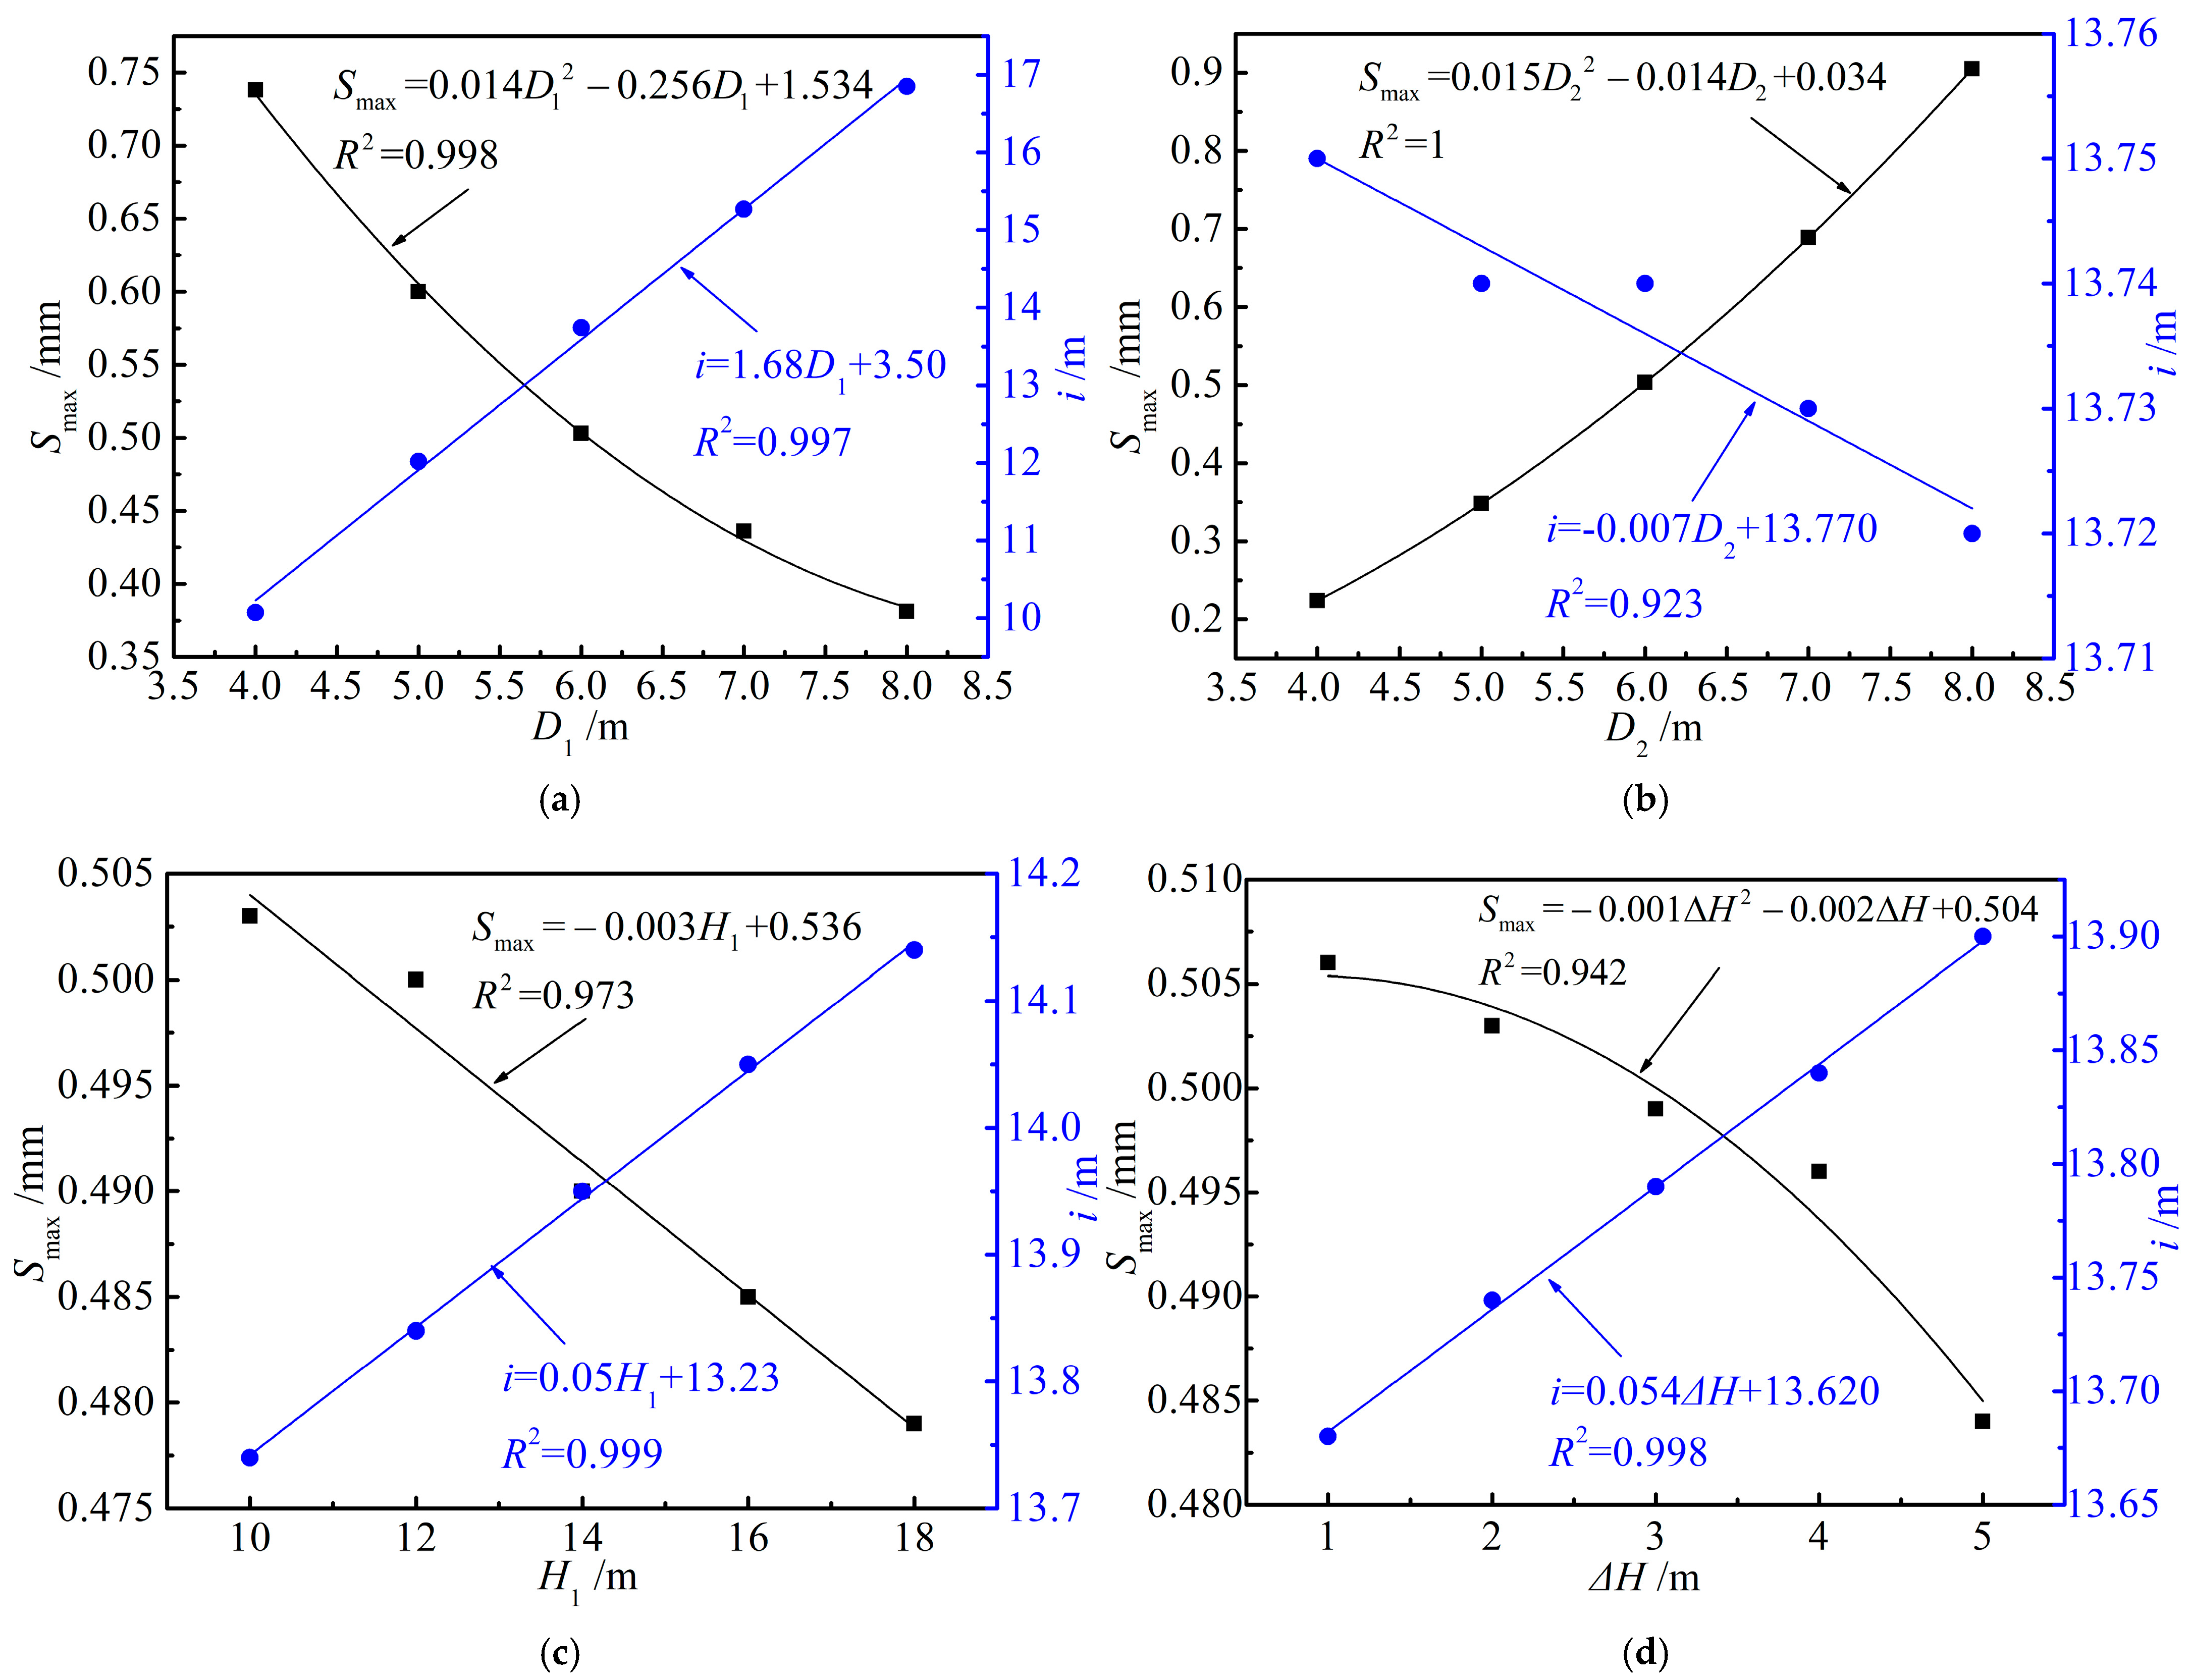
Figure 13 shows the variation patterns of Smax and i under different tunnel dimensions and spatial layouts. Overall, although various parameters have different effects on Smax and i, they consistently exhibit an apparent regularity. As D1 increases, Smax shows a quadratic trend with an upward concavity, and the amplitude gradually decreases, while i shows a linear increase. As D2 increases, Smax also exhibits an upward concave quadratic decrease trend, but with a steeper gradient compared to D1. In contrast, i decreases linearly, albeit with a significantly smaller decrease. As H1 increases, Smax exhibits a linear decreasing trend, but the amplitude is significantly smaller than in the previous two cases, while i increases linearly at a moderate rate. Finally, as ΔH increases, Smax exhibits a concave-up quadratic trajectory with gradually decreasing amplitude similar to H1, while i increases linearly at a rate comparable to that of H1. In actual engineering, when a large-diameter new tunnel crosses an existing small-diameter tunnel, special attention should be paid to the ground settlement values above the crossing section. Conversely, if both sides are large-diameter tunnels, the crossing scenario may expand the overall range of ground settlement influence.

5.3. Adaptability of the Prediction Model

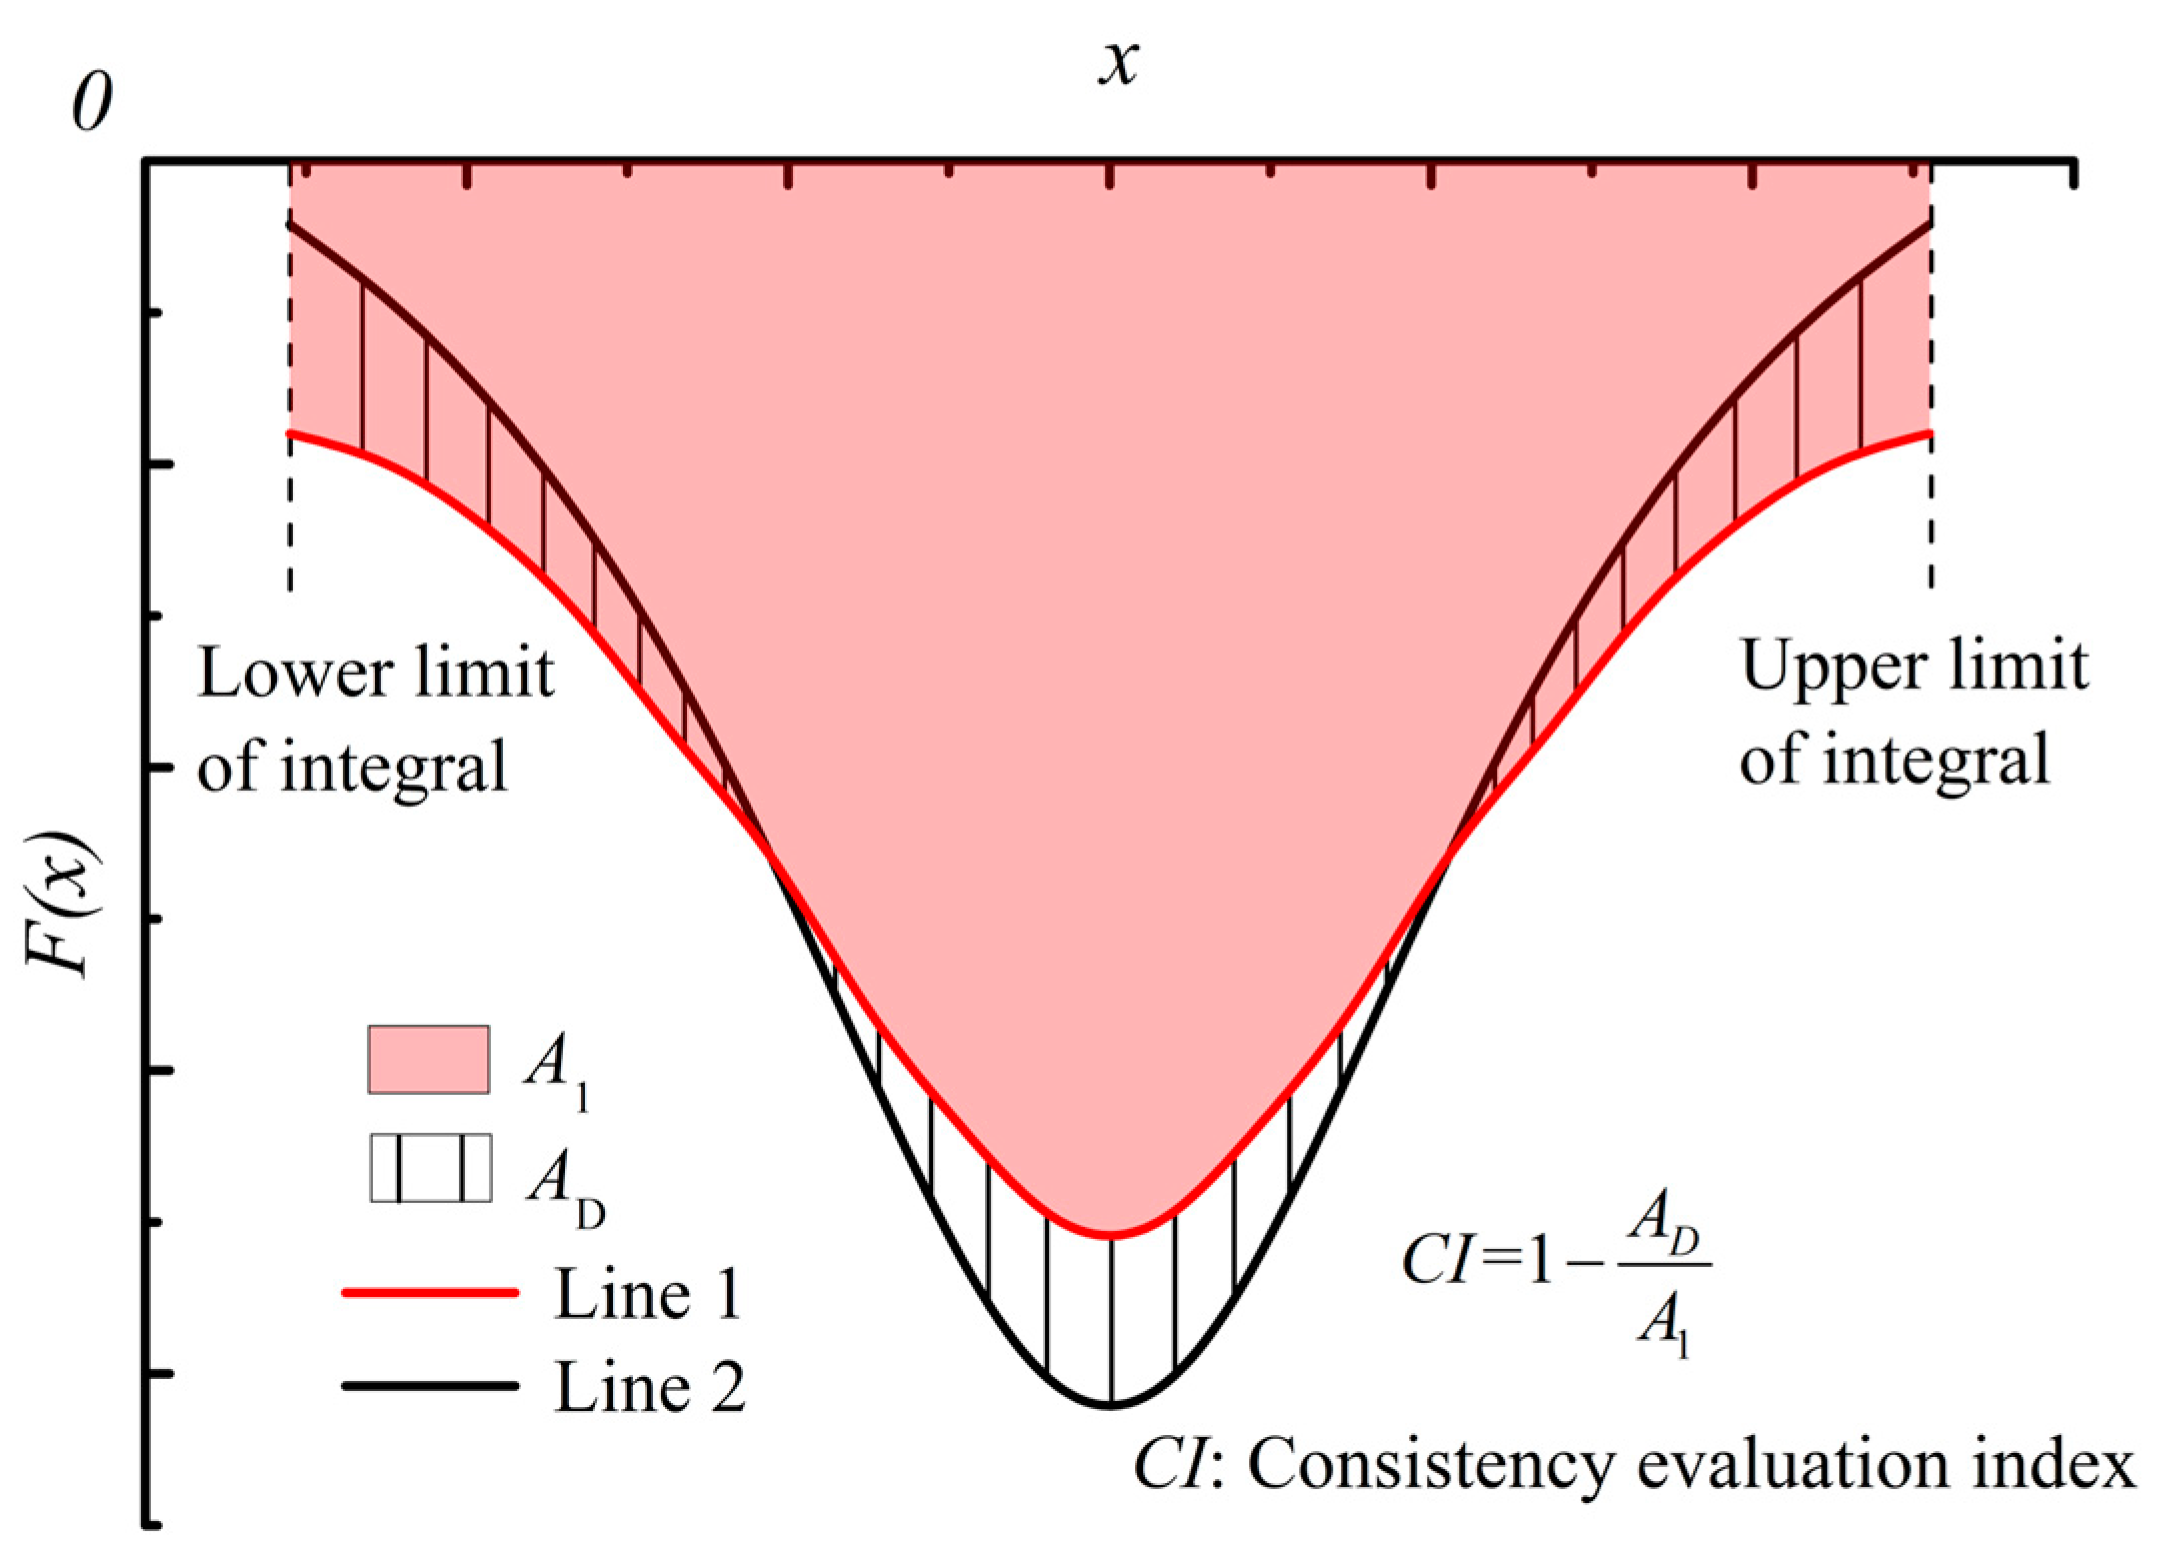
To quantitatively evaluate the consistency between the prediction model and numerical simulation results, the following evaluation method was adopted: For two curves with the same functional form, calculate the integral of the absolute difference between them, divide this value by the integral of one of the curves, and subtract the resulting ratio from 1. The resulting metric is referred to as the consistency evaluation index (CI), which quantifies consistency—the higher the CI value, the stronger the consistency; conversely, the lower the CI value, the weaker the consistency. Figure 14 illustrates the evaluation method.
Table 4 presents the CI of ground settlement curves obtained using the prediction model and numerical simulation under different operating conditions. Since the purpose of this consistency evaluation is to assess the agreement between the proposed prediction model and numerical simulation results, it is more conventional to designate A1 as the numerical simulation results and A2 as the prediction model results. In fact, as intuitively reflected in Figure 12, the prediction model’s results are very close to those of the numerical simulation. Therefore, whether A1 or A2 is used as the reference has little impact on the results.
Clearly, the prediction model and numerical simulation results exhibit good consistency under all operating conditions, with CI values primarily concentrated around 0.95 and nearly all exceeding 0.9. This indicates that the model shows high robustness and accuracy in predicting ground settlement resulting from the orthogonal crossing of the new and existing tunnels. However, there are slight differences in CI values under different conditions, especially in overly soft or hard rock layers, where CI values tend to be lower. As shown in Figure 9, the primary source of these differences lies in minor deviations in curve shapes: the prediction model exhibits a smoother settlement curve in soft rock layers and a steeper curve in hard rock layers. To enhance the prediction accuracy of ground settlement patterns, the correction coefficient A can be redefined as a function dependent on rock layer conditions. The model demonstrates excellent accuracy in predicting settlement behavior under different tunnel dimensions and spatial layouts. However, when the existing tunnel burial depth is deep (H1 ≥ 16 m), the CI value is below 0.9. As shown in Figure 12c, this is primarily due to significant deviations in the wing regions of the curve edges, indicating that the prediction model may introduce errors at locations farther from the crossing point in deep burial crossing scenarios.

6. Engineering Case Verification

In this section, a model test was designed based on actual engineering cases to verify the applicability of the prediction model.

6.1. Engineering Background

A tunnel in Chongqing crosses the Jialing River and the Yangtze River, connecting the Yuzhong Peninsula with Jiangbei and Nan’an Districts in a planar “Y” configuration (Figure 15). The project includes six parallel lines and five closely spaced interchanges. This study focuses on a specific section where the newly constructed tunnel intersects the existing tunnel at right angles. The new tunnel is buried at a depth of 43 m, with a clear distance of 8.25 m between the two tunnels. Both tunnels feature a three-center arch cross-section, measuring 11 m in width, 8.6 m in height, and 77.84 m2 in cross-sectional area. Excavation was carried out using the drill-and-blast method, with composite lining. The geological strata in the study section primarily consist of Grade IV sandy mudstone (approximately 95%), with localized interlayers of Grade III sandstone (approximately 5%).

6.2. Model Test Process

Based on rigorous derivations from similarity theory, carefully designed test protocols, and strict program execution, indoor similarity model tests can accurately reproduce the unloading effects and ground disturbance caused by tunnel excavation [39,40]. Due to the lack of field monitoring data, similar model tests were designed to obtain the deformation and mechanical response patterns of the tunnel and surrounding rock when a new tunnel undercrosses an existing tunnel. Additionally, considering the test effectiveness, an appropriate weakening treatment was applied to the relatively hard Grade III–IV surrounding rock.
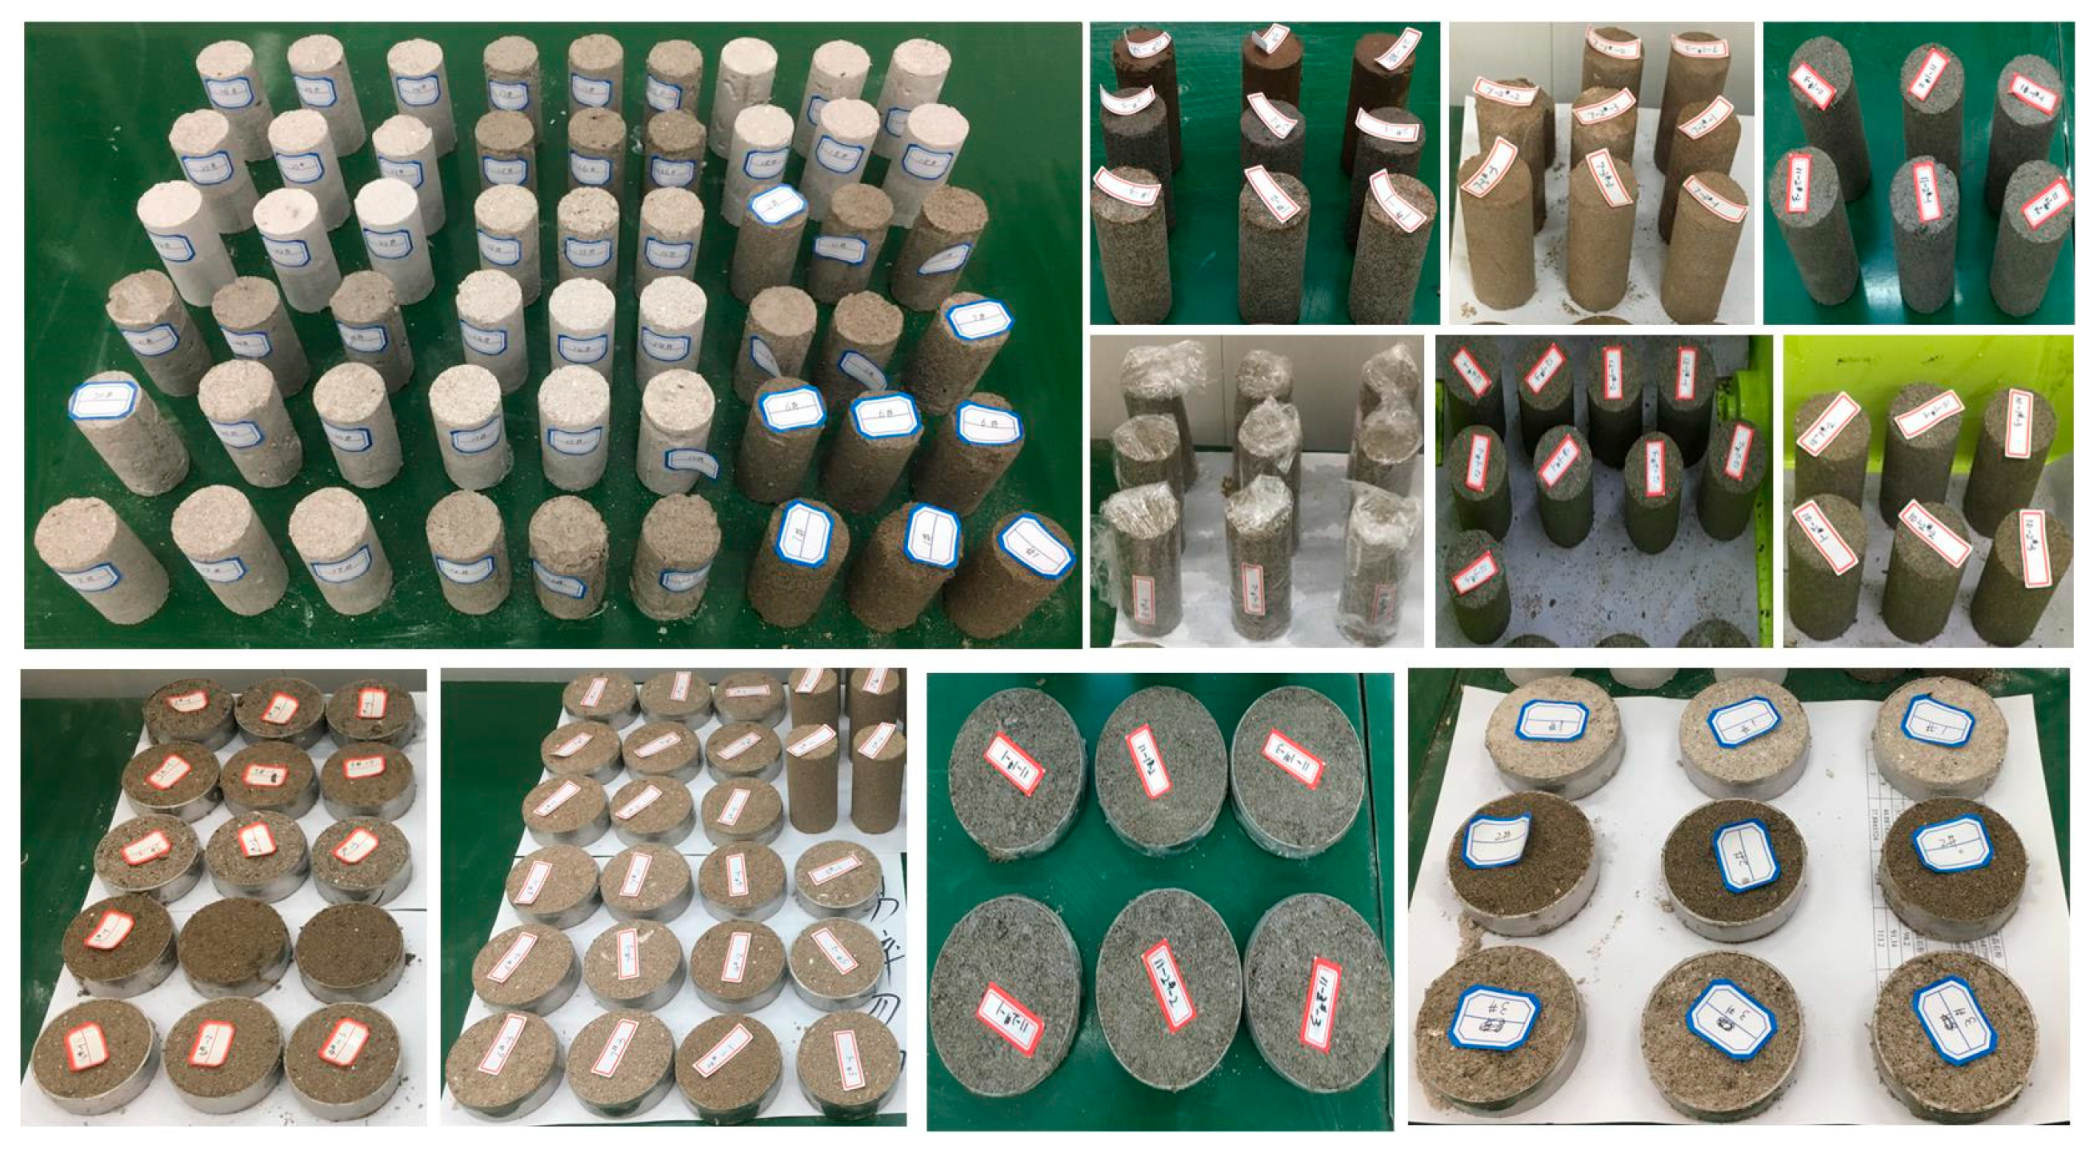
The geometric similarity ratio CL = 85 was determined after careful consideration of the test conditions and expected results. Other similarity ratios were derived strictly based on the principles of similarity theory. However, due to space limitations, the detailed derivation process is omitted here. According to similarity theory, the remaining ratios are determined as follows: unit weight similarity ratio Cγ = 1.27; Poisson’s ratio, strain, and friction angle similarity ratios Cμ = Cε = Cφ = 1; Strength, stress, cohesion, and elastic modulus similarity ratios CR = Cσ = Cc = CE = 107.95; and lining bending stiffness similarity ratio CD = 614,125. A similar material was prepared using gypsum, quartz sand, barite powder, and water. Approximately 120 test specimens were prepared to calibrate the material parameters (Figure 16). The optimized material ratio was gypsum: quartz sand: barite powder: water = 0.03:0.67:0.24:0.06. The physical and mechanical properties of the similar materials prepared according to this ratio, as well as the properties of the original material, are shown in Table 5.
The dimensions of the model test apparatus are 2000 mm × 900 mm × 1400 mm (length × width × height). The left, right, rear, and bottom sides of the test chamber are constructed from 5 mm thick steel plates, reinforced with angle iron. A viewing window measuring 1400 mm × 1000 mm (length × height) is installed on the front side, fitted with a 10 mm thick acrylic glass panel for visual monitoring. In the model test, the tunnel cross-section adopts a three-center arch structure, with an arch width of 130 mm, an arch height of 100 mm, a clear distance of 100 mm between the two tunnels, and a new tunnel burial depth of 500 mm. The original tunnel length is 2000 mm, and the new tunnel length is 900 mm. Only the primary support structures were simulated in the test, with the secondary lining serving as a safety reserve. Based on the similarity ratio of the bending stiffness of the lining, 0.9 mm-thick stainless steel plates were selected to simulate the lining. The model test chamber and its dimensions are shown in Figure 17, which also indicates the layout of the measurement points, spaced 300 mm apart and located directly above the existing tunnel.
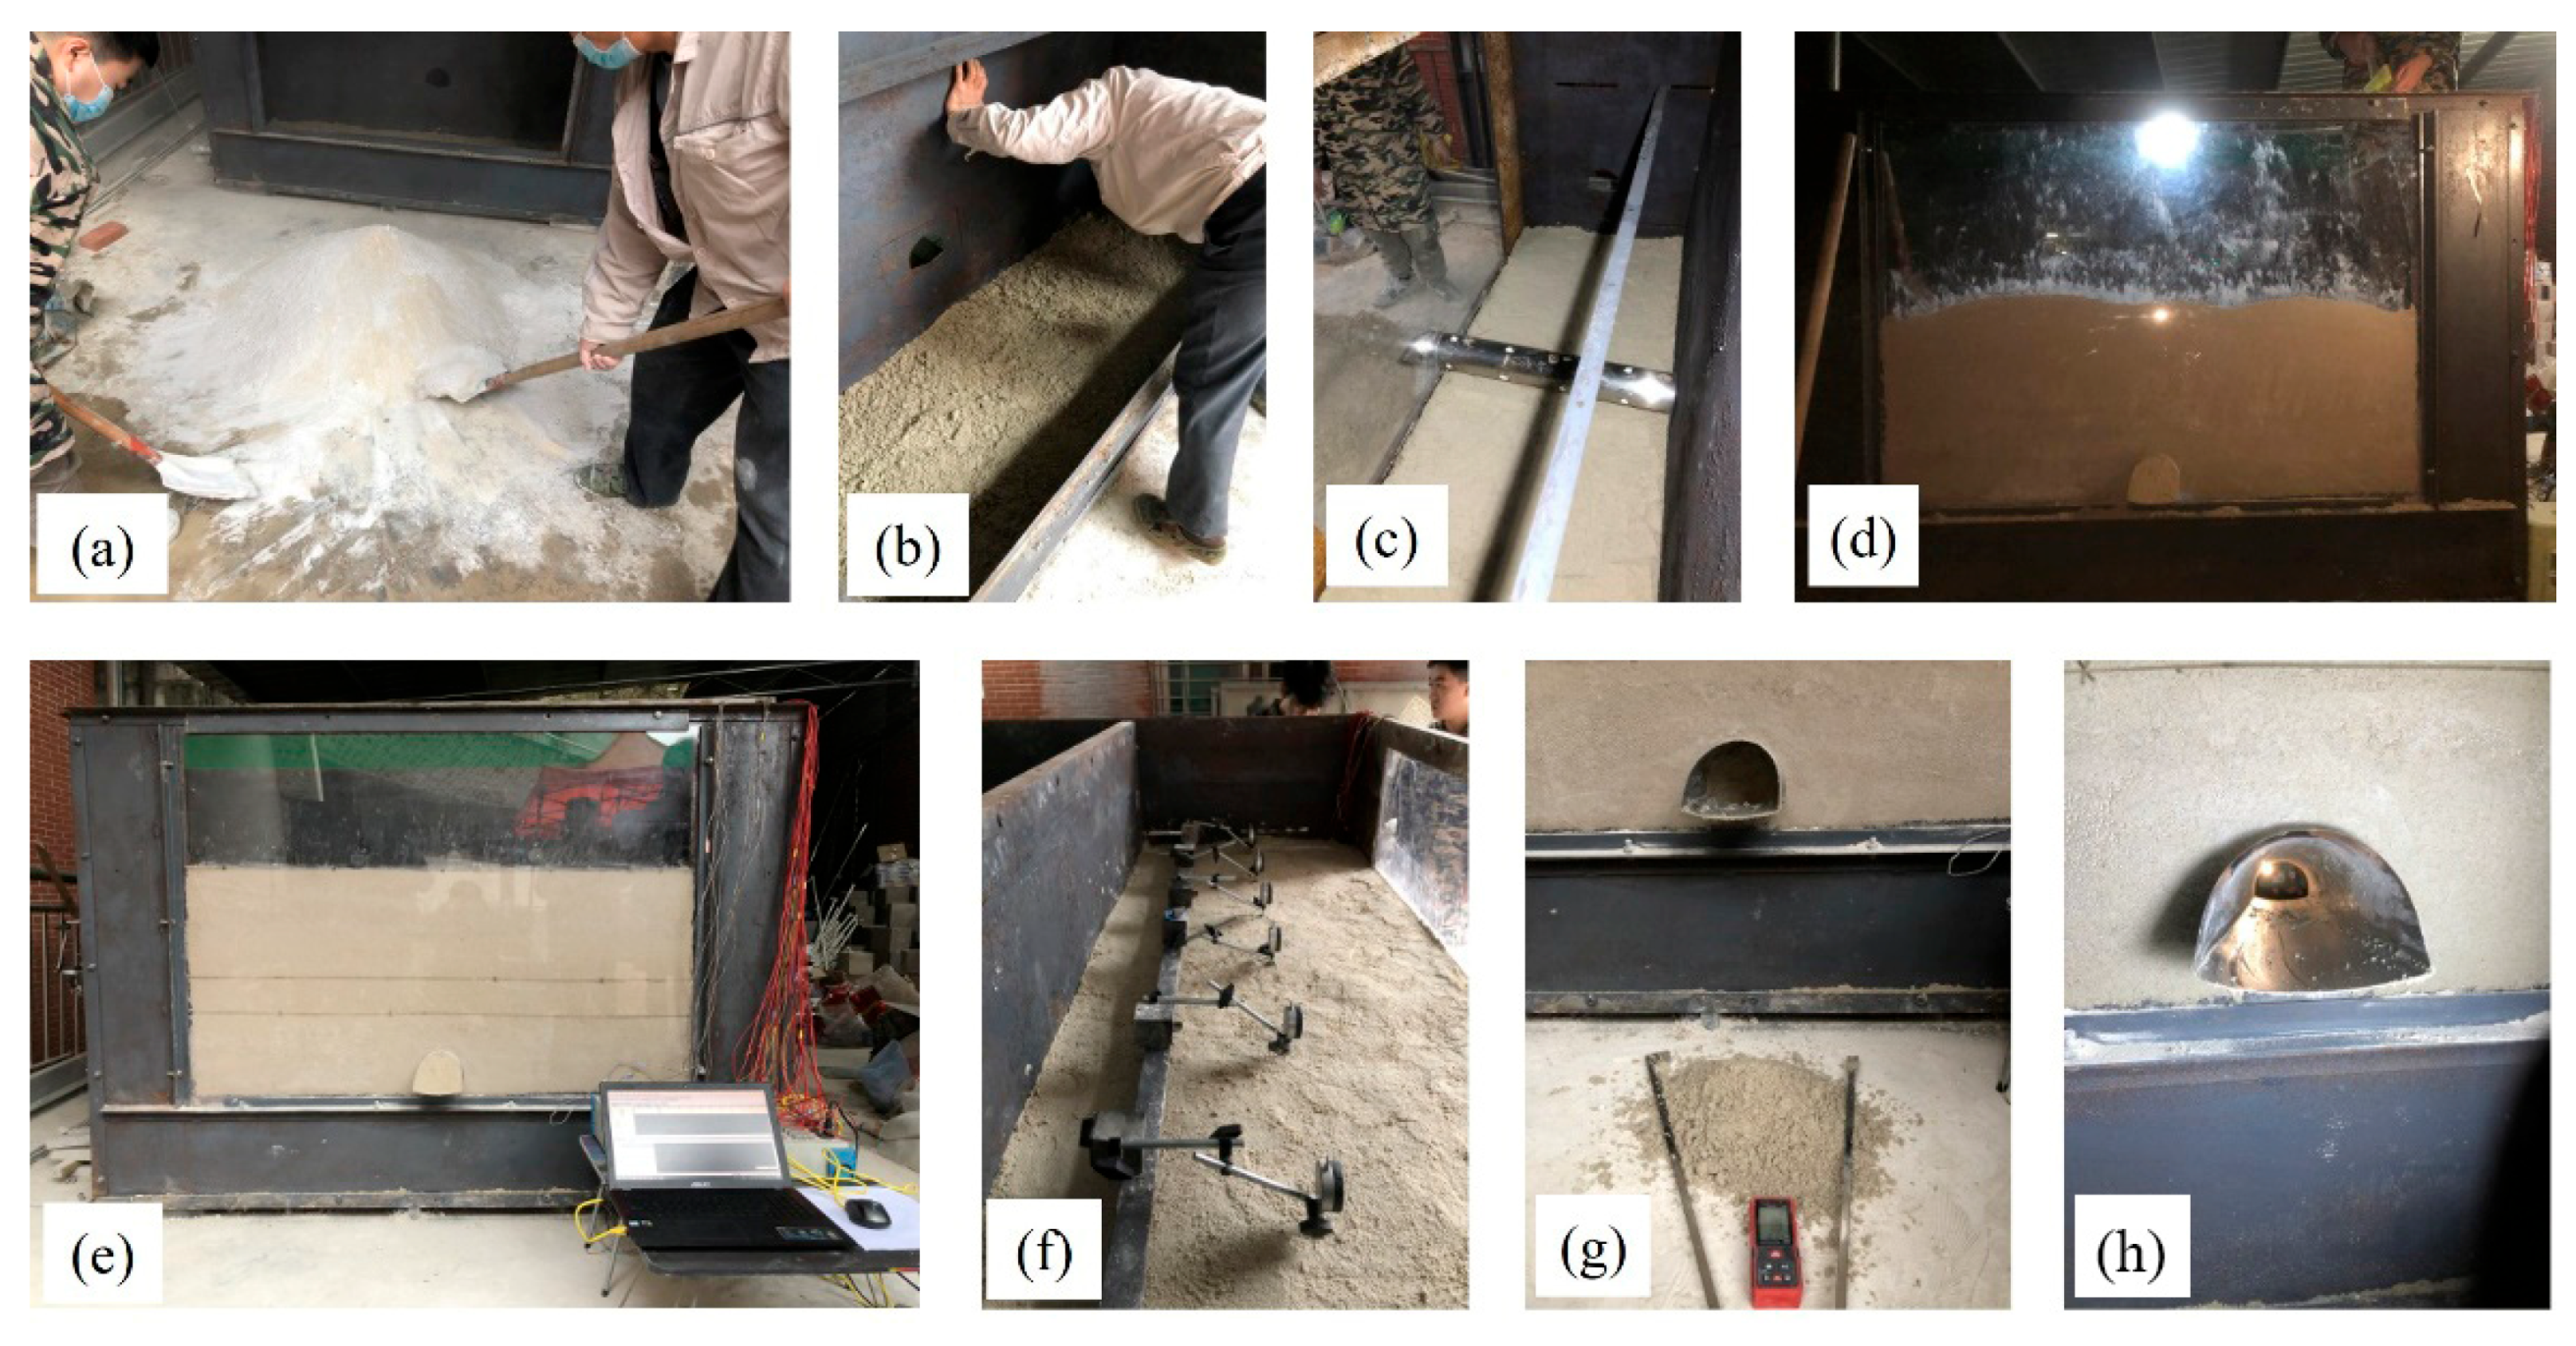
The model test processes are shown in Figure 18. During the test, the same material was continuously filled in 12 layers, with compaction performed after each layer to ensure uniform density. When the filling reached the tunnel bottom elevation, the tunnel was inserted through the opening reserved in the model box wall and extended to the other side, thereby exposing it and completing the embedding. After the material was filled, a 2-day curing period followed, after which excavation operations commenced. Digital dial gauges fixed to the monitoring frame via a magnetic base were used to measure ground settlement. Self-made excavation equipment was used to excavate the new tunnel, including two special long-handle shovels and a laser rangefinder, which was used to measure the excavation depth of each step. The tunnel was advanced in increments of 5 cm in depth. After each excavation increment, work was halted for 10 min to allow the tunnel and surrounding strata to deform fully. The dial gauge must be reset to zero before testing begins, and readings were recorded before each subsequent excavation step.
In addition to ground settlement, the test also monitored the deformation of the existing tunnel, the earth pressure around the two tunnels, and the strain in the surrounding areas. However, since this paper focuses only on ground settlement directly above the existing tunnel, the analysis of other monitoring parameters is omitted here.

6.3. Results and Verification

Figure 19 shows the ground settlement data monitored directly above the existing tunnel during the model test. Based on the excavation progress, the test phase is divided into Stages 1 to 5, with the distance values reflecting the actual engineering proportions.
Stage 1: The new tunnel excavation begins (excavation depth in the model test is 0 cm).
Stage 2: The new tunnel is located 17 m ahead of the existing tunnel axis (excavation depth in the model test is 25 cm).
Stage 3: The new tunnel is directly below the existing tunnel (excavation depth in the model test is 45 cm).
Stage 4: The new tunnel advances to a distance of 17 m from the axis of the existing tunnel (excavation depth in the model test is 65 cm).
Stage 5: Excavation of the new tunnel is complete (the excavation depth in the model test is 90 cm).
Meanwhile, after the new tunnel was excavated, the prediction model was used to calculate the settlement of the ground above the existing tunnel, as shown in Figure 19. The parameter calculation process is the same as described earlier and will not be repeated here. For the sake of direct comparison, the ground settlement values obtained from the model test were converted to actual engineering quantities using geometric similarity ratios.
As shown in the observations, no ground settlement occurred directly above the existing tunnel during Stages 1 and 2. When the new tunnel reached directly below the existing tunnel (Stage 3), settlement began to occur, with a maximum value of 0.17 mm, immediately appearing directly above the axis of the new tunnel. After the new tunnel passes through the existing tunnel, settlement of the poor foundation within approximately 50 m on both sides of the new tunnel axis continues to worsen, eventually reaching approximately 0.765 mm. The final ground settlement curve derived from the prediction model is highly consistent with the model test results, with a consistency evaluation index (CI) of 0.800. This confirms the model’s accuracy in predicting ground settlement above the existing tunnel caused by the new tunnel’s orthogonal undercrossing.

7. Discussion

7.1. Applicability of the Double-Track Tunnel Undercrossing Problems

The prediction model proposed in this paper was primarily researched and validated for scenarios where a new single-track tunnel undercrosses an existing single-track tunnel. However, its applicability can be extended to double-track tunnel undercrossing situations. Double-track tunnel undercrossing can be categorized into three types: (1) a new double-track tunnel undercrossing an existing single-track tunnel; (2) a new single-track tunnel undercrossing an existing double-track tunnel; (3) A new double-track tunnel crossing an existing double-track tunnel. For case (1), the new double-track tunnel can be regarded as the superposition of two single-track tunnels. The settlement curve may change from a “U” shape to a ‘W’ shape, but the influence of the existing tunnel may weaken the “W” trend. By adjusting parameters of the equivalent layer method and the mirroring method (such as equivalent stiffness and geometric relationships), the model can theoretically be applied to this scenario.
However, for scenarios (2) and (3), the presence of the existing double-track tunnel introduces complex spatial interactions. The superposition effects of settlement curves along the axis of the existing tunnel and in the perpendicular direction must be considered. The current model simplifies tunnels into strata using the equivalent layer method, failing to adequately account for the transition between the double-track tunnel and intermediate strata. This limitation prevents direct resolution of Scenarios (2) and (3).
Future research will focus on validating the model’s applicability in case (1) and exploring improvement strategies for cases (2) and (3).

7.2. Applicability in Non-Vertical Undercrossing Problems

The prediction model proposed in this paper was primarily developed and validated for vertical undercrossing scenarios, employing a combination of the equivalent layer method and the mirroring method to calculate ground settlement. However, non-vertical undercrossing introduces complex spatial and geometric relationships, as well as asymmetric stress distributions. Existing models lack cross-angle parameters, making them difficult to apply directly.
To address this issue, introducing an angle-dependent correction function can adjust the asymmetry in axial deformation and settlement curves of existing tunnels. This correction function can be derived through regression analysis of extensive field monitoring data or combined with numerical simulations to capture the impact of angular variations on settlement.
Future research will explore the incorporation of angle-dependent terms into the mirroring method and validate the model’s adaptability through practical non-vertical underpass cases, thereby expanding its application scope.

8. Conclusions

By combining the equivalent layer method with the mirror method, a prediction model was preliminarily proposed for directly estimating ground settlement caused by a new tunnel crossing beneath an existing tunnel at right angles. The model was subsequently modified in light of the significant discrepancy with reality. Parameter analysis was conducted using the modified prediction model, and its applicability was evaluated through comparison with corresponding numerical simulations. Based on an actual engineering case, indoor similarity model tests were designed to validate the practicality of the prediction model in engineering applications. The main conclusions are as follows:
  • In cases where a new tunnel undercrosses an existing tunnel, the significant stiffness of the existing tunnel interacts with the foundation settlement, resulting in a flatter settlement curve and a reduction in the maximum settlement value directly above it. The classic Peck formula does not account for the presence of existing tunnels when calculating foundation settlement, leading to significant errors in the results.
  • Based on the equivalent layer method and the mirror method, the preliminary proposed ground settlement prediction model has the advantages of simple formulas, clear parameters, and high computational efficiency. Compared to the Peck formula, this model considers the influence of existing tunnels on ground settlement; however, it overestimates the stiffness difference between the tunnel and the surrounding strata, as well as the overall deformation capacity of the tunnel lining.
  • The modified prediction model retains the advantages of the original model while introducing a correction coefficient A to optimize the calculation results, thereby enabling a more reasonable assessment of the impact of existing tunnels on ground settlement. Compared with the Peck formula and the preliminary prediction model, this model has significantly improved prediction accuracy.
  • The elastic modulus of the strata has a minor influence on the shape of the ground settlement curve but a significant impact on the magnitude of settlement. Softer strata result in greater settlement at all locations. The diameter of existing tunnels primarily affects settlement within approximately 15 m of the new tunnel axis, with settlement values decreasing gradually as the diameter increases. Conversely, the diameter of the new tunnel determines the overall shape of the settlement curve; the larger the tunnel diameter, the more pronounced the settlement amplitude will be. The burial depth of existing tunnels and the spacing between tunnels have negligible effects on settlement. Consistency assessments confirm that the prediction model exhibits strong adaptability under various conditions (CI > 0.9).
  • When the new tunnel is directly located below the existing tunnel, ground settlement begins to occur, with a maximum settlement of 0.17 mm. After the new tunnel passes the existing tunnel, ground settlement continues to increase within approximately 50 m on either side of the new tunnel axis, eventually reaching approximately 0.765 mm. The consistency evaluation results indicate that the prediction model demonstrates good application effectiveness in actual engineering projects.

Author Contributions

Conceptualization, L.W. and X.Z.; methodology, X.Z. and X.L.; software, L.W.; writing—original draft preparation: L.W.; Data Curation, L.W.; writing—review and editing, X.Z. and W.Y.; funding acquisition, X.Z.; resources, X.L.; project administration, X.L. All authors have read and agreed to the published version of the manuscript.

Funding

The research described in this paper was financially supported by the National Natural Science Foundation for Young Scientists of China (52104076).

Data Availability Statement

The data will be made available upon request.

Conflicts of Interest

The authors declare that they have no conflicts of interest.

References

  1. Lu, K.; Zhang, L.; Li, S.; Huang, Y.P.; Ding, X.; Hao, J.N.; Huang, S.Q.; Li, X.J.; Lu, F.; Zhang, H.W. Urban Rail Transit in China: Progress Report and Analysis (2015–2023). Urban Rail Transit 2025, 11, 1–27. [Google Scholar] [CrossRef]
  2. Ding, Z.; Zhang, M.B.; Zhang, X.; Wei, X.J. Theoretical analysis on the deformation of existing tunnel caused by under-crossing of large-diameter slurry shield considering construction factors. Tunn. Undergr. Space Technol. 2023, 133, 104913. [Google Scholar] [CrossRef]
  3. Zhou, Z.; Zheng, Y.D.; Hu, J.F.; Yang, H.; Gong, C.J. Deformation analysis of shield undercrossing and vertical paralleling excavation with existing tunnel in composite stratum. J. Cent. South. Univ. 2023, 30, 2238–2246. [Google Scholar] [CrossRef]
  4. Yang, Z.P.; Cheng, Z.K.; Wu, D. Deep learning driven prediction and comparative study of surrounding rock deformation in high speed railway tunnels. Sci. Rep. 2025, 15, 24104. [Google Scholar] [CrossRef]
  5. Zhang, J.C.; Yu, J.C.; Li, C.J.; Liu, Y.Z.; Tian, L.G.; He, Y.L.; Zhang, Q. Deformation and reinforcement of the existing tunnel affected by new shield tunnel construction with small clearance. Buildings 2025, 15, 265. [Google Scholar] [CrossRef]
  6. Lai, H.P.; Zheng, H.W.; Chen, R.; Kang, Z.; Liu, Y. Settlement behaviors of existing tunnel caused by obliquely under-crossing shield tunneling in close proximity with small intersection angle. Tunn. Undergr. Space Technol. 2020, 97, 103258. [Google Scholar] [CrossRef]
  7. Fang, Q.; Zhang, D.L.; Li, Q.Q.; Wong, L.N.Y. Effects of twin tunnels construction beneath existing shield-driven twin tunnels. Tunn. Undergr. Space Technol. 2015, 45, 128–137. [Google Scholar] [CrossRef]
  8. Feng, Z.B.; Wang, J.Y.; Liu, W.; Li, T.J.; Wu, X.G.; Zhao, P.X. Data-driven deformation prediction and control for existing tunnels below shield tunneling. Eng. Appl. Artif. Intel. 2024, 137, 109379. [Google Scholar] [CrossRef]
  9. Dong, M.; Guan, M.Z.; Wang, K.H.; Wu, Y.Y.; Fu, Y.H. Machine learning-based measurement and prediction of ground settlement induced by shield tunneling undercrossing existing tunnels in composite strata. Sensors 2025, 25, 1600. [Google Scholar] [CrossRef]
  10. Liu, Z.Y.; Xue, J.F.; Ye, J.Z.; Qian, J.G. A simplified two-stage method to estimate the settlement and bending moment of upper tunnel considering the interaction of undercrossing twin tunnels. Transp. Geotech. 2021, 29, 100558. [Google Scholar] [CrossRef]
  11. Li, Y.F.; Huang, C.F.; Lu, H.J.; Mou, C. Deformation prediction model of existing tunnel structures with equivalent layered method–Peck coupled under multiple factors. Mathematics 2024, 12, 1479. [Google Scholar] [CrossRef]
  12. Yao, J.Q.; Nie, J.J.; Li, C.F. Research on prediction of surrounding rock deformation and optimization of construction parameters of high ground stress tunnel based on WOA-LSTM. Sci. Rep. 2024, 14, 27396. [Google Scholar] [CrossRef] [PubMed]
  13. Chang, J.Q.; Thewes, M.; Zhang, D.M.; Huang, H.W.; Lin, W. Deformational behaviors of existing three-line tunnels induced by under-crossing of three-line mechanized tunnels: A case study. Can. Geotech. J. 2025, 62, 23. [Google Scholar] [CrossRef]
  14. Ahmed, N.Z.; El-Shourbagy, M.; Akl, A.; Metwally, K. Field monitoring and numerical analysis of ground deformation induced by tunnelling beneath an existing tunnel. Cogent. Eng. 2021, 8, 1861731. [Google Scholar] [CrossRef]
  15. Liu, S.G.; Wang, Y.H.; Zhou, H.; Sun, C.Z.; Lin, D.F. Model test on approaching the construction of multi-line overlapping shield tunnels for up- and down-crossing. Processes 2022, 10, 500. [Google Scholar] [CrossRef]
  16. Cai, Q.P.; Elbaz, K.; Guo, X.Y.; Ding, X.M. Physics-informed deep learning and analytical patterns for predicting deformations of existing tunnels induced by new tunnelling. Comput. Geotech. 2025, 187, 107451. [Google Scholar] [CrossRef]
  17. Zhou, Z.; Chen, Y.; Liu, Z.Z.; Miao, L.W. Theoretical prediction model for deformations caused by construction of new tunnels undercrossing existing tunnels based on the equivalent layered method. Comput. Geotech. 2020, 123, 103565. [Google Scholar] [CrossRef]
  18. Liu, X.R.; Wang, L.F.; Zhou, X.H.; Wang, J.M.; Zhong, Z.L.; Liu, P.; Xiong, F.; He, C.M. E-M calculation model and its application of calculating deformation in a new tunnel orthogonally undercrossing an existing tunnel. Tunn. Undergr. Space Technol. 2022, 123, 104418. [Google Scholar] [CrossRef]
  19. Hiroyoshi, H. Settlements and stresses of multi-layered grounds and improved grounds by equivalent elastic method. Int. J. Numer. Anal. Met. 2008, 32, 523–557. [Google Scholar] [CrossRef]
  20. Bao, L.L.; Wei, F. Impact mechanism of shallow buried soft rock tunnel excavation on existing highways and pipe-shed reinforcement effect. Sci. Rep. 2024, 14, 3401. [Google Scholar] [CrossRef]
  21. Verruijt, A.; Booker, J.R. Ground settlements due to deformation of a tunnel in an elastic half plane. Geotechnique 1996, 46, 753–756. [Google Scholar] [CrossRef]
  22. González, C.; Sagaseta, C. Patterns of soil deformations around tunnels. Application to the extension of Madrid Metro. Comput. Geotech. 2001, 28, 445–468. [Google Scholar] [CrossRef]
  23. Park, K.H. Analytical solution for tunnelling-induced ground movement in clays. Tunn. Undergr. Space Technol. 2005, 20, 249–261. [Google Scholar] [CrossRef]
  24. Tan, X.R.; Zhang, H.; Zhang, G.; Zhu, Y.M. An improved method for predicting the greenfield stratum movements caused by shield tunnel construction. Appl. Sci. 2019, 9, 4522. [Google Scholar] [CrossRef]
  25. Li, Y.; Bian, X.W.; Peng, H.; Zhu, B.Q.; Zhou, Y.L. Additional stress of soil and surface settlement during tunnel shield construction. Buildings 2023, 13, 1437. [Google Scholar] [CrossRef]
  26. Chen, X.J.; Zhang, J.Z.; Hu, Y.; Wang, W.; Liu, Y. Random large-deformation modelling on face stability considering dynamic excavation process during tunnelling through spatially variable soils. Can. Geotech. J. 2025, 62, 280. [Google Scholar] [CrossRef]
  27. Liang, J.B. Study on the Effect of Construction of Undercrossing Shield Tunnel on the Existing Shield Tunnel. Master’s Thesis, Guangzhou University, Guangzhou, China, 2016. [Google Scholar]
  28. Itasca Consulting Group, Inc. FLAC3D: Fast Lagrangian Analysis of Continua in 3 Dimensions, version 5.0; Itasca Consulting Group, Inc.: Minneapolis, MN, USA, 2012. [Google Scholar]
  29. MIDAS Information Technology Co., Ltd. Midas-GTS NX: Geotechnical Analysis System, version 2021; MIDAS Information Technology Co., Ltd.: Seongnam-si, Republic of Korea, 2021. [Google Scholar]
  30. Guo, H.P.; Yuan, D.J.; Jin, D.L.; Ma, Q.L.; Zhao, H.Y. Theoretical analysis and numerical simulations for the safe clear distance of a shallow-buried twin-shield tunnel with small spacing. KSCE J. Civ. Eng. 2024, 28, 5277–5289. [Google Scholar] [CrossRef]
  31. Nong, X.Z.; Bai, W.F.; Yi, S.X.; Lu, Z.Z.; Lu, Y. Numerical simulation for risk assessment of tunnel construction through fault fracture zones. Buildings 2024, 14, 3161. [Google Scholar] [CrossRef]
  32. Dun, H.D.; Chen, S.; Liu, H.T.; Chen, C.; Zhang, Y.S.; Yuan, Y. Numerical simulation analysis of the stability of the construction face of a super long tunnel under conditions of precipitation and abundant water. Front. Mater. 2024, 11, 1461308. [Google Scholar] [CrossRef]
  33. Lin, X.T.; Chen, R.P.; Wu, H.N.; Chen, H.Z. Deformation behaviors of existing tunnels caused by shield tunneling undercrossing with oblique angle. Tunn. Undergr. Space Technol. 2019, 89, 78–90. [Google Scholar] [CrossRef]
  34. Peck, R.B. Deep excavation and tunneling in soft ground. In Proceedings of the 7th International Conference on Soil Mechanics and Foundation Engineering, Mexico City, Mexico, 25–29 August 1969. [Google Scholar]
  35. Gao, Y.X.; Liu, Y.W.; Tang, P.J.; Mi, C.Q. Modification of Peck formula to predict surface settlement of tunnel construction in water-rich sandy cobble strata based on visual analysis of grouting parameters. Sustainability 2022, 14, 14545. [Google Scholar] [CrossRef]
  36. Liu, Y.N.; Li, Y.F.; Chen, G.J.; Li, Y.H.; Li, J.L.; Jin, J.X. Theoretical analysis of surface settlement during parallel excavation of twin tunnels based on modified Peck formula. Buildings 2025, 15, 1143. [Google Scholar] [CrossRef]
  37. O’Reilly, M.P.; New, B.M. Settlement above tunnels in the United Kingdom-their magnitude and prediction. In Proceedings of the Tunnelling Conference, Brighton, UK, 7–11 June 1982. [Google Scholar]
  38. Wu, C.S.; Zhu, Z.D. Statistical analysis of ground loss ratio caused by different tunnel construction methods in China. J. Zhejiang Univ. (Eng. Sci.) 2019, 53, 19–30. [Google Scholar] [CrossRef]
  39. Chen, H.; Zhou, X.H.; Liu, X.R.; Lojain, S.; Xu, Q.; Ren, L.J. Study on construction mechanical characteristics and pinch rocks reinforcement schemes of honeycomb tunnel clusters in Mountainous City. Tunn. Undergr. Space Technol. 2025, 158, 106397. [Google Scholar] [CrossRef]
  40. Liu, X.R.; Suliman, L.; Zhou, X.H.; Wang, J.W.; Wang, L.F.; Abd Elmageed, A. Settlement characteristic due to excavate parallel tunnels in a fill-rock slope: Model test and numerical analysis. Rock Mech. Rock Eng. 2022, 55, 7125–7143. [Google Scholar] [CrossRef]
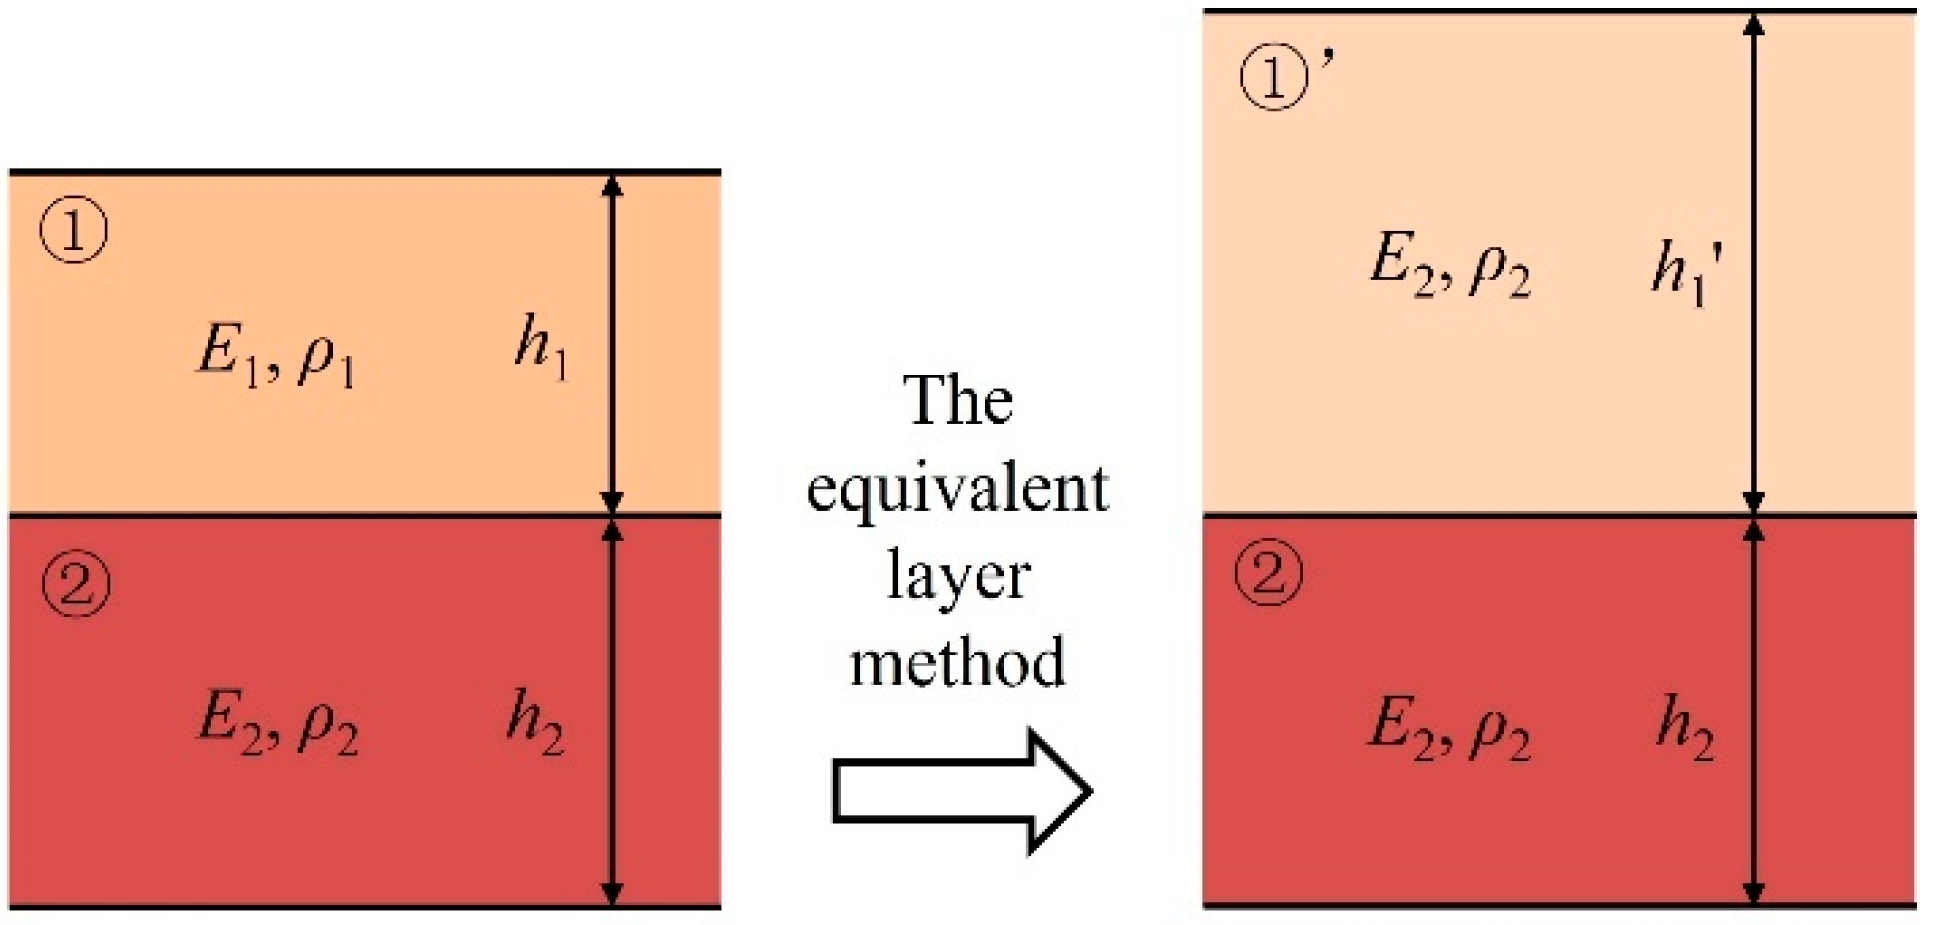
Figure 1. Parameters of the equivalent layer method (① means the upper layer, ② means the lower layer, through the equivalent layer method, the parameter of the upper layer has been changed, and indicated by ①’).
Buildings 15 03708 g001
Figure 2. Parameters of the mirror method.
Buildings 15 03708 g002
Figure 3. Location and size of the existing and new tunnels.
Buildings 15 03708 g003
Figure 4. The established 3D simulation model.
Buildings 15 03708 g004
Figure 5. The monitoring section layout of the right line of Line 3.
Buildings 15 03708 g005
Figure 6. Comparison between the numerical simulation and monitoring: (a) Along the existing tunnel axis. (b) R11, R12, R13 during excavation.
Buildings 15 03708 g006
Figure 7. Comparison of settlement curves obtained by numerical simulation and the preliminary prediction model: (a) Comparison. (b) The preliminary prediction model.
Buildings 15 03708 g007
Figure 8. Comparison between the modified prediction model, the preliminary prediction model, the Peck formula, and the numerical simulation.
Buildings 15 03708 g008
Figure 9. Ground settlement curve with different strata elastic modulus.
Buildings 15 03708 g009
Figure 10. The variation rule of Smax and i with different strata elastic modulus (a is the ratio of the elastic modulus of each group of strata to the reference value).
Buildings 15 03708 g010
Figure 11. Analyzing diagram and meaning of each parameter.
Buildings 15 03708 g011
Figure 12. Ground settlement curve with different tunnel sizes and locations: (a) The diameter of the existing tunnel D1. (b) The diameter of the new tunnel D2. (c) The buried depth of the existing tunnel H1. (d) The spacing between two tunnels ΔH.
Buildings 15 03708 g012
Figure 13. The variation rule of Smax and i with different tunnel sizes and locations: (a) The diameter of the existing tunnel D1. (b) The diameter of the new tunnel D2. (c) The buried depth of the existing tunnel H1. (d) The spacing between two tunnels ΔH.
Buildings 15 03708 g013
Figure 14. Schematic diagram of consistency evaluation method (Lines 1 and 2 are two curves with the same equation form, A1 is the integral area of Line 1, AD is the integral area of the absolute value of the difference between Lines 1 and 2, CI is the consistency evaluation index).
Buildings 15 03708 g014
Figure 15. Plan layout of the cross-river tunnels in Chongqing.
Buildings 15 03708 g015
Figure 16. Samples for the determination of similar material parameters.
Buildings 15 03708 g016
Figure 17. The model test box and dimensions (unit: mm): (a) Model test dimensions. (b) Measuring point arrangement. (c) Model test box.
Buildings 15 03708 g017
Figure 18. Model test processes: (a) Similarity materials production. (b) Materials filling. (c) Tunnels burying. (d) Continue filling. (e) Similarity materials curing. (f) Dial gauges arranging. (g) New tunnel excavation. (h) Excavation complete.
Buildings 15 03708 g018
Figure 19. Comparison of model test results and prediction model.
Buildings 15 03708 g019
Table 1. Physical and mechanical parameters of the strata in simulation.
LayerSoilDensityElastic ModulusFriction AngleCohesionPoisson’s RatioStrength of ExtensionThickness
ρ/(kg/m3)E/MPaφc/kPaμ/−T/MPah/m
Plain fill18806.010.015.00.380.01.6
Completely weathered composite granite189027.021.028.00.288.06.5
Strongly weathered composite granite194030.026.740.00.2510.0-
Table 2. Calculation parameters of the lining segments and grouting layer.
MaterialsThicknessDensityElastic ModulusPoisson’s Ratio
t/mρ/(kg/m3)E/MPaμ/−
Lining segments0.3250034,5000.25
Grouting layer0.4230010000.25
Table 3. Working conditions.
Group NumberThe Diameter of the Existing TunnelThe Diameter of the New TunnelThe Depth of the Existing TunnelThe Spacing Between Two Tunnels
D1/mD2/mH1/mΔH/m
166102
2, 3, 4, 54, 5, 7, 86102
6, 7, 8, 964, 5, 7, 8102
10, 11, 12, 136612, 14, 16, 182
14, 15, 16, 1766101, 3, 4, 5
Table 4. Consistency evaluation between the prediction model results and numerical simulation results under different parameters.
a0.250.5124Average
CI0.8730.9280.9590.9390.7680.895
D1/m45678Average
CI0.9310.9710.9590.9230.9540.948
D2/m45678Average
CI0.8950.9600.9590.9560.9670.947
H1/m1012141618Average
CI0.9590.9400.9200.8850.8250.906
ΔH/m12345Average
CI0.9800.9590.9780.9720.9760.973
Table 5. The physical and mechanical parameters of similar materials and prototype materials.
Unit Weight
γ/kN/m3
Elastic Modulus
E/GPa
Poisson’s Ratio
μ/−
Cohesion
c/MPa
Friction Angle
φ
Prototype materials24.600.30.330.1331–33
Similar materials19.400.00280.310.001126.52
Disclaimer/Publisher’s Note: The statements, opinions and data contained in all publications are solely those of the individual author(s) and contributor(s) and not of MDPI and/or the editor(s). MDPI and/or the editor(s) disclaim responsibility for any injury to people or property resulting from any ideas, methods, instructions or products referred to in the content.