Article

Numerical Simulation Study on the Energy Benefits and Environmental Impacts of BIPV Installation Configurations and Positions at the Street Canyon Scale

1
School of Building Services Science and Engineering, Xi’an University of Architecture and Technology, Xi’an 710055, China
2
MOE Joint International Laboratory of Low-Carbon Building Environment, Xi’an University of Architecture and Technology, Xi’an 710055, China
3
Xi’an ShuFeng Technological Information, Ltd., Xi’an 710061, China
*
Author to whom correspondence should be addressed.
Buildings 2025, 15(20), 3692; https://doi.org/10.3390/buildings15203692 (registering DOI)
Submission received: 17 July 2025 / Revised: 27 September 2025 / Accepted: 1 October 2025 / Published: 14 October 2025
(This article belongs to the Section Building Energy, Physics, Environment, and Systems)

Abstract

Building-integrated photovoltaic (BIPV) systems play a pivotal role in advancing low-carbon urban transformation. However, replacing conventional building envelope materials with photovoltaic (PV) panels modifies heat transfer processes and airflow patterns, potentially influencing urban environmental quality. This study examines the impacts of BIPV on building energy efficiency, PV system performance, and street canyon micro-climates, including airflow, temperature distribution, and pollutant dispersion, under perpendicular wind speeds ranging from 0.5 to 4 m/s, across three installation configurations and three installation positions. Results indicate that rooftop PV panels outperform facade-mounted systems in power generation. Ventilated PV configurations achieve optimal energy production and thermal insulation, thereby reducing building cooling loads and associated electricity consumption. Moreover, BIPV installations enhance street canyon ventilation, improving pollutant removal rates: ventilation rates increased by 1.43 times (rooftop), 3.02 times (leeward facade), and 2.09 times (windward facade) at 0.5 m/s. Correspondingly, canyon-averaged pollutant concentrations decreased by 30.1%, 87.7%, and 85.9%, respectively. However, the introduction of facade PV panels locally reduces pedestrian thermal comfort, particularly under low wind conditions, but this negative effect is significantly alleviated with increasing wind speed. To quantitatively evaluate BIPV-induced micro-climatic impacts, this study introduces the Pollutant-Weighted Air Exchange Rate (PACH)—a metric that weights the air exchange rate by pollutant concentration—providing a more precise indicator for evaluating micro-environmental changes. These findings offer quantitative evidence to guide urban-scale BIPV deployment, supporting the integration of renewable energy systems into sustainable urban design.

Graphical Abstract

1. Introduction

With the rapid growth of global energy demand and the increasing urgency of climate change issues, the development and utilization of renewable energy have become essential pathways for sustainable urban development [1,2,3]. Among various renewable energy technologies, photovoltaic (PV) panels are increasingly integrated into building environments due to their clean and efficient characteristics [4,5]. Building-integrated photovoltaic (BIPV) technology offers buildings a green energy solution that reduces dependence on traditional fossil fuels. The installation of PV panels can also enhance a building’s energy self-sufficiency and resilience during extreme weather events or energy crises [6,7,8]. However, the widespread adoption of PV panels in the building environment also presents new challenges. Unlike conventional building materials, PV materials have a high solar radiation absorption rate (>0.9) and a low albedo (0.04–0.1). BIPV alters the thermal balance of building surfaces, which not only affects the building’s cooling and heating loads but also influences the surrounding street canyon environment through radiation and convection. This process reshapes critical environmental factors such as wind patterns, thermal conditions, and pollutant dispersion, which are essential considerations for urban planning and sustainability. Nevertheless, the impacts of these changes on both the urban environment and building energy consumption remain uncertain [9,10] and have rarely been explored.
There are three main approaches to BIPV environmental impact studies: mesoscale numerical simulation coupled Urban Canopy Model/Building Energy Model (UCM/BEM), computational fluid dynamics (CFD), and experimental methods. Simulation studies [9,11,12,13,14,15] generally indicate that PV panels (rooftop, facade, window-integrated) can reduce urban temperatures and mitigate the heat island effect, with specific findings including urban temperature reductions up to 0.2 °C and lower air temperatures near the ground [13]. Conversely, experimental studies [16,17] report that PV panels exhibit significantly higher daytime sensible heat flux (80% greater than asphalt) compared to conventional surfaces, increasing sensible heat release to the environment and potentially enhancing local temperatures. This creates a conflict regarding BIPV’s thermal impact. Key limitations exist: mesoscale models use coarse resolutions, inadequately capturing small-scale PV photo-thermal-electric conversion processes and potentially underestimating thermal effects; experimental methods, while providing local heat flux/temperature data, have limited measurement points, hindering the assessment of dynamic interactions between PV thermal effects and surrounding environmental elements (buildings, streets). This study uses CFD method, which focuses on the coupling between PV photo-thermal-electric effects and urban street canyon environments, in order to solve these conflicts and better understand the relationship between BIPV and micro-environment.
The street canyons, as an important part of the urban structure, are sensitive areas for the interaction between buildings and the environment. The ventilation effect of urban street canyon is closely related to urban air quality, thermal comfort, and the health of residents [18,19,20]. A perpendicular wind is not conducive to the ventilation of the street canyon, and the perpendicular wind direction is often chosen in studies. This paper also adopts a perpendicular wind direction for simulation analysis. Previous studies have researched street canyon ventilation, discussing and analyzing various influencing factors, such as the geometric characteristics of street canyons [21,22,23], wall thermal plumes [24,25], trees and vegetation [26,27], water bodies [28], and traffic flow [29]. As a typical tool of urban canopy research, the street canyon model is widely used in urban environment analysis. This model allows for the simultaneous study of both the internal and external environments of street canyons and can flexibly configure elements that influence the urban microclimate, effectively simulating the impacts of urban streets and buildings on the urban climate, airflow, and thermal environments.
For the BIPV system, we need to consider its unique characteristics, as PV panels exhibit photovoltaic conversion effects. Photovoltaic modules have a high solar radiation absorption capacity but low heat retention ability, so their surface temperature is typically higher than that of ordinary building surfaces. This characteristic enhances heat exchange with the surrounding environment, making the airflow within the street canyon more complex due to thermal buoyancy. Mei [30] studied the impact of thermal buoyancy on the ventilation capacity of a 2D street canyon by analyzing the relationship between the Richardson number (Ri) and ventilation indicators. Saxena [31] examined the thermal effects of different roofing materials (asphalt, reflective roofs, and green roofs) in an ideal urban environment and their impact on pollutant dispersion in street canyons. Existing research emphasizes the critical role of thermal buoyancy in street canyon ventilation and pollutant dispersion. However, specific research on BIPV systems remains notably scarce. This study addresses this research gap through two primary avenues: First, based on the photo-thermal-electric coupling characteristics of PV materials, numerical simulations are employed to systematically analyze the impact of three typical BIPV installation configurations (ventilated channel type, enclosed channel type, and direct attachment type) on building energy efficiency and PV system operational performance. Second, after determining the optimal configuration, steady-state numerical simulations are used to further investigate the effects of roof-mounted and facade-mounted PV layouts on momentum transfer, heat transfer, and pollutant dispersion processes within street canyons under vertical wind speeds ranging from 0.5 to 4 m/s. It is noteworthy that, given the complex and dynamic wind conditions in real urban environments, this study focuses on vertical inflow to establish foundational insights under controlled conditions. This methodology enables a systematic exploration of key parametric influences, laying the groundwork for future analyses closer to real-world scenarios involving turbulence and multi-directional wind fields. Overall, this research provides theoretical support for the synergistic optimization of BIPV systems and urban micro-environments.

2. Methodology and Numerical Procedures

This section details the methodology and numerical simulation procedures employed in this study. Considering the unique characteristics of BIPV building envelopes, Section 2.1 first introduces their heat transfer properties under common installation configurations, providing the heat transfer rates (Q), power generation ( P p v ), and energy balance equations. Subsequently, Section 2.2 derives and lists the governing equations describing the airflow, heat transfer, and pollutant mass transfer processes within street canyons, where the BIPV envelope energy balance equations from Section 2.1 are incorporated as source terms in the air heat transfer equation to achieve coupled analysis of BIPV thermal behavior and the street canyon environment.

2.1. Heat Transfer in BIPV Systems with Different Installation Configurations

The heat transfer behavior of BIPV systems is significantly influenced by the installation configuration of the PV modules relative to the building envelope. There are three typical mounting configurations for BIPV systems, as illustrated in Figure 1: the ventilated channel type (Type 1), the enclosed channel type (Type 2), and the direct attachment type (Type 3). These configurations impact the thermal resistance between the PV module and the building installation wall, which, in turn, affects the overall heat transfer characteristics.
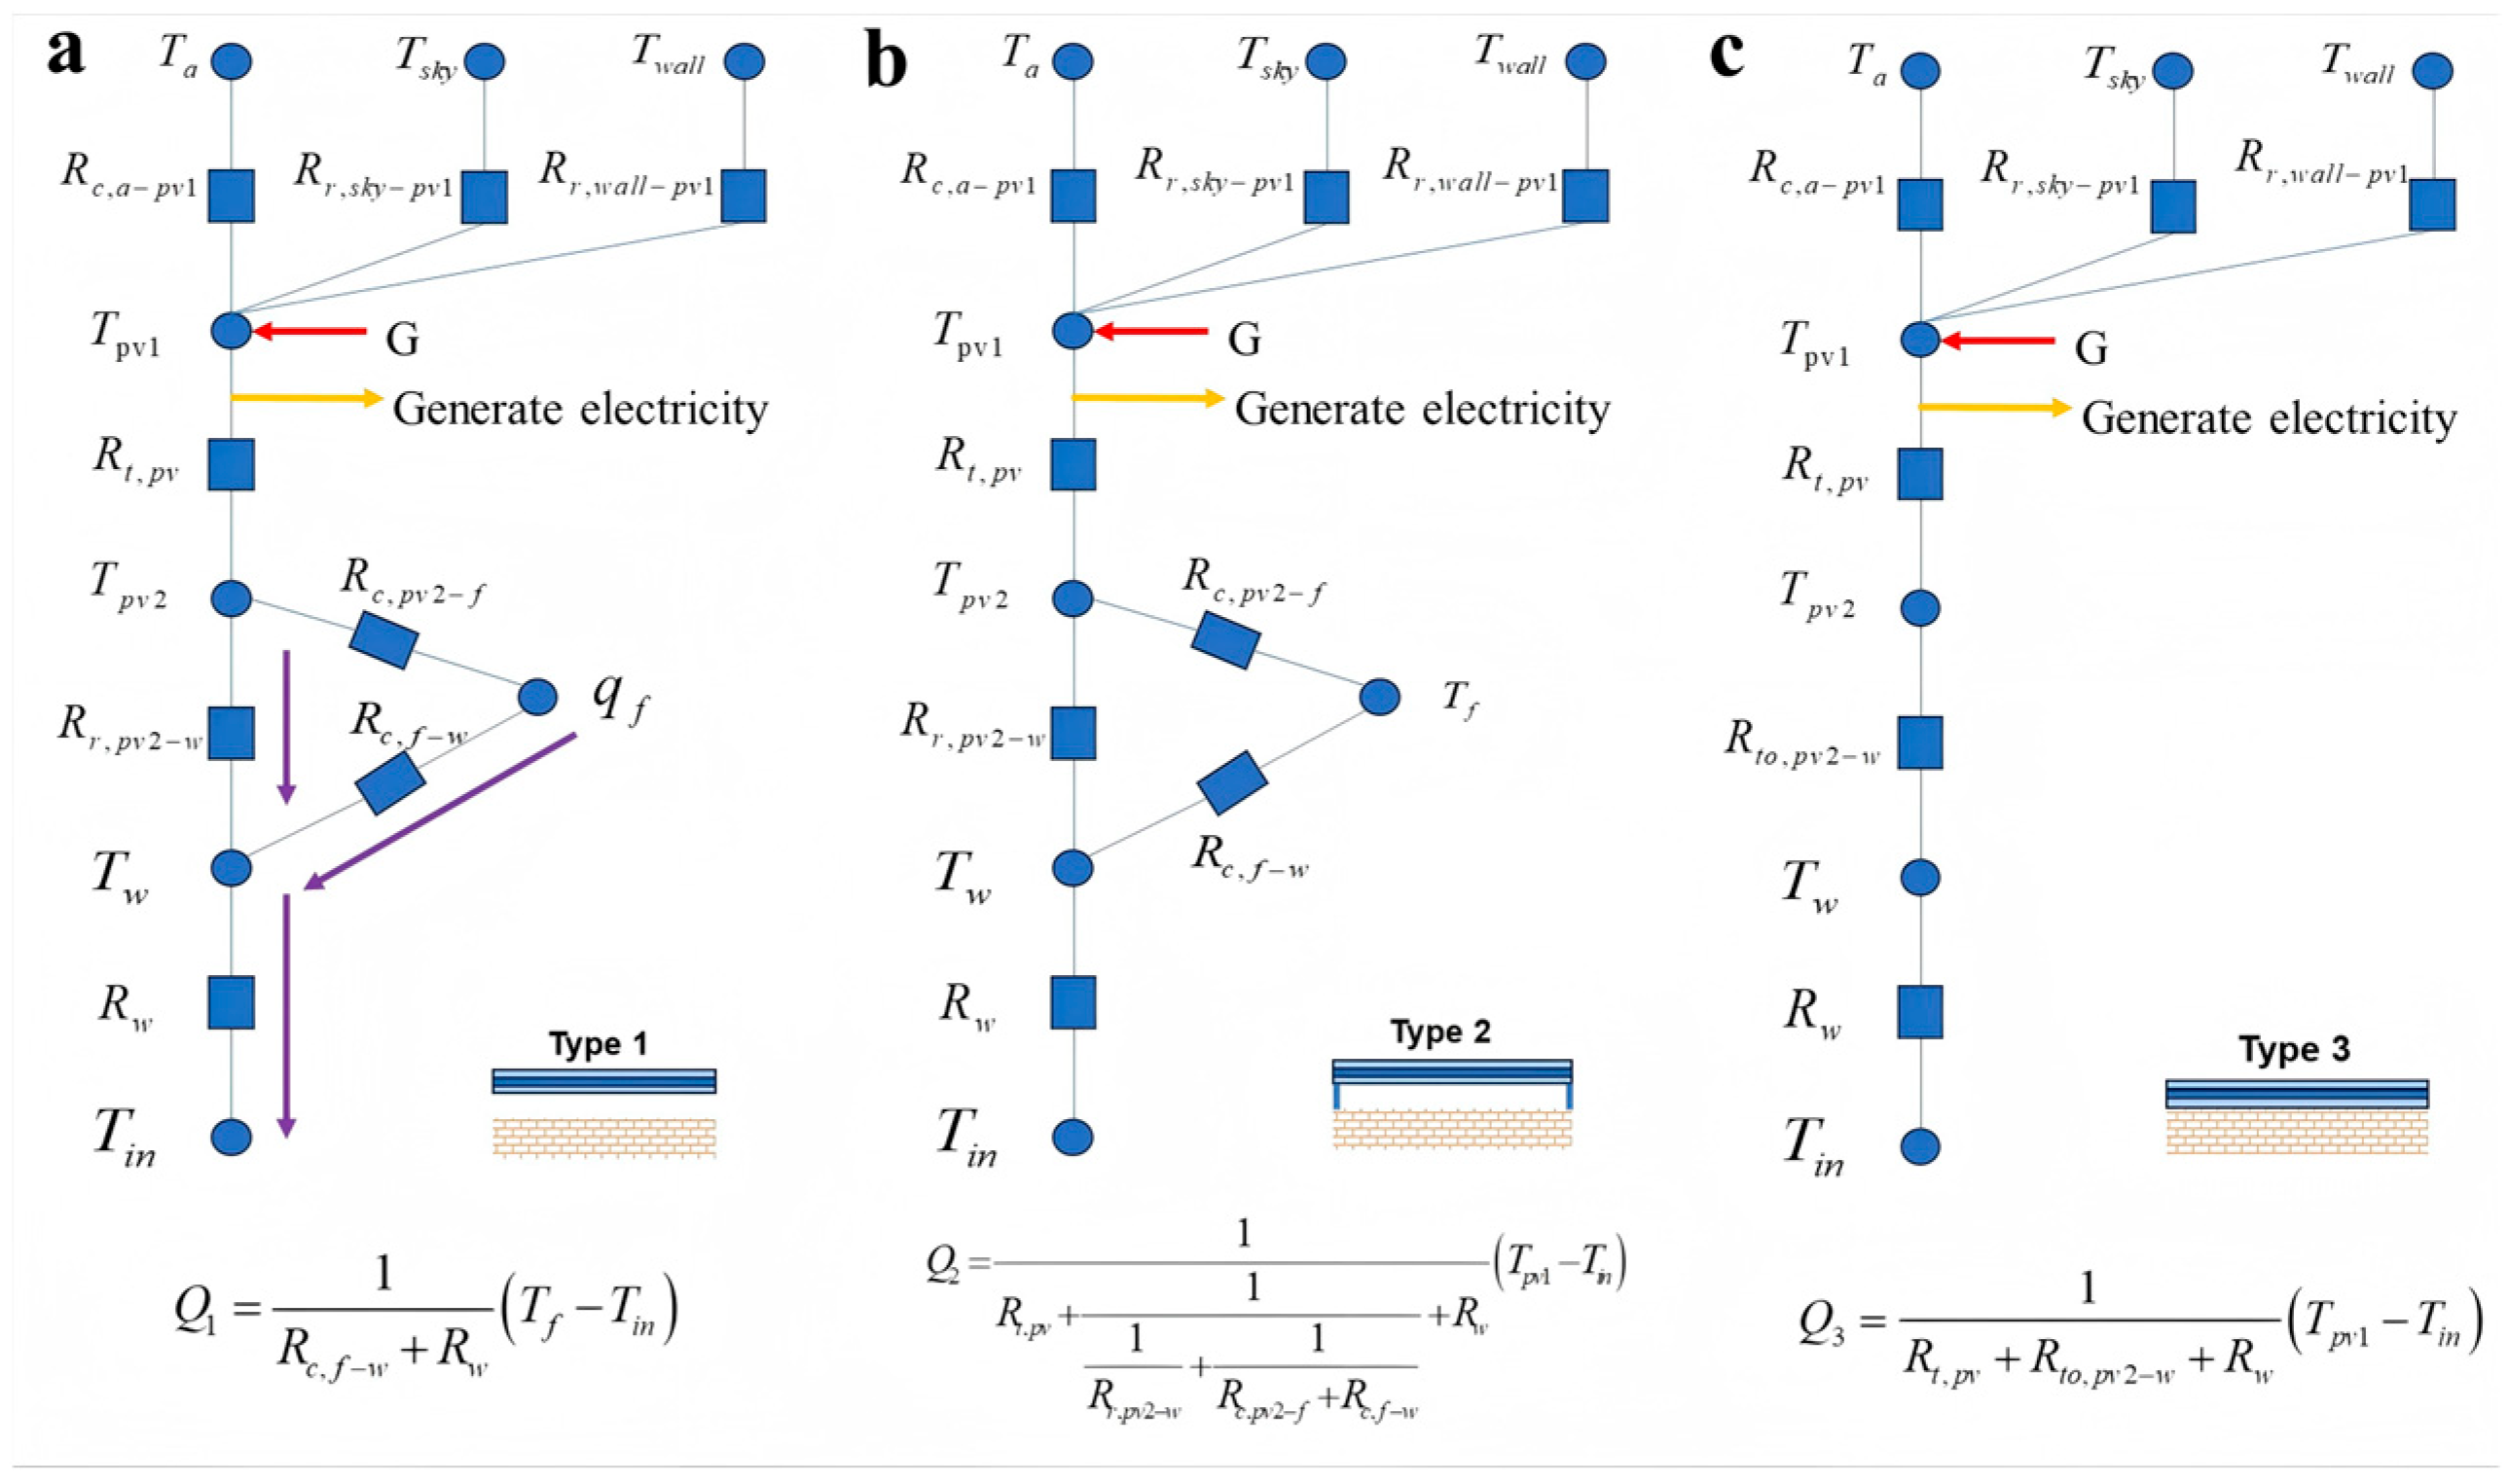
This study focuses on the heat transfer rate (Q) through the BIPV envelope, including contributions from conduction, convection, and radiation. We do not use U to represent the building physics U-value (overall heat transfer coefficient). All detailed calculations of heat transfer coefficients, thermal resistances, and any equivalent U-values are placed in Appendix A to avoid overloading the main text. While U or Uref appear in the CFD section, they exclusively denote wind velocity and reference wind velocity, respectively, and are unrelated to the building U-value. The thermal resistance network method has been applied to calculate this heat transfer rate (Q) for each of the three installation configurations. The corresponding thermal resistance network models are shown in Figure 2.
The subscripts a, sky, wall, pv1, pv2, w, and in for temperature T and thermal resistance R denote ambient air, sky, urban canyon surfaces (including other walls and ground), exterior surface of the PV module, interior surface of the PV module, building wall, and indoor air, respectively. The subscripts c, t, r, and to for thermal resistance R indicate convective thermal resistance, conductive thermal resistance, radiative thermal resistance, and contact thermal resistance, respectively. The symbol R w represents the composite thermal resistance encompassing wall conduction and convective heat transfer with indoor air. G denotes solar irradiance.
The heat transfer rate Qi for each configuration can be determined using the following formulas, where i = 1, 2, 3 denotes the three installation types.
Q 1 = 1 R c , f w + R w T f T i n F ,
Q 2 = 1 R t , p v + 1 1 R r , p v 2 w + 1 R c , p v 2 f + R c , f w + R w T p v 1 T i n F ,
Q 3 = 1 R t , p v + R t o , p v 2 w + R w T p v 1 T i n F ,
where T f denotes the temperature of the air gap (°C); T i n is the outdoor air temperature (°C); T p v 1 is the temperature of the PV panel’s outer surface (°C); R t o , p v 2 w in Equation (3) represents the thermal contact resistance, specifically referring to the interface thermal resistance between the PV module and the building surface in the direct attachment type (Type 3). This study assumes ideal thermal contact conditions, setting this resistance to zero. In practical applications, well-bonded interfaces in direct attachment configurations typically exhibit negligible resistance; and F represents the area of the photovoltaic panels. The determination of the thermal resistances R used in these equations follows the thermal resistance network method, and the detailed calculation procedures are provided in Appendix A to avoid interrupting the flow of the main discussion.
Further, to ensure energy balance in the CFD simulation of the PV modules, the total heat transfer rate must be fully accounted for through a comprehensive heat balance equation. This heat balance formulation should be consistent with the approach used in the previous calculation of Qi, ensuring methodological continuity throughout the analysis. Specifically, the heat balance equation is:
Q p v ,   solar   = Q p v ,   air   + Q p v ,   sky   + Q i + Q p v ,   wall   + Q e l e c ,
here, Q p v , s o l a r represents the solar radiation received by PV panel. Q p v , a i r = h p v , a i r T p v T a i r / δ p v is the convective heat transfer between the PV panel and the air. Q p v , s k y = ε p v σ T p v 4 T s k y 4 / δ p v is the radiative heat transfer between the top surface of the PV panel and the sky, with ε p v equal to 0.8. Q i is obtained from the thermal resistance network analysis. Q p v , w a l l represents the radiative heat transfer between the PV module and other surfaces in the street canyon, such as adjacent walls and the canyon ground, calculated using the Surface-to-Surface (S2S) model. Q e l e c = P p v A p v δ p v is the negative source term considering power generation, and P p v is the electrical power output of the PV panel. As is well known, the power generation efficiency of PV panels decreases with increasing temperature. Therefore, the electric power output model of PV panels based on temperature correction is adopted. The formula is as follows:
P p v = G A p v η r e f 1 + β r e f T p v T r e f ,
here, η r e f is the reference efficiency under reference conditions (irradiance of 1000 W/m2, PV panel temperature of 25 °C), and its common value in the market is 20%. β r e f is the temperature coefficient that varies with different PV cell materials (for crystalline silicon, it is approximately −0.3 to −0.45%/K, and for thin-film technologies, it is −0.2 to −0.35%/K) [32]. A smaller (more negative) value for β r e f results in lower power generation and a higher panel temperature; conversely, a larger (less negative) value leads to higher power generation and a lower panel temperature. In this study, β r e f set to a fixed value of −0.35%/K. This value, selected as a representative intermediate from typical ranges for common PV technologies, reflects the average thermal characteristics of commercially available panels. While this simplification affects the absolute predicted values, it is not expected to alter the comparative performance trends and primary conclusions of this study.

2.2. Governing Equations

The airflow in the street canyon can generally be considered incompressible. Hence, the Reynolds-averaged Navier–Stokes (RANS) equations and the realizable k ε turbulence model are used for numerical calculations to solve the turbulent flow field [33]. To account for natural convection induced by PV panels, the widely accepted Boussinesq approximation is employed to simulate the buoyancy effect resulting from air temperature changes [34]. The governing equations consist of the continuity conservation:
u j ¯ x j = 0 ,
and the momentum conservation:
u ¯ j u ¯ i x j = ρ ρ 0 ρ 0 g i + x j ν + ν t u ¯ i x j 1 ρ p ¯ x j ,
and the energy conservation:
T ¯ u ¯ j x j = x j K t + K m T ¯ x j ,
here, u j ¯ is the mean velocity tensor, representing the ensemble-averaged velocity components in three orthogonal directions. x j is the Cartesian coordinates, p ¯ is the pressure, g i is the gravitational acceleration tensor, ρ is the actual fluid density and ρ 0 is the reference density. ν and ν t = C μ k 2 / ε represent the kinematic viscosity and turbulent kinematic viscosity of air, respectively. T ¯ is the actual fluid temperature. K m and K t represent additional heat transfer by the mean flow and turbulence flow, respectively, for the mean flow and the turbulence flow. In Equation (7), the buoyancy term is modeled using the Boussinesq density approximation. This approximation assumes that the difference between the actual fluid density ρ and the standard air hydrostatic density ρ 0 is small. In the equation-solving process, the density is considered a constant value, and density variations in other equations are neglected except for the buoyancy term. The buoyancy term under the influence of gravity still retains the effect of density variations, and its specific form is as follows:
ρ ρ 0 ρ 0 β ( T T 0 ) ,
where β is the coefficient of thermal expansion, T is local temperature (K), and T0 is Reference temperature (K).
The transport equations for turbulent kinetic energy k and dissipation rate ε in the realizable k ε turbulence model are as follows:
k u ¯ j x j = x j ν t σ k k x j + P k + G b ε ,
ε u ¯ j x j = x j ν t σ ε ε x j + C 1 S ε C 2 ε 2 k + ν ε .
The source terms P k   a n d   G b represent the turbulent kinetic energy generated by wind and buoyancy, respectively, and their equations are as follows:
P k = ν t u ¯ i x j + u ¯ j x i u ¯ i x j ,
G b = δ i 2 g θ 0 ν t Pr t θ ¯ x i ,
in the above equations, C 1 = max [ 0.43 , η / ( η + 5 ) ] , η = k S / ε , C 2 = 1.9   a n d   σ ε = 1.0 .
The transport of common gaseous pollutants within a street canyon can be regarded as their migration and diffusion driven by fluid motion. In the simulation process, the distribution and evolution of contaminants are usually described by scalar transport equations (see refs. [35,36,37,38]), as shown below:
u ¯ j C g ¯ x j = x j D m , g + ν t S c t , g C g ¯ x j ,
here, the variable C g ¯ k g m 3 represents the average mass concentration of the pollutant. D m , g   m 2 s 1 is the molecular diffusion coefficient of the pollutant and S c t is the turbulent Schmidt number. In this study, the turbulent Schmidt number S c t is fixed at 0.7, based on literature recommendations [39,40]. While this choice affects the absolute values of predicted pollutant concentrations, it is deemed appropriate as it provides a consistent and effective comparative basis for investigating the relative impact of different BIPV configurations on pollutant dispersion trends.

2.3. Computational Domain and Boundary Conditions

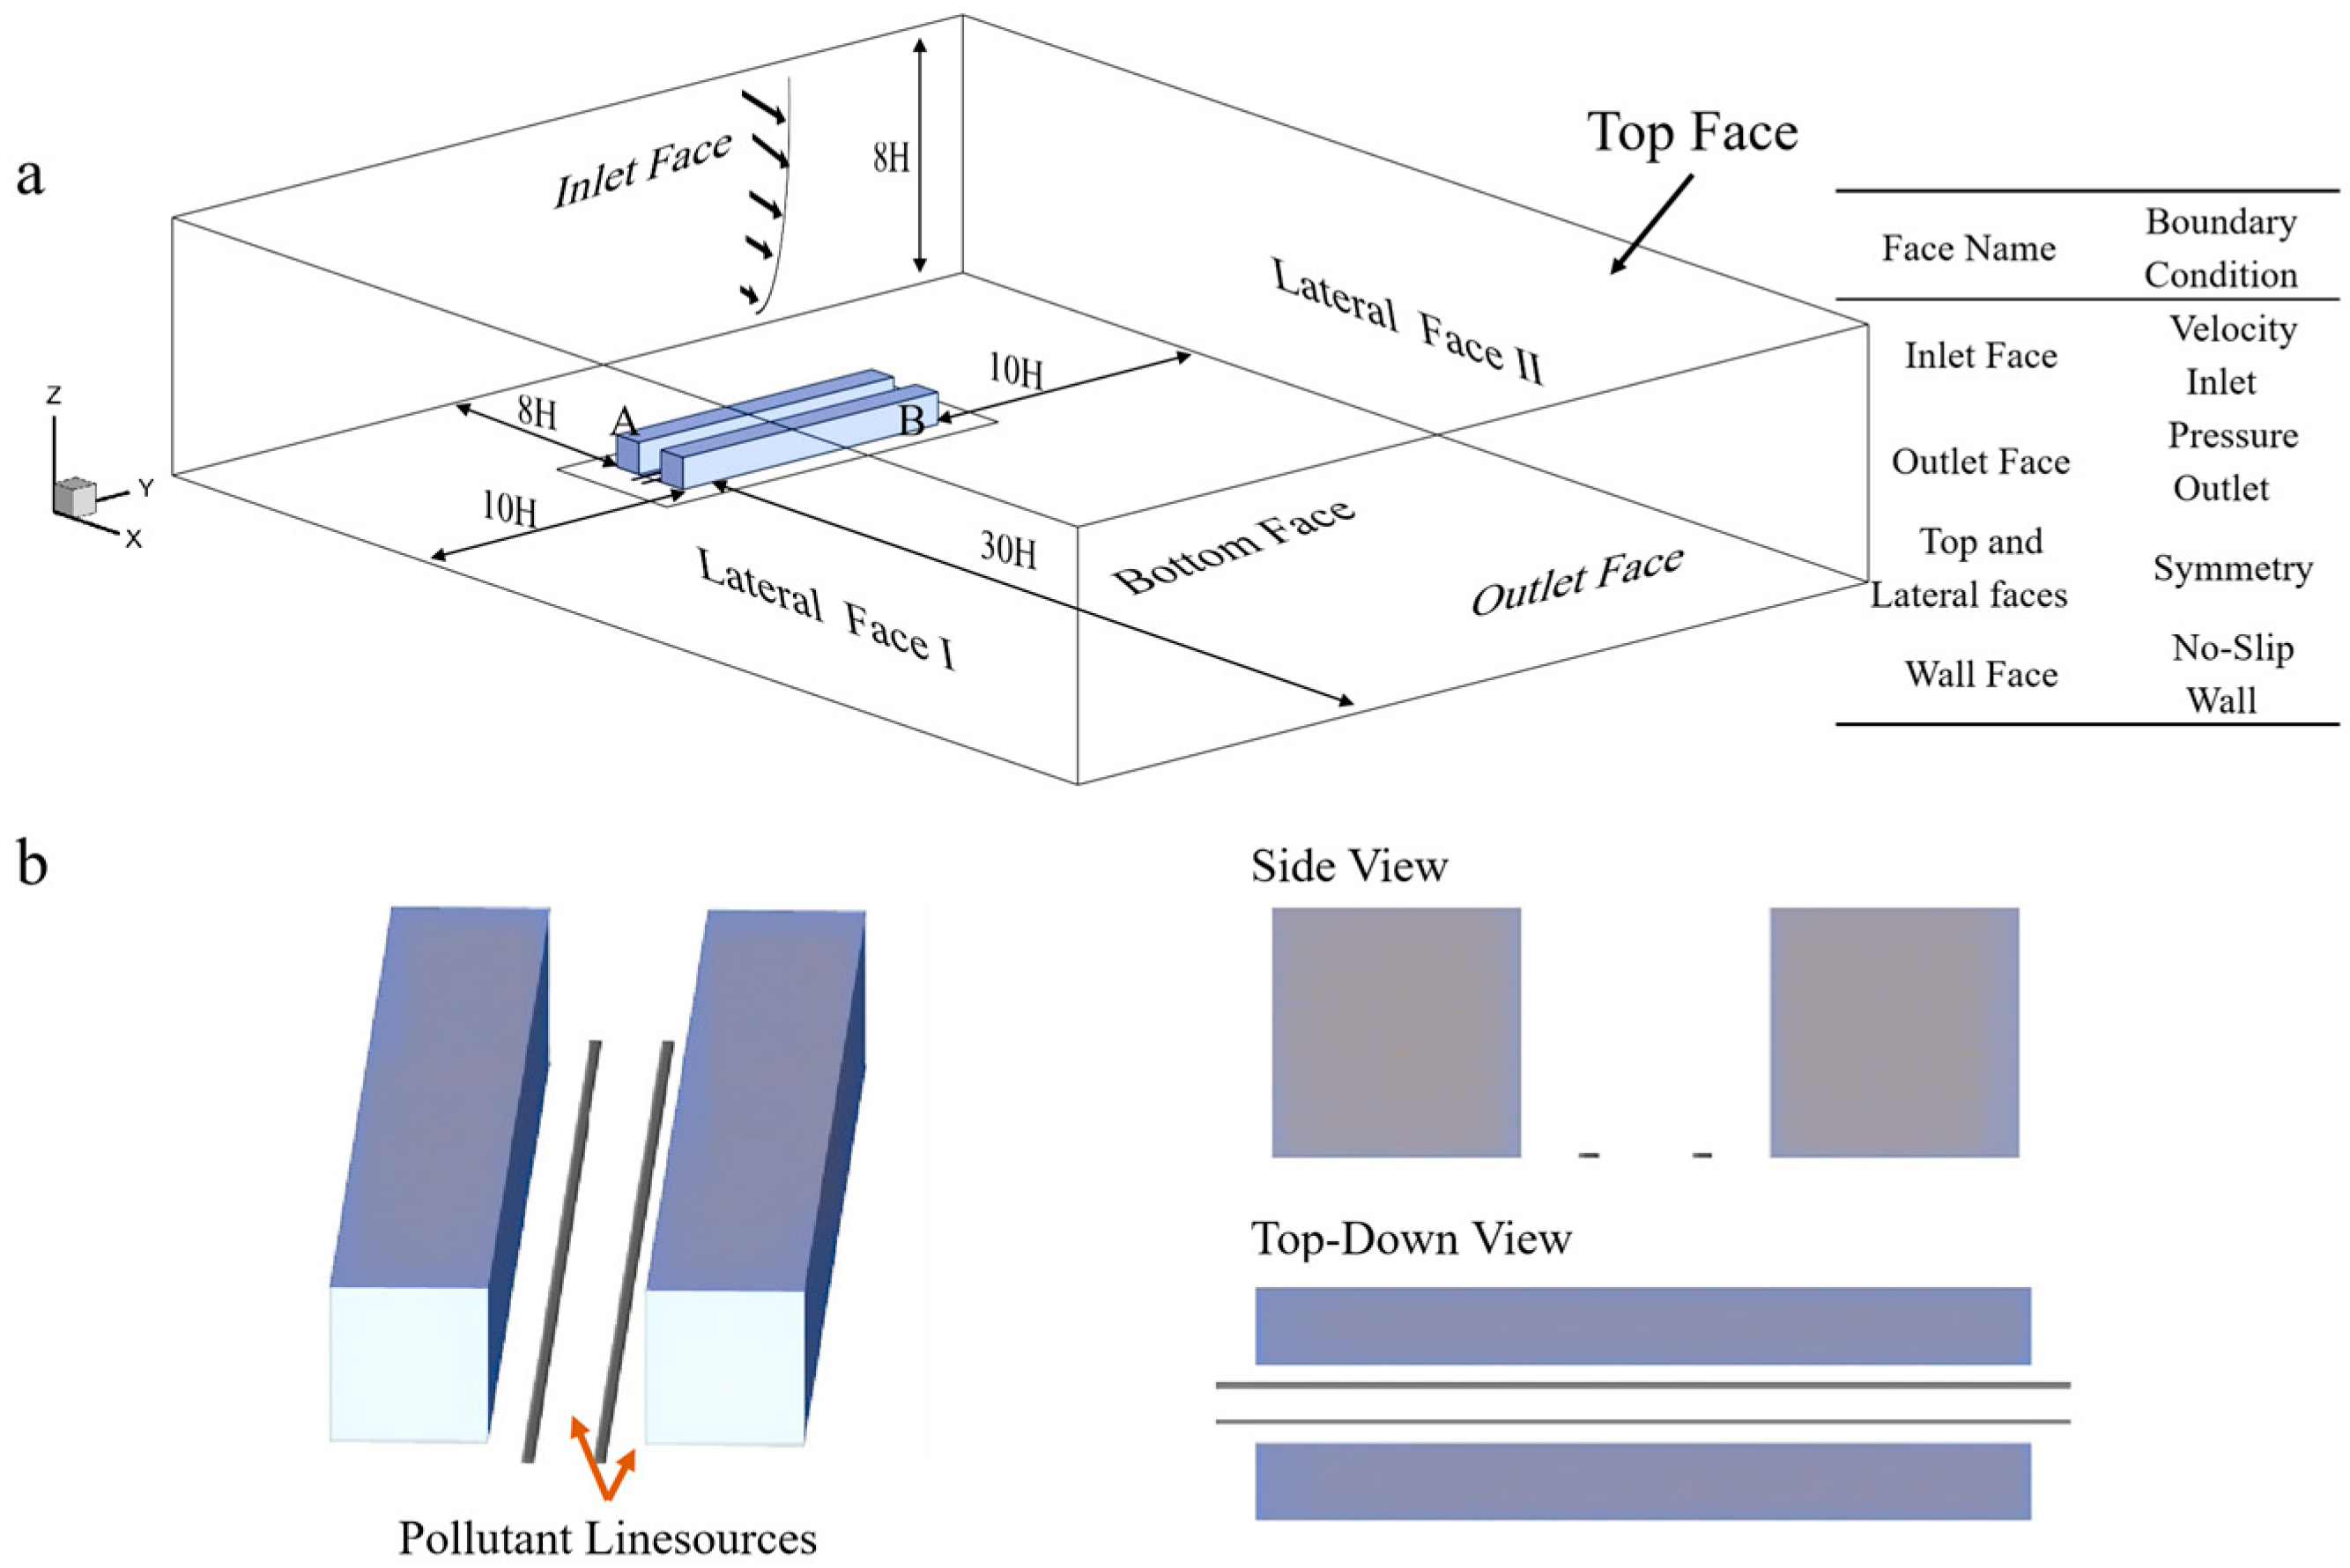
This study establishes a full-scale long street canyon model with an aspect ratio of H/W = 1 (typical of urban canyons) and a length-to-width ratio of L/W = 18. The canyon height H is set to 18 m. The computational domain and boundary conditions are shown in Figure 3. Referring to COST ACTION [41], the street canyon is set at a distance of 8H from the entrance of the computational domain, 10H from both sides of the computational domain, and 30H from the exit. The height of the computational domain is 8H.
As shown in Figure 3a, the sides and top of the computational domain are symmetric boundaries, and a pressure outlet boundary is used at the exit of the computational domain. The incoming flow velocity profile at the inlet is based on the fully developed turbulence under neutral atmospheric conditions proposed by Richards and Hoxey [42], which is described by the following formulas:
u = u κ ln z + z 0 z 0 ,
k = u 2 C μ ,
ε = u 3 κ z + z 0 ,
here, c μ is a coefficient in the turbulence model (0.09). At a height of z = 10 m, the inlet wind speeds are prescribed as 0.5 m/s, 1.0 m/s, 2.0 m/s, 3.0 m/s, and 4.0 m/s, serving as the reference wind speeds (Uref). First, the friction velocity u is calculated using Equation (15) and the selected wind speed at z = 10 m, and then u is substituted into the equation to determine the wind profile for the inlet of the computational domain.
The study simulates the dispersion of pollutants at the location shown in Figure 3b, where two sources are located at ground level in the street canyon at a distance of 0.5 H from the building, with a width of 0.08 W and a pollution release rate of 0.01 kg/s.
The ground and building walls within the computational domain are set as no-slip wall boundary conditions. The wall boundaries need to account for the effects of roughness elements, and the installation of PV panels causes changes in the roughness of the building walls. Therefore, modified wall functions are used [43].
k s = 9.793 z 0 c s ,
here, k s is the equivalent roughness height, C s is the roughness constant, and z 0 is the aerodynamic roughness length. In this paper, the z 0 for the outer ground is specified as 0.1 m, see reference [36]. Rough open terrain, such as building scattered farmland. k s is equal to 0.12 m, less than half of the height of adjacent units on the ground, so the roughness constant C s is selected to be 8. For the building wall, z 0 is set to 4.7 × 1 0 3 m , k s   i s   e q u a l   t o   1.2 × 1 0 3 m , so C s is equal to 0.38 [44]. The building wall covered by PV panels is assumed to be smooth, with z 0 set to 0.
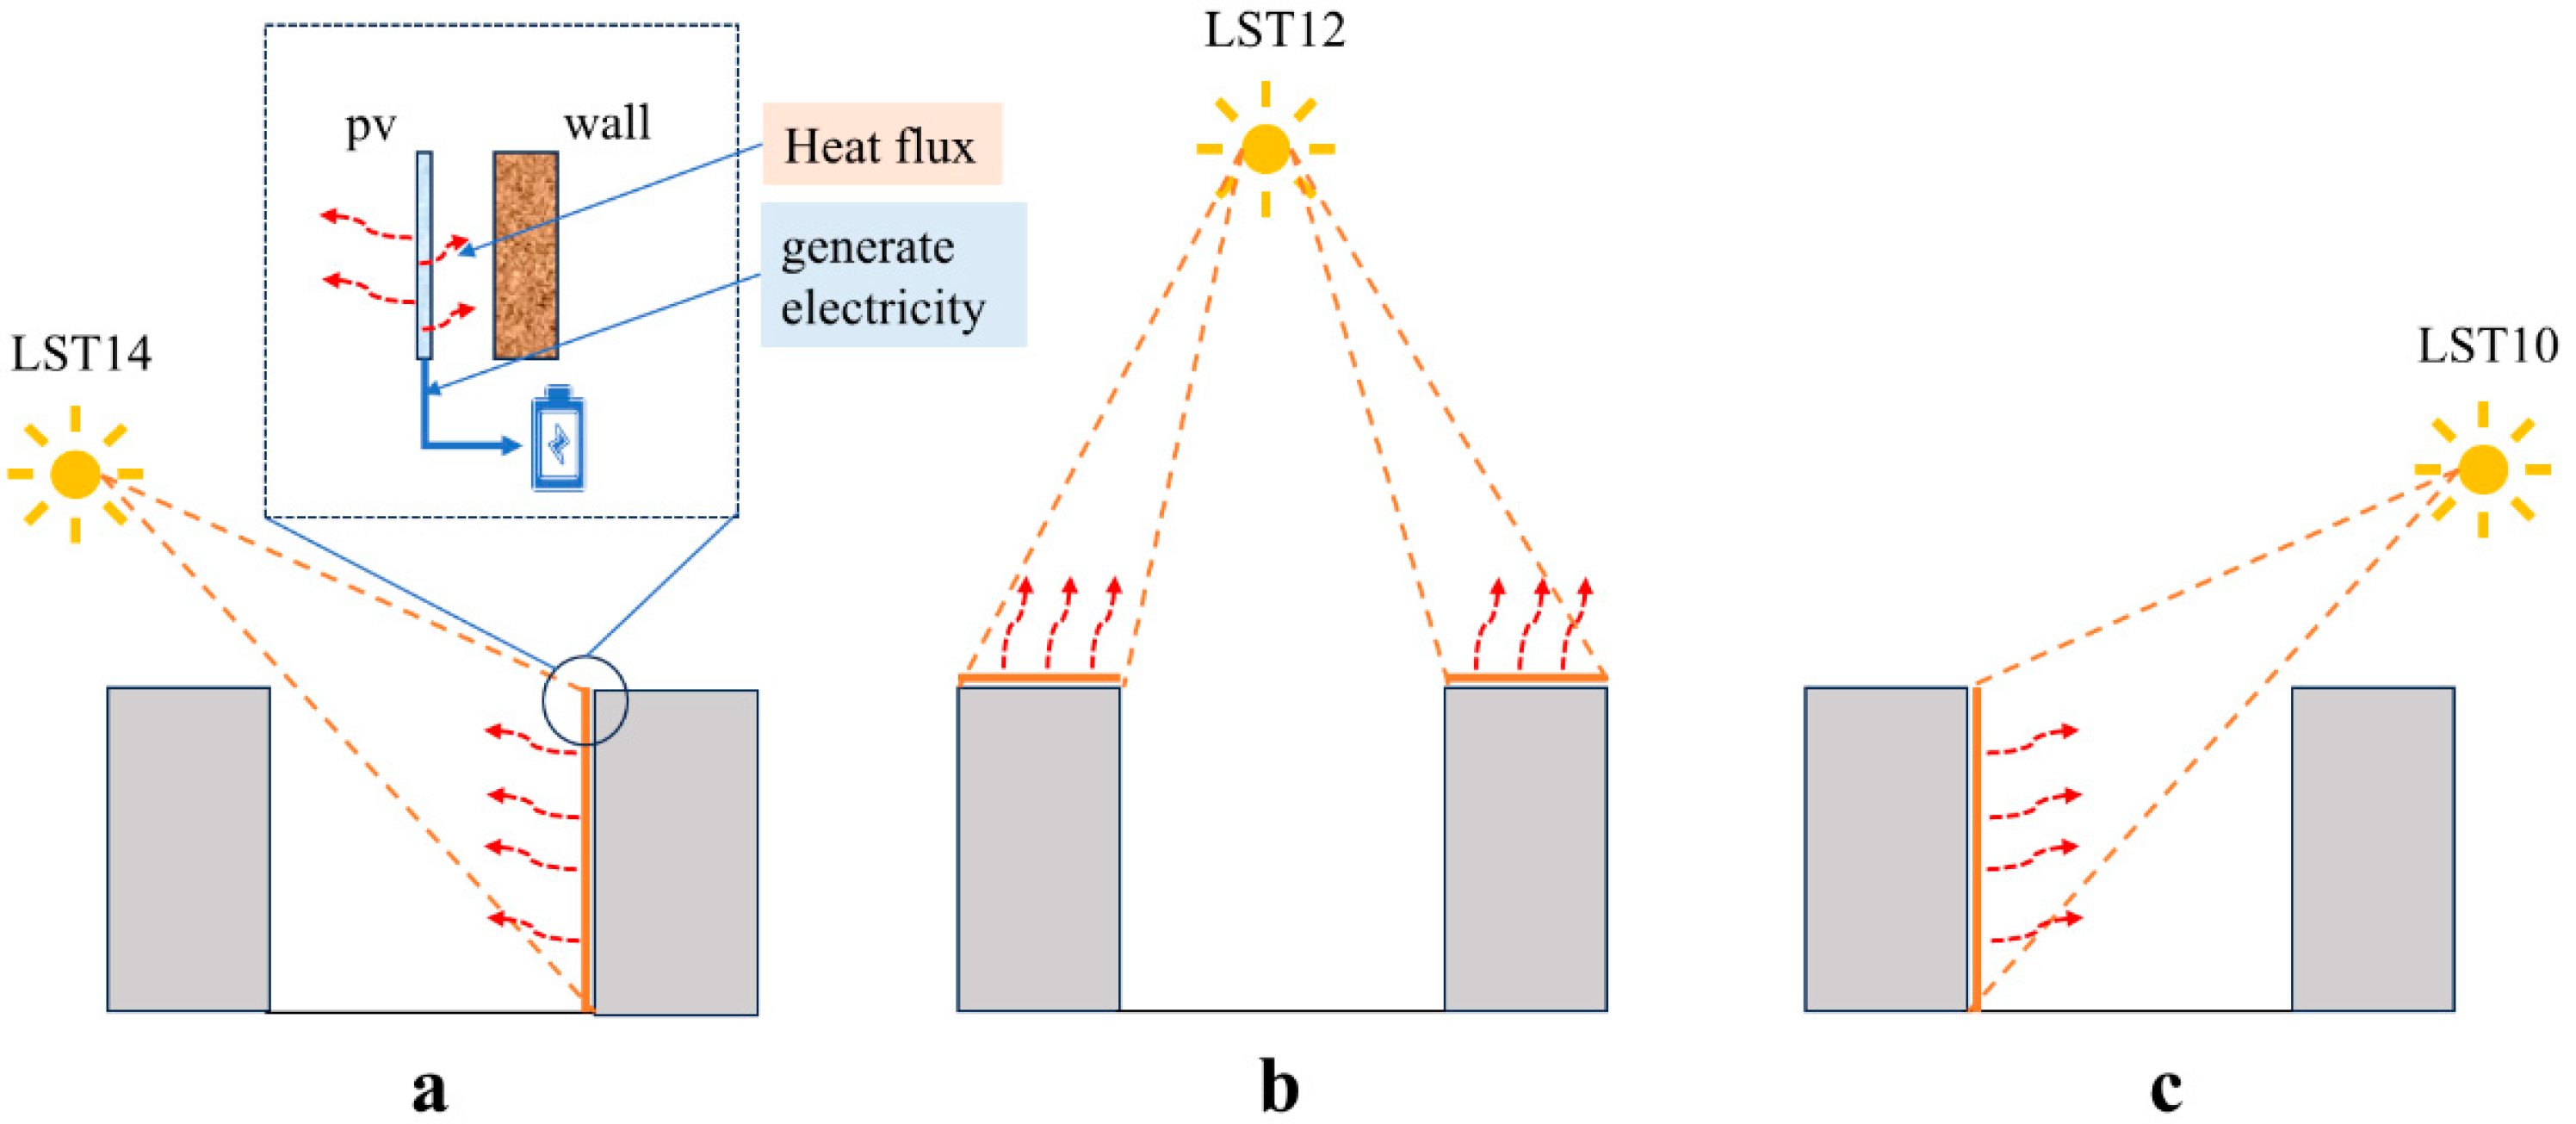
As shown in Figure 4, this paper simulates PV panel installation at three typical building locations—leeward facade, rooftop, and windward facade. The installation configurations shown correspond to approximately 10 a.m. (Local Standard Time, LST10), 12 p.m. (noon, Local Standard Time, LST12), and 2 p.m. (Local Standard Time, LST14) conditions in mid-latitude regions of the Northern Hemisphere, assuming full illumination of the panels. The resulting average solar irradiance values for the panels are 707 W/m2, 845 W/m2, and 707 W/m2, respectively.

2.4. Discretization Schemes and Computational Meshes

The governing equations are discretized using the finite volume method, and pressure-velocity coupling is achieved via the SIMPLE algorithm. Convective terms in governing equations are discretized using a second-order upwind scheme, and diffusive terms employ a central difference scheme. Steady-state simulations solve the RANS equations with the realizable k ε turbulence model. For radiative heat transfer, the S2S model is applied. The heat flux between the PV module and the building installation wall are defined via custom source terms.
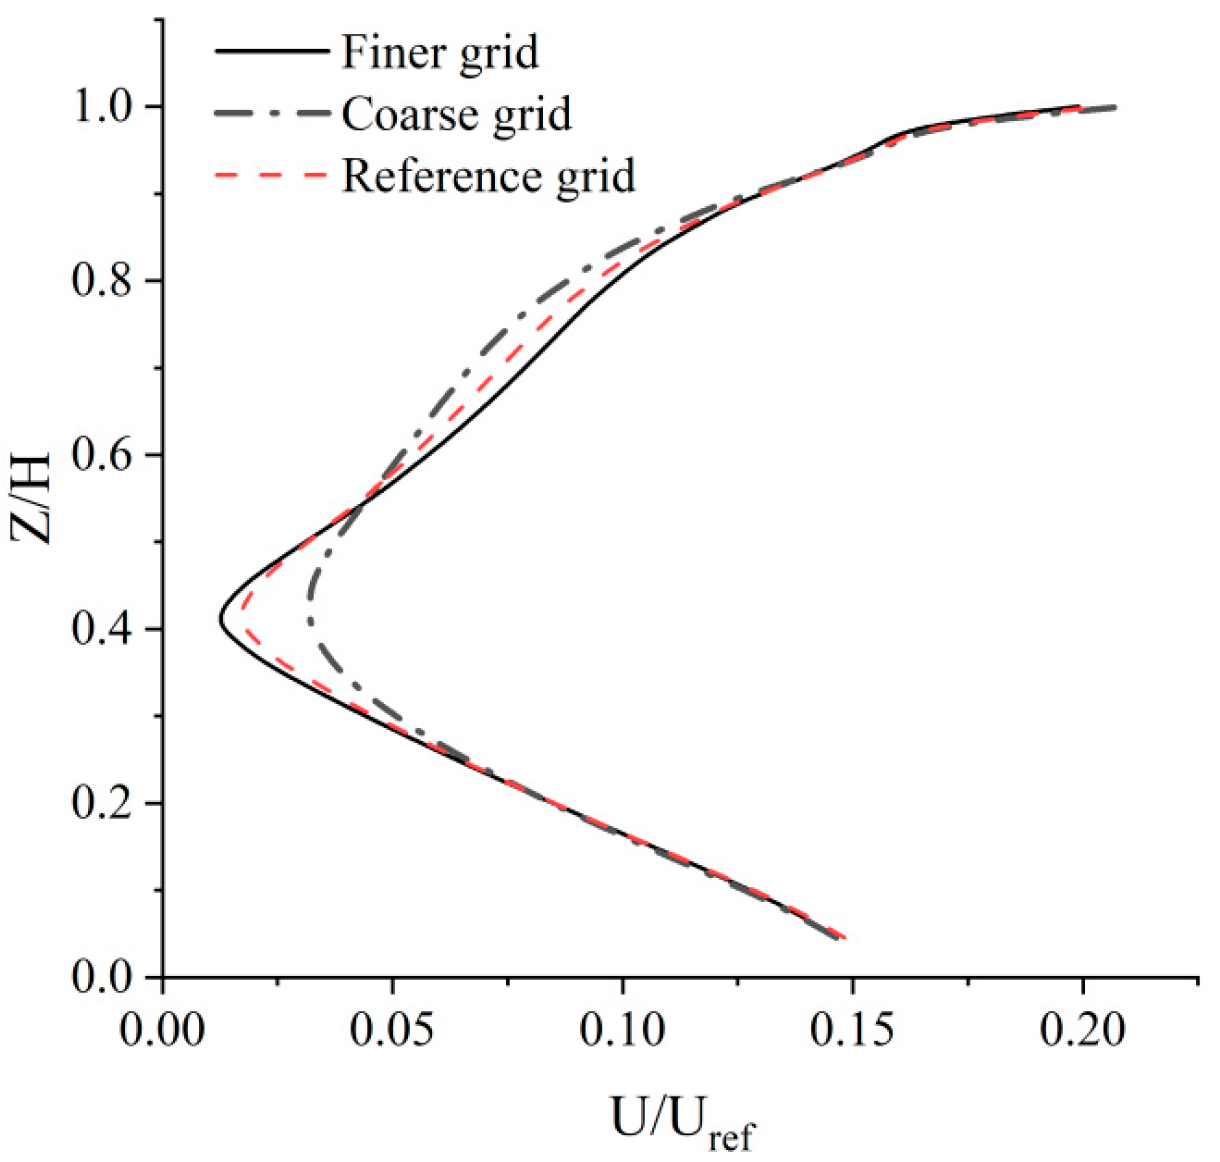
A grid independence study was conducted. Grids were generated by setting the maximum spacing near the buildings to 1 m, 2 m, and 3 m, using a grid expansion ratio of 1.1. This resulted in three sets: a coarse grid (1,826,320 cells), a reference grid (3,382,456 cells), and a fine grid (6,534,536 cells). Figure 5 compares the velocity profiles along the vertical centerline of the street canyon across these grids. The velocity profiles demonstrate good agreement between the reference grid and the fine grid results. Therefore, using the reference grid for the numerical simulations is reasonable.

3. Model Validation

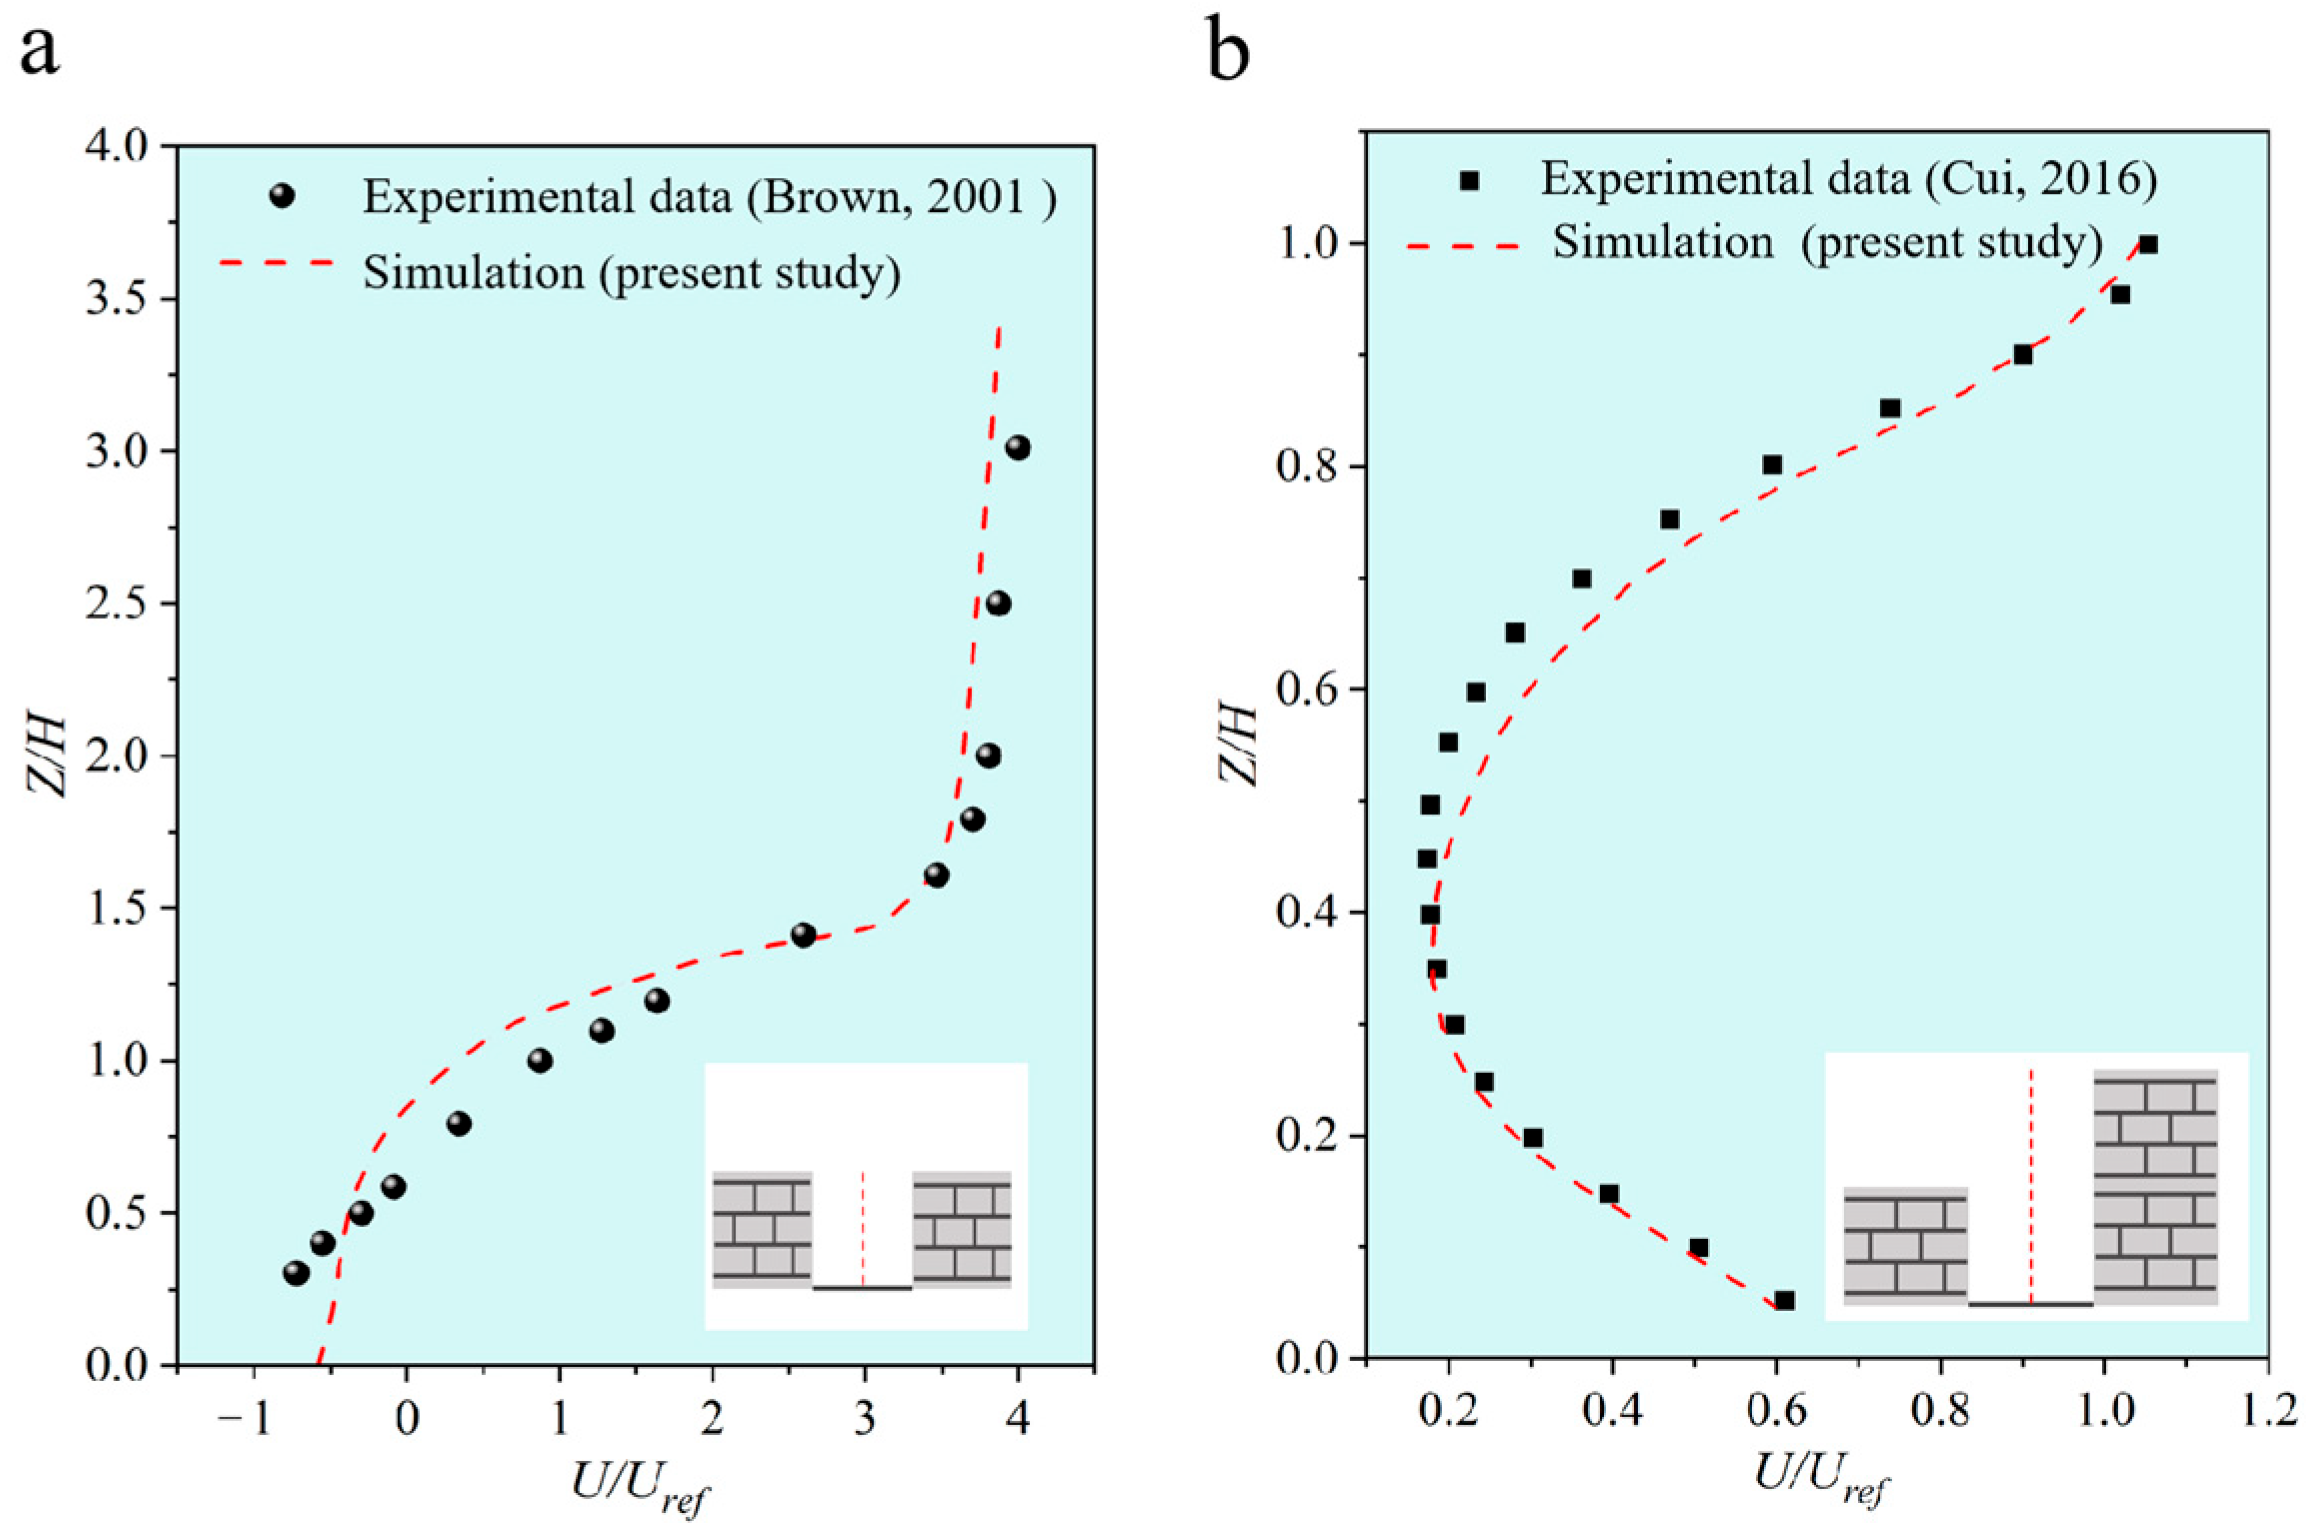
Two experimental results were adopted for simulation validation. The first set comes from experiments by the U.S. Environmental Protection Agency’s Fluid Modeling Laboratory [45], which did not consider thermal effects. The second set is from experiments by the State Key Laboratory of Pollution Control and Resource Reuse at Tongji University, China [46], which did consider thermal effects.
We established identical models in our numerical simulations. We also ensured matching Reynolds number (Re) and Richardson number (Ri) values. Then, we compared the velocity distribution along the vertical centerline of the street canyon, as shown in Figure 6.
Overall, the numerical simulation results show good agreement with the wind tunnel experimental data. Therefore, the numerical model presented in this paper is reliable and ensures the accuracy of subsequent research.

4. Results and Discussion

This section presents and discusses the simulation results, focusing on the intrinsic relationship between building energy efficiency and urban micro-environmental effects. The analysis proceeds in two steps: first, an optimal design is identified by comparing the energy performance of three BIPV installation configurations under various wind speeds. Second, the comprehensive environmental impacts of this optimal design are evaluated under different layouts (rooftop vs. facade) concerning street canyon ventilation, heat transfer, and pollutant dispersion. This approach is designed to quantitatively analyze the synergistic co-benefits or potential trade-offs for the urban micro-environment (e.g., ventilation, thermal comfort, and pollutant concentration) that arise from enhancing energy efficiency.

4.1. BIPV System Energy Benefits

BIPV systems mainly offer energy benefits through two distinct mechanisms: electricity generation revenue and energy saving benefits. For electricity generation, BIPV systems use building surfaces like roofs and facades to produce electrical power. The generation efficiency largely depends on the operating temperature of photovoltaic modules. Different installation configurations affect thermal dissipation, subsequently impacting module temperature and power output. Regarding energy saving, BIPV systems help regulate thermal conditions inside buildings. PV panel placement provides shading from direct solar radiation, leading to a drop in building’s exterior surface temperature. This temperature drop reduces heat transfer through the envelope, thus cutting cooling energy demand. The extent of energy saving mainly relies on installation configurations specifics. This paper examines the electricity generation revenue, energy saving benefits for three mounting configurations (shown in Figure 1) and three installation positions (shown in Figure 4) across wind speeds of 0.5, 1, 2, 3, and 4 m/s.

4.1.1. Electricity Generation Revenue Analysis

Figure 7 and Figure 8 show trends in power generation efficiency and total power generation for three PV panel installation configurations—Type 1 (ventilated channel), Type 2 (enclosed channel), and Type 3 (direct attachment)—under different ambient wind speeds across various installation locations (the rooftop, leeward facade, and windward facade).
First, comparing the effects of installation location, corresponding to the differences between subfigures a–c in Figure 7 and Figure 8. As observed from Figure 7, installation location significantly affects power generation efficiency. Roof-mounted PV panels exhibit higher efficiency than facade-mounted ones (including both leeward and windward walls) across all wind speed conditions. Figure 8 indicates that the power generation of roof installations stably ranges from 491 to 521 kW, whereas that of facade installations ranges from 407 to 436 kW. These results indicate a power generation advantage exceeding 16% for roof-mounted panels. This phenomenon can be attributed to the superior solar exposure and air flow conditions on rooftops, which help reduce PV panel surface temperature and enhance energy efficiency.
Second, for each subfigure, we assess the influence of installation configurations. Type 1 achieves the highest power generation efficiency, with Type 3 outperforming Type 2. For instance, under U r e f = 4.0 m / s , the efficiency of Type 1 on the roof is approximately 0.191, compared to 0.187 for Type 2 with a 2.1% improvement. On windward walls, the efficiency difference even reaches 3.7%. Thus, effective ventilation structures play a critical role in enhancing power generation efficiency.
Third, we consider the impact of ambient wind speed. Figure 7 shows that as wind speed increases, the power generation efficiency of all three installation configurations rises. This is primarily because higher wind speeds enhance PV panel heat dissipation, lower operating temperature, and improve energy conversion efficiency. However, Figure 8 indicates that total power generation changes relatively moderately, with only slight growth within the 0.5–4.0 m/s range, suggesting that wind speed mainly affects unit-area power generation performance by improving efficiency, while overall power generation is less sensitive to wind speed due to constraints from factors like solar irradiance.

4.1.2. Energy Saving Benefits Analysis

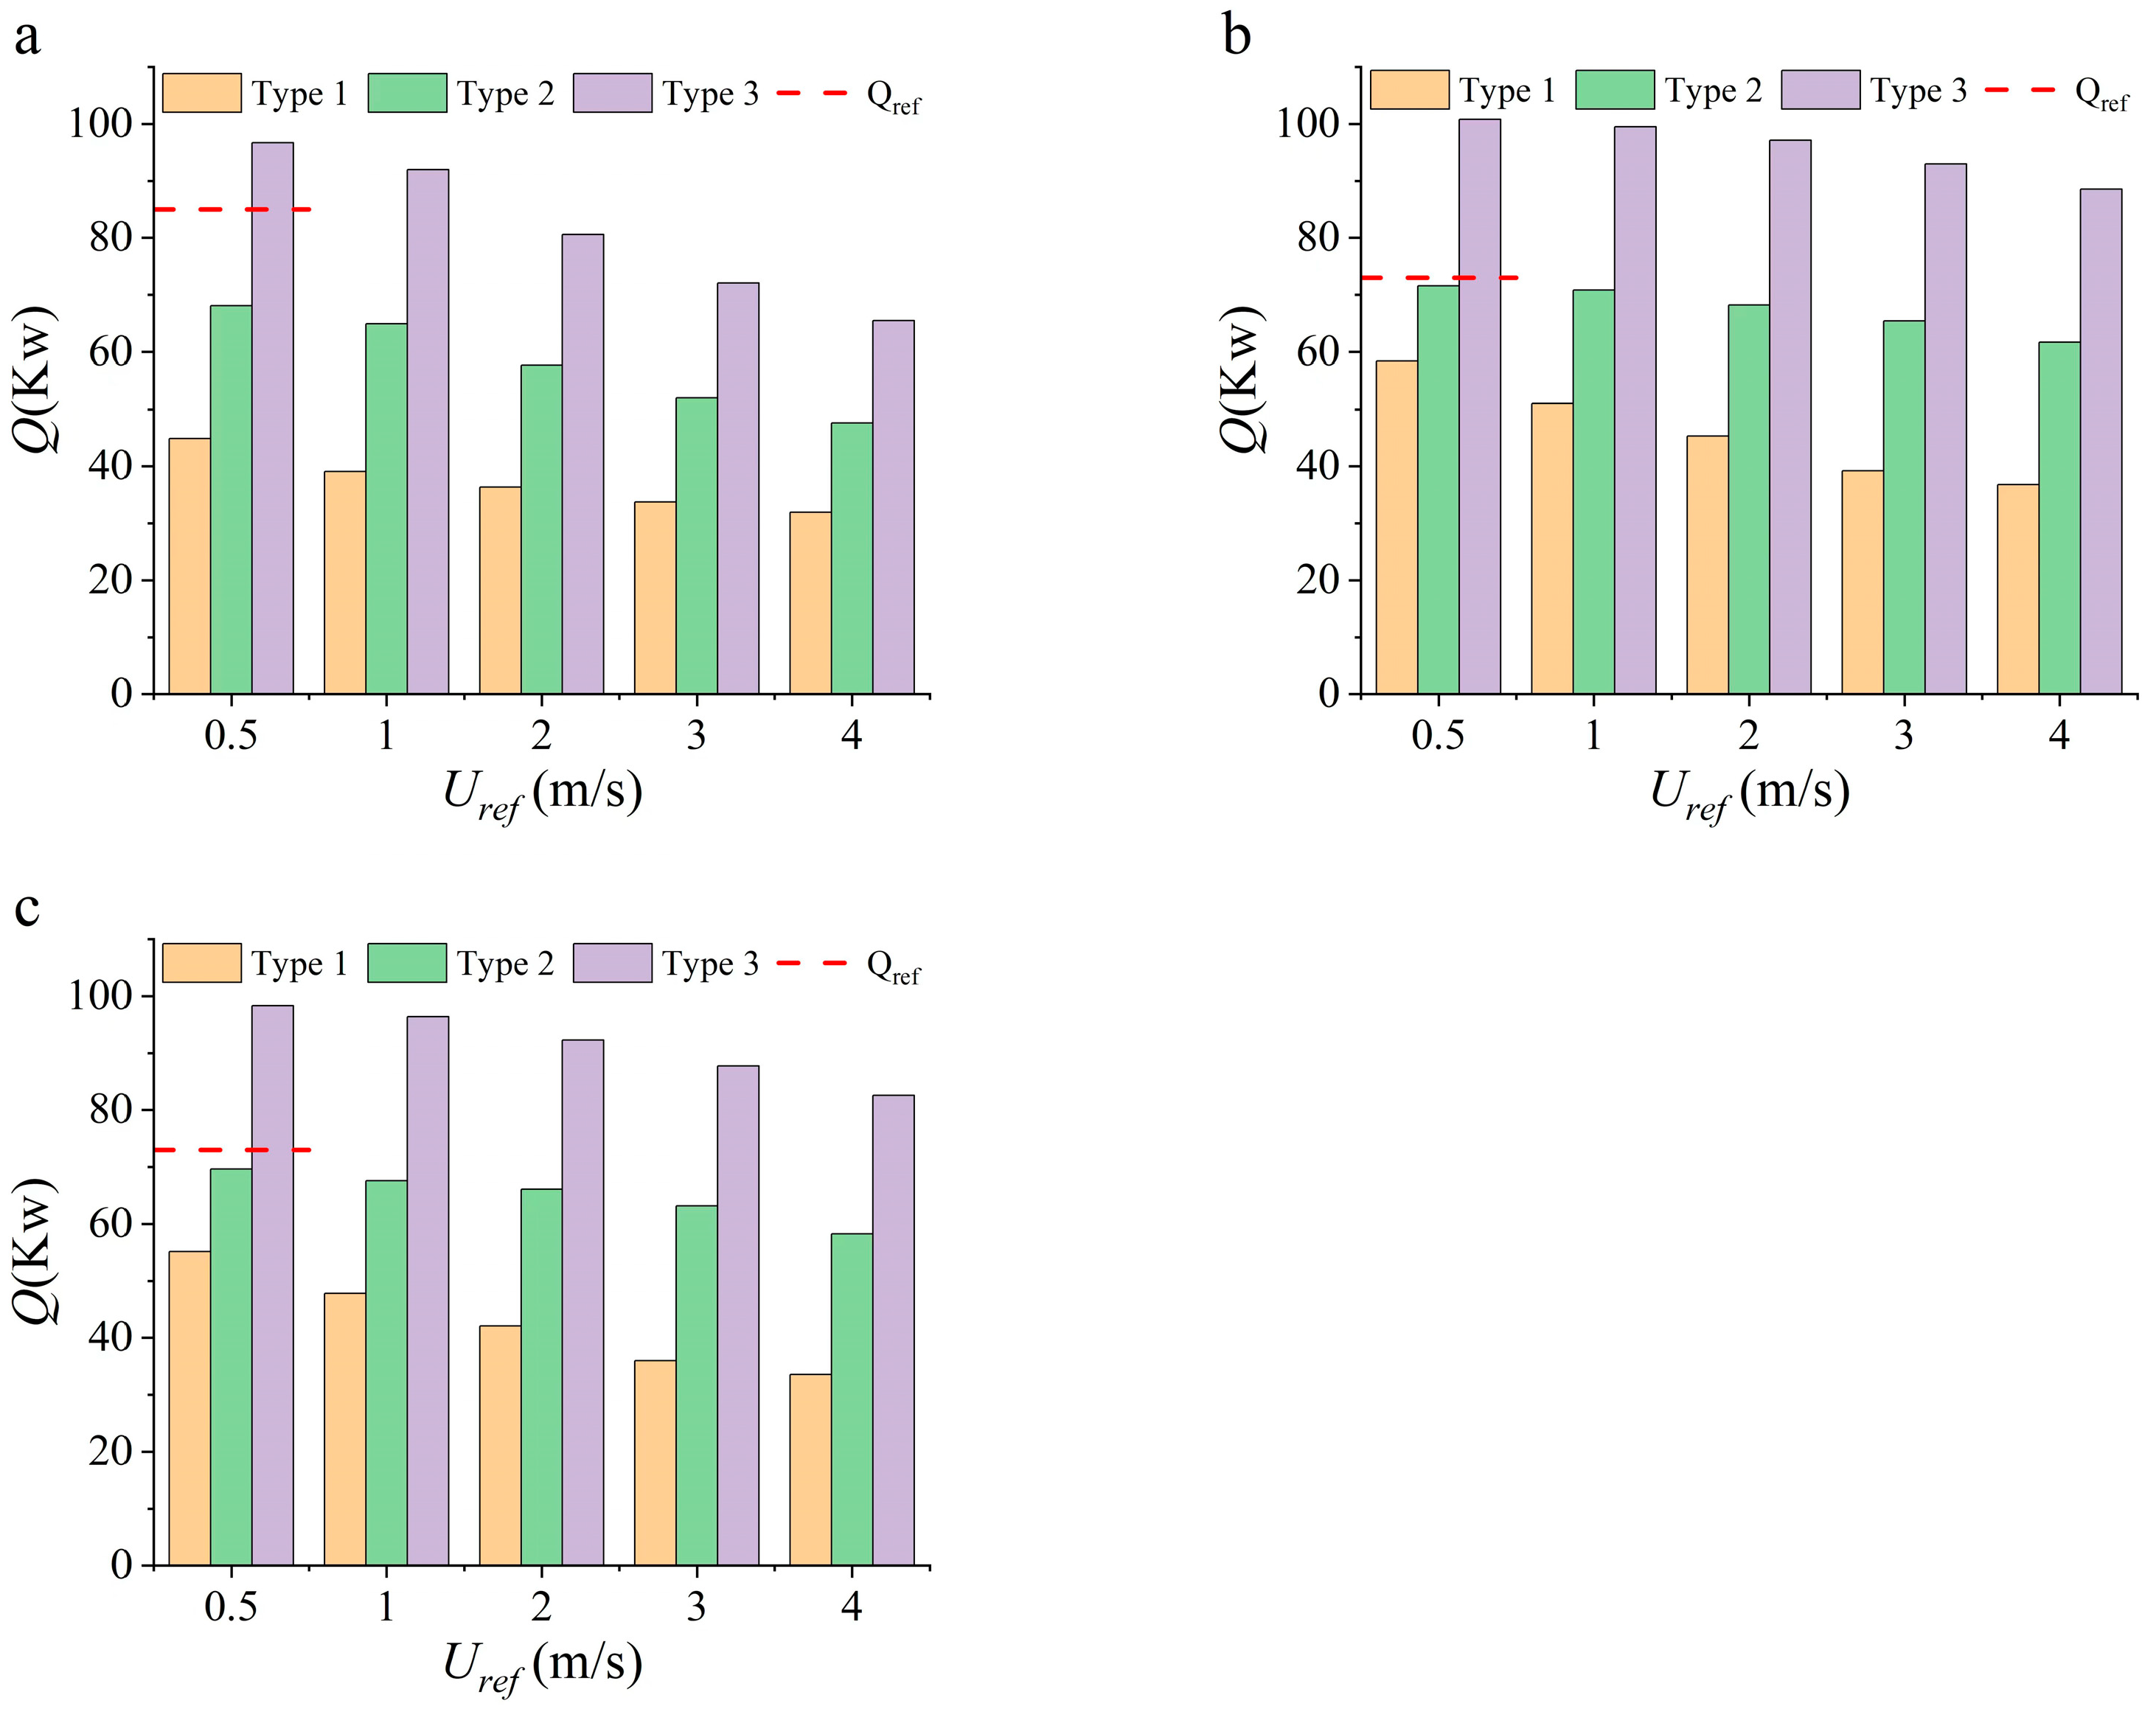
Figure 9 illustrates the variation in heat gain (Q) by the building through the BIPV envelope, as calculated using Equations (1)–(3). Subfigures a–c represent different installation locations: the rooftop, leeward facade, and windward facade, respectively.
Under the three installation locations illustrated in subfigures a–c, the results exhibit a consistent overall trend. However, the magnitude of heat gain reduction varies with the mounting configuration, indicating that different mounting configuration of the BIPV system lead to distinct levels of thermal insulation performance. For installation Type 1 (with ventilated channel), the open air flow channel between PV panels and the building surface effectively dissipates heat, significantly reducing heat transfer to the building surface and achieving the best thermal insulation performance. Type 2 (with enclosed channel), although with an air gap, exhibits heat accumulation due to stagnant air, resulting in better insulation than the no-PV baseline but worse than Type 1. Type 3 (direct attachment), however, leads to increased heat gain due to the significantly higher surface temperature of PV materials compared to conventional building materials. Further analysis reveals that wind speed enhances thermal insulation performance, with higher wind speeds resulting in better insulation.
A comparison of subfigures a–c shows that rooftop installation results in lower heat gain, primarily because rooftop ventilation is more effective. In contrast, wall-mounted configurations produce higher heat gain. The patterns in Figure 9b,c are broadly similar, as both leeward and windward facades experience comparable wind-driven convective cooling. However, subtle differences remain: on the leeward facade, recirculating airflow causes localized heat buildup, whereas on the windward facade, direct wind impingement promotes a more uniform cooling effect.
Changes in building heat gain directly affect the cooling load and, in turn, the cooling energy consumption. To facilitate a standardized comparison between different configurations, this study uses a representative fixed Coefficient of Performance (COP = 3) to provide a estimation of the cooling electricity consumption (E) from the heat gain (Q), following the relation E Q / C O P = Q / 3 . It should be noted that this is a simplification, as the actual COP of air conditioners varies dynamically with factors like outdoor temperature. However, this approach provides a clear baseline for assessing the relative thermal performance of different BIPV configurations. Therefore, differences in cooling electricity consumption under various PV installation configurations are linearly related to differences in heat gain. According to the Practical Handbook of Heating and Air-Conditioning Design [47], the heat transfer through conventional envelopes under no-wind conditions is determined and shown in Figure 9 as a red reference line on the vertical axis (expressed as Qref). Based on this estimation, and relative to this baseline of traditional non-PV materials, installation Type 1 is estimated to reduce cooling electricity consumption (E) by 20–43%, Type 2 reduces it by 4–17%, while Type 3 results in an increase of 19–38%.
In summary, rooftop installation demonstrates clear advantages in PV performance. Across all tested conditions, the ventilated channel configuration (Type 1) delivers the best power generation efficiency while also strengthening building thermal insulation, thereby reducing cooling load and electricity consumption. These findings highlight the combined benefits of installation location and configuration on both energy production and savings. Therefore, installation Type 1 is adopted in the subsequent analysis of BIPV impacts on street canyon environments, providing a consistent basis for evaluating environmental performance.

4.2. BIPV System Environmental Impacts

In this section, the air temperature distribution within the street canyon is presented using the temperature difference, denoted as T , expressed in relative T T o u t , terms T o u t with reference to the ambient temperature outside the street canyon, which is 35 °C. Velocity and pollutant concentration adopt dimensionless forms; the dimensionless velocity is given by U / U r e f , while the dimensionless concentration is described as follows:
C * = c ¯ U r e f H W V ,
where V represents the volume of the street canyon (m3).

4.2.1. Flow Field Analysis

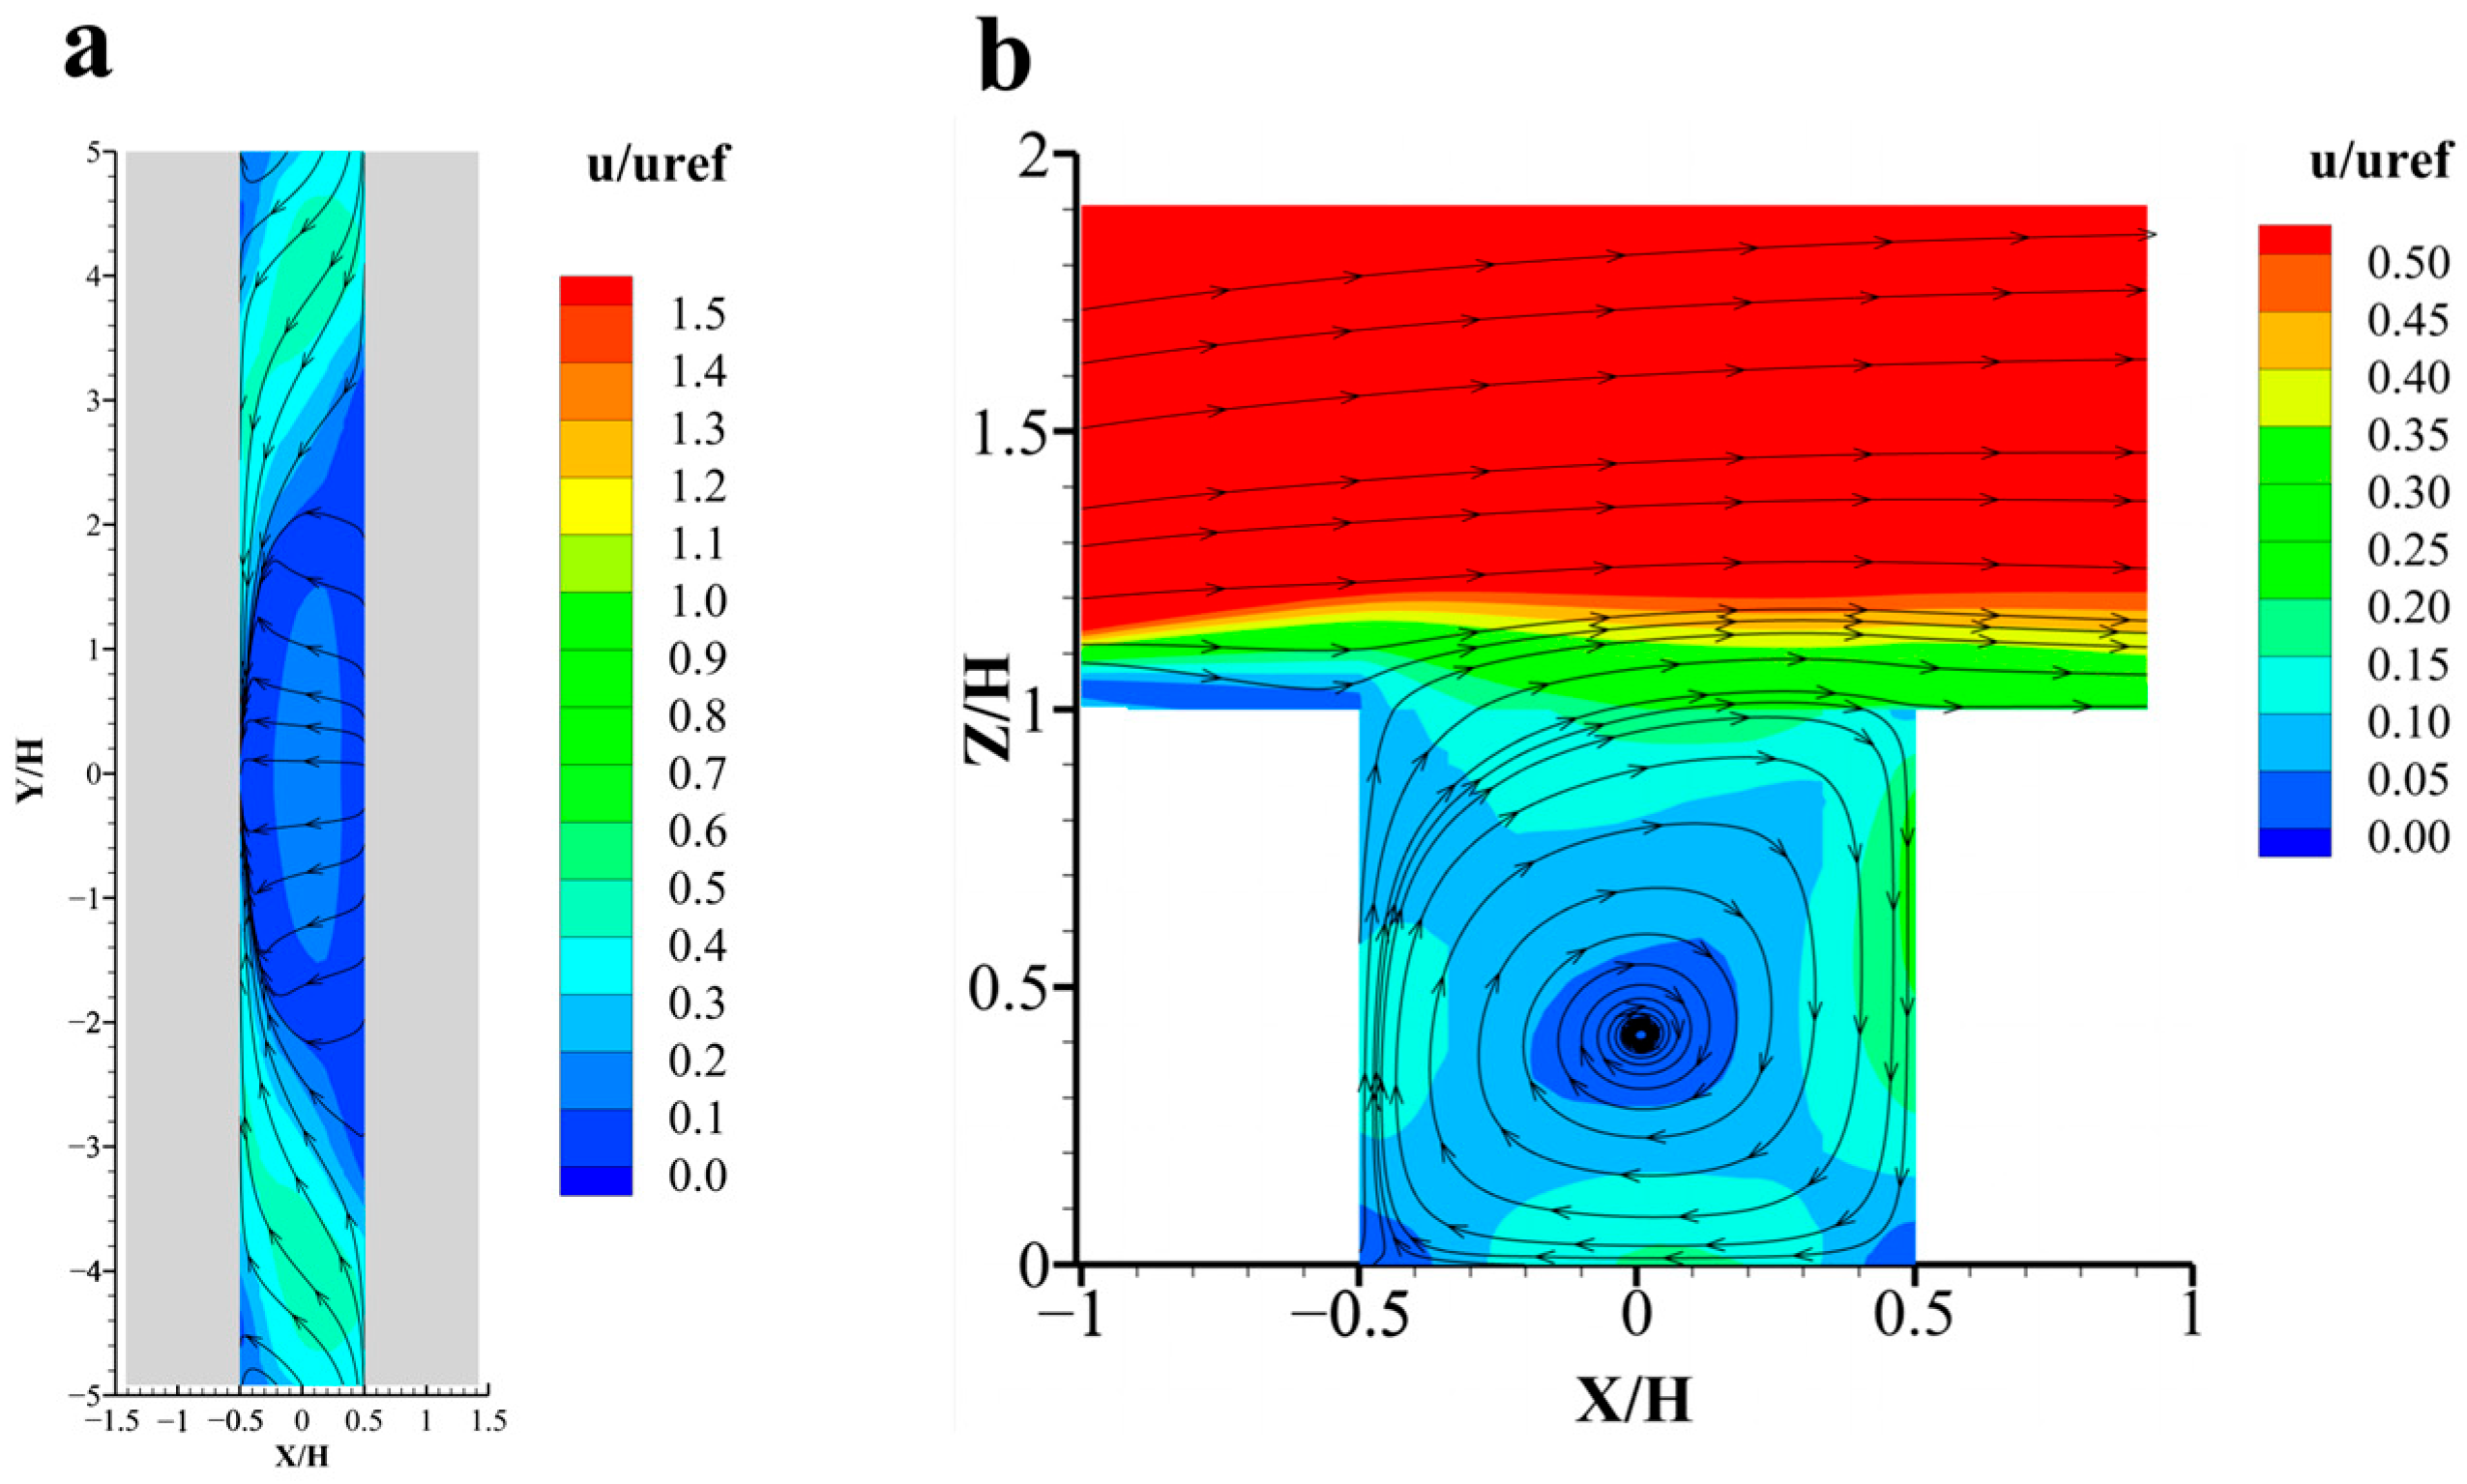
Taking the urban street canyon without PV panels as the baseline, existing research [23,48,49] indicates this street canyon environment can be considered an ideal isothermal environment. Simulation results demonstrate that within such an isothermal setting, the airflow pattern inside the street canyon remains consistent across varying ambient wind speed conditions. The dimensionless velocity U / U ref within the canyon exhibits remarkable consistency, confirming that the internal airflow velocity distribution can be reliably predicted based on the incoming wind speed, as illustrated in Figure 10. The horizontal section in Figure 10a (located at pedestrian height z = 1.7 m in the x–y plane) reveals a large isolated low-speed region (blue-shaded) in the central part of the street canyon, with small corner vortices appearing at both ends. Flow field analysis indicates that horizontal momentum transport inside the canyon is strongly suppressed. The typical vortex structure is evident in the central longitudinal section shown in Figure 10b (the x–z plane at the canyon center; this convention applies to subsequent references). Relative to the external wind speed, the airflow within the canyon is greatly reduced, and the velocity in the central region nearly drops to zero (blue-shaded). In this region, air exchange is driven primarily by vertical ventilation.
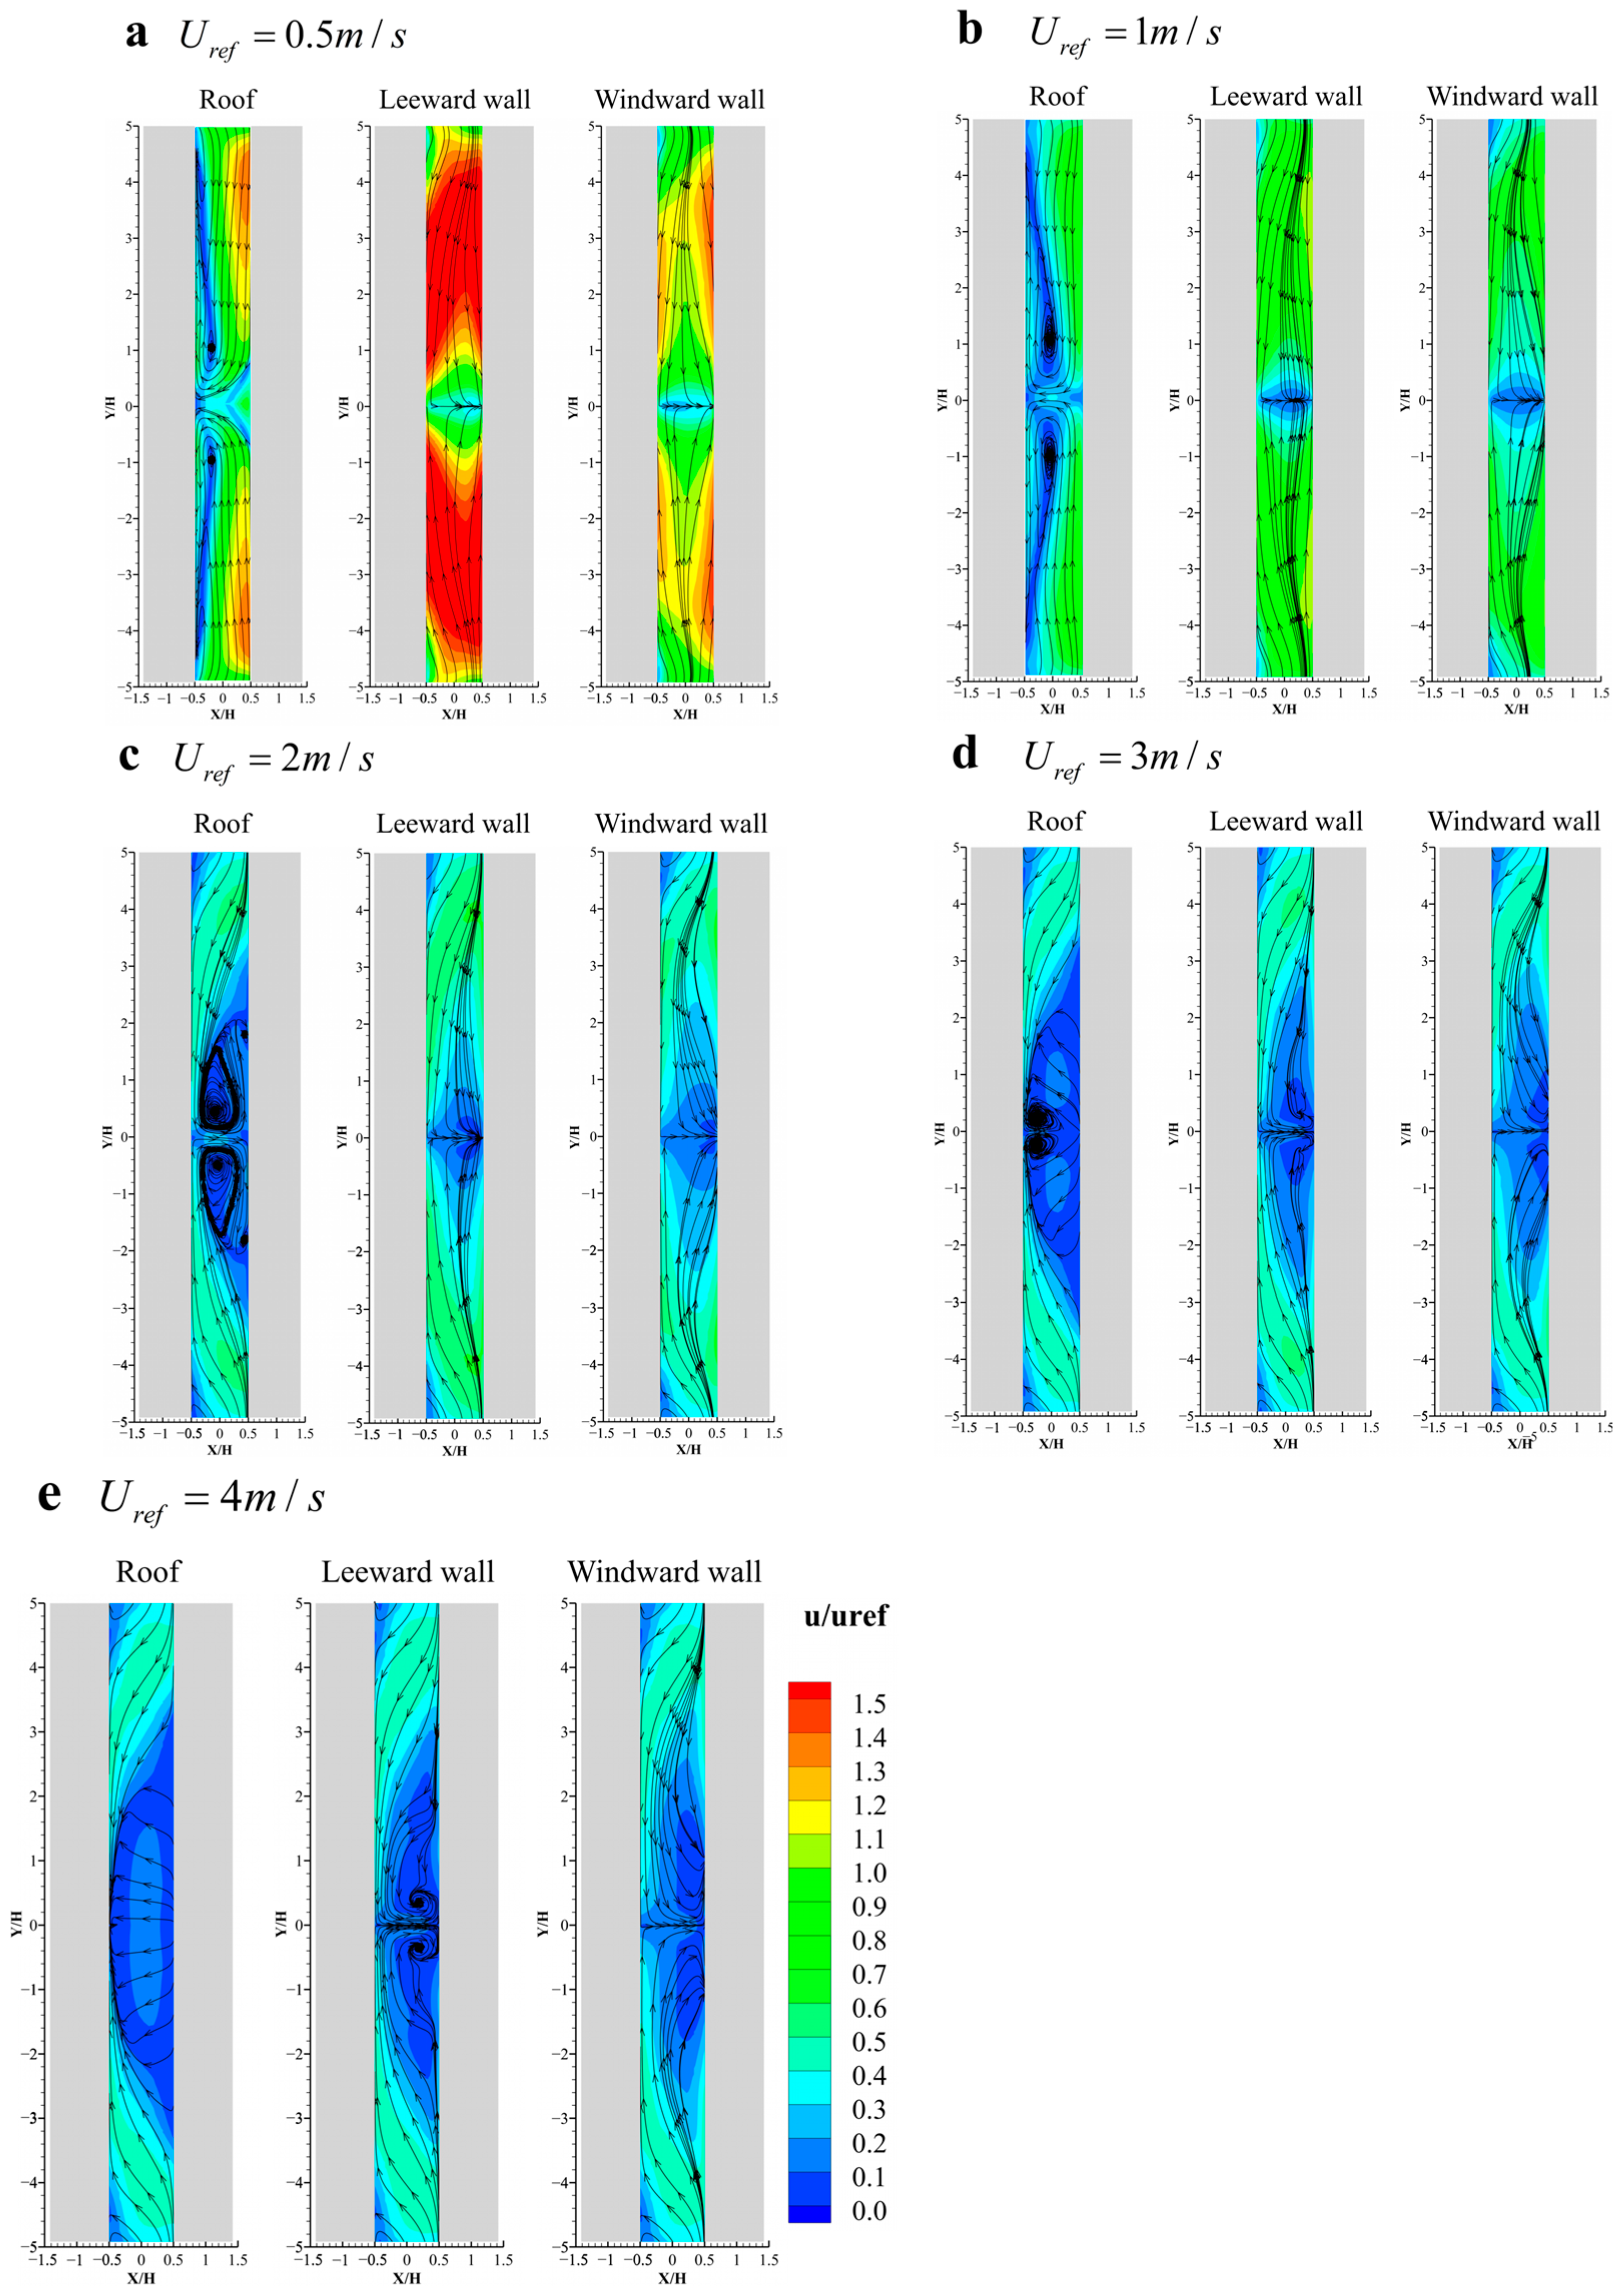
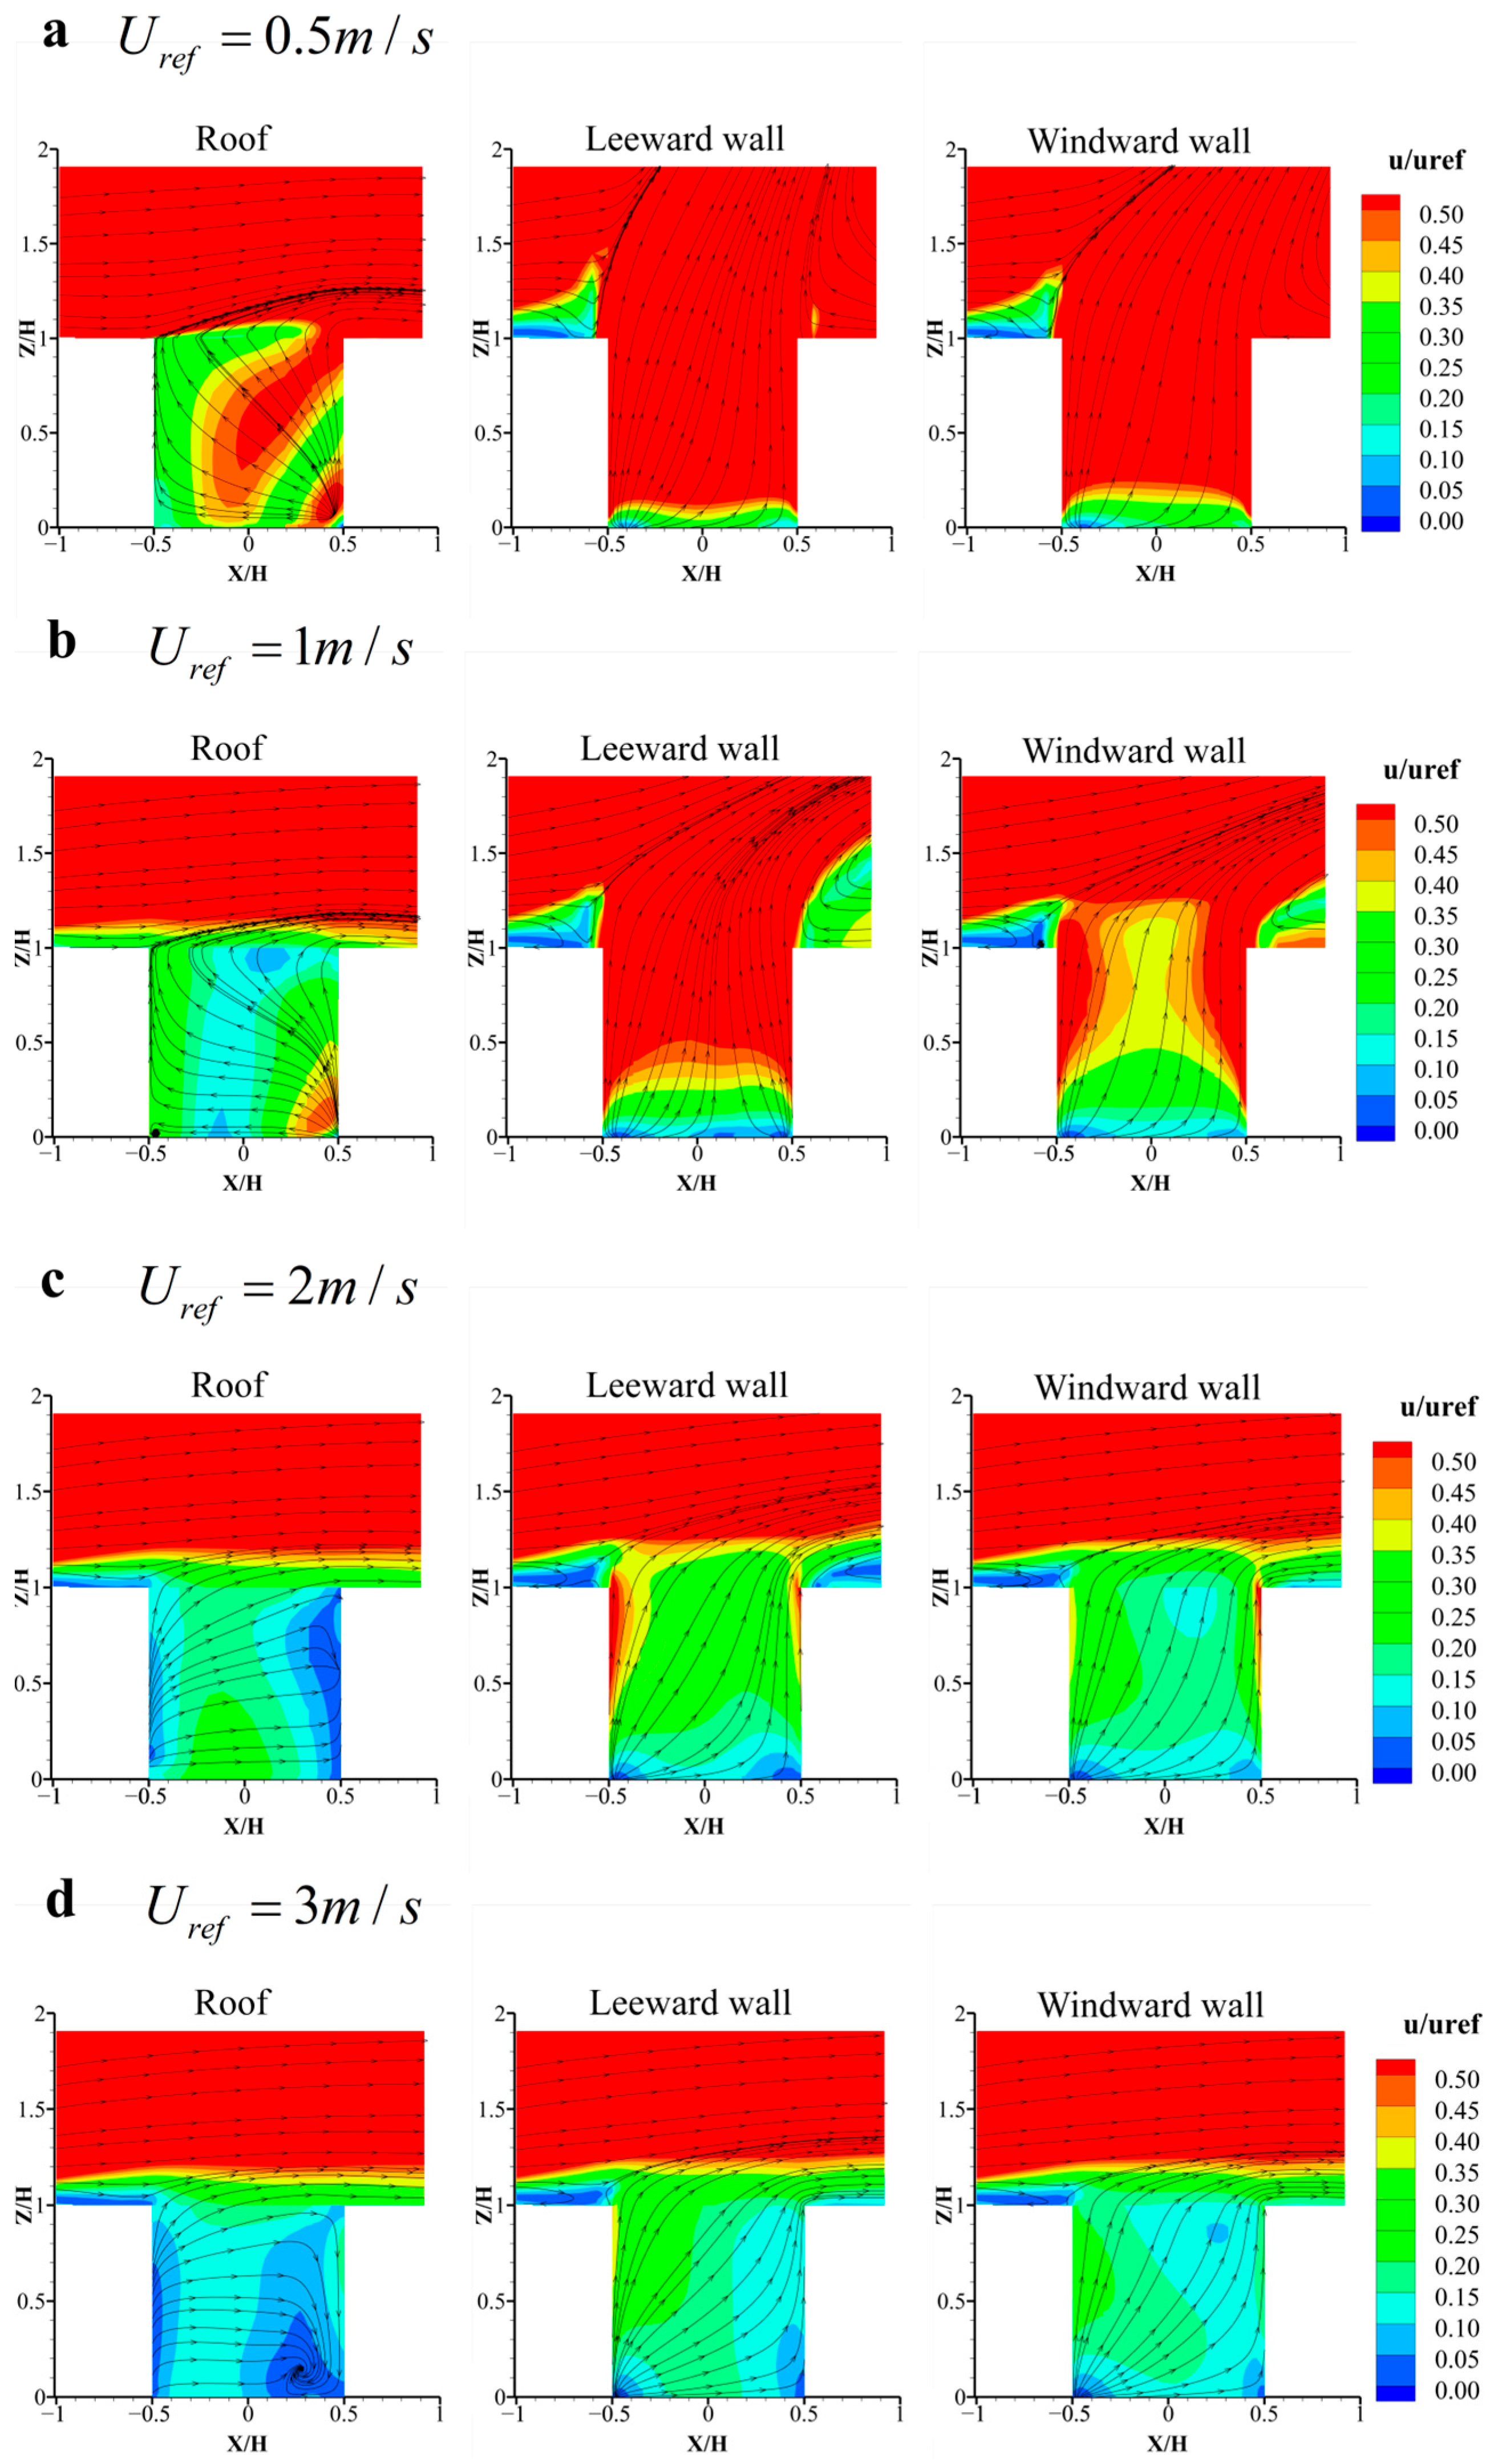
The following section focuses on the impact of BIPV on the street canyon environment. As discussed previously, the installation configuration with a ventilated channel (Type 1) is adopted. Figure 11 and Figure 12 present the flow field distributions for the pedestrian height cross-section and the longitudinal cross-section at the center of the street canyon, respectively. To assess the impact of installation position on system performance, three locations are considered in each subplot: the rooftop, the leeward facade, and the windward facade. Subplots (a)–(e) correspond to reference wind speeds of 0.5 m/s, 1.0 m/s, 2.0 m/s, 3.0 m/s, and 4.0 m/s, respectively, thereby enabling a systematic comparison under varying ventilation conditions.
Compared to Figure 10, introducing PV panels significantly changes the street canyon’s flow characteristics, particularly under low wind speed conditions. First, comparing Figure 11 with Figure 10a reveals that the PV panels cause a reduction in the low-speed area (blue-shaded); the airflow also exhibits a marked tendency to converge from the canyon’s ends toward its center. This indicates that the PV panel arrangement enhances airflow within the street canyon and promotes vertical ventilation to some extent. Notably, when comparing different mounting locations, the low-speed area (blue-shaded) is smallest for the leeward facade case, followed by the windward facade and the rooftops. Moreover, as ambient wind speed rises, the blocking of horizontal flow inside the canyon becomes stronger, and the flow pattern looks more like the state shown in Figure 10a, with the influence of the PV panels progressively diminishing.
Similarly, compared with Figure 10b, Figure 12 demonstrates that PV panels significantly change the vertical airflow distribution inside the canyon. Within the canyon, the upward flow breaks through the horizontal shear layer created by the ambient wind, leading to airflow redistribution in the vertical direction and improving ventilation. However, when the ambient wind speed increases, this upward flow is suppressed by the stronger horizontal shear at the roof level. This means the positive effect of PV panels on canyon ventilation gradually decreases with higher wind speeds. Comparing different installation locations, the leeward facade provides the greatest improvement in ventilation, followed by the windward facade, and finally the rooftop. At lower ambient wind speeds, the outlet flow rate at the top of the street canyon increases noticeably. For example, when the ambient wind speed is 0.5 m/s, compared to a canyon without PV panels, the rooftop PV can increase the flow rate by 1.43 times, the leeward facade PV can increase the flow rate by 3.02 times, and the windward facade PV can increase the flow rate by 2.09 times; when the ambient wind speed is 1 m/s, the multiples of the flow rate increased are 0.48, 1.21, and 0.82, respectively.

4.2.2. Temperature Field Analysis

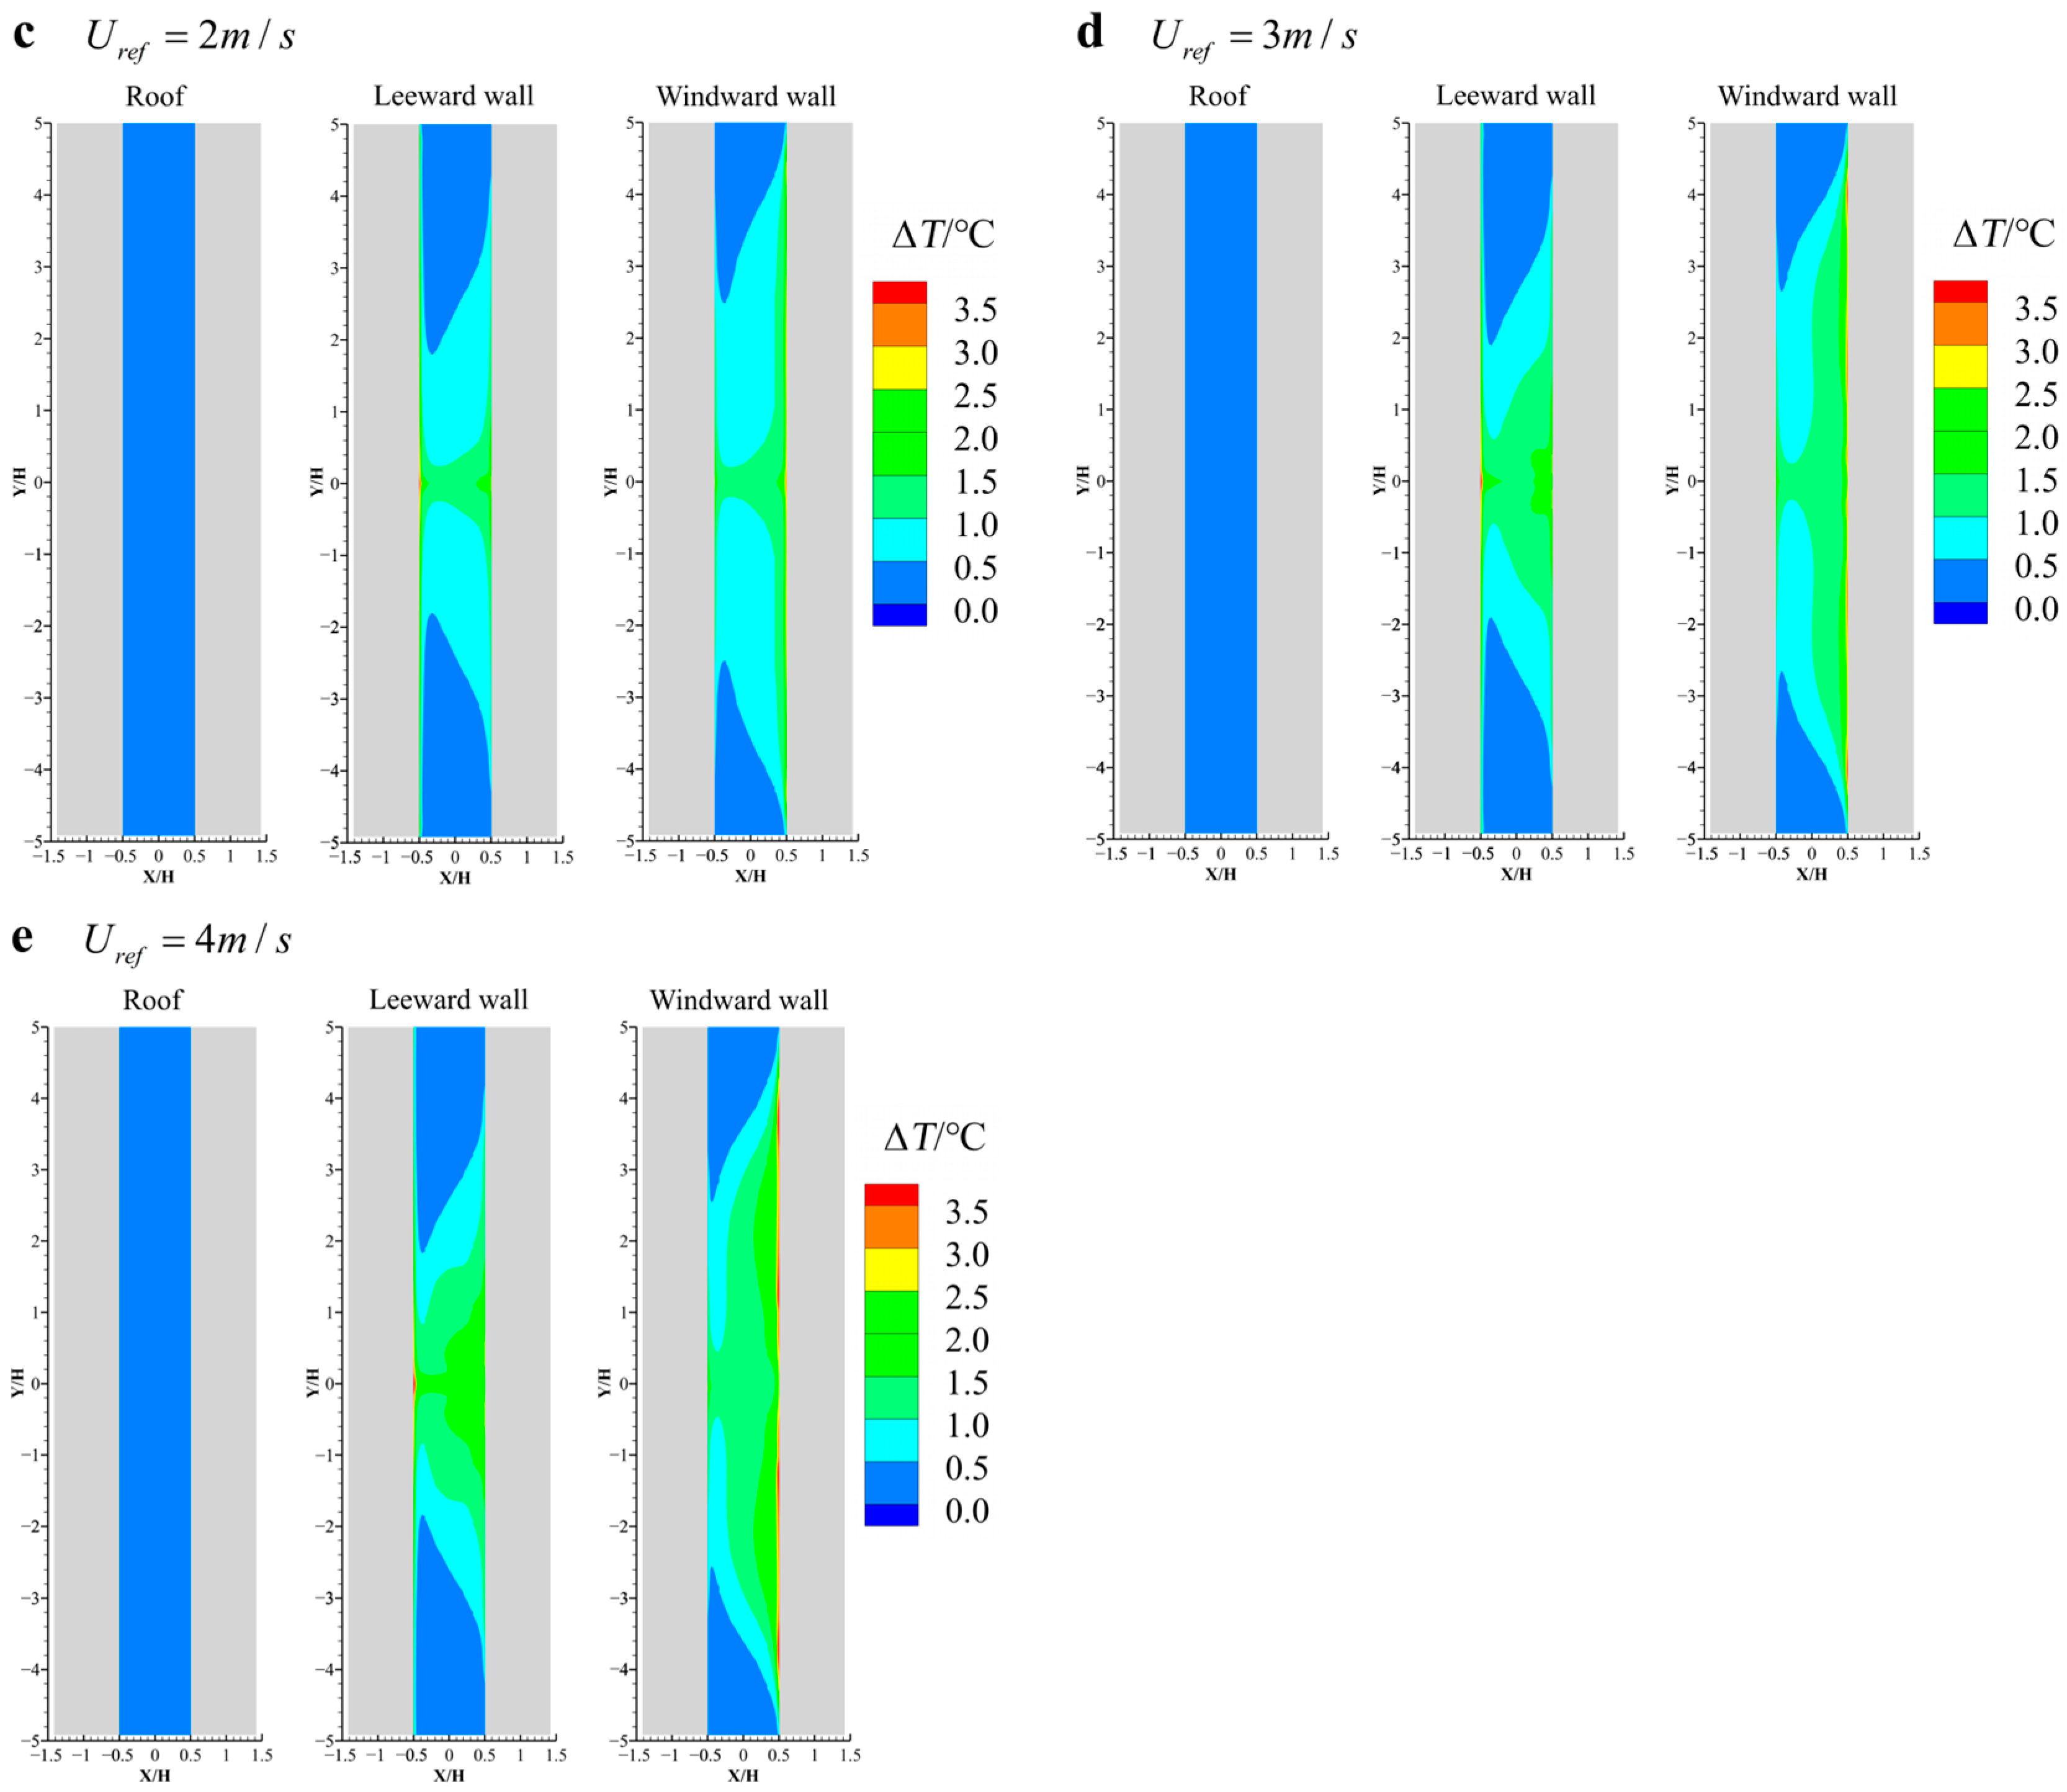
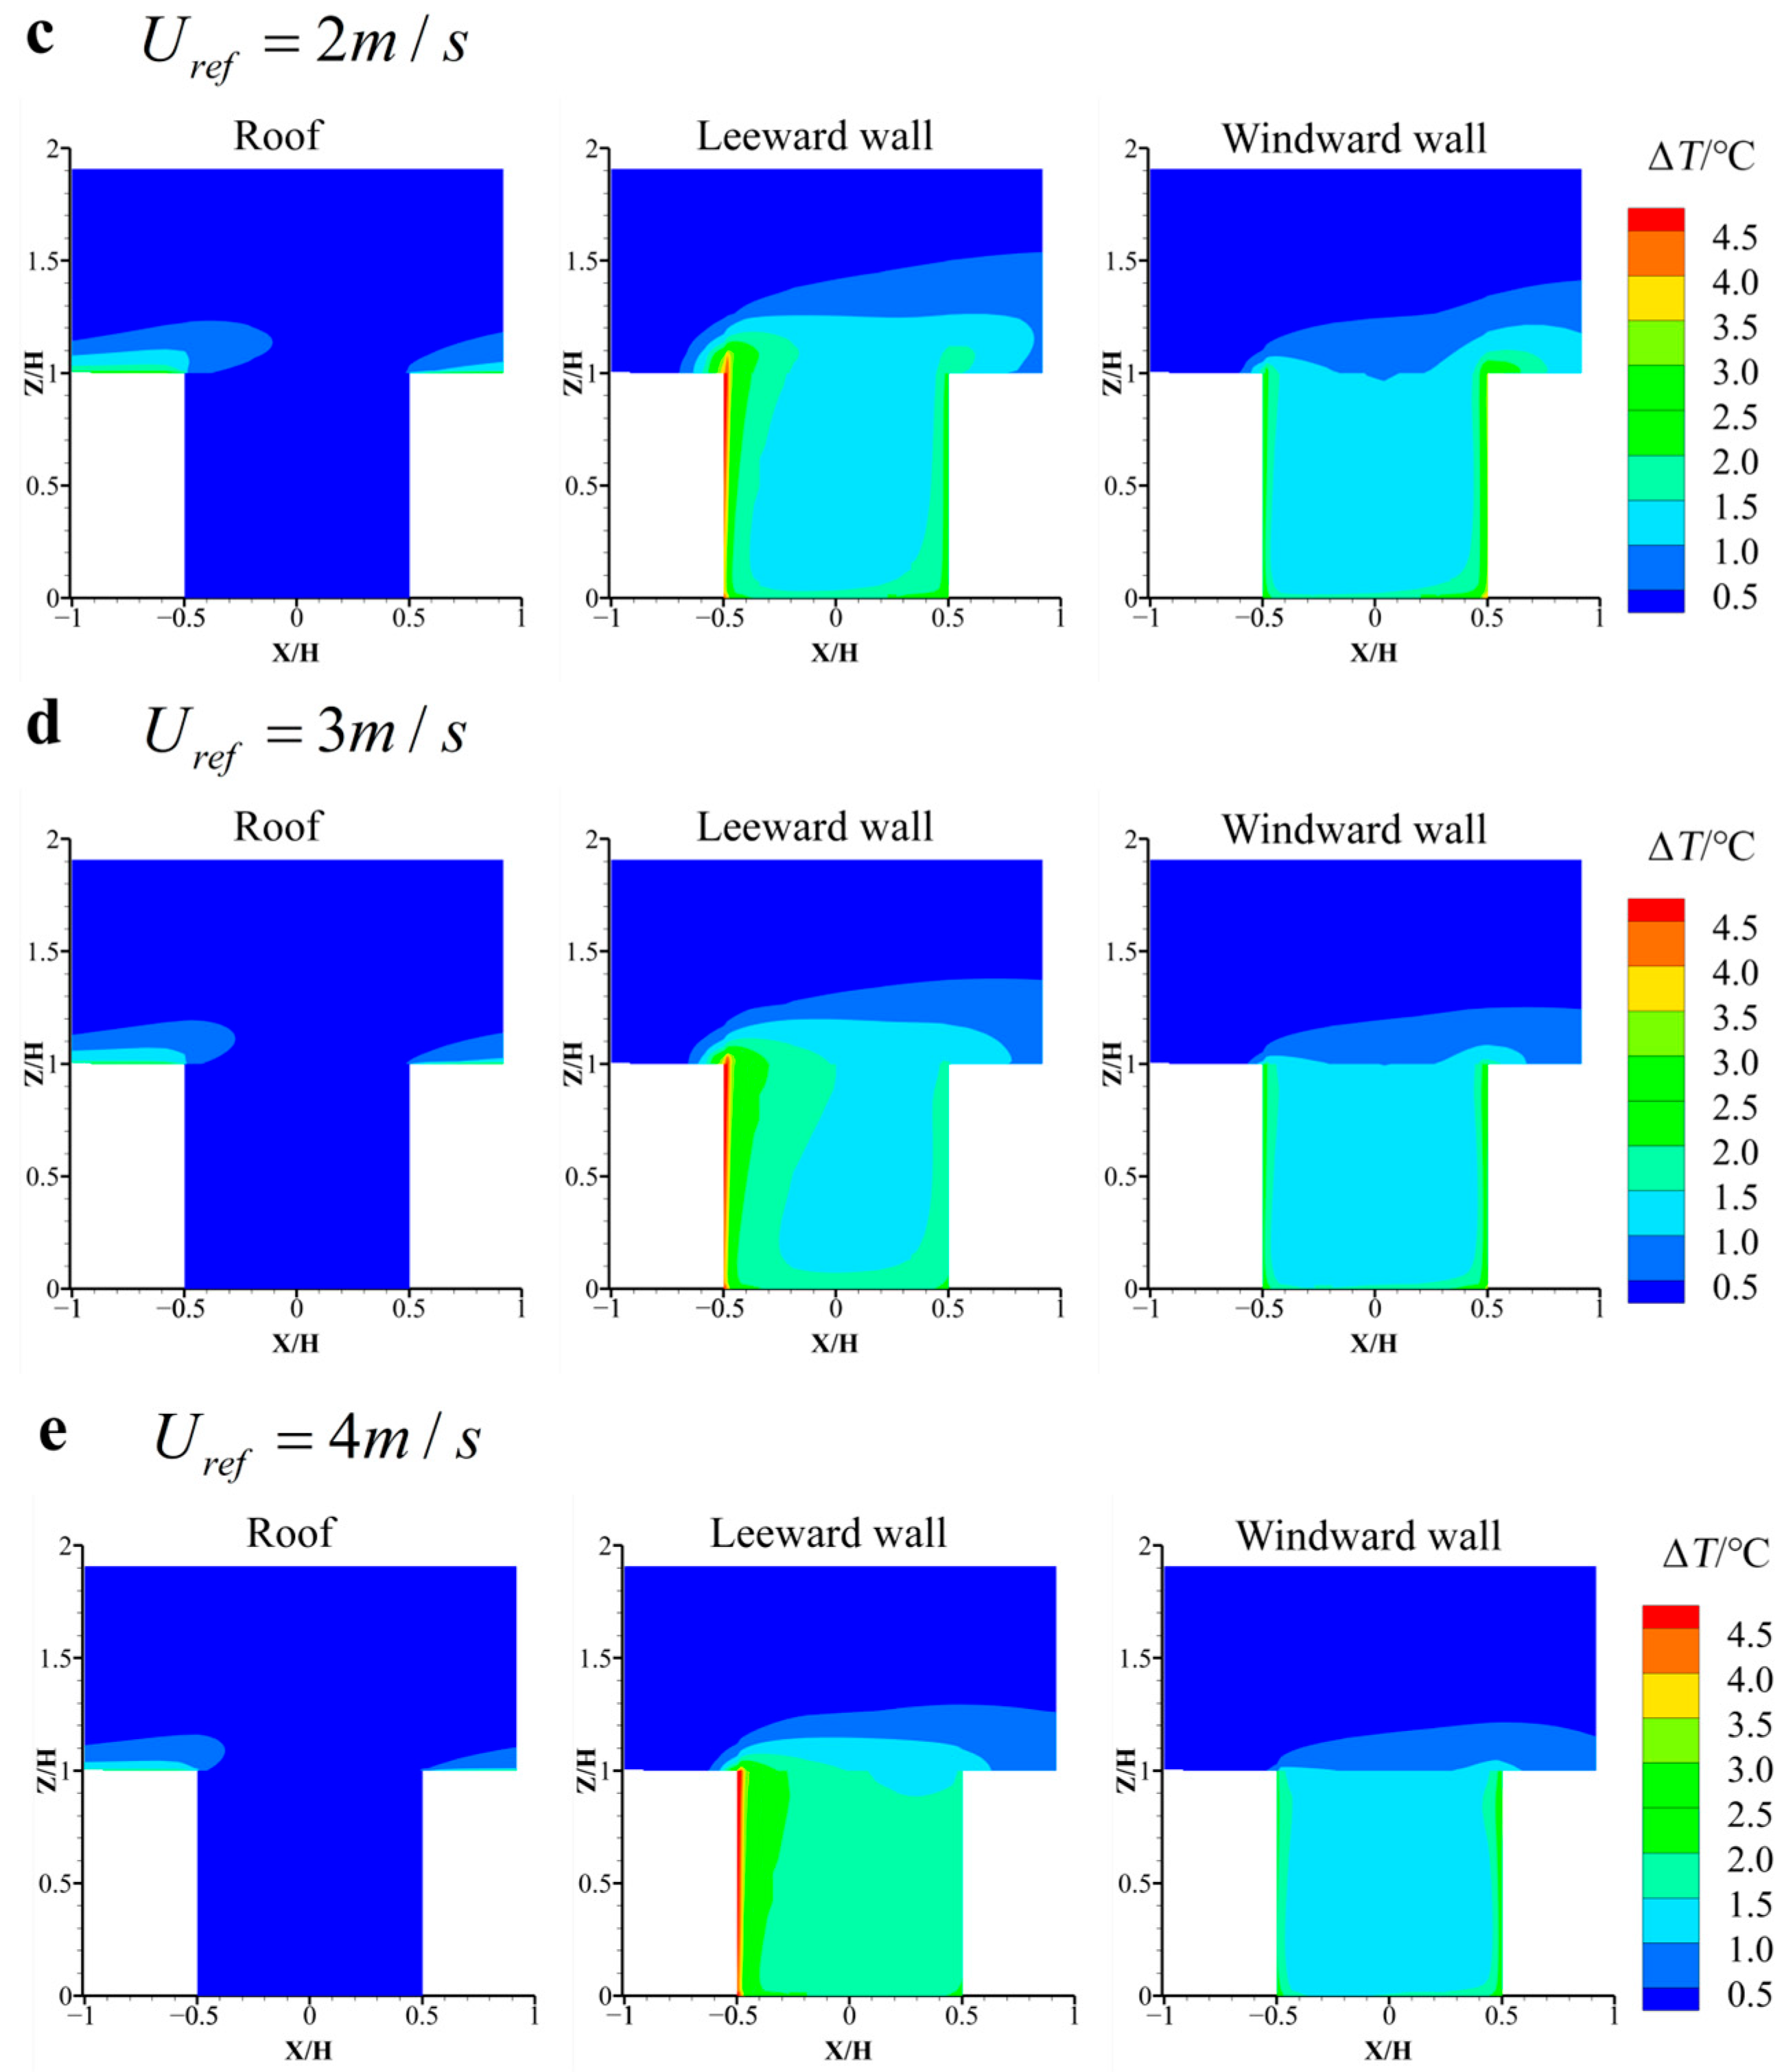
Figure 13 and Figure 14 illustrate how the temperature distribution in the street canyon change with the ambient wind speed. When the PV panels are mounted on the rooftops, the heat source is positioned above the street canyon and primarily diffused upwards. As a result, only a small amount of heat is drawn into the canyon, leading to a very limited rise in temperature within the street space. In contrast, when PV panels are mounted on the windward or leeward facades inside the canyon, the released heat directly into the canyon environment, thereby increasing the ambient air temperatures in the confined street space. Figure 13 shows that at the pedestrian height, rooftop PV has little effect on the canyon temperature, and the temperature distribution remains uniform. In contrast, the windward and leeward facades PV significantly increased the temperature at the canyon center, and the high-temperature area expanded as the ambient wind speed increases. This occurs because higher wind speed enhances the heat transfer coefficient of the photovoltaic wall and increases the heat sensing flux, leading to higher canyon temperatures under windy conditions compared to calm air. Figure 14 shows the temperature distribution in the canyon center. With rooftop PV, the distribution is generally uniform. However, with windward or leeward facade PV, the distribution becomes uneven, with higher temperatures concentrated near the PV wall. With the increase in ambient wind speed, a stable vortex gradually forms in the canyon center, carrying heat away from the wall surface to other regions and making the temperature more evenly distributed. The uniform distribution of heat helps to reduce the local high-temperature phenomenon, but at the same time, is not conducive to the heat out of the canyon. When the ambient wind speed is 0.5 m/s, windward facade PV causes the pedestrian-level temperature in the canyon to rise by about 0.5 °C on average. At 4 m/s, the increase is much greater, reaching about 2.5 °C.
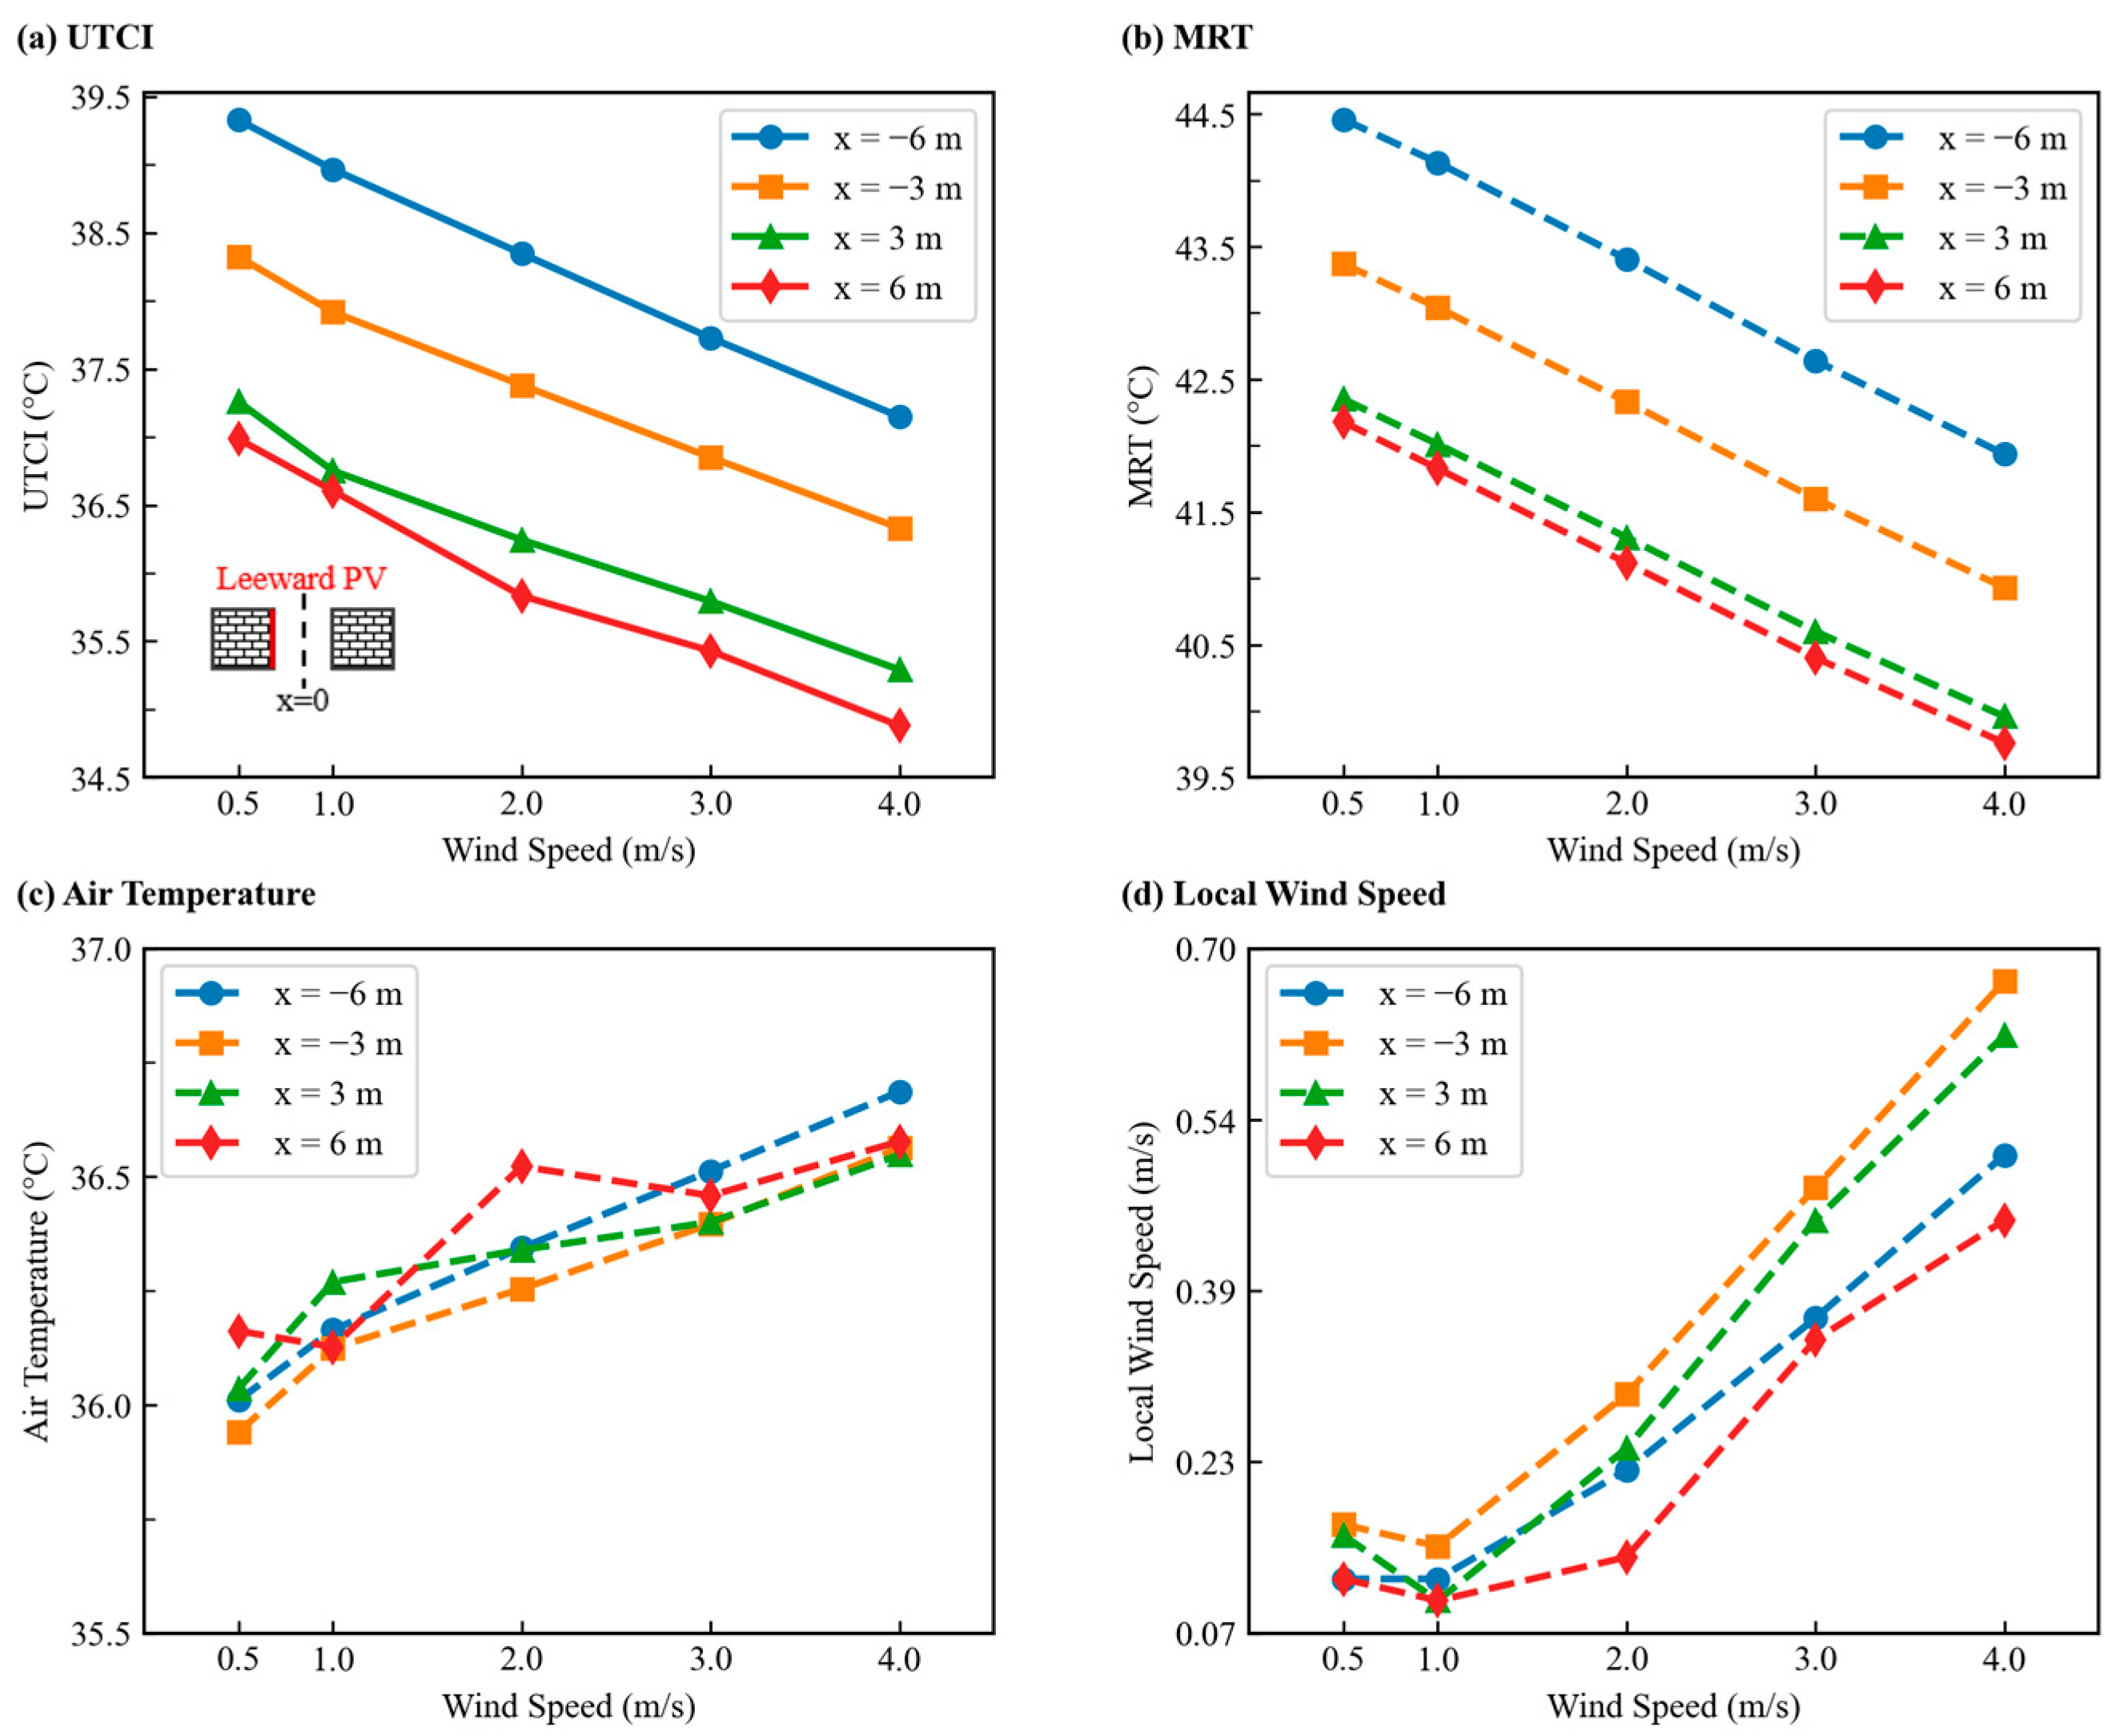
Outdoor thermal comfort analysis is conducted on the central longitudinal section of the street canyon at a height of 1.1 m (representing the center of the human torso). For calculation simplification, pedestrians are treated as points. Universal Thermal Climate Index (UTCI) is calculated following the methodology proposed by Brode et al. [50], with input parameters including simulated air temperature ( T a ), in-canyon wind speed ( U a ), and mean radiant temperature (MRT) calculated from simulated surface temperatures. As the current computational model does not account for humidity, we assume a constant relative humidity of 50% for UTCI calculations. This is considered for two reasons: first, 50% represents a moderate humidity condition typical of outdoor environments and serves as a reasonable baseline when specific data are unavailable; second, this assumption effectively isolates the influence of humidity variation, allowing us to focus on evaluating the relative impact of PV panels on core thermal comfort drivers such as air temperature, mean radiant temperature, and wind speed.
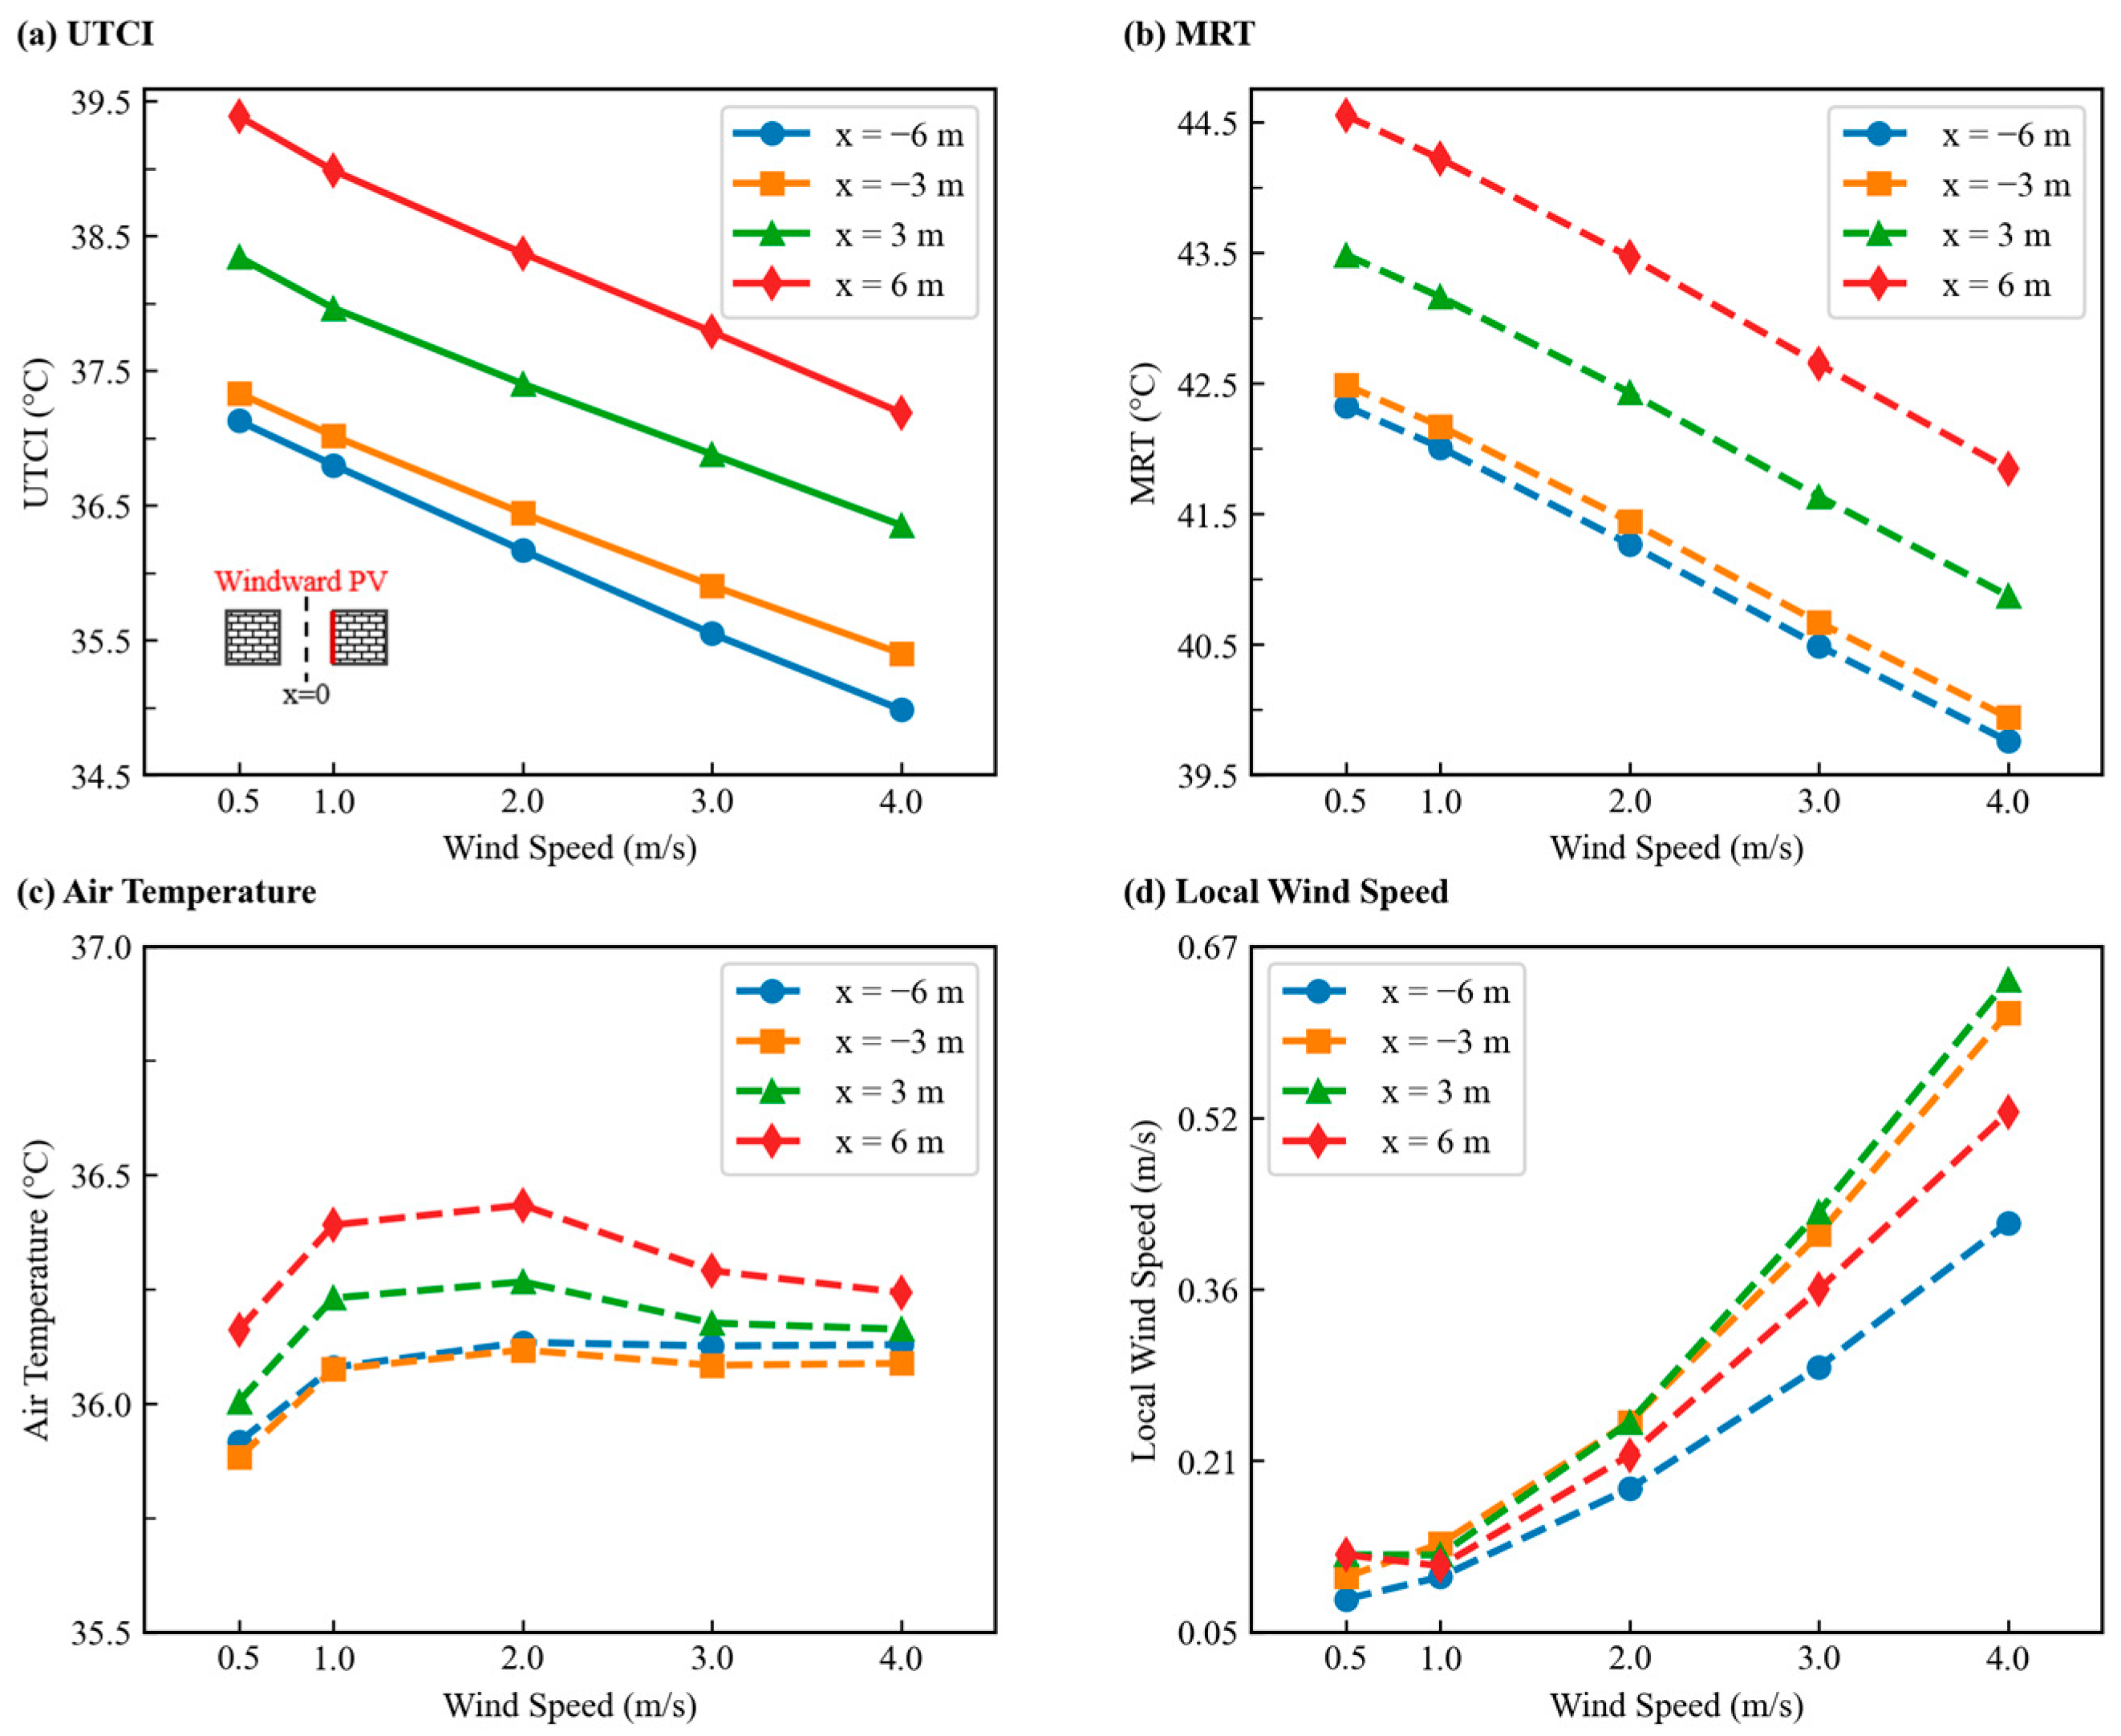
Compared to street canyons without facade PV panels, the introduction of PV panels as an additional heat source typically negatively impacts pedestrian thermal comfort in their vicinity. Figure 15 (leeward facade) and Figure 16 (windward facade) illustrate the variations in pedestrian thermal comfort (UTCI), mean radiant temperature (MRT), air temperature, and local wind speed within the street canyon for two BIPV configurations. The analysis reveals that radiant heat generated by the PV panels is the primary driver of pedestrian discomfort. UTCI trends closely align with MRT, with peak values consistently observed in areas adjacent to the PV panels. Both UTCI and MRT show a decreasing trend with increasing ambient wind speed, indicating improved comfort. Although air temperature may slightly increase in some regions with higher wind speeds, the significant reduction in radiant heat load and the enhanced convective heat dissipation due to increased local wind speed are key factors dominating the improvement in UTCI. This highlights the necessity of considering the PV installation position, radiant heat load, and the interaction of ambient wind with local flow patterns when assessing BIPV’s impact on micro-climates. Overall, the introduction of facade PV panels locally reduces pedestrian thermal comfort, particularly under low-wind conditions, but this negative effect is significantly alleviated with increasing wind speed.

4.2.3. Pollutant Dispersion Analysis

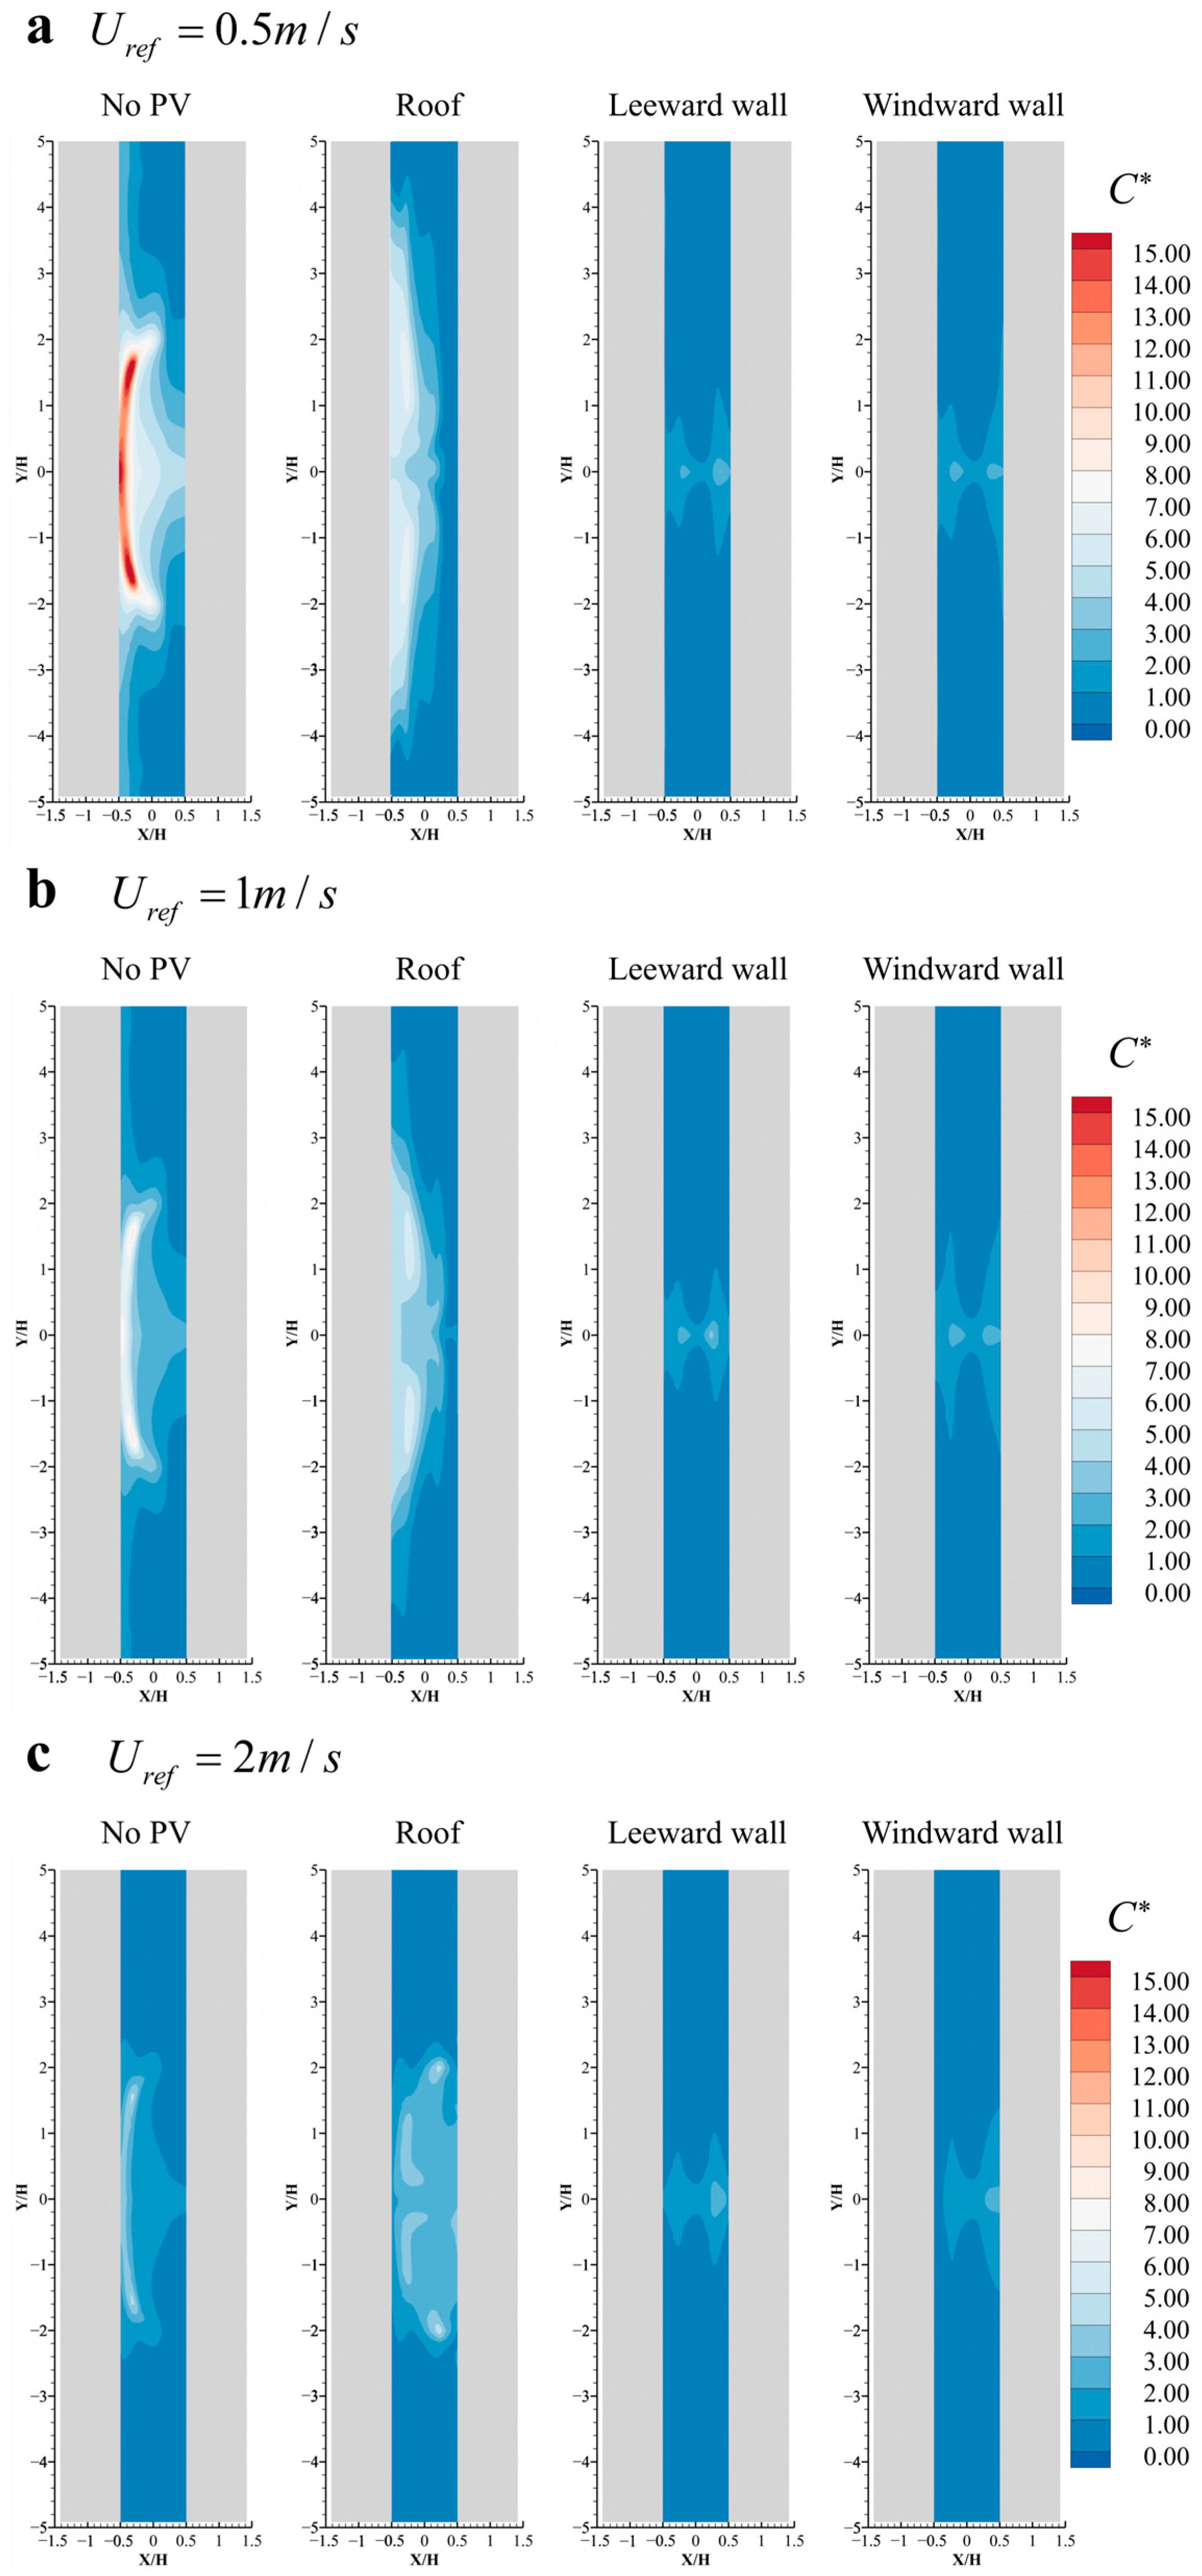
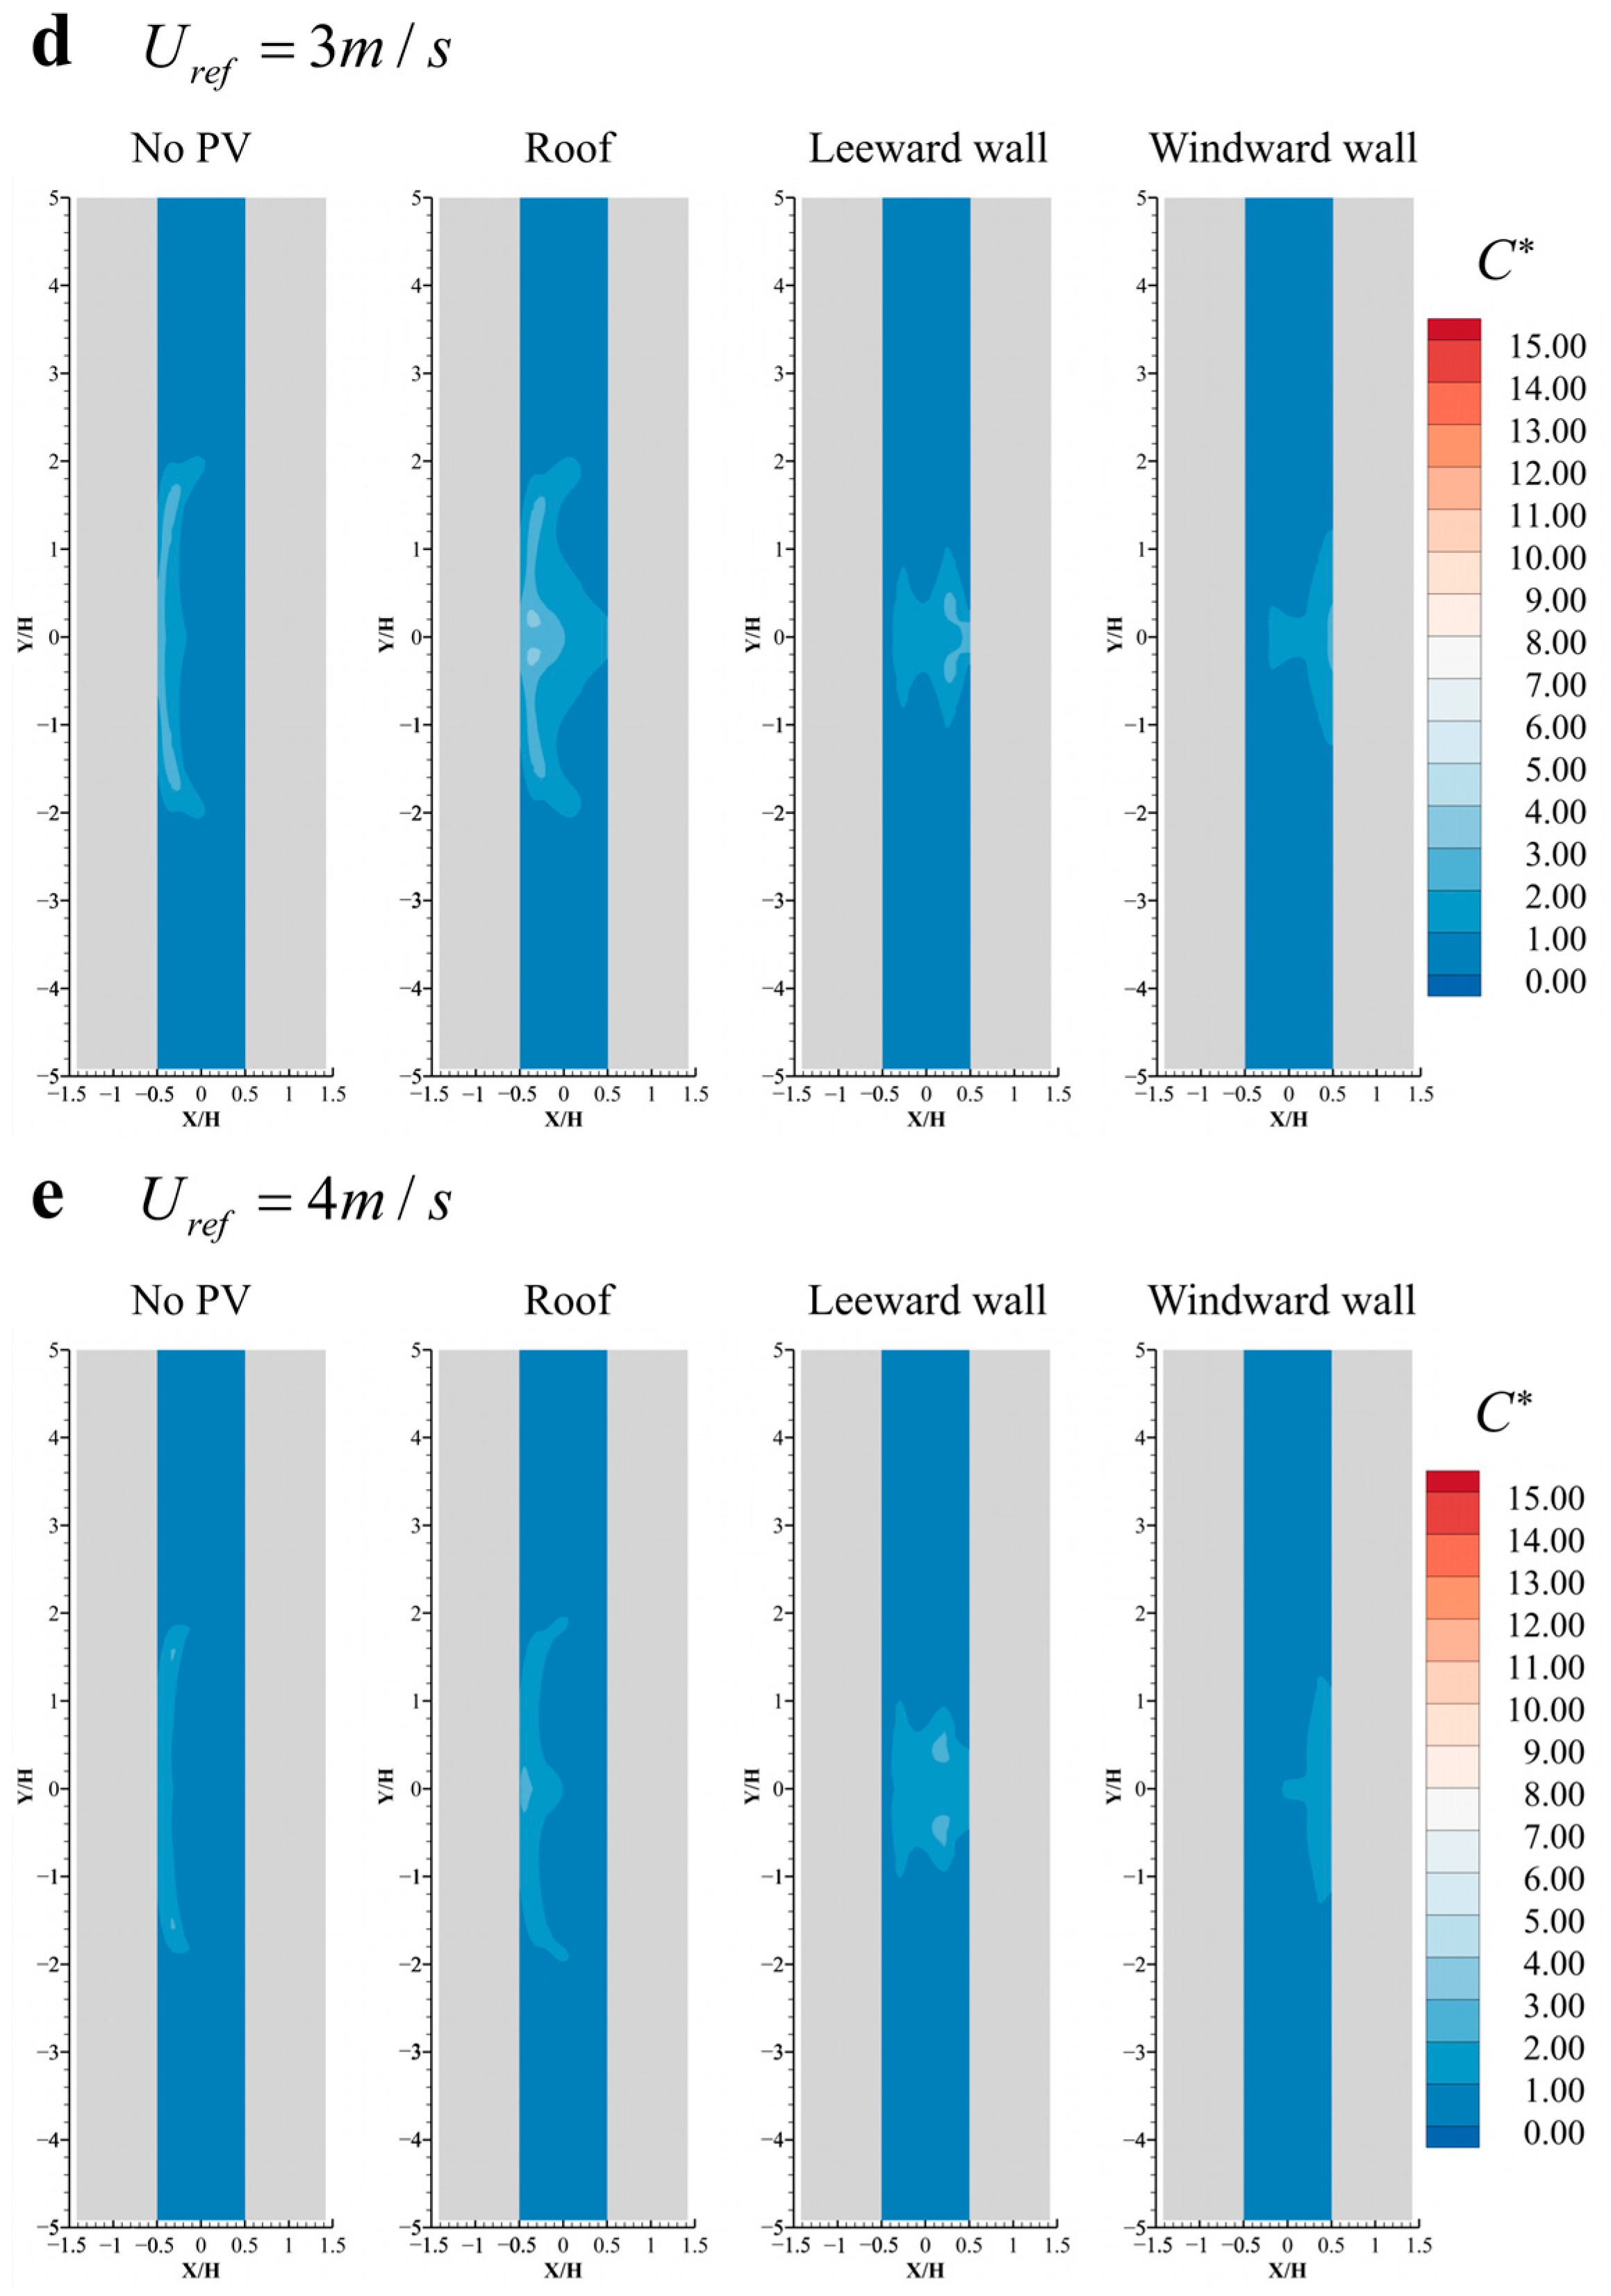
Analysis of pollutant distributions in both cross-sectional (Figure 17) and longitudinal (Figure 18) views shows that higher ambient wind speeds consistently lead to lower pollutant concentrations within the canyon. At the same wind speed, pollutant concentrations are consistently lower in canyons with PV panels than in those without, with the most significant reductions observed when panels are mounted on the windward or leeward facades. This improvement occurs because pollutant removal largely depends on canyon ventilation, and the presence of PV panels alters the flow structure in ways that enhance ventilation efficiency. As a result, pollutant concentration can serve as a practical indicator of ventilation capacity. Future work will build on this finding by further examining pollutant concentration as a key measure for evaluating canyon ventilation.
A volume-averaged analysis of pollutant concentrations was conducted to quantify the influence of PV panel installation locations under different wind conditions, as shown in Figure 19. The results show that at low wind speeds, introducing PV panels significantly reduces pollutant levels. For example, at 0.5 m/s, rooftop, leeward, and windward installations lowered concentrations by 30.1%, 87.7%, and 85.9%, respectively. As wind speed increased, the reduction effect weakened. At 4 m/s, the decreases stabilized at 9.3%, 18.6%, and 19.6% for rooftop, leeward, and windward PV, respectively. Notably, both the no-PV case and the rooftop PV case showed strong decreases in concentration with higher wind speed, while leeward and windward PV maintained relatively stable values, less affected by wind. This indicates that facade-mounted PV is more effective in enhancing canyon ventilation at lower wind speeds.

4.3. Quantitative Analysis of Buoyancy and Wind-Driven Effects

To provide a deeper explanation of the dominant physical mechanisms driving the in-canyon flow under different wind speeds and PV mounted positions, the dimensionless Richardson number (Ri) is introduced to quantitatively assess the relative importance of buoyancy and inertial forces. The Richardson number is defined as the ratio of the buoyancy term to the inertia term:
R i = g β L Δ T U r e f 2
where g is the gravitational acceleration, β is the thermal expansion coefficient, Δ T is the characteristic temperature difference, L is the characteristic length, and U r e f is the reference velocity.
The dominant force can be determined by the magnitude of the Richardson number. When the Ri << 1, it indicates that inertial force dominates; when the Ri >> 1, thermal buoyancy plays a dominant role; and when Ri ≈ 1, both forces are of comparable magnitude, and the flow is in a mixed convection regime.
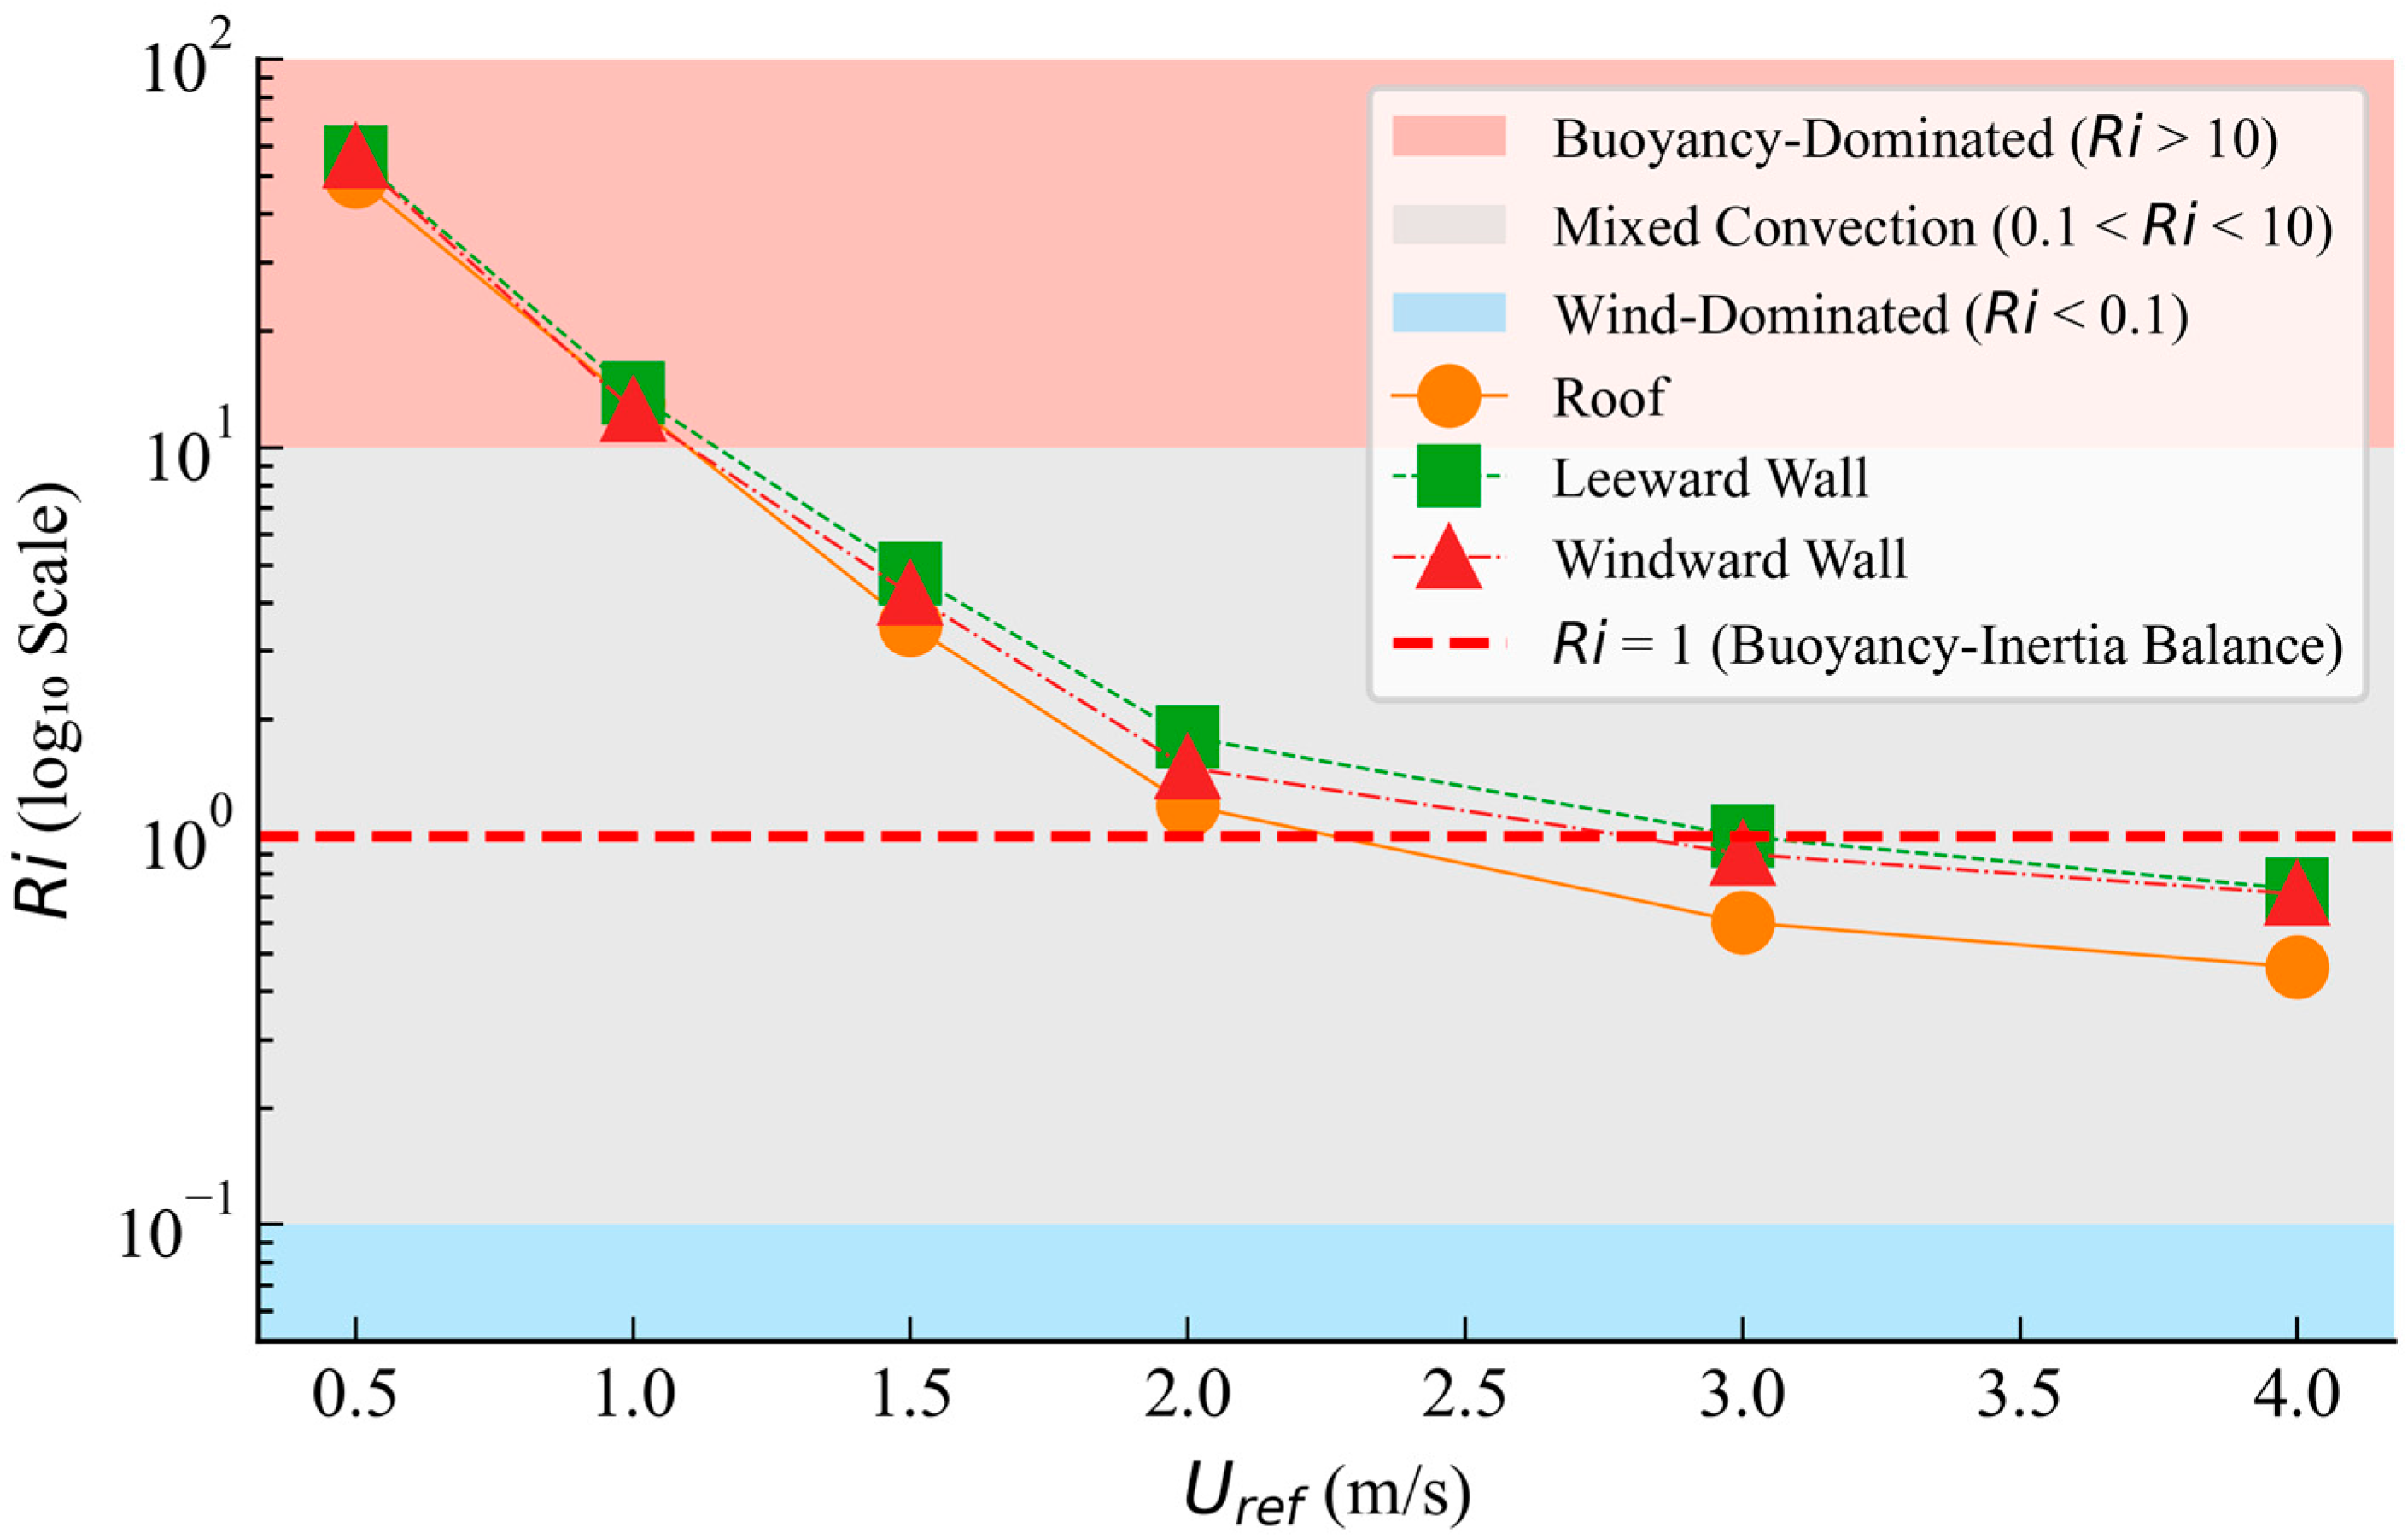
Figure 20 illustrates the variation in the Richardson number (Ri) at different PV-installed surfaces (roof, leeward wall, and windward wall) as a function of the reference velocity ( U r e f ). Note that the y-axis is presented on a logarithmic scale for better visualization of the wide range of Ri values. As clearly shown in the data, under low wind speed conditions ( U r e f = 0.5   m / s ), the Ri values for all surfaces are significantly greater than 1, with values of 49.84 (roof), 56.17 (leeward wall), and 55.93 (windward wall). This indicates that buoyancy induced by the heated PV panels is the absolute dominant force driving the airflow within the street canyon.
As the wind speed increases, the Ri value drops sharply across all configurations. When the velocity exceeds 2.0 m/s, the Ri values in most cases become less than 1, with values at U r e f = 4.0   m / s dropping to 0.46 (roof), 0.73 (leeward wall), and 0.71 (windward wall). This signifies that the inertial force of the ambient wind has gradually become the dominant factor, and the flow has gradually transitioned to a forced convection regime. In the transitional range, particularly at U r e f = 1.5 m/s, the Ri values are on the order of 1 to 10. This signifies a mixed convection zone where both buoyancy and inertial forces play a significant and comparable role in dictating the flow structure.

4.4. Street Canyon Ventilation Indicators

The mass flow exchange process between the flow in the street canyon and the flow above the building occurs mainly through the canyon’s top. Previous studies usually used ACH (air change rate) to represent the air exchange rate through the top of the street canyon. The mathematical expression for ACH is given by references [51,52], which contains an average component:
A C H m = 1 v o l A t o p w ¯ d A ,
and a turbulent component:
A C H t = 1 v o l A t o p 1 2 w w ¯ d A = 1 v o l A t o p k 6 1 2 v t w ¯ z dA ,
where w ¯ and w denote the vertical component of the mean flow and the vertical velocity pulsation, respectively; A t o p denotes the canyon’s top opening area; k is the turbulent kinetic energy intensity; ν t is the turbulent kinematic viscosity; and v o l = A t o p × H .
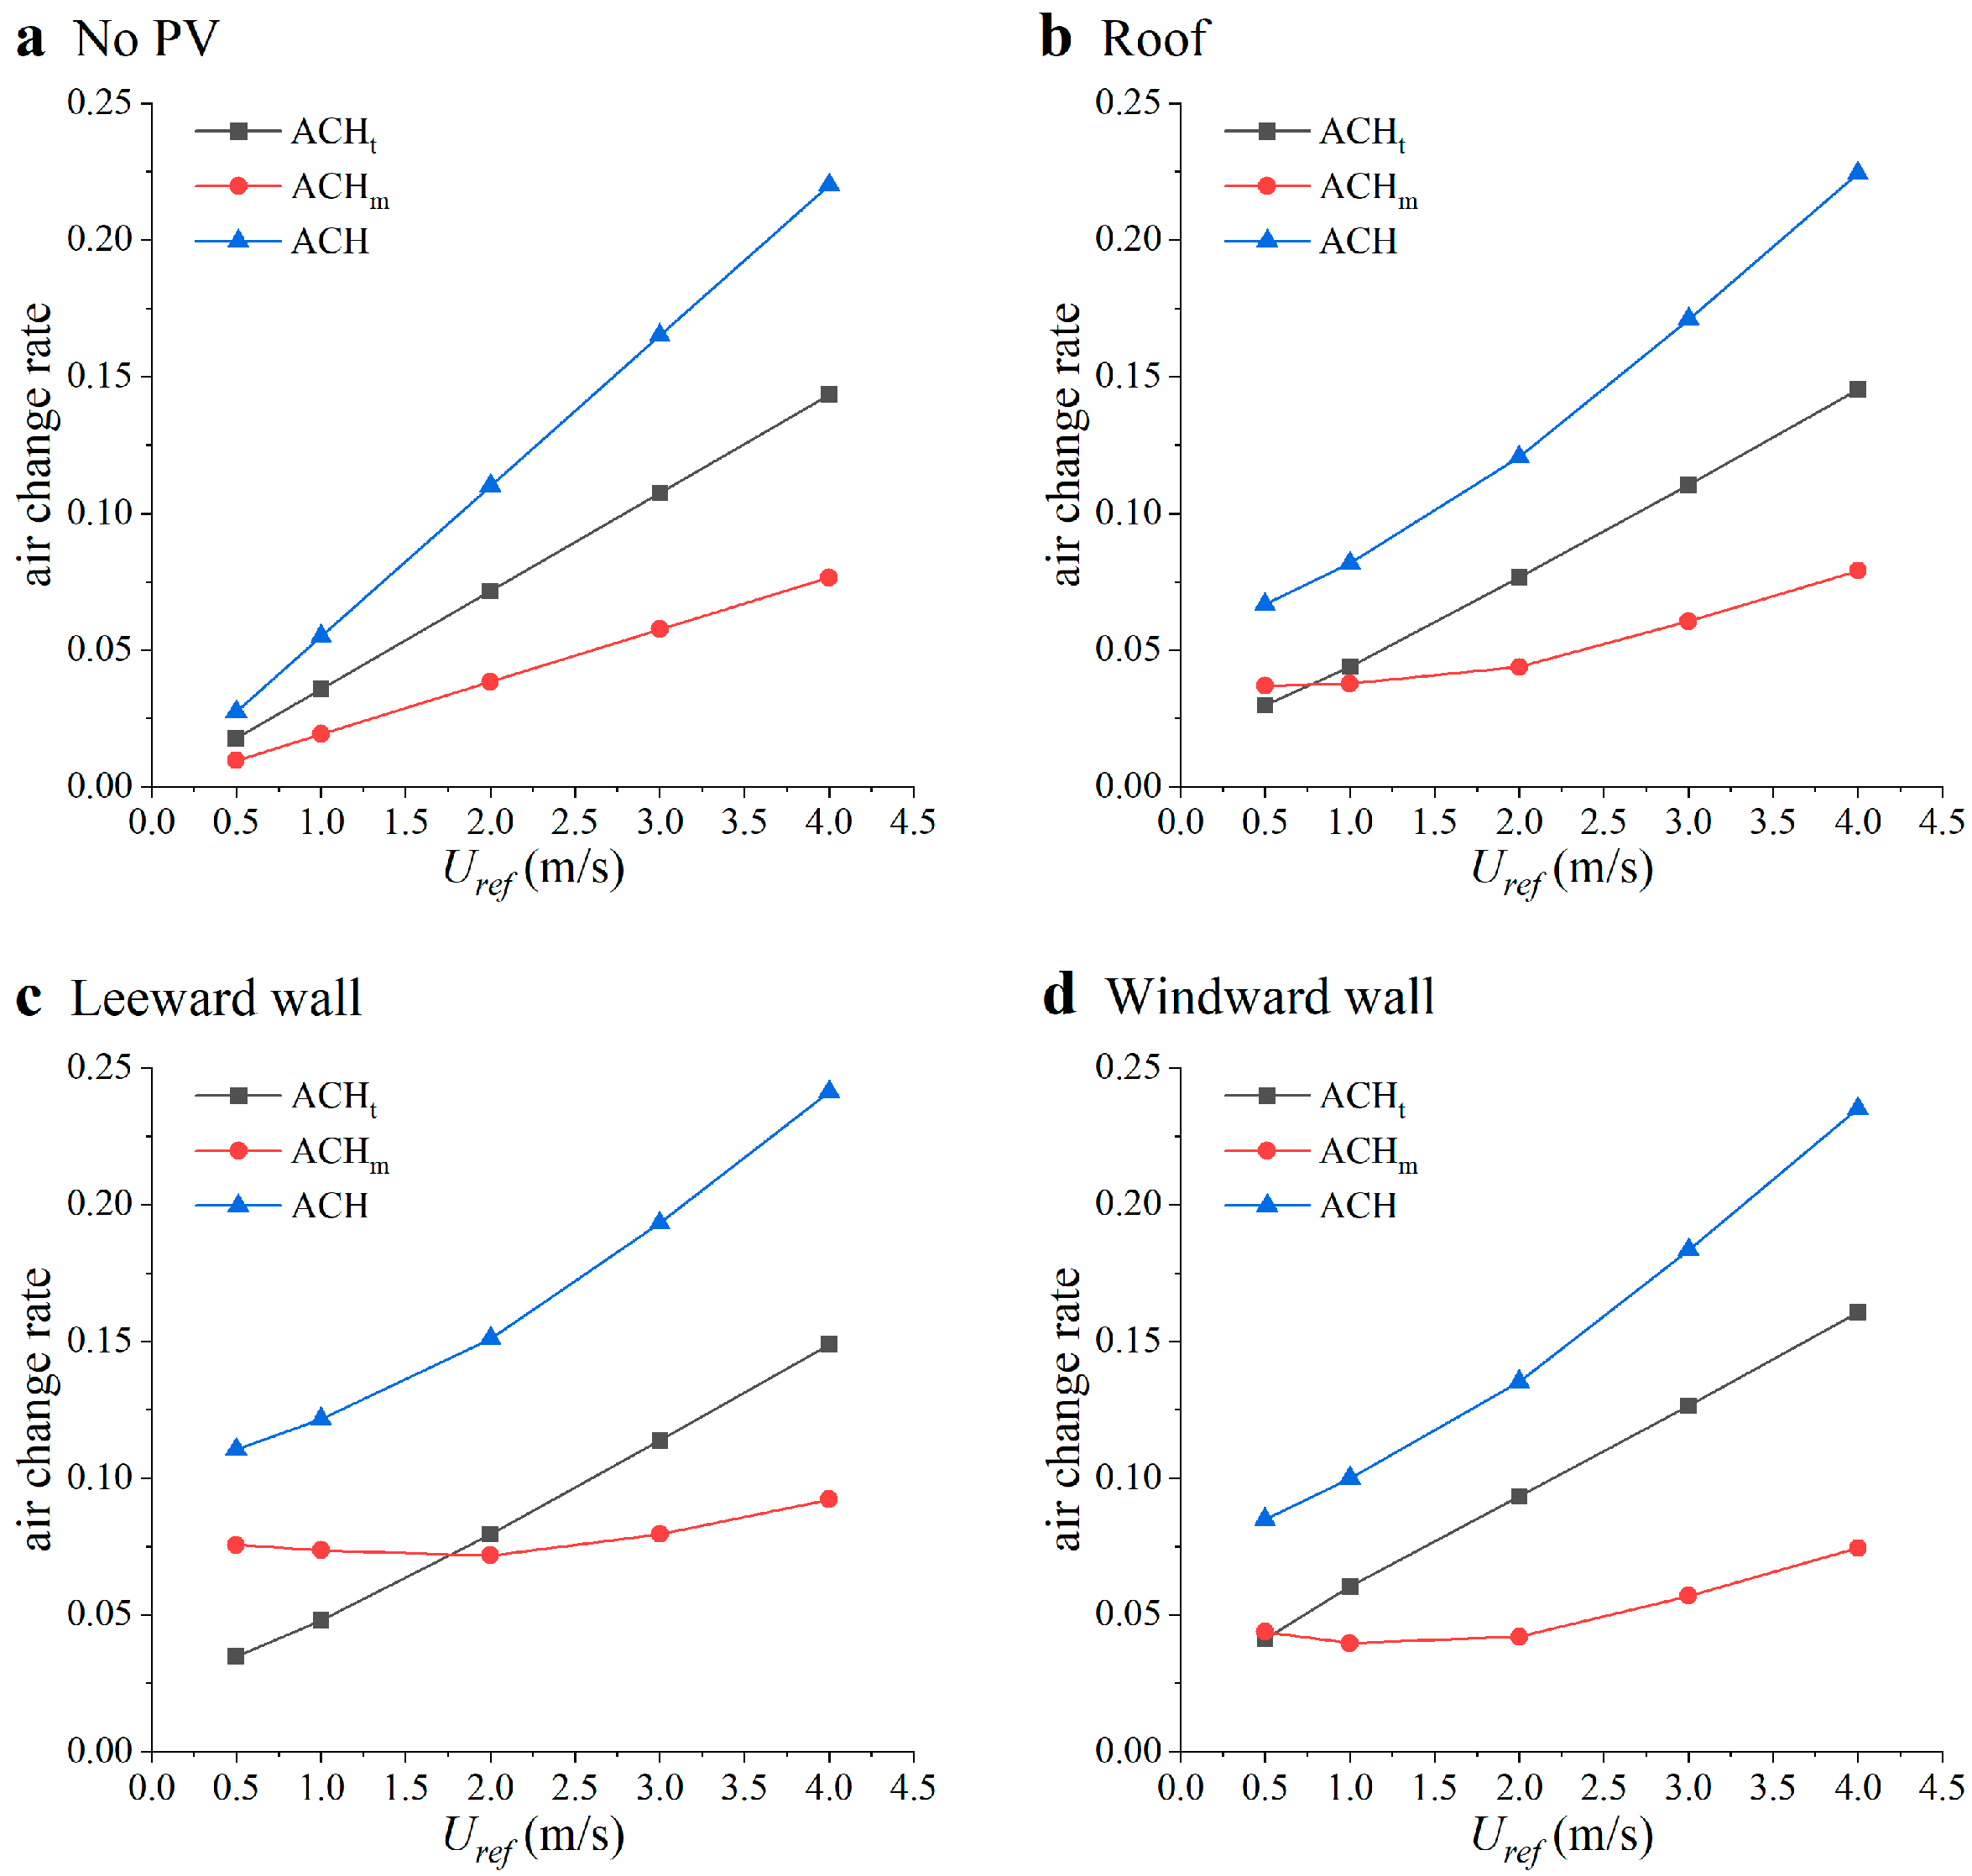
Figure 21 presents the air exchange rate (ACH) at the canyon top together with the contributions from turbulent fluctuations and mean flow. As observed, the total ACH in the street canyon increases with wind speed. At low wind speeds (0.5 m/s), despite the mean flow component ( A C H m ) remaining low due to weak external wind driving forces, the turbulent component ( A C H t ) significantly increases with the introduction of PV panels due to thermal plume effects, leading to an overall rise in ACH. However, ACH’s fundamental limitation lies in its focus on air volume exchange rather than the actual efficiency of pollutant removal. At low wind speeds, the absolute ACH values remain relatively low, failing to adequately reflect the highly efficient contribution of PV-induced vertical thermal plumes and enhanced turbulence to pollutant removal. To address this inadequacy, we propose a novel metric, the pollutant-weighted air changes per hour (PACH), which incorporates weighting factors based on pollutant flux contributions to more accurately capture and quantify the street canyon’s actual pollutant removal capacity in complex flow regimes.
Based on the traditional ACH concept, PACH formulas are as follows:
PACH = A C H m × C R p , m + A C H t × C R p , t ,
C R p , m = P T F m / P T F m + P T F t ,
C R p , t = P T F t / P T F m + P T F t ,
P T F m = V n c ¯ d A ,
P T F t = K c c ¯ n d A ,
where C R p , m is the mean flow contribution factor and C R p , t is the turbulent diffusion contribution factor; PTF is the pollutant transport flux [25]; K c = v t / S c t is the turbulent diffusion coefficient of the pollutant; v t is the turbulent kinematic viscosity; and S c t is the turbulent Schmidt number.
Building upon the traditional ACH concept, PACH discards the assumption of the ACH metric that mean flow and turbulence contribute equally to pollutant removal. Instead, it introduces physically derived weighting factors ( C R p , m and C R p , t ) to allocate the weights for A C H m and A C H t . These weighting factors originate directly from the proportions of total pollutant removal flux transported by mean flow and turbulent diffusion, respectively, thus possessing clear physical meaning rather than being empirically determined. The applicable boundary for these weighting factors is explicitly defined as the street canyon’s top outlet interface.
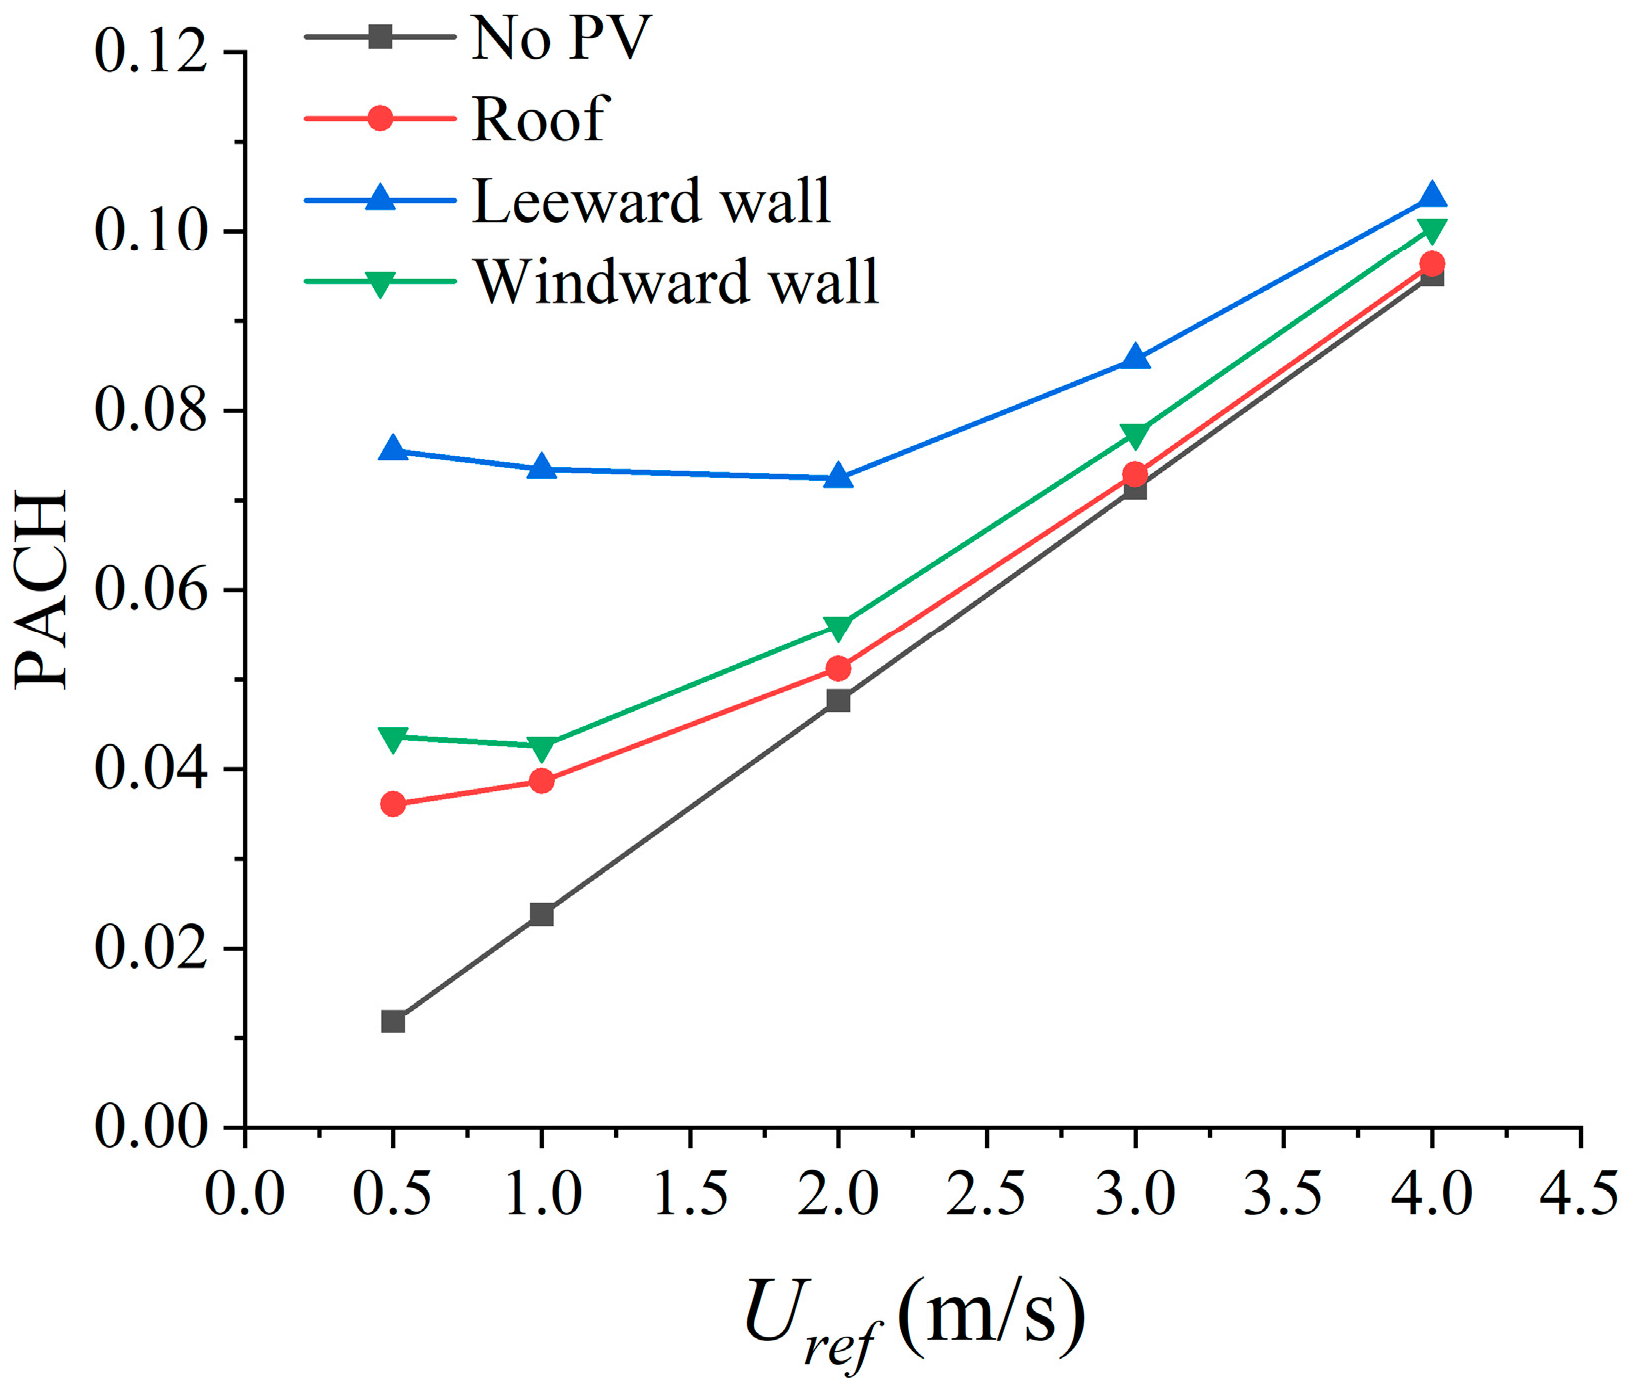
Figure 22 shows PACH variation with reference wind speed, whose increasing/decreasing trend with wind speed aligns with the variation in average pollutant concentration with reference wind speed (Figure 17). This variable effectively reflects the wind-speed-dependent pollutant removal capacity in both street canyons without PV panels and those equipped with PV panels.
The ventilation capacity of a street canyon without PV panels depends directly on ambient wind speed and shows a clear linear relationship. In contrast, when PV panels are installed, ventilation capacity responds differently. At wind speeds below 2 m/s, the ventilation capacity becomes less sensitive to changes in wind speed because thermal buoyancy generated by the PV panels plays a dominant role. Once wind speed exceeds 2 m/s, the linear relationship with wind speed re-emerges, as the influence of thermal buoyancy weakens and wind-driven forces become the primary driver. These results indicate that PV panels significantly alter canyon ventilation performance. In particular, under low-wind conditions, the thermal effects of PV panels act as a critical mechanism for enhancing ventilation.
Although traditional ACH reflects the air volume exchange, it has limitations in evaluating pollutant removal efficiency in complex flow regimes (especially buoyancy-driven ones). PACH, by introducing weighting factors based on pollutant flux contributions, can more accurately capture the actual efficiency and dominant role of mean flow and turbulence in pollutant removal, rather than merely the air volume exchange. This allows PACH to provide deeper physical mechanistic insights, particularly under low wind speeds and thermal plume influence, thus compensating for ACH’s deficiencies. However, PACH’s calculation is more complex than ACH’s, requiring more detailed flow and concentration data, which increases its data acquisition and computational costs. Nevertheless, PACH can still provide more precise practical guidance for optimizing air quality in urban micro-environments.

5. Limitations and Further Study

This study has the following limitations. First, methodologically, we assumed vertical inflow conditions without conducting sensitivity analyses on natural wind direction variations and turbulent inlet conditions, which limits the direct applicability of the PACH index and its results in real urban environments. Second, the research scope is confined to a single street canyon model, neglecting heat and mass transfer in multi-street canyons, radiation heterogeneity, and the impacts of climatic and seasonal variations on ventilation. Although this simplification facilitates the exclusion of confounding factors and establishes foundational insights under controlled conditions, it may compromise the generalizability and practicality of the conclusions.
Future research will address these issues in two ways: first, by incorporating LES modeling and time-varying inflow conditions, along with sensitivity analyses (including realistic atmospheric boundary layer profiles, wind direction changes, and turbulence models) to improve turbulence simulation accuracy; second, by expanding simulation scenarios to explore the mechanisms of heat and mass transfer in multi-street canyons, radiation heterogeneity, and climatic/seasonal influences, thereby enhancing the robustness, practicality, and generalizability of the results in complex urban settings.

6. Summary and Conclusions

This study employs numerical simulation to evaluate the energy efficiency and environmental impact of different installation methods and positions of BIPV systems at the street canyon scale. The study focuses on three types of photovoltaic installations (ventilated channel, enclosed channel, and direct attachment) and three installation locations (rooftop, windward facade, and leeward facade). Within an environmental wind speed range of 0.5 to 4 m/s, the study quantitatively analyzes the effects of these installations on building energy efficiency, photovoltaic system performance, and the flow field structure, temperature distribution, and pollutant dispersion patterns within the street canyon. The study highlights the limitations of the traditional ACH index in assessing the environmental performance of photovoltaic buildings and proposes a new index (PACH), based on pollutant concentration. The main conclusions are as follows:
  • Compared with facade-mounted PV systems, rooftop-mounted systems show clear advantages in power generation. Under all test conditions, the installation method with ventilated channel (Type 1) not only achieves the best power generation performance, but also provides the strongest thermal insulation, which lowers cooling demand and reduces overall power consumption.
  • The introduction of PV panels changes street canyon ventilation due to the interaction between incoming horizontal flow and buoyant flow inside the canyon. When the incoming wind speed is lower than 2 m/s, the effect of thermal buoyancy within the street canyon is stronger than the inertial force of the incoming flow, and thus, the effect of thermal buoyancy on street canyon ventilation is more significant.
  • The effect of PV installation on ventilation varies by position. Leeward facade PV achieves the greatest improvement, followed by windward facade, while rooftop PV shows the weakest impact. At 0.5 m/s, compared to the non-PV canyon, rooftop, leeward facade, and windward facade PV installations increase ventilation flow rates by 1.43 times, 3.02 times, and 2.09 times, respectively. When wind speed rises to 1 m/s, the enhancement factors decrease to 0.48 times, 1.21 times, and 0.82 times, reflecting the reduced dominance of thermal buoyancy effects at higher wind speeds.
  • Rooftop PV has a small effect on the street canyon temperature, whereas the introduction of facade PV panels locally reduces pedestrian thermal comfort, particularly under low-wind conditions, but this negative effect is significantly alleviated with increasing wind speed.
  • Pollutant concentration inside the canyon is strongly linked to ventilation capacity. At the same ambient wind speed, street canyons with PV systems have significantly lower pollutant levels than those without PV systems, especially if the PV panels are installed on the windward or leeward facades. At an ambient wind speed of 0.5 m/s, rooftop, leeward and windward facades PV reduced pollutant concentrations by 30.1%, 87.7%, and 85.9%, respectively.
  • The pollutant-weighted air changes per hour (PACH) proposed in this study overcomes the limitations of traditional ACH in evaluating pollutant removal efficiency in complex flow regimes, offering a more accurate and mechanistically insightful metric for assessing urban microenvironmental ventilation performance; despite its higher computational complexity, it significantly enhances the assessment capability of urban microenvironment ventilation performance.

Author Contributions

Conceptualization, M.H.; methodology, M.H.; software, K.C.; validation, M.H., F.W. and J.L.; formal analysis, K.C.; investigation, M.H. and K.C.; resources, M.H.; data curation, K.C.; writing—original draft preparation, M.H. and K.C.; writing—review and editing, M.H.; visualization, M.H. and K.C.; supervision, M.H.; project administration, M.H.; funding acquisition, M.H. All authors have read and agreed to the published version of the manuscript.

Funding

This research was funded by the National Natural Science Foundation of China (No. 52208126).

Data Availability Statement

The raw data supporting the conclusions of this article will be made available by the authors on request.

Conflicts of Interest

Author Kuan Chen is employed by the company Xi’an ShuFeng Technological Information, Ltd., Xi’an 710061, China. The remaining authors declare that the research was conducted in the absence of any commercial or financial relationships that could be constructed as a potential conflict of interest.

Abbreviations

The following abbreviations are used in this manuscript:
BIPVBuilding-integrated photovoltaic
CFDComputational fluid dynamics
PVPhotovoltaic
UCMUrban Canopy Model
BEMBuilding Energy Model
ACHAir change rate
PACHPollutant-Weighted Air Exchange Rate
UTCI Universal Thermal Climate Index

Appendix A

To support the building energy simulation, the following assumptions and simplifications are applied to the thermal modeling of photovoltaic (PV) systems:
(1) The PV modules and roof are assumed to have length and width much greater than their thickness, thereby enabling the heat transfer process to be modeled as one-dimensional steady-state conduction, analogous to that in an infinite flat plate;
(2) The thermophysical properties (e.g., thermal conductivity, specific heat, and density) of all components, including the PV layers and the building envelope, are considered temperature-independent throughout the simulation;
(3) Thermal contact resistances at the interfaces between different material layers are neglected;
(4) For PV installations with ventilated air channels, the air temperature adjacent to the PV surface is used to approximate the temperature of the ventilated air gap.
This appendix presents the detailed calculation procedures for the thermal resistances R used in Equations (1)–(3) in the main text. The calculations are based on the thermal resistance network method, incorporating conduction, convection, and radiation pathways between the PV module and the installation wall.
For installations with ventilated channels, the formula for calculating the convective heat transfer resistance between the channel air and the wall surface is as follows:
R c , f w = 1 h c , f w , h c , f w = N u k f d = ( 5.801 + 0.086 Re d / L ) k f / d ,
where Nu is the Nusselt number; kf is the thermal conductivity of air (W/m·K); Re is the Reynolds number; d is the hydraulic radius of the air gap; and L is the length of the air gap along the airflow direction (m).
The formula for the combined thermal resistance of wall conduction and convective heat transfer with indoor air is:
R w = 1 h c , w i n + δ w λ w ,
where δ w is the wall thickness (m); and λ w is the thermal conductivity of the wall (W/m·K).
The thermal resistance of the PV panel is calculated as:
R t , p v = δ p v λ p v ,
where δ p v is the thickness of the PV panel (m); and λ p v is the thermal conductivity of the PV panel (W/m·K).
The formula for the radiative heat transfer resistance between the PV panel and the building wall is:
R r , p v 2 w = 1 h r , p v 2 w , h r , p v 2 w = σ T p v 2 + T w T p v 2 2 + T w 2 1 ε p v + 1 ε w 1 ,
where T p v 2   and T w   are the temperatures of the PV panel’s inner surface and the wall surface (°C), respectively; ε p ν and ε w are the emissivities of the PV panel and the wall, respectively.
For installations with enclosed ventilated channels, the convective heat transfer resistance of the enclosed air layer with formulas as follows:
R c , p v 2 f = 1 h c , p v 2 f , h c , p v 2 f = N u k f d ,
N u = 1 + 1.14 1 1708 ( sin 1.8 φ ) 1.6 R a × cos φ 1 1708 R a × cos φ + + R a × cos φ 5830 1 3 1 + ,
R a = g β Δ t d 3 α v ,
where []+ indicates that the value is set to zero if the expression in the brackets is negative; Ra is the Rayleigh number; and φ is the angle between the wall surface and the parallel plane.
The calculated thermal resistances R serve as input parameters for the heat flux equations presented in the main text. The Nusselt numbers, as well as the PV surface temperature and building surface temperature required for these calculations, are obtained directly from the CFD simulations. Further details regarding the simulation setup, boundary conditions, and results are provided in the main body of the paper.

References

  1. IEA. World Energy Outlook Special Report; International Energy Agency: Paris, France, 2016. [Google Scholar]
  2. Strielkowski, W.; Chygryn, O.; Drozd, S.; Koibichuk, V. Sustainable transformation of energy sector: Cluster analysis for the sustainable development strategies of selected European countries. Heliyon 2024, 10, e38930. [Google Scholar] [CrossRef] [PubMed]
  3. Yu, S.; Zheng, Y.; Li, L. A comprehensive evaluation of the development and utilization of China’s regional renewable energy. Energy Policy 2019, 127, 73–86. [Google Scholar] [CrossRef]
  4. Ding, L.; Zhu, Y.; Zheng, L.; Dai, Q.; Zhang, Z. What is the path of photovoltaic building (BIPV or BAPV) promotion? --The perspective of evolutionary games. Appl. Energy 2023, 340, 121033. [Google Scholar] [CrossRef]
  5. Wang, S.; Wu, J.; Peng, Y.; Xu, J.; Leinonen, L.; Wang, Y.; Meng, Z. Influence of Residential Photovoltaic Promotion Policy on Installation Intention in Typical Regions of China. Sustainability 2022, 14, 8659. [Google Scholar] [CrossRef]
  6. del Hierro, I.; Polo, J.; Chivelet, N.M.; Olivieri, F.; Caamaño-Martín, E.; Olivieri, L. Photovoltaic self-sufficiency potential at a district scale in Madrid. A scalable methodology. Energy Build. 2024, 323, 114764. [Google Scholar] [CrossRef]
  7. Jurasz, J.K.; Dąbek, P.B.; Campana, P.E. Can a city reach energy self-sufficiency by means of rooftop photovoltaics? Case study from Poland. J. Clean. Prod. 2020, 245, 118813. [Google Scholar] [CrossRef]
  8. Vecchi, F.; Berardi, U.; Mutani, G. Self-Sufficiency Building Energy Modelling from Urban to Block-Scale with PV Technology. Int. J. Sustain. Dev. Plan. 2023, 18, 2309–2318. [Google Scholar] [CrossRef]
  9. Masson, V.; Bonhomme, M.; Salagnac, J.-L.; Briottet, X.; Lemonsu, A. Solar panels reduce both global warming and urban heat island. Front. Environ. Sci. 2014, 2, 14. [Google Scholar] [CrossRef]
  10. Sailor, D.; Anand, J.; King, R. Photovoltaics in the built environment: A critical review. Energy Build. 2021, 253, 111479. [Google Scholar] [CrossRef]
  11. Chen, L.; Zheng, X.; Yang, J.; Yoon, J.H. Impact of BIPV windows on building energy consumption in street canyons: Model development and validation. Energy Build. 2021, 249, 111207. [Google Scholar] [CrossRef]
  12. Salamanca, F.; Georgescu, M.; Mahalov, A.; Moustaoui, M.; Martilli, A. Citywide Impacts of Cool Roof and Rooftop Solar Photovoltaic Deployment on Near-Surface Air Temperature and Cooling Energy Demand. Bound.-Layer Meteorol. 2016, 161, 203–221. [Google Scholar] [CrossRef]
  13. Taha, H. The potential for air-temperature impact from large-scale deployment of solar photovoltaic arrays in urban areas. Sol. Energy 2013, 91, 358–367. [Google Scholar] [CrossRef]
  14. Berardi, U.; Graham, J. Investigation of the impacts of microclimate on PV energy efficiency and outdoor thermal comfort. Sustain. Cities Soc. 2020, 62, 102402. [Google Scholar] [CrossRef]
  15. Boccalatte, A.; Fossa, M.; Ménézo, C. Best arrangement of BIPV surfaces for future NZEB districts while considering urban heat island effects and the reduction of reflected radiation from solar façades. Renew. Energy 2020, 160, 686–697. [Google Scholar] [CrossRef]
  16. Pham, J.V.; Baniassadi, A.; Brown, K.E.; Heusinger, J.; Sailor, D.J. Comparing photovoltaic and reflective shade surfaces in the urban environment: Effects on surface sensible heat flux and pedestrian thermal comfort. Urban Clim. 2019, 29, 100500. [Google Scholar] [CrossRef]
  17. Brown, K.E.; Baniassadi, A.; Pham, J.V.; Sailor, D.J.; Phelan, P.E. Effects of Rooftop Photovoltaics on Building Cooling Demand and Sensible Heat Flux Into the Environment for an Installation on a White Roof. ASME J. Eng. Sustain. Build. Cities 2020, 1, 021001. [Google Scholar] [CrossRef]
  18. Abhijith, K.; Kumar, P.; Gallagher, J.; McNabola, A.; Baldauf, R.; Pilla, F.; Broderick, B.; Di Sabatino, S.; Pulvirenti, B. Air pollution abatement performances of green infrastructure in open road and built-up street canyon environments—A review. Atmos. Environ. 2017, 162, 71–86. [Google Scholar] [CrossRef]
  19. Haakman, R.; Beenakker, I.; Geerlings, H. Reducing vehicle-related NOx and PM emissions in metropolitan areas: A comparison between the Randstad and the Rhine-Ruhr area. J. Clean. Prod. 2020, 247, 119175. [Google Scholar] [CrossRef]
  20. Wu, J.; Zheng, H.; Zhe, F.; Xie, W.; Song, J. Study on the relationship between urbanization and fine particulate matter (PM2.5) concentration and its implication in China. J. Clean. Prod. 2018, 182, 872–882. [Google Scholar] [CrossRef]
  21. Llaguno-Munitxa, M.; Bou-Zeid, E.; Hultmark, M. The influence of building geometry on street canyon air flow: Validation of large eddy simulations against wind tunnel experiments. J. Wind. Eng. Ind. Aerodyn. 2017, 165, 115–130. [Google Scholar] [CrossRef]
  22. Toparlar, Y.; Blocken, B.; Maiheu, B.; van Heijst, G.J.F. A review on the CFD analysis of urban microclimate. Renew. Sustain. Energy Rev. 2017, 80, 1613–1640. [Google Scholar] [CrossRef]
  23. Hang, J.; Li, Y. Ventilation strategy and air change rates in idealized high-rise compact urban areas. Build. Environ. 2010, 45, 2754–2767. [Google Scholar] [CrossRef]
  24. Chen, G.; Wang, D.; Wang, Q.; Li, Y.; Wang, X.; Hang, J.; Gao, P.; Ou, C.; Wang, K. Scaled outdoor experimental studies of urban thermal environment in street canyon models with various aspect ratios and thermal storage. Sci. Total Environ. 2020, 726, 138147. [Google Scholar] [CrossRef] [PubMed]
  25. Yang, H.; Chen, G.; Wang, D.; Hang, J.; Li, Q.; Wang, Q. Influences of street aspect ratios and realistic solar heating on convective heat transfer and ventilation in full-scale 2D street canyons. Build. Environ. 2021, 204, 108125. [Google Scholar] [CrossRef]
  26. Gromke, C.; Blocken, B. Influence of avenue-trees on air quality at the urban neighborhood scale. Part II: Traffic pollutant concentrations at pedestrian level. Environ. Pollut. 2015, 196, 176–184. [Google Scholar] [CrossRef]
  27. Kang, G.; Kim, J.-J.; Kim, D.-J.; Choi, W.; Park, S.-J. Development of a computational fluid dynamics model with tree drag parameterizations: Application to pedestrian wind comfort in an urban area. Build. Environ. 2017, 124, 209–218. [Google Scholar] [CrossRef]
  28. Liu, J.; Zhao, Y.; Lam, C.K.C.; Liang, J.; Ling, H.; Wang, Q. Integrated impacts of solar heating and water evaporation on urban airflows and thermal environments in 2D street canyons. Urban Clim. 2023, 48, 101411. [Google Scholar] [CrossRef]
  29. Xu, F.; Gao, Z.; Zhang, J. Effects of roadside morphologies and moving vehicles on street canyon ventilation. Build. Environ. 2022, 218, 109138. [Google Scholar] [CrossRef]
  30. Mei, S.-J.; Liu, C.-W.; Liu, D.; Zhao, F.-Y.; Wang, H.-Q.; Li, X.-H. Fluid mechanical dispersion of airborne pollutants inside urban street canyons subjecting to multi-component ventilation and unstable thermal stratifications. Sci. Total Environ. 2016, 565, 1102–1115. [Google Scholar] [CrossRef]
  31. Saxena, S.; Yaghoobian, N. Diurnal Surface Heating and Roof Material Effects on Urban Pollution Dispersion: A Coupled Large-eddy Simulation and Surface Energy Balance Analysis. Bound.-Layer Meteorol. 2022, 184, 143–171. [Google Scholar] [CrossRef]
  32. Guo, J.; Lin, S.; Bilbao, J.I.; White, S.D.; Sproul, A.B. A review of photovoltaic thermal (PV/T) heat utilisation with low temperature desiccant cooling and dehumidification. Renew. Sustain. Energy Rev. 2017, 67, 1–14. [Google Scholar] [CrossRef]
  33. Cheng, W.; Liu, C.-H.; Leung, D.Y. On the correlation of air and pollutant exchange for street canyons in combined wind-buoyancy-driven flow. Atmos. Environ. 2009, 43, 3682–3690. [Google Scholar] [CrossRef]
  34. Xie, X.; Huang, Z.; Wang, J.; Xie, Z. The impact of solar radiation and street layout on pollutant dispersion in street canyon. Build. Environ. 2005, 40, 201–212. [Google Scholar] [CrossRef]
  35. Huang, M.-H.; Huang, Y.; Cao, J.-J.; Tao, W.-Q. Study on mitigation of automobile exhaust pollution in an urban street canyon: Emission reduction and air cleaning street lamps. Build. Environ. 2021, 193, 107651. [Google Scholar] [CrossRef]
  36. Vranckx, S.; Vos, P.; Maiheu, B.; Janssen, S. Impact of trees on pollutant dispersion in street canyons: A numerical study of the annual average effects in Antwerp, Belgium. Sci. Total Environ. 2015, 532, 474–483. [Google Scholar] [CrossRef]
  37. Xing, Y.; Brimblecombe, P. Dispersion of traffic derived air pollutants into urban parks. Sci. Total Environ. 2018, 622–623, 576–583. [Google Scholar] [CrossRef]
  38. Xue, F.; Li, X. The impact of roadside trees on traffic released PM 10 in urban street canyon: Aerodynamic and deposition effects. Sustain. Cities Soc. 2017, 30, 195–204. [Google Scholar] [CrossRef]
  39. Lee, D.; Barquilla, C.A.M.; Lee, J. Analyzing Dispersion Characteristics of Fine Particulate Matter in High-Density Urban Areas: A Study Using CFD Simulation and Machine Learning. Land 2025, 14, 632. [Google Scholar] [CrossRef]
  40. Ioannidis, G.; Li, C.; Tremper, P.; Riedel, T.; Ntziachristos, L. Application of CFD Modelling for Pollutant Dispersion at an Urban Traffic Hotspot. Atmosphere 2024, 15, 113. [Google Scholar] [CrossRef]
  41. Franke, J.; Hellsten, A.; Schlünzen, H.; Carissimo, B.J.G.S. Best Practice Guideline for the CFD Simulation of Flows in the Urban Environment; COST Office: Brussels, Belgium, 2007. [Google Scholar]
  42. Richards, P.; Hoxey, R. Appropriate boundary conditions for computational wind engineering models using the k-ε turbulence model. In Computational Wind Engineering 1; Elsevier: Amsterdam, The Netherlands, 1993; Volume 46, pp. 145–153. [Google Scholar]
  43. Blocken, B.; Stathopoulos, T.; Carmeliet, J. CFD simulation of the atmospheric boundary layer: Wall function problems. Atmos. Environ. 2007, 41, 238–252. [Google Scholar] [CrossRef]
  44. Toparlar, Y.; Blocken, B.; Vos, P.; van Heijst, G.; Janssen, W.; van Hooff, T.; Montazeri, H.; Timmermans, H. CFD simulation and validation of urban microclimate: A case study for Bergpolder Zuid, Rotterdam. Build. Environ. 2015, 83, 79–90. [Google Scholar] [CrossRef]
  45. Brown, M.J.; Lawson, R.E.; Lee, R.L.; DeCroix, D.S. Comparison of centerline velocity measurements obtained around 2D and 3D building arrays in a wind tunnel. In Proceedings of the 2001 International Symposium on Environmental Hydraulics, Tempe, AZ, USA, 5–8 December 2001. [Google Scholar]
  46. Cui, P.-Y.; Li, Z.; Tao, W.-Q. Buoyancy flows and pollutant dispersion through different scale urban areas: CFD simulations and wind-tunnel measurements. Build. Environ. 2016, 104, 76–91. [Google Scholar] [CrossRef]
  47. Lu, Y. Shiyong Gongre Kongtiao Sheji Shouce [Practical Handbook of Heating and Air Conditioning Design]; China Architecture & Building Press: Beijing, China, 1993. (In Chinese) [Google Scholar]
  48. Chen, L.; Hang, J.; Sandberg, M.; Claesson, L.; Di Sabatino, S.; Wigo, H. The impacts of building height variations and building packing densities on flow adjustment and city breathability in idealized urban models. Build. Environ. 2017, 118, 344–361. [Google Scholar] [CrossRef]
  49. Cui, P.-Y.; Li, Z.; Tao, W.-Q. Investigation of Re-independence of turbulent flow and pollutant dispersion in urban street canyon using numerical wind tunnel (NWT) models. Int. J. Heat Mass Transf. 2014, 79, 176–188. [Google Scholar] [CrossRef]
  50. Bröde, P.; Fiala, D.; Błażejczyk, K.; Holmér, I.; Jendritzky, G.; Kampmann, B.; Tinz, B.; Havenith, G. Deriving the operational procedure for the Universal Thermal Climate Index (UTCI). Int. J. Biometeorol. 2012, 56, 481–494. [Google Scholar] [CrossRef]
  51. Cheng, W.; Liu, C.-H.; Leung, D.Y. Computational formulation for the evaluation of street canyon ventilation and pollutant removal performance. Atmos. Environ. 2008, 42, 9041–9051. [Google Scholar] [CrossRef]
  52. Hang, J.; Li, Y. Wind Conditions in Idealized Building Clusters: Macroscopic Simulations Using a Porous Turbulence Model. Bound.-Layer Meteorol. 2010, 136, 129–159. [Google Scholar] [CrossRef]
Figure 1. Three typical installation configurations of BIPV systems. The blue block represents the PV module, while the orange block indicates the building wall.
Buildings 15 03692 g001
Figure 2. Thermal resistance network models for three typical installation configurations of BIPV systems: (a) Type 1 PV installation, (b) Type 2 PV installation, and (c) Type 3 PV installation.
Buildings 15 03692 g002
Figure 3. (a) Computational domain and boundary conditions (the coordinate origin is located at the center of the street canyon, Building A represents the leeward side, and Building B represents the windward side of the canyon); (b) location of the pollutant sources (as the pollutant sources are equidistant from buildings A and B, no specific labeling of A or B is required).
Buildings 15 03692 g003
Figure 4. Schematic layout of PV panel installation locations: (a) leeward facade; (b) rooftop; and (c) windward facade.
Buildings 15 03692 g004
Figure 5. Grids independence analysis.
Buildings 15 03692 g005
Figure 6. Validation of numerical simulation results using wind tunnel experimental data: (a) U.S. EPA FML (isothermal) [45]; (b) Tongji SKL-PCRR (non-isothermal) [46].
Buildings 15 03692 g006
Figure 7. Power generation efficiency of PV panels by locations: (a) rooftop, (b) leeward facade, and (c) windward facade.
Buildings 15 03692 g007
Figure 8. Total power generation of PV panels by locations: (a) rooftop, (b) leeward facade, and (c) windward facade.
Buildings 15 03692 g008
Figure 9. Heat gain of the building under different installation locations: (a) rooftop, (b) leeward facade, and (c) windward facade.
Buildings 15 03692 g009
Figure 10. (a) Dimensionless wind speed at the horizontal cross-section; (b) dimensionless wind speed at the central longitudinal section (the arrows indicate the flow direction).
Buildings 15 03692 g010
Figure 11. Dimensionless wind speed at the horizontal cross-section (the arrows indicate the flow direction).
Buildings 15 03692 g011
Figure 12. Dimensionless wind speed at the central longitudinal section (the arrows indicate the flow direction).
Buildings 15 03692 g012aBuildings 15 03692 g012b
Figure 13. Temperature difference T at the horizontal cross-section.
Buildings 15 03692 g013aBuildings 15 03692 g013b
Figure 14. Temperature difference T at the central longitudinal section.
Buildings 15 03692 g014aBuildings 15 03692 g014b
Figure 15. Variation in pedestrian thermal comfort (UTCI), mean radiant temperature (MRT), air temperature, and local wind speed with position and wind speed for leeward facade PV configuration.
Buildings 15 03692 g015
Figure 16. Variation in pedestrian thermal comfort (UTCI), mean radiant temperature (MRT), air temperature, and local wind speed with position and wind speed for windward facade PV configuration.
Buildings 15 03692 g016
Figure 17. Dimensionless concentration C* at the horizontal cross-section.
Buildings 15 03692 g017aBuildings 15 03692 g017b
Figure 18. Dimensionless concentration C* at the central longitudinal section.
Buildings 15 03692 g018aBuildings 15 03692 g018b
Figure 19. Average pollutant dimensionless concentrations C* in street canyons with and without PV panel installations.
Buildings 15 03692 g019
Figure 20. Richardson number variation with reference wind speed.
Buildings 15 03692 g020
Figure 21. Air exchange rate (ACH) and its components in street canyons with and without PV panel installations:(a) no PV, (b)roof, (c) leeward wall, and (d) windward wall.
Buildings 15 03692 g021
Figure 22. PACH in street canyons with and without PV panel installations.
Buildings 15 03692 g022
Disclaimer/Publisher’s Note: The statements, opinions and data contained in all publications are solely those of the individual author(s) and contributor(s) and not of MDPI and/or the editor(s). MDPI and/or the editor(s) disclaim responsibility for any injury to people or property resulting from any ideas, methods, instructions or products referred to in the content.