Article

Research on the Designer Mismatch Characteristic and Talent Cultivation Strategy in China’s Construction Industry

1
School of Natural Resources and Surveying, Nanning Normal University, Nanning 530001, China
2
School of Public Administration, Jiangxi University of Finance and Economics, Nanchang 330013, China
3
Gansu Kaiyuan Survey, Planning, Design and Consulting Co., Ltd., Lanzhou 730000, China
4
Urban-Rural Construction College, Guangxi Vocational University of Agriculture, Nanning 530007, China
5
Faculty of Education, Guangxi Normal University, Guilin 541004, China
*
Author to whom correspondence should be addressed.
Buildings 2025, 15(20), 3686; https://doi.org/10.3390/buildings15203686
Submission received: 20 August 2025 / Revised: 6 October 2025 / Accepted: 10 October 2025 / Published: 13 October 2025
(This article belongs to the Section Architectural Design, Urban Science, and Real Estate)

Abstract

Architectural design stands as a highly knowledge-intensive field, with designers serving as the linchpin for its premium development. China’s construction industry is now navigating a transitional phase of slower growth, where a misalignment in designer capabilities significantly obstructs the nation’s shift from being a mere “construction giant” to becoming a true “construction powerhouse”. Based on the spatial mismatch model and Geodetector, this study empirically analyzes the mismatch relationship among designers and its influencing factors using panel data from 31 provinces in China from 2013 to 2023, and proposes strategies for cultivating architectural design talents. Findings reveal that China’s architectural designers exhibit spatial supply imbalance, and complex trends in designer allocation-simultaneous growth and decline coexist. China exhibits diverse types of architect mismatch: 22.58% of regions are in a state of Positive Mismatch, and 12.90% experience Negative Mismatch. In over one-third of regions, the architectural design talent market can no longer self-correct architect mismatch through market mechanisms, urgently requiring collaborative intervention policies from governments, design associations, and enterprises to address architect supply–demand governance. For a smooth transition during the transformation and upgrading of the construction and design industries, the architectural design talent market should accommodate frictional designer mismatch. The contribution of designer mismatch varies significantly, with factors such as innovation, industrial structure, and fiscal self-sufficiency exerting more direct influence, while other factors play indirect roles through dual-factor enhancement effects and nonlinear enhancement effects. The insights from the analysis results and conclusions for future designer cultivation include fostering an interdisciplinary teaching model for designers through university–enterprise collaboration, enhancing education in AI and intelligent construction literacy, and establishing an intelligent service platform for designer supply–demand matching to promptly build a new differentiated and precise designer supply system.

1. Introduction

As an intellectual-intensive sector, architectural design plays a pivotal role in the high-quality development of the construction industry. Architectural designers are the source of architectural innovation, and their numbers, quality, and distribution must be closely aligned with the sustainable, high-quality development of the construction industry [1,2]. Rational talent allocation infuses construction projects with creativity and vitality to drive continuous innovation in design concepts and technological applications, while playing a decisive role in enhancing architectural quality and optimizing building functions [3]. China currently leads the world in the scale of its construction industry and is committed to transforming itself from a major construction nation into a construction powerhouse. While most scholars primarily focus on the shortage of construction workers and international labor, our research narrows its scope to “designers”—a core group driving the high-quality development of the construction industry—and explores their spatial mismatch. This stretches the current international research agenda on construction labor mismatch and provides a new case study from the largest emerging construction market (China) for global comparison.
China is currently undergoing a transitional period of decline in the construction industry, leaving architectural designers in a challenging predicament. The dilemma is that, on the one hand, there is an oversupply of general designers, leading to fierce employment competition. Many designers face employment difficulties, with some even at increased risk of unemployment. On the other hand, specialized designers in fields such as green building, intelligent construction, and digital design are in critically short supply. This has resulted in recruitment challenges for architectural design firms when undertaking such projects, severely constraining business expansion and innovation within the industry. This talent mismatch significantly hinders the transformation and upgrading of the construction industry [4]. In this study, we refer to the mismatch between the demand for designers capable of meeting the high-quality development needs of the construction industry in a province and the actual supply of such designers as designer mismatch. When actual supply exceeds demand, an oversupply of designers occurs, leading to waste of design human resources. Conversely, when actual supply falls short of demand, a shortage of designers arises, thereby limiting the high-quality development of the construction industry. The talent cultivation strategies in this study refer to the intervention policies and new designer training initiatives that governments, enterprises, and universities should adopt when there is an imbalance between designer supply and demand, thereby achieving a new balance between designer supply and demand.
Against this backdrop, conducting in-depth research on the architectural designer mismatch and its underlying mechanisms, coupled with systematic analysis of talent development strategies aligned with the construction industry’s transformation, holds significant theoretical and practical value. Theoretically, it enriches the framework of architectural talent and design development; practically, it offers tailored talent cultivation approaches for universities, design firms, and other stakeholders, clarifies pathways for nurturing the next generation of designers, and supports the construction industry’s seamless transition through this transformative phase [5].

2. Literature Review

Architectural designers are the core driving force behind innovation and development in the construction industry, and they remain a hot topic of research in academic circles. Existing research primarily revolves around three dimensions:

2.1. Focusing on the Value and Role of Architects

Studies on the role of designers in implementing new concepts, methods, and ideas in the construction industry emphasize their thought processes, inspiration preferences, cognitive influencing factors, and behavioral characteristics in driving architectural innovation. Scholars generally agree that designers serve as a critical bridge connecting theory with practice and ideals with reality [6]. In fields such as green buildings [7], biophilic architecture [8], BIM technology applications [9], public interest preservation [10], and the integration of construction worker health and safety design [11,12], they play a decisive role in the transformation and implementation of innovative outcomes. The designer’s thinking patterns and problem-solving strategies are central to innovation. Although designers are reluctant to discuss their design process, this is precisely the focus of non-designers and potential designers (architecture students) [13,14]. Dinar et al. [15] reviewed empirical research methods and pointed out that studies on designer cognition have shifted from loosely exploratory approaches to systematic hypothesis testing. Future research should integrate computer-assisted data analysis to construct cognitive models of designers. Gonçalves et al. [16] investigated preferences for inspiration methods and found that designers face methodological limitations during the creative generation phase, necessitating an expansion of resource utilization. The cognitive influencing factors and decision-making behaviors of designers exhibit context-dependency, sensory orientation, and tool-dependency. Their decision logic encompasses both professional judgments for functional realization and implicit preferences in value prioritization. For instance, Altay et al. [17] discovered that designer decisions are jointly influenced by material properties, project requirements, and personal experience. Sensory attributes (e.g., visual and tactile) are prioritized, while ecological attributes are often undervalued, reflecting a latent conflict between pragmatism and sustainability. Dürr et al. [18] developed the BASK multi-criteria decision model, revealing that material selection in architectural design requires balancing eight indicators including thermal stress, cost, and renovability, demonstrating the systematic integration challenges designers face when incorporating technical parameters into climate-adaptive design.

2.2. Focusing on the Growth and Development of Architectural Designers

It encompasses nurturing emerging designers through four dimensions: skill development, tool empowerment, technical integration, and interdisciplinary training, while exploring system optimization for next-gen designer education and pathways to enhance capabilities via future-oriented strategies, management innovations, and collaborative frameworks. Mohedas et al. [19] employed coding methods to reveal disparities in the application of stakeholder interviews by novice designers, emphasizing the necessity of communication skills in the systematic training of designers. Jewitt et al. [20] developed an educational toolkit for digital touch design, demonstrating that structured interventions effectively enhance novices’ ability to design complex interactions. Rahimian et al. [21] found that VR 3D sketching significantly enhances spatial cognition and collaboration efficiency among novices, highlighting the empowering role of technological media in conceptual design. Barbara et al. [22] emphasized that future literacy cultivation requires interdisciplinary integration and community co-creation, enabling designers to transcend current challenges and proactively construct ideal sustainable future spaces. Faia [23] demonstrated through experiential case teaching in living architecture projects the importance of reverse design and comprehensive strategies in improving climate response management capabilities, strengthening the connection between sustainable ideals and real-world dilemmas. Scholars’ research has identified educational background, personal traits, and social support as key factors influencing designer growth and development. Katebi [24] confirmed the moderating effects of education background and income on the performance of supervision engineers, suggesting the need for differentiated training and compensation system design. Ibrahim et al. [25] found that job flexibility significantly and positively influences engineers’ engagement and satisfaction, highlighting the importance of cultivating psychological capital to cope with industry pressures. Alam et al. [26] pointed out that socioeconomic background has a greater influence on engineers’ career development than years of education, calling for attention to educational equity and policy interventions to narrow the disparities in starting points. Additionally, some scholars have specifically focused on female designers, including occupational safety and its influencing factors [27], and motivational mechanisms and incentive strategies [28], as well as structural barriers and career development challenges [29].

2.3. Exploring the Social Relationship Networks of Designers and Their Impact Effects

Existing research has examined the interplay between architectural designers and stakeholders (e.g., clients and contractors), enhancing multi-perspective insights into designers’ social networks while uncovering their significant impact on design innovation and project delivery success. He et al. [30] conducted a social network analysis of Chinese designers’ virtual communities (Zcool) and found that their networks exhibit a polycentric structure, with centrality highly dependent on economic–political power and superstar effects, while connectivity is driven by transportation, cultural homogeneity, and economic proximity rather than geographic proximity. This expands the “socialized” description of creative city networks. Li et al. [31], from a social psychology perspective, confirmed that designers’ social relationships positively influence green design intentions through the mediating role of personal norms, and that proactive and voluntary tools can enhance this effect, providing pathways to arouse sustainable design behaviors. Pan et al. [32] proposed a node2vec-GMM clustering algorithm based on BIM event logs. By analyzing designer collaboration networks, they identified tightly linked subgroups, providing data support for monitoring collaborative design processes. Kirsh [33] highlighted the cognitive mismatch between architects and designers in interactive cognition. The former focuses on physical space and bodily activities, while the latter prioritizes interface interactions, a difference that impacts cross-disciplinary collaboration efficiency. Zare et al. [34] applied actor–network theory to emphasize the joint role of human and non-human participants in collaborative design, revealing the critical influence of factors such as “other-acceptability” and “criticism tolerance” on interaction quality. Faizi et al. [35] developed an interaction framework for landscape and urban designers, proposing a four-level sequence encompassing design planning and management guidance to enhance cross-disciplinary collaboration.

2.4. Research Gaps

Current research has established a multidimensional theoretical framework integrating architectural designers’ value, development trajectories, and social networks, systematically addressing talent allocation requirements across the construction industry’s evolutionary stages. However, substantial innovation potential persists in tackling new-era transformation challenges, primarily manifesting in two key areas:
First, the micro-level bias and macro-level absence in research scale have led to the “reductionist trap” in theoretical construction, resulting in a disconnect between theoretical supply and practical demand. Current studies predominantly focus on the cognitive behaviors (e.g., design thinking patterns and decision-making preferences), skill development (e.g., novice training and tool usage), or social network characteristics (e.g., virtual community interactions) of individual designers or small sample groups, while lacking analysis of the allocation characteristics of architectural designers at the macro level. System science theory emphasizes that the macro-level properties of complex systems cannot be derived simply by aggregating micro-level behaviors. Most existing studies are based on the reductionist perspective, attempting to explain industry phenomena by analyzing individual designers’ cognitive, behavioral, or relational characteristics. However, this approach neglects the evolving designer community within the industry ecosystem, causing existing research to fall short in constructing a bidirectional linkage model between micro-level behaviors and macro-level environments. Meanwhile, policymakers’ designs generally target macro-level issues, yet current studies only provide fragmented micro-level cases, making it difficult for micro-level theoretical frameworks to offer systematic and precise guidance for macro-level management practices.
Second, the limitations in research perspective have resulted in a pronounced phenomenon of “discussing designers in isolation”, with talent cultivation and allocation lacking analytical connections to the high-quality development of the construction industry. The theory of talent geography posits that the quantity, quality, and distribution of professionals must align with the developmental stage of the industry; otherwise, it may lead to talent wastage or shortages, threatening sustainable industrial development [36]. Currently, the construction industry is transitioning toward green and intelligent practices, with varying developmental stages across regions, coexisting expansion and contraction, and an increasingly fragmented architectural design market. As innovation influencing factors, designers play a pivotal role. When their quantity, skillsets, and spatial distribution mismatch the construction industry’s industrial demands, it results in either innovative resource waste or technological implementation barriers, directly undermining the sustainable development of the design market while further jeopardizing the efficiency of construction industry transformation and upgrading.

3. Materials and Methods

3.1. Study Area

The study area of this paper comprises 31 provincial-level administrative regions in mainland China, excluding Hong Kong, Macao, and Taiwan due to data unavailability. The primary rationale for selecting China as the research focus was because as the world’s largest developing country, China has demonstrated remarkable scale and speed in infrastructure construction and urbanization processes—particularly in urban renewal and rural revitalization. The development status of its engineering survey and architectural design industries holds significant “bellwether” implications for global trends in this sector. In 2023, China had 29,352 enterprises with engineering survey and design qualifications, employing 4.827 million workers, including 1.077 million engaged in design. Its architectural design market ranks among the top globally, demonstrating broad representativeness. Notably, with the transformation of China’s economic and social development, the construction industry and real estate sector have entered a downturn, leading to a challenging period for the engineering survey and architectural design markets. This has further impacted the allocation of designers, such as the shift from rapid growth to a decline phase (Figure 1). China places high importance on the development of the engineering survey and architectural design industries, with central and local government departments issuing a series of policy documents. For example, the Ministry of Housing and Urban–Rural Development released the “14th Five-Year Plan for the Development of the Engineering Survey and Design Industry”, and Hukou County in Jiangxi Province issued Ten Measures to Promote High-Quality Development of the Engineering Survey and Design Industry. These policies clearly outline development goals for the design sector, requirements for enterprise qualifications and designer licensing, and propose measures to enhance design quality and optimize the market environment, aiming to improve the overall quality and competitiveness of the industry. In summary, China’s vast number of designers, and its pivotal position in global engineering survey and architectural design fields, coupled with deep government policy interventions, make it an ideal region for studying designer mismatch influencing factors and talent cultivation strategies under industry downturns. It is of great reference value for other countries worldwide.

3.2. Research Steps

The first step is to analyze the supply characteristics of designers, including the geographical distribution in the spatial dimension and the changing trends in the temporal dimension, to gain a comprehensive understanding of the overall situation of designers in China. The second step is to, using a spatial mismatch model, examine the alignment between designer supply and the development demands of the construction industry, identify regions, types, and degrees of mismatch, and diagnose symptoms of designer supply–demand mismatch. The third step is to analyze the influencing factors of designer mismatch using Geodetector to quantitatively reveal the root causes of designer supply–demand mismatch. The fourth step proposes talent cultivation strategies for architectural designers that align with the industry’s downturn, based on the analysis results from the second and third steps, providing a foundation for developing solutions to designer mismatch issues.

3.3. Research Method

3.3.1. Spatial Mismatch Index

The spatial mismatch theory was initially used to explain unemployment issues caused by the spatial separation between African American labor in urban centers and suburban job opportunities in the United States, with its core being the geographical mismatch between labor supply and demand [37]. The spatial mismatch theory is now widely applied in fields such as design, urban planning, geography, economics, demography, and education. Its primary purpose is to analyze the imbalance between the spatial distribution of various resources (e.g., labor, talent, schools, and medical facilities) and demand, providing a theoretical foundation for spatial planning and management policies. Designers are high-end human resources in the construction industry. Ensuring a mutual match between their spatial supply and the development demands of the construction industry is key to preventing unemployment among designers and promoting high-quality growth in the sector. Therefore, the spatial mismatch theory enables quantitatively evaluating the spatial imbalance between designer supply and the development needs of the construction industry, thus offering an analytical framework for optimizing the spatial allocation of designer resources and coordinating regional development in the construction industry.
This paper employs the spatial mismatch index to analyze whether the supply of designers aligns with the development needs of the construction industry. The calculation equations are shown in (1) to (2). A zero value of S M I i indicates a perfect match between designer supply and the development demands of the construction industry.   S M I i less than zero signifies an oversupply of designers, exceeding the actual demand for high-quality development in the construction industry amid its downturn. This necessitates guiding the outflow of designers from the local area or fostering their better and faster development to more effectively accommodate the surplus. S M I i greater than zero indicates a shortage of designer supply, which may become a key factor constraining the high-quality development of the construction industry, necessitating the introduction of designers from surplus regions in large numbers. A larger absolute value of the spatial mismatch index indicates a higher degree of designer mismatch.
S M I i = E i E X X i 2 E × 100 % ,   S M I = i = 1 n E i E X X i 2 E
C i = S M I i S M I × 100 %
where S M I i represents the spatial mismatch index of the i th province, and S M I represents the total sum of absolute values of S M I i in China. C i represents the contribution degree of the designer spatial mismatch index. E i represents the high-quality development demand intensity of the construction industry in the i th province; E represents the overall development status of China’s construction industry, which is the sum of all provinces. Many indicators such as value-added, total output value, and contracted project amounts can measure the high-quality development demand of the construction industry. This paper selects value-added as the metric. The primary reason is that the value-added metric of the construction industry represents the final monetary outcome of construction enterprises’ production and business activities during the reporting period. It serves as a crucial basis for the government in formulating macro-control policies for the construction industry. Compared with other indicators, it reflects the true economic contribution and demand scale of the construction industry, directly relates to the supply of architectural designers, and possesses greater policy sensitivity and macro-control significance. Moreover, the added value data for the construction industry exhibits greater availability and international comparability, enabling it to be compared and aligned with empirical research from other countries and regions. X i represents the number of designers in the i th province; X represents the total number of designers in China. It is worth noting that high-quality development in the construction industry is a complex adaptive system with dynamic resilience. Therefore, designer mismatch must reach a sufficient degree to have a significant negative impact on the high-quality development of the construction industry. This paper uses the average of positive and negative S M I i values as the threshold to classify spatial mismatch types into four categories: Positive Mismatch when S M I i is greater than the positive average; Positive Matching when S M I i is greater than zero but less than the positive average; Negative Matching when S M I i is greater than the negative average but less than zero; and Negative Mismatch when S M I i is less than the negative average. Taking the SMI calculation for Jiangsu Province in 2023 as an example, the calculation process is presented as follows: collect basic data: number of designers in 2023: 655,332 in Jiangsu Province and 4,827,324 nationwide (in China); value-added of the construction industry: 776.57 billion yuan in Jiangsu Province and 8528.13 billion yuan nationwide (in China).
Calculate this using Formula (1): S M I i = E i E X X i 2 E × 100 %
SMIJiangsu = (((7765.7/85,281.3) × 4827,324 − 655,332)/(2 × 85281.3)) × 100% = −2.23
By following the same method, the S M I i for each province can be calculated.

3.3.2. Geodetector

Geodetector was first proposed by Wang Jinfeng’s team at the Chinese Academy of Sciences in 2010 in the paper “Geographical Detectors-Based Health Risk Assessment”. Initially, it was employed to analyze the geographical environmental factors influencing neural tube defects in newborns in Heshun County, Shanxi Province, China [38,39]. The method quantifies spatial stratified heterogeneity to reveal the influencing factors behind the distribution differences of geographical phenomena. It has since evolved into a mainstream international geographical analysis tool and is widely applied in fields such as environmental science, public health, and urban planning. This study employs Geodetector to quantitatively measure the influence of various factors on designers’ spatial mismatch and the interactive relationships among these factors, providing a scientific framework for diagnosing the causes of the mismatch between designer supply and the demand of the construction industry.
The output of Geodetector is an index q , which is positive, with larger values indicating stronger influence, and a maximum value of 1. Geodetector can calculate the interaction between two factors. When the interaction influence is less than the individual influence of either factor alone, it indicates a mutual inhibitory effect between the two factors, classified as nonlinear weaken; when the interaction influence lies between the maximum and minimum individual influences, it is classified as single nonlinear weaken; when the interaction influence is greater than the maximum individual influence but less than the sum of their individual influences, it is classified as bifactor enhancement; when the interaction influence equals the sum of individual influences, it indicates independent effects of the two factors, classified as independent; and when the interaction influence exceeds the sum of individual influences, it indicates a synergistic enhancement effect between the two factors, classified as nonlinear enhancement [40] (Figure 2). Calculations were performed using the Geodetector open-source software, and the program was obtained from the link http://geodetector.cn/ (accessed on 18 March 2024). The influencing factors need to be discretized before the use of Geodetector software. Prior to applying the Geodetector software, it is necessary to discretize the influencing factors. The discretization scheme directly impacts the analysis results. While the software requires at least 2 provinces to be assigned to each group, we consider assigning at least 5 provinces to each group to be more reasonable in terms of the representativeness and significance of the grouping results. This study utilizes the quantile method. Given that there are 31 provinces in the study area, this resulted in 5 discretization schemes. During the calculation process, the optimal scheme was selected by further observing the p-values and their variations in the analysis results from each discretization scheme, thereby addressing the sensitivity issue in discretization. A threshold of 0.05 was set for the p-value; otherwise, the results would not pass the significance test. The optimal solution prioritizes schemes with strict statistical significance and relatively large influence values. Taking the urbanization rate as an example, the calculated q (p) values for its five discretization schemes are 0.18 (0.03), 0.21 (0.07), 0.32 (0.04), 0.40 (0.03), and 0.55 (0.01), respectively. After mandatory selection based on the above criteria, the last scheme was determined as the final calculation result. This study uses the quantile method to classify the influencing factors into h categories. N h represents the number of provinces included in each h category, with n = 31 (representing the total number of provincial-level administrative regions in China), and σ h 2 and σ 2 represent the factor variances for the h category and China, respectively. SSW is the within sum of squares, and SST is the total sum of squares for China. The calculation equation for q is as follows:
q = 1 h = 1 l N h σ h 2 N σ 2 = 1 S S W S S T ,   S S W = h = 1 l N h σ h 2 ,   S S T =   N σ 2

3.4. Data Sources

The designer data is sourced from the National Engineering Survey and Design Statistical Bulletin, while the added value of the construction industry and impact factor data are primarily derived from the China Statistical Yearbook, China Construction Industry Statistical Yearbook, and National Enterprise Innovation Survey Yearbook. The main reasons for selecting the impact factors are as follows: First, they are grounded in the needs of regional macroeconomic development. Designers are positioned at the forefront of the construction industry and engineering projects, directly serving regional urbanization and industrial development [41,42]. Therefore, the foundation of regional economic development (economic capacity for talent aggregation) and industrial demand (the direct influencing factors of employment opportunities) are essential macro-environmental factors to consider. This study uses 5 indicators to represent them: GDP, industrial structure index, urbanization rate, per capita GDP, and fiscal self-sufficiency rate [43]. Specifically, the industrial structure index is calculated by assigning weights of 1, 2, and 3 to the primary, secondary, and tertiary industries, respectively, and then multiplied by their respective proportions. A higher value indicates a more advanced industrial structure. The fiscal self-sufficiency rate is measured by the ratio of fiscal revenue to fiscal expenditure, reflecting the self-sufficiency capability of local governments. Secondly, closely following the development trends of the architectural design industry, this paper selects five indicators: number of design enterprises, average scale index of design enterprises, proportion of real estate added value in GDP, proportion of construction industry employment in total employment, and construction floor area. These indicators characterize the development status of the architectural design industry and the closely related construction and real estate industries, and determine the impact of sub-industry development on the demand for designers [44]. Third, emphasizing the technological innovation dependency of the design industry, four indicators of proportion of innovative enterprises in total construction enterprises, full-time equivalent of R&D personnel, R&D expenditure intensity, and number of valid patents are selected. These indicators characterize the regional innovation environment and technological level, reflecting the appeal of technological upgrading to designers [45,46]. Fourth, addressing the motivations for talent aggregation and mobility, four indicators of disposable income of residents, average housing price, number of beds in medical and health institutions per 1000 people, and number of artistic performance sessions are selected. They, respectively, reflect income attractiveness [47], the repelling effect of housing costs [48], and the influence of healthcare and cultural service quality [49], characterizing how regional living environment comfort and livability affect the spatial aggregation and mobility of designers. It is worth noting that the supply of designers directly stems from the development demand of the construction industry, and this study has consistently used the “value added of the construction industry” indicator to measure this demand. Furthermore, the development of the construction industry is profoundly influenced by macro-factors such as economy, innovation, and talent mobility—these constitute indirect factors that exert a non-negligible impact on the supply and demand of architectural designers. Therefore, this study selects indicators including GDP, R&D expenditure intensity, number of valid patents, residents’ disposable income, average housing price, and number of artistic performances to measure these macro-factors.

4. Results

4.1. Analysis of Designer Market Supply

4.1.1. Spatial Features

Architect distribution in China exhibits spatial imbalance, with marked provincial disparities in designer proportions. Designers are predominantly concentrated in eastern coastal regions such as Jiangsu and Shandong, while central and western provinces like Qinghai and Xizang generally have fewer, with the exception of some provinces such as Sichuan. This may be related to factors such as regional economic development levels, industrial structure, and urbanization processes. Economically developed areas are typically more dynamic, with diverse thriving industries and strong demand for design services, offering more employment opportunities and better career platforms, thereby attracting designers to relocate. In contrast, less developed regions face limitations in economic growth, with smaller design demands and a narrower scale of the design industry, resulting in significant disadvantages in attracting and aggregating designers (Table 1).
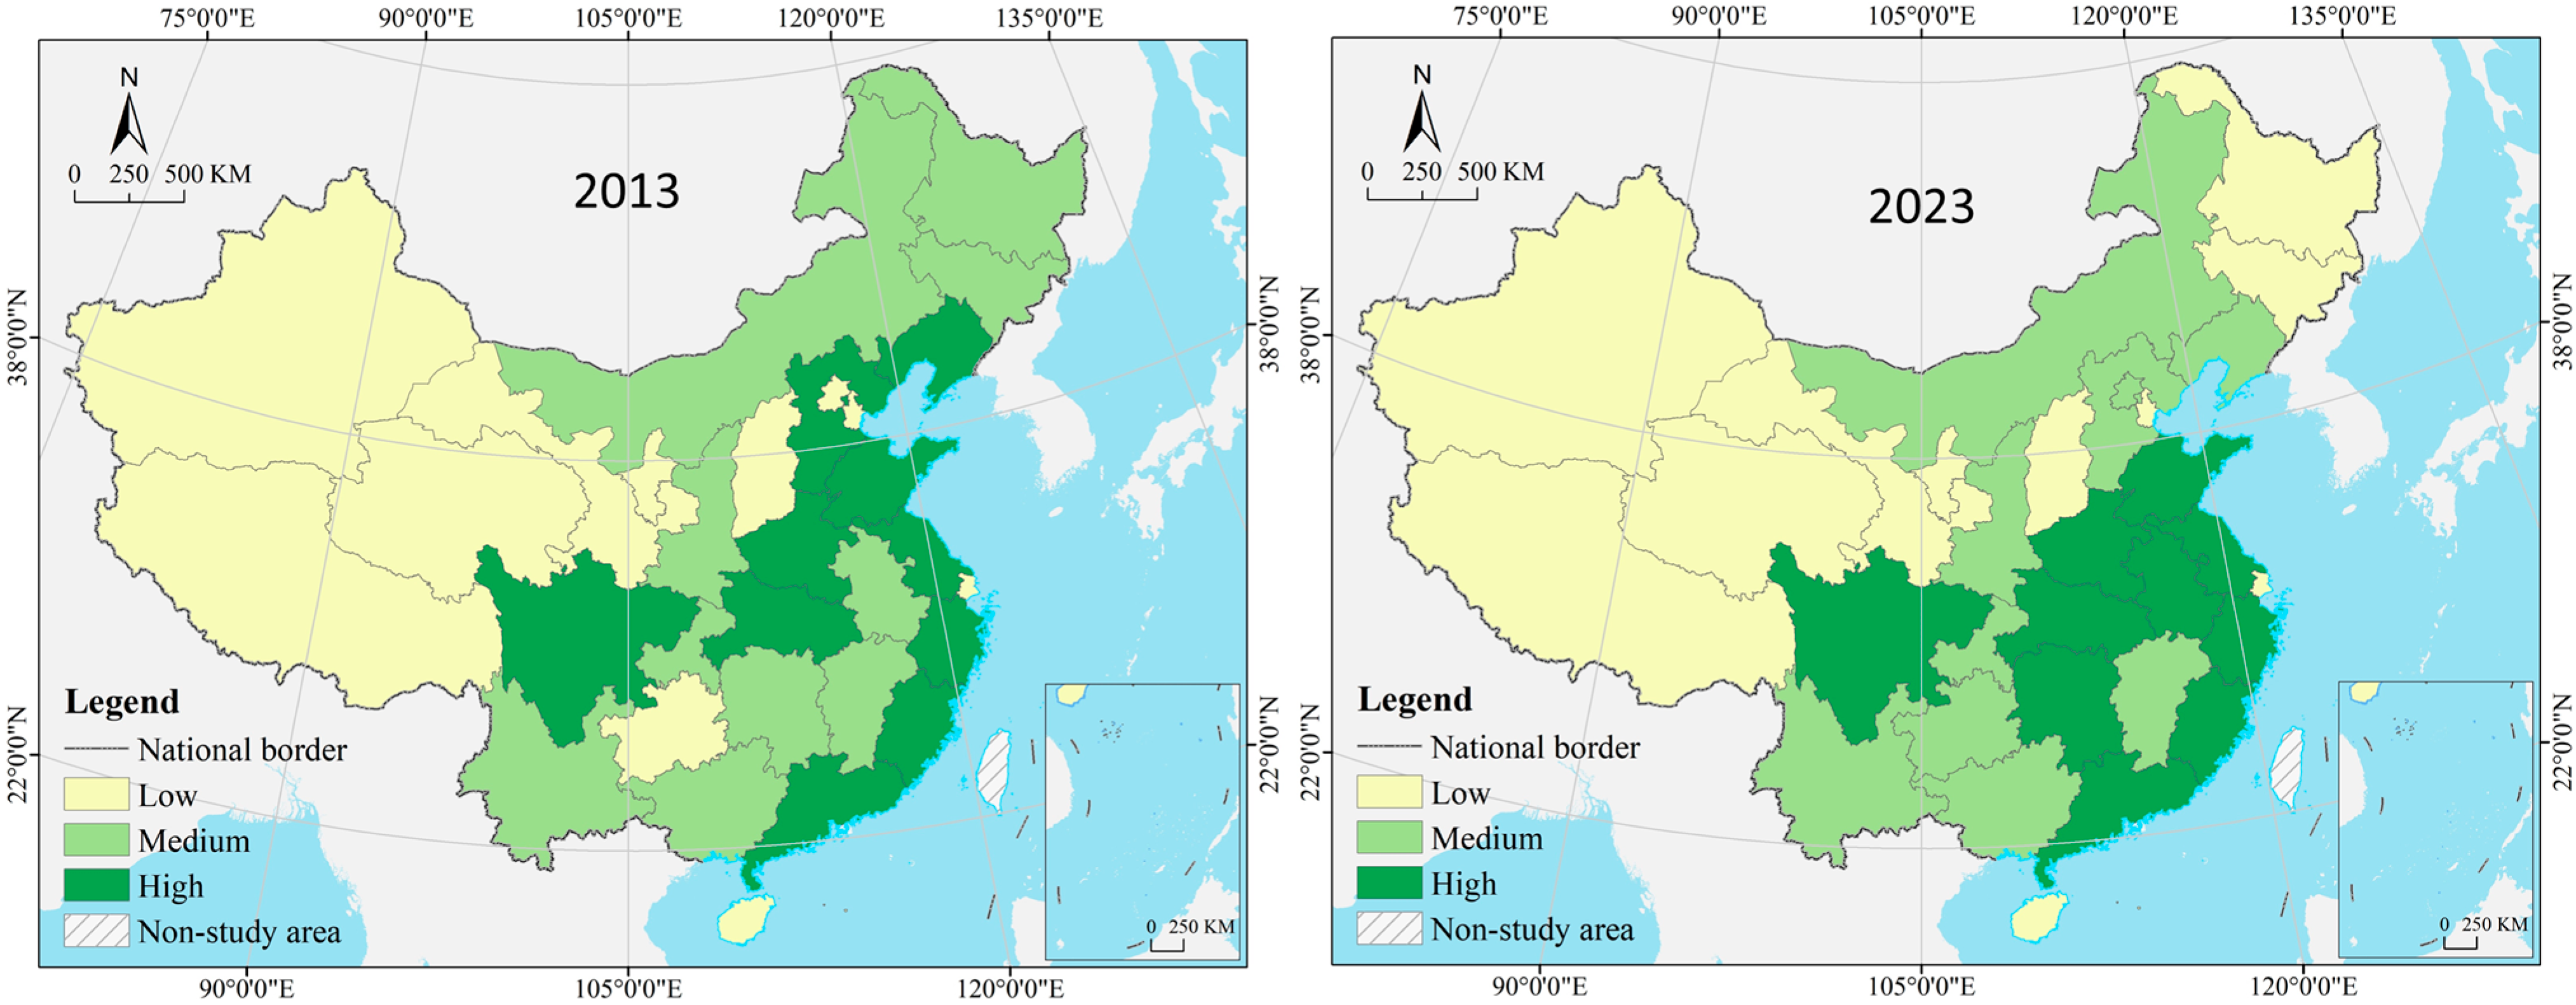
Quantile cluster analysis conducted for 2013 and 2023 shows that the gradient characteristics and agglomeration characteristics of the geographical distribution of China’s designer supply volume remain unchanged, while the spatial pattern has undergone adjustments. The highly agglomerated areas of designers have undergone significant changes in form—contracting in the northern part of coastal areas and expanding notably in the central region—and their overall pattern has transformed from the Chinese character “person” to the letter “O”. The moderately agglomerated areas of designers have remained largely unchanged, with only a slight contraction in the Northeast China region and moderate densification in the central region. The lowly agglomerated areas have been mostly concentrated in the western region, with a few scattered in the central region and Northwest China (Figure 3).

4.1.2. Changing Trends

Chinese designer supply is experiencing complex transformations, marked by concurrent growth and decline. Positive trends predominantly emerge in economically vibrant cities and regions with robust market demand, reflecting sustained, rapid growth in designer numbers. For instance, Tianjin witnessed a growth of 64.07% in 2013, while Hebei Province reached an impressive growth of 218.25% in 2015. It is noteworthy that although negative changes did occur, they were mostly short-term fluctuations that did not affect the overall upward trend (Table 2). Spatial agglomeration is prominent, with major urban clusters becoming the primary hubs for designers. The number of designers in Beijing, Tianjin, and Hebei within the Beijing–Tianjin–Hebei urban agglomeration has grown to varying degrees, with close interconnections among them. This trend is also evident in the Yangtze River Delta region (Shanghai, Jiangsu, and Zhejiang) and the Pearl River Delta region (Guangdong). These areas not only boast a solid economic foundation but also feature well-developed industrial chains and market environments, encouraging more design talents to gather there. In contrast, the western and northeastern regions (such as Heilongjiang, Jilin, and Liaoning) have experienced slower growth, with some even recording negative growth. Notably, with increasing national emphasis and support for the development of central and western regions, some areas (e.g., Guangxi, Sichuan, and Yunnan) have begun to demonstrate strong growth potential in recent years and may emerge as new hubs for designers in the future. Meanwhile, considering the inherent characteristics of the design industry and its close connection with local economic and cultural factors, local governments should continue to optimize policy environments, strengthen talent cultivation and recruitment, and promote the healthy development of the regional design industry.
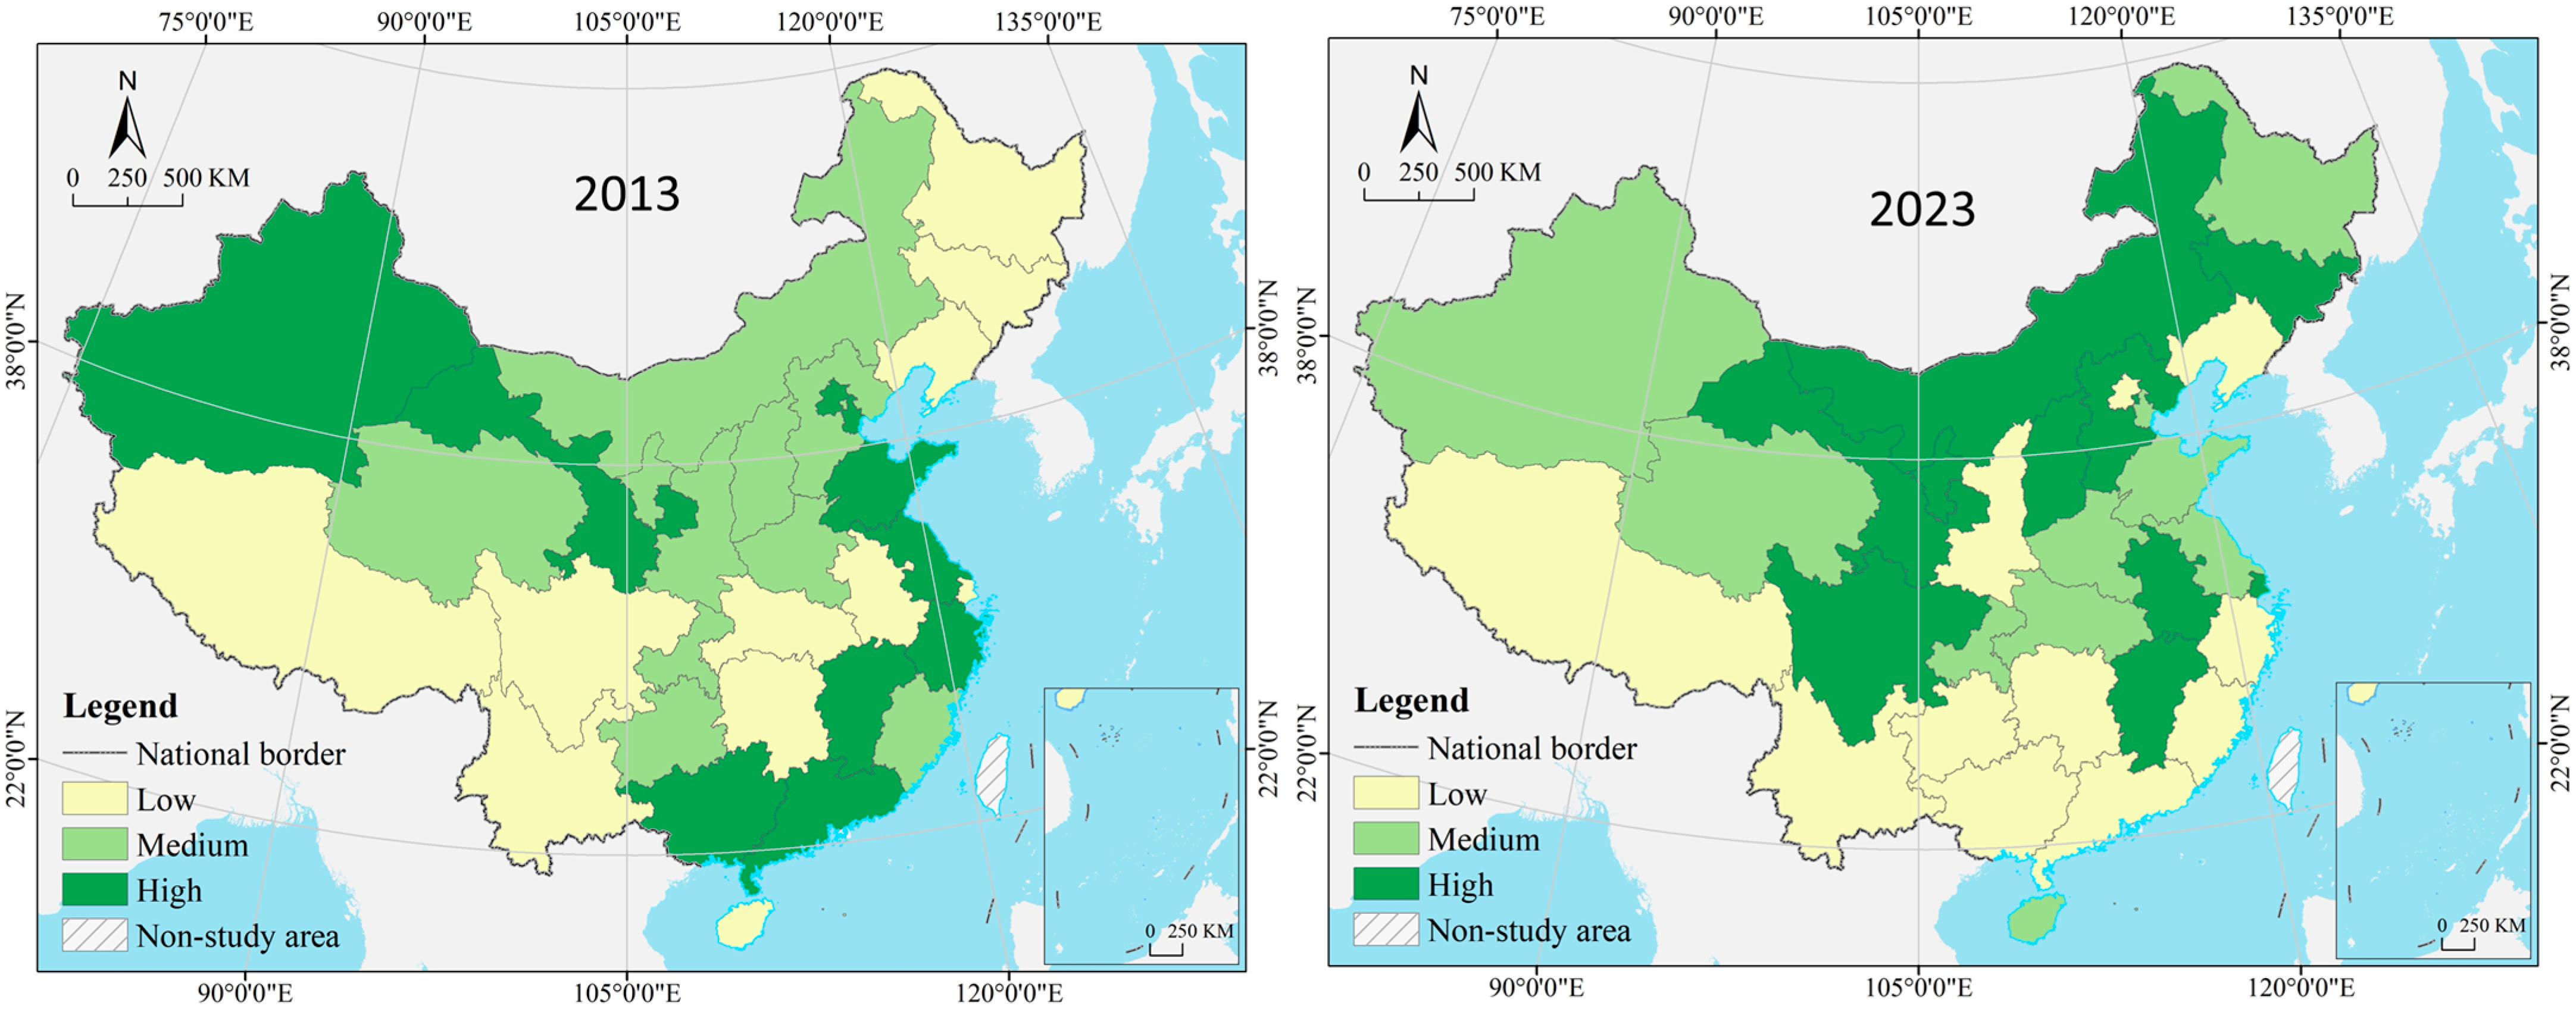
Quantile cluster analysis conducted on the change rate of designers in 2013 and 2023 shows that the geographical distribution pattern of changes in China’s designers has changed remarkably. In 2013, the high-growth regions presented a band-like agglomeration distribution in coastal areas and Northwest China; in 2023, this pattern transformed into a “π-shaped” one, with major agglomeration concentrated in regions such as Inner Mongolia, Gansu, Ningxia, Sichuan, Shanxi, Hebei, Anhui, and Jiangxi. In 2013, most of the moderate-growth regions were agglomerated in Northern China; by 2023, only two small-scale agglomeration areas had formed in Northwest China and the central region. For low-growth regions, three agglomeration areas were formed in Southwest China, the central region, and Northeast China in 2013; while in 2023, a large-scale border–coastal agglomeration belt had formed, spanning from Xizang to Zhejiang (Figure 4).

4.2. Analysis of Designer Mismatch Characteristics

4.2.1. Designer Mismatch Type

Regarding Positive Mismatch, provinces such as Neimenggu, Shandong, Henan, Yunnan, Chongqing, and Sichuan have recorded this type of mismatch up to 11 times, indicating that these regions have long faced a severe shortage of designer supply, making it difficult to meet the high-quality development demands of the construction industry. For Positive Matching, provinces like Jilin, Hainan, Xizang, Qinghai, and Ningxia have recorded this type 11 times, signifying that these provinces have long experienced a relative shortage of designer supply compared to construction industry demand but remain within a reasonable range. For Negative Matching, Tianjin has recorded this type 11 times, demonstrating that over the past 11 years, the supply of designers in Tianjin has been well matched with the high-quality development demands of the construction industry. For Negative Mismatch, Beijing and Zhejiang have recorded this type 11 times, indicating that during 2013~2023, these provinces have long been in a state of excessive designer supply relative to the high-quality development demands of the construction industry (Table 3).
Provincial disparities are pronounced, revealing distinct spatial clustering patterns. In eastern China, regions like Beijing, Shanghai, and Zhejiang predominantly exhibit Negative Mismatch, having amplified construction sector investments during specific periods that drew designer inflows. However, the growth in demand did not meet expectations, resulting in a relative oversupply of designers. Jiangsu exhibits multiple types of mismatches, indicating a complex relationship between the development of its construction industry and the supply of designers, with potential variations in supply–demand dynamics across different years. In the central region, provinces such as Henan, Anhui, and Hubei predominantly show Positive Mismatch, suggesting that these economically developed and construction industry-active areas may experience rapid industry growth and strong demand, while the supply of designers lags behind, leading to significant supply–demand gaps. For the western region, provinces such as Neimenggu, Chongqing, Sichuan, and Yunnan mostly exhibit Positive Mismatch, while Xizang, Qinghai, Ningxia, and other areas are predominantly characterized by Positive Matching, all experiencing a state of supply–demand imbalance, though the degree varies significantly. In the northeastern region, Liaoning demonstrates both Positive Mismatch and Positive Matching, indicating an unstable supply–demand relationship; Jilin is primarily marked by Positive Matching, reflecting a relatively balanced supply–demand dynamic; and Heilongjiang is dominated by Positive Matching, with a small proportion of Positive Mismatch, suggesting an overall optimistic supply–demand scenario.
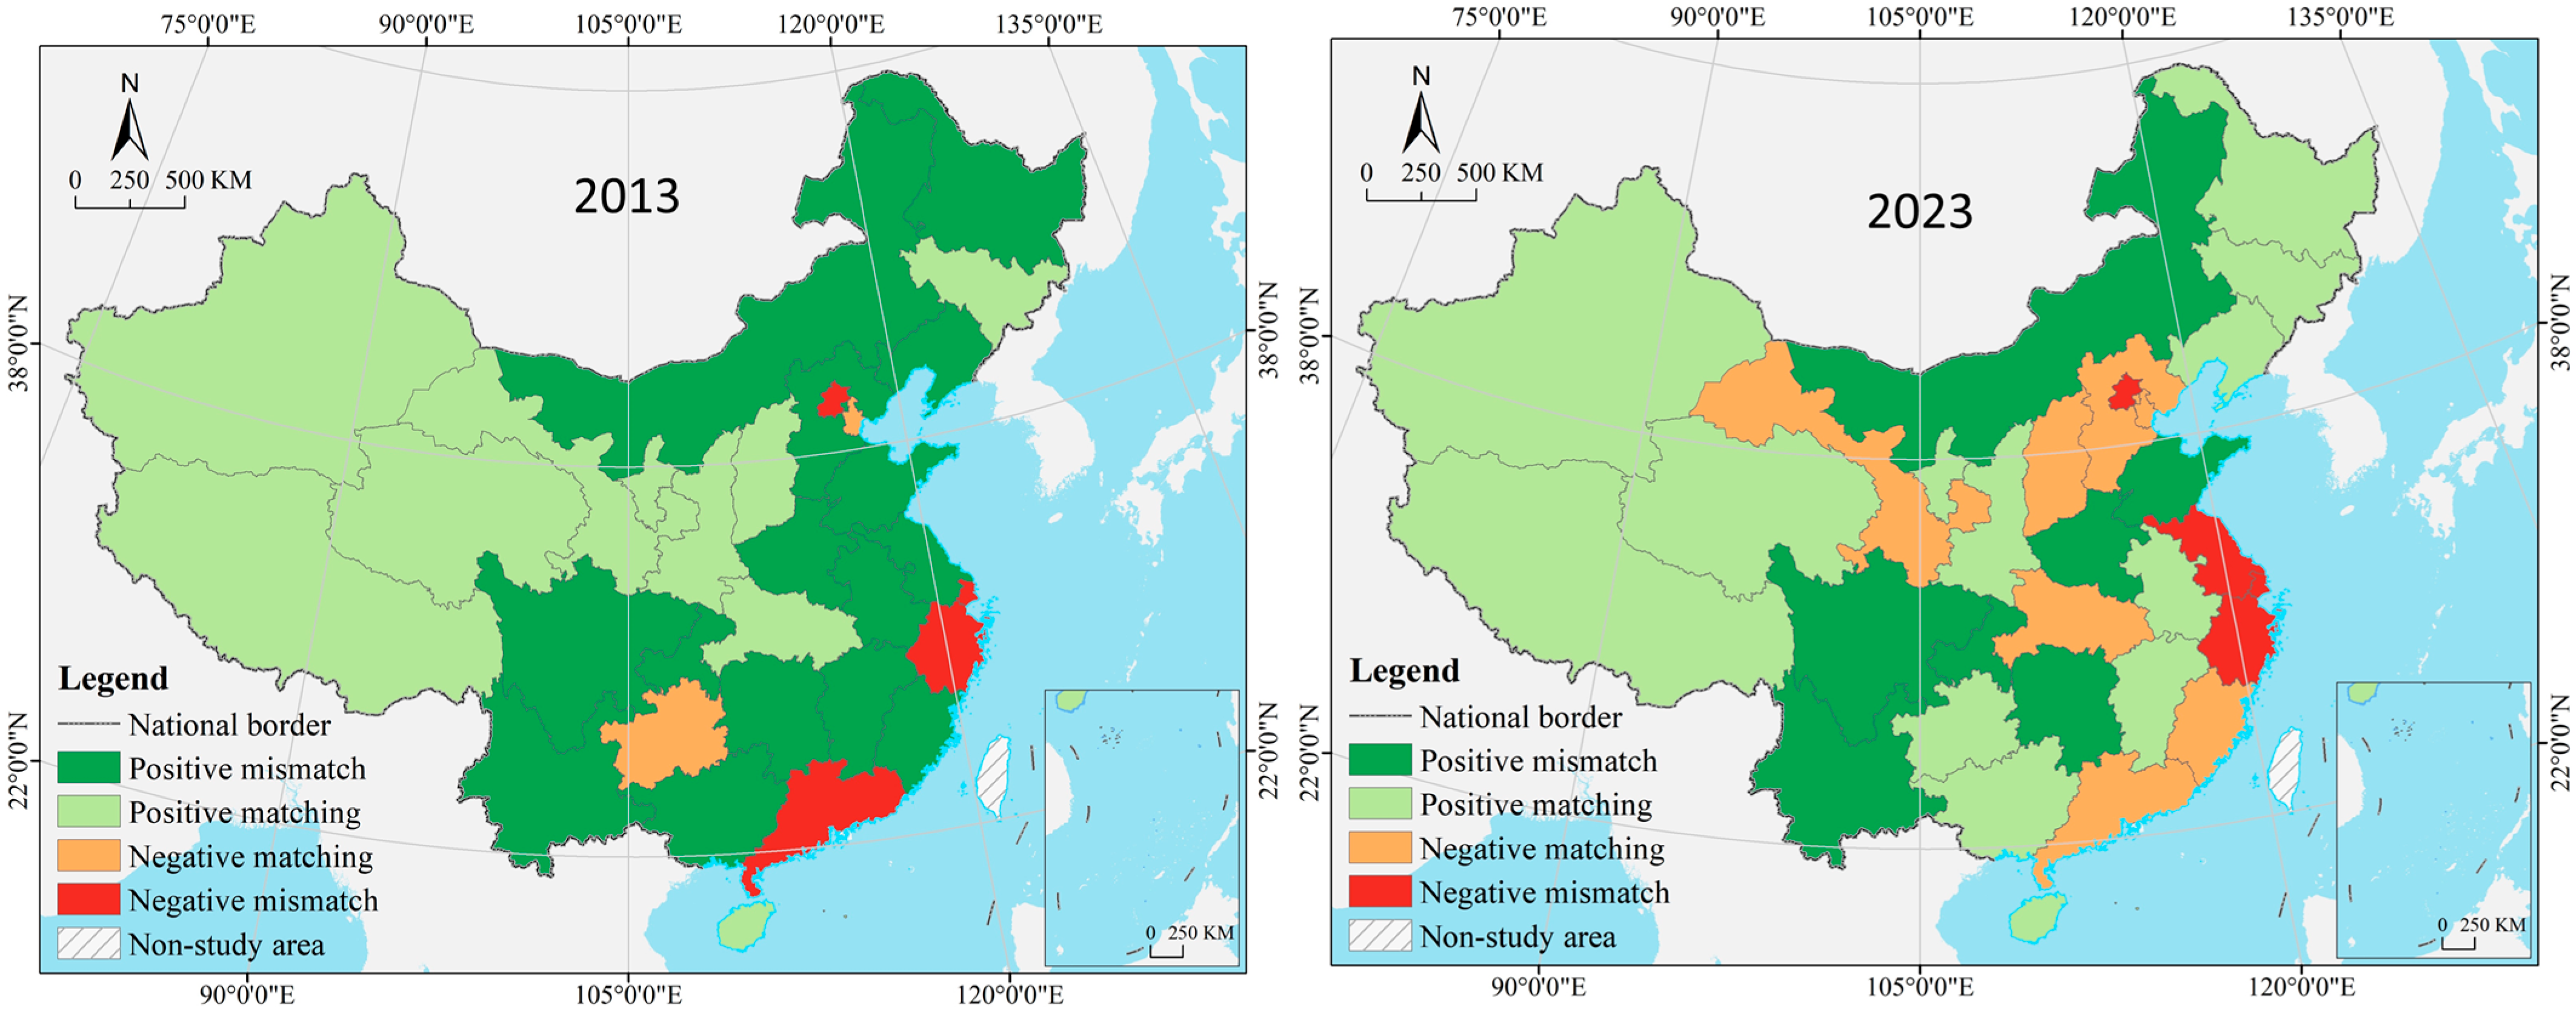
Comparative analysis of the geographical distribution patterns of designer mismatch types in 2013 and 2023 reveals the following: For Positive Mismatch, in 2013, it was highly agglomerated and continuously distributed, with its coverage extending from Northeast China and North China to the eastern coastal areas and Southwest China. However, the agglomeration feature of its geographical spatial pattern was significantly weakened in 2023—only small-scale clusters were maintained in Southwest China, while the scale of such clusters in other regions decreased significantly. For positive matching, most of it was agglomerated in Northwest China and the middle and upper reaches of the Yellow River Basin in 2013. In 2023, its agglomeration feature remained unchanged in Northwest China, contracted significantly in the Yellow River Basin, and expanded significantly in Northeast China, Southwest China, and the central region. For negative matching, it has long shown a scattered distribution pattern: the number was extremely small in 2013 and increased significantly in 2023, but distinct agglomeration areas still failed to form. For Negative Mismatch, it has long been scarce in quantity and scattered in distribution, with no large-scale geographical agglomeration areas formed (Figure 5).
In summary, the evolution of mismatch types between Chinese designers and the high-quality development of the construction industry exhibits distinct regularity. The four mismatch types display significant spatial heterogeneity and clustering, with an increasingly balanced distribution. From 2013 to 2023, the proportion of Positive Mismatch consistently declined, while Positive Matching and Negative Matching showed a gradual increase. The proportion of Negative Mismatch remained relatively stable (Table 4).

4.2.2. Designer Mismatch Contribution

The numerical values of designer mismatch contribution among different provinces vary significantly. For instance, Beijing exhibited relatively high mismatch contribution in certain years, such as 2013 when it reached 21.79%, whereas Heilongjiang showed extremely low mismatch contribution in some years, like 2019 when it was merely 0.02%. It indicates substantial disparities in the severity of mismatch between designers and high-quality development of the construction industry across different provinces. From the perspective of temporal trends, Zhejiang Province’s contribution of mismatch peaked at 22.74% in 2015, with consistently high values in other years, suggesting that this province may have faced a relatively severe designer allocation issue over an extended period. In contrast, Tianjin’s mismatch contribution values were generally low and stable, remaining below 2.6% for an extended period, indicating relatively mild and stable mismatch conditions in this region (Table 5).
In the eastern coastal regions, developed areas such as Beijing, Shanghai, Zhejiang, and Guangdong exhibit relatively high mismatch contributions in certain years. This may be attributed to the rapid development and large scale of the construction industry in these regions, which demands a diverse and substantial number of designers. Additionally, the mobility of designers and market adjustment influencing factors may be relatively complex, leading to a higher degree of mismatch. In the central regions, provinces such as Henan, Anhui, and Hubei show fluctuating contributions to mismatch. Henan exhibited relatively high mismatch values between 2016 and 2019, likely due to rapid expansion in the construction industry during this period, where designer resources failed to match in terms of quantity or structure in a timely manner. Anhui, on the other hand, demonstrates moderate overall mismatch values, indicating that the coordination between its designers and the development of the construction industry is at an intermediate level. In the western region, most provinces such as Xizang, Qinghai, and Ningxia exhibit overall low levels of mismatch contribution. For instance, the mismatch values for Xizang across years mostly range between 0.7 and 1.5, which may be attributed to the relatively small scale of the construction industry in these areas, limited demand for designers, or a higher alignment between local designers and the development of the construction industry. However, some western provinces like Sichuan show higher mismatch contribution in certain years, possibly due to factors such as the initiation of major construction projects locally. In the northeastern region, the mismatch contribution of Liaoning, Jilin, and Heilongjiang provinces is generally low and relatively stable. For example, Heilongjiang recorded low mismatch values in most years, indicating that the mismatch between the local construction industry and designer resources is relatively insignificant. This could be attributed to the slower development of the local construction industry, resulting in a smaller gap between demand and supply.
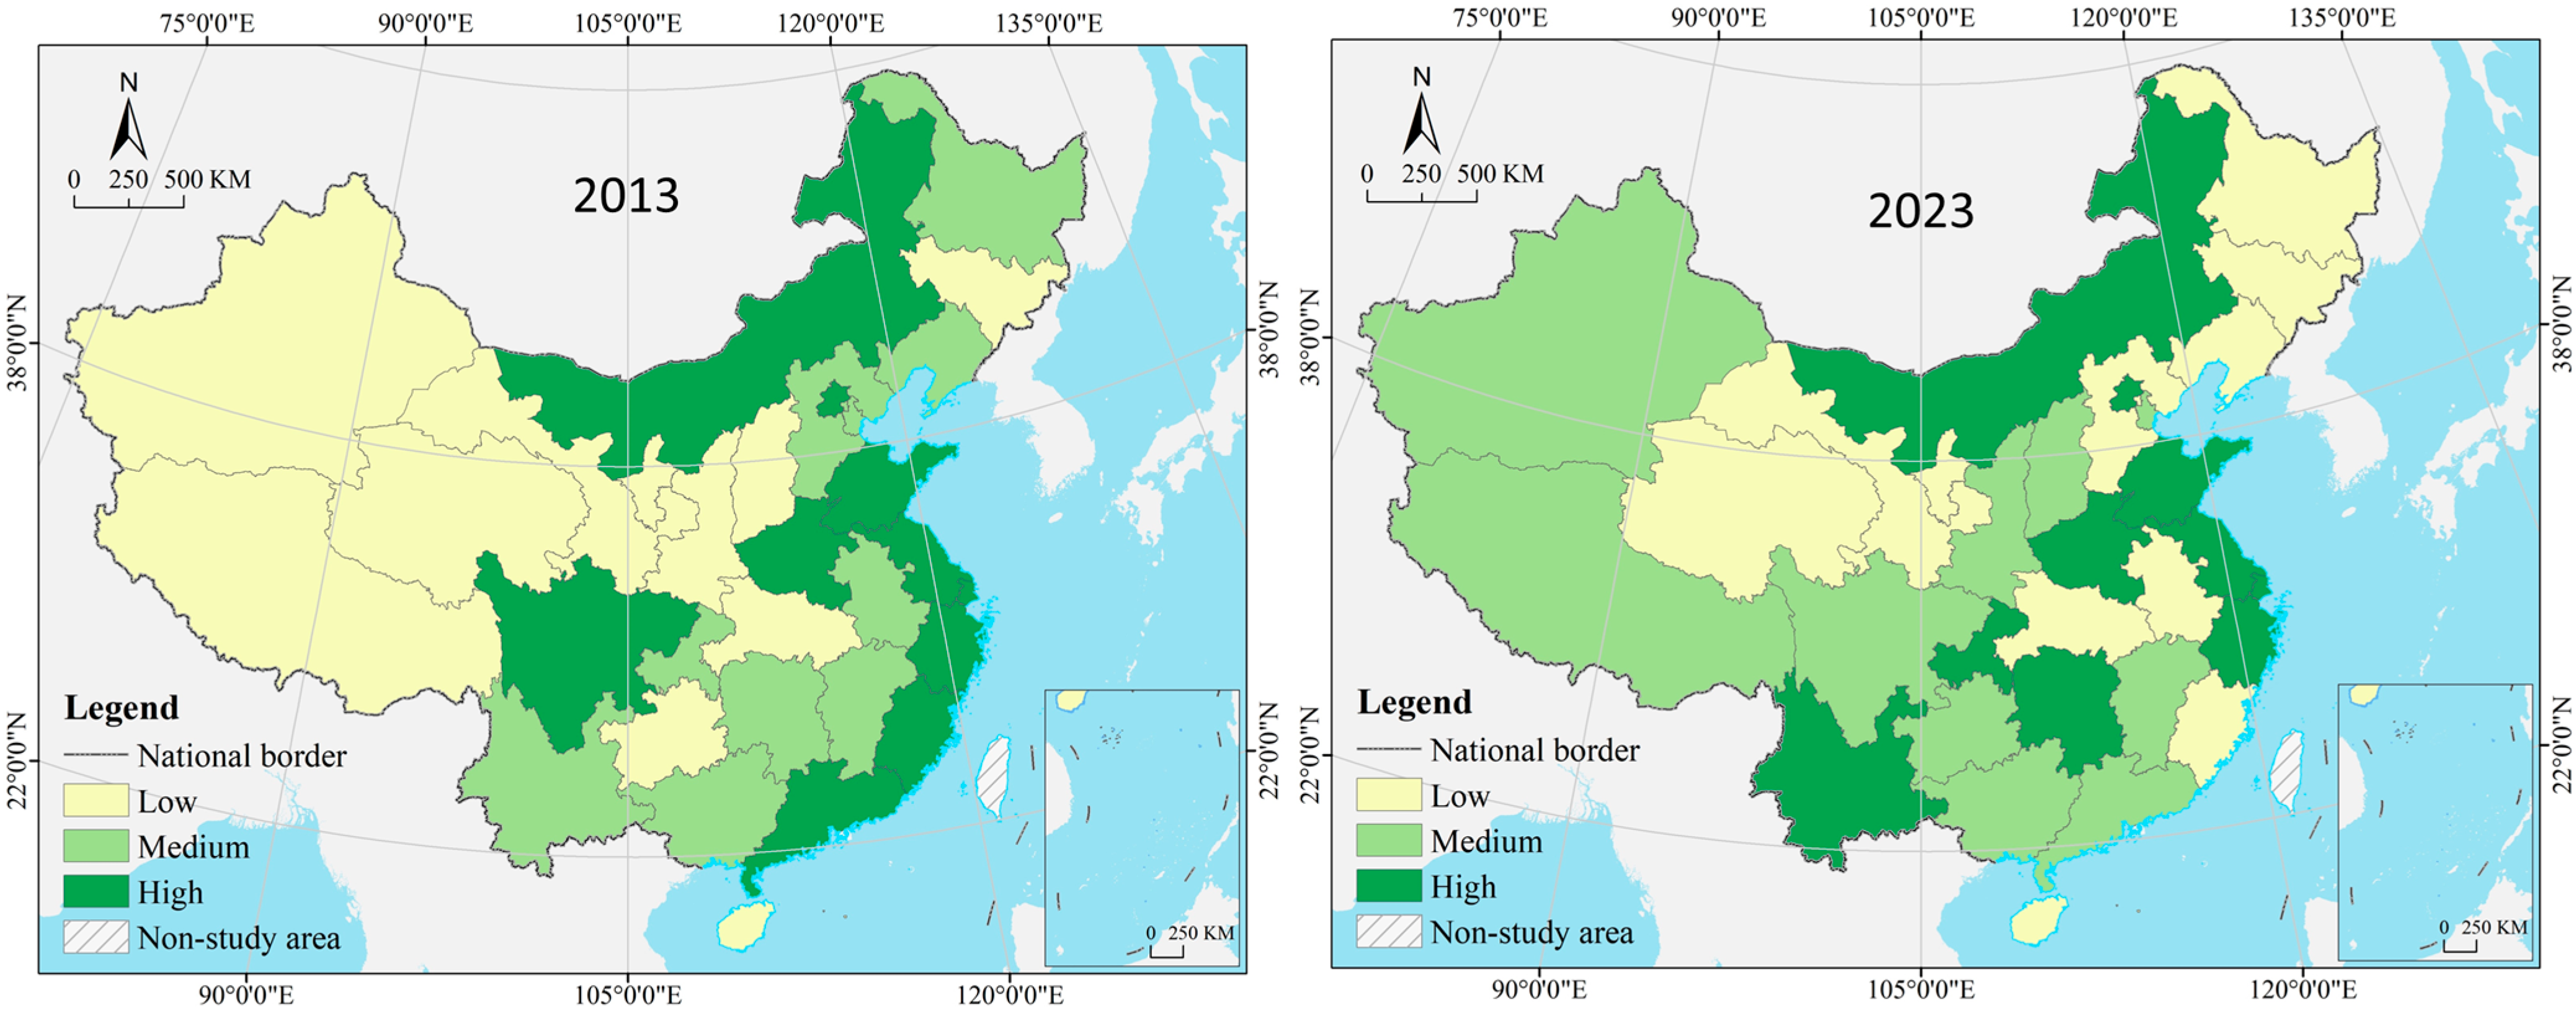
Quantile cluster analysis on the mismatch contribution degree of designers in 2013 and 2023 shows that the spatial pattern of China’s designer mismatch contribution degree has changed remarkably. In 2013, except for a few provinces and cities such as Sichuan, Inner Mongolia, and Beijing, most high-contribution regions presented a band-like continuous distribution in coastal areas. In 2023, high-contribution regions generally showed a scattered distribution, with only a small-scale agglomeration area formed in the lower reaches of the Yellow River and Yangtze River from Shandong to Zhejiang. In 2013, medium-contribution regions were adjacent to high-contribution regions, forming a “core-periphery” structure with prominent marginalization characteristics. In 2023, medium-contribution regions presented a concentrated and continuous band-like distribution, having broken away from dependence on high-contribution regions. In 2013, most low-contribution regions were agglomerated in the western region and the middle and upper reaches of the Yellow River Basin, forming a large-scale agglomeration area. In 2023, the agglomeration degree decreased significantly: two small-scale agglomeration areas were formed in the upper reaches of the Yellow River Basin and Northeast China, while the agglomeration area in the lower reaches of the Yangtze River has not yet formed (Figure 6).

4.3. Influencing Factors of Designer Mismatch

4.3.1. Impact Intensity

Four high-impact factors (q ≥ 0.5) are identified as follows: full-time equivalent of R&D personnel ( X 12 ), number of valid patents ( X 14 ), industrial structure index ( X 2 ), and fiscal self-sufficiency rate ( X 5 ). R&D personnel serve as the core carriers of regional innovation capability, and their scale directly influences the construction industry’s demand for “high-tech, high-value-added” designs (e.g., green buildings and smart construction). If the supply of designers in regions with concentrated R&D personnel fails to meet innovation demands (e.g., due to insufficient skills or quantity), the degree of mismatch will significantly increase. The number of valid patents reflects the accumulation of regional technological innovation achievements. In areas with high patent density, the construction industry is more inclined to adopt new technologies and design solutions, placing more specific demands on designers’ professional expertise (e.g., BIM technology and low-carbon design). If designers’ skills mismatch with patent application scenarios, the degree of mismatch will intensify. A high industrial structure index indicates regional industrial diversification (e.g., a high proportion of service and high-tech industries), and the linkage between the construction industry and other sectors (such as commercial complexes and industrial park design) will change the demand structure for designers. If industrial upgrading outpaces the adjustment speed of designer supply, the mismatch will significantly increase. Regions with high fiscal self-sufficiency rates empower local governments with stronger investment capabilities in infrastructure and public buildings (e.g., municipal projects and cultural venues), directly boosting designer demand. If fiscal allocation is concentrated but designer supply is dispersed (e.g., uneven talent distribution), spatial mismatch between supply and demand will occur (Table 6).
There are five medium-to-high influence factors (0.4 ≤ q > 0.5), including urbanization rate ( X 3 ), per capita GDP ( X 4 ), R&D expenditure intensity ( X 13 ), disposable income of residents ( X 15 ), and number of beds in medical and health institutions per 1000 people ( X 17 ). During urbanization, urban expansion and rural revitalization require massive construction, driving a surge in demand for designers. However, designers tend to cluster in large cities at the post-urbanization stage, and clients prefer hiring designers from developed cities for local projects, resulting in a mismatch of designer supply and demand across regions. Resident income determines the tier of construction projects (e.g., high-end residences, premium commercial spaces). High-income areas demand more personalized and high-quality designs, creating larger design markets and higher-value design services. Meanwhile, resident income directly influences the spatial allocation of designers. Designers, especially high-end designers, tend to gather and move to high-income areas. With the transformation and development of the construction industry, designers are increasingly inclined to explore new technologies, urgently requiring regions to intensify investment in technological research and development. If funding allocation does not match designers’ technical reserves, the mismatch will worsen. Medical bed indicators reflect the level of public services and indirectly influence a region’s attractiveness to talent. Areas with abundant medical resources are more likely to attract designers, but if construction industry demand is concentrated in regions with weak medical resources, a mismatch where “designers gather but demand is dispersed” will occur.
There are six medium-impact factors (0.3 ≤ q > 0.4); that is, number of design enterprises ( X 6 ), aerage scale index of design enterprises ( X 7 ), proportion of construction industry employment in total employment ( X 9 ), proportion of innovative enterprises in total construction enterprises ( X 11 ), average housing price ( X 16 ), and number of artistic performance sessions ( X 18 ). The scale and number of design firms directly reflect the supply capacity of designers. If firms are too small in scale, they may struggle to undertake large-scale projects, thereby exacerbating mismatches. The high cost of living in areas with high housing prices may drive designers to relocate to regions with lower living expenses. Regions with a high proportion of employment in the construction industry typically have numerous and large-scale projects, leading to substantial demand for designers. If the growth rate of designer supply lags behind the expansion speed of the construction industry, a mismatch of “excess demand and insufficient supply” will occur.
There are three low-impact factors (q < 0.3); that is, GDP ( X 1 ), proportion of real estate added value in GDP ( X 8 ), and construction floor area ( X 10 ). GDP is a macro-level indicator and it is difficult to precisely reflect the structural relationship between the construction industry and designers. Against the backdrop of sluggish growth in China’s real estate industry in recent years, fluctuations in the real estate market have weakened the correlation with designer demand, resulting in a decline in influence. Construction floor area primarily reflects the scale of the construction industry but fails to capture the structural characteristics of design demand (e.g., type and technical difficulty), leading to a weaker correlation with designer supply allocation and thus lower impact.

4.3.2. Interaction Effect

Most factor pairs exhibit an interaction relationship categorized as bifactor enhancement, such as the number of artistic performance sessions ( X 18 ), number of beds in medical and health institutions per 1000 people ( X 17 ), proportion of innovative enterprises in total construction enterprises ( X 11 ), and GDP ( X 1 ). The majority of factor pairs formed with these factors demonstrate an interaction relationship classified as nonlinear enhancement. Based on the intensity of interaction influence, the relationships are categorized into three types: strong factor pairs, moderate factor pairs, and weak factor pairs. Strong factor pairs have interaction influence values close to or greater than 0.9. For example, the interaction influence between number of beds in medical and health institutions per 1000 people and urbanization rate ( X 17 X 3 ) reaches 0.96, which is double their individual effects under single-factor analysis. It indicates that during urbanization, the layout and allocation of medical resources have a synergistic and significant impact on designer mismatch. In regions experiencing rapid urbanization, unreasonable planning and development of medical resources may indirectly affect the growth of the construction industry and the demand for designers, thereby exacerbating designer mismatch. The interaction influence values of medium factor pairs range between 0.6 and 0.9, with most factor pairs falling into this category. For example, the interaction influence between the industrial structure index and urbanization rate ( X 2 X 3 ) is 0.61, indicating a relatively pronounced interaction between industrial structure and urbanization, jointly affecting designer mismatch. The interaction influence values of weak factor pairs are less than 0.6, suggesting that the interplay between these factors is relatively weak, with minimal joint impact on designer mismatch. For example, construction floor area and number of artistic performance sessions ( X 10 X 18 ) indicate their relative independence, with different pathways influencing designer mismatch, making it difficult to achieve effective synergy (Table 7).

5. Discussion

5.1. Theoretical Analysis of Designer Allocation

With the rise of the knowledge economy, human capital has begun to replace physical capital in demonstrating its importance in economic growth, drawing both businesses and governments into a “talent war” aimed at securing workers with scarce human capital [50]. At a time when China’s construction industry is transitioning from quantitative growth to qualitative improvement, designers are key talents who can influence the high-quality development of the construction economy [51]. Under a perfectly competitive market structure, designers freely relocate to regions with higher marginal productivity in accordance with market forces, attaining Pareto optimality in the designer labor market. Mismatch signifies that designer allocation deviates from this optimal state, suggesting that targeted interventions can rectify the imbalance, thereby boosting construction sector economic output or elevating industrial development quality [52]. The architectural design market operates in a state of dynamic fluctuation, where designer oversupply and undersupply are common phenomena. Only by accurately identifying the root causes, types, and industrial impact levels of designer mismatch can we “prescribe the right remedy” and propose reasonable corrective strategies. Through extended analysis of previous findings, we categorize designer mismatch into three theoretical types: cyclical mismatch, structural mismatch, and frictional mismatch.
Cyclical mismatch refers to designer misallocation caused by fluctuations in the construction economic cycle, characterized by unemployment rates inversely correlating with economic prosperity [53]. During rapid development phases of the construction industry, total demand for designers increases. However, due to the cyclical nature of designer training, supply–demand disconnection leads to mismatch where designer supply falls short. In recessionary periods of the construction industry, total demand for designers declines, yet the market retains a surplus of designers who face difficulties transitioning careers, resulting in oversupply mismatch. Currently, the growing divergence in construction industry development across provinces in China has created significant disparities in total designer demand generated by construction economies, with simultaneous growth and decline further exacerbating spatial mismatch characteristics where designer supply exhibits coexisting surpluses and shortages. Provinces such as Neimenggu, Shandong, Henan, Yunnan, Chongqing, and Sichuan have long experienced a Positive Mismatch in designer supply, indicating that the total demand for designers in these regions has consistently remained unmet. Meanwhile, Beijing, Shanghai, and Zhejiang have long been in a state of Negative Mismatch, reflecting weak total demand for designers. In contrast, the market development in other provinces is better, resulting in a serious spillover of designer space. Overall, cyclical designer mismatch is rooted in the macro-development environment of the construction economy, focusing more on the alignment between the total supply and total demand of designers. The key to addressing cyclical designer mismatch lies in counter-cyclical interventions in the total demand of the architectural design market. Based on the specific manifestations of designer mismatch, policy measures should target the development trends of local economies, particularly in sectors like construction, real estate, and civil engineering. When designer supply is insufficient, priority should be given to the possibility of an overheated construction economy; conversely, incentives for the development of the construction industry should be strengthened.
Structural mismatch refers to the supply–demand imbalance in designers’ skills and specialties caused by industrial restructuring in the construction industry, representing inevitable growing pains during industrial upgrading [54]. For instance, with the advent of the intelligent construction era, digital and smart design has become a new trend in the development of the construction industry. A plethora of new tools and technologies, such as IBM and prefabricated building design, continue to emerge [55,56]. Many traditional designers, constrained by factors like age and education, are unfamiliar with these new tools and technologies, and their mastered design skills have become obsolete [57]. As the construction industry transitions toward green and intelligent construction, traditional designers face unemployment. Influenced by developmental stages, regional cultures, industrial policies, and other factors, the growth of prefabricated buildings, green buildings, and intelligent construction in China remains uneven [58]. The root of structural mismatch lies in the disconnection between the supply of designers’ skills and the demand for architectural design positions, leading to “employment difficulties” in traditional design fields and “labor shortages” in emerging design sectors [59]. The coexistence of “employment difficulties” and “labor shortages” may occur within the same province or across different provinces, depending on the developmental divergence between traditional and emerging design markets. Jilin, Heilongjiang, Hainan, Xizang, Gansu, Qinghai, Ningxia, and other declining or underdeveloped regions in the northwest, northeast, and southwest border areas have long been in a state of Positive Matching, indicating that due to economic conditions, geographical factors, and quality of life, it is difficult to attract designers from emerging fields to settle down, likely exacerbating structural mismatches in local design markets. In contrast, Tianjin exhibits Negative Matching. As a major first-tier city in close proximity to Beijing, Tianjin exhibits strong appeal to emerging designers in terms of its economic environment, geographical location, and quality of life. This has led to a concentration of highly skilled designers in Tianjin, thereby avoiding the intense internal competition among designers in Beijing. Overall, the structural designer mismatch originates from the microeconomic structure of the construction industry, with a greater emphasis on the alignment between supply and demand for designers in both traditional and emerging sectors. Addressing the structural designer mismatch primarily hinges on the transformation of talent cultivation, guided by the evolving needs of the construction industry’s transition. Schools and enterprises must collaborate to establish a new designer training system.
Frictional mismatch represents a temporary state arising from designers’ job transitions. Owing to information asymmetry in the designer supply–demand market and mobility costs, job-seeking designers struggle to promptly access matching position information, while companies also require time to screen suitable candidates [60,61]. Meanwhile, time and economic costs associated with geographic relocation, skill certification, and contract termination slow down the matching process between architectural designers and design firms [62]. For instance, regions like Hebei, Shanxi, Jiangxi, and Fujian exhibit designer mismatch fluctuations between Positive Matching and Negative Matching, with no state persisting long-term, indicating they are in a benign frictional designer mismatch state. Their architectural design talent market can self-adjust and correct mismatch conditions without human intervention. It is worth noting that Jiangsu transitioned from Positive Mismatch to Negative Mismatch during fluctuations, Hubei shifted from Positive Matching to Negative Matching, and Guizhou changed from Negative Matching to Positive Matching. Their frictional designer mismatch conditions may be non-benign. The architectural design talent market is unable to correct the mismatch of designers through self-regulatory mechanisms, making human intervention measures urgently necessary. Overall, frictional designer mismatch focuses more on whether the mismatch is temporary or long-term, which can be caused by macro-environmental fluctuations or micro-level industry changes. The key to resolving frictional designer mismatch lies in reducing transaction costs in the architectural design market, such as improving employment and entrepreneurship information platforms for designers, providing re-employment and entrepreneurship education for designers [63], and correcting human capital mismatches caused by incomplete market information in the design industry.
It should be pointed out that both cyclical and structural designer mismatches have significant negative effects on the high-quality development of the construction economy. In contrast, frictional designer mismatch exhibits duality. Similar to cyclical and structural designer mismatches, excessive frictional designer mismatch may lead to designer wastage or shortages, thereby threatening the development of the construction economy. The difference is that moderate frictional designer mismatch reflects the vitality of the designer market, indicating that designers are pursuing better matches with design firms and careers. For example, when frictional mismatch manifests as a slight surplus of designers, it compels designers to proactively transform or engage in self-directed learning, thereby enhancing their design capabilities, and it will drive business upgrades for design firms, further leveraging the transformation of the local architectural design industry and market. Another example is when frictional mismatch appears as a slight shortage of designers. In such cases, design firms incentivize designers to expand their skill sets and enhance the diversity and complexity of their skills through rewards, compensation, professional titles, and promotions [64]. These measures similarly drive business upgrades for design firms and catalyze the expansion of the design industry and market. Academia holds a negative stance towards human capital mismatch, believing that designer mismatch hinders the development of the construction economy. In contrast, this paper argues for embracing frictional designer mismatch to facilitate a smooth transition during the transformation and upgrading of the construction industry and design sector.

5.2. Training Strategies for Design Talents

5.2.1. Establishing a Differentiated Supply System for Designers

Quantitatively, China’s designer supply demonstrates simultaneous surplus and shortage, revealing severe cyclical mismatches in architectural design talent. This is primarily manifested as spatial allocation imbalances across regions, where the coexistence of “over-concentration” and “acute scarcity” undermines the efficacy of capital and technology while widening regional development gaps. In developed regions and first-tier cities such as Beijing, Shanghai, and Zhejiang, the excessive concentration of designer resources has led to market saturation, intensified competition, and diminishing marginal output for new designers. For example, Shanghai has a large number of architectural design institutes and firms, but most enterprises are trapped in homogenized competition due to a lack of differentiated competitiveness, forcing some designers to engage in low-value-added design services. However, constrained by the lifecycle of economic development, the local construction industry has already entered a mature, stable, or even declining phase, making it difficult to experience explosive growth again in the short term. Therefore, it is recommended that these regions accelerate the design of policies to facilitate designer mobility, encourage design firms to actively implement the “going global” strategy, and promote designer initiatives such as “Go to West” or “Go Abroad” to better serve China’s Western Development or the Belt and Road Initiative [65]. The Chinese construction industry is currently in a downward phase of development. Thus, accelerating the introduction of policies to stimulate the construction economy and revitalize and expand the total demand of the design market should become the mainstream focus at this stage.
In contrast, central and western regions such as Henan, Anhui, Hubei, Guangxi, and Sichuan are facing growing demand for urban renewal and green buildings, but are unable to promote industrial upgrading due to a shortage of designers. In China, it takes a long time to train architectural designers. Typically, the educational phase consists of a five-year bachelor’s degree, a three-year master’s degree, and a four- to eight-year doctoral degree. After entering the workforce, designers must undergo eight to ten years of practical experience to transition from assistant designer to senior designer. Consequently, the strategy of cultivating architectural designers from scratch falls short of meeting the urgent needs of China’s Western Development and the construction of strategic national hinterlands. It is recommended that regions in central and western China with insufficient designer supply accelerate partnerships with eastern regions experiencing designer surpluses. Incentives such as preferential fiscal policies and project commissions may attract design firms to establish branches in the west, while special policies on professional promotions and compensation packages may encourage the relocation of surplus designers from the east to the west.

5.2.2. Establishing a School–Enterprise Joint Training System for Designers

From a qualitative perspective, the structural mismatch of designers cannot be overlooked. This is primarily reflected in the incomplete alignment between the structure of traditional and emerging field designers and the evolving trends in the construction industry’s upgrading. The adverse effects of designer mismatch on industrial structure upgrading primarily manifest as obstacles to industrial rationalization and technological advancement. For example, in regions with designer over-concentration, firms often prioritize low-cost labor over technological innovation, causing the architectural design industry to stagnate at the basic design service stage. In regions with a shortage of designers, however, enterprises struggle to achieve technological upgrades and product innovation due to the lack of high-end design talent. Without the creative thinking of designers to drive product differentiation, the rationalization of industrial structures stagnates. The structural mismatch of designers hinders the specialization of labor in the architectural design industry, particularly in emerging fields such as smart construction and green building design, where talent supply is insufficient, thereby affecting the progress of green building and smart construction development [66].
Since universities serve as the primary source of designer supply, the program offerings and talent development in Chinese universities have long adhered to the core principle of serving local economic development strategies. Therefore, the spatial mismatch of architectural designers in China can be regarded, to a certain extent, as a consequence or reflection of the mismatch between the supply of designer talent cultivated by universities and the development needs of local construction enterprises. Architectural design is an application-oriented major; however, in recent years, the talent cultivation in architecture universities and colleges has exhibited a prominent phenomenon of Academic Drift—the talent cultivation goals of these institutions have deviated from practice-oriented principles and shifted toward an academic orientation, leading to a gradual weakening of their capacity to serve the high-quality development of the construction industry. To ensure designers meet the actual demands of the architectural design market and socioeconomic development, universities should establish close collaborative relationships with architectural design firms to further optimize the design education system [67,68]. Universities and architectural design enterprises should jointly establish off-campus internship bases through co-investment, collaborating on student training and research projects. The government should take measures to promote mutual exchanges between teachers and designers, encouraging the sharing of design experience and the latest industry trends to ensure students receive comprehensive and up-to-date guidance in architectural design. On one hand, universities should establish design industry research institutes, appoint senior designers or project managers from architectural design firms as “industry professors” to impart the latest design skills to students, which can then be applied in their future design works [69,70]. On the other hand, enterprises should set up design R&D centers, appointing university professors as “technical advisors” or “technical managers/technology deputy directors”, enabling teachers to stay abreast of cutting-edge design trends and thereby equipping students with more practical design skills [71]. Following the operational model of “customizing courses based on industry needs, involving corporate mentors in teaching, and feeding research outcomes back into the industry”, efforts should be accelerated to enhance the training quality of future new designers [72]. Additionally, the research of architectural designers has long been confined within engineering or design disciplines, lacking interdisciplinary integration with fields such as sociology, economics, and complex systems science [73,74]. Therefore, the future cultivation of designer competencies should also emphasize interdisciplinary design education, establishing a multidimensional maturity evaluation model and standards for designers [75].

5.2.3. Optimizing the Development Environment for Architectural Design Talent Market

The frictional unemployment of architectural designers primarily stems from information asymmetry, lagging skill adaptation, and spatial mobility barriers, manifesting as temporary mismatches between design talent and job requirements. Against the backdrop of accelerating digital and intelligent transformation, key solutions to mitigate frictional unemployment include building efficient designer markets to reduce transaction costs, establishing new training systems to enhance talent adaptability, and optimizing urban livability to break down spatial mobility barriers. Now, China has not established a nationwide unified information platform for architectural designers, which results in significant information barriers in terms of designer recruitment and job application information between different regions. Furthermore, as China’s household registration system is linked to public services, the system for inter-provincial mutual recognition of designers’ professional qualifications remains inadequate across regions, and restrictions driven by local protectionism still exist in the bidding for construction projects in different regions—these factors thus lead to notable spatial barriers to the inter-provincial mobility of designers. To fully leverage and utilize designer resources, it is recommended to establish an intelligent designer supply–demand matching service platform in China, promote the “Internet + Employment” model, and achieve precise allocation between design positions and designers through AI algorithms. The deep application of AI in areas such as scheme generation and performance optimization are reshaping the working paradigm of architectural design [76,77]. For regions with higher fiscal self-sufficiency rates or larger numbers of patents, there are often strong innovative requirements for architectural design; intelligent construction and smart design thus tend to become additional or mandatory new design parameters. For instance, Guangdong Province, a national leader in both fiscal self-sufficiency and patent volume, explicitly states in its Implementation Opinions on Promoting Coordinated Development of Intelligent Construction and Construction Industrialization that by the end of 2030, it aims to cultivate no fewer than 100 leading backbone enterprises in intelligent construction, establish at least three industrial clusters with an annual output of 100 billion RMB in intelligent construction, ensure that over 80% of construction projects province-wide adopt intelligent construction systems, and achieve digital transformation in over 90% of construction enterprises. Designers lacking the ability to collaborate with AI are highly susceptible to frictional unemployment due to lagging skill iteration. Therefore, the training system must incorporate a “human–machine collaboration” mindset and establish a competency chain encompassing “AI tool application-design logic reconstruction” [78]. Industry certifications should also evolve with the times by incorporating intelligent design-related content into registered architect examinations, guiding practicing designers to proactively update their knowledge frameworks and shortening their skill iteration cycles.
Less developed regions, particularly small- and medium-sized cities, find it hard to attract design talent due to inadequate livability, leading to excessive concentration of professionals in first-tier cities and creating crowding effects. The push–pull theory posits that talent mobility is driven by both the pull of advantages in destination regions and the push of disadvantages in origin regions, necessitating a combined push–pull force to attract senior designers [79,80]. Based on the push–pull theory, cities need to build comfort advantages and livability from three dimensions: hardware facilities, software environment, and development opportunities [81], forming a designer aggregation ecosystem that “ensures basic needs for the low-end, provides support for the mid-range, and offers incentives for the high-end”. At the basic comfort level, it is necessary to improve public services such as housing and transportation. Given the significant income fluctuations among designers, “design talent apartments” can be established with a “tiered rent” system—charging 70% of the market rate for the first three years of employment and gradually adjusting as designers achieve stable employment. A creative ecosystem for design should be established by building open design workshops, hosting international design weeks, and other activities to create opportunities for knowledge sharing and cross-border exchanges. Creating emotional comfort often leads to greater stickiness. Cities should explore their cultural characteristics to develop living scenarios that blend locality with international appeal. For high-end design talents, personalized services such as international school placements for their children and prioritized medical access should be provided, as these measures effectively reduce the hidden costs of talent mobility.

5.3. Robustness Check and Limitation Analysis

Threshold selection and outlier handling often exert a significant impact on analytical results. Given the presence of an outlier in Xizang in 2015, we incorporate robustness analysis here. This study’s robustness analysis focuses on two aspects: First, verification of the authenticity of the outlier data, i.e., whether the 2015 outlier in Xizang constitutes a data error, with a focus on analyzing whether its existence is consistent with the objective reality of Xizang’s construction industry and economic and social development. Second, an impact check of the outlier on the analytical results in both temporal and spatial dimensions, i.e., examining whether this extreme value significantly affected the data analysis results of adjacent years of 2015 or other provinces and cities in the same year, covering four aspects: the geographical pattern, change trends, mismatch types, and mismatch contribution degree of architectural designer supply. The robustness analysis method adopted in this study is to exclude the outlier of “the number of architectural designers in Xizang in 2015”, recalculate the data analysis results of the four core statistical indicators, and compare the differences between the two sets of results (“with outlier” and “without outlier”). The judgment criterion is if the clustering structure of the two sets of results remains unchanged and the rank changes are minor (generally no more than 3), it indicates that the outlier has little impact on the conclusions, and the conclusions are robust. Conversely, it is necessary to supplement the explanation of “the particularity of Xizang’s 2015 data” and its impact on partial conclusions.
From the perspective of temporal effects, the outlier appeared in 2015, and its potential impact might involve the analytical results of 2013–2014 and 2016–2017. This is because China’s architectural design cycle is generally within 1 year, and the time from design to construction start usually does not exceed 2 years. From the perspective of temporal changes in Xizang’s architectural designers, the changes were continuous in 2013–2014, with an extreme value appearing in 2015, which is highly consistent with the data of 2016–2017. The data showed long-term continuity both before and after the abrupt change, indicating that the 2015 outlier in Xizang is most likely not a data error, requiring further verification by consulting more data on Xizang’s construction industry, social, and economic development. Through comparative analysis, this study concludes that the massive influx of engineering survey and design personnel into Xizang in 2015 was mainly driven by factors such as increased demand for local construction projects and infrastructure development, the implementation of talent introduction policies, and reform and development in the engineering survey and architectural design industry. First, in 2015, Xizang launched numerous water conservancy projects and resettlement programs, such as the Laluo Water Conservancy Project and its supporting irrigation district project, as well as resettlement projects. As the largest investment water conservancy project in Xizang’s water conservancy development history, these initiatives significantly boosted the demand for engineering survey and architectural design talents in Xizang. Second, Xizang introduced its first high-level talent introduction policy in 2015, which greatly enhanced the attractiveness to engineering survey and architectural design talents. In that year alone, Xizang attracted over 6000 graduates from other provinces in fields related to engineering technology, design, and construction. Third, Xizang initiated reforms in the bidding system for engineering survey and architectural design, strengthening the competitiveness of the engineering survey and architectural design market, thereby promoting the mobility of designers, particularly their inflow into Xizang. In summary, combined with the characteristics of data changes and the analysis of the underlying social and economic environment, the 2015 outlier in Xizang is a normal phenomenon rather than a data error.
Table 1 shows the ranking of China’s designer supply: Xizang ranked last (31st) nationwide from 2013 to 2016, with Qinghai ranking 30th. In 2017, the rankings of Xizang and Qinghai swapped (Xizang 30th and Qinghai 31st), with a rank change of 1 (less than 3), which did not affect the spatial clustering results. Therefore, it can be clearly judged that the 2015 extreme value in Xizang did not affect the geographical pattern characteristics of China’s designer supply, and its impact on the analytical results can be excluded. Table 2 shows the ranking of the change rate of China’s designers: Xizang’s national rankings from 2013 to 2017 were 31st, 13th, 1st, 7th, and 9th, respectively (with rank changes much greater than 3), indicating that the outlier significantly affected the spatial clustering results of China’s designers’ change trends. After excluding Xizang’s 2015 data, the analysis results of China’s designer mismatch types remained unchanged, demonstrating the robustness and validity of the analysis. After excluding Xizang’s 2015 data, the values of China’s designer mismatch contribution degree changed significantly (all decreased), but their rankings were slightly affected, with only Guizhou and Qinghai swapping positions (their national rankings were 27th and 28th, with a rank change of 1 < 3), which had no impact on the spatial clustering structure (Table 8). In summary, the 2015 outlier in Xizang had almost no impact on the geographical pattern and mismatch types of China’s designers. It significantly affected the values of mismatch contribution degree but had little impact on their rankings. Notably, the 2015 outlier exerted a significant impact on the spatial structure of designers’ change trends, affecting the robustness of data analysis results. Fortunately, the analysis results of designers’ change trends are relatively independent of those of mismatch types and mismatch contribution degree, without interfering with each other, thus not affecting the core analysis results of this study.
Therefore, it is ultimately determined that the 2015 outlier in Xizang is not a data error, as it is consistent with Xizang’s construction industry and economic and social development environment at that time. Meanwhile, this outlier had almost no impact on the analysis results of the geographical pattern, mismatch types, and mismatch contribution degree of China’s designer supply, ensuring the robustness of the analysis conclusions. It is worth noting that the outlier significantly affected the analysis results of designers’ change trends, failing to maintain robustness, but it did not impact the analysis results of other core statistical indicators in this paper, thus still ensuring the validity of most key research conclusions. In future studies, great attention should be paid to data outliers and their impact on threshold selection and the robustness of analysis results. The mean is highly affected by outliers and may not be the optimal threshold; considering the median or other criteria based on data characteristics may be more appropriate.
The analysis of the spatial mismatch of architectural designers falls within the research scope of talent geography. Currently, international talent geography is exhibiting a core trend of shifting from broad-spectrum talent research to in-depth exploration of specific talent types [82,83]. The spatial allocation and mobility patterns of talents in specific fields—such as technology-oriented [84], highly educated [85], high-level [86], medical [87], PhD [88,89], high -skilled [90], and overseas [91] talents—have become research hotspots. Against this backdrop, conducting research on the spatial mismatch of architectural designers provides new cases for understanding the formation mechanisms of spatial mismatch among “industry-specific talents” and offers Chinese empirical support for the “industry-talent adaptation” theory in international talent geography, thus holding significant innovative value. On the one hand, architectural design talents possess both technical attributes and creative characteristics, and are deeply tied to the development of regional construction industries. Their spatial mismatch has not yet been systematically analyzed. This study incorporates architectural design talents into the analytical framework of talent geography, expanding the scope of its research on segmented talents [92]. On the other hand, international talent geography research is increasingly emphasizing the spatial adaptability between “talent supply and industrial demand.” By focusing on the mismatch between designer supply and construction industry demand, this study accurately responds to the cutting-edge topic of “talent-industry” spatial interaction, addressing the gap in existing research regarding insufficient attention to the engineering design field [93]. The paper’s most notable innovation resides in developing a technical framework that integrates “designer mismatch characteristics–influencing factors–design talent cultivation strategies”. By systematically applying the spatial mismatch model and Geodetector, this study quantitatively assesses the relationships and magnitudes of designer mismatch in China, empirically examines its influencing factors, and further proposes forward-looking design talent cultivation strategies. These findings offer practical references for designer management and talent development in China and comparable countries globally.
It is noted that this study also has limitations. The rationality of designer allocation requires time for verification. While dynamic mismatch models are more accurate than static ones, constrained by the researcher’s capabilities and limitations in data and methodology, this paper adopts a static mismatch model. Additionally, the influencing factors of designer mismatch are exceptionally complex and significantly influenced by government policy interventions. However, constrained by data availability, this analysis did not incorporate policy factors as influencing variables, warranting further in-depth exploration in future research. Furthermore, empirical research on the microdata of firm-level employment or vacancy designers can further enhance the depth of analysis. However, due to the absence of relevant official data, our study failed to extend the analysis scale to the micro level. For instance, under China’s provincial administrative divisions, there are cities and counties. Empirical analyses that directly use provincial aggregate data will inevitably obscure spatial heterogeneity at the city and county scales. Therefore, from the perspective of enhancing the precision of analytical results, empirical analyses at finer scales (i.e., cities and counties) or empirical studies based on disaggregated provincial data are both desirable. In future research, we look forward to collaborating with interested scholars to obtain firm-level employment or vacancy data of designers through corporate surveys or internet big data scraping, and analyze the mismatch mechanism at a more refined level.
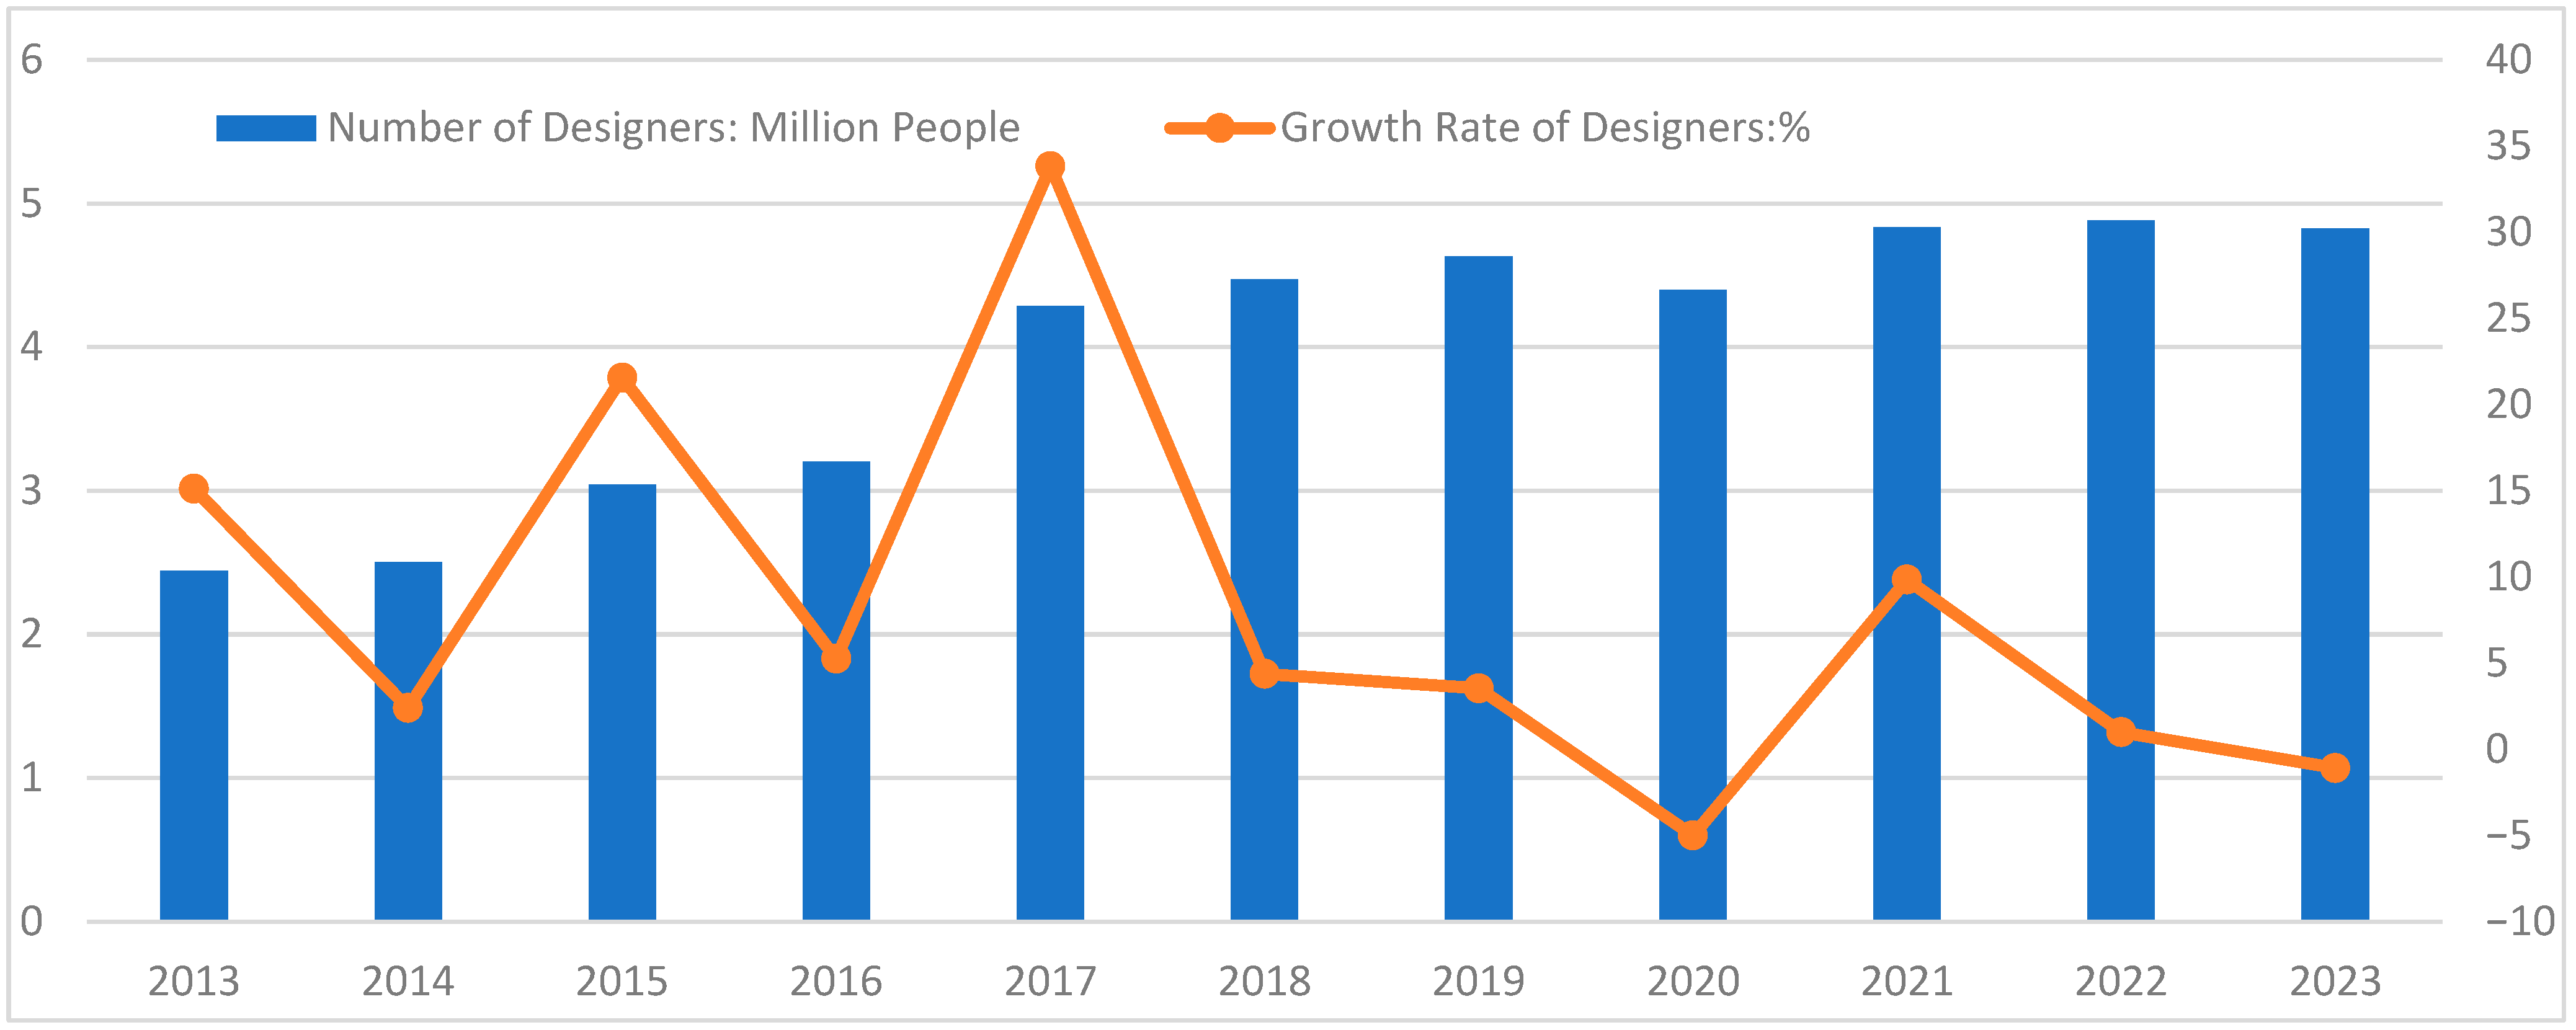
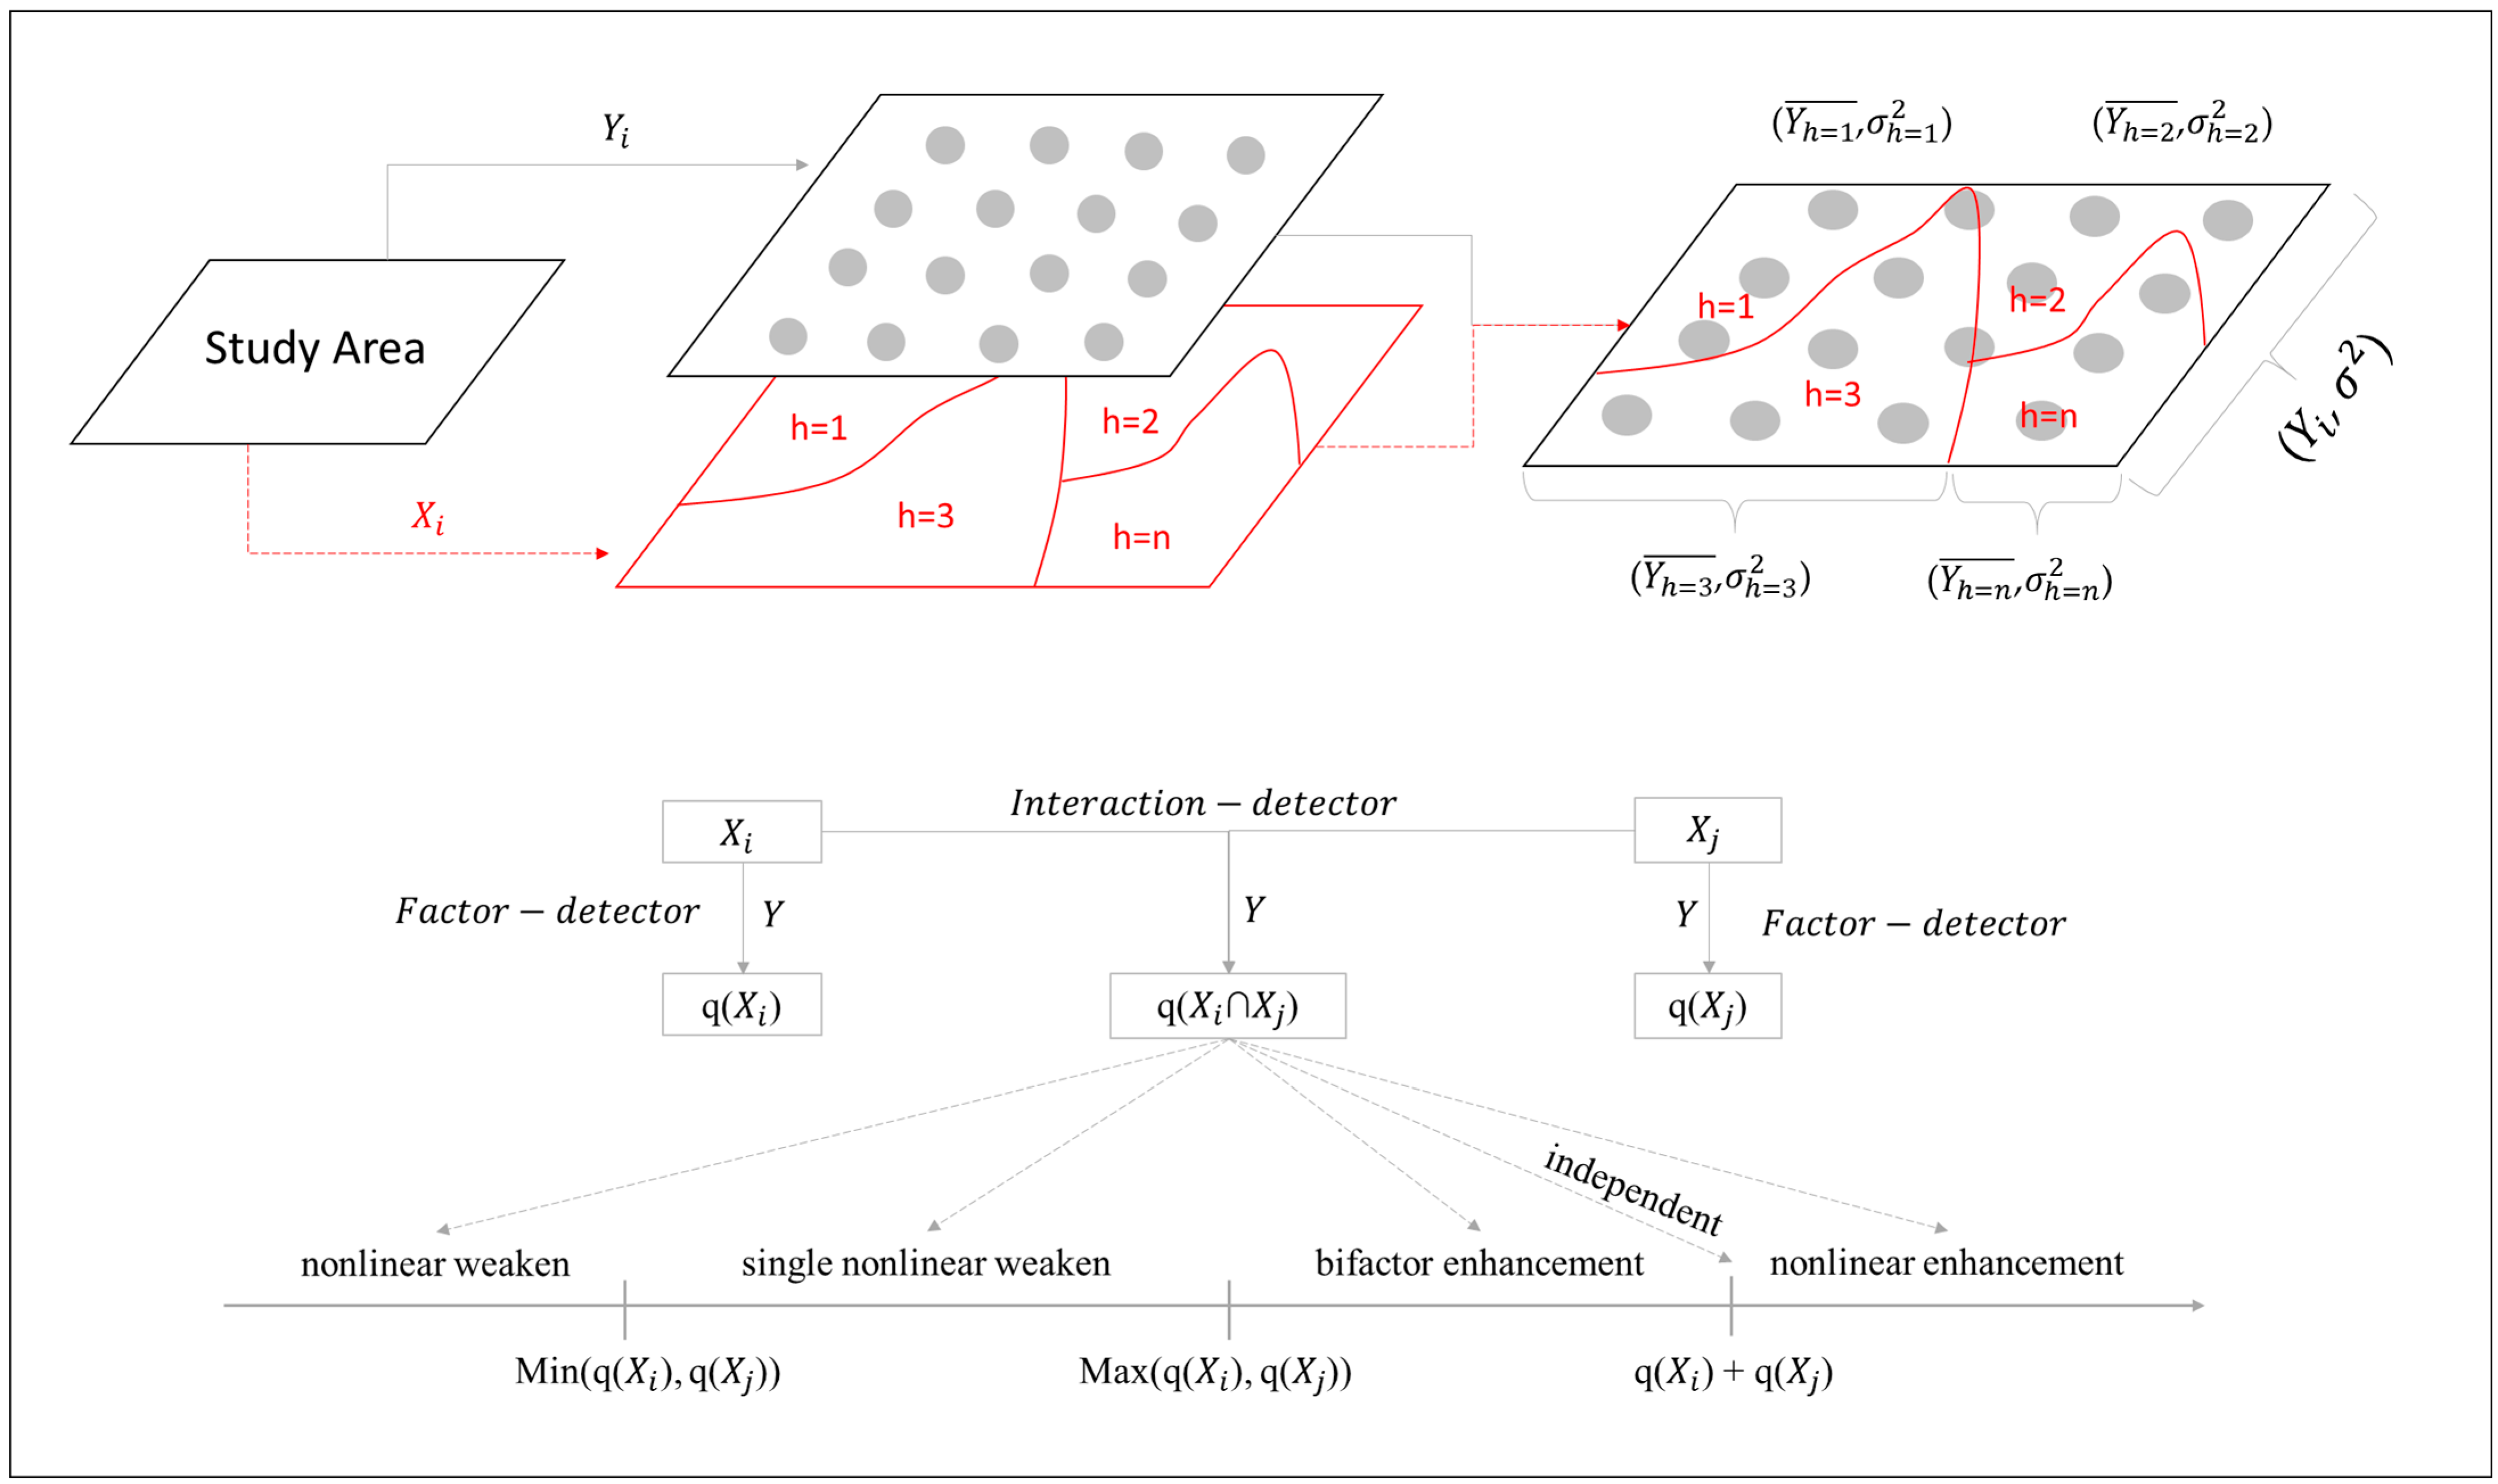
6. Conclusions

Architectural design is an intellectual-intensive industry, and designers are the key to its high-quality development. Against the backdrop of the construction industry’s transformation, particularly its downward development, the scientific and rational allocation of designers directly constrains China’s transition from a “construction giant” to a “construction powerhouse.” Leveraging the spatial mismatch model and Geodetector, this study empirically examines designer mismatch relationships and their influencing factors using panel data spanning 31 Chinese provinces from 2013 to 2023. It also proposes strategies for cultivating architectural design talents to address designer mismatch. Research findings indicate the following: First, there is an uneven spatial allocation of architects in China, with significant disparities in the proportion of designers across different provinces. The supply of Chinese designers is undergoing complex changes, characterized by simultaneous growth and decline. Second, there is a wide variety of mismatches among Chinese designers, with coexistence of oversupply and undersupply. Regions such as Beijing, Shanghai, and Zhejiang exhibit Negative Mismatch, while Henan, Anhui, and Hubei demonstrate Positive Mismatch. Third, the contribution of designer mismatch varies significantly, with long-term high mismatch levels in regions like Beijing, Zhejiang, and Guangdong, making them key areas for correction. Fourth, the factors affecting designer mismatch are classified into four levels, with innovation, industrial structure, and fiscal self-sufficiency factors having a more direct influence. Fifth, most factor pairs exhibit interaction relationships classified as bifactor enhancement, such as the number of artistic performance sessions ( X 18 ), number of beds in medical and health institutions per 1000 people ( X 17 ), proportion of innovative enterprises in total construction enterprises ( X 11 ), and GDP ( X 1 ). Most of the interaction relationships formed between these factors and others fall under nonlinear enhancement, primarily leveraging synergistic enhancement effects among factors to exert indirect influence.
In terms of research application, through extended theoretical analysis, the study discusses the root causes and manifestations of designer mismatch and proposes future strategies for cultivating design talent. The study suggests that cyclical and structural designer mismatches have significant negative effects, while frictional designer mismatch exhibits duality. To facilitate a smooth transition during the transformation and upgrading of the construction industry and design sector, frictional designer mismatch should be tolerated. Future designer cultivation requires the establishment of a differentiated designer supply system. It is recommended that regions in the east with a surplus of designers form partnerships with regions in the central and western parts with a shortage of designers. Design companies should be encouraged to actively implement the “going global” and “bringing in” strategies, and designers should be encouraged to participate in the “Go to West” or “Go Abroad” strategy to contribute to the development of China’s western regions and the Belt and Road Initiative. Meanwhile, it is essential to accelerate the establishment of a school–enterprise joint training system for designers, promote mutual employment and exchange between teachers and designers, and ensure students can acquire the latest architectural design experience and industry trend guidance. Additionally, interdisciplinary integrated design education should be implemented to cultivate talent in intelligent construction and AI architectural design, enhancing the industry adaptability of new designers. Finally, a smart supply–demand matching service platform for Chinese designers should be established, creating urban comfort advantages from multiple dimensions such as hardware facilities, software environments, and development opportunities, fostering an ecosystem for designer aggregation, and optimizing the development environment of the architectural design talent market.

Author Contributions

Conceptualization, S.Z. and W.L.; methodology, S.Z. and W.L.; software, S.Z. and X.L.; validation, X.L., Y.L. and S.Z.; formal analysis, X.L. and W.L.; investigation, S.Z., X.L. and Y.L.; resources, X.L., Y.L. and S.Z.; data curation, X.L., Y.L. and S.Z.; writing—original draft preparation, S.Z. and X.L.; writing—review and editing, Y.L. and W.L.; visualization, X.L. and Y.L.; supervision, X.L.; project administration, S.Z. and W.L.; funding acquisition, S.Z. and W.L. All authors have read and agreed to the published version of the manuscript.

Funding

This research was funded by “Research Project for Philosophy and Social Science Planning of Guangxi Zhuang Autonomous Region in 2024 (24GLF013)”.

Data Availability Statement

https://www.mohurd.gov.cn/gongkai/fdzdgknr/sjfb/index.html (accessed on 20 January 2025) and https://www.stats.gov.cn/sj/ndsj/ (accessed on 7 March 2025).

Conflicts of Interest

Author Yongxin Liu was employed by the company Gansu Kaiyuan Survey, Planning, Design and Consulting Co., Ltd. The remaining authors declare that the research was conducted in the absence of any commercial or financial relationships that could be construed as a potential conflict of interest.

References

  1. Deregibus, C. The Key Role of Keywords in Architectural Design: A Systemic Framework. Architecture 2025, 5, 32. [Google Scholar] [CrossRef]
  2. Micklethwaite, P. Sustainable Design Masters: Increasing the Sustainability Literacy of Designers. Sustainability 2022, 14, 3255. [Google Scholar] [CrossRef]
  3. Othman, A.A.E.; Khalil, M.H.M. Lean talent management: A novel approach for increasing creativity in architectural design firms. Eng. Constr. Archit. Manag. 2018, 25, 1355–1375. [Google Scholar] [CrossRef]
  4. Zhang, W.; Ding, N.; Xue, R.; Han, Y.L.; Liu, C.Y. Building success: The impact of talent recruitment on the growth of the construction industry. Eng. Constr. Archit. Manag. 2024. early access. [Google Scholar] [CrossRef]
  5. Qu, L.; Chen, Y.W.; Rooij, R.; de Jong, P. Cultivating the Next Generation Designers: Group Work in Urban and Regional Design Education. Int. J. Technol. Des. Educ. 2020, 30, 899–918. [Google Scholar] [CrossRef]
  6. Hira, A.; Hynes, M. How Do Designers and Engineers Practice Design While Making? A Narrative Inquiry of Designers Who Make. Inf. Learn. Sci. 2021, 122, 749–773. [Google Scholar] [CrossRef]
  7. Wang, W.; Zhang, S.J.; Su, Y.K.; Deng, X.Y. Key Factors to Green Building Technologies Adoption in Developing Countries: The Perspective of Chinese Designers. Sustainability 2018, 10, 4135. [Google Scholar] [CrossRef]
  8. McGee, B.; Jin, X.; Park, N.K.; Ball, S.; Carr, A. Designers’ Perceptions of Biophilia and Testing of the Biophilic Interior Design Matrix in China. ARCHNET-IJAR Int. J. Archit. Res. 2022, 16, 517–535. [Google Scholar] [CrossRef]
  9. Cui, Q.H.; Hu, X.C.; Liu, X.; Zhao, L.M.; Wang, G.B. Understanding Architectural Designers’ Continuous Use Intention Regarding BIM Technology: A China Case. Buildings 2021, 11, 448. [Google Scholar] [CrossRef]
  10. Cech, E.A.; Finelli, C.J. Learning to Prioritize the Public Good: Does Training in Classes, Workplaces, and Professional Societies Shape Engineers’ Understanding of Their Public Welfare Responsibilities? J. Eng. Educ. 2024, 113, 407–438. [Google Scholar] [CrossRef]
  11. Karakhan, A.A.; Gambatese, J.A. Integrating Worker Health and Safety into Sustainable Design and Construction: Designer and Constructor Perspectives. J. Constr. Eng. Manag. 2017, 143, 04017069. [Google Scholar] [CrossRef]
  12. Morrow, S.; Hare, B.; Cameron, I. Design Engineers’ Perception of Health and Safety and Its Impact in the Design Process. Eng. Constr. Archit. Manag. 2016, 23, 40–59. [Google Scholar] [CrossRef]
  13. Goudini, J.; Rezazadeh, E.; Koulivandi, S. Developing a Model for the Totality of Designers’ Actions in the Architectural Design Process (Aiming for Consensus on Ex-Models). Bagh-E Nazar 2024, 21, 13–22. [Google Scholar] [CrossRef]
  14. Conti, A. Why Are Designers Not Comfortable in Talking About Their Design Process? Exploration of Students’ Perception of Their Design Experience. Bo-Ric. Progett. Il Territ. Citta L Archit. 2020, 11, 84–90. [Google Scholar] [CrossRef]
  15. Dinar, M.; Shah, J.J.; Cagan, J.; Leifer, L.; Linsey, J.; Smith, S.M.; Hernandez, N.V. Empirical Studies of Designer Thinking: Past, Present, and Future. J. Mech. Des. 2015, 137, 021101. [Google Scholar] [CrossRef]
  16. Gonçalves, M.; Cardoso, C.; Badke-Schaub, P. What Inspires Designers? Preferences on Inspirational Approaches During Idea Generation. Des. Stud. 2014, 35, 29–53. [Google Scholar] [CrossRef]
  17. Altay, B.; Salci, E. Exploring Designers’ Finishing Materials Selection for Residential Interior Spaces. Archit. Eng. Des. Manag. 2024, 20, 269–286. [Google Scholar] [CrossRef]
  18. Dürr, J.; Geissler, A.; Hoffmann, C. Development of a Multi-Criteria Decision-Making Model to Assist Building Designers in the Choice of Superficial Construction Systems in Urban Areas. J. Build. Phys. 2023, 46, 513–540. [Google Scholar] [CrossRef]
  19. Mohedas, I.; Daly, S.R.; Loweth, R.P.; Huynh, L.; Cravens, G.L.; Sienko, K.H. The Use of Recommended Interviewing Practices by Novice Engineering Designers to Elicit Information During Requirements Development. Des. Sci. 2022, 8, e16. [Google Scholar] [CrossRef]
  20. Jewitt, C.; Mitchell, V.; Wilson, G.; Golmohammadi, L.; Atkinson, D.; Mackley, K.L.; Price, S. Supporting Novice Designers Design of Digital Touch. Int. J. Technol. Des. Educ. 2023, 33, 191–216. [Google Scholar] [CrossRef]
  21. Rahimian, F.P.; Ibrahim, R. Impacts of VR 3D Sketching on Novice Designers’ Spatial Cognition in Collaborative Conceptual Architectural Design. Des. Stud. 2011, 32, 255–291. [Google Scholar] [CrossRef]
  22. Barbara, A.; Ma, Y.M. From Utopia to Futurescapes: Futures Literacy for Next Generations of Architects and Designers. J. Futures Stud. 2024, 28, 7–15. [Google Scholar] [CrossRef]
  23. Faia, C.B. Cultivating Stewardship in the Next Generation of Designers: Employing an Experiential Case-Based Method Using Living Building Projects. J. Green Build. 2022, 17, 235–253. [Google Scholar] [CrossRef]
  24. Katebi, A.; Keshtkar-Ghalati, A.; Katebi, B.; Ardestani, Z.A.; Bordbar, A. The Moderating Effect of Education Level and Income on Job Performance of Supervising Engineers. Buildings 2025, 15, 397. [Google Scholar] [CrossRef]
  25. Ibrahim, B.A.; Hussein, S.M. Relationship Between Resilience at Work, Work Engagement and Job Satisfaction Among Engineers: A Cross-Sectional Study. BMC Public Health 2024, 24, 1077. [Google Scholar] [CrossRef]
  26. Alam, G.M.; Forhad, M.A.R. What Makes a Difference for Further Advancement of Engineers: Socioeconomic Background or Education Programs? High. Educ. 2022, 83, 1259–1278. [Google Scholar] [CrossRef]
  27. Abdelwahed, N.A.A.; Soomro, B.A. Factors Impacting Occupational Safety among Women Engineers. Safety 2023, 9, 38. [Google Scholar] [CrossRef]
  28. Hodzic, E.; El Sayed, A.; Novalic, A. Motivation of Female Engineers in the Construction Industry in Bosnia and Herzegovina. Eng. Technol. Appl. Sci. Res. 2022, 12, 9372–9378. [Google Scholar] [CrossRef]
  29. Yates, J.; Skinner, S. How Do Female Engineers Conceptualise Career Advancement in Engineering: A Template Analysis. Career Dev. Int. 2021, 26, 697–719. [Google Scholar] [CrossRef]
  30. He, J.L.; Wang, X.P.; Zeng, G. Creative City Networks: A Social Network Analysis of a Virtual Community of Designers in China. Cities 2022, 123, 103578. [Google Scholar] [CrossRef]
  31. Li, Q.; Zhang, L.Y.; Liu, T.T.; Qian, Q.Z. How Engineering Designers’ Social Relationships Influence Green Design Intention: The Roles of Personal Norms and Voluntary Instruments. J. Clean. Prod. 2021, 278, 123470. [Google Scholar] [CrossRef]
  32. Pan, Y.; Zhang, L.M.; Skibniewski, M.J. Clustering of Designers Based on Building Information Modeling Event Logs. Comput.-Aided Civ. Infrastruct. Eng. 2020, 35, 701–718. [Google Scholar] [CrossRef]
  33. Kirsh, D. Do Architects and Designers Think about Interactivity Differently? ACM Trans. Comput.-Hum. Interact. 2019, 26, 7. [Google Scholar] [CrossRef]
  34. Zare, F.; Bazrafkan, K.; Behbahani, H.I.; Mansouri, B. Co-designers’ Interaction: A Network Based Approach. Bagh-E Nazar 2021, 18, 69–82. [Google Scholar] [CrossRef]
  35. Faizi, M.; Behzadfar, M.; Asl, S.R. A Conceptual Framework for Interacting Landscape Architects and Urban Designers: Professionals’ Perspectives. Int. J. Environ. Res. 2011, 5, 271–276. [Google Scholar]
  36. Jiu, Z.; Sethi, M.H. Is Upcycling the Best Approach for Designers to Contribute to Sustainable Textile Industry? Text.-Cloth Cult. 2025, 23, 276–288. [Google Scholar] [CrossRef]
  37. Kain, J.F. Housing Segregation, Negro Employment, and Metropolitan Decentralization. Q. J. Econ. 1968, 82, 175–197. [Google Scholar] [CrossRef]
  38. Wang, J.F.; Li, X.H.; Christakos, G.; Liao, Y.L.; Zhang, T.; Gu, X.; Zheng, X.Y. Geographical detectors-based health risk assessment and its application in the neural tube defects study of the Heshun region, China. Int. J. Geogr. Inf. Sci. 2010, 24, 107–127. [Google Scholar] [CrossRef]
  39. Wang, J.F.; Xu, C.D. Geodetector: Principle and prospective. Acta Geogr. Sin. 2017, 72, 116–134. [Google Scholar]
  40. Zhao, S.; Yan, Y.; Han, J. Industrial Land Change in Chinese Silk Road Cities and Its Influence on Environments. Land 2021, 10, 806. [Google Scholar] [CrossRef]
  41. Gibbs, E.; Mackenzie, E.; McKinlay, A.; McNulty, D.; Phillips, J.; Procter, S. Rolls-Royce Engineers and Deindustrialization in Scotland from the 1950s to the 2020s. Mod. Br. Hist. 2025, 36, hwaf002. [Google Scholar] [CrossRef]
  42. Perlstein, A.; Ortolano, L. Urban Growth in China: Evolution in the Role of Urban Planners. J. Plan. Educ. Res. 2015, 35, 435–443. [Google Scholar] [CrossRef]
  43. Zhang, J.; Hao, F.L.; Wang, S.J. Spatiotemporal Characteristics and Influencing Factors of Talent Inflow in Northeast China from the Perspective of Urban Amenity. J. Urban Plan. Dev. 2024, 150, 05024011. [Google Scholar] [CrossRef]
  44. Kuo, Y.C. Interactive Relationships Among Factors Influencing Skilled Labor Shortages in the Construction Industry. Eng. Constr. Archit. Manag. 2024. early access. [Google Scholar] [CrossRef]
  45. Fjællegaard, C.B.; Beukel, K.; Alkærsig, L. Designers as the Determinants of Design Innovations. Creat. Innov. Manag. 2019, 28, 144–156. [Google Scholar] [CrossRef]
  46. Wipulanusat, W.; Panuwatwanich, K.; Stewart, R.A.; Parnphumeesup, P.; Sunkpho, J. Unraveling Key Drivers for Engineer Creativity and Meaningfulness of Work: Bayesian Network Approach. Manag. Prod. Eng. Rev. 2020, 11, 26–37. [Google Scholar] [CrossRef]
  47. Aydinli, S.; Oral, M.; Oral, E. Wage Determinants and Wage Inequalities—Case of Construction Engineers in Turkey. Tek. Dergi 2019, 30, 8961–8985. [Google Scholar] [CrossRef]
  48. Gao, B.; Zhang, N.W.; Chen, C.Y. Comprehensive Evaluation of Urban Talent Ecological Environment and Diagnosis of Barrier Factors: An Analysis of 16 Cities in Shandong Province. Expert Syst. Appl. 2024, 246, 123157. [Google Scholar] [CrossRef]
  49. Hu, B.B.; Liu, Y.Y.; Zhang, X.X.; Dong, X.L. Understanding regional talent attraction and its influencing factors in China: From the perspective of spatiotemporal pattern evolution. PLoS ONE 2020, 15, e0234856. [Google Scholar] [CrossRef]
  50. Zhang, L.G.; Li, Y.; Kung, C.C.; Wu, B.C.; Zhang, C. Impact of New Talent Settlement Policy on Housing Prices: Evidence from 70 Large and Medium-Sized Chinese Cities. PLoS ONE 2023, 18, e0280317. [Google Scholar] [CrossRef] [PubMed]
  51. Jian, X.J.; Du, D.L.; Liang, D.Z. Scale or Effectiveness? The Nonlinear Impact of Talent Agglomeration on High-Quality Economic Development in China. Heliyon 2024, 10, e30121. [Google Scholar] [CrossRef] [PubMed]
  52. Kracke, N.; Rodrigues, M. A Task-Based Indicator for Labour Market Mismatch. Soc. Indic. Res. 2020, 149, 399–421. [Google Scholar] [CrossRef]
  53. Liu, K.; Salvanes, K.G.; Sorensen, E.O. Good skills in bad times: Cyclical skill mismatch and the long-term effects of graduating in a recession. Eur. Econ. Rev. 2016, 84, 3–17. [Google Scholar] [CrossRef]
  54. Brunello, G.; Wruuck, P. Skill shortages and skill mismatch: A review of the literature. J. Econ. Surv. 2021, 35, 1145–1167. [Google Scholar] [CrossRef]
  55. Perera, S.; Jin, X.H.; Gunasekara, K.; Samaratunga, M. Impact of Digitalisation in Construction on Australian Designers and Builders: A Cross-Analysis Based on the Size of Organisations. Buildings 2024, 14, 3607. [Google Scholar] [CrossRef]
  56. Pracucci, A. Designing Digital Twin with IoT and AI in Warehouse to Support Optimization and Safety in Engineer-to-Order Manufacturing Process for Prefabricated Building Products. Appl. Sci. 2024, 14, 6835. [Google Scholar] [CrossRef]
  57. McGuinness, S.; Pouliakas, K.; Redmond, P. Skills Mismatch: Concepts, Measurement and Policy Approaches. J. Econ. Surv. 2018, 32, 985–1015. [Google Scholar] [CrossRef]
  58. Wang, G.; Shao, Q.G.; Jiang, C.C.; Liou, J.J.H. Exploring the Driving Factors Influencing Designers to Implement Green Design Practices Based on the DANP Model. Sustainability 2022, 14, 6537. [Google Scholar] [CrossRef]
  59. Husain, S.H.; Che-Ani, A.I.; Affandi, H.M.; Nasri, N.M.; Musid, N.A. Mismatch in Supply and Demand of Building Surveying Graduates’ Skills: A Triangulation Perspective. J. Tech. Educ. Train. 2020, 12, 70–80. [Google Scholar] [CrossRef]
  60. Zhou, J.; Zhang, Z.P.; Shao, Y. Credit Resource Misallocation and Macroeconomic Fluctuations in China: From the Perspective of Heterogeneous Financial Frictions. B E J. Macroecon. 2024, 24, 97–134. [Google Scholar] [CrossRef]
  61. Barros, F.; Delalibera, B.R.; Nakabashi, L.; Ribeiro, M.J. Misallocation of talent, teachers’ human capital, and development in Brazil. J. Macroecon. 2023, 77, 103542. [Google Scholar] [CrossRef]
  62. Zaharieva, A. On the optimal diversification of social networks in frictional labour markets with occupational mismatch. Labour Econ. 2018, 50, 112–127. [Google Scholar] [CrossRef]
  63. Sandhu, K.; Sarkar, P.; Subburaj, K. Understanding Entrepreneurial Thinking for Designers: Perspectives from Entrepreneurs, Academicians, Product Designers, and Students. Think. Ski. Creat. 2025, 56, 101728. [Google Scholar] [CrossRef]
  64. Jin, G.Y. Designer Selection for Complex Engineering System Design Projects Considering the Disciplines Demanded. Sustainability 2022, 14, 16145. [Google Scholar] [CrossRef]
  65. Pelzer, T. Engineers on the Move: Elite Geographic Mobility in Republican China. Twent.-Century China 2025, 50, 25–55. [Google Scholar] [CrossRef]
  66. Gradisar, L.; Klinc, R.; Turk, Ä.; Dolenc, M. Generative Design Methodology and Framework Exploiting Designer-Algorithm Synergies. Buildings 2022, 12, 2194. [Google Scholar] [CrossRef]
  67. Formosa, D. Design Education Is Too Important to Be Left to Designers. Des. Stud. 2025, 98, 101301. [Google Scholar] [CrossRef]
  68. Delaney, E.; Liu, W. An Investigation into the Current Status and Importance of Sustainability Education for Designers and Engineers. Int. J. Eng. Educ. 2023, 39, 502–518. [Google Scholar]
  69. Temeltas, H.; Kaya, C. Transfer of Craft Knowledge to New Product Development through Collaboration between Craftsmen and Designers. Des. J. 2021, 24, 865–886. [Google Scholar] [CrossRef]
  70. Pizarro, C.C.; Marchevsky, M.R.; Scandela, L.A.; David, B.; de la Cerda, M.L. Potential Implications from the Methodological Application of Design Thinking in Urban Design Processes. Analysis from the Designer’s Experience. Rev. Urban. 2022, 46, 75–94. [Google Scholar] [CrossRef]
  71. Örnekoglu-Selçuk, M.; Emmanouil, M.; Hasirci, D.; Grizioti, M.; Van Langenhove, L. A Systematic Literature Review on Co-Design Education and Preparing Future Designers for Their Role in Co-Design. Codesign-Int. J. Cocreation Des. Arts 2024, 20, 351–366. [Google Scholar] [CrossRef]
  72. Bales, A.D.; Jensen, C.X.J.; Sekor, M.R.; Adinolfi, B. From Science Class to Studio: Supporting Transformative Sustainability Learning Among Future Designers. Int. J. Sustain. High. Educ. 2024. early access. [Google Scholar] [CrossRef]
  73. Silver, M.; Ruokamo, H. Competences for the Modern Designer—Systematic Literature Review. Arts Humanit. High. Educ. 2025. early access. [Google Scholar] [CrossRef]
  74. Kessler, C.; Rieger, J. Designing for Sustainability: Emerging Professional Roles and Capabilities for Designers in the 21st Century. Int. J. Art Des. Educ. 2025. early access. [Google Scholar] [CrossRef]
  75. Scherz, M.; Zunk, B.M.; Steinmann, C.; Kreiner, H. How to Assess Sustainable Planning Processes of Buildings? A Maturity Assessment Model Approach for Designers. Sustainability 2022, 14, 2879. [Google Scholar] [CrossRef]
  76. Jang, S.; Roh, H.; Lee, G. Generative AI in Architectural Design: Application, Data, and Evaluation Methods. Autom. Constr. 2025, 174, 106174. [Google Scholar] [CrossRef]
  77. Cocho-Bermejo, A. Artificial Intelligence and Architectural Design Before Generative AI: Artificial Intelligence Algorithmics Approaches 2000–2022 in Review. Eng. Rep. 2025, 7, e70114. [Google Scholar] [CrossRef]
  78. Zhuang, X.W.; Zhu, P.R.; Yang, A.; Caldas, L. Machine Learning for Generative Architectural Design: Advancements, Opportunities, and Challenges. Autom. Constr. 2025, 174, 106129. [Google Scholar] [CrossRef]
  79. Gu, H.Y.; Wang, J.H.; Ling, Y.K. Economic Geography of Talent Migration and Agglomeration in China: A Dual-Driver Framework. China Econ. Rev. 2024, 86, 102180. [Google Scholar] [CrossRef]
  80. Wang, H.N.; Guo, F. City-Level Socioeconomic Divergence, Air Pollution Differentials and Internal Migration in China: Migrants vs Talent Migrants. CITIES 2023, 133, 104116. [Google Scholar] [CrossRef]
  81. Rowe, M.S.; Gjata, J.; Roudbari, S. Dissenting Designers: Reading Activism and Advocacy in Architecture through a Sociological Lens. Archit. Theory Rev. 2020, 24, 69–85. [Google Scholar] [CrossRef]
  82. Hancock, D.J.; Vierimaa, M.; Newman, A. The Geography of Talent Development. Front. Sports Act. Living 2022, 4, 1031227. [Google Scholar] [CrossRef] [PubMed]
  83. Mátyás, S.; Birtók, V.; Vasvári, M.; Kovács, T. Talent Geography Research in an Inner Peripheral Hungarian Region—Case Study of Nagykunság. Ter Es Tarsad. 2024, 38, 118–139. [Google Scholar] [CrossRef]
  84. Luo, J.W.; Zhu, K.K. The Influential Factors on the Attraction of Outstanding Scientific and Technological Talents in Developed Cities in China. Sustainability 2023, 15, 6214. [Google Scholar] [CrossRef]
  85. Shi, W.T.; Yang, W.L.; Mu, X.Y.; Yang, F. Analysis of Spatial Characteristics and Influencing Factors of the Flow Network of Highly Educated Talents from National and Local Perspective. Sci. Rep. 2024, 14, 9657. [Google Scholar] [CrossRef]
  86. Zhou, Y.; Guo, Y.Z.; Liu, Y.S. High-level talent flow and its influence on regional unbalanced development in China. Appl. Geogr. 2018, 91, 89–98. [Google Scholar] [CrossRef]
  87. Zhang, L.; Tang, J.; Zhou, Q.Q.; Song, Y.; Zhang, D.Y. Spatial-Temporal Distribution and Evolution of Medical and Health Talents in China. BMC Public Health 2025, 25, 124. [Google Scholar] [CrossRef]
  88. Khelifi, S. PhD Crisis in the Global South: Oversupply or Mismanagement of Talent? High. Educ. Q. 2023, 77, 410–426. [Google Scholar] [CrossRef]
  89. Grogger, J.; Hanson, G.H. Attracting Talent: Location Choices of Foreign-Born PhDs in the United States. J. Labor Econ. 2015, 33, S5–S38. [Google Scholar] [CrossRef]
  90. Huang, C.F.; Han, Q.; Tan, X.M.; Hua, Y.; Shang, L. High-Speed Rail Operations, the Cross-Regional Mobility of Highly Skilled Talent, and Regional Innovation-Evidence from the Yangtze River Delta in China. Appl. Econ. 2024, 57, 2581–2598. [Google Scholar] [CrossRef]
  91. Liu, Y.; Huang, C.Y.; Zhang, F.F.; Ma, H.T. Locational Preferences of High-Level Overseas Talent Returning to China: Evidence from Microdata Analysis. Popul. Space Place 2023, 29, e2650. [Google Scholar] [CrossRef]
  92. Sanchez-Serra, D. Talent and creative economy in French local labour systems. Environ. Plan. C-Gov. Policy 2014, 32, 405–425. [Google Scholar] [CrossRef]
  93. Hsieh, C.T.; Hurst, E.; Jones, C.I.; Klenow, P.J. The Allocation of Talent and US Economic Growth. Econometrica 2019, 87, 1439–1474. [Google Scholar] [CrossRef]
Figure 1. Analysis of designer changes in China.
Buildings 15 03686 g001
Figure 2. Analysis principle of Geodetector.
Buildings 15 03686 g002
Figure 3. Geographical distribution pattern of designer quantity in 2013 and 2023.
Buildings 15 03686 g003
Figure 4. Geographical distribution pattern of designer change speed in 2013 and 2023.
Buildings 15 03686 g004
Figure 5. Geographical distribution pattern of designer mismatch type in 2013 and 2023.
Buildings 15 03686 g005
Figure 6. Geographical distribution pattern of designer mismatch contribution in 2013 and 2023.
Buildings 15 03686 g006
Table 1. Analysis on the spatial distribution characteristics of designers in China.
Province20132014201520162017201820192020202120222023
Beijing2.082.042.052.062.062.112.142.112.021.931.88
Tianjin1.521.551.581.581.351.140.980.990.950.870.90
Hebei3.993.843.803.793.813.363.012.862.882.892.94
Shanxi1.941.861.811.801.841.521.271.301.331.311.27
Neimenggu2.902.752.702.662.332.061.851.811.831.842.13
Liaoning4.484.234.023.793.612.762.102.112.061.911.93
Jilin2.102.011.981.931.741.411.141.161.201.111.07
Heilongjiang2.111.911.811.761.541.010.590.570.550.550.51
Shanghai2.021.881.831.771.761.341.010.991.000.891.03
Jiangsu8.878.798.668.408.418.859.198.948.978.839.11
Zhejiang5.305.565.465.265.145.265.355.225.285.255.42
Anhui3.763.693.633.553.514.645.535.525.695.775.72
Fujian4.744.764.844.874.905.716.346.376.426.616.45
Jiangxi3.153.163.193.243.323.032.802.933.023.112.97
Shandong8.157.977.827.667.737.717.707.697.617.698.16
Henan4.704.684.594.614.876.327.467.107.027.136.24
Hubei4.184.344.364.414.454.394.353.874.154.484.59
Hunan3.863.934.014.064.124.454.714.914.965.005.02
Guangdong5.105.285.215.145.105.616.026.376.466.286.91
Guangxi2.842.852.902.942.962.742.572.612.662.612.38
Hainan0.820.820.830.850.850.780.730.720.700.650.69
Chongqing2.933.053.233.453.613.844.024.114.124.093.95
Sichuan5.105.024.964.985.135.535.835.865.825.855.68
Guizhou1.421.621.781.922.112.132.152.212.061.951.92
Yunnan2.963.133.363.643.843.803.773.883.803.933.59
Xizang0.590.610.650.690.740.730.710.890.710.720.74
Shaanxi3.583.713.803.914.013.733.513.563.343.463.47
Gansu1.521.541.561.561.471.080.780.780.780.790.83
Qinghai0.600.630.670.700.700.580.480.490.470.430.40
Ningxia0.820.830.850.870.880.640.450.450.430.430.42
Xinjiang1.891.962.052.112.101.741.471.641.711.621.67
Table 2. Analysis on the changing trend characteristics of designers in China.
Province20132014201520162017201820192020202120222023
Beijing27.75−41.874.161.511.5523.6010.994.872.331.44−9.97
Tianjin64.079.12−21.322.4640.34−4.97−6.304.9614.7811.041.36
Hebei0.181.08218.2514.502.50−1.20−62.306.9223.1654.7119.86
Shanxi4.62134.28−13.46−15.50−25.243.96−1.817.4314.7237.3612.06
Neimenggu2.39−0.15−7.5023.95−4.18−11.632.77−3.191.04−17.3710.29
Liaoning−3.81−3.95−0.92−7.5413.98−2.481.675.55−6.56−2.07−5.14
Jilin−6.130.721.13−7.9611.590.76−0.584.515.068.066.89
Heilongjiang−16.81−67.42244.735.20−5.26−3.0212.36−10.4611.48−17.431.01
Shanghai−14.67−7.69−12.66169.58−4.845.69−6.3214.06−12.07−1.5410.04
Jiangsu17.9917.3220.25−12.2798.7251.64−20.782.9228.076.832.27
Zhejiang63.3142.8383.87−25.1321.49−25.3646.34−34.406.9716.65−13.65
Anhui−8.247.595.1475.8123.7811.2750.655.378.71−18.0721.17
Fujian7.65−23.7051.0434.03173.838.81−5.512.4556.64−16.25−4.17
Jiangxi10.564.81119.8318.29105.35−7.44−0.402.38−18.35−38.375.02
Shandong10.293.526.29−4.5869.086.0425.254.246.783.11−0.87
Henan7.912.4732.32−6.7526.5028.190.6013.367.01−1.703.43
Hubei−3.992.27−8.604.1858.6821.0427.72−4.5610.067.991.24
Hunan−3.403.2540.8927.1661.2639.10−30.264.108.75−1.17−12.29
Guangdong33.8714.11−2.745.0421.66−8.3410.72−21.11−2.423.39−11.66
Guangxi9.453.925.1310.3594.245.0413.89−14.8558.97−13.79−15.70
Hainan−9.9025.5112.729.1219.35−10.033.12−3.49−2.61−1.160.26
Chongqing3.1320.336.786.020.022.391.888.758.07−0.372.80
Sichuan−10.278.58−7.9954.35110.29−16.014.877.90−5.88−0.217.30
Guizhou6.361.2018.307.5225.480.09−58.06−5.3563.27−21.67−4.91
Yunnan−6.2410.280.76−4.0925.7526.1113.75−2.838.07−3.62−2.12
Xizang−69.064.655344.4420.4941.02−60.25156.9236.31−14.01−4.25−55.18
Shaanxi−2.933.09−7.0710.5134.492.9829.81−8.467.152.17−3.64
Gansu9.21−8.747.057.118.1641.95−4.776.463.315.0556.23
Qinghai5.812.551.943.519.07−4.15−2.023.379.709.72−1.43
Ningxia0.8411.034.18−19.377.29−4.796.365.2615.59−1.0518.64
Xinjiang17.460.85−5.4411.1432.20−11.916.73−12.5417.068.922.63
Table 3. Analysis on the mismatch type characteristics of designers in China.
Province20132014201520162017201820192020202120222023
Beijing−2−2−2−2−2−2−2−2−2−2−2
Tianjin−1−1−1−1−1−1−1−1−1−1−1
Hebei22−1−1−1−1211−1−1
Shanxi1−1−1−1111−1−1−1−1
Neimenggu22222222222
Liaoning22222211111
Jilin11111111111
Heilongjiang22111111111
Shanghai−2−2−1−2−2−2−2−2−2−2−2
Jiangsu2222−1−2−1−1−2−2−2
Zhejiang−2−2−2−2−2−2−2−2−2−2−2
Anhui22211211121
Fujian2222−1−111−1−1−1
Jiangxi2211−1−1−1−1121
Shandong22222222222
Henan22222222222
Hubei112221−1−1−1−1−1
Hunan22222122222
Guangdong−2−2−2−2−2−2−2−2−1−1−1
Guangxi22222212111
Hainan11111111111
Chongqing22222222222
Sichuan22221222222
Guizhou−1−1−1−1−1122111
Yunnan22222222222
Xizang11111111111
Shaanxi11222211111
Gansu1111111111−1
Qinghai11111111111
Ningxia11111111111
Xinjiang11222111111
Note: 2 indicates Positive Mismatch, 1 indicates Positive Matching, −1 indicates Negative Matching, −2 indicates Negative Mismatch.
Table 4. Statistical analysis on the mismatch type of designers in China.
Mismatch Type20132014201520162017201820192020202120222023
Positive Mismatch48.3948.3948.3945.1635.4832.2629.0329.0322.5829.0322.58
Positive Matching32.2629.0325.8129.0332.2638.7145.1641.9448.3938.7141.94
Negative Matching6.459.6816.1312.9019.3512.9012.9016.1316.1319.3522.58
Negative Mismatch12.9012.909.6812.9012.9016.1312.9012.9012.9012.9012.90
Table 5. Analysis on the mismatch contribution characteristics of designers in China.
Province20132014201520162017201820192020202120222023
Beijing21.8011.509.279.187.6610.2110.9913.9913.1512.4012.05
Tianjin1.611.860.410.350.981.101.071.511.772.122.34
Hebei2.592.481.992.731.011.452.652.261.930.091.25
Shanxi0.352.681.230.541.050.540.190.010.071.021.69
Neimenggu2.912.782.892.833.203.022.602.802.952.883.64
Liaoning2.362.302.602.743.512.371.201.041.431.131.38
Jilin1.351.281.461.611.861.400.960.971.130.800.68
Heilongjiang1.632.211.361.341.660.870.040.060.020.200.12
Shanghai4.223.822.059.527.428.748.1411.338.818.099.72
Jiangsu3.422.142.033.410.737.191.133.356.907.979.03
Zhejiang7.1212.6522.7414.9315.909.2016.519.669.1911.389.13
Anhui2.111.922.210.350.782.501.400.531.002.881.13
Fujian3.013.973.412.721.840.951.160.474.661.201.17
Jiangxi2.432.450.980.671.551.311.441.900.252.492.21
Shandong5.395.215.626.096.086.284.594.124.343.955.23
Henan3.273.322.883.414.806.868.898.258.388.096.77
Hubei0.750.992.192.402.141.250.371.390.880.790.87
Hunan2.893.042.722.332.111.113.774.104.334.195.22
Guangdong13.9816.5011.6412.1812.799.8510.346.854.594.952.20
Guangxi2.392.442.662.752.662.411.822.411.321.671.86
Hainan0.690.620.670.710.920.930.820.880.920.780.92
Chongqing2.001.882.352.754.264.965.235.695.845.395.48
Sichuan3.202.943.742.520.252.733.142.453.753.612.92
Guizhou1.270.990.670.570.120.072.302.691.621.801.98
Yunnan2.142.292.893.544.774.604.264.894.854.854.63
Xizang0.780.830.770.831.101.241.101.501.211.161.40
Shaanxi0.861.032.072.152.772.481.001.421.141.231.48
Gansu0.981.141.261.301.630.710.260.150.230.170.54
Qinghai0.450.510.610.680.890.750.590.640.620.470.45
Ningxia0.790.810.871.001.270.940.580.620.590.540.53
Xinjiang1.261.401.771.882.281.991.442.042.141.721.93
Table 6. Analysis on the impact intensity of designer mismatch in China.
IndicatorCodeqp
GDP X 1 0.250.04
Industrial structure index X 2 0.510.00
Urbanization rate X 3 0.490.02
Per capita GDP X 4 0.470.03
Fiscal self-sufficiency rate X 5 0.510.01
Number of design enterprises X 6 0.300.02
Average scale index of design enterprises X 7 0.380.02
Proportion of real estate added value in GDP X 8 0.200.03
Proportion of construction industry employment in total employment X 9 0.350.05
Construction floor area X 10 0.250.01
Proportion of innovative enterprises in total construction enterprises X 11 0.300.06
Full-time equivalent of R&D personnel X 12 0.600.00
R&D expenditure intensity X 13 0.450.03
Number of valid patents X 14 0.580.00
Disposable income of residents X 15 0.470.02
Average housing price X 16 0.380.04
Number of beds in medical and health institutions per 1000 people X 17 0.420.03
Number of artistic performance sessions X 18 0.300.06
Table 7. Analysis on the interaction effect of designer mismatch in China.
X 1 X 2 X 3 X 4 X 5 X 6 X 7 X 8 X 9 X 10 X 11 X 12 X 13 X 14 X 15 X 16 X 17
X 2 0.65
X 3 0.740.61
X 4 0.750.700.74
X 5 0.720.640.630.82
X 6 0.420.630.680.700.66
X 7 0.600.690.710.710.760.52
X 8 0.340.560.570.670.550.450.53
X 9 0.420.650.610.740.640.570.500.49
X 10 0.310.610.640.600.650.370.430.330.53
X 11 0.530.760.780.660.800.550.600.600.740.51
X 12 0.750.720.780.880.710.660.680.660.740.620.84
X 13 0.750.620.590.750.590.710.700.550.610.630.830.70
X 14 0.740.660.750.930.740.670.780.640.790.610.830.730.78
X 15 0.770.600.620.700.610.710.710.560.610.690.820.780.520.81
X 16 0.800.670.630.760.670.720.700.480.640.730.810.780.590.790.60
X 17 0.670.870.960.870.940.820.860.700.680.800.720.880.840.920.850.93
X 18 0.550.830.900.900.920.770.760.430.760.540.770.900.910.820.970.710.90
Note: The underlined data indicate a nonlinear enhancement relationship.
Table 8. Robustness analysis of Xizang outliers to designer mismatch in 2015.
ProvinceDesigner Mismatch TypeDesigner Mismatch Contribution
Contains OutliersExcluding OutliersResult ChangesContains OutliersExcluding OutliersResult Changes
Beijing−2−209.273.46−5.81
Tianjin−1−100.410.15−0.26
Hebei−1−101.990.74−1.25
Shanxi−1−101.230.46−0.77
Neimenggu2202.891.08−1.81
Liaoning2202.60.97−1.63
Jilin1101.460.54−0.92
Heilongjiang1101.360.51−0.85
Shanghai−1−102.050.77−1.28
Jiangsu2202.030.76−1.27
Zhejiang−2−2022.748.50−14.24
Anhui2202.210.83−1.38
Fujian2203.411.27−2.14
Jiangxi1100.980.37−0.61
Shandong2205.622.10−3.52
Henan2202.881.08−1.80
Hubei2202.190.82−1.37
Hunan2202.721.02−1.70
Guangdong−2−2011.644.35−7.29
Guangxi2202.660.99−1.67
Hainan1100.670.25−0.42
Chongqing2202.350.88−1.47
Sichuan2203.741.40−2.34
Guizhou−1−100.670.25−0.42
Yunnan2202.891.08−1.81
Xizang1 0.77
Shaanxi2202.070.77−1.30
Gansu1101.260.47−0.79
Qinghai1100.610.23−0.38
Ningxia1100.870.32−0.55
Xinjiang2201.770.66−1.11
Disclaimer/Publisher’s Note: The statements, opinions and data contained in all publications are solely those of the individual author(s) and contributor(s) and not of MDPI and/or the editor(s). MDPI and/or the editor(s) disclaim responsibility for any injury to people or property resulting from any ideas, methods, instructions or products referred to in the content.