1. Introduction
Ultra-high-performance concrete (UHPC) boasts excellent mechanical properties, high durability, and low porosity [
1,
2,
3], making it a promising material for a wide range of engineering applications, particularly in large-scale projects [
4,
5]. However, UHPC faces challenges such as a high reliance on premium resources like quartz sand (QS), significant energy consumption, and substantial environmental pollution. Its widespread adoption is constrained by elevated material cost, and resource and environmental burden [
6,
7,
8]. High-quality QS accounts for approximately 40–65% of UHPC [
9], with a particle size generally less than 1.18 mm. Crushing rock and coarse sand not only consume significant energy and contribute to high carbon emissions, but the quartz dust generated during their production also poses direct and long-term environmental hazards [
10,
11]. In addition, QS comes from non-renewable mineral resources [
12], and over-exploitation of QS will lead to resource depletion and irreversible damage to the ecological environment. In summary, seeking low-carbon sustainable alternative raw materials to reduce UHPC’s dependence on QS has become one of the important directions for sustainable development in the UHPC field.
Currently, many scholars are conducting research on alternative materials for QS. Soliman et al. [
11] used glass sand to replace 50% and 100% of QS and successfully prepared UHPC with 28-day compressive strengths of 145 MPa and 132 MPa, respectively. Jiao et al. [
13] used waste glass sand to replace QS and found that when the replacement rate of waste glass sand was 75%, the compressive strength of UHPC reached its maximum value. The research results also showed that the addition of waste glass sand had no significant effect on the flexural strength and splitting tensile strength of UHPC. Wang et al. [
3] used industrial waste (such as lead-zinc tailings and granite waste powder) recycled sand to replace natural QS. They found that when the replacement rate of recycled sand was 50%, the wet packing density increased by 0.6%, the UHPC compressive strength remained stable at 150 MPa, and the carbon emissions decreased by 15%. When the replacement rate of lead-zinc tailings recycled sand is 30%, through surface activation treatment (such as CO
2-accelerated carbonization), the heavy metal leaching concentration is lower than the limit (Pb < 0.1 mg/L), and the compressive strength of UHPC is increased to 165 MPa. Although materials such as recycled sand from waste glass and industrial waste, etc., have been widely explored as substitutes for QS, these materials still have limitations in terms of environmental benefits and performance adaptability.
With rapid economic development, the production of municipal solid waste (MSW) increases year by year. Since 2015, China has surpassed the United States as the world’s largest producer of MSW [
14,
15]. Globally, approximately 2.01 billion tons of MSW are generated annually, with about 33% being directly released into the environment without treatment [
16]. It is projected that by 2050, the global annual MSW production will reach 3.4 billion tons [
17]. MSW disposal has become a core issue for sustainable development in most cities. Currently, incineration can effectively reduce the mass and volume of MSW by approximately 70% and 90%, respectively, and convert it into electricity at the same time [
18,
19,
20]. It has become the dominant method for treating MSW in many countries around the world [
21]. Municipal solid waste incineration bottom ash (MSWIBA) is the main product after MSW incineration, accounting for 80–90% of the total mass of the incineration products [
22,
23,
24]. MSWIBA contains heavy metals such as Zn, Pb, and Cr (the total amount can reach 0.5–2%). The current conventional disposal method is usually landfill after solidification with cement [
25], which has problems such as land occupation, high cost, complex process, and high environmental risk. Consequently, the harmless disposal and resource utilization of MSWIBA have become an important research topic.
MSWIBA has an appearance similar to round particles, with an uneven surface, many pores, and a high water absorption rate. It has the characteristics of natural aggregates and physical properties similar to those of natural sand [
26]. Its chemical composition is mainly SiO
2 (40–50%), CaO (15–25%), Al
2O
3 (10–15%), and Fe
2O
3 (5–15%). It has volcanic ash activity and has the potential to be used in concrete [
27]. Current research mainly focuses on the reuse of MSWIBA as a substitute for aggregates in road bases or low-grade concrete [
28,
29,
30,
31], and there is little research on the application of MSWIBA in UHPC. However, the high cement content of UHPC is conducive to the solidification of heavy metals in MSWIBA by its hydration products [
32]. The ultra-low porosity (<2%) and high durability of UHPC can form a dense barrier, which has natural advantages and long-term stability in inhibiting the migration of heavy metals in MSWIBA. In addition, UHPC often uses an ultra-low water–binder ratio [
33], and the water absorption and storage properties of MSWIBA are conducive to improving the hydration rate of the UHPC matrix, increasing the density, and thus improving the performance of UHPC. In summary, it can be seen that the preparation of MSWIBA-UHPC with MSWIBA has good research significance.
In view of this, this study partially replaced QS with MSWIBA to prepare UHPC, and studied the effect of MSWIBA substitution rate on the fluidity, setting time, wet packing density, mechanical strength, resistance to chloride erosion, resistance to sulfate erosion, shrinkage, heavy metal solidification and other properties of UHPC. Microscopic testing and mechanism analysis were carried out through XRD, TG, SEM, etc. On this basis, the ecological benefit and economic evaluation of MSWIBA-UHPC were carried out. This research not only reduces the production cost of UHPC, but also helps alleviate the environmental problems caused by the production of QS [
10,
11,
12]. At the same time, it alleviates the disposal pressure of MSWIBA and provides a new way for its recycling. And it will provide favorable support for promoting the low-carbon sustainable development of UHPC, achieving efficient recycling of MSWIBA, and assisting in the “dual carbon” goals.
2. Materials and Methods
2.1. Materials
QS is produced by Henan Minghai Environmental Protection Technology Co., Ltd., Kaifeng City, Henan Province, China. The bulk density, specific gravity and mohs hardness of QS are 1.65 g/cm3, 2.66 g/cm3 and 7.5, respectively. The particle size of QS is 0.15–1.18 mm, of which the mass ratios of 0.15–0.30 mm, 0.30–0.60 mm and 0.60–1.18 mm are 2:4.2:3.8.
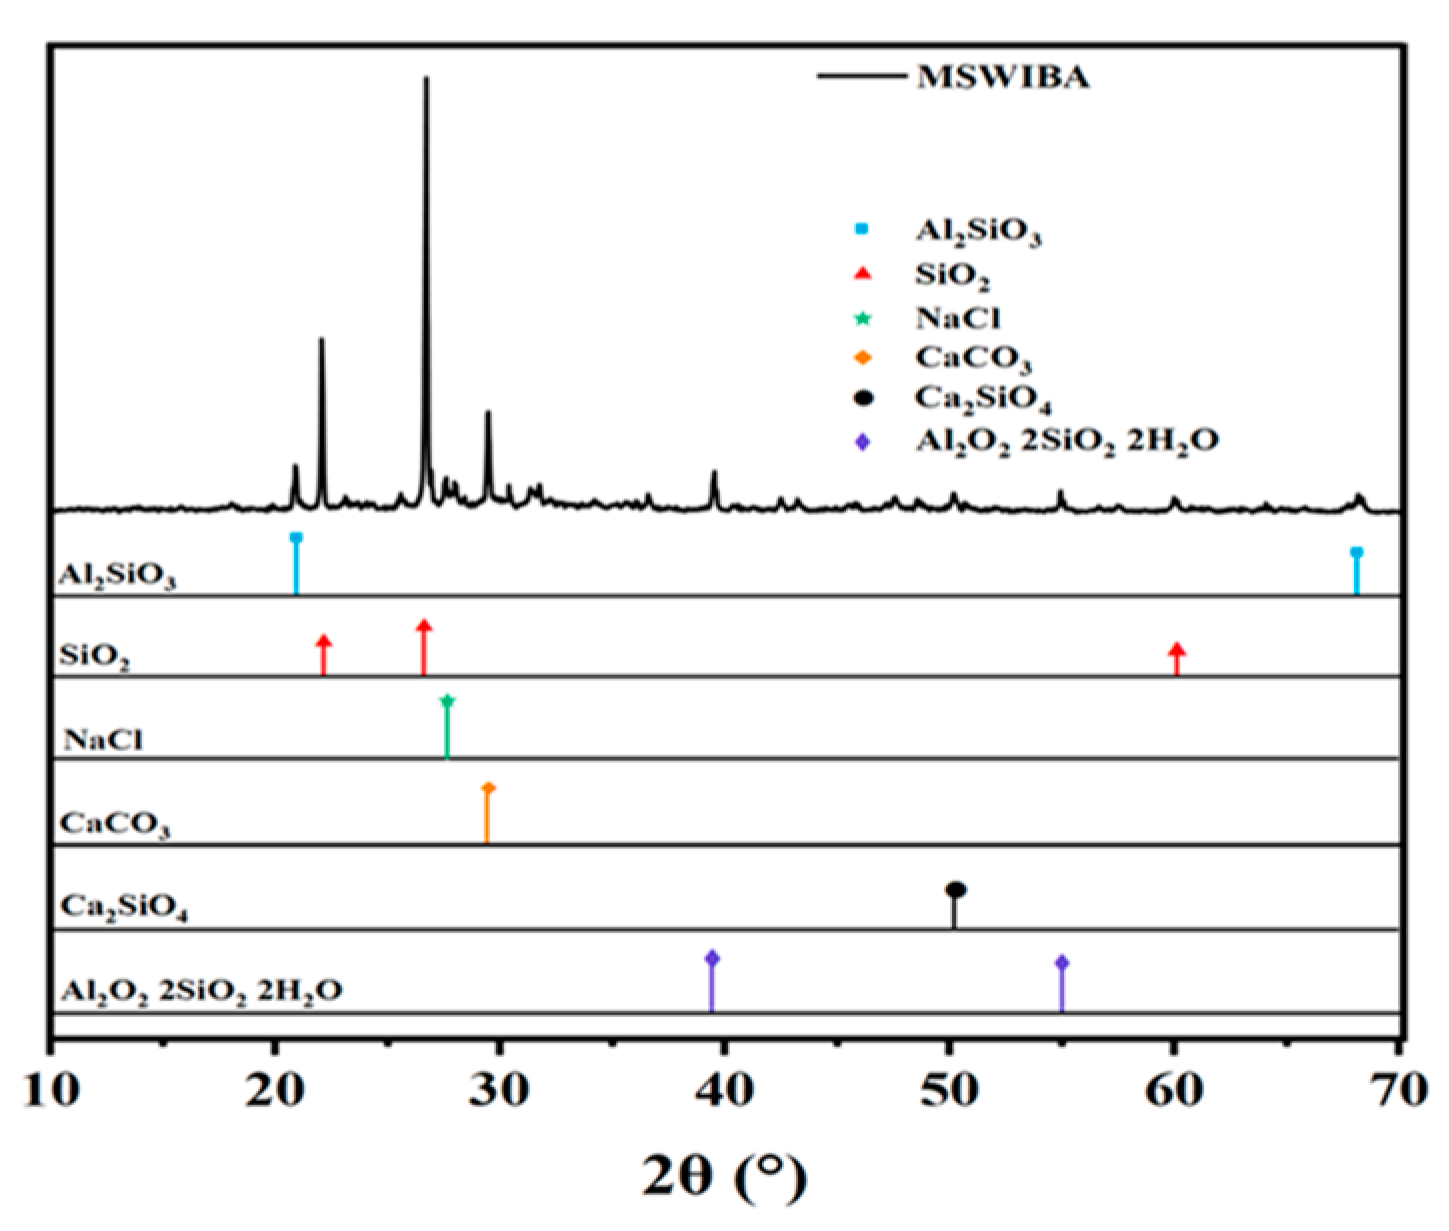
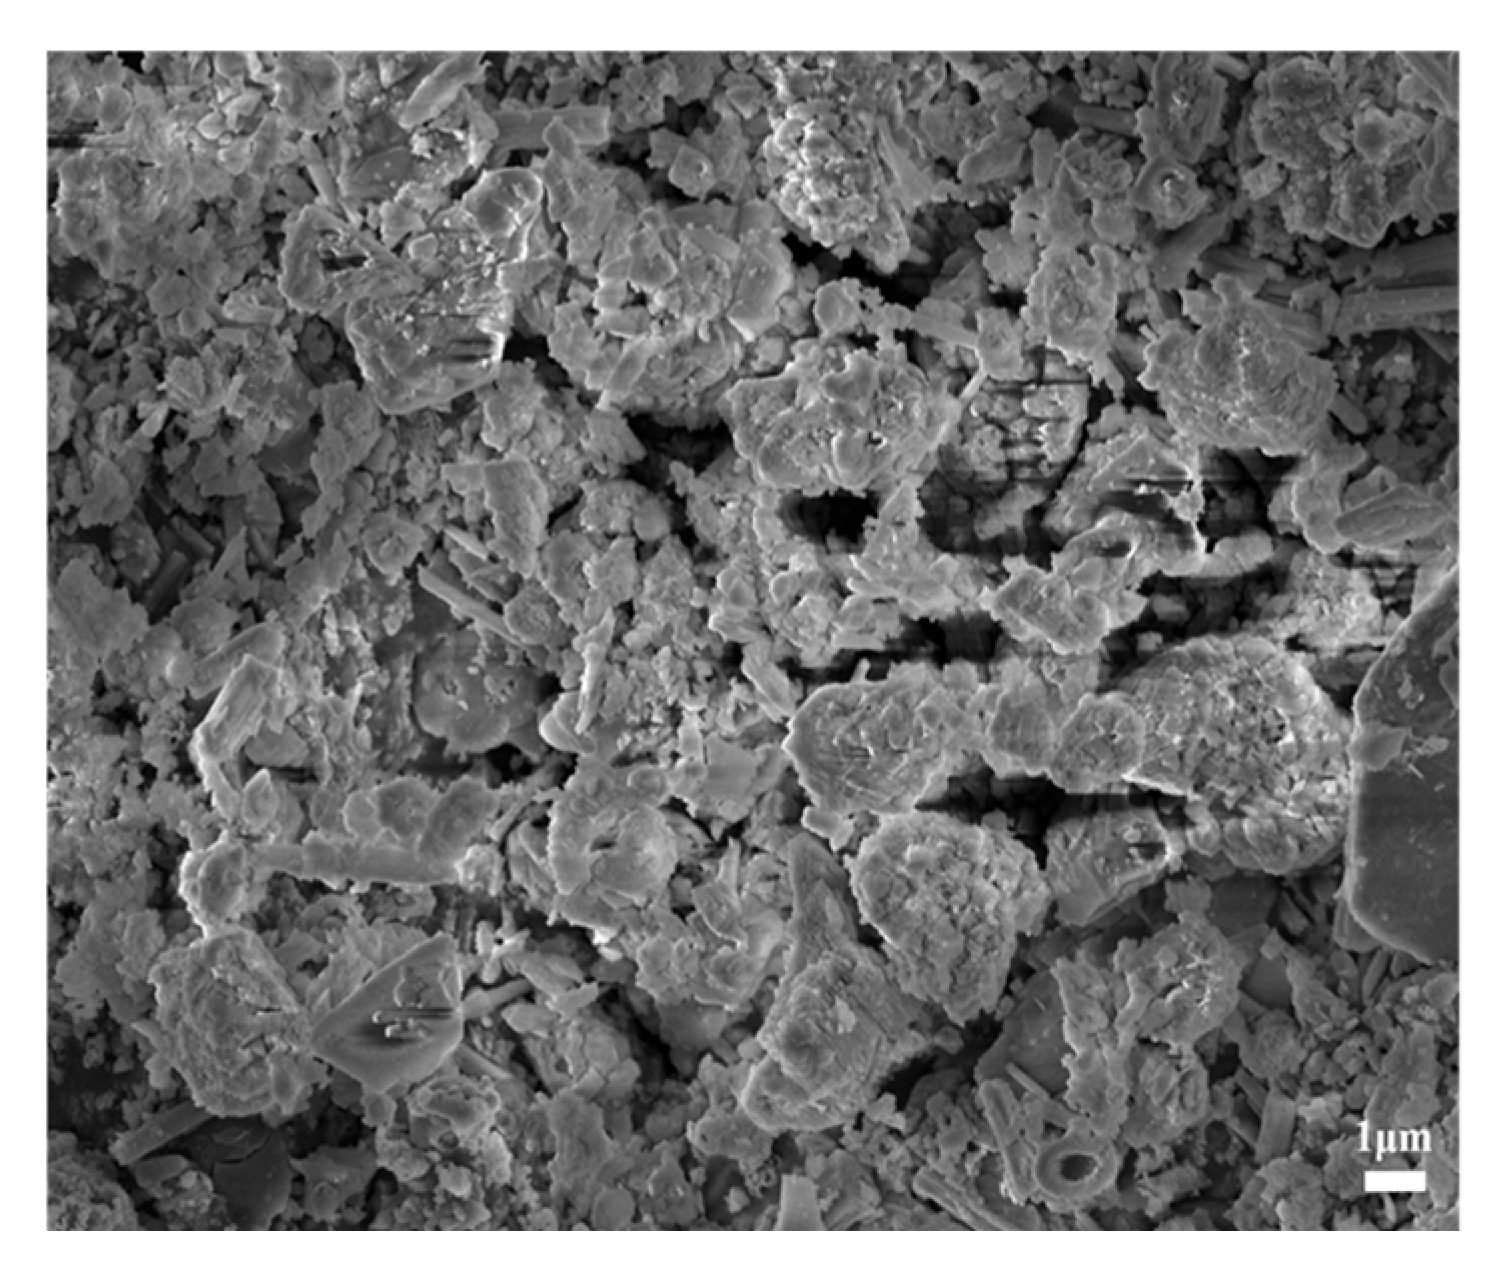
MSWIBA is provided by Henan Environmental Protection Energy Co., Ltd., Kaifeng City, Henan Province, China. The mineral composition and microscopic morphology are shown in
Figure 1 and
Figure 2, respectively. As shown in
Figure 2, MSWIBA consists of an aggregate of irregularly shaped particles of varying sizes and shapes, with needle-like and plate-like crystals attached to the surface and pores in the middle. The XRD test results reveal a diffuse peak between 25 and 30°, indicating the presence of amorphous SiO
2. This silica can combine with hydration products and undergo a pozzolanic reaction at room temperature. However, due to the low SiO
2 content and the material’s poor hardness, a lower replacement range of 5–30% was used in this study.
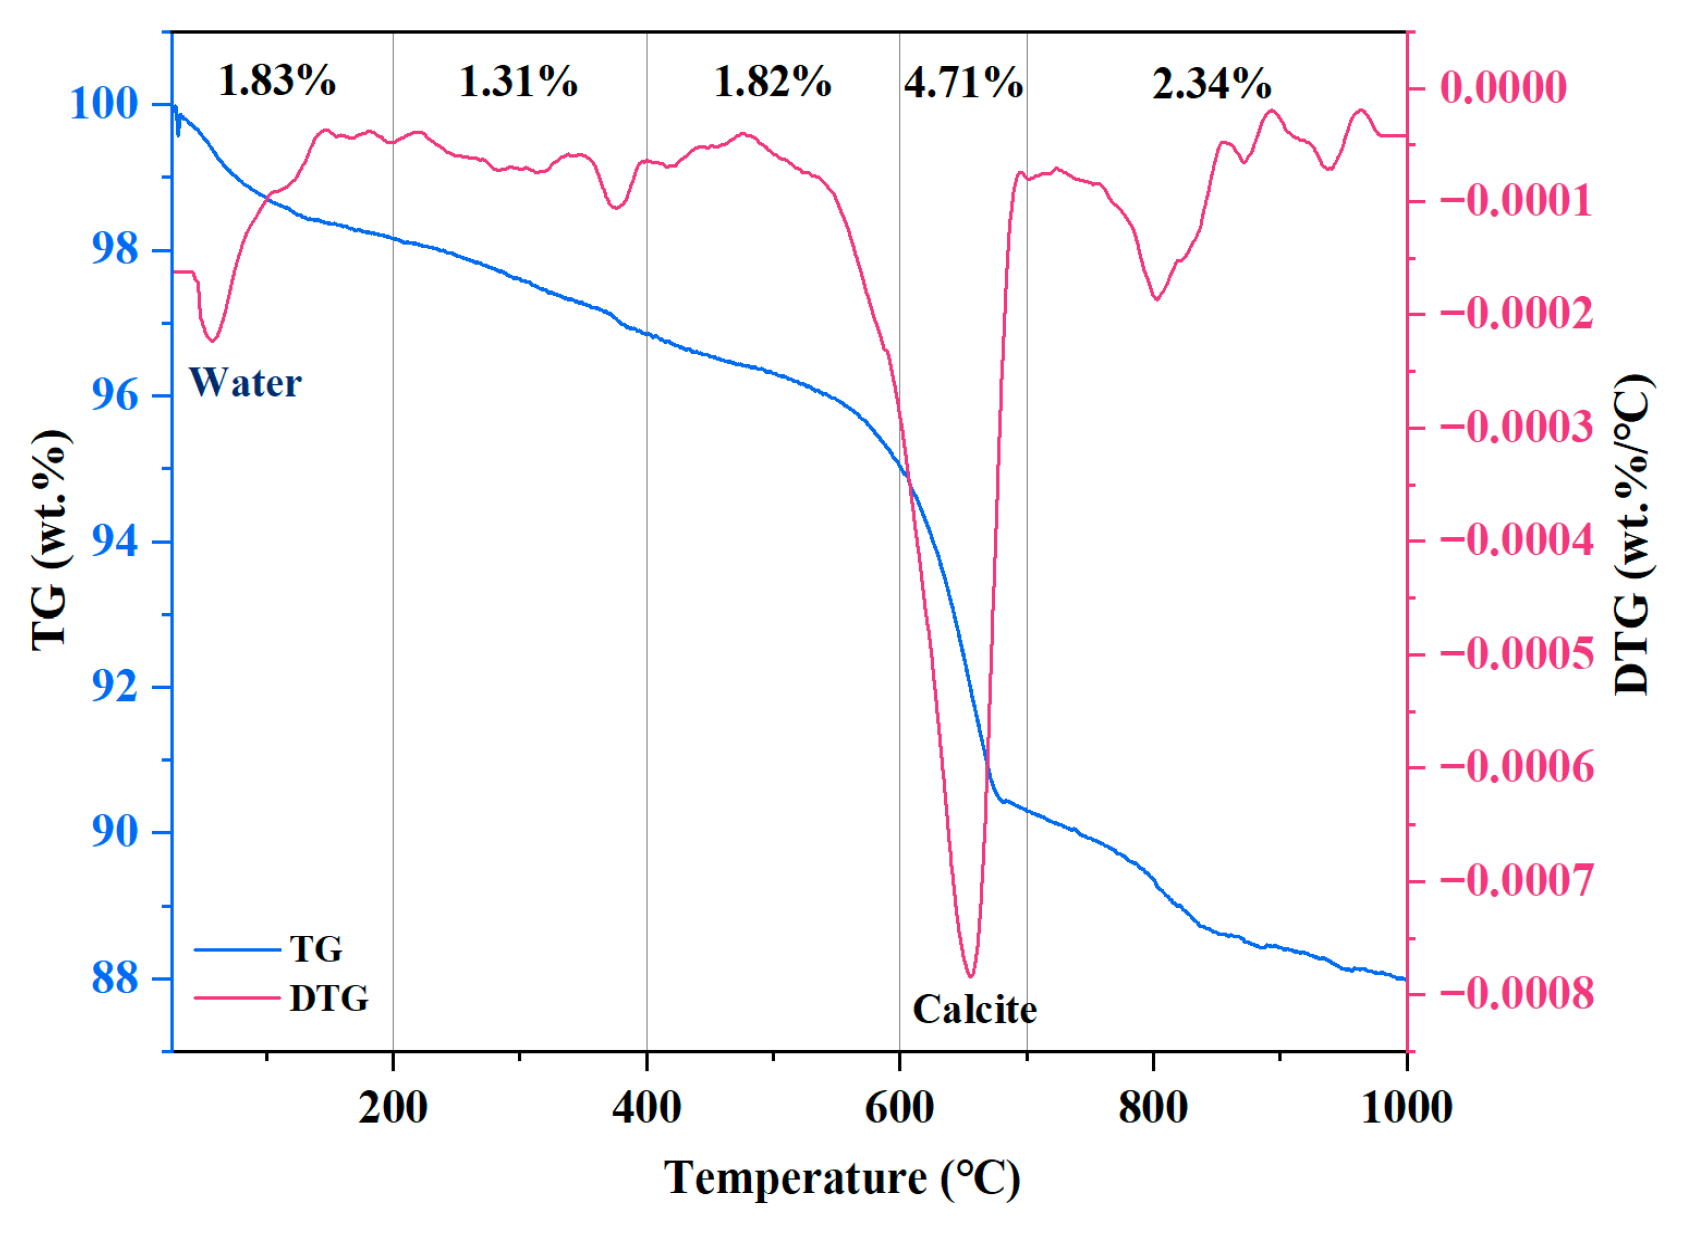
The TG/DTA curve of MSWIBA is shown in
Figure 3. As shown in the figure, the weight loss of MSWIBA occurred in five distinct intervals. The mass loss between 80 and 200 °C was mainly due to water evaporation. Between 200 and 400 °C, the mass loss of the sample was primarily attributed to weight loss from Ca(OH)
2. The small mass loss peak observed between 400 and 600 °C may have been due to the weight loss of calcium chloride hydroxide (CaClOH) present in the MSWIBA. Between 600 and 700 °C, the mass loss of the MSWIBA further increased, mainly resulting from the thermal decomposition of CaCO
3. The mass loss phenomenon between 700 and 1000 °C may have been attributed to the decomposition of organic matter within the MSWIBA. As the temperature increased, MSWIBA exhibited gradual mass loss between 80 and 1000 °C, with a total mass loss of 12.01%. This suggests that MSWIBA has good thermal stability during the curing and service stages of UHPC.
The leaching test results of heavy metal concentrations in MSWIBA are presented in
Table 1. As shown in the table, the concentrations of lead (Pb) and chromium (Cr) ions significantly exceed the regulatory limits for MSW landfill sites.
The main chemical compositions of QS and MSWIBA are shown in
Table 2. The QS exhibits a high SiO
2 content of 98.02%. MSWIBA contains a higher proportion of CaO and SiO
2, along with minor amounts of Al
2O
3, Fe
2O
3, SO
3, MgO, Na
2O, K
2O, and MgO. Additionally, MSWIBA has a significant water content. Therefore, the MSWIBA was dried at 55 °C for 24 h and then cooled to room temperature before further processing.
The ternary cementitious system, composed of cement, slag, and silica fume, forms a multi-scale filling system through the synergistic particle size distribution of the three components, thereby enhancing the compactness of the matrix. The basic properties of cement are listed in
Table 3, and the chemical compositions of different cementitious materials are shown in
Table 2. The polycarboxylate superplasticizer is a pale yellow viscous liquid with a water reduction rate of ≥40% and a solid content of 18%.
2.2. Preparation of UHPC Samples
Using the optimal mix proportion from the previous experiment as the reference group (Ref group), MSWIBA with different particle size range (0.15–0.3 mm, 0.3–0.6 mm, and 0.6–1.18 mm) was mixed evenly at a mass ratio of 2:4.2:3.8. This mixture was then used to replace 5%, 10%, 20%, and 30% of the QS to prepare MSWIBA-UHPC. The corresponding sample numbers were MSWIBA-5, MSWIBA-10, MSWIBA-20, and MSWIBA-30, respectively. All replacement groups maintained the same water-to-binder ratio and cementitious material content as the Ref group, with only the aggregate composition being altered. Detailed experimental mix proportions are shown in
Table 4.
The specimen preparation procedure is as follows: First, water and superplasticizer were mixed thoroughly to form a solution. Cement, silica fume, and slag were added to the cement mortar mixer and mixed at low speed for 60 s. Subsequently, 80% of the water-reducing agent solution was introduced and mixed at low speed for 120 s. Then, QS and MSWIBA were added, and the mixture was mixed at low speed for another 120 s. Finally, the remaining 20% of the water-reducing agent solution was added, and the mixture was mixed at high speed for 360 s. The slurry was poured into half of the 40 mm × 40 mm × 160 mm molds, vibrated for 60 s, and the remaining mold was filled and vibrated for another 60 s. The surfaces were leveled and covered with plastic wrap. The specimens were placed in a standard curing chamber for 24 h of initial curing, followed by demolding and continued standard curing until the desired age for testing.
Total sample count: 171. In preliminary experiments, 27 sets of tests were conducted to determine the optimal mix proportion, involving a total of 81 cubic samples (40 mm). For compressive strength measurement, 15 cubic samples (40 mm) were prepared. For flexural strength measurement, 15 prism samples of 40 mm × 40 mm × 160 mm were prepared. To evaluate the resistance to chloride salt and sulfate erosion, 60 cubic samples (40 mm) were prepared.
2.3. Experimental Methods
2.3.1. Physical Properties
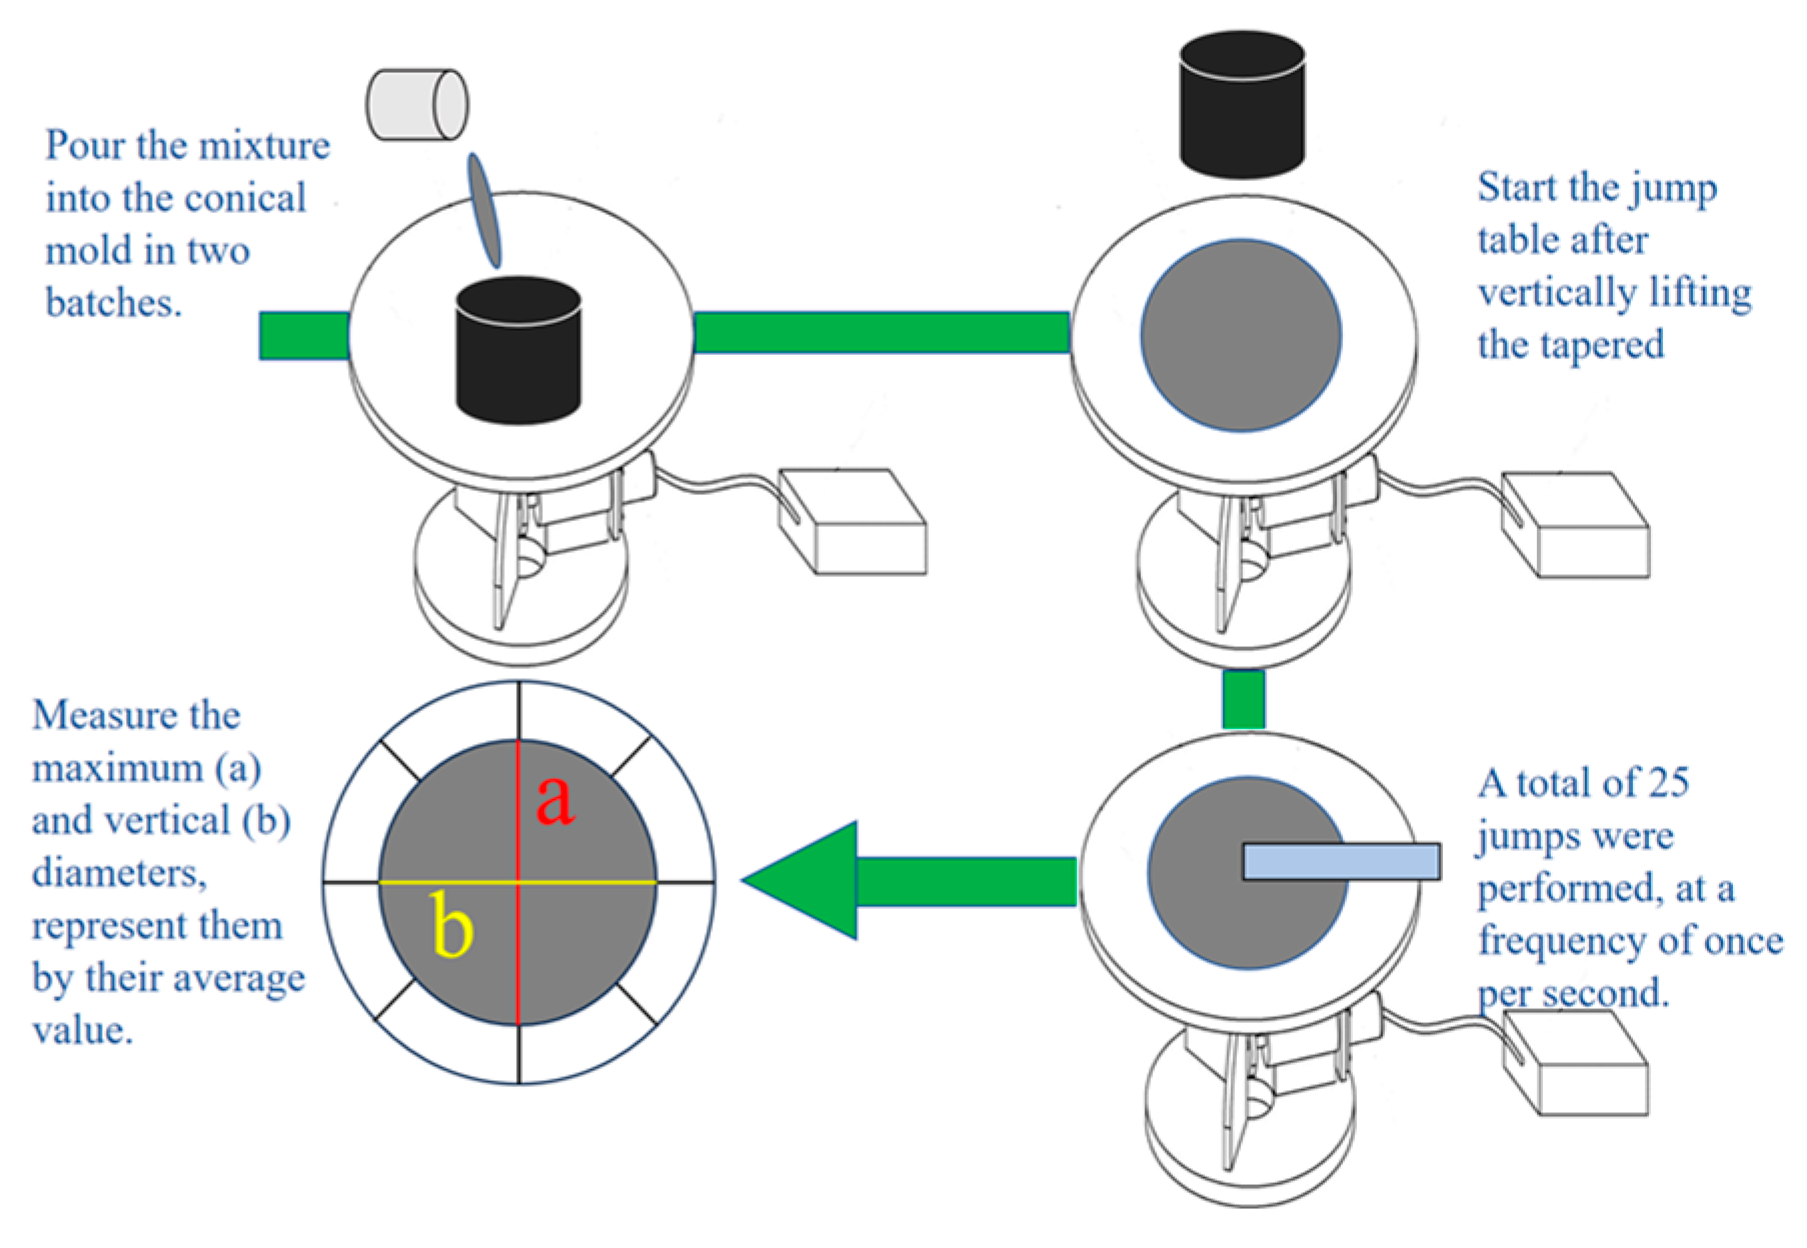
According to GB/T 2419-2005 [
34], the fluidity of the specimen was determined using the jump table method, which is equivalent to the Vebe time test method in ASTM C143/EN 12350-6. The specific testing procedure is shown in
Figure 4.
According to the national standard JGJ/T 70-2009 [
35], the setting time of the specimen was determined using the standardized penetration resistance method, which is equivalent to the setting time determined using a Vicat needle in ASTM C191/EN 196-3 [
36,
37]. When the penetration resistance reached 0.3 MPa, it was recorded as the initial setting time. When the penetration resistance reached 0.7 MPa, it was recorded as the final setting time.
The wet packing density [
38] was used to evaluate the effect of MSWIBA replacement rate on the packing state of UHPC slurry, which is equivalent to the wet bulk density test method in the modified ASTM C29/EN 1097-3 [
39,
40]. The calculation method for the wet packing density of UHPC is shown in Equation (1):
where Φ is the packing density, V is the volume of the mold to be filled by the sample, the container volume used in this paper is 400 mL, and V
s is the total volume of concrete raw materials. V
s can be expressed as Equation (2):
where M is the total amount of concrete mixture in the container;
represents different cementitious materials;
represents all cementitious material components;
represent densities of water, aggregate (QS, MSWIBA) and cementitious material
respectively;
respectively represent the volumetric ratios of water, aggregate and cementitious materials
to the total volume of concrete raw materials.
2.3.2. Mechanical Properties
According to GB/T 17671-2021 [
41], the flexural and compressive strengths of the UHPC were tested at 3, 7, and 28 days using a WDW-600E electro-hydraulic universal testing machine. The loading rates for flexural and compressive strength tests were 0.05 kN/s and 2.4 kN/s, respectively. These correspond to the ASTM C109/EN 12390-3 [
42,
43] for measuring the compressive strength of 100 mm cubic specimens at a loading rate of 0.5 MPa s
−1 and the ASTM C348/EN 12390-5 standard for measuring the flexural strength of 40 mm × 40 mm × 160 mm prism specimens at a loading rate of 0.05 kN s
−1.
2.3.3. Durability
According to GB/T 50082-2024 [
44], the shrinkage test was conducted on specimens with dimensions of 25 mm × 25 mm × 280 mm. The measuring heads were pre-installed at both ends of the mold prior to casting. After 24 h of standard curing, the specimens were demolded, numbered, and marked with the direction of measurement. The specimens were then immersed in water for 2 days to determine the initial length L
0, followed by placement in a shrinkage chamber for length measurement at various ages, with the final length recorded as L
t. The calculation method is shown in Equation (3).
: Dry shrinkage of specimen at t-day (10−6); : Initial length of specimen (mm); : T-day length of specimen (mm); : Gauge length (mm)
To test the resistance of UHPC to chloride and sulfate attack, specimens cured for 28 days were immersed in a 10% Na
2SO
4 solution and a 5% NaCl solution by mass, respectively. After soaking for 28 and 56 days, the specimens were removed, wiped dry, and their mass and mechanical strength were measured. The mass loss rate and corrosion resistance coefficient were calculated using Equations (4) and (5), respectively.
: Mass loss rate after chloride or sulfate attack at the corresponding age (%); : Mass after water immersion at the corresponding age (g); : Mass of specimen after chloride or sulfate attack at the corresponding age (%); : Compressive strength corrosion resistance coefficient at the corresponding age (%); : Compressive strength of specimens after chloride or sulfate attack at the corresponding age (MPa); : Compressive strength of specimens after water immersion at the corresponding age (MPa).
2.3.4. Microscopic Properties
The specimens cured for 28 days were crushed, and samples were taken from the center and immersed in anhydrous ethanol to terminate hydration. After 3 days, they were removed and dried at 40 °C until constant weight was achieved. The dried samples were then ground and passed through a 200-mesh sieve for chemical composition analysis using an S8 TIGER wavelength-dispersive X-ray fluorescence spectrometer. X-ray diffraction (XRD) analysis was conducted on a D8-ADVANCE X-ray diffractometer to determine the mineral phase composition of the raw materials and UHPC. The scanning step was 0.02°, the scanning range was 10–80°, and the scanning speed was 10°/min. Thermogravimetric analysis (TGA) was performed using a TGA 400 synchronous thermal analyzer. A 10–15 mg sample was placed in a crucible and heated from 30 °C to 1000 °C at a heating rate of 10 °C/min. The environmental atmosphere during the test was continuous nitrogen to suppress the carbonation of the sample during heating.
For the UHPC specimens, 5 mm × 5 mm × 5 mm cubic blocks were cut from the cured 28-day specimens using a cutting machine. The surfaces of the cubes were polished with sandpaper, immersed in anhydrous ethanol to terminate hydration, and then dried at 40 °C until constant weight was achieved. The dried specimens were subsequently subjected to gold sputtering. They were then examined under a Geminisem scanning electron microscope which was manufactured by Carl Zeiss AG in Oberkochen, Germany in secondary electron imaging mode at various magnifications.
2.3.5. Heavy Metal Leaching Concentration Analysis
The test was conducted in accordance with the national environmental protection industry standards HJ/T 300-2007 [
45] and HJ 557-2010 [
46], which are equivalent to the heavy metal leaching test method in the EN 12457-2 [
47]. The test block was crushed and placed in a polyethylene (PE) centrifuge tube, followed by rotational oscillation. The resulting filtrate was subsequently analyzed using inductively coupled plasma mass spectrometry (ICP-MS).
3. Results and Discussion
3.1. Effects of MSWIBA Content on the Physical Properties of UHPC
3.1.1. Fluidity
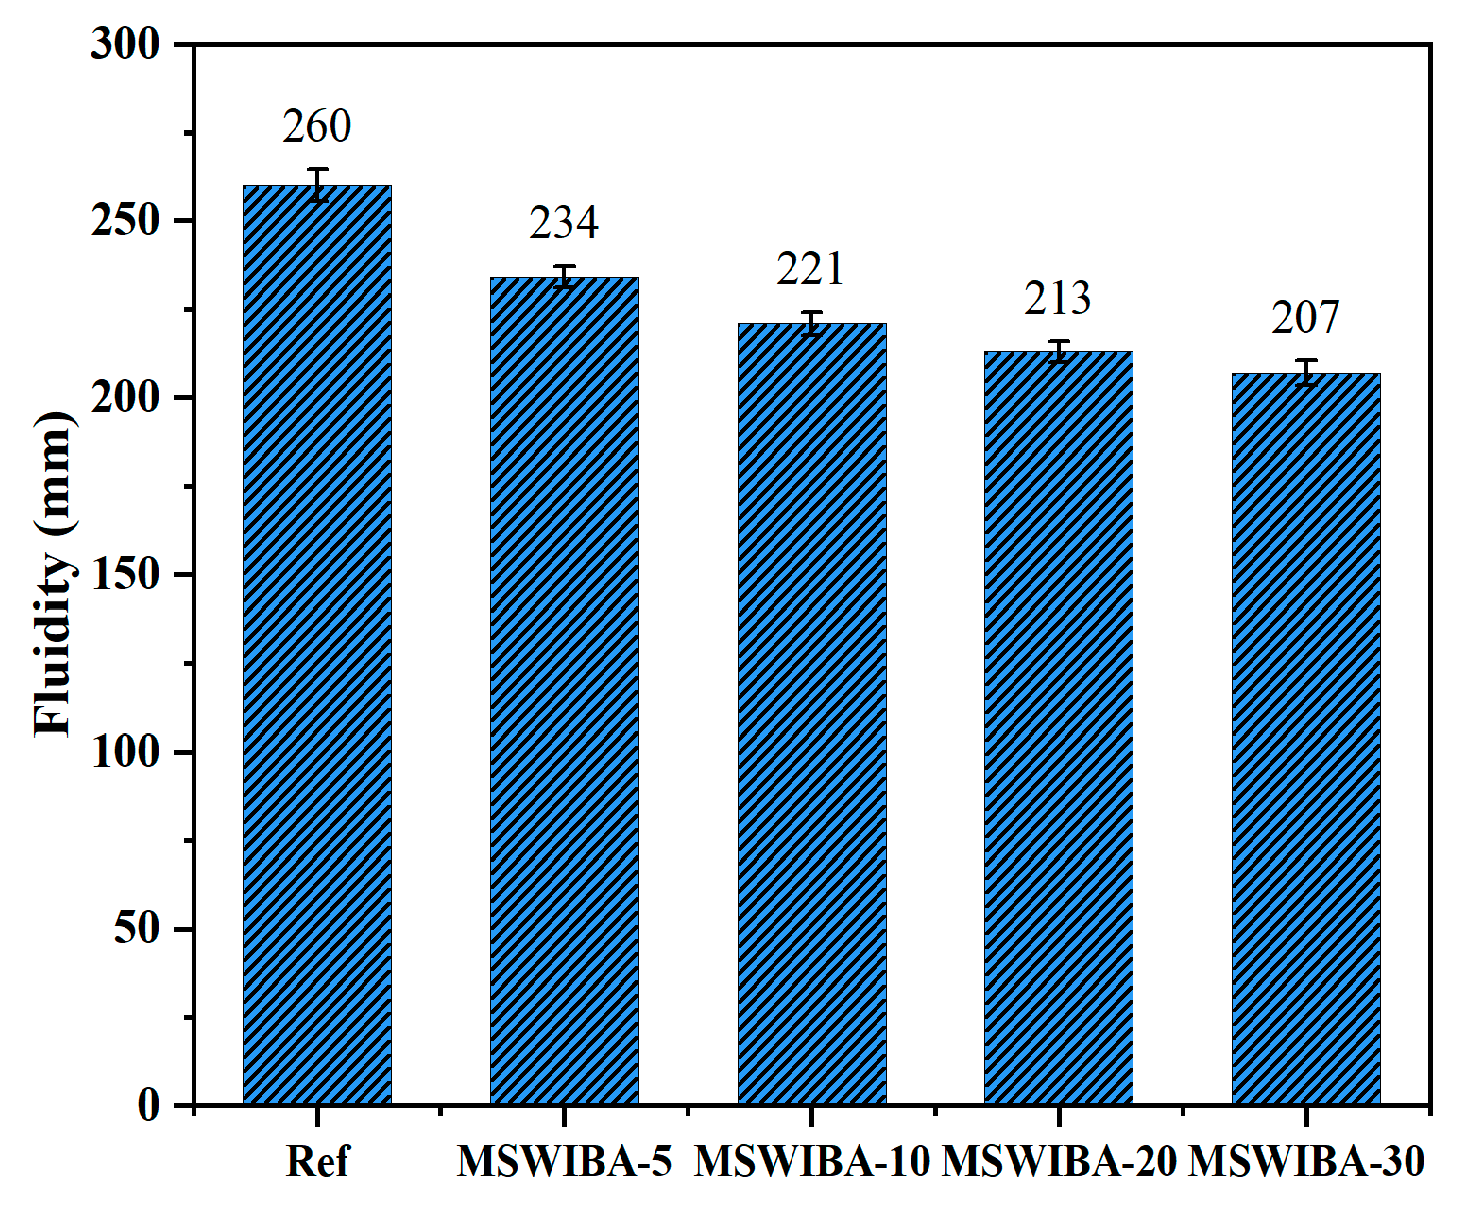
The fluidity test results of UHPC at different MSWIBA substitution rates are shown in
Figure 5. The reference group exhibited a fluidity of 260 mm, while the fluidity of UHPC gradually decreased with increasing MSWIBA replacement. When the replacement rate of MSWIBA was 5%, 10%, 20%, and 30%, the fluidity of UHPC decreased by 10%, 15%, 18.07%, and 20.28% compared to the reference group, respectively. Notably, even at the maximum replacement rate of 30%, the fluidity of UHPC remained at 207 mm, which satisfies the performance requirements for UHPC. The high-temperature incineration process imparted a porous microstructure to MSWIBA particles, resulting in a 15–30% higher specific surface area and an 8–12% lower density compared to QS [
48]. Furthermore, the angular morphology and irregular particle size distribution of MSWIBA intensified inter-particle friction and viscosity [
49]. The higher specific surface area, high water absorption, and angular particle morphology of MSWIBA, compared to QS, collectively contributed to the gradual decrease in fluidity of MSWIBA-UHPC as the replacement rate increases. In this study, when MSWIBA replaced QS by less than 30%, the fluidity of UHPC met the requirements.
3.1.2. Setting Time
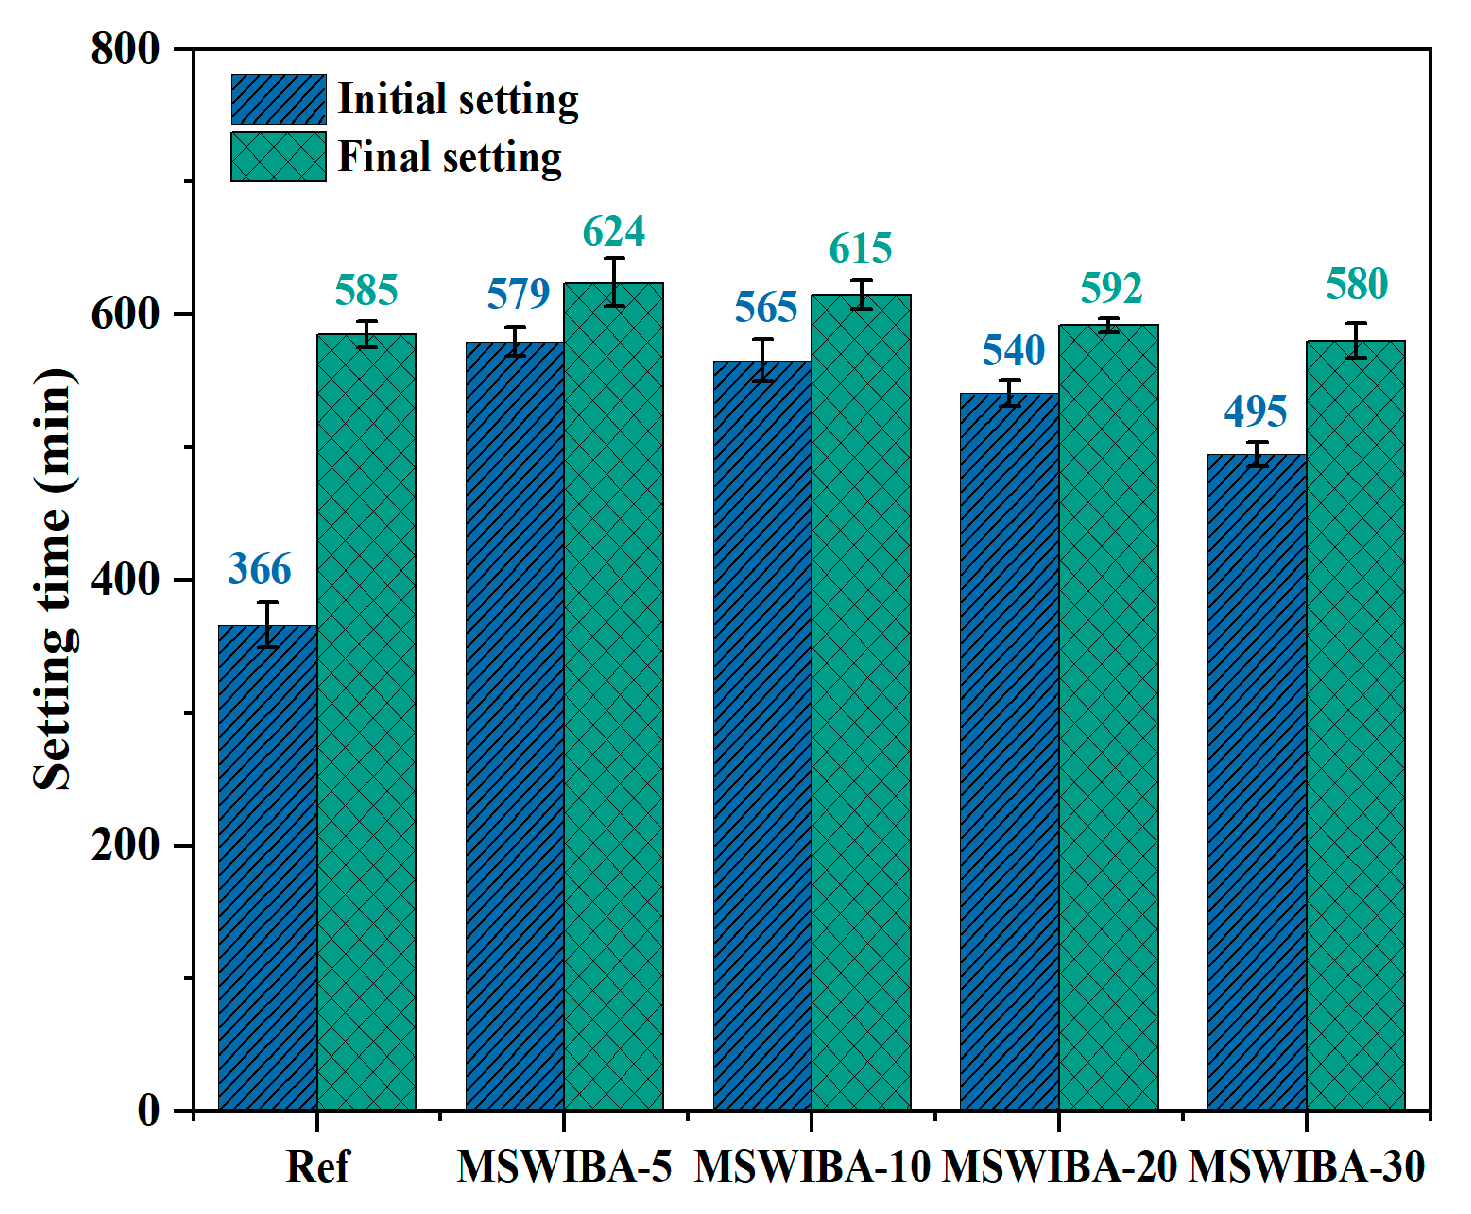
The setting time test results of UHPC with different MSWIBA replacement rates are shown in
Figure 6. The results show that both initial and final setting times initially increased and then decreased as the MSWIBA replacement rate increased. The maximum increase in initial and final setting times occurs at a 5% replacement rate, with increases of 36.79% and 6.67%, respectively, compared to the reference group. However, at the maximum replacement rate of 30%, the initial setting time increased by 35.25% compared to the reference group, while the final setting time decreased by 0.85%.
The prolonged initial setting time at low MSWIBA replacement rates was primarily attributed to the adsorption of mixing water by the porous structure of MSWIBA, which reduced the availability of free water for the initial hydration reactions of cementitious materials, thereby delaying the formation of hydration products and extending the initial setting time. When the MSWIBA replacement rate exceeded a certain threshold, its wide particle size distribution and irregular morphology effectively compensated for the gradation deficiencies in the original QS system, thereby reducing porosity. A lower porosity enhanced the contact between cement particles, reducing the volume of hydration products needed to fill voids and accelerating the setting process. Additionally, reduced porosity increases the availability of water for hydration reactions, promoting the formation of hydration products and further enhancing the setting rate. Moreover, as internal humidity decreased, moisture within the micropores of MSWIBA diffused toward unhydrated cement particles due to a humidity gradient, shortening the induction period of tricalcium silicate (C3S) and contributing to a shorter initial setting time. However, the residual adsorption effect of MSWIBA at a 30% replacement rate still resulted in a longer initial setting time compared to the reference group.
In the final setting stage (>6 h), the residual active components in MSWIBA, such as CaO and Al
2O
3, reacted with the hydration products of cement Ca(OH)
2 to form calcium silicate hydrate (C-S-H) gel. At low replacement levels, the limited pozzolanic reaction prolonged the final setting time. Conversely, at high dosage levels, the reaction accelerated, and metal oxides in MSWIBA, such as Fe
2O
3 and ZnO, catalyzed the hydration reaction of tricalcium aluminate (C
3A) during the final setting stage [
50], leading to a shorter final setting time compared to the reference group. Overall, the incorporation of MSWIBA had a complex effect on setting time, and a balance needed to be achieved between dosage control and performance optimization.
3.1.3. Wet Packing Density
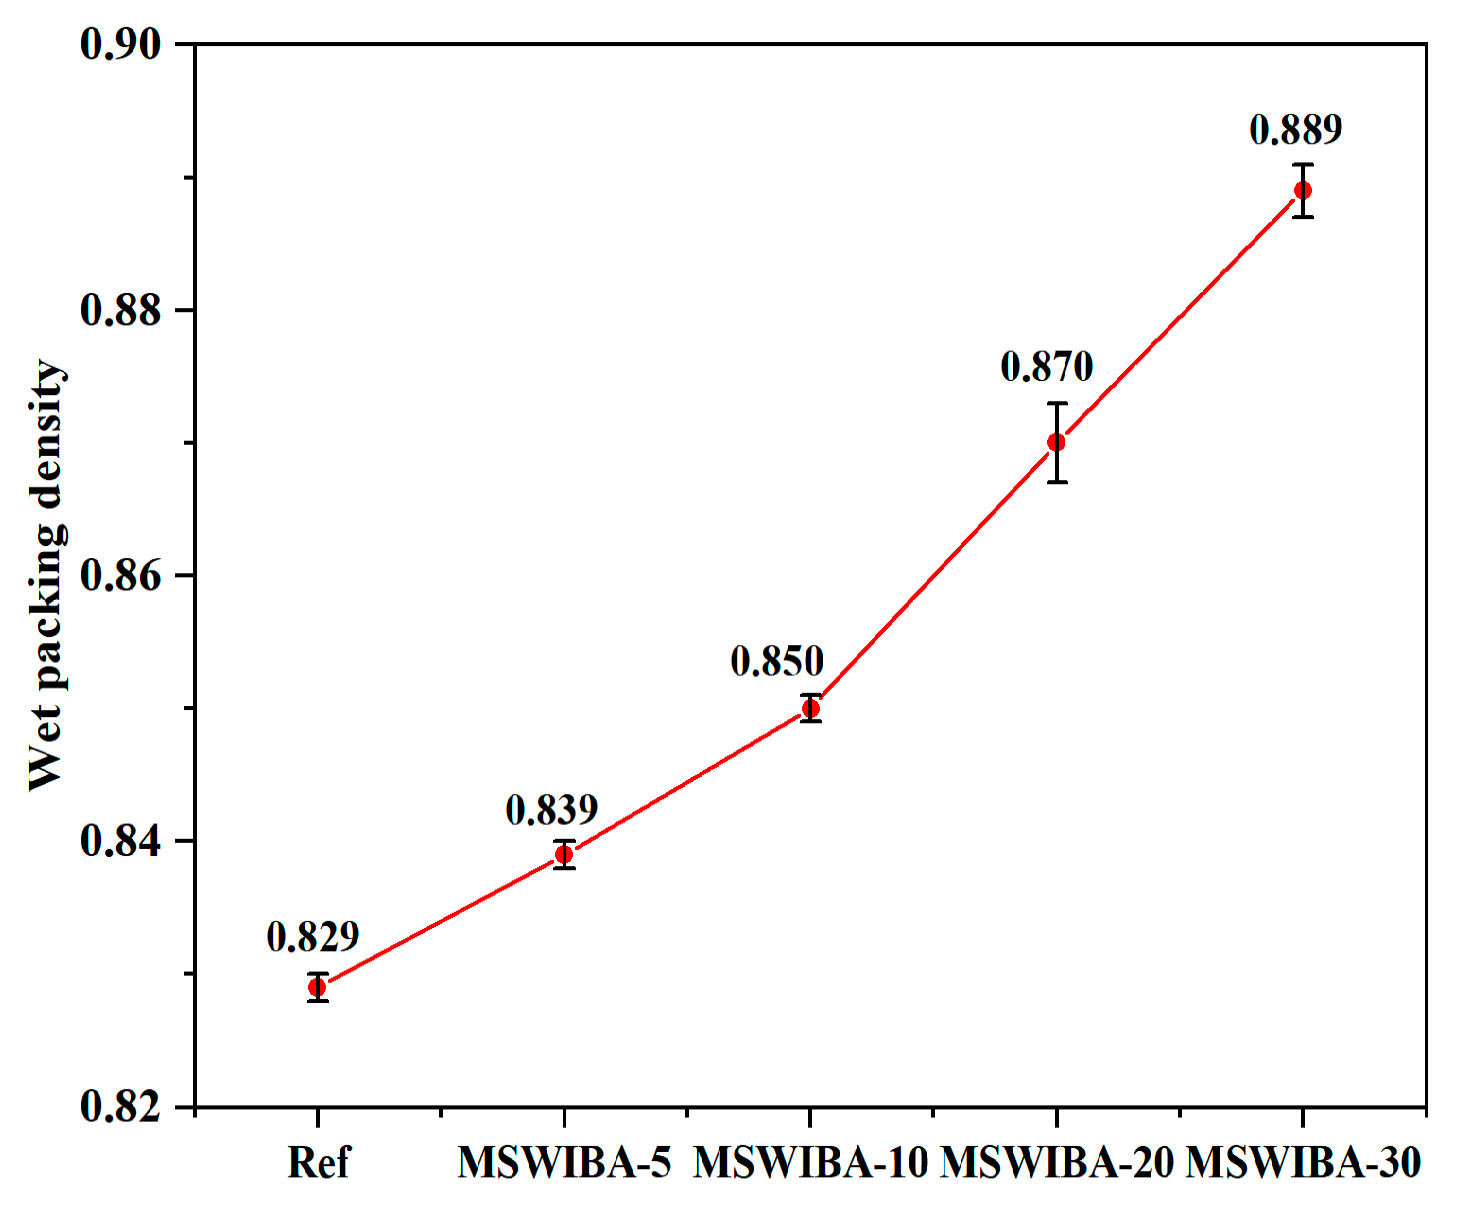
The results of the wet packing density test for UHPC with varying MSWIBA replacement rates are presented in
Figure 7. As the figure illustrates, replacing QS with MSWIBA in UHPC increased the wet packing density. Compared with the reference group, the wet packing density of the MSWIBA-5, MSWIBA-10, MSWIBA-20, and MSWIBA-30 groups increased by 1.21%, 2.47%, 4.95%, and 7.24%, respectively, representing a small overall increase. The porous structure of MSWIBA adsorbed some free water during wet stacking, reducing the volume of available free water in the paste and consequently lowering the effective water-to-binder ratio. Studies have shown that for every 10% increase in MSWIBA dosage, the effective water-to-binder ratio of the paste decreased by 0.02–0.03, and the wet packing density increased by 0.8–1.2% [
51]. Additionally, the residual CaO, Al
2O
3, and other components in MSWIBA underwent a pozzolanic reaction in an alkaline environment, generating C-S-H gel that filled micropores and contributed to microstructure densification [
52]. Simultaneously, the optimized particle gradation of MSWIBA further enhanced the wet packing density. Therefore, MSWIBA, through its porous structure and pozzolanic reaction, improved the compactness of the material and optimized the pore structure, thereby increasing the wet packing density of UHPC.
3.2. Effects of MSWIBA Content on the Mechanical Properties of UHPC
3.2.1. Compressive Strength
The test results of the effect of different MSWIBA replacement rates on the compressive strength of UHPC are shown in
Figure 8. The compressive strength of UHPC increased with curing age, with rapid development observed in the first 3 days, contributing approximately 46–69% of the 28-day strength. At various curing ages, the compressive strength of UHPC consistently decreased as the MSWIBA replacement rate increased. Specifically, at replacement rates of 5%, 10%, 20%, and 30%, the 28-day compressive strength decreased by 11.00%, 19.17%, 32.33%, and 38.89%, respectively, compared to the reference group. Notably, at replacement rates of 5% and 10%, the 28-day compressive strengths of UHPC were 141.7 MPa and 128.7 MPa, respectively, both exceeding 120 MPa and thus satisfying the mechanical performance requirements of UHPC. At replacement rates of 20% and 30%, the 28-day compressive strengths of UHPC were 107.7 MPa and 97.3 MPa, respectively, which still meet the compressive strength requirements for high-performance concrete (HPC).
Compared with QS, the porous structure of MSWIBA introduced a large number of initial pores, compromising the low-porosity nature of UHPC. These pores tended to act as stress concentration points under load, leading to crack propagation and a reduction in compressive strength. As the MSWIBA replacement rate increased, the proportion of free water and polycarboxylate high-efficiency superplasticizer adsorbed by its porous structure also increased, significantly reducing the effective water-to-binder ratio. This resulted in insufficient water availability for hydration, delaying the hydration of C3S and C3A, and consequently reducing the amount of C-S-H gel formed, which in turn led to a decrease in early compressive strength. Typically, a higher wet packing density implies better particle grading and a denser microstructure, and thus higher strength. Yet, although MSWIBA increases the physical packing density, its chemical nature and lower intrinsic strength have a certain negative impact on the microstructure. However, compared to the 3-day and 7-day compressive strength, the reduction in the 28-day compressive strength was less pronounced. This was mainly attributed to the internal curing effect of MSWIBA as the curing time increased. Concurrently, silica fume, slag, and MSWIBA underwent a secondary hydration reaction with calcium hydroxide, leading to an increase in hydration products during the later stages and a gradual optimization of the pore structure, which contributed to a reduced strength reduction at 28 days.
3.2.2. Flexural Strength
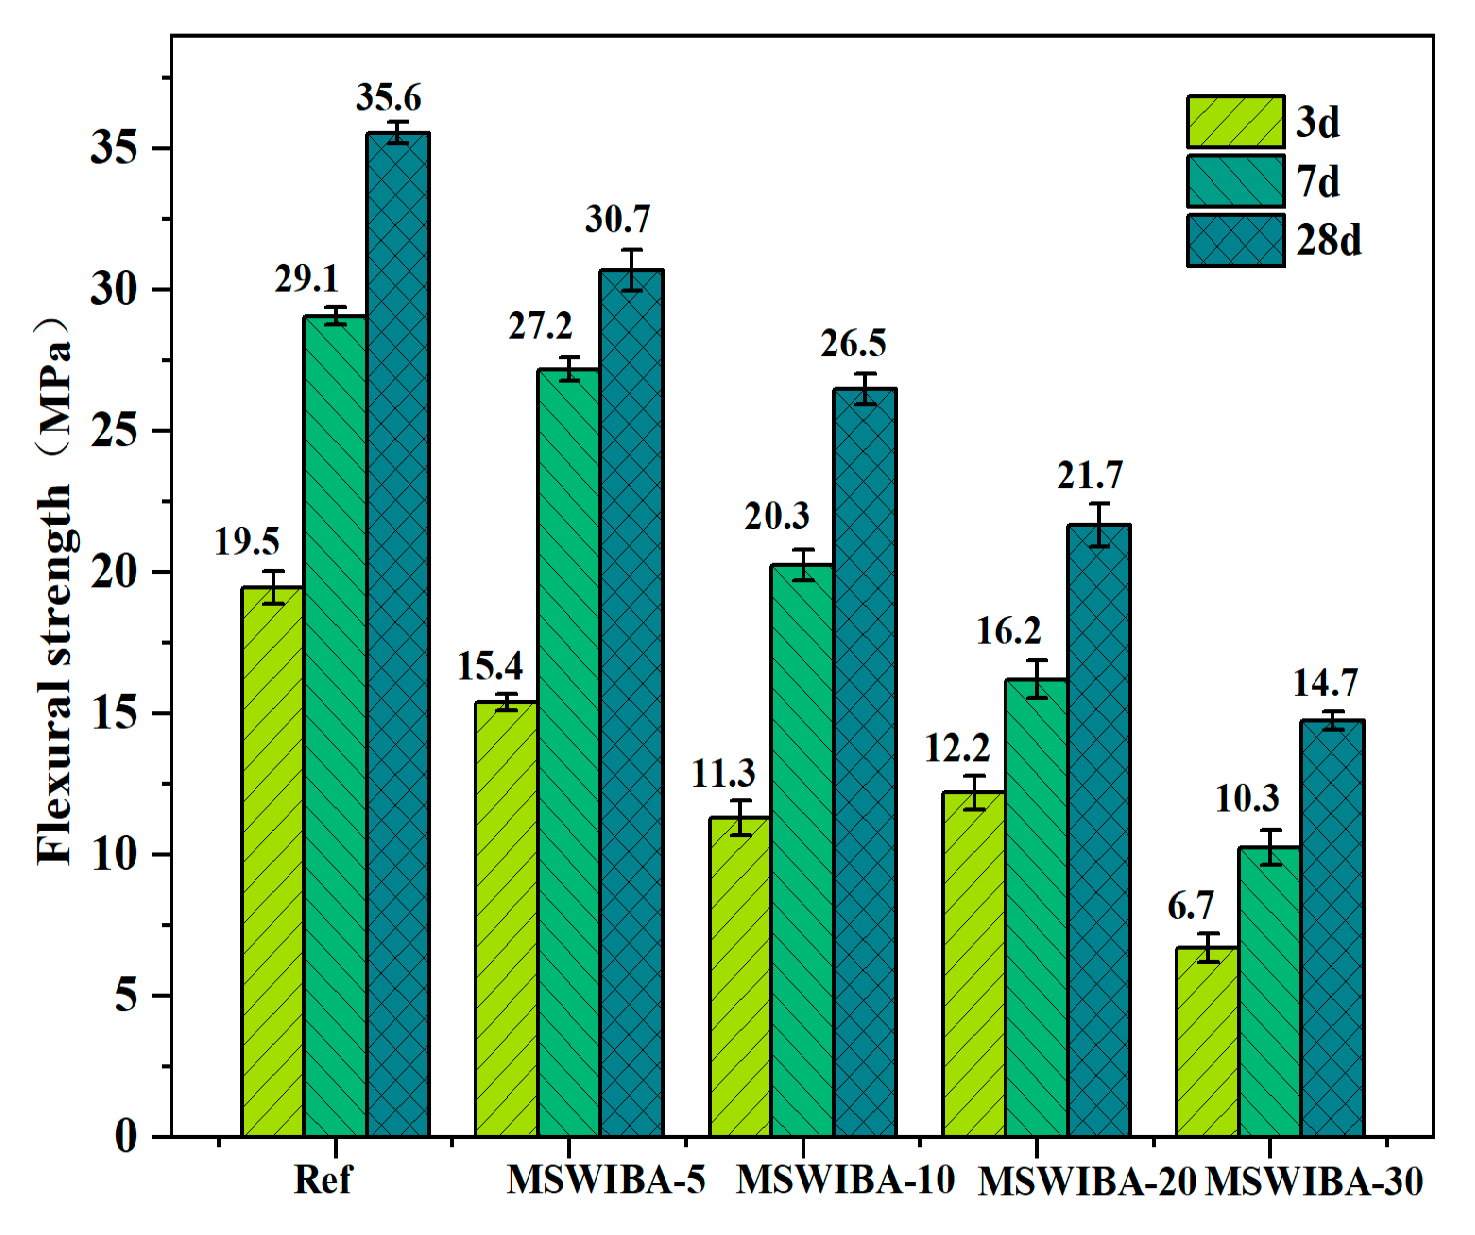
The effect of different MSWIBA replacement rates on the flexural strength of UHPC is shown in
Figure 9. As illustrated, the development trend of flexural strength was consistent with that of compressive strength. With increasing MSWIBA replacement rate, the flexural strength of UHPC at each curing age consistently decreased. At replacement rates of 5%, 10%, 20%, and 30%, the 28-day flexural strength decreased by 13.72%, 25.53%, 39.06%, and 58.58%, respectively, compared to the reference group. Compared with QS, MSWIBA has a high porosity. Replacing QS with MSWIBA increased the internal pore structure of UHPC, which led to stress concentration when subjected to stress, resulting in a decrease in flexural strength. Additionally, the low packing density of MSWIBA resulted in inferior compactness and strength compared to the UHPC matrix, leading to uneven density distribution and the formation of vulnerable zones, which ultimately diminished the flexural resistance of the UHPC. Furthermore, the reaction of Cl
− in MSWIBA with C
3A produced expansive products such as Friedel’s salt, which triggered micro-crack propagation. This exacerbated stress concentration during flexural testing, further reducing the flexural strength of UHPC.
3.3. Effects of MSWIBA Content on the Durability of UHPC
3.3.1. Drying Shrinkage Performance
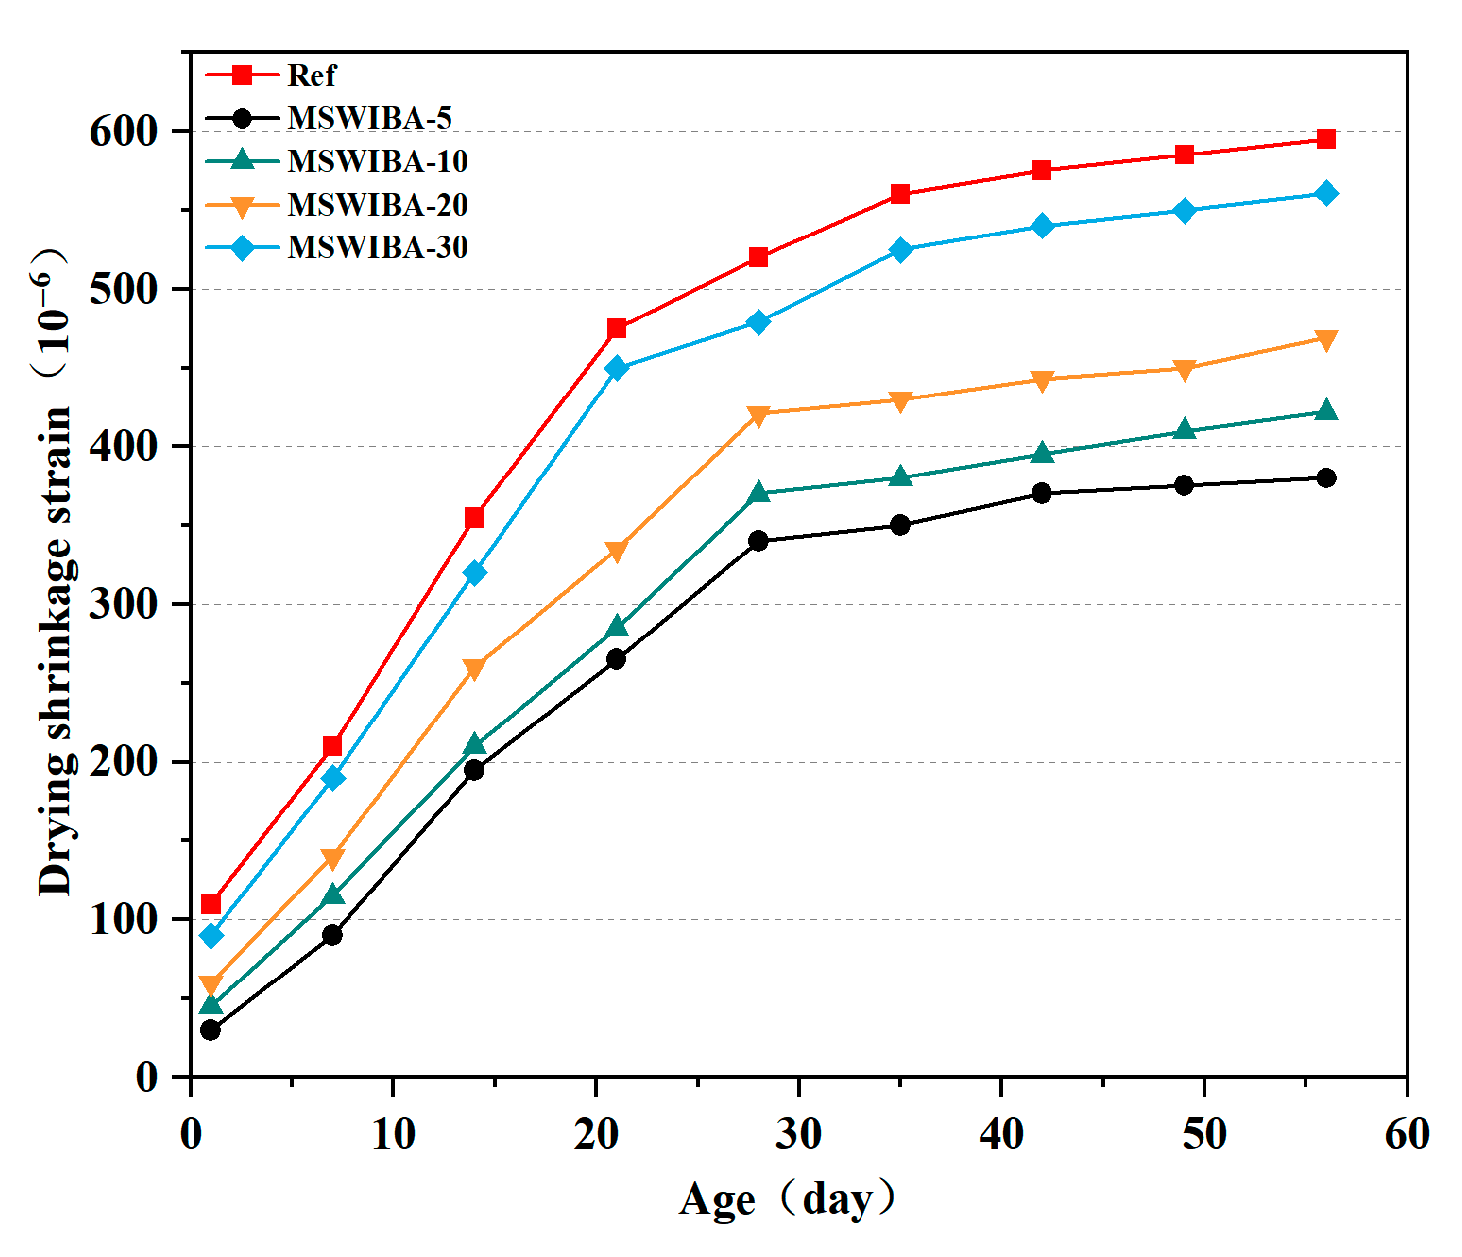
The drying shrinkage test results of UHPC samples are shown in
Figure 10. As shown in the figure, the change pattern of UHPC shrinkage performance is basically the same. With the increase in age, the shrinkage rate of UHPC gradually increases, and the growth trend gradually slows down after 28 days. The reference group UHPC exhibited a drying shrinkage rate of 210 × 10
−6 at 7 days and 520 × 10
−6 at 28 days, with the 28-day drying shrinkage accounting for 87.39% of the 56-day value. This was attributed to the low water–binder ratio and the rapid hydration of the high-content cement, which led to a sharp decrease in internal relative humidity, triggering autogenous shrinkage. After 28 days, the external moisture evaporation rate decreased, but the residual moisture within the internal pores continued to migrate, resulting in a sustained, albeit reduced, drying shrinkage rate.
The 7-day drying shrinkage rate of the specimens decreased by 57.14%, 45.24%, 33.33%, and 14.29% at MSWIBA replacement rates of 5%, 10%, 20%, and 30%, respectively, compared to the reference group, indicating a significant reduction in drying shrinkage. The most substantial decrease in drying shrinkage was observed at a 5% replacement rate, and as the replacement rate increased further, the drying shrinkage rate gradually increased. The drying shrinkage rate of the UHPC specimens with MSWIBA was lower than that of the reference group. This was attributed to the loose and porous nature of MSWIBA, which allowed it to adsorb some of the mixing water. During the hardening process, MSWIBA functions as an “internal curing” agent, gradually releasing the adsorbed water and alleviating the early drying shrinkage of UHPC to some extent. This internal curing effect significantly reduced the initial drying shrinkage, resulting in lower drying shrinkage values for all dosage groups compared to the reference group.
As the MSWIBA replacement rate increased, the proportion of initial pores introduced by its porous structure also increased significantly, leading to a longer moisture evaporation path and increased capillary tension, which in turn increased the drying shrinkage rate. The elastic modulus of MSWIBA was lower than that of QS, and an increased replacement rate reduced the aggregate skeleton effect, which normally inhibits drying shrinkage. Consequently, it was demonstrated that when the MSWIBA replacement rate exceeded 5%, the drying shrinkage rate of UHPC gradually increased. According to the Chinese national standard GB/T 50082-2024 [
44], the 28-day drying shrinkage rate of UHPC should be controlled within 550 × 10
−6. In this study, the 28-day drying shrinkage rate of the UHPC mix with a 10% MSWIBA replacement rate was 286 × 10
−6, indicating that its drying shrinkage performance met the requirements of the relevant standard of UHPC.
3.3.2. Resistance to Chloride Attack
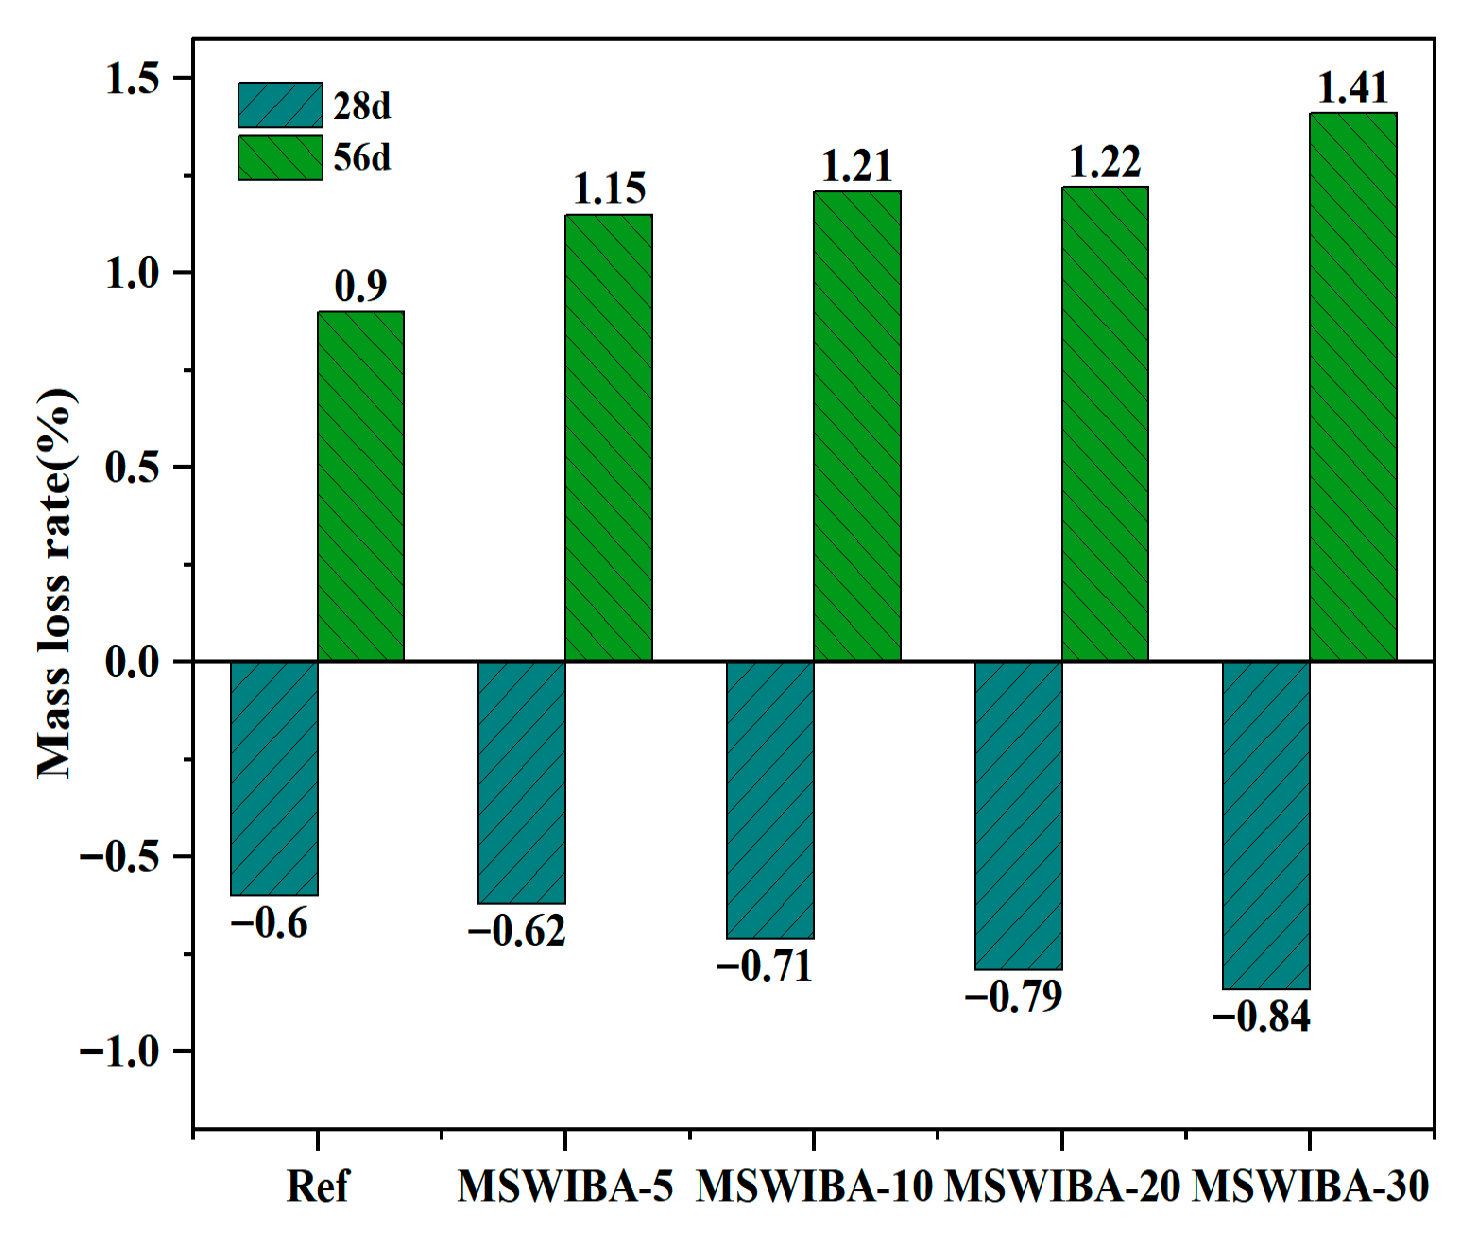
The mass loss rate test results of UHPC under NaCl erosion with varying MSWIBA replacement rates are shown in
Figure 11. After being immersed in NaCl solution for 28 days, the mass loss rate of the UHPC was negative. Compared to the test blocks immersed in clean water, the mass of the Ref, MSWIBA-5, MSWIBA-10, MSWIBA-20, and MSWIBA-30 test blocks increased by 0.60%, 1.15%, 1.21%, 1.22%, and 1.41%, respectively.
The reason for the observed mass increase was that MSWIBA possessed a porous structure, which allowed NaCl solution to rapidly infiltrate the material via capillary action, thereby accelerating chloride ion diffusion. Additionally, MSWIBA absorbed water, contributing to mass accumulation. A higher MSWIBA dosage enhanced pore connectivity, increasing both chloride and water absorption, which in turn led to a greater mass increase. Furthermore, MSWIBA contained a small amount of Cl− that reacted with C3A in the cement to form Friedel’s salt, resulting in localized mass gain.
At 56 days curing age, the mass loss rate of UHPC was positive and increased with the MSWIBA replacement rate. This was due to the increased porosity within the UHPC as the MSWIBA replacement rate rose, which facilitated greater chloride ion penetration and higher concentrations. High Cl− concentrations could interact with Ca2+ in the C-S-H gel, disrupting the gel network structure and reducing the amount of hydration products, thereby increasing the mass loss rate. Additionally, Cl− reacted with C3A in the cement to form Friedel’s salt. Excess Cl− led to the supersaturation and precipitation of Friedel’s salt, which promoted the continued dissolution of C3A and the formation of pores. Simultaneously, the crystallization expansion of the supersaturated Friedel’s salt induced internal expansion and cracking in the UHPC, leading to surface spalling and mass loss. Additionally, a high concentration of Cl− formed an osmotic pressure gradient in the pore solution, which also contributed to internal micro-crack propagation. Consequently, a higher MSWIBA replacement rate resulted in greater porosity within the UHPC and a faster corrosion rate.
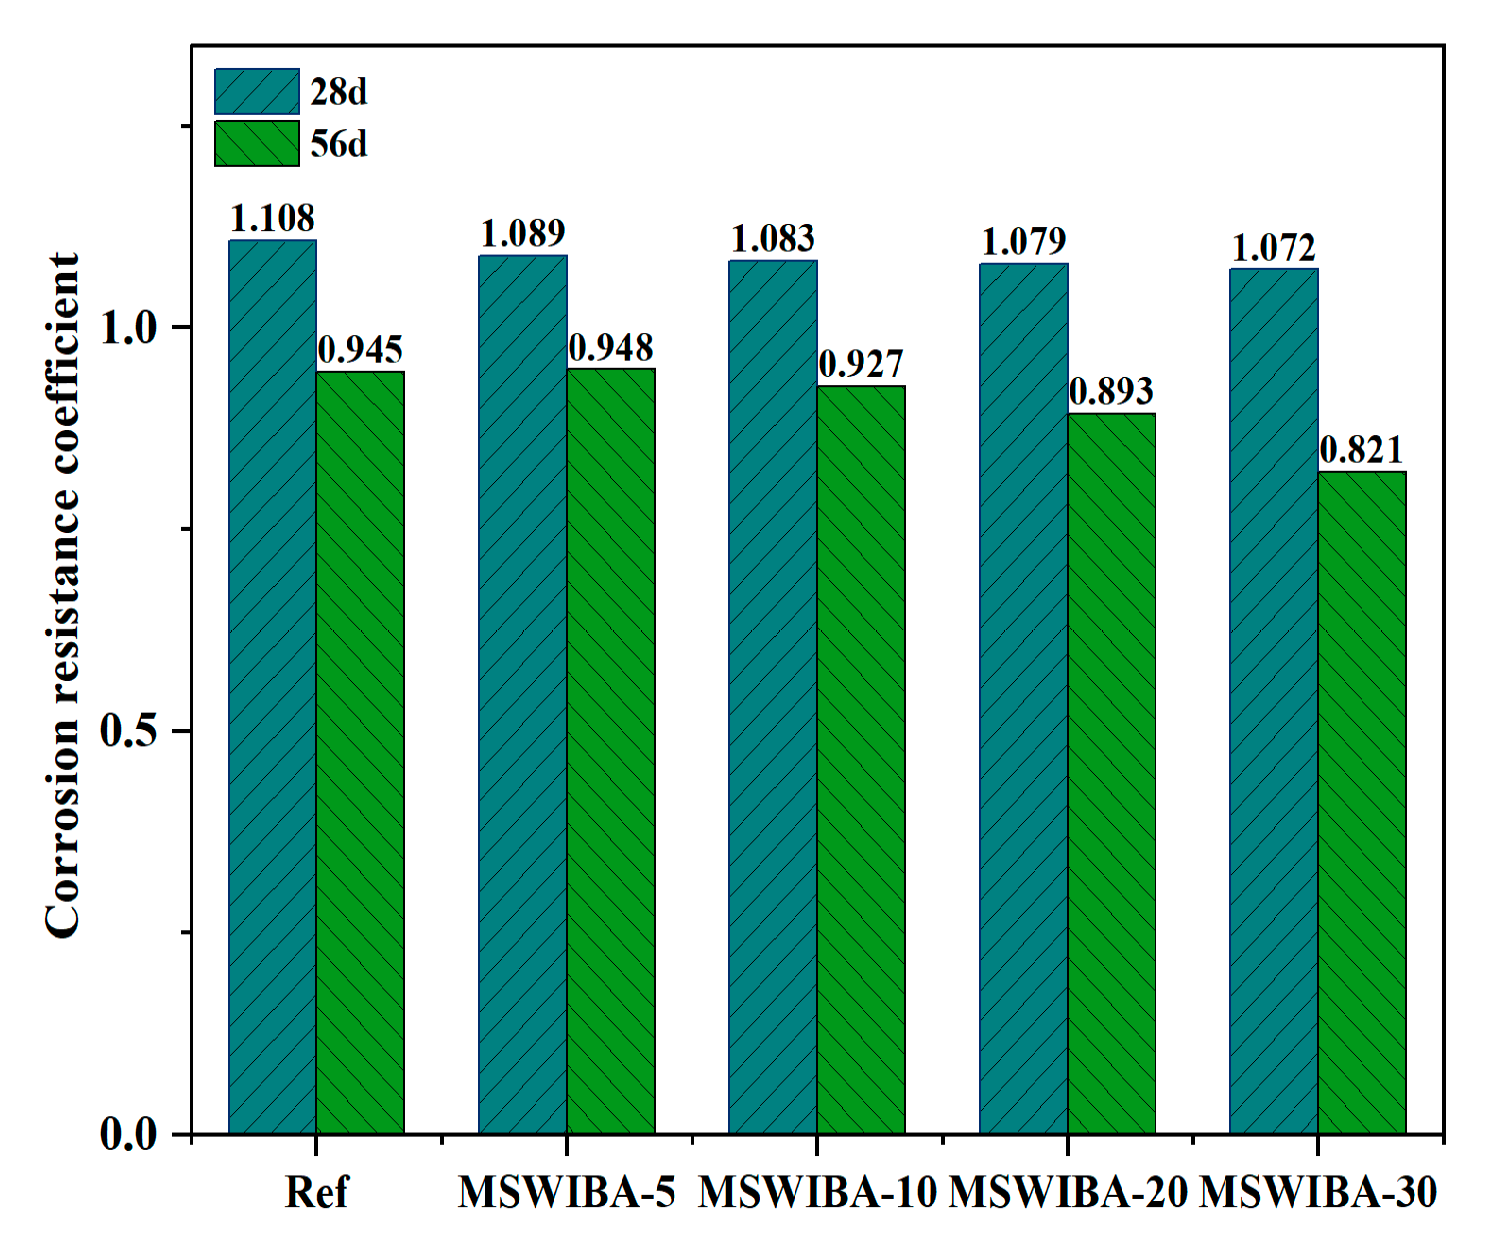
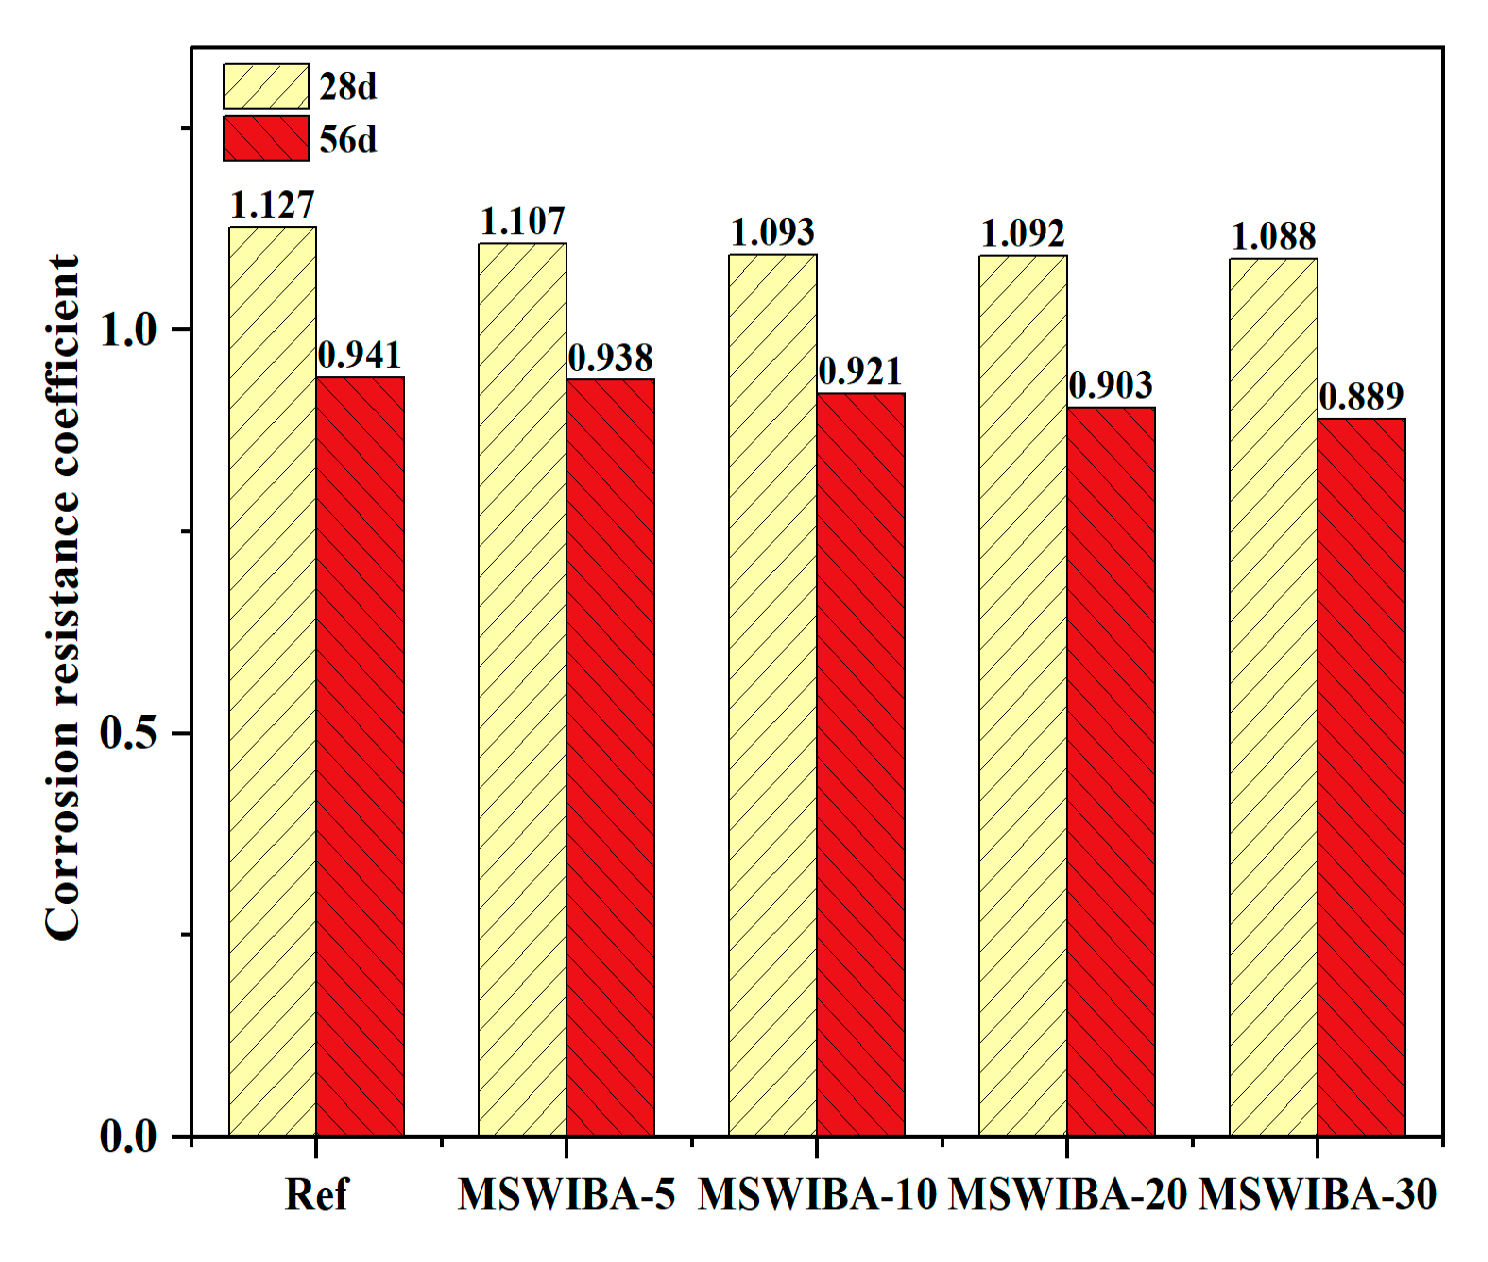
The corrosion resistance coefficient test results of UHPC under different MSWIBA replacement rates are shown in
Figure 12. As illustrated, after 28 days of NaCl erosion, the corrosion resistance coefficient was greater than 1, indicating that the compressive strength of UHPC with varying replacement rates was higher than that of the reference sample immersed in clean water. Moreover, the higher the MSWIBA replacement rate, the lower the corrosion resistance coefficient. However, when NaCl erosion lasted for 56 days, the corrosion resistance coefficient was less than 1, indicating that the compressive strength of UHPC at different replacement rates was lower than that of the reference specimens placed in clean water. The corrosion resistance coefficient at a 5% replacement rate was greater than that of the reference group with a 0% replacement rate. However, when the MSWIBA replacement rate exceeded 5%, the corrosion resistance coefficient gradually decreased.
The increase in 28-day compressive strength was due to the displacement reactions of interlayer anions (such as SO42−, CO32−, and OH−) in monosulfate hydrated calcium sulfoaluminate (AFm) with Cl−, leading to the formation of Friedel’s salt. Additionally, C3A in the cement or unhydrated aluminates directly reacted with Cl− to form Friedel’s salt. The layered structure of AFm achieved charge balance by adsorbing anions (such as Cl−), and after Cl− entered the interlayer, they formed solid solutions with the original anions and combined with water molecules via hydrogen bonds to form stable Friedel’s salt, temporarily filling pores and inhibiting ion migration. However, as the curing age increased, Cl− continued to penetrate through the pores, generating excessive amounts of Friedel’s salt, which expanded and led to a decrease in the compressive strength of UHPC.
At a 5% replacement rate, MSWIBA introduced an appropriate amount of internal porosity into UHPC, which effectively alleviated expansion stress compared to the reference group, as indicated by a higher corrosion resistance coefficient. However, when the replacement ratio exceeded 5%, the increased MSWIBA content led to a more interconnected capillary pore network, significantly increasing the Cl− diffusion coefficient. Additionally, the lower intrinsic strength of MSWIBA contributed to a gradual decline in the Cl− resistance of UHPC. Notably, even at a 10% replacement ratio, the 56-day compressive strength of UHPC after NaCl exposure remained above 120 MPa, satisfying the mechanical performance requirements for UHPC.
3.3.3. Resistance to Sulfate Attack
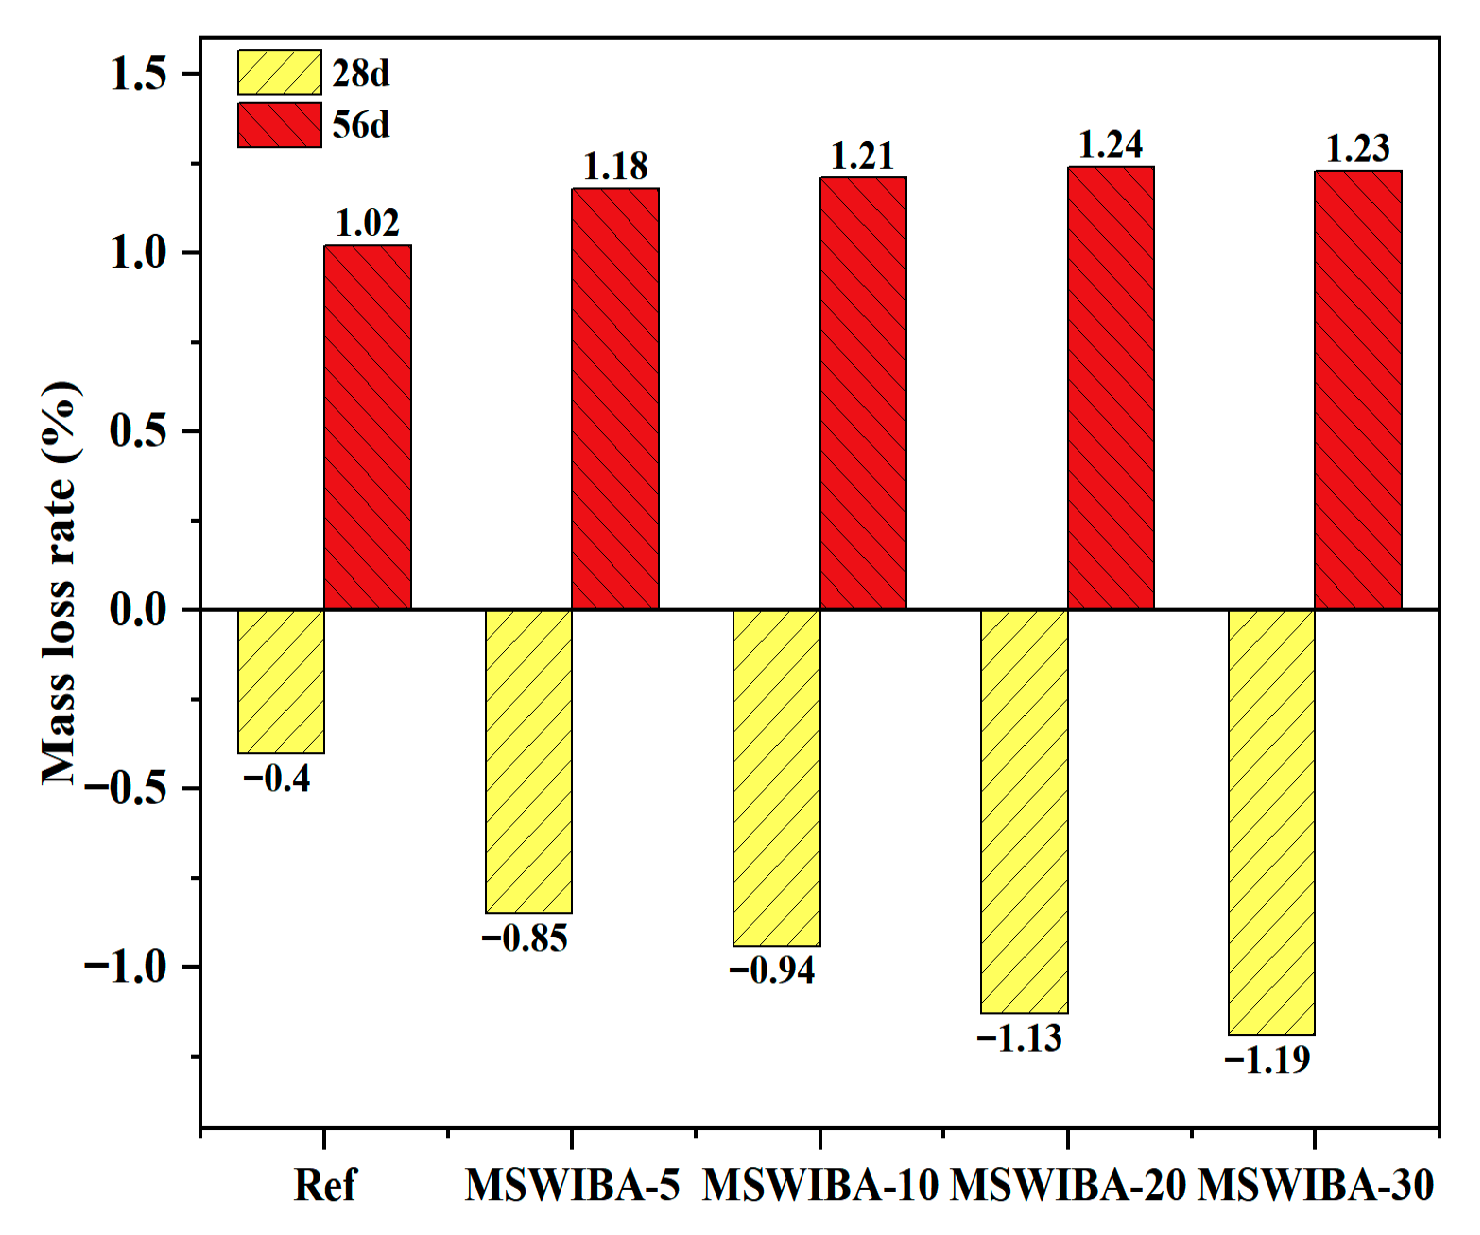
The mass loss rate of UHPC soaked in sodium sulfate solution is shown in
Figure 13. At 28 days curing age, the mass of Ref, MSWIBA-5, MSWIBA-10, MSWIBA-20, and MSWIBA-30 samples increased by 0.40%, 0.85%, 0.94%, 1.13%, and 1.19%, respectively, compared to the mass of the sample soaked in clean water. This was attributed to the porous structure of MSWIBA, which adsorbed water and ions (SO
42−, Na
+) from the sodium sulfate solution, contributing to the observed mass gain. Additionally, sodium sulfate reacted with the hydration product Ca(OH)
2 from the cement to form Ettringite (AFt), which temporarily filled the pores and adsorbed the solution, further supporting the initial mass increase. At 56 days curing age, the mass of Ref, MSWIBA-5, MSWIBA-10, MSWIBA-20, and MSWIBA-30 samples soaked in sodium sulfate solution decreased by 1.02%, 1.18%, 1.21%, 1.24%, and 1.23%, respectively, compared to the sample in the clean water group. This was due to the continuous formation of AFt within the pores, which generated crystallization pressure and induced microcrack propagation. Once the cracks interconnected, the surface material spalled off, resulting in mass loss.
The corrosion resistance coefficient of the samples immersed in sodium sulfate solution is shown in
Figure 14. As illustrated, after 28 days of sodium sulfate erosion, the corrosion resistance coefficient was greater than 1, indicating that the compressive strength of UHPC with varying replacement rates was higher than that of the reference specimens in clean water. Furthermore, a larger MSWIBA replacement rate corresponded to a smaller corrosion resistance coefficient. After 56 days of sodium sulfate erosion, the corrosion resistance coefficient was less than 1, indicating that the compressive strength of UHPC with different replacement rates was lower than that of the reference specimens in clean water. Similarly, the greater the MSWIBA substitution rate, the smaller the corrosion resistance coefficient.
The reaction between sodium sulfate and the cement hydration product Ca(OH)2, which produced compounds such as AFt. These compounds initially filled the pores, enhancing compactness and temporarily improving mechanical properties. However, as the curing age extended, SO42− continued to penetrate, leading to excessive AFt formation. These products accumulated within the pores, generating expansive stress and initiating microcrack propagation. Simultaneously, the continuous permeation of sodium sulfate led to the decalcification of the C-S-H gel, further contributing to the reduction in compressive strength. However, with an increasing MSWIBA dosage, the corrosion resistance coefficient of the UHPC at 56 days of curing age remained stable at approximately 0.90, showing minimal variation compared to the 0% replacement rate reference group. This indicates that within the dosage range of this experiment, MSWIBA had a negligible impact on the sulfate erosion resistance of UHPC. Combined with the evolution of the mass loss rate, the UHPC exhibited good resistance to SO42− erosion.
3.4. Microscopic Test Analysis of UHPC
3.4.1. XRD
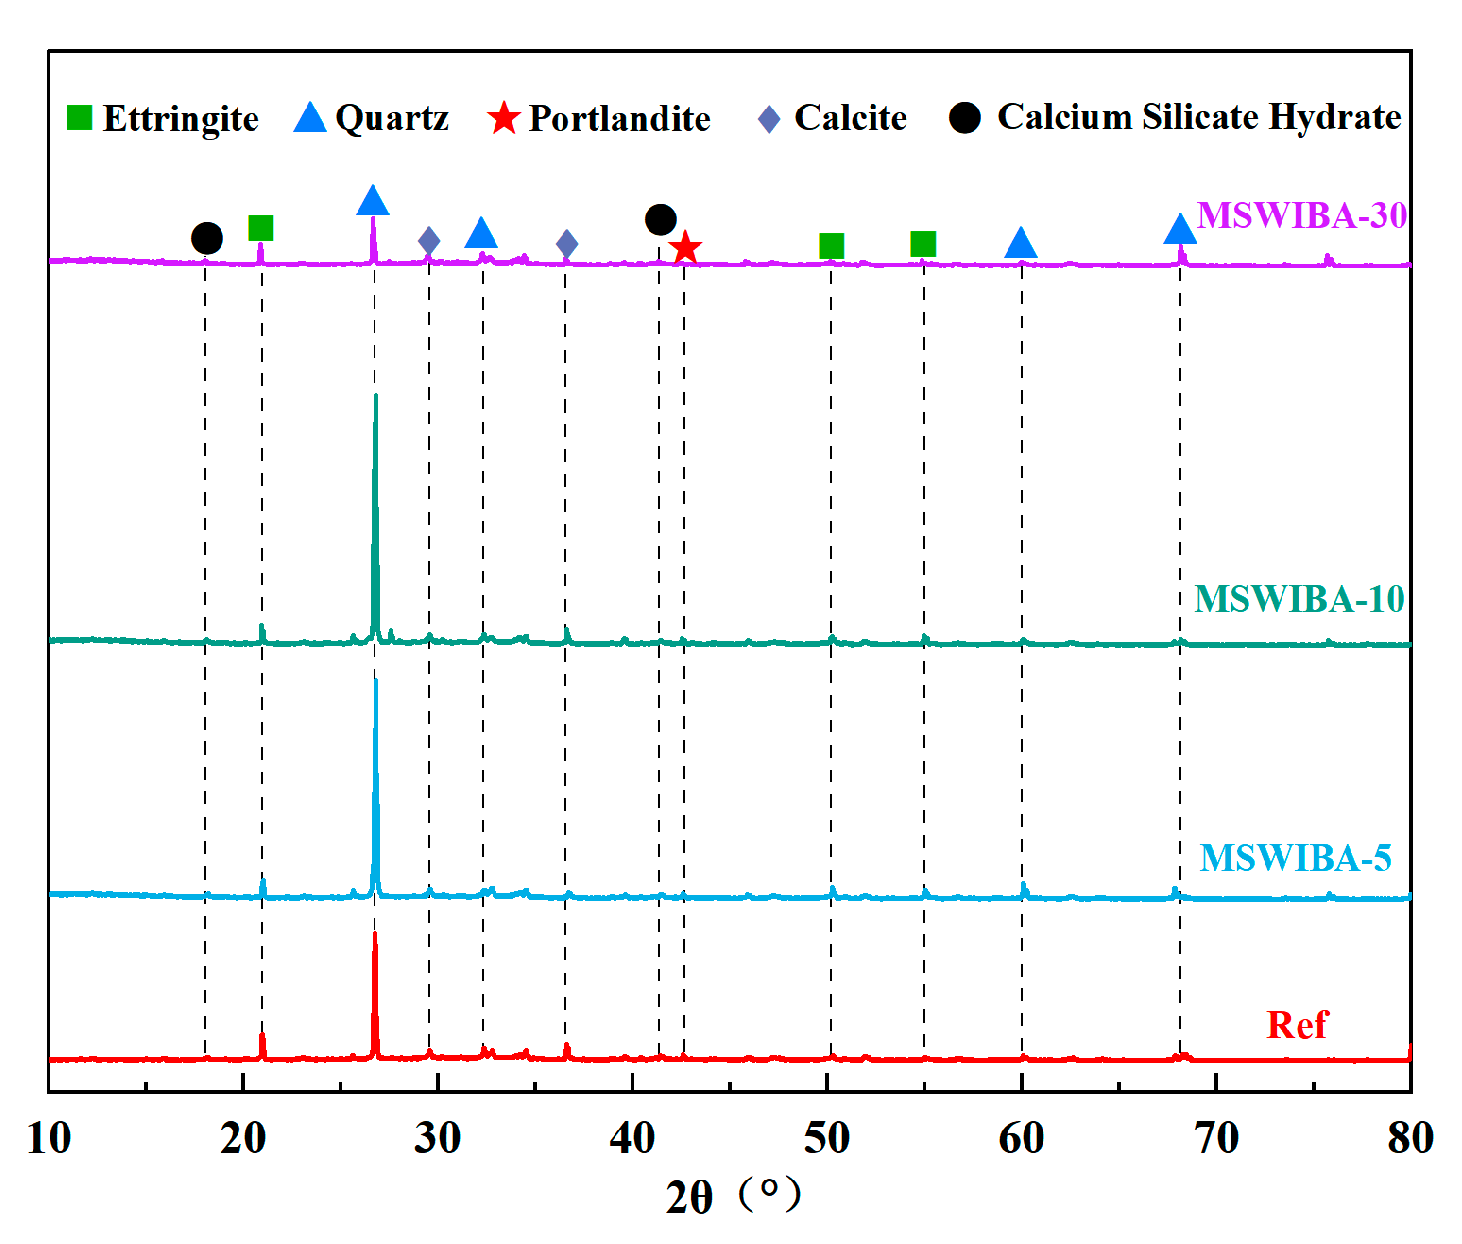
The XRD test results of UHPC samples with varying MSWIBA replacement rates are shown in
Figure 15. As illustrated, the phase composition of all samples remained consistent, with the primary mineral phases identified as ettringite, quartz, calcite, calcium hydroxide, and calcium silicate hydrate. With the gradual increase in MSWIBA replacement rate, the diffraction peaks corresponding to calcium hydroxide and AFt progressively weakened, and some peaks were no longer observable in the MSWIBA-30 group. The observed phenomenon indicated that the pozzolanic activity of MSWIBA promoted the consumption of calcium hydroxide and altered the composition of hydration products. Concurrently, the competitive adsorption of free water by MSWIBA particles reduced the effective water available for the hydration of C
3S and C
3A, thereby decreasing the formation of AFt and C-S-H gel. The sharp silicon dioxide diffraction peak observed in the figure originated from the quartz present in the raw materials. Compared with the reference group, the intensity of the silicon dioxide diffraction peak in the MSWIBA-30 group was significantly lower, which was directly related to the reduced quartz content.
3.4.2. TG/DTA
The TG and DTA curves of Ref, MSWIBA-5, MSWIBA-10, and MSWIBA-30 specimens are shown in
Figure 16. From the TG curves in
Figure 16, it could be observed that as the temperature increased, the mass loss of UHPC gradually increased due to water evaporation and the decomposition of chemical components. The mass loss rates for the Ref, MSWIBA-5, MSWIBA-10, and MSWIBA-30 groups were 12.53%, 12.70%, 11.97%, and 13.07%, respectively. The total mass loss rate of the MSWIBA-30 group increased by only 9.19% compared with the Ref group. And the overall mass loss of UHPC under different MSWIBA substitution rates was relatively small at high temperatures, indicating that UHPC exhibited good thermal stability.
As shown in
Figure 16, the heating process of UHPC exhibited three distinct thermal peaks. The first peak occurred between 50 and 150 °C, primarily associated with the loss of free water and physically adsorbed water from the UHPC matrix, as well as chemically bound water from C-S-H gel and AFt. The MSWIBA-5 group showed a more pronounced mass loss at this peak, likely due to the high porosity of MSWIBA, which enhanced the adsorption of free water and accelerated initial weight loss. However, as the MSWIBA replacement increased, compared with inert QS, MSWIBA can participate in the secondary hydration reaction to generate more hydration products, which reduces the overall porosity and significantly reduces the capacity of physically adsorbed water. The second peak appeared between 380 and 430 °C, mainly due to the dehydration of C-S-H gel. C-S-H gel not only significantly contributed to the early strength of UHPC but also played a crucial role in the compactness of its microstructure and its long-term performance. Generally, a higher content of C-S-H gel was more favorable for strength development. The peak near 415 °C changed with increasing MSWIBA replacement, indicating that MSWIBA affected the amount of C-S-H gel formed and changed the formation of hydration products. The third peak, occurring between 600 and 850 °C, corresponded to the decomposition of CaCO
3. The higher mass loss rate observed in UHPC with MSWIBA at this peak may be attributed to the presence of carbonates within the MSWIBA.
3.4.3. SEM
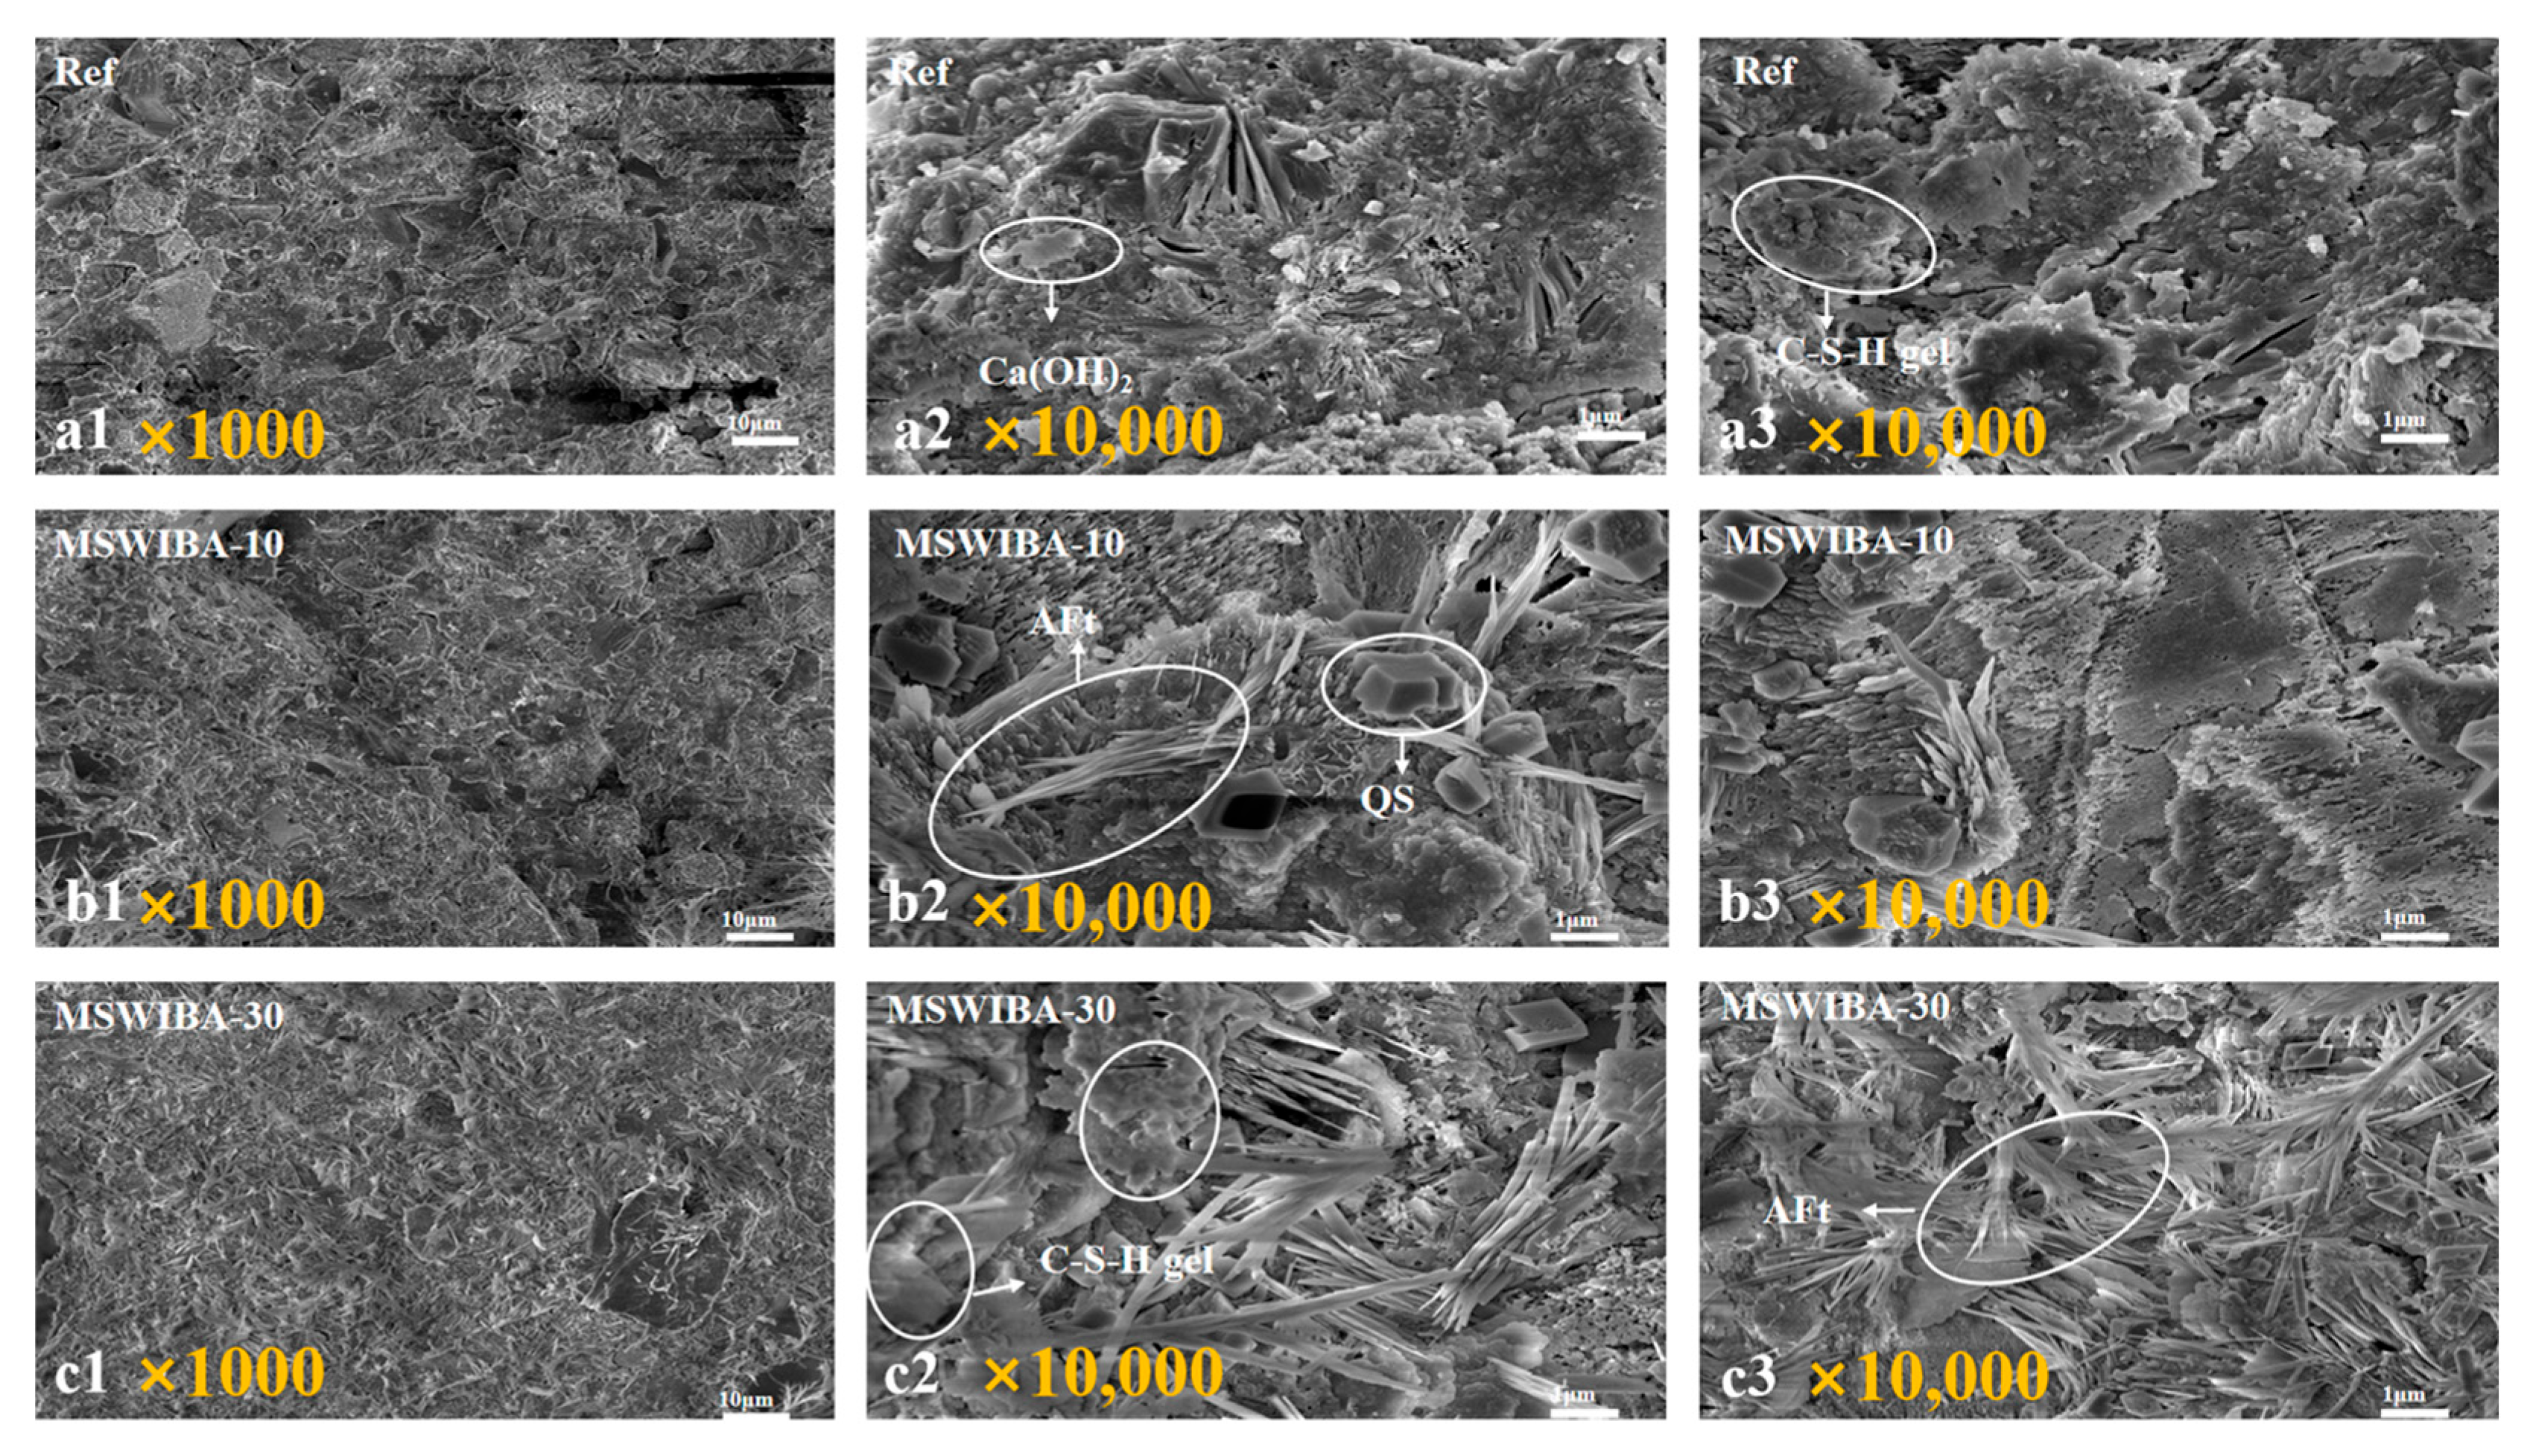
Figure 17 show the microstructures of the Ref, MSWIBA-10, and MSWIBA-30 specimens at different magnifications at 28 days of age, respectively.
Figure 17(a2,a3) showed that the interior of the reference specimen was primarily composed of a three-dimensional, interconnected flocculent C-S-H gel, interwoven and layered with plate-like Ca(OH)
2 crystals. The presence of Ca(OH)
2 provided a strongly alkaline environment, which helped maintain the stability of the rebar passive film and improved the carbonation resistance of the UHPC, ultimately ensuring the composite’s durability. Quartz, on the other hand, exhibited a multifaceted morphology with sharp edges. It physically interlocked with the cement matrix and bonded to it through van der Waals forces, ensuring the volume stability of the UHPC. Its low porosity also meant it rarely participated in any harmful physical and chemical reactions and provided no migration pathway for aggressive media such as chloride or sulfate ions. As shown in
Figure 17(b1–b3), at a 10% MSWIBA replacement ratio, the overall structure of the sample was relatively dense, with visible needle-like ettringite (AFt) crystals, pores, and QS within. However, compared to the reference sample, the formation and distribution of the C-S-H gel were less uniform. Macroscopically, the MSWIBA-10 sample exhibited a decrease in both compressive and flexural strength compared to the reference sample.
Figure 17c shows that when the MSWIBA replacement ratio increased to 30%, the needle-like AFt content in the sample increased significantly. Simultaneously, the C-S-H gel network transformed from a flocculated structure to a highly porous microstructure, with visible pores appearing in certain areas. Compared to the 10% MSWIBA replacement group, the 30% replacement group showed a significant increase in both the number of needle-like AFt and the extent of the loose, lamellar C-S-H gel structure. However, the C-S-H gel was a key phase influencing the durability of UHPC. As the primary barrier against carbonization, chloride attack, and sulfate intrusion, the dense, well-developed C-S-H network effectively blocked the intrusion of water and aggressive ions. Macroscopically, the MSWIBA-30 specimen exhibited a significant decrease in both compressive and flexural strength compared to the reference specimen.
The primary reason for the observed microstructural and mechanical behavior is the presence of reactive SiO2 and Al2O3 in MSWIBA, which undergoes a secondary pozzolanic reaction with the hydration product Ca(OH)2 from cement, forming a low Ca/Si ratio C-S-H gel. This reaction significantly reduced the number of plate-like Ca(OH)2 crystals. Meanwhile, the low Ca/Si ratio C-S-H gel exhibited higher interlayer water content and weaker pore-filling capacity compared to the reference group, leading to a looser, flakier structure. As the MSWIBA replacement rate increased, the soluble sulfates within it reacted with C3A in the cement, generating needle-rod-shaped AFt. Concurrently, the high porosity and irregular morphology of MSWIBA particles increased the proportion of connected pores with rising replacement rates, accelerating moisture and ion migration. This exacerbated AFt expansion and the loosening of the C-S-H structure, which correlated with the downward trend in mechanical properties.
In addition to qualitative analysis of the sample microstructure through SEM testing, quantitative image analysis is an effective method for characterizing microstructural degradation. For example, DeepLab [
53] can accurately identify and segment microscopic features (such as pores, cracks, and different phases) in images, which is suitable for quantifying porosity and phase distribution. EfficientNet [
54] can quickly identify and classify microstructural defects (such as flaky C-S-H and AFt crystals). Subsequent research will use a combination of qualitative and quantitative methods to further reveal the impact of sample microstructure on macroscopic properties.
3.5. Heavy Metal Immobilization Performance Analysis of UHPC
The Inductively Coupled Plasma (ICP) testing results of UHPC are presented in
Table 5. As shown, when the MSWIBA replacement rate is within 30%, the UHPC specimens exhibited a good immobilization effect on heavy metals such as Pb, Cr, Cd, and Cu, and the heavy metal leaching concentrations are all lower than the national safety standard limit. However, the stability of heavy-metal leaching still requires long-term monitoring. First, the primary hydration product, C-S-H gel, immobilized heavy metal ions through surface complexation with oxygen atoms, forming inner-sphere complexes with high-valent metal ions such as Pb
2+ and Cr
3+. Additionally, interlayer Ca
2+ underwent substitution reactions with lower-valent ions such as Cu
2+ and Zn
2+, and was embedded within the gel structure. Furthermore, the growth of needle-like AFt crystals encapsulates heavy metals within pores or grain boundaries, thereby inhibiting their leaching.
The test results indicated that when the MSWIBA replacement rate was within 30%, the hydration products in the hardened UHPC effectively immobilized heavy metals, ensuring that the leaching concentrations remained within safe limits. Meanwhile, when the MSWIBA replacement rate is within 10%, the compressive strength of UHPC is 128.67 MPa, which is higher than the mechanical performance standard of 120 MPa and meets the strength requirements of UHPC. When the MSWIBA replacement rate is within 30%, the compressive strength of UHPC is about 100 MPa, which meets the strength requirements of HPC. Considering the balance between physical mechanical properties and durability, the UHPC with a 10% MSWIBA replacement rate demonstrated the most optimal performance and is therefore selected as the preferred option.
3.6. Integrated Ecological-Economic Analysis of UHPC
The Material Sustainability Index (MSI) is a parameter used to evaluate the environmental impact and economic performance of materials throughout their life cycle. In the application of UHPC, the MSI was employed to comprehensively assess its performance in terms of energy consumption, carbon footprint, and cost, thereby determining its sustainability. Energy consumption refers to the energy demand during the production, transportation, and use of UHPC, while the carbon footprint is a key indicator measuring greenhouse gas emissions throughout the life cycle of UHPC. Economic performance encompasses factors such as raw material cost, production cost, transportation cost, and maintenance cost. Following the ISO 14040/44 guidelines, the MSI weights were assigned as 50% environmental, 30% mechanical and 20% economic.
The carbon emissions and energy consumption data for the cement, silica fume, slag, MSWIBA, QS, and water used in the experiment were obtained from the literature [
55,
56,
57,
58]. The raw material cost is mainly based on the specific situation in Kaifeng City, China. In addition, according to previous studies by Fan et al. [
56], MSWIBA, as a product of MSWI, does not generate energy consumption and carbon emissions. The energy consumption, carbon emissions, and cost of raw materials are shown in
Table 6.
Table 7 shows the environmental impact and economic cost of producing 1 kg of UHPC at different MSWIBA replacement rates.
As shown in
Table 7, the incorporation of MSWIBA significantly reduced the raw material cost, while its impact on carbon emissions and energy consumption was relatively minor. This was primarily due to the high environmental and energy costs associated with the extensive use of cement-based materials in UHPC, whereas MSWIBA, serving as a substitute for aggregate, contributed to a lower overall environmental footprint. Additionally, since the QS used in UHPC was a non-renewable resource, the large-scale utilization of MSWIBA, as a product of MSWI, substantially reduced the demand for QS.
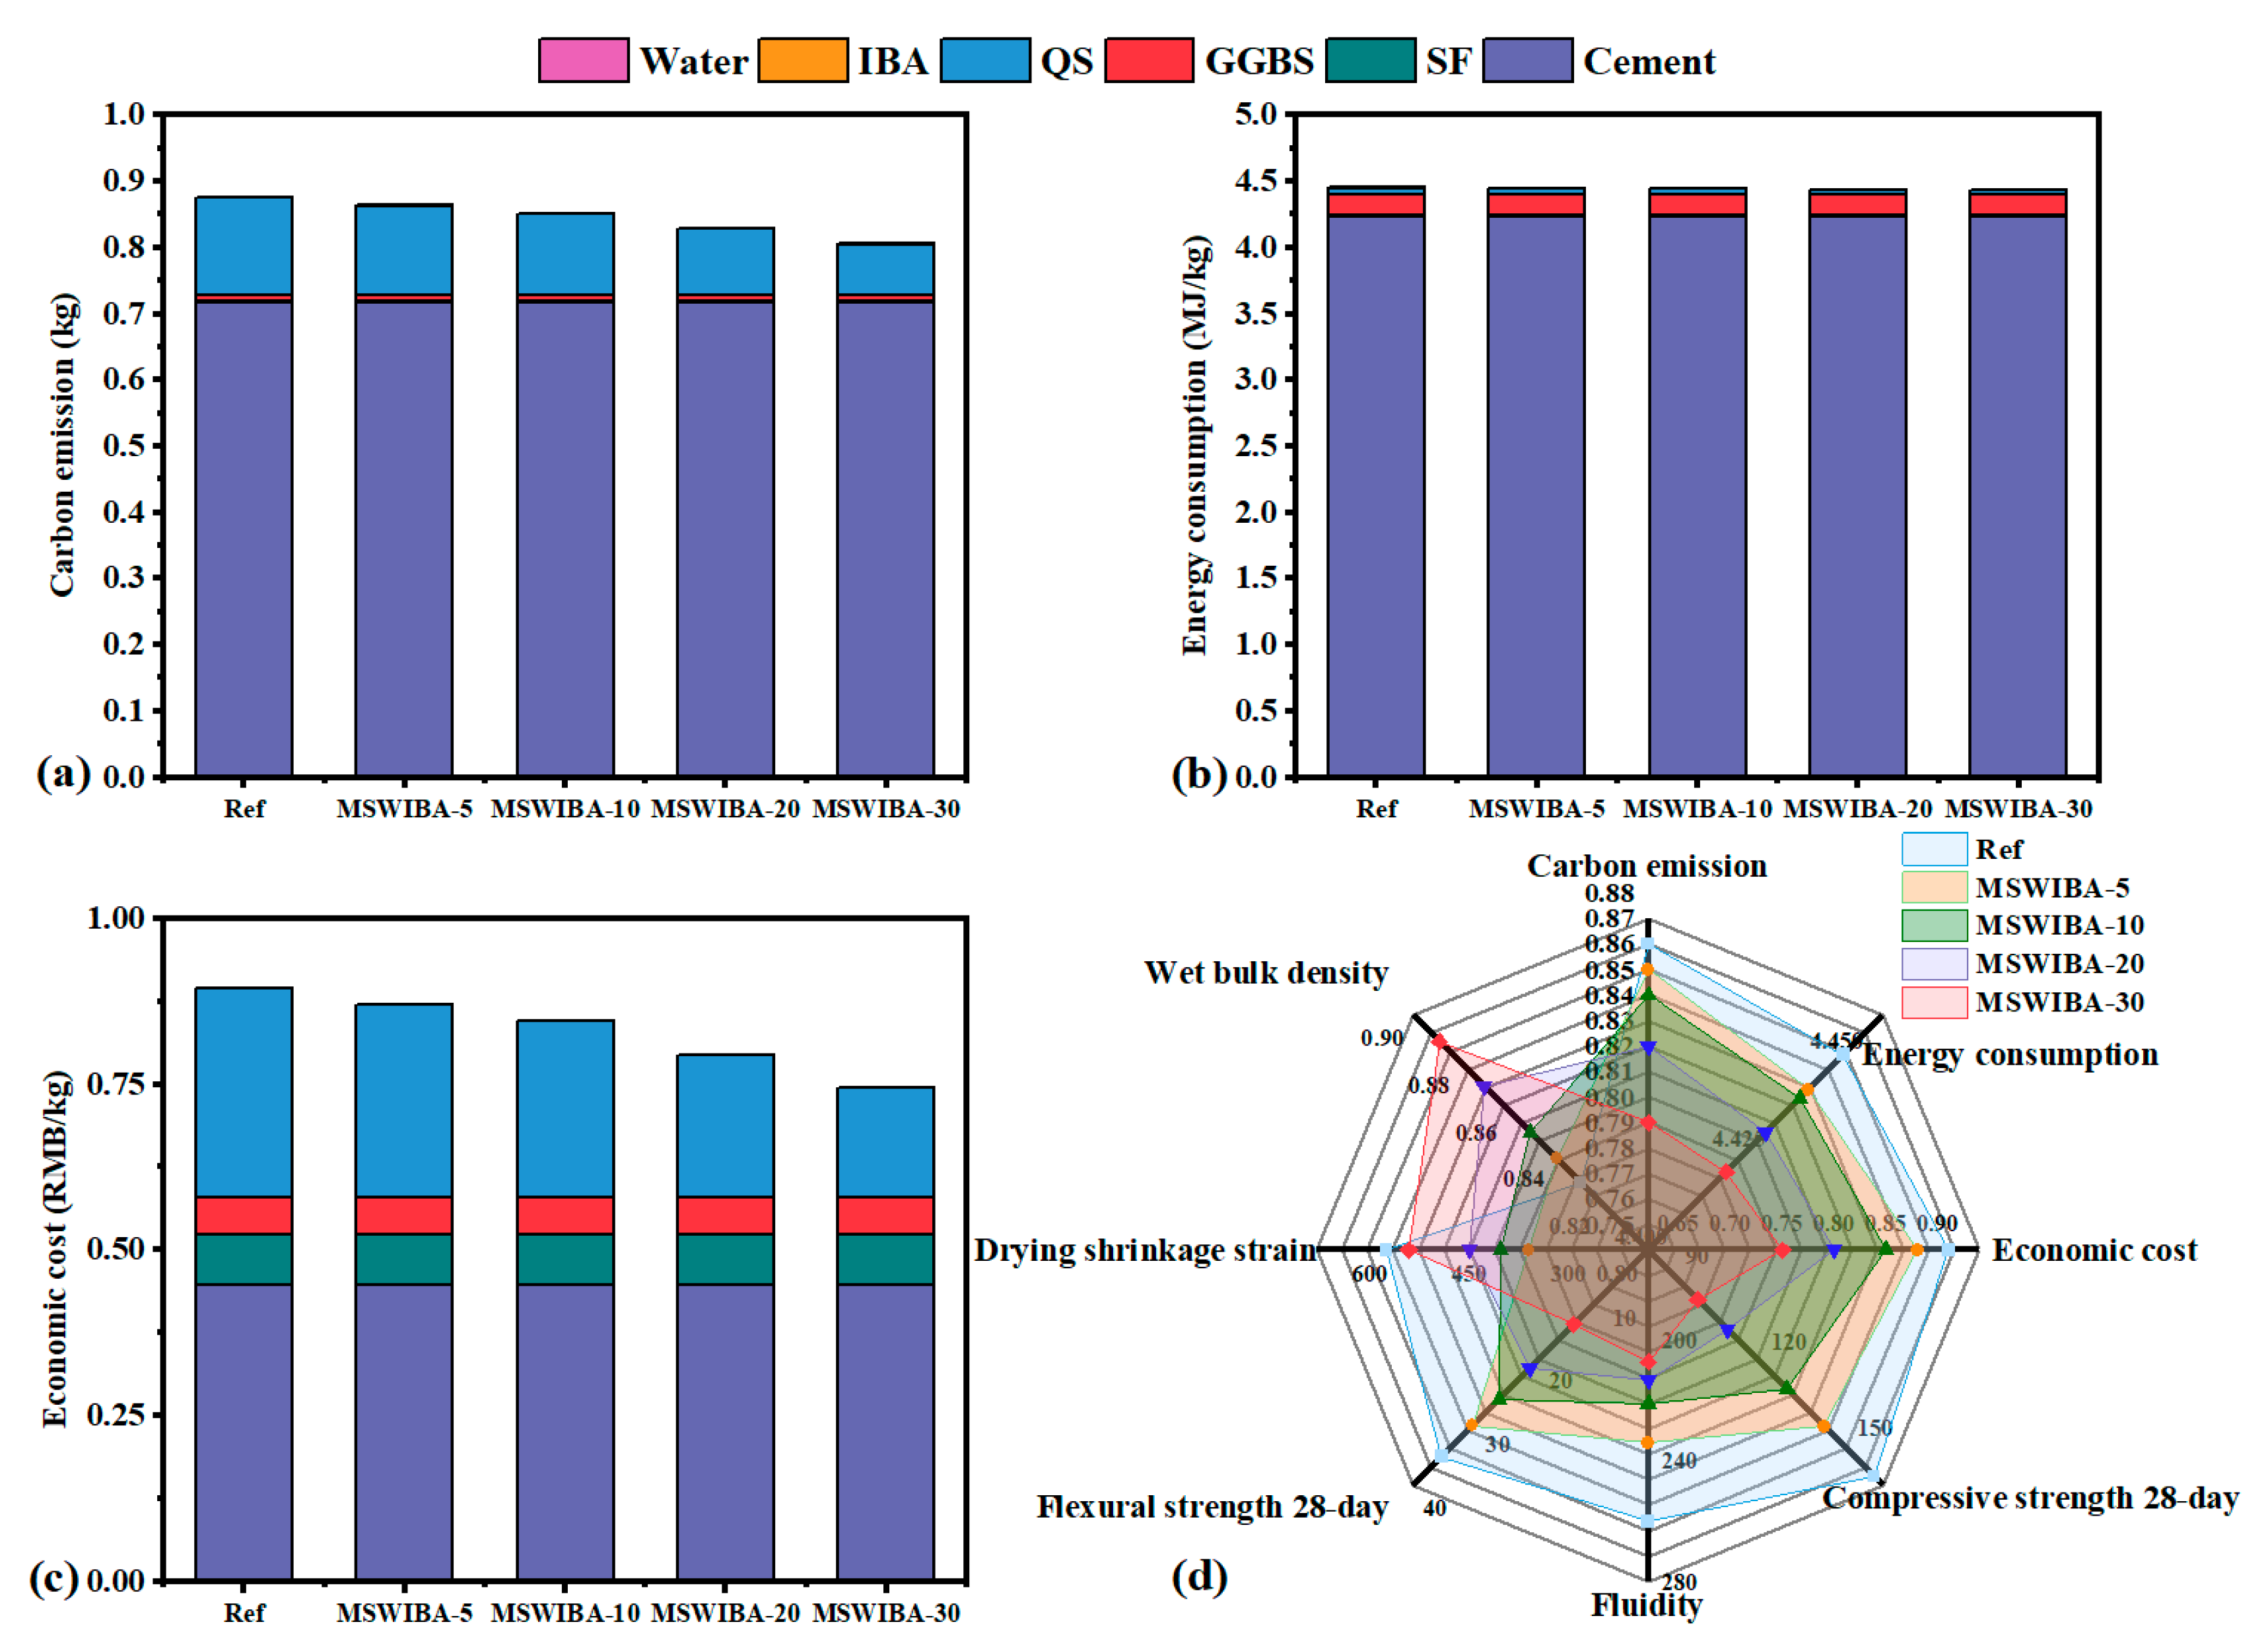
The comparison of carbon emissions, energy consumption, and economic cost of UHPC with varying MSWIBA content is illustrated in
Figure 18a–c. In the reference group, cement accounted for 82.30% of carbon emissions and 95.17% of energy consumption. As the MSWIBA content increased, carbon emissions, energy consumption, and economic cost gradually decreased. Compared to the reference group, the total carbon emissions of the MSWIBA-5, MSWIBA-10, MSWIBA-20, and MSWIBA-30 groups were reduced by 1.15%, 2.30%, 4.60%, and 8.05%, respectively, reflecting the difference in carbon neutrality status between MSWIBA and the significant emission factor of QS. The total economic cost was reduced by 2.56%, 6.41%, 12.82%, and 19.23% at MSWIBA replacement rates of 5%, 10%, 20%, and 30%, respectively. The findings align with the work of Tang et al. [
59], which demonstrated the benefits of using industrial byproducts in cement-based systems.
In general, the use of MSWIBA instead of QS in traditional UHPC can achieve effective disposal and utilization of hazardous waste resources while ensuring the performance of UHPC, reduce resource consumption, and significantly reduce carbon emissions. It has good economic and environmental benefits, promotes the advancement of green and low-carbon building practices, and provides strong support for achieving sustainable development goals.
The radar chart in
Figure 18d compares the comprehensive performance of Ref, MSWIBA-5, MSWIBA-10, MSWIBA-20, and MSWIBA-30. MSWIBA-10 exhibited better comprehensive performance in terms of carbon emissions, energy consumption, economic cost, 28-day compressive strength, 28-day tensile strength, drying shrinkage performance, and wet packing density. The mechanical performance of the concrete deteriorated as the MSWIBA replacement rate increased. Conversely, the performance of UHPC improves with an increasing MSWIBA replacement rate in terms of carbon emissions, energy consumption, and economic cost. Therefore, when the MSWIBA substitution rate is within 30%, UHPC or HPC with comprehensive performance that meets the requirements can be obtained. The research results of this paper can provide a reference for the low-carbon ecological sustainability of UHPC and the efficient resource utilization of MSWIBA.
4. Conclusions
This study investigated the feasibility of utilizing MSWIBA as a partial substitute for QS in UHPC, with a focus on its impact on physical properties, mechanical properties, durability, and sustainability. The experimental results lead to the following key conclusions.
- (1)
MSWIBA exhibits a high-porosity microstructure and low pozzolanic activity. Its use as a QS replacement reduces UHPC fluidity, prolongs setting time, and increases wet packing density.
- (2)
Replacing QS with MSWIBA negatively affects mechanical properties. At 5% and 10% replacement, 28-day compressive strengths reached 141.7 MPa and 128.7 MPa, and flexural strengths reached 30.7 MPa and 26.5 MPa, respectively, meeting UHPC requirements. At 20% and 30%, compressive strengths were 107.7 MPa and 97.3 MPa, and flexural strengths were 21.7 MPa and 14.7 MPa, respectively. It can meet the mechanical properties requirements of HPC within a 30% replacement rate.
- (3)
Due to its water retention and internal curing effects, MSWIBA significantly reduces drying shrinkage. However, after 56 days of chloride and sulfate exposure, mass loss and strength reduction indicate progressive degradation. While early-age resistance improves within 30% replacement, long-term durability under ionic attack remains insufficient.
- (4)
The incorporation of MSWIBA as a partial replacement for QS in UHPC production results in a reduction in energy consumption, carbon emissions, and costs by 0.22–0.67%, 1.15–8.05%, and 3.33–17.78%, respectively. This strategy enhances both environmental and economic benefits, supporting resource recycling and cost control and promoting green transformation in UHPC.
When the MSWIBA replacement ratio is less than 10% and 30%, respectively, MSWIBA-UHPC and MSWIBA high-performance concrete (MSWIBA-HPC) with excellent overall performance can be achieved. However, untreated MSWIBA contains harmful components (such as heavy metals, chloride salts, and unburned organic matter), which can affect durability and pose environmental risks such as steel corrosion and heavy metal leaching. We recommend pretreatment of MSWIBA, such as water washing, before UHPC production to remove soluble salts and some heavy metals, thereby reducing the risks of heavy metal leaching and steel corrosion. Based on this, further research is recommended to optimize UHPC formulation parameters, such as reducing the water–binder ratio and using high-efficiency water reducers. Furthermore, we recommend further clarifying the applicable scenarios for this environmentally friendly UHPC.
In summary, the utilization of MSWIBA as a replacement for QS in UHPC meets the performance requirements of the concrete. Additionally, this approach significantly enhances environmental sustainability and reduces economic cost, thereby fostering the sustainable development of UHPC.
