Abstract
In urban redevelopment, adding basements beneath existing buildings often requires specialized retaining structures, such as existing and newly added double-row piles, yet their complex load-sharing mechanism is not yet fully understood. This study addresses this gap through a series of physical model tests, systematically investigating the influence of two key variables: the row spacing and the newly added/existing pile length ratio. The results reveal that row spacing is a critical factor governing the system’s stability and cooperative behavior. The newly added piles bear the majority of the earth pressure, effectively shielding the existing piles. A distinct, layered pressure distribution was observed in the inter-row soil, a phenomenon that classical earth pressure theories cannot adequately predict. Based on a comprehensive evaluation of structural performance, deformation control, and stability, this study proposes an optimized configuration with a row spacing of 4D and a newly added/existing pile length ratio of 9/6. This configuration achieves an effective balance between structural performance and economic efficiency, offering valuable practical guidance for the design of supplementary retaining systems in basement addition projects.
1. Introduction
In recent years, the development and utilization of urban underground space in China have entered a new phase, driven by technological innovation and the demand for high-quality urban growth. As cities undertake extensive and multilayered underground construction projects, the limitations of existing basement space beneath buildings have become increasingly apparent. In response to these limitations, implementing vertical expansion via basement addition beneath existing buildings has become an important redevelopment strategy [1,2,3,4]. Nevertheless, the complex structural interaction and load-sharing mechanisms of retaining systems in such contexts pose notable engineering challenges, continuing to attract attention as a central issue in geotechnical engineering research [5,6,7].
Previous research on basement construction beneath existing buildings, both in China and abroad, has primarily concentrated on techniques such as pile underpinning, building relocation, and excavation support in confined urban environments [8]. In recent years, numerous successful case studies have been documented [9,10,11]. For instance, Gong et al. investigated the bearing performance of single piles under excavation conditions by combining finite element simulations and theoretical analysis, drawing on data from the Zhejiang Hotel basement addition project [12,13]. The original building, completed in 1997 with a footprint of approximately 2600 m2, initially included a single-level basement excavated to a depth of 5 m. A subsequent 6.5 m-deep basement was later constructed beneath the original structure [14]. The basement addition project employed a two-stage support scheme: new retaining structures were erected beyond the existing ones before proceeding with deeper excavation.
This approach often leads to the formation of a double-row pile system. Compared to single-row pile systems, traditional double-row pile structures exhibit more intricate earth pressure distributions and superior stability, making them widely used in deep excavations [15,16,17,18,19]. However, under basement addition conditions, the interaction between existing and newly added double-row piles introduces further complexity [20,21,22]. The insertion of new piles confines the originally active soil zone behind the existing piles, fundamentally altering the stress transfer through mechanisms like soil arching [23,24,25,26]. As earth pressure is a critical parameter in retaining structure design, the lack of accurate estimation methods limits the reliability of engineering design [27,28,29]. This challenge is particularly pronounced for basement addition projects due to a significant regulatory gap. Currently, there are no specific calculation methods or codes tailored to retaining structures composed of existing and newly added double-row piles. In prevailing governmental codes, the design of retaining structures for such basement addition excavations typically considers only the newly added support system, failing to incorporate the existing retaining structure into the overall system analysis. Consequently, there are no related provisions for the calculation and analysis of these retaining systems, leading to a critical lack of guidance on their load-bearing behavior and safety analysis. Furthermore, while the soil behind newly added piles is often treated as semi-infinite in theoretical models, the actual excavation face typically does not directly contact the pile wall, introducing additional uncertainty in pressure distribution [30,31,32]. Recent research has utilized both physical model tests and numerical simulations to investigate the performance of various double-row pile configurations, confirming that parameters like row spacing and pile stiffness are critical to the system’s behavior.
Despite this progress, the specific configuration of an existing-newly added double-row pile system remains a unique and less-studied challenge. While some studies have explored complex scenarios such as the time-dependent effects of pre-excavation dewatering in saturated soils and the influence of some parameters on the time-dependent behavior of retaining piles [33]. Similarly, for double-row pile systems, their complex, three-dimensional interactions—particularly the soil arching effect and load-transfer mechanisms—necessitate experimental data for validation and enhanced physical understanding [34].
Due to the difficulty of directly measuring earth pressure in the existing and newly added double-row piles, several researchers have explored their mechanical behavior using indirect approaches. Yu et al. conducted model box experiments to simulate the mechanical behavior and load-sharing mechanism of both existing and newly added retaining systems. Their findings revealed that the bending moment in the existing piles is negatively correlated with the embedment depth of the newly added piles and positively correlated with the row spacing [35]. Building on this, Tang et al. analyzed the impact of row spacing on pile bending behavior and proposed a predictive formula for the earth pressure behind existing piles [36]. Wang et al. focused on optimizing the spacing of newly added piles and identified an optimal configuration that enhances the overall performance of the retaining system [37]. Although these studies examined indicators such as bending moment and displacement through physical model testing, systematic research on the evolution and distribution of earth pressure along the pile shafts during staged excavation remains insufficient. Consequently, engineering applications of such systems still face technical challenges due to the lack of theoretical guidance.
Although basement addition has received increasing attention, research on the mechanical behavior of existing and newly added double-row piles remains limited. In particular, the earth pressure distribution within the inter-row soil, which is strongly influenced by row spacing and pile length ratio, is not yet fully understood. The two rows of piles, constructed at different times and serving distinct functions, form a non-integrated system, making it difficult for existing models to capture the complex layered interactions within the soil.
To address these shortcomings, this study undertakes a comprehensive experimental investigation into the behavior of retaining systems composed of existing and newly added double-row piles. Through a series of physical model tests, the influence of two key design parameters—the row spacing and the pile length ratio—on the system’s performance is systematically explored. The detailed measurements from these tests facilitate an in-depth analysis of the earth pressure evolution along the double-row piles and within the inter-row soil, revealing a complex nonlinear and layered stress distribution that classical theories fail to capture. This analysis clarifies the cooperative load-sharing mechanism between the piles and identifies the conditions under which this interaction is most effective. To synthesize these multifaceted findings, an entropy-weighted evaluation method is introduced to objectively assess the overall performance, leading to the proposal of an optimized structural configuration. Ultimately, the findings of this study aim to provide a stronger theoretical basis and practical design guidance for basement addition projects utilizing this complex retaining system.
2. Materials and Methods
2.1. Experimental Setup
The model tests were conducted using a composite testing chamber constructed from steel plates and plexiglass panels, as shown in Figure 1. The internal dimensions of the chamber were 1.5 m × 1.5 m × 1.0 m. These dimensions were specifically chosen to minimize boundary effects on the experimental results. The size of the chamber ensures that the zone of soil failure and stress redistribution around the model piles is contained well within the model box, preventing the rigid walls from artificially constraining the soil’s mechanical behavior and influencing the measured data. To minimize boundary effects and enhance measurement accuracy, a waterproof geomembrane was affixed to the inner surfaces of the chamber.
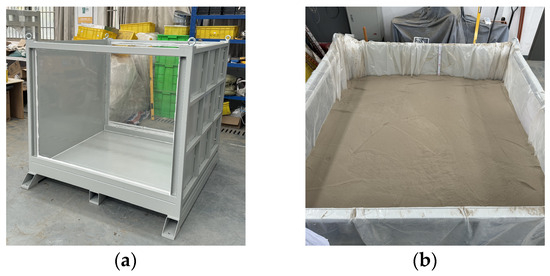
Figure 1.
Schematic diagram of the model box: (a) Front view, and (b) Top view.
In the model tests, the geometric scale factor is , the elastic modulus scale factor is , the pile stress scale factor is , the pile strain scale factor is , and the pile bending moment scale factor is . The model piles were simulated using Polyvinyl Chloride (PVC) pipes with an outer diameter (D) of 25 mm and a wall thickness of 1.7 mm. The total length of the existing piles was 33 cm, corresponding to a constant embedment depth of 30 cm. For the different test groups, the newly added piles had total lengths of 33 cm, 45 cm, and 60 cm, corresponding to embedment depths of 30 cm, 45 cm, and 60 cm, respectively, to examine the influence of pile length [38].
Earth pressure sensors were symmetrically arranged on both the front and rear sides of the existing and newly added piles. To prevent interference between adjacent sensors, measurement points on each pile were staggered vertically, as shown in the schematic. This configuration allowed for accurate monitoring of the earth pressure distribution along the pile shafts at various depths. The careful arrangement of the sensors ensured the reliability and validity of the data collected throughout the staged excavation process.
The earth pressure monitoring system utilized a TDS-540 data acquisition equipment (Tokyo Sokki Kenkyujo Co., Ltd., Tokyo, Japan), capable of supporting up to 60 channels with a resolution of 1 × 10⁻⁷, in combination with an ASW-30C signal conversion box. Silicon-based micro pressure cells were employed, each with a diameter of 16 mm, a thickness of 4.2 mm, and a measurement range of 0–10 kPa. The sensors had an accuracy error within ±0.5% F·S, ensuring reliable measurements. As shown in Figure 2, the measured values from the earth pressure cell are in good agreement with the theoretical values under at-rest conditions [39].
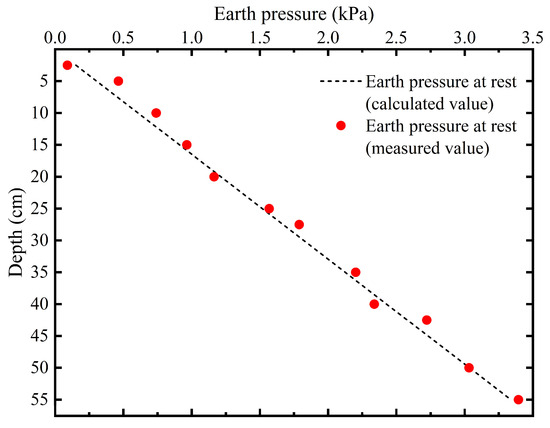
Figure 2.
Comparison between measured and theoretical at-rest earth pressure.
Each sensor was wired using a full-bridge electrical circuit. The yellow and black signal wires were connected to channels B and D of the data acquisition unit, while the red and blue power wires were supplied by a regulated 5 V DC source. Prior to testing, calibration experiments were performed to determine the voltage-to-pressure conversion factor, ensuring the precision and consistency of the sensor system.
The model piles were arranged with a center-to-center spacing of 40 mm. The earth pressure measurement piles were placed at the center of the retaining pile row to minimize the influence of boundary effects from the excavation. During the tests, earth pressure data for each pile type were obtained by averaging the readings from two identically instrumented piles. To reduce noise and enhance reliability, all raw signals were processed using MATLAB (R2024a, MathWorks, Natick, MA, USA). Extreme maximum and minimum outliers were filtered out, improving the accuracy and smoothness of the recorded earth pressure profiles along the pile shafts.
Pile head displacement was monitored using dial indicators with a measurement range of 10 mm. To ensure stable and precise positioning, the indicators were mounted on independent stands equipped with magnetic bases. Each pile had a 3 cm section exposed above the soil. This ensured that the measurement probe could make secure contact. After each excavation stage, a waiting period of 5 min was observed to allow for system stabilization, after which the horizontal displacement readings were recorded. This procedure enabled accurate tracking of pile head deformation throughout the excavation process [40]. The configuration of the model test equipment and instrumentation is detailed in Figure 3.
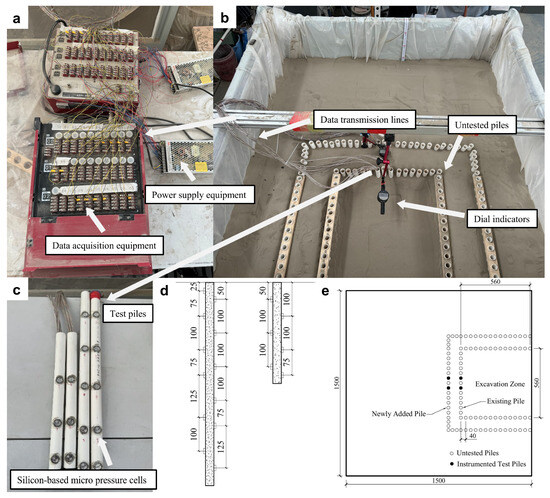
Figure 3.
Model test equipment and detailed layout: (a) Data acquisition equipment; (b) Test instrumentation layout; (c) Photograph showing the installation of earth pressure cells on the piles; (d) Detailed layout of earth pressure cells (unit: mm); (e) Plan view of the model (unit: mm).
2.2. Soil Parameters
The soil used in the model tests was silty soil, representative of typical strata in the Hangzhou region. Before test, the soil was screened to remove debris and impurities, and its physical properties were subsequently measured. The unit weight of the soil was determined to be 13.328 kN/m3. To determine the shear strength parameters, a series of direct shear tests were conducted. Figure 4 presents the results of these tests, plotting the measured peak shear stress () against the corresponding applied normal stress (). The data points exhibit a strong linear relationship, which was fitted using the Mohr–Coulomb failure criterion. From the linear regression of this data, the internal friction angle () is determined from the slope of the line, yielding a value of . The y-intercept of the fitted line is negligible, indicating that the soil’s effective cohesion () can be considered zero for the purposes of this study.
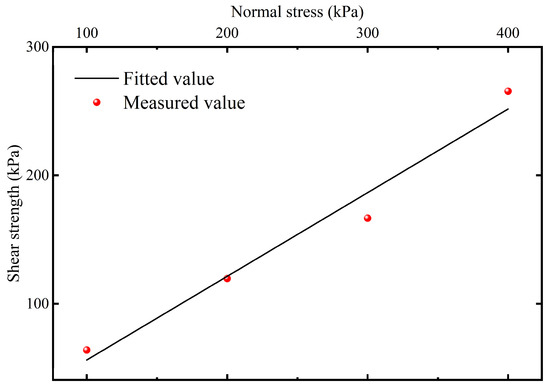
Figure 4.
Data fitting for direct shear tests.
The soil was placed in the model chamber using the pluviation method. Compaction was carried out in 10 cm thick layers, with a fixed mass of soil introduced per layer to ensure consistent density and uniformity across the entire model box. This procedure effectively reduced variability in soil conditions, thereby improving the repeatability and credibility of the experimental results.
2.3. Test Plan
To systematically investigate the influence of row spacing and pile length ratio on the performance of the double-row pile system, a comprehensive testing program was designed. This program involved six distinct test groups with varying geometric configurations and a standardized, four-stage excavation procedure to simulate the entire construction sequence from the original basement excavation to the subsequent basement addition.
Based on the optimized parameters proposed by Yu et al. [35] and Tang et al. [36], the optimal configuration of the existing and newly added double-row piles was identified as a row spacing of 4D and a newly added/existing pile length ratio of 9/6. In this study, six comparative tests were conducted to systematically examine the effects of row spacing and pile length ratio on the earth pressure distribution within the retaining structure. The details of each test configuration are listed in Table 1, where D represents the outer diameter of the model pile.

Table 1.
Experimental grouping and test conditions.
The excavation procedure for each test followed a standardized four-stage sequence, as illustrated in Figure 5:
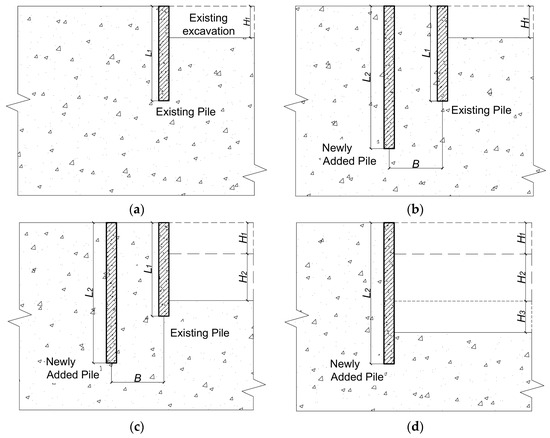
Figure 5.
Excavation procedure for basement addition: (a) Stage 1; (b) Stage 2; (c) Stage 3; (d) Stage 4.
Stage 1: Simulated the excavation of the original basement (existing underground space), with an initial excavation depth of H1 = 10 cm. After excavation, the soil was left undisturbed for 24 h to allow for stress redistribution and consolidation.
Stage 2: The newly added piles were installed behind the existing piles, with a center-to-center distance of B (i.e., the designated row spacing).
Stage 3: Simulated the excavation for the basement addition, with a second-stage excavation depth of H2 = 15 cm. If no failure occurred at 15 cm, excavation was continued incrementally until soil rupture or pile overturning was observed, and the critical failure condition was recorded.
Stage 4: The existing piles and the inter-row soil were removed, and excavation proceeded to an additional depth of H3 = 10 cm to simulate further extension of the underground space.
2.4. Principle and Implementation of the Entropy Weight Method
This section employs a comprehensive evaluation method based on the entropy weight method (EWM) to assess the performance of the existing and newly added double-row piles as a supplementary retaining system. Unlike conventional subjective weighting approaches, EWM determines the weights of evaluation indicators directly from the decision matrix, reflecting the inherent variability of the data. This ensures a more objective and reliable outcome, minimizing human bias and enhancing the scientific rigor and credibility of the evaluation process. Consequently, EWM is particularly suitable for multi-attribute decision-making in geotechnical and structural engineering applications [41,42,43]. The implementation procedure is described as follows:
- Normalization of Indicator Data and Construction of the Standardized Data Matrix
To eliminate dimensional inconsistencies among the evaluation indicators, the original data must be normalized. Let the original data matrix be defined as , where n represents the number of test groups and m denotes the number of evaluation indicators.
Since the indicators may differ in type, they are classified as either benefit-type indicators (the larger the better) or cost-type indicators (the smaller the better). Each type is normalized accordingly to ensure comparability. After normalization, the standardized data matrix is denoted as , which provides the foundation for the subsequent entropy-based weight calculation.
The normalization formulas for benefit-type (positive) and cost-type (negative) indicators are given as follows:
For benefit-type indicators (the larger, the better):
For cost-type indicators (the smaller, the better):
Here, represents the original value of the j-th indicator for the i-th scheme, and is the corresponding normalized value. and denote the maximum and minimum values of the j-th indicator across all schemes, respectively.
- 2.
- Entropy Calculation
The entropy value reflects the degree of dispersion and uncertainty associated with each indicator. A higher entropy value corresponds to greater variability in the data and lower information utility, indicating that the indicator contributes less to the overall evaluation. The calculation of entropy for each indicator involves the following steps:
First, compute the proportional value of each normalized indicator:
Then, calculate the entropy value for the j-th indicator using the following formula:
where is the number of schemes or test groups, and is a constant that ensures the entropy value remains within the range . If , the term is conventionally treated as zero.
- 3.
- Determination of Indicator Weights
Based on the entropy values of each indicator, the degree of divergence is first calculated to reflect the amount of useful information contained in the data. The objective weight of each indicator is then derived accordingly.
The entropy weight of the j-th indicator is calculated as follows:
where is the entropy value of the j-th indicator, and m is the total number of indicators. This formula ensures that indicators with greater variability (i.e., lower entropy) are assigned higher weights, reflecting their stronger contribution to the evaluation system.
- 4.
- Comprehensive Score Calculation
The comprehensive performance score for each test scheme is calculated by combining the normalized indicator values with their corresponding entropy weights. The score for the i-th scheme is computed as follows:
where is the entropy weight of the j-th indicator, and is the normalized value of the j-th indicator for the i-th test group.
A higher indicates better overall performance of the corresponding test scheme, reflecting a more favorable combination of all evaluation attributes.
3. Results
3.1. Pile Head Displacement Analysis
In this study, the excavation of 10 cm to form the existing underground space, followed by the installation of the newly added piles without further excavation, was defined as the zero-displacement reference point for pile head movement. Based on this baseline, the horizontal displacements of the pile heads in Test Groups 2 to 5 were compared to investigate the effect of row spacing on the lateral deformation behavior of the retaining system.
The analysis of pile head displacement reveals that row spacing is a critical factor influencing the lateral deformation of the existing piles, with wider spacings leading to significantly larger movements. Figure 6 illustrates the variation in horizontal displacement of the existing pile heads during basement addition excavation. As shown in the figure, the pile head displacement increased continuously with excavation depth, and the rate of increase became more pronounced as the depth progressed from 5 cm to 17.5 cm.
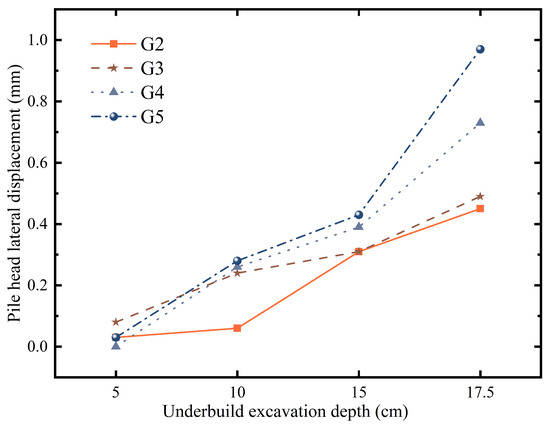
Figure 6.
Existing pile head lateral displacement.
At a basement addition excavation depth of 17.5 cm, as the row spacing increased from 2D (G2) to 8D (G5), the corresponding pile head displacements were recorded as 0.45 mm, 0.49 mm, 0.73 mm, and 0.97 mm, respectively. G5 showed a sharp increase in displacement, with a growth rate of 125.58% compared to the previous stage. This substantial escalation suggests that excessive row spacing may significantly compromise the global stability of the retaining structure and elevate the risk of overturning of the existing piles.
As illustrated in Figure 7, during the stage when the existing piles had not yet been removed (i.e., basement addition excavation depth ≤ 15 cm), the horizontal displacement of the newly added piles was generally smaller than that of the existing piles. The maximum displacement of the newly added piles reached 0.22 mm, which was only 70.97% of the corresponding displacement of the existing piles under the same condition. This behavior is mainly attributed to the greater embedment depth of the newly added piles and the lateral confinement provided by the inter-row soil mass.
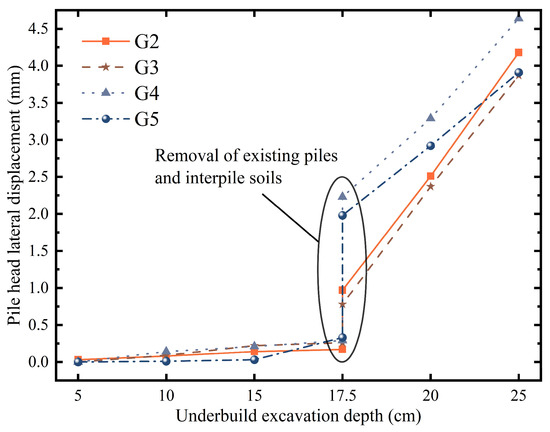
Figure 7.
Newly added pile head lateral displacement.
These results demonstrate a clear positive correlation between row spacing and lateral displacement. This trend is attributed to the weakening of the cooperative pile-soil interaction as the rows are moved further apart. At smaller spacings (e.g., 2D and 4D), the inter-row soil is effectively confined, allowing a robust soil arch to form that helps the system act as a composite structure with high lateral stiffness. As the spacing increases to 8D (G5), this arching effect diminishes significantly. The system begins to behave more like two independent rows of piles, leading to a sharp increase in displacement. This substantial escalation suggests that excessive row spacing compromises the global stability of the retaining structure and elevates the risk of overturning.
Following the removal of the existing piles and the inter-row soil, the newly added piles experienced a substantial increase in horizontal displacement, which may contribute to post-excavation settlement of the soil behind the retaining wall. When the excavation depth reached 25 cm, the differences in pile head displacement among all test groups diminished, indicating a convergence in deformation behavior under deeper excavation conditions. This convergence reflects a fundamental shift in structural behavior. The system transitioned from a complex double-row structure, where deformation was sensitive to row spacing, to a simple single-row cantilever system after the existing piles were removed. In this final stage, the original row spacing became irrelevant, and the uniform properties of the newly added piles resulted in a consistent cantilever response across the test groups.
3.2. Effect of Row Spacing Variation in Double-Row Piles
Figure 8 and Figure 9 illustrate the earth pressure distribution along the double-row piles in G3 during staged excavation. It is important to note that as excavation progressed, some earth pressure sensors on the front side of the piles became exposed due to deep cutting, necessitating the exclusion of data from exposed sensors for the analysis of that excavation stage.
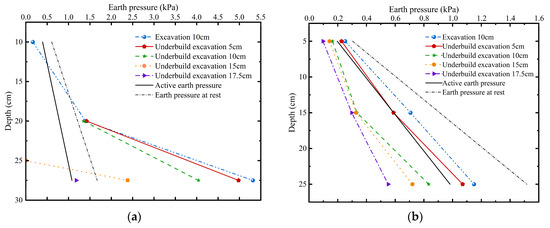
Figure 8.
Earth pressure distribution along existing piles in G3 (row spacing of 4D and pile length ratio of 9/6) during staged excavation: (a) Earth pressure in front of existing piles; (b) Earth pressure behind existing piles.
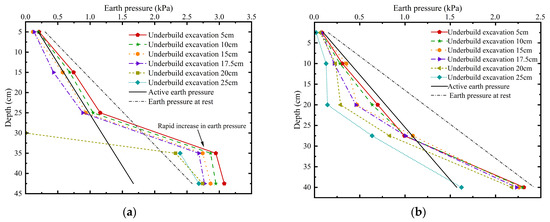
Figure 9.
Earth pressure distribution along newly added piles in G3 (row spacing of 4D and pile length ratio of 9/6) during staged excavation: (a) Earth pressure in front of newly added piles; (b) Earth pressure behind newly added piles.
As excavation depth increased, the passive soil zone in front of the existing piles was progressively reduced, leading to a continuous decrease in passive earth pressure. A notable unloading effect was observed in deeper soil layers, where the passive pressure in front of the existing piles decreased by 77.8% at a depth of 27.5 cm. Furthermore, due to the presence of the newly added piles, the active earth pressure behind the existing piles was reduced in comparison to a single-row pile configuration.
With the progressive lowering of the excavation face, the newly added piles began to take on more of the earth-retaining function. Under the basement addition excavation depth of 15 cm, the earth pressure behind the existing piles was 36.7% lower than that recorded at the 5 cm stage, confirming the cooperative load-sharing mechanism of the existing and newly added double-row piles.
The earth pressure distribution in front of the newly added piles exhibited a distinctly nonlinear pattern. Above the excavation face, the measured earth pressure values were lower than those predicted by classical Rankine active earth pressure theory. A pronounced stress inflection point was identified below the excavation face, where earth pressure increased abruptly. This indicates that traditional earth pressure theories may have limited applicability under spatially constrained excavation conditions.
On the rear side of the newly added piles, the measured earth pressures generally fell between the theoretical active and at-rest pressure envelopes. After the existing piles ceased to function (i.e., basement addition excavation depth ≥ 20 cm), the earth pressure behind the newly added piles above the excavation face decreased significantly compared to the critical condition at 15 cm. This suggests that when acting alone, the newly added piles remained in a non-limit equilibrium state. Nevertheless, the insertion of the newly added piles disturbed the surrounding soil mass, altered its mechanical properties, and led to earth pressure values considerably lower than those predicted by active earth pressure theory.
A comparative analysis of the earth pressure behind the existing piles under the critical excavation condition (basement addition excavation depth = 15 cm) was conducted for Groups 2 through 5, with the corresponding results shown in Figure 10. The results clearly show that the newly added piles provide a significant “shielding effect” for the existing piles, and the effectiveness of this shielding is highly dependent on the row spacing. At this excavation depth, the measured earth pressure exhibited a positive correlation with row spacing (B). When B ≥ 6D, the recorded values closely approached the theoretical Rankine active earth pressure. Specifically, at a depth of 25 cm, the earth pressure behind the existing piles in G2 and G3 was 0.79 kPa and 0.72 kPa, respectively, representing reductions of 19.39% and 26.53% relative to the theoretical active pressure. At narrow row spacing (G2 and G3), the newly added piles intercept a significant portion of the potential failure wedge, leading to a substantial reduction in earth pressure on the existing piles. As the row spacing increases (G4 and G5), this shielding effect weakens, allowing the soil behind the existing piles to mobilize more of its shear strength and approach the classical Rankine active state. These findings indicate that increasing row spacing diminishes the collaborative effect of the newly added piles on the existing piles, thereby reducing the overall load-sharing efficiency of the double-row retaining system.
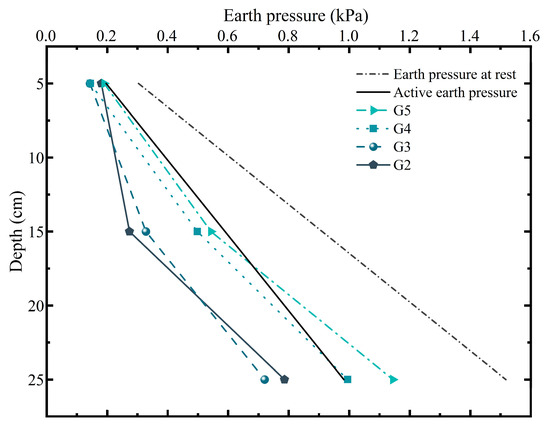
Figure 10.
Earth pressure distribution behind existing piles under the critical excavation condition (basement addition excavation depth = 15 cm).
As shown in Figure 11, the earth pressure in front of the newly added piles above the excavation face (at a depth of 25 cm) tended to approach the theoretical active earth pressure across all four test groups. However, below the excavation face, the earth pressure exhibited a clear stratified variation with increasing row spacing. At a depth of 42.5 cm, the earth pressure in G5 reached 6.61 kPa, which was approximately 40% higher than that in G4. In contrast, the earth pressure in G2 at the same depth remained between the theoretical active and at-rest pressure values.
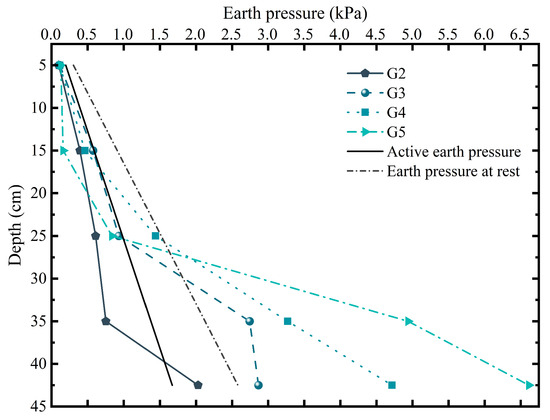
Figure 11.
Earth pressure distribution in front of newly added piles under the critical excavation condition (basement addition excavation depth = 15 cm).
This positive correlation between row spacing and the earth pressure in front of the newly added piles is primarily attributed to the development of the passive soil wedge. A greater row spacing provides a larger volume of inter-row soil, allowing a wider and deeper passive wedge to be mobilized as the new piles deflect into it. This larger mobilized soil mass generates significantly higher passive resistance. For instance, at a depth of 42.5 cm, the pressure in G5 is approximately 40% higher than in G4. In contrast, the narrow row spacing in G2 constrains the formation of this passive wedge, resulting in much lower pressures that remain between the theoretical active and at-rest states.
Figure 12 illustrates the distribution of earth pressure behind the newly added piles. Above the excavation face, the measured earth pressure across all test groups generally fluctuated around the theoretical active earth pressure line. However, below the excavation face, the measured values gradually converged toward the at-rest pressure envelope with increasing depth, suggesting that the deeper soil remained in a non-limit active state.
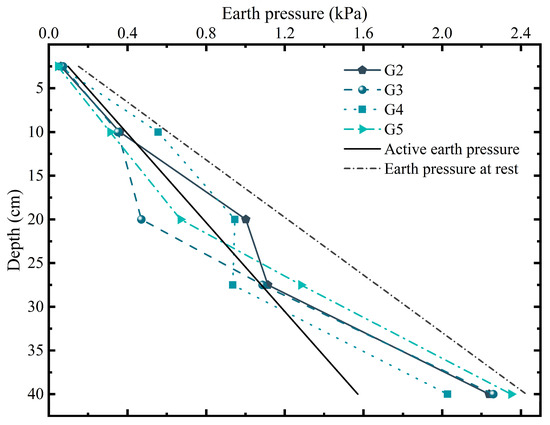
Figure 12.
Earth pressure distribution behind newly added piles under the critical excavation conditions (basement addition excavation depth = 15 cm).
A comparative analysis between the rear-side earth pressure of the existing piles and that of the newly added piles at equivalent depths reveals distinct interaction patterns. In G2, the earth pressure behind the newly added piles significantly exceeded that behind the existing piles, with a relative difference of 62%. In contrast, Groups 3 and 4 exhibited much smaller discrepancies, with relative differences of 11% and 23%, respectively, indicating better load-sharing coordination between the two pile rows. Interestingly, in G5, the rear earth pressure of the existing piles near the excavation face surpassed that of the newly added piles.
These findings indicate that when the row spacing is set to 4D or 6D, the existing and newly added piles exhibit relatively consistent earth pressure responses. This behavior suggests improved cooperative load-sharing between the two rows of piles, contributing to greater overall stability of the retaining structure.
3.3. Effect of Pile Length Ratio Variation in Double-Row Piles
This section investigates the influence of the pile length ratio, defined as the ratio of the newly added pile length (L2) to the existing pile length (L1), on the distribution of earth pressure along the pile shafts. Specifically, G1, G3, and G6 were selected for comparison, corresponding to pile length ratios (L2/L1) of 6/6, 9/6, and 12/6, respectively.
Figure 13 illustrates the variation in rear earth pressure behind the existing piles during staged excavation, under a constant row spacing of 4D, for different pile length ratios. As shown in the figure, when the pile length ratio increased from L2/L1 = 9/6 (G3) to 12/6 (G6), the reduction in rear earth pressure from 10 cm to 15 cm basement addition excavation depth increased from 9.41% to 37.64% at the 10 cm depth level. This result indicates that increasing the embedment depth of the newly added piles effectively reduces the load on the rear side of the existing piles.
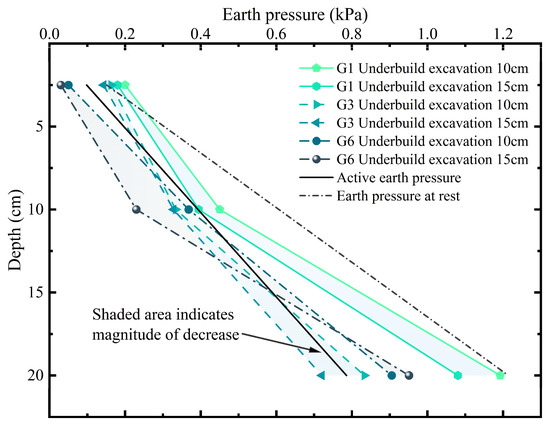
Figure 13.
Variation in rear earth pressure behind existing piles during staged excavation.
It is worth noting that in G6, a local increase in earth pressure was observed near the excavation face. This phenomenon can be attributed to the displacement pattern of the existing piles during the basement addition process, which resembled a rigid-body rotation around the pile toe. Under such a mechanism, the horizontal displacement at a given depth is inversely related to the pile length. Therefore, longer piles move less at any given depth. This restricted movement prevents the inter-row soil from deforming enough to reach a fully active state, thus maintaining a higher, near-at-rest pressure. In contrast, in G3, the earth pressure at the same position decreased by only 13.25%, suggesting that this intermediate pile length ratio results in a more uniform earth pressure distribution near the excavation face.
Figure 14 and Figure 15 show the distributions of earth pressure in front of and behind the newly added piles in Groups 1 and 6, respectively. A vertical comparison with Figure 9 reveals that the earth pressure in front of the newly added piles decreases progressively with increasing pile length ratio. In G6, the passive earth pressure below the excavation face exhibits an approximately linear increase with depth.
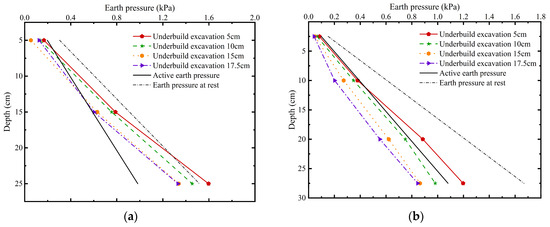
Figure 14.
Earth pressure distribution along newly added piles in G1 (row spacing of 4D and pile length ratio of 6/6) during staged excavation: (a) Earth pressure in front of newly added piles; (b) Earth pressure behind newly added piles.
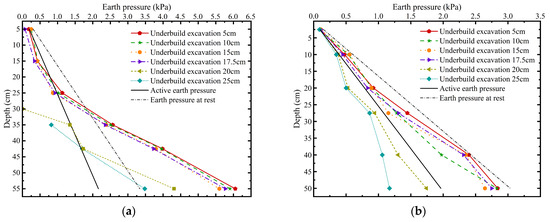
Figure 15.
Earth pressure distribution along newly added piles in G6 (row spacing of 4D and pile length ratio of 12/6) during staged excavation: (a) Earth pressure in front of newly added piles; (b) Earth pressure behind newly added piles.
Under the critical excavation condition, at a depth of 25 cm, the rear earth pressure behind the newly added piles is lowest in G3 and highest in G6. The reduction in active earth pressure in G3 during excavation is more pronounced than that in G6. Specifically, near the excavation face under the critical condition, the earth pressure in G3 is 0.4 kPa lower than in G6. This indicates that when the pile length ratio is 9/6, the load distribution within the existing and newly added double-row piles is more balanced, effectively reducing the risk of excessive loading on either row, which could otherwise lead to overturning or global instability.
3.4. Lateral Earth Pressure Coefficient Analysis of Inter-Row Soil
Figure 16 presents the distribution of the lateral earth pressure coefficient () under the critical excavation condition, where the basement addition depth is 15 cm. The coefficient is defined as the ratio of the measured horizontal earth pressure at each pile shaft sensor to the corresponding vertical overburden stress, as expressed in Equation (7):
where is the lateral earth pressure coefficient, is the measured horizontal earth pressure, is the unit weight of the soil, and is the depth of the soil layer.
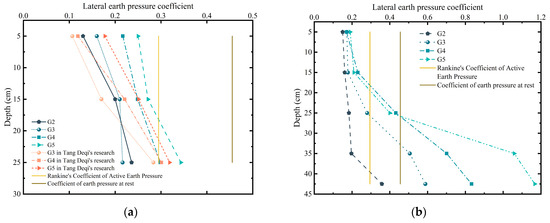
Figure 16.
Analysis of lateral earth pressure coefficient in the existing and newly added double-row piles: (a) Lateral earth pressure coefficient behind existing piles; (b) Lateral earth pressure coefficient in front of newly added piles.
The analysis of the lateral earth pressure coefficient () confirms that the soil behind the existing piles did not reach the classical active state, highlighting the protective effect of the new piles. As shown in Figure 16a, the measured coefficient () in the upper soil layers (0–15 cm depth) are consistently below the theoretical Rankine active coefficient across all test groups. This indicates that the soil has not yet fully mobilized its shear strength, remaining in a sub-active stress state. Such behavior is typical of staged excavation, where the redistribution of stress has not reached a failure condition near the ground surface.
At the excavation depth (approximately 15 cm), the coefficients in Groups 4 and 5 increase significantly to 0.29 and 0.34, respectively. The value in G4 closely matches the Rankine active coefficient, whereas the value in G5 exceeds it. This trend can be attributed to increased row spacing, which enlarges the volume of inter-row soil. With smaller row spacing, the failure surface intersects the newly added piles, allowing them to constrain soil deformation effectively. However, as spacing increases, the failure surface extends beyond the influence of the newly added piles, diminishing their restraining effect and allowing a more active stress condition to develop behind the existing piles.
Compared with the model test results reported by Tang et al. [36], the lateral earth pressure coefficients obtained in this study are generally higher in magnitude. Despite this difference, the overall shape and trend of the pressure distribution curves remain consistent, thereby confirming the reliability of the experimental design and data interpretation. This consistency also underscores the role of boundary conditions and pile configurations in influencing lateral pressure development.
In summary, applying the classical Rankine active earth pressure theory to estimate lateral earth pressure on the existing piles in an existing and newly added double-row piles tends to overestimate the actual values observed in the model tests. This discrepancy should be accounted for in practical design, particularly when assessing internal force demands on the rear pile row.
As shown in Figure 16b, above the excavation face, the lateral earth pressure coefficients measured in front of the newly added piles are lower than the theoretical Rankine active earth pressure coefficient. This suggests a sub-active or constrained state, where the passive wedge is not fully developed due to the influence of the surrounding soil and the existing piles.
Below the excavation face, however, a sharp increase in coefficients is observed, particularly in Groups 3 through 5. At a depth of 35 cm, the coefficient in G5 reaches 1.06, which is approximately 40% higher than that in G4. These values significantly exceed classical predictions, implying a nonlinear stress response within the passive zone.
This overpressure is likely due to the confined geometry of the inter-row soil and the stress concentration that develops as excavation progresses. An increase in row spacing allows for the development of a larger passive soil wedge, which in turn leads to higher earth pressures acting on the front face of the newly added piles. In contrast, G2, characterized by a narrower row spacing and shorter pile length, exhibits a more constrained passive soil response, resulting in reduced lateral pressure coefficients.
These findings underscore the limitations of conventional earth pressure theories, such as the Rankine and Coulomb models, in accurately representing the mechanical behavior of inter-row soil between existing and newly added double-row piles, particularly during deep excavation stages. This discrepancy highlights the need to redefine the effective stress transfer boundary within the inter-row zone and to establish a more refined theoretical framework that captures the nonlinear soil response in front of the newly added piles, especially beneath the excavation face.
In conclusion, the analysis of lateral earth pressure coefficients reveals that classical earth pressure theories fail to accurately describe the stress state of inter-row soil in existing and newly added double-row piles, especially below the excavation face. While both existing and newly added piles exhibit sub-active pressures above the excavation, significant overpressures are observed below, particularly in front of the newly added piles. These findings highlight the need to reconsider conventional models and emphasize the importance of optimizing row spacing and pile length to ensure structural stability in basement addition projects.
3.5. Comprehensive Evaluation of Double-Row Piles Performance Based on the Entropy Weight Method
3.5.1. Selection and Calculation of Comprehensive Evaluation Indicators
To evaluate the performance of the existing and newly added double-row piles serving as supplementary retaining structures under basement addition conditions, a comprehensive index system was developed, incorporating both structural and geotechnical indicators.
The classification of the earth pressure mobilized in front of the newly added piles is not straightforward, owing to its inherently dualistic role. While this pressure contributes beneficially to the system’s global overturning resistance, it concurrently imposes a structural load on the piles, thereby detracting from economic efficiency. Crucially, our experimental observations reveal that the mobilized pressure consistently remained well below the theoretical passive limit and the pile stresses are nowhere near the material’s strength limit. This finding effectively mitigates concerns regarding structural overload, allowing the pressure’s stabilizing function to be considered its predominant contribution. Consequently, its classification as a positive indicator is justified within the framework of this study. In contrast, the total earth pressure behind the existing piles was treated as a negative indicator, as excessive active pressure poses a risk to structural stability. The system’s reliability was further gauged by the overturning safety factor of the existing piles, a positive metric, while the lateral displacement of the pile heads served as a final negative indicator reflecting overall deformation.
Collectively, these four indicators—reflecting both earth pressure distribution and deformation response—establish a multidimensional framework for holistically assessing the load-sharing performance and deformation control of the double-row piles during excavation. This framework provides a robust and objective foundation for the subsequent application of the entropy weight method to performance ranking and optimization.
The raw data for normalization were derived from experimental measurements under the critical excavation condition, as shown in Table 2. In this table, E1, E2, , and v denote the standardized values of the total earth pressure in front of the newly added piles, the total earth pressure behind the existing piles, the overturning safety factor of the existing piles, and the cumulative lateral displacement at the pile heads, respectively. The earth pressure resultants and their action depths were calculated using MATLAB based on measured pressures at various depths. A piecewise integration method was applied to determine the magnitude and moment of the resultant forces, from which the action point depths were derived.

Table 2.
Test raw data.
The overturning safety factor of the existing piles is calculated according to Equation (8):
where and represent the passive and active earth pressure resultants on the inner and outer sides of the excavation, respectively, and and are the distances from their respective resultant force action points to the pile support point.
The normalized results obtained through the procedure described in Section 3.5.1 were summarized in Table 3.

Table 3.
Standardized data matrix.
Using the data from Table 3, the coefficient of variation for each indicator was calculated, followed by the derivation of information entropy values and entropy-based weights. The complete results are summarized in Table 4.

Table 4.
Information entropy of each indicator for existing and newly added double-row piles.
3.5.2. Comprehensive Evaluation Analysis
Based on the entropy values calculated in the previous section, the objective weights of each evaluation indicator were determined. These weights were then combined with the normalized indicator values to construct a comprehensive evaluation matrix.
Table 5 summarizes the final evaluation results obtained through weighted summation. Among all test groups, G6 achieved the highest comprehensive score, indicating superior overall performance in terms of structural stability and support effectiveness.

Table 5.
Comprehensive evaluation table.
Based on the weighted summation, G6 achieved the highest comprehensive score, indicating the best technical performance in terms of structural stability and support effectiveness.
However, a direct comparison of the evaluation outcomes warrants caution, as the distinct geometric properties of the G6 piles introduce a potential bias. The substantially increased pile length in this configuration inherently mobilizes superior earth pressure and shear resistance, disproportionately favoring its performance metrics. This issue of comparability is further compounded by the challenge of integrating engineering costs, as the difficulty in formulating a robust quantitative indicator precludes a truly holistic assessment.
To approximate this economic dimension, we consider pile length as the primary cost driver—a premise supported by the Chinese national standard, Specifications for Calculation and Pricing of Precast Concrete Piles. On this basis, the substantially longer piles in G6 translate to an estimated 33% cost increase per pile over G3. This significant economic consideration suggests that G3, despite ranking second with a comprehensive score of 0.612, arguably represents a more balanced and efficient solution overall.
Synthesizing the multifaceted performance indicators with practical economic constraints, G3 is identified as the optimal configuration in this study. Its parameters—a row spacing of 4D and a newly added/existing pile length ratio of 9/6—provide a rational basis for the preliminary design of supplementary double-row pile systems in basement addition projects.
4. Discussion
Our experimental observations unveil a pronounced departure from classical Rankine and Coulomb theories regarding lateral earth pressure distribution in double-row pile retaining systems. The pressures measured behind the existing piles consistently fall below the anticipated Rankine active state, while the resistance mobilized in front of the newly added piles accumulates nonlinearly with depth, frequently surpassing the theoretical passive limit. This divergence strongly suggests that conventional design methodologies may be inherently flawed, fostering an over-conservative reinforcement of the existing piles while simultaneously undervaluing the stabilizing contribution of the new ones. To reconcile these critical discrepancies, a more sophisticated analytical framework is necessitated—one that incorporates the coupled mechanisms of soil arching within a finite soil mass and progressive failure outside the confines of the limit state.
It is important to consider the findings of this study in light of the constraints associated with 1 g physical modeling. The challenges in accurately simulating the in situ soil stress field suggest that the results are primarily illustrative rather than quantitatively exact. Accordingly, the contribution of this experimental program is focused on offering valuable insights into the system’s operational principles and presenting a systematic comparison of its performance across various configurations, as opposed to generating directly transferable design parameters.
4.1. Earth Pressure Distribution in Finite Soil Mass
The confinement of soil within a finite width, a condition inherent to our experimental setup, fundamentally alters the lateral earth pressure distribution from the semi-infinite idealization of classical theories [44]. A consistent and substantial reduction in active earth pressure was observed across all depths, a phenomenon widely attributed to the soil arching mechanism. The relative displacement of the retaining piles induces a compressive stress arch within the entrapped soil, which effectively redistributes a significant portion of the overburden stress onto the stationary lateral boundaries. This transference of stress inherently alleviates the horizontal forces exerted on the piles themselves [45].
The efficacy of this arching-induced pressure reduction is intimately linked to the geometric constraint, primarily governed by the width-to-height ratio () of the soil mass. A more pronounced arching effect manifests in narrower configurations, yielding greater pressure attenuation; for instance, reductions approaching 48% have been documented for a slender ratio of 0.2 [46]. Conversely, as this ratio increases, the arching mechanism progressively weakens, causing the pressure profile to converge towards the classical Rankine or Coulomb solution. This relationship underscores the existence of a critical width, beyond which the influence of the finite boundaries becomes negligible. Furthermore, the capacity to form and sustain this arch is not merely a geometric function but is also contingent upon the soil’s constitutive properties. The ability to mobilize the requisite shear stresses depends critically on the internal friction angle of the soil and the frictional characteristics of the soil-pile interface.
4.2. Progressive Failure and Non-Limit State Conditions
The distinctly nonlinear pressure profile observed, particularly near the base of the retaining structure, can be attributed to the mechanics of progressive failure, which is intrinsically linked to the retaining structure’s operational movement mode. For a retaining structure undergoing Rotation about the Base (RB)—a mode characterized by significantly larger displacements at its crest than at its toe—a non-uniform strain field is imposed upon the backfill. This differential strain initiates a top-down failure sequence: the soil in the upper strata yields first, eventually reaching the active limit state, whereas the soil adjacent to the less-displaced base remains in a non-limit state, its full shear strength yet to be mobilized. This sequence of top-down failure progression is a well-documented phenomenon, confirmed by various experimental investigations [47].
The experimental data from the non-limit state, presented in Figure 16, provide compelling quantitative support for this interpretation. Although the pressure near the base has decreased from the initial at-rest condition, it remains significantly elevated above the theoretical active limit state. This observation validates the existence of an intermediate or non-limit active state within the lower soil strata. This complex physical behavior is well-reproduced by the theoretical model proposed by Weidong et al. [11], which conceptualizes the soil wedge as a composite of an upper limit-state zone and a lower non-limit-state zone. To account for the partial mobilization of shear strength in this lower region, the model employs a shear strength reduction methodology, introducing an equivalent friction angle. The resulting formulation successfully predicts a concave-upward pressure profile, characterized by higher-than-limit-state pressures near the base, which aligns qualitatively with the trends observed in our experiments.
4.3. Theoretical Derivation of a Simplified Bilinear Earth Pressure Conceptual Model
To bridge the gap between the complex soil-structure interaction mechanisms and practical design applications, a simplified bilinear earth pressure model is proposed. This model encapsulates the essential physical phenomena previously discussed—namely, soil arching and the non-limit state—by conceptualizing the nonlinear pressure distribution as two distinct linear segments.
4.3.1. Model Formulation
The soil behind the supporting structure (height ) is divided at a transition depth—a parameter dependent on the soil’s internal friction angle and the width-to-depth ratio—which for this study is assumed to be .
- Upper Zone (Limit State, )
The horizontal pressure, is modified by an arching reduction factor, :
where is the soil unit weight, and is the Rankine active earth pressure coefficient, . The soil arching reduction factor, , can be represented by a simple empirical function based on experimental trends.
Consistent with theoretical predictions, the earth pressure behind the existing piles at narrow row spacings was observed to remain in a sub-active state, confirming that the shielding and arching effects within the inter-row soil inhibit the full mobilization of active thrust.
- Lower Zone (Non-Limit State, )
In the lower zone, the pressure increases from its value at the transition depth, , but at a steeper gradient governed by a non-limit earth pressure coefficient, .
Following the strength reduction principle, is calculated using a reduced internal friction angle, . Adopting [11]:
Since , it follows that , correctly modeling the steeper pressure gradient characteristic of a state intermediate between active and at-rest conditions.
This formulation yields lateral pressures near the base that exceed the ultimate active state, thereby accounting for the concave-upward profiles measured in the tests. Such a result substantiates the conceptual model of a partitioned soil response, wherein top-down mobilization leads to an active-like upper zone and a partially mobilized lower zone.
4.3.2. Resultant Thrust and Point of Application
By integrating the bilinear pressure distribution, the total active thrust () and the height of its point of application from the base () can be derived in closed form:
4.3.3. Model Validation
To assess the model’s validity, its predictions are compared with the experimental data from Table 2 and classical theory. The results are summarized in Table 6.

Table 6.
Comparison of Total Active Thrust for Finite Soil Mass.
The proposed bilinear model attempts to improve upon classical theory by incorporating the observed mechanisms of soil arching and non-limit state conditions. However, a comparison with experimental data reveals substantial deviations, particularly for the configurations with the smallest (G2) and largest (G5) row spacings.
For the G2 case (2D row spacing), the model significantly underestimates the measured thrust. This is likely because its simplified arching assumptions fail in an extremely narrow soil mass where the row spacing may act as a composite structure, an issue compounded by experimental uncertainties at small scales.
Conversely, for the wider G5 configuration (8D row spacing), the model substantially overestimates the earth pressure. This over-prediction stems from two compounding invalid assumptions. First, the model does not capture the degradation of the soil arching effect as row spacing increases. Second, this error is exacerbated by its reliance on a non-limit state characteristic of the RB mode. At a large 8D spacing, the less constrained soil can deform more, approaching the classical active limit state. The model’s formula, however, continues to assume a significant non-limit state contribution, leading to a pronounced overestimation of pressure in the lower strata.
Therefore, while acknowledging its limitations in providing precise quantitative predictions, the model serves as a useful conceptual framework. It highlights that a refined theory must account for both soil arching and non-limit state conditions, demonstrating their dependence on the inter-row soil’s width-to-depth ratio. This model should be regarded as a preliminary step toward developing a more comprehensive analytical tool, rather than a direct method for engineering design. To further enhance the applicability of the findings, future studies may incorporate advanced inversion methods, such as Bayesian or probabilistic frameworks, to rigorously identify earth pressure distributions and quantify the associated uncertainties.
5. Conclusions
It is important to first acknowledge the inherent limitations of 1 g physical model test. Due to the inability to fully replicate a prototype’s in situ stress field, the quantitative results of this study should be viewed as illustrative of the system’s mechanical principles rather than as absolute design values. With this context, this study investigates the mechanical behavior and load-sharing mechanism of existing and newly added double-row piles in basement addition projects through a series of model tests. By analyzing lateral pile head displacements and earth pressure distributions along the pile shafts under various excavation scenarios, the following conclusions are drawn:
- Pile head displacements increased with row spacing. This finding is of critical practical importance as excessive spacing (e.g., 8D) was observed to compromise the overall stability of the retaining system. The scientific significance lies in demonstrating that the double-row pile system transitions from a robust, composite structure at narrow row spacings to two less effective, independent rows at wider spacings. The observation that newly added piles exhibit smaller lateral displacements than the existing ones provides direct evidence of the intended load-transfer mechanism, confirming their primary role in controlling deformation before the existing piles is removed.
- The earth pressure distribution reveals that the newly added piles play a dominant role in maintaining system stability, acting as a “shield” for the existing piles. This shielding effect, a key scientific finding of this study, is most effective at narrower row spacing (4D or 6D), where the earth pressure distribution in the inter-row soil is relatively balanced. This has direct applicability in engineering design, suggesting that an optimized spacing can significantly reduce the load on the existing structure, leading to more economical and safer designs. Furthermore, the discovery of a distinct, nonlinear, and layered stress state in the inter-row soil—transitioning from active in the upper layer to passive in the lower—is a novel insight that explains the complex load transfer pathway and highlights why simple theoretical models are insufficient.
- The measured lateral earth pressure coefficients deviate significantly from classical theoretical values, particularly below the excavation face. This discrepancy underscores a fundamental scientific contribution of this study: proving the limitations of conventional earth pressure theories for this specific, spatially constrained retaining system. For engineering practice, this is a crucial warning that relying on conventional earth pressure theories may lead to inaccurate and potentially unsafe designs. The findings emphasize the necessity for refined theoretical models that, like the conceptual model proposed herein, account for the coupled mechanisms of soil arching and the non-limit stress state, thereby providing a more realistic basis for design. Finally, while the proposed bilinear conceptual model provides a useful framework for understanding the key mechanical behaviors, its limitations in quantitatively predicting pressures at very narrow or wide row spacing must be acknowledged, highlighting the need for further theoretical refinement.
- Based on a comprehensive, multi-criteria evaluation using the Entropy Weight Method, this study identifies an optimal configuration with a row spacing of 4D and a newly added/existing pile length ratio of 9/6. This configuration represents a novel and practical outcome of the research. It provides a superior balance between structural performance and economic feasibility. This finding offers engineers a rational and validated starting point for the preliminary design of this complex retaining systems, moving beyond reliance on overly conservative classical assumptions.
Author Contributions
Conceptualization, F.Y.; methodology, F.Y.; software, Y.J. and J.Y.; formal analysis, Y.J. and J.Y.; investigation, Y.J., J.Y. and Z.W.; resources, F.Y.; writing—original draft preparation, Y.J., J.Y. and F.Y.; writing—review and editing, F.Y.; visualization, Y.J.; supervision, F.Y. and Z.W.; project administration, Y.J., J.Y., F.Y. and Z.W.; funding acquisition, F.Y. All authors have read and agreed to the published version of the manuscript.
Funding
This research is fully supported by the National Natural Science Foundation of China (No. 52178365).
Data Availability Statement
Data are contained within the article.
Conflicts of Interest
The authors declare no conflicts of interest.
References
- Cui, J.; Allan, A.; Taylor, M.A.P. Underground Pedestrian Systems Development in Cities: Influencing Factors and Implications. Tunn. Undergr. Space Technol. 2013, 35, 152–160. [Google Scholar] [CrossRef]
- Chew, M.Y.L. Design for Maintainability of Basements and Wet Areas. Buildings 2021, 11, 75. [Google Scholar] [CrossRef]
- Zhong, W.; Wan, Q.; Nie, N.; Ding, H.; Gao, F.; Xu, C. Research on the Optimal Design of Retaining Piles of a Wide Metro Tunnel Foundation Pit Based on Deformation Control. Buildings 2024, 14, 1906. [Google Scholar] [CrossRef]
- Yi, F.; Su, J.; Zheng, G.; Cheng, X.S.; Zhang, J.T.; Lei, Y.W. Overturning Progressive Collapse Mechanism and Control Methods of Excavations Retained by Cantilever Piles. Eng. Fail. Anal. 2022, 140, 106591. [Google Scholar] [CrossRef]
- Liyanapathirana, D.S.; Nishanthan, R. Influence of Deep Excavation Induced Ground Movements on Adjacent Piles. Tunn. Undergr. Space Technol. 2016, 52, 168–181. [Google Scholar] [CrossRef]
- Cho, S.E. Effects of Spatial Variability of Soil Properties on Slope Stability. Eng. Geol. 2007, 92, 97–109. [Google Scholar] [CrossRef]
- Deng, B.; Yang, M.H.; Zhao, M.H. Upper Limit Analysis of Anti-Sliding Stability of a Rigid Retaining Wall in Unsaturated Soils. J. Hunan Univ. 2023, 50, 171–180. (In Chinese) [Google Scholar] [CrossRef]
- Shan, H.; Yu, F.; Xia, T.; Lin, C.; Pan, J. Performance of the Underpinning Piles for Basement-Supplementing Retrofit of a Constructed Building. J. Perform. Constr. Facil. 2017, 31, 04017017. [Google Scholar] [CrossRef]
- Shan, H.; Xia, T.; Yu, F.; Tao, H.; He, S. Influence of Underpinning Pile Drilling Construction on the Bearing Behavior of Existing Loaded Foundation Piles: Case Study. Adv. Civ. Eng. 2020, 2020, 9568279. [Google Scholar] [CrossRef]
- Tang, D.Q.; Yu, F.; Chen, Y.T.; Liu, N.W. Model Excavation Tests on Double Layered Retaining Structure Composed of Existing and Supplementary Soldier Piles. Rock Soil Mech. 2019, 40, 1040–1049. (In Chinese) [Google Scholar] [CrossRef]
- Hu, W.D.; Zhu, X.N.; Liu, X.H.; Zeng, Y.; Zhou, X. Active Earth Pressure Against Cantilever Retaining Wall Adjacent to Existing Basement Exterior Wall. Int. J. Geomech. 2020, 20, 04020207. [Google Scholar] [CrossRef]
- Gong, X.N.; Wu, C.J.; Yu, F.; Fang, K.; Yang, M. Shaft Resistance Loss of Piles Due to Excavation Beneath Existing Basements. Chin. J. Geotech. Eng. 2013, 35, 1957–1964. (In Chinese) [Google Scholar]
- Wu, C.J.; Gong, X.N.; Yu, F.; Lou, C.-H. Pile Base Resistance Loss for Excavation Beneath Existing High-Rise Building. J. Zhejiang Univ. (Eng. Sci.) 2014, 48, 671–678. (In Chinese) [Google Scholar] [CrossRef]
- Yang, X.L.; Zhu, W.W.; Zhou, P.H. Design Key Technique of Additional Basement Constructed by Top-Down Excavation Below the Existing High-Rise Building. Chin. J. Rock Mech. Eng. 2018, 37, 3775–3786. (In Chinese) [Google Scholar] [CrossRef]
- Lan, B.; Wang, Y.; Wang, W. Review of the Double-Row Pile Supporting Structure and Its Force and Deformation Characteristics. Appl. Sci. 2023, 13, 7715. [Google Scholar] [CrossRef]
- Jiang, Y.; Guo, F.; Wang, W.; Yang, G.; Yue, J.; Huang, Y. Stability Study of a Double-Row Steel Sheet Pile Cofferdam Structure on Soft Ground. Water 2023, 15, 2643. [Google Scholar] [CrossRef]
- Sui, Y.; Zhang, S.; Li, Z.; Zhang, X.; Wu, F.; Tai, P. Numerical Simulation of Double-Row Retaining System with Different Piers. Buildings 2024, 14, 1049. [Google Scholar] [CrossRef]
- Wang, R.; Yang, H.; Ni, P.; Zhao, C.; Guo, C.; Ma, H.; Dong, P.; Liang, H.; Tang, M. Model Test and Numerical Simulation of a New Prefabricated Double-Row Piles Retaining System in Silty Clay Ground. Undergr. Space 2023, 13, 262–280. [Google Scholar] [CrossRef]
- Wang, G.; Dong, C.; Fang, Z.; Chang, S.; Singh, J. Parameter Study on Double-Row Pile in the Combined High Retaining Structure. Geotech. Geol. Eng. 2022, 40, 5233–5248. [Google Scholar] [CrossRef]
- Chen, F.-Q.; Lin, Y.-J.; Yang, J.-T.; Huang, M. Passive Earth Pressure of Narrow Cohesionless Backfill Against Rigid Retaining Walls Rotating About the Base. Int. J. Geomech. 2021, 21, 06020036. [Google Scholar] [CrossRef]
- Finno, R.J.; Lawrence, S.A.; Allawh, N.F.; Harahap, I.S. Analysis of Performance of Pile Groups Adjacent to Deep Excavation. J. Geotech. Eng. 1991, 117, 934–955. [Google Scholar] [CrossRef]
- Liang, Y.Y.; Liu, N.W.; Yu, F.; Gong, X.N.; Chen, Y.T. Prediction of Response of Existing Building Piles to Adjacent Deep Excavation in Soft Clay. Adv. Civ. Eng. 2019, 2019, 8914708. [Google Scholar] [CrossRef]
- Li, Z.; Yang, K.; Xu, X.; Yang, Y.; Jiang, Y.; Tong, L.; Chen, Y. Investigation of Metro Tunnel Response to Multiple Adjacent Large Excavations in Soft Soils. Tunn. Undergr. Space Technol. 2024, 152, 105935. [Google Scholar] [CrossRef]
- Jiang, Z.; Zhu, S.; Que, X.; Ge, X. Deformation Effects of Deep Foundation Pit Excavation on Retaining Structures and Adjacent Subway Stations. Buildings 2024, 14, 2521. [Google Scholar] [CrossRef]
- Wang, K.; Yang, Z.; Guo, J.; Dang, Y.; Yan, Y. Numerical Analysis of the Influence of Deep Excavation on Nearby Pile Foundation Building. Buildings 2023, 13, 2842. [Google Scholar] [CrossRef]
- Yang, M.; Deng, B. Stability Study of Slope Reinforced with Piles Under Steady Unsaturated Flow Conditions. Comput. Geotech. 2019, 109, 89–98. [Google Scholar] [CrossRef]
- Shan, H.; Yu, F.; He, S.; Xia, T. Influence of Soil Excavation on Bearing Behavior of Pile Group Foundation Composed of Underpinning Piles and Existing Piles. J. Test. Eval. 2024, 52, 1021–1034. [Google Scholar] [CrossRef]
- Michalowski, R.L. Coefficient of Earth Pressure at Rest. J. Geotech. Geoenviron. Eng. 2005, 131, 1429–1433. [Google Scholar] [CrossRef]
- Pantelidis, L. The Generalized Coefficients of Earth Pressure: A Unified Approach. Appl. Sci. 2019, 9, 5291. [Google Scholar] [CrossRef]
- Zhu, Y.; Qin, H.; Zhang, X.; Wei, D.; Zhai, L.; Hu, L. Innovative Three-Row Pile Support System of Ultra-Deep Foundation Pit and Cooperative Construction Technology with Basement for High-Rise Tower Structures. Buildings 2024, 14, 1003. [Google Scholar] [CrossRef]
- Zheng, G.; Liu, Z.; Zhou, H.; Ding, M.; Guo, Z. Theoretical Analysis of the Active Earth Pressure on Inclined Retaining Walls. Buildings 2024, 14, 76. [Google Scholar] [CrossRef]
- Soomro, M.A.; Mangnejo, D.A.; Bhanbhro, R.; Memon, N.A.; Memon, M.A. 3D Finite Element Analysis of Pile Responses to Adjacent Excavation in Soft Clay: Effects of Different Excavation Depths Systems Relative to a Floating Pile. Tunn. Undergr. Space Technol. 2019, 86, 138–155. [Google Scholar] [CrossRef]
- Cheng, Y.C.; Zhang, R.H.; Wang, K.H.; Ai, Z.Y. Time-Dependent Behavior of Retaining Piles During Pre-Excavation Dewatering in Multi-Layered Saturated Soils. Comput. Geotech. 2021, 137, 104300. [Google Scholar] [CrossRef]
- Pham, T.A.; Akan, R.; Tabaroei, A. A Simplified Soil–Structure Interaction Model for Load–Settlement Analysis of Piles. Can. Geotech. J. 2025, 62, 1–24. [Google Scholar] [CrossRef]
- Yu, F.; Xie, Z.-B.; Duan, N.; Liu, N.-W.; Shan, H.-F. Performance of Double-Row Piles Retaining Excavation Beneath Existing Underground Space. Int. J. Phys. Model. Geotech. 2019, 19, 167–180. [Google Scholar] [CrossRef]
- Tang, D.Q.; Yu, F.; Huang, X.G.; Liu, N.W.; Xie, Z.B. Behavior and Optimal Analysis of Double-Layered Cantilever Soldier-Pile Retaining Structure Subjected to Basement Supplement beneath Existing Building. China Civ. Eng. J. 2019, 52, 182–192. (In Chinese) [Google Scholar] [CrossRef]
- Wang, Z.J.; Yu, F.; Liao, Y.B.; Wang, L. Analysis on the Bearing Characteristics of the Soldier Pile Retaining Structure Subject to Supplementary Excavation. J. Zhejiang Sci.-Tech. Univ. 2022, 47, 131–138. (In Chinese) [Google Scholar] [CrossRef]
- Xiao, Y.; Wang, X.; Yu, F.; Wang, Z. Experimental Investigation of H-Type Supporting System for Excavation Beneath Existing Underground Space. Buildings 2022, 12, 635. [Google Scholar] [CrossRef]
- Mesri, G.; Hayat, T.M. The Coefficient of Earth Pressure at Rest. Can. Geotech. J. 1993, 30, 647–666. [Google Scholar] [CrossRef]
- Lehane, B.M.; White, D.J. Lateral Stress Changes and Shaft Friction for Model Displacement Piles in Sand. Can. Geotech. J. 2005, 42, 1039–1052. [Google Scholar] [CrossRef]
- Zhu, Y.; Tian, D.; Yan, F. Effectiveness of Entropy Weight Method in Decision-Making. Math. Probl. Eng. 2020, 2020, 3564835. [Google Scholar] [CrossRef]
- Zhang, L.; Li, H. Construction Risk Assessment of Deep Foundation Pit Projects Based on the Projection Pursuit Method and Improved Set Pair Analysis. Appl. Sci. 2022, 12, 1922. [Google Scholar] [CrossRef]
- Su, M.; Li, C.; Xue, Y.; Wang, P.; Cheng, K.; Liu, Y. Engineering Application of Fuzzy Evaluation Based on Comprehensive Weight in the Selection of Geophysical Prospecting Methods. Earth Sci. Inform. 2022, 15, 105–123. [Google Scholar] [CrossRef]
- Zhang, Z.; Qie, B.; Xu, F.; Wang, W.; Liu, Z.; Lin, X.; Huang, A. Experimental Study on the Nonlimit Active Earth Pressure of Finite Soil in Proximity Engineering. Sci. Rep. 2024, 14, 30212. [Google Scholar] [CrossRef] [PubMed]
- Yang, M.H.; Wang, L.C.; Zhao, M.H. Calculation of Active Earth Pressure for Finite Soils Based on the Soil Arching Theory. Build. Struct. 2013, 43, 71–75. [Google Scholar] [CrossRef]
- Bashir, S.D.; Basha, B.M. Experimental Study of Active Earth Pressure on Narrow Backfill Retaining Walls Under Rotation. Geotech. Geol. Eng. 2025, 43, 232. [Google Scholar] [CrossRef]
- Li, M.-G.; Chen, J.-J.; Wang, J.-H. Arching Effect on Lateral Pressure of Confined Granular Material: Numerical and Theoretical Analysis. Granul. Matter 2017, 19, 20. [Google Scholar] [CrossRef]
Disclaimer/Publisher’s Note: The statements, opinions and data contained in all publications are solely those of the individual author(s) and contributor(s) and not of MDPI and/or the editor(s). MDPI and/or the editor(s) disclaim responsibility for any injury to people or property resulting from any ideas, methods, instructions or products referred to in the content. |
© 2025 by the authors. Licensee MDPI, Basel, Switzerland. This article is an open access article distributed under the terms and conditions of the Creative Commons Attribution (CC BY) license (https://creativecommons.org/licenses/by/4.0/).